EP3289976A1 - Sensor assembly, test substance monitoring system, and test substance monitoring method - Google Patents
Sensor assembly, test substance monitoring system, and test substance monitoring method Download PDFInfo
- Publication number
- EP3289976A1 EP3289976A1 EP17188116.2A EP17188116A EP3289976A1 EP 3289976 A1 EP3289976 A1 EP 3289976A1 EP 17188116 A EP17188116 A EP 17188116A EP 3289976 A1 EP3289976 A1 EP 3289976A1
- Authority
- EP
- European Patent Office
- Prior art keywords
- test substance
- intensity
- signal
- measurement
- background signal
- Prior art date
- Legal status (The legal status is an assumption and is not a legal conclusion. Google has not performed a legal analysis and makes no representation as to the accuracy of the status listed.)
- Withdrawn
Links
- 239000000126 substance Substances 0.000 title claims abstract description 251
- 238000012360 testing method Methods 0.000 title claims abstract description 219
- 238000000034 method Methods 0.000 title claims description 55
- 238000012544 monitoring process Methods 0.000 title claims description 35
- 238000005259 measurement Methods 0.000 claims abstract description 215
- 238000001727 in vivo Methods 0.000 claims abstract description 39
- 230000008859 change Effects 0.000 claims abstract description 38
- 239000008280 blood Substances 0.000 claims description 181
- 210000004369 blood Anatomy 0.000 claims description 181
- 210000003722 extracellular fluid Anatomy 0.000 claims description 65
- 230000002596 correlated effect Effects 0.000 claims description 22
- 230000002123 temporal effect Effects 0.000 claims description 9
- WQZGKKKJIJFFOK-GASJEMHNSA-N Glucose Natural products OC[C@H]1OC(O)[C@H](O)[C@@H](O)[C@@H]1O WQZGKKKJIJFFOK-GASJEMHNSA-N 0.000 description 265
- WQZGKKKJIJFFOK-VFUOTHLCSA-N beta-D-glucose Chemical compound OC[C@H]1O[C@@H](O)[C@H](O)[C@@H](O)[C@@H]1O WQZGKKKJIJFFOK-VFUOTHLCSA-N 0.000 description 265
- 239000008103 glucose Substances 0.000 description 265
- 239000000017 hydrogel Substances 0.000 description 53
- 238000000605 extraction Methods 0.000 description 46
- 102000004190 Enzymes Human genes 0.000 description 32
- 108090000790 Enzymes Proteins 0.000 description 32
- 229940088598 enzyme Drugs 0.000 description 32
- 239000010410 layer Substances 0.000 description 32
- 239000000758 substrate Substances 0.000 description 28
- 230000000052 comparative effect Effects 0.000 description 27
- 238000004458 analytical method Methods 0.000 description 24
- 210000000245 forearm Anatomy 0.000 description 23
- MHAJPDPJQMAIIY-UHFFFAOYSA-N Hydrogen peroxide Chemical compound OO MHAJPDPJQMAIIY-UHFFFAOYSA-N 0.000 description 20
- 238000004364 calculation method Methods 0.000 description 19
- 238000004891 communication Methods 0.000 description 19
- 238000001514 detection method Methods 0.000 description 16
- 210000003491 skin Anatomy 0.000 description 15
- 230000015572 biosynthetic process Effects 0.000 description 14
- 108010015776 Glucose oxidase Proteins 0.000 description 12
- 239000004366 Glucose oxidase Substances 0.000 description 12
- 238000012937 correction Methods 0.000 description 12
- 229940116332 glucose oxidase Drugs 0.000 description 12
- 235000019420 glucose oxidase Nutrition 0.000 description 12
- 239000004372 Polyvinyl alcohol Substances 0.000 description 10
- 239000004020 conductor Substances 0.000 description 10
- BASFCYQUMIYNBI-UHFFFAOYSA-N platinum Chemical compound [Pt] BASFCYQUMIYNBI-UHFFFAOYSA-N 0.000 description 10
- 229920002451 polyvinyl alcohol Polymers 0.000 description 10
- 230000000875 corresponding effect Effects 0.000 description 8
- -1 for example Substances 0.000 description 8
- 230000006870 function Effects 0.000 description 8
- 229920000642 polymer Polymers 0.000 description 8
- 238000004132 cross linking Methods 0.000 description 7
- OKTJSMMVPCPJKN-UHFFFAOYSA-N Carbon Chemical compound [C] OKTJSMMVPCPJKN-UHFFFAOYSA-N 0.000 description 6
- 229910052751 metal Inorganic materials 0.000 description 6
- 239000002184 metal Substances 0.000 description 6
- 239000002953 phosphate buffered saline Substances 0.000 description 6
- 238000012545 processing Methods 0.000 description 6
- 239000012790 adhesive layer Substances 0.000 description 5
- 210000001124 body fluid Anatomy 0.000 description 5
- 239000010839 body fluid Substances 0.000 description 5
- 238000009795 derivation Methods 0.000 description 5
- 150000002739 metals Chemical class 0.000 description 5
- 238000012806 monitoring device Methods 0.000 description 5
- 229910052697 platinum Inorganic materials 0.000 description 5
- 229920003207 poly(ethylene-2,6-naphthalate) Polymers 0.000 description 5
- 239000011112 polyethylene naphthalate Substances 0.000 description 5
- 239000000243 solution Substances 0.000 description 5
- 238000003786 synthesis reaction Methods 0.000 description 5
- PXHVJJICTQNCMI-UHFFFAOYSA-N Nickel Chemical compound [Ni] PXHVJJICTQNCMI-UHFFFAOYSA-N 0.000 description 4
- KDLHZDBZIXYQEI-UHFFFAOYSA-N Palladium Chemical compound [Pd] KDLHZDBZIXYQEI-UHFFFAOYSA-N 0.000 description 4
- BQCADISMDOOEFD-UHFFFAOYSA-N Silver Chemical compound [Ag] BQCADISMDOOEFD-UHFFFAOYSA-N 0.000 description 4
- 229910052799 carbon Inorganic materials 0.000 description 4
- 238000006911 enzymatic reaction Methods 0.000 description 4
- JVTAAEKCZFNVCJ-UHFFFAOYSA-N lactic acid Chemical compound CC(O)C(O)=O JVTAAEKCZFNVCJ-UHFFFAOYSA-N 0.000 description 4
- 239000000463 material Substances 0.000 description 4
- 102000004169 proteins and genes Human genes 0.000 description 4
- 108090000623 proteins and genes Proteins 0.000 description 4
- 229910052709 silver Inorganic materials 0.000 description 4
- 239000004332 silver Substances 0.000 description 4
- 239000002202 Polyethylene glycol Substances 0.000 description 3
- 238000010894 electron beam technology Methods 0.000 description 3
- PCHJSUWPFVWCPO-UHFFFAOYSA-N gold Chemical compound [Au] PCHJSUWPFVWCPO-UHFFFAOYSA-N 0.000 description 3
- 229910052737 gold Inorganic materials 0.000 description 3
- 239000010931 gold Substances 0.000 description 3
- 238000004519 manufacturing process Methods 0.000 description 3
- 229920005615 natural polymer Polymers 0.000 description 3
- 229920001223 polyethylene glycol Polymers 0.000 description 3
- 238000006116 polymerization reaction Methods 0.000 description 3
- 238000002360 preparation method Methods 0.000 description 3
- 230000001629 suppression Effects 0.000 description 3
- VYZAMTAEIAYCRO-UHFFFAOYSA-N Chromium Chemical compound [Cr] VYZAMTAEIAYCRO-UHFFFAOYSA-N 0.000 description 2
- RYGMFSIKBFXOCR-UHFFFAOYSA-N Copper Chemical compound [Cu] RYGMFSIKBFXOCR-UHFFFAOYSA-N 0.000 description 2
- RGHNJXZEOKUKBD-SQOUGZDYSA-N D-gluconic acid Chemical compound OC[C@@H](O)[C@@H](O)[C@H](O)[C@@H](O)C(O)=O RGHNJXZEOKUKBD-SQOUGZDYSA-N 0.000 description 2
- LFQSCWFLJHTTHZ-UHFFFAOYSA-N Ethanol Chemical compound CCO LFQSCWFLJHTTHZ-UHFFFAOYSA-N 0.000 description 2
- 108010050375 Glucose 1-Dehydrogenase Proteins 0.000 description 2
- 108010073450 Lactate 2-monooxygenase Proteins 0.000 description 2
- WCUXLLCKKVVCTQ-UHFFFAOYSA-M Potassium chloride Chemical compound [Cl-].[K+] WCUXLLCKKVVCTQ-UHFFFAOYSA-M 0.000 description 2
- 229910021607 Silver chloride Inorganic materials 0.000 description 2
- 229910045601 alloy Inorganic materials 0.000 description 2
- 239000000956 alloy Substances 0.000 description 2
- 229910052782 aluminium Inorganic materials 0.000 description 2
- XAGFODPZIPBFFR-UHFFFAOYSA-N aluminium Chemical compound [Al] XAGFODPZIPBFFR-UHFFFAOYSA-N 0.000 description 2
- 239000002238 carbon nanotube film Substances 0.000 description 2
- 239000003575 carbonaceous material Substances 0.000 description 2
- 230000015556 catabolic process Effects 0.000 description 2
- 229910052804 chromium Inorganic materials 0.000 description 2
- 239000011651 chromium Substances 0.000 description 2
- 238000000970 chrono-amperometry Methods 0.000 description 2
- 238000001567 chrono-coulometry Methods 0.000 description 2
- 229910052802 copper Inorganic materials 0.000 description 2
- 239000010949 copper Substances 0.000 description 2
- 238000002484 cyclic voltammetry Methods 0.000 description 2
- 238000006731 degradation reaction Methods 0.000 description 2
- 230000006866 deterioration Effects 0.000 description 2
- 125000004386 diacrylate group Chemical group 0.000 description 2
- 238000010586 diagram Methods 0.000 description 2
- LOKCTEFSRHRXRJ-UHFFFAOYSA-I dipotassium trisodium dihydrogen phosphate hydrogen phosphate dichloride Chemical compound P(=O)(O)(O)[O-].[K+].P(=O)(O)([O-])[O-].[Na+].[Na+].[Cl-].[K+].[Cl-].[Na+] LOKCTEFSRHRXRJ-UHFFFAOYSA-I 0.000 description 2
- 238000001035 drying Methods 0.000 description 2
- 238000002848 electrochemical method Methods 0.000 description 2
- 239000010408 film Substances 0.000 description 2
- 125000000524 functional group Chemical group 0.000 description 2
- 229910052732 germanium Inorganic materials 0.000 description 2
- GNPVGFCGXDBREM-UHFFFAOYSA-N germanium atom Chemical compound [Ge] GNPVGFCGXDBREM-UHFFFAOYSA-N 0.000 description 2
- 239000011521 glass Substances 0.000 description 2
- 229910002804 graphite Inorganic materials 0.000 description 2
- 239000010439 graphite Substances 0.000 description 2
- 235000014655 lactic acid Nutrition 0.000 description 2
- 239000004310 lactic acid Substances 0.000 description 2
- 229910052759 nickel Inorganic materials 0.000 description 2
- 229910052763 palladium Inorganic materials 0.000 description 2
- 238000005498 polishing Methods 0.000 description 2
- 230000008569 process Effects 0.000 description 2
- 238000005070 sampling Methods 0.000 description 2
- 239000004065 semiconductor Substances 0.000 description 2
- 229910052710 silicon Inorganic materials 0.000 description 2
- 239000010703 silicon Substances 0.000 description 2
- HKZLPVFGJNLROG-UHFFFAOYSA-M silver monochloride Chemical compound [Cl-].[Ag+] HKZLPVFGJNLROG-UHFFFAOYSA-M 0.000 description 2
- 229920001059 synthetic polymer Polymers 0.000 description 2
- 239000010409 thin film Substances 0.000 description 2
- 238000007740 vapor deposition Methods 0.000 description 2
- XLYOFNOQVPJJNP-UHFFFAOYSA-N water Substances O XLYOFNOQVPJJNP-UHFFFAOYSA-N 0.000 description 2
- KIUKXJAPPMFGSW-DNGZLQJQSA-N (2S,3S,4S,5R,6R)-6-[(2S,3R,4R,5S,6R)-3-Acetamido-2-[(2S,3S,4R,5R,6R)-6-[(2R,3R,4R,5S,6R)-3-acetamido-2,5-dihydroxy-6-(hydroxymethyl)oxan-4-yl]oxy-2-carboxy-4,5-dihydroxyoxan-3-yl]oxy-5-hydroxy-6-(hydroxymethyl)oxan-4-yl]oxy-3,4,5-trihydroxyoxane-2-carboxylic acid Chemical compound CC(=O)N[C@H]1[C@H](O)O[C@H](CO)[C@@H](O)[C@@H]1O[C@H]1[C@H](O)[C@@H](O)[C@H](O[C@H]2[C@@H]([C@@H](O[C@H]3[C@@H]([C@@H](O)[C@H](O)[C@H](O3)C(O)=O)O)[C@H](O)[C@@H](CO)O2)NC(C)=O)[C@@H](C(O)=O)O1 KIUKXJAPPMFGSW-DNGZLQJQSA-N 0.000 description 1
- 229920000936 Agarose Polymers 0.000 description 1
- 108010088751 Albumins Proteins 0.000 description 1
- 102000009027 Albumins Human genes 0.000 description 1
- 108091003079 Bovine Serum Albumin Proteins 0.000 description 1
- VEXZGXHMUGYJMC-UHFFFAOYSA-M Chloride anion Chemical compound [Cl-] VEXZGXHMUGYJMC-UHFFFAOYSA-M 0.000 description 1
- 108010089254 Cholesterol oxidase Proteins 0.000 description 1
- 102000008186 Collagen Human genes 0.000 description 1
- 108010035532 Collagen Proteins 0.000 description 1
- RGHNJXZEOKUKBD-UHFFFAOYSA-N D-gluconic acid Natural products OCC(O)C(O)C(O)C(O)C(O)=O RGHNJXZEOKUKBD-UHFFFAOYSA-N 0.000 description 1
- 108010015133 Galactose oxidase Proteins 0.000 description 1
- 108010010803 Gelatin Proteins 0.000 description 1
- SXRSQZLOMIGNAQ-UHFFFAOYSA-N Glutaraldehyde Chemical compound O=CCCCC=O SXRSQZLOMIGNAQ-UHFFFAOYSA-N 0.000 description 1
- 229920002153 Hydroxypropyl cellulose Polymers 0.000 description 1
- 102000003855 L-lactate dehydrogenase Human genes 0.000 description 1
- 241001499733 Plantago asiatica Species 0.000 description 1
- 235000003421 Plantago ovata Nutrition 0.000 description 1
- 239000004698 Polyethylene Substances 0.000 description 1
- 229920002873 Polyethylenimine Polymers 0.000 description 1
- 239000004642 Polyimide Substances 0.000 description 1
- 239000009223 Psyllium Substances 0.000 description 1
- 229920002125 Sokalan® Polymers 0.000 description 1
- 239000007983 Tris buffer Substances 0.000 description 1
- LEHOTFFKMJEONL-UHFFFAOYSA-N Uric Acid Chemical compound N1C(=O)NC(=O)C2=C1NC(=O)N2 LEHOTFFKMJEONL-UHFFFAOYSA-N 0.000 description 1
- TVWHNULVHGKJHS-UHFFFAOYSA-N Uric acid Natural products N1C(=O)NC(=O)C2NC(=O)NC21 TVWHNULVHGKJHS-UHFFFAOYSA-N 0.000 description 1
- XTXRWKRVRITETP-UHFFFAOYSA-N Vinyl acetate Chemical compound CC(=O)OC=C XTXRWKRVRITETP-UHFFFAOYSA-N 0.000 description 1
- 230000006978 adaptation Effects 0.000 description 1
- 102000020006 aldose 1-epimerase Human genes 0.000 description 1
- 108091022872 aldose 1-epimerase Proteins 0.000 description 1
- WQZGKKKJIJFFOK-PHYPRBDBSA-N alpha-D-galactose Chemical compound OC[C@H]1O[C@H](O)[C@H](O)[C@@H](O)[C@H]1O WQZGKKKJIJFFOK-PHYPRBDBSA-N 0.000 description 1
- 239000007864 aqueous solution Substances 0.000 description 1
- 239000012752 auxiliary agent Substances 0.000 description 1
- 229920000249 biocompatible polymer Polymers 0.000 description 1
- 229920001400 block copolymer Polymers 0.000 description 1
- 229940098773 bovine serum albumin Drugs 0.000 description 1
- 230000001413 cellular effect Effects 0.000 description 1
- 239000001913 cellulose Substances 0.000 description 1
- 229920002678 cellulose Polymers 0.000 description 1
- 239000000919 ceramic Substances 0.000 description 1
- 150000001805 chlorine compounds Chemical class 0.000 description 1
- GTKRFUAGOKINCA-UHFFFAOYSA-M chlorosilver;silver Chemical compound [Ag].[Ag]Cl GTKRFUAGOKINCA-UHFFFAOYSA-M 0.000 description 1
- 229920001436 collagen Polymers 0.000 description 1
- 230000000295 complement effect Effects 0.000 description 1
- 150000001875 compounds Chemical class 0.000 description 1
- 229920001577 copolymer Polymers 0.000 description 1
- 206010012601 diabetes mellitus Diseases 0.000 description 1
- 238000009792 diffusion process Methods 0.000 description 1
- 201000010099 disease Diseases 0.000 description 1
- 208000037265 diseases, disorders, signs and symptoms Diseases 0.000 description 1
- 230000000694 effects Effects 0.000 description 1
- 238000005868 electrolysis reaction Methods 0.000 description 1
- 210000002615 epidermis Anatomy 0.000 description 1
- 239000003822 epoxy resin Substances 0.000 description 1
- 238000011156 evaluation Methods 0.000 description 1
- 229930182830 galactose Natural products 0.000 description 1
- 239000000499 gel Substances 0.000 description 1
- 239000008273 gelatin Substances 0.000 description 1
- 229920000159 gelatin Polymers 0.000 description 1
- 235000019322 gelatine Nutrition 0.000 description 1
- 235000011852 gelatine desserts Nutrition 0.000 description 1
- 239000000174 gluconic acid Substances 0.000 description 1
- 235000012208 gluconic acid Nutrition 0.000 description 1
- 125000002791 glucosyl group Chemical group C1([C@H](O)[C@@H](O)[C@H](O)[C@H](O1)CO)* 0.000 description 1
- 150000004676 glycans Chemical class 0.000 description 1
- 229910052736 halogen Inorganic materials 0.000 description 1
- 150000002367 halogens Chemical class 0.000 description 1
- 229920002674 hyaluronan Polymers 0.000 description 1
- 229960003160 hyaluronic acid Drugs 0.000 description 1
- 239000001863 hydroxypropyl cellulose Substances 0.000 description 1
- 235000010977 hydroxypropyl cellulose Nutrition 0.000 description 1
- 230000003345 hyperglycaemic effect Effects 0.000 description 1
- 230000002218 hypoglycaemic effect Effects 0.000 description 1
- 239000011810 insulating material Substances 0.000 description 1
- 230000009545 invasion Effects 0.000 description 1
- 230000001678 irradiating effect Effects 0.000 description 1
- 230000033001 locomotion Effects 0.000 description 1
- 229910001507 metal halide Inorganic materials 0.000 description 1
- 150000005309 metal halides Chemical class 0.000 description 1
- 239000007769 metal material Substances 0.000 description 1
- 239000000203 mixture Substances 0.000 description 1
- 239000000178 monomer Substances 0.000 description 1
- 230000003647 oxidation Effects 0.000 description 1
- 238000007254 oxidation reaction Methods 0.000 description 1
- 230000002093 peripheral effect Effects 0.000 description 1
- 239000002504 physiological saline solution Substances 0.000 description 1
- 229920001707 polybutylene terephthalate Polymers 0.000 description 1
- 229920000647 polyepoxide Polymers 0.000 description 1
- 229920001225 polyester resin Polymers 0.000 description 1
- 239000004645 polyester resin Substances 0.000 description 1
- 229920000573 polyethylene Polymers 0.000 description 1
- 239000005020 polyethylene terephthalate Substances 0.000 description 1
- 229920000139 polyethylene terephthalate Polymers 0.000 description 1
- 229920001721 polyimide Polymers 0.000 description 1
- 229920001282 polysaccharide Polymers 0.000 description 1
- 239000005017 polysaccharide Substances 0.000 description 1
- 239000011148 porous material Substances 0.000 description 1
- 239000001103 potassium chloride Substances 0.000 description 1
- 235000011164 potassium chloride Nutrition 0.000 description 1
- 229940070687 psyllium Drugs 0.000 description 1
- 229920013730 reactive polymer Polymers 0.000 description 1
- 230000009467 reduction Effects 0.000 description 1
- 230000004044 response Effects 0.000 description 1
- 238000007650 screen-printing Methods 0.000 description 1
- 238000007789 sealing Methods 0.000 description 1
- 230000035945 sensitivity Effects 0.000 description 1
- 150000003384 small molecules Chemical class 0.000 description 1
- 238000004544 sputter deposition Methods 0.000 description 1
- 230000006641 stabilisation Effects 0.000 description 1
- 238000011105 stabilization Methods 0.000 description 1
- 230000000087 stabilizing effect Effects 0.000 description 1
- 210000001519 tissue Anatomy 0.000 description 1
- 229940116269 uric acid Drugs 0.000 description 1
- 229920002554 vinyl polymer Polymers 0.000 description 1
Images







Classifications
-
- G—PHYSICS
- G01—MEASURING; TESTING
- G01N—INVESTIGATING OR ANALYSING MATERIALS BY DETERMINING THEIR CHEMICAL OR PHYSICAL PROPERTIES
- G01N27/00—Investigating or analysing materials by the use of electric, electrochemical, or magnetic means
- G01N27/26—Investigating or analysing materials by the use of electric, electrochemical, or magnetic means by investigating electrochemical variables; by using electrolysis or electrophoresis
-
- A—HUMAN NECESSITIES
- A61—MEDICAL OR VETERINARY SCIENCE; HYGIENE
- A61B—DIAGNOSIS; SURGERY; IDENTIFICATION
- A61B5/00—Measuring for diagnostic purposes; Identification of persons
- A61B5/145—Measuring characteristics of blood in vivo, e.g. gas concentration or pH-value ; Measuring characteristics of body fluids or tissues, e.g. interstitial fluid or cerebral tissue
- A61B5/14532—Measuring characteristics of blood in vivo, e.g. gas concentration or pH-value ; Measuring characteristics of body fluids or tissues, e.g. interstitial fluid or cerebral tissue for measuring glucose, e.g. by tissue impedance measurement
-
- A—HUMAN NECESSITIES
- A61—MEDICAL OR VETERINARY SCIENCE; HYGIENE
- A61B—DIAGNOSIS; SURGERY; IDENTIFICATION
- A61B5/00—Measuring for diagnostic purposes; Identification of persons
- A61B5/145—Measuring characteristics of blood in vivo, e.g. gas concentration or pH-value ; Measuring characteristics of body fluids or tissues, e.g. interstitial fluid or cerebral tissue
- A61B5/14507—Measuring characteristics of blood in vivo, e.g. gas concentration or pH-value ; Measuring characteristics of body fluids or tissues, e.g. interstitial fluid or cerebral tissue specially adapted for measuring characteristics of body fluids other than blood
- A61B5/1451—Measuring characteristics of blood in vivo, e.g. gas concentration or pH-value ; Measuring characteristics of body fluids or tissues, e.g. interstitial fluid or cerebral tissue specially adapted for measuring characteristics of body fluids other than blood for interstitial fluid
- A61B5/14514—Measuring characteristics of blood in vivo, e.g. gas concentration or pH-value ; Measuring characteristics of body fluids or tissues, e.g. interstitial fluid or cerebral tissue specially adapted for measuring characteristics of body fluids other than blood for interstitial fluid using means for aiding extraction of interstitial fluid, e.g. microneedles or suction
-
- A—HUMAN NECESSITIES
- A61—MEDICAL OR VETERINARY SCIENCE; HYGIENE
- A61B—DIAGNOSIS; SURGERY; IDENTIFICATION
- A61B5/00—Measuring for diagnostic purposes; Identification of persons
- A61B5/145—Measuring characteristics of blood in vivo, e.g. gas concentration or pH-value ; Measuring characteristics of body fluids or tissues, e.g. interstitial fluid or cerebral tissue
- A61B5/1495—Calibrating or testing of in-vivo probes
-
- A—HUMAN NECESSITIES
- A61—MEDICAL OR VETERINARY SCIENCE; HYGIENE
- A61B—DIAGNOSIS; SURGERY; IDENTIFICATION
- A61B5/00—Measuring for diagnostic purposes; Identification of persons
- A61B5/68—Arrangements of detecting, measuring or recording means, e.g. sensors, in relation to patient
- A61B5/6801—Arrangements of detecting, measuring or recording means, e.g. sensors, in relation to patient specially adapted to be attached to or worn on the body surface
- A61B5/683—Means for maintaining contact with the body
- A61B5/6832—Means for maintaining contact with the body using adhesives
- A61B5/6833—Adhesive patches
-
- A—HUMAN NECESSITIES
- A61—MEDICAL OR VETERINARY SCIENCE; HYGIENE
- A61B—DIAGNOSIS; SURGERY; IDENTIFICATION
- A61B5/00—Measuring for diagnostic purposes; Identification of persons
- A61B5/72—Signal processing specially adapted for physiological signals or for diagnostic purposes
- A61B5/7203—Signal processing specially adapted for physiological signals or for diagnostic purposes for noise prevention, reduction or removal
- A61B5/7207—Signal processing specially adapted for physiological signals or for diagnostic purposes for noise prevention, reduction or removal of noise induced by motion artifacts
- A61B5/7214—Signal processing specially adapted for physiological signals or for diagnostic purposes for noise prevention, reduction or removal of noise induced by motion artifacts using signal cancellation, e.g. based on input of two identical physiological sensors spaced apart, or based on two signals derived from the same sensor, for different optical wavelengths
-
- G—PHYSICS
- G01—MEASURING; TESTING
- G01N—INVESTIGATING OR ANALYSING MATERIALS BY DETERMINING THEIR CHEMICAL OR PHYSICAL PROPERTIES
- G01N27/00—Investigating or analysing materials by the use of electric, electrochemical, or magnetic means
- G01N27/26—Investigating or analysing materials by the use of electric, electrochemical, or magnetic means by investigating electrochemical variables; by using electrolysis or electrophoresis
- G01N27/28—Electrolytic cell components
- G01N27/30—Electrodes, e.g. test electrodes; Half-cells
- G01N27/327—Biochemical electrodes, e.g. electrical or mechanical details for in vitro measurements
- G01N27/3271—Amperometric enzyme electrodes for analytes in body fluids, e.g. glucose in blood
- G01N27/3273—Devices therefor, e.g. test element readers, circuitry
-
- G—PHYSICS
- G01—MEASURING; TESTING
- G01N—INVESTIGATING OR ANALYSING MATERIALS BY DETERMINING THEIR CHEMICAL OR PHYSICAL PROPERTIES
- G01N27/00—Investigating or analysing materials by the use of electric, electrochemical, or magnetic means
- G01N27/26—Investigating or analysing materials by the use of electric, electrochemical, or magnetic means by investigating electrochemical variables; by using electrolysis or electrophoresis
- G01N27/416—Systems
-
- G—PHYSICS
- G01—MEASURING; TESTING
- G01N—INVESTIGATING OR ANALYSING MATERIALS BY DETERMINING THEIR CHEMICAL OR PHYSICAL PROPERTIES
- G01N33/00—Investigating or analysing materials by specific methods not covered by groups G01N1/00 - G01N31/00
- G01N33/48—Biological material, e.g. blood, urine; Haemocytometers
- G01N33/483—Physical analysis of biological material
- G01N33/487—Physical analysis of biological material of liquid biological material
- G01N33/48785—Electrical and electronic details of measuring devices for physical analysis of liquid biological material not specific to a particular test method, e.g. user interface or power supply
-
- G—PHYSICS
- G01—MEASURING; TESTING
- G01N—INVESTIGATING OR ANALYSING MATERIALS BY DETERMINING THEIR CHEMICAL OR PHYSICAL PROPERTIES
- G01N33/00—Investigating or analysing materials by specific methods not covered by groups G01N1/00 - G01N31/00
- G01N33/48—Biological material, e.g. blood, urine; Haemocytometers
- G01N33/483—Physical analysis of biological material
- G01N33/487—Physical analysis of biological material of liquid biological material
- G01N33/48785—Electrical and electronic details of measuring devices for physical analysis of liquid biological material not specific to a particular test method, e.g. user interface or power supply
- G01N33/48792—Data management, e.g. communication with processing unit
-
- G—PHYSICS
- G01—MEASURING; TESTING
- G01N—INVESTIGATING OR ANALYSING MATERIALS BY DETERMINING THEIR CHEMICAL OR PHYSICAL PROPERTIES
- G01N33/00—Investigating or analysing materials by specific methods not covered by groups G01N1/00 - G01N31/00
- G01N33/48—Biological material, e.g. blood, urine; Haemocytometers
- G01N33/483—Physical analysis of biological material
- G01N33/487—Physical analysis of biological material of liquid biological material
- G01N33/49—Blood
Definitions
- the invention relates to a sensor assembly, test substance monitoring system, and test substance monitoring method.
- An in-vivo component contained in a specimen such as blood, for example, glucose, is an indicator of diabetes.
- the in-vivo component must be detected with high accuracy in order to manage the amount of in-vivo component for preventing disease deterioration.
- Japanese Patent Registration No. 4545398 discloses a monitoring device that measures the amount of glucose contained in a specimen collected percutaneously.
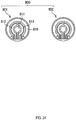
- the monitoring device 800 described in Japanese Patent Registration No. 4545398 includes two detection devices 801 and 802 attached to the subject's arm.
- the detection devices 801 and 802 each include a working electrode 811, a reference electrode 812, and a counter electrode 813.
- Glucose is extracted from the subject's skin by one detection device 801 and the extracted glucose is measured.
- the signal measurement value obtained by the detection device 801 includes a signal originating from glucose and a background signal that is not attributable to glucose.
- the background signal is measured by the other detection device 802 simultaneously with the measurement of glucose by the detection device 801, and the signal value due to glucose is calculated by subtracting the background signal measurement value acquired by the detection device 802 from the signal measurement value acquired by the detection device 801. The amount of glucose is acquired based on the calculated signal measurement value.
- the background signal is measured by different detection devices in the monitoring device 800 described in Japanese Patent Registration No. 4545398 , variations may occur in the background signal measurement value between the detection device 801 and the detection device 802 due to the individual difference of the detection devices. Therefore, the background signal measurement value obtained by the detection device 802 may be different from the background signal measurement value that originally should be subtracted from the detection device 801 in the monitoring device 800 described in Japanese Patent Registration No. 4545398 . In this case, it was difficult to accurately calculate the amount of glucose.
- a sensor assembly includes an electrochemical sensor for measuring a test substance percutaneously extracted from a living body, and a processor for determining the intensity of the background signal at an optional measurement time point of the test substance outside a predetermined time based on the intensity of the background signal measured within the predetermined time by the electrochemical sensor.
- the electrochemical sensor is used for applications in which a test substance is detected by a change in the intensity of an electric signal.
- a “background signal” is a signal detected regardless of the presence or absence of a test substance, and refers to a signal generated by a sensor assembly without originating from a test substance.
- a “background signal” also includes a signal attributable to the electrochemical sensor itself.
- the "background signal” includes a current signal inherent to the electrochemical sensor, a current signal flowing when a component in the hydrogel diffuses on the electrode, a current signal flowing when a component in the hydrogel reacts on the electrode, and a current signal flowing when a component fixed on the electrode reacts.
- the "predetermined time” may be any time other than the time during which the measurement of the test substance is performed.
- the “predetermined time” may be, for example, the time just before or immediately after the measurement of the test substance or may be a time when manufacturing the sensor assembly.
- the background signal is usually different for each sensor assembly.
- the electrochemical sensor used for the measurement of the test substance is also used for obtaining the background signal alone, and calculates the intensity of the background signal at the measurement time point of the test substance outside the predetermined time based on the intensity of the background signal at the time of measurement of the test substance within the predetermined time.
- the sensor assembly having such a configuration therefore, it is possible to determine the intensity of the background signal to be originally subtracted from the intensity of the signal obtained by measuring the test substance since the intensity of the background signal at the time of measurement of the test substance is determined based on the background signal obtained from the electrochemical sensor used for measurement of the test substance. Therefore, it is possible to accurately calculate the amount of the test substance according to the sensor assembly of the first aspect of the present invention.
- the predetermined time may be a period of time from the energizing of the electrochemical sensor to the stabilization of the value measured by the electrochemical sensor. Normally, when an electrochemical sensor is used, after a voltage is applied to the electrochemical sensor, a certain amount of time is required for the current signal flowing in the electrochemical sensor to stabilize and for the value measured by the electrochemical sensor to stabilize after a voltage is applied to the electrochemical sensor. When a test substance is measured using an electrochemical sensor, the measurement value also tends to vary during the period from the application of a voltage to the electrochemical sensor until the measured value by the electrochemical sensor becomes stabilized.
- the present inventors measured the intensity of the background signal during the time from the application of the voltage to the electrochemical sensor until the value measured by the electrochemical sensor became stabilized, and based on the measurement result, it was found that the amount of the test substance can be accurately calculated using this time by determining the intensity of the background signal at the time of measurement.
- the electrochemical sensor is configured to measure a test substance extracted from a living body to a collection member while in a state of contact with a collection member, and the electrochemical sensor also may measure the intensity of the background signal within a predetermined time while in a state of contact with the collection member, the predetermined time being a time before the test substance is extracted to the collecting member after the electrochemical sensor is brought into contact with the collecting member.
- the intensity of the background signal to be subtracted as previously described can be more accurately determined since the intensity of the background signal caused by the collection member also can be measured, and the intensity of the background signal at the time of measurement of the test substance can be determined based on this measurement value.
- the processor also may calculate the intensity of the background signal at the time of measurement based on the change over time in the intensity of the background signal measured within a predetermined time. In this way, the intensity of the background signal at the time of measurement of the test substance can be calculated, taking into consideration the temporal fluctuation of the intensity of the background signal.
- the processor preferably calculates the intensity of the background signal at the measurement time point by applying exponential approximation, exponential approximation, linear approximation or a combination thereof to the temporal change of the intensity of the background signal within a predetermined time.
- the processor also preferably calculates the intensity of the background signal at the measurement time point based on an equation obtained by calculating constants included in the equation by performing power approximation, exponential approximation, linear approximation or performing fitting of combinations thereof with respect to the temporal change of the intensity of the background signal within the predetermined time.
- the temporal change in the intensity of the background signal is a power function change, an exponential change, a linear change or a combination thereof. Therefore, the calculated value of the intensity of the background signal can be obtained with higher accuracy according to the sensor assembly having such a configuration.
- the processor is configured to obtain a value representing the intensity of the signal attributable to the test substance by subtracting the value of the intensity of the background signal at the measurement time point from the measurement value of the intensity of the unprocessed signal including the signal attributable to the test substance acquired by the electrochemical sensor at the time of measurement of the test substance.
- Signal attributable to a test substance means a signal that varies according to the amount of the test substance.
- Unprocessed signal including a signal attributable to a test substance includes a signal attributable to a test substance and a background signal.
- the electrochemical sensor also may be configured to automatically obtain a value representing the intensity of the signal attributable to the test substance by measuring the intensity of the unprocessed signal including the signal attributable to the test substance and subtracting the intensity of the background signal at the measurement time point when the measurement of the intensity of the background signal and the determination of the intensity of the background signal at the measurement time point are automatically performed in a first measurement performed after the sensor assembly is first activated, and second and subsequent measurements are performed. In this way, the burden on the user can be reduced since the user does not need to manually switch between the background measurement and the measurement of the test substance.
- the processor can obtain a value indicating the amount of the test substance based on the intensity of the signal attributable to the test substance and the in-vivo concentration of a substance correlated with the in-vivo concentration of the test substance.
- the in-vivo concentration of the substance correlated with the in-vivo concentration of the test substance may be, for example, the blood concentration of the test substance, the concentration of other substances correlated with the test substance in the interstitial fluid, the blood concentration of other substances correlated with the test substance in the blood and the like, but the correlated substance is not particularly limited.
- the in-vivo concentration of the substance correlated with the in-vivo concentration of the test substance is preferably the blood concentration of the test substance. According to the sensor assembly having such a configuration, it is possible to accurately estimate the amount of the test substance.
- the sensor assembly may be equipped with one electrochemical sensor.
- the sensor assembly further preferably includes a memory for storing the value of the intensity of the background signal at the time of measurement.
- the user reduce the time required to prepare for measurement because the intensity of the unprocessed signal including the signal attributable to the test substance can be measured without measuring the intensity of the background signal since the intensity can be measured by using the value of the intensity of the background signal at the measurement time point stored in the memory.
- the electrochemical sensor can measure a test substance at each of a plurality of measurement time points outside the predetermined time.
- the processor can determine the intensity of the background signal at each of the plurality of measurement time points based on the intensity of the background signal measured within a predetermined time.
- the electrochemical sensor also may be an enzyme sensor provided with a substrate body, an electrode disposed on the substrate body, and an enzyme immobilized on the surface of the electrode. According to the sensor assembly having such a configuration, it is possible to accurately calculate the amount of a test substance using an enzymatic reaction.
- the test substance also may be glucose.
- the enzyme sensor is a glucose sensor including a substrate body, an electrode disposed on the substrate body for detecting hydrogen peroxide, and glucose oxidase immobilized on the surface of the electrode. According to the sensor assembly having such a configuration, the amount of glucose can be calculated with high accuracy.
- a monitoring system includes a collection member capable of collecting a test substance contained in interstitial fluid extracted from a living body, and the aforementioned sensor assembly.
- the collection member also may include hydrogel.
- the predetermined time may be a time for the diffusion of the substance in the hydrogel to proceed to achieve a state in which the influence on the measurement of the test substance reaches equilibrium. state
- the test substance monitoring method is a method of percutaneously extracting and monitoring a test substance from a living body.
- the test substance monitoring method of the third aspect of the invention includes (A1) a step of bringing a collection member into contact with an electrochemical sensor and measuring the intensity of the background signal within a predetermined time; (A2) a step of determining the intensity of the background signal at an optional measurement time point of the test substance outside the predetermined time based on the intensity of the background signal within the predetermined time; (A3) a step of measuring a test substance extracted into a collection member from a living body by the electrochemical sensor at the measurement time point to obtain a measurement value of the intensity of the unprocessed signal including the signal attributable to the test substance; and (A4) a step of subtracting the value of the intensity of the background signal obtained in the step (A2) from the measured value of the intensity of the unprocessed signal measured in the step (A3) to calculate the intensity of the signal attributable to the test substance.
- step (A1) an electrochemical sensor is brought into contact with a collecting member attached to the living body, and the intensity of the background signal can be measured within a predetermined time from when the electrochemical sensor in contact with the collecting member is energized to when the measured value by the electrochemical sensor stabilizes.
- step (A1) the intensity of the background signal can be measured within a predetermined time after the electrochemical sensor is brought into contact with the collecting member and before the test substance is collected by the collecting member.
- step (A2) the intensity of the background signal at each of a plurality of measurement time points of the test substance is determined based on the intensity of the background signal within the predetermined time.
- step (A3) a test substance is measured at each of the plurality of measurement time points, and a measurement value of the intensity of a unprocessed signal including the signal attributable to the test substance is acquired at each measurement time point.
- step (A4) the value of the intensity of the background signal can be subtracted from the measured value of the intensity of the unprocessed signal acquired at each of the plurality of measurement points.
- Microinvasive interstitial fluid extraction technique refers to a technique of extracting interstitial fluid from a subject with minimal invasion.
- micropores are formed in the skin of the living body by a puncture tool or the like to promote extraction of interstitial fluid.
- the interstitial fluid extracted from the micropores is collected using a collection member including a gel or the like.
- In-vivo component refers to a component contained in a living body, for example, a body fluid extracted from a subject.
- in-vivo components include, but are not limited to, glucose, uric acid, lactic acid, galactose and the like.
- Test substance refers to a substance to be detected among in-vivo components.
- body fluid include, but are not limited to, interstitial fluid, blood and the like.
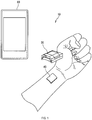
- the continuous monitoring system 10 includes a sensor assembly 20, a collection member 40, and a terminal 60.
- the continuous monitoring system 10 is used by mounting the sensor assembly 20 so as to contact the collection member 40 installed on the forearm of the subject who has formed micropores.
- Terminal 60 is used to display the information obtained by sensor assembly 20.
- a cellular phone terminal, a tablet type computer and the like can be mentioned as the terminal 60, but there is no particular limitation.
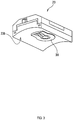
- the sensor assembly 20 includes a cover 21, an upper main body 22 incorporating an electric circuit, and a lower main body 23 for housing the electrochemical sensor 30.
- the upper body 22 includes an electric circuit (not shown), a notch part 22a for attaching the cover 21, a housing 22b for housing the battery 25 as a power supply, a switch 22c for switching on/off of the sensor assembly 20, and a connection terminal 22d for connecting the electrochemical sensor 30 to the electric circuit.
- the cover 21 is attached to the notch part 22a so as to cover the housing 22b in which the battery 25 is stored.
- the electric circuit includes a connection terminal to the battery 25, a processor, a memory and the like.
- the lower main body 23 has a hole 23a for aligning the electrode-side surface of the electrochemical sensor 30 with the micropore-formed area of the subject's forearm.
- the forearm contact surface 23b of the lower body 23 of the sensor assembly 20 is a recess having a curved surface along the curved surface of the forearm so that the sensor assembly 20 can be attached to the forearm.
- the R value of the contact surface 23b is normally set to 40 to 50.
- the electrochemical sensor 30 is connected to the electric circuit via the connection terminal 22d of the upper main body 22.
- the electrochemical sensor 30 connected to the connection terminal 22d also is housed between the upper main body 22 and the lower main body 23.
- the electrochemical sensor 30 is housed between the upper main body 22 and the lower main body 23 so that the electrodes are positioned on the forearm side.
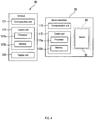
- the sensor assembly 20 has an electrochemical sensor 30, a communication unit 113, and a control unit 115.
- the sensor assembly 20 is communicably connected to the communication unit 121 of the terminal 60 via the communication unit 113.
- the electrochemical sensor 30 is disposed so as to be in contact with the collection member 40.
- the measurement value of the intensity of the unprocessed signal and the measurement value of the background signal including the signal attributable to the test substance acquired by the electrochemical sensor 30 are output to the control unit 115.
- the communication unit 113 is a wireless communication unit.
- the communication unit 113 also may be a wired communication unit. Since the handling by the user is easy, the communication unit 113 is preferably a wireless communication unit.
- the control unit 115 of the sensor assembly 20 includes a processor 115a and a memory 115b.
- the processor 115a has the function of acquiring information on measured values of intensities of unprocessed signals and information on measured values of background signals including signals attributable to the test substance output from the electrochemical sensor 30.
- the processor 115a stores the information of the measurement value of the intensity of the unprocessed signal including the signal attributable to the acquired test substance and the information of the measurement value of the background signal in the memory 115b as necessary.
- the processor 115a has a function of executing the calculation of the intensity of the background signal at an arbitrary point in time after elapse of a predetermined time applying a power approximate expression, an exponential approximate expression, a linear approximate expression, or a combination thereof as the estimated expression for the change over time of the intensity of the background signal acquired within a predetermined time by the electrochemical sensor 30.
- the processor 115a also stores the information of the calculated value of the intensity of the background signal in the memory 115b as necessary.
- the processor 115a has a function of executing the calculation of the intensity of the signal attributable to the test substance by subtracting the intensity of the background signal at the measurement time point of the intensity of the unprocessed signal including the signal attributable to the test substance from the measured value of the intensity of the unprocessed signal including the signal attributable to the test substance.
- the processor 115a also stores the information on the intensity of the signal attributable to the test substance in the memory 115b as necessary.
- the processor 115a also has a function of executing the calculation of the amount of the test substance based on the relationship between the intensity of the signal attributable to the test substance and the in-vivo concentration of a substance correlated with the in-vivo concentration of the test substance.
- the processor 115a stores the information of the amount of the test substance in the memory 115b as necessary.
- the start of the predetermined time may be, for example, a point of time when the power supply of the sensor assembly 20 is turned on, a point of several minutes after the point of turning on the power of the sensor assembly 20, a point of time instructed by the user and the like.
- the end of the predetermined time also includes, for example, the time when the user instructs termination, the time when the background signal becomes lower than a threshold value, a time set in the memory 115b of the sensor assembly 20 set in advance or the like.
- the memory 115b stores information on a power approximate expression, an exponential approximation expression, a linear approximation expression or a combination thereof which is an estimated expression, information on the in-vivo concentration of a substance correlated with the in-vivo concentration of the test substance, information on correction formula and the like.
- examples of the in-vivo concentration of the substance correlated with the in vivo concentration of the test substance include, but are not limited to, the blood concentration of the test substance, the concentration in the interstitial fluid of another substance correlated with the test substance, blood concentration of other substances correlated with the test substance and the like.
- the memory 115b also may temporarily store information on the measured value of the intensity of the background signal acquired within a predetermined time by the electrochemical sensor 20, information on the calculated value of the intensity of the background signal at an optional point in time after the lapse of a predetermined time, information on the intensity of a signal attributable to the test substance, information on the amount of a test substance and the like.
- the sensor assembly 20 also may be integrated with the collection member 40 described later. In this case, measurement of the background signal is performed without setting the sensor assembly 20 on the arm of the subject.
- an electrochemical sensor including a glucose sensor for use in detection of glucose contained in interstitial fluid extracted from a subject.
- the electrochemical sensor 30 includes a substrate 31, a working electrode 32, a counter electrode 33, a reference electrode 34, and electrode leads 35, 36, and 37.
- the working electrode 32, the counter electrode 33, the reference electrode 34, and the electrode leads 35, 36, 37 are provided on one surface of the substrate 31.
- the shape of the substrate 31 may be a rectangular shape, a polygonal shape, a circular shape, or the like, and is not particularly limited.
- the material configuring the substrate 31 is an insulating material which does not affect the conductivity of at least the working electrode 32, the counter electrode 33 and the reference electrode 34.
- Examples of the material configuring the substrate 31 include polyester resins such as polyvinyl alcohol, polyethylene terephthalate, polybutylene terephthalate, polyethylene naphthalate, and polybutylene naphthalate; polyimide; glass epoxy resin; glass; ceramic and the like, but is not particularly limited.
- the thickness of the substrate 31 can be appropriately decided according to the application of the electrochemical sensor and the like.
- the substrate 31 preferably is sufficiently flexible to be adhered to the skin.
- the working electrode 32 is arranged on one side of the surface of the substrate 31.
- the working electrode 32 is connected to the electrode lead 35.
- the electrode lead 35 extends from the working electrode 32 toward the other side portion of the substrate 31, more specifically, toward the lower side of the substrate 31 in FIG. 5 .
- the working electrode 32 includes an electrode layer 131 formed on one surface of the substrate 31 and an enzyme layer 132 containing glucose oxidase.
- the enzyme layer 132 is provided on the surface of the electrode layer 131.
- the electrode layer 132 exchanges electrons with hydrogen peroxide attributable to glucose.
- the electrode layer 131 contains a conductive material.
- a metal material such as platinum, gold and the like can be used as the conductive material used for the electrode layer 131, but there is no particular limitation.
- the thickness of the electrode layer 132 is not particularly limited as long as it is a thickness that maintains conductivity. From the perspective of conductivity, the thickness of the electrode layer 132 is preferably 0.01 ⁇ m or more, more preferably 0.05 ⁇ m or more, and from the perspective of manufacturing cost the thickness is preferably 0.5 ⁇ m or less, more preferably 0 .3 ⁇ m or less.
- the enzyme layer 132 is provided on the surface of the electrode layer 131.
- the enzyme layer 132 includes glucose oxidase.
- Glucose oxidase is an enzyme that generates hydrogen peroxide using glucose as a substrate.
- the organism of the source of glucose oxidase is not particularly limited.
- the amount of glucose oxidase in the enzyme layer 132 is preferably 0.01 U/ ⁇ L or more, and more preferably 0.1 U/ ⁇ L or more from the viewpoint of glucose detection sensitivity when converted to the amount of glucose oxidase activity in the solution applied on the electrode layer 131. From the perspective of cost, the amount of glucose oxidase is preferably 100 U/ ⁇ L or less, and more preferably 50 U/ ⁇ L or less.
- the working electrode 32 is brought into contact with body fluid.
- glucose is contained in the body fluid
- the glucose oxidase existing in the enzyme layer 132 in the working electrode 32 oxidizes the glucose, as shown in FIG. 6 .
- Oxidation of glucose produces hydrogen peroxide and gluconic acid.
- the generated hydrogen peroxide is electrolyzed on the electrode layer 131 of the working electrode 32.
- glucose contained in a body fluid can be detected based on a current signal generated by electrolysis of hydrogen peroxide.
- the counter electrode 33 is disposed outside the working electrode 32, more specifically, on the surface of the substrate 31 on the upper side of the working electrode 32 in FIG. 5 .
- the counter electrode 32 is connected to the electrode lead 36.
- the electrode lead 36 extends from the counter electrode 33 toward the other side portion of the substrate 31, more specifically, toward the lower side of the substrate 31 in FIG. 5 .
- the counter electrode 33 includes an electrode layer containing a conductive material.
- the conductive material may be, for example, metals such as platinum, gold, silver, copper, carbon, palladium, chromium, aluminum, nickel, alloys including at least one of these metals, metal halogens such as chlorides of these metals, carbon materials such as carbon nanotube film, glassher carbon, graphite and the like, semiconductors such as silicon and germanium, and is not particularly limited.
- the thickness of the electrode layer in the counter electrode 33 can be appropriately determined according to the application of the electrochemical sensor and the like.
- the reference electrode 34 is disposed at a position facing the counter electrode 33 across the working electrode 32.
- the reference electrode 34 is connected to the electrode lead 37.
- the electrode lead 37 extends from the reference electrode 34 toward the other side portion of the substrate 31, more specifically, toward the lower side of the substrate 31 in FIG. 5 .
- the reference electrode 34 includes an electrode layer containing a conductive material.
- the conductive material used for the electrode layer of the reference electrode 34 is the same as the conductive material used for the electrode layer of the counter electrode 33.
- Specific examples of the reference electrode include a silver-silver chloride electrode and the like, but are not particularly limited.
- the thickness of the electrode layer in the reference electrode 34 can be appropriately determined according to the application of the electrochemical sensor 30 and the like.
- the electrochemical sensor 30 also may omit the reference electrode 34.
- the counter electrode 33 also may serve as the reference electrode depending on the type of the conductive material used for the counter electrode 33, the thickness of the counter electrode 33 and the like.
- the electrochemical sensor 30 preferably includes the reference electrode 34 from the perspective of suppressing the influence of the voltage drop and stabilizing the voltage applied to the working electrode 32.
- Examples of a method of forming the working electrode 32, the counter electrode 33, and the reference electrode 34 include, for example, a vapor deposition method, a sputtering method, a screen printing method, and the like, but are not particularly limited.
- the method of forming the working electrode 32, the counter electrode 33, and the reference electrode 34 can be appropriately selected according to the type of the conductive material.
- the electrode lead 35, the electrode lead 36, and the electrode lead 37 are arranged so as to be parallel to each other at the other side part of the substrate 31, more specifically, at the lower side portion of the substrate 31 in FIG 5 .
- the electrochemical sensor 30 may be an enzyme sensor other than a glucose sensor, such as a protein sensor, a DNA sensor or the like.
- a glucose sensor such as a protein sensor, a DNA sensor or the like.
- the electrochemical sensor 30 instead of glucose oxidase contained in the enzyme layer 132 of the working electrode 32, can also use other enzymes, substances specifically binding to the protein of the test substance, or substance specific to the DNA of the test substance. It is possible to detect substances other than glucose according to the electrochemical sensor 30 of a type other than the glucose sensor.
- an enzyme that generates hydrogen peroxide by an enzymatic reaction typified by lactate oxidase, galactose oxidase, cholesterol oxidase and the like
- an enzyme that generates a substance other than hydrogen peroxide by an enzymatic reaction such as glucose dehydrogenase may be used as the enzyme, but is not particularly limited.
- an enzyme that generates a substance other than hydrogen peroxide by an enzymatic reaction platinum, gold, silver, copper, carbon, palladium, chromium, aluminum, nickel or the like can be used as the conductive material of the working electrode, an alloy containing at least one of these metals, a metal halide such as chloride of these metals, a carbon material such as a carbon nanotube film, glassher carbon, graphite, a semiconductor such as silicon, germanium, or the like may be used.
- substances that specifically bind to proteins include, but are not limited to, antibodies against proteins, and the like.
- substances that specifically bind to DNA include, but are not limited to, complementary strand DNA of the DNA of the test substance, and the like.
- the electrode structure of the electrochemical sensor 30 also may be a three-electrode structure or a two-electrode structure.
- the three-electrode structure is a three-electrode structure including one working electrode 32, one counter electrode 33, and one reference electrode 34 as described above.
- the two-electrode structure is a two-electrode structure including one working electrode, and an electrode that serves as both a counter electrode and reference electrode.
- the collection member 40 is a member for collecting interstitial fluid extracted from the skin of the subject by percutaneous sampling.
- the collection member 40 has an extraction medium 41 capable of collecting interstitial fluid and a support member 42 supporting the extraction medium.
- the extraction medium include, but are not limited to, hydrogel, pure water, phosphate buffered saline, tris-buffered physiological saline and the like.
- a hydrogel is preferable when considering the motion of the subject at the time of percutaneous sampling of the interstitial fluid. The hydrogel only needs to be capable of collecting the test substance in the interstitial fluid or interstitial fluid.
- hydrogel materials include, but are not limited to, agarose-based hydrogels; hydrogels based on polyethylene glycol diacrylate; hydrogels based on vinyl acetate containing polyethylene glycol/polyethyleneimine diacrylate and polyethylene glycol-n-vinylpyrrolidone diacrylate and the like.
- the polymer capable of forming a hydrogel may be either a synthetic polymer or a natural polymer.
- synthetic polymers include, but are not limited to, polyvinyl alcohol, polyacrylic acid polymers, cellulose derivatives such as hydroxypropyl cellulose, polymers such as polyethylene glycol, copolymers and block copolymers, and other water-swellable or biocompatible polymers.
- natural polymers include, but are not limited to, collagen, hyaluronic acid, gelatin, albumin, polysaccharides, derivatives thereof and the like.
- the natural polymer may be of a compound type separated from various botanical materials such as psyllium.
- the hydrogel can also be produced by, for example, the following methods: a) synthesis from a monomer (crosslinking polymerization); b) synthesis from a polymer and a polymerization aid (grafting and crosslinking polymerization); c) synthesis from nonpolymerization aid (crosslinking polymer); d) synthesis from polymer with energy source (crosslinking polymer without auxiliary agent), and e) synthesis from polymer (due to intermolecular bond of reactive polymer crosslinking).
- the thickness of the hydrogel preferably is as thin as possible in consideration of the response speed of the electrochemical sensor 30 to the test substance.
- the thickness of the hydrogel is preferably 1 to 1000 ⁇ m, more preferably 5 to 700 ⁇ m, most preferably 10 to 300 ⁇ m.
- the size of the hydrogel may be any size as long as the interstitial fluid extraction region is covered and contact with the electrochemical sensor 30 can be secured.
- the hydrogel may contain an enzyme when the test substance is a low molecular weight compound such as glucose, lactic acid or the like. Examples of the enzyme include glucose oxidase, glucose dehydrogenase, lactate oxidase and the like. The method of introducing the enzyme into the hydrogel can be appropriately determined depending on the method of forming the hydrogel.
- Examples of methods for introducing the enzyme into the hydrogel in the case of preparing a hydrogel by electron beam crosslinking of polyvinyl alcohol include, but are not limited to, a method of adding an enzyme to a polyvinyl solution and performing electron beam crosslinking, and a method in which a functional group is introduced into a polymer constituting the hydrogel and the enzyme is chemically bonded to the functional group, and the like.
- the working electrode of the electrochemical sensor 30 is a working electrode which does not include an enzyme layer and includes an electrode layer.
- the support member 42 has a support part body 42a having a concave portion and a flange portion 42b formed on the outer peripheral side of the support part body 42a.
- the extraction medium is held in the concave portion of the support part body 42a.
- An adhesive layer 43 is provided on the surface of the flange portion 42b.
- a release paper 44 for sealing the extraction medium 41 held in the concave portion is affixed to the adhesive layer 43.
- the release paper 44 is peeled from the adhesive layer 43 to expose the extraction medium 41 and the adhesive layer 43.
- the collection member 40 can be affixed to the skin of the subject by the adhesive layer 43 so that the extraction medium 41 is brought into contact with the skin of the subject.
- the terminal 60 includes a communication unit 121, a control unit 123, and a display unit 125.
- the terminal 60 is communicably connected to the communication unit 113 of the sensor assembly 20 via the communication unit 121.
- the communication unit 121 is a wireless communication unit. Note that the communication unit 121 also may be a wired communication unit. Since the handling by the user is easy, the communication unit 121 is preferably a wireless communication unit. Note that the terminal 60 also may calculate a value indicating the amount of the test substance or the like.
- the control unit 123 includes a processor 123a and a memory 123b.
- the processor 123a has the function of obtaining information on the measurement value of the intensity of an unprocessed signal including a signal attributable to the test substance, information on the measurement value of the background signal, information of the calculated value of the intensity of the background signal at an optional time point after a predetermined time has elapsed, information on the intensity of the signal attributable to the test substance, information on the amount of the test substance and the like from the sensor assembly via the communication unit 12.
- the processor 123a also stores information on the measured value of the intensity of the unprocessed signal including the signal attributable to the test substance, the information on the measured value of the background signal in the absence of the test substance, information on the calculated value of the intensity of the background signal at an optional time point after a predetermined time has elapsed, information on the intensity of the signal attributable the test substance, information on the amount of the test substance and the like in the memory 123b.
- the processor 123a also has the function of generating image information for display on the display unit 125 from the information on the measured value of the intensity of the unprocessed signal including the signal attributable to the test substance, the information on the measured value of the background signal in the absence of the test substance, information on the calculated value of the intensity of the background signal at an optional time after a predetermined time has elapsed, information on the intensity of the signal attributable to the test substance, information on the amount of the test substance and the like.
- the processor 123a has a function of outputting the generated image information to the display unit 125.
- the memory 123b temporarily stores information on the measured value of the intensity of the unprocessed signal including the signal attributable to the test substance, information on the measured value of the background signal in the absence of the test substance, information on the calculated value of the intensity of the background signal at an optional time point after a predetermined time has elapsed, information on the intensity of the signal attributable to the test substance, information on the amount of the test substance and the like.
- the memory 123b also may store information on a power approximate expression, an exponential approximate expression, a linear approximation expression or a combination thereof, information on the in-vivo concentration of a substance correlated with the in-vivo concentration of the test substance, information on a correction equation and the like.
- the display unit 125 displays an image based on the image information output from the processor 123a. For example, information on the amount of the test substance together with information at an optional point in time after a predetermined time has elapsed are displayed on the display unit 125.
- FIG. 8 is a flowchart showing the processing procedure of the test substance continuous monitoring method according to the first embodiment.
- interstitial fluid derivation promotion processing Before step S101, the user first applies interstitial fluid derivation promotion processing to the skin of the forearm.
- methods for performing the interstitial fluid derivation promotion treatment include, but are not limited to, a method of forming an interstitial fluid extraction region containing micropores in the skin using a puncture tool equipped with a fine needles; a method of treating the skin to form an interstitial fluid extraction region by microinvasive treatment of the skin by a tape, friction, polishing, ultrasonic irradiation.
- the frequency of the ultrasonic wave is preferably 10 kHz to 500 kHz, more preferably 20 kHz to 200 kHz, and most preferably 30 to 150 kHz.
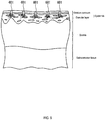
- the user uses a puncture needle equipped with a microneedle to form a interstitial fluid extraction region including micropores 601 in the epidermis of the forearm.
- the user closes the fine holes 601 in the interstitial fluid extraction region with a tape or the like.
- the user also adheres the collection member 40 onto this tape.
- the sensor assembly 20 is installed on the collection member 40.
- step S101 the user first activates the sensor assembly 20.
- the processor 115a of the control unit 115 then causes the electrochemical sensor 30 to measure the background signal B1 for a predetermined time.
- step S101 the change over time of the intensity of the background signal for a predetermined time is measured. Examples of methods of measuring the background signal B1 include, but are not particularly limited to, an electrochemical measurement method such as a chronoamperometry method, a cyclic voltammetry method, a chrono-coulometry method and the like.
- Measurement of the background signal B1 preferably is performed during the warm-up time of the electrochemical sensor 30 of the sensor assembly 20. Normally, in the case of performing measurement using an electrochemical sensor, a certain amount of time is required until the current signal flowing in the electrochemical sensor is stabilized and the measured value is stabilized after energization. Therefore, the electrochemical sensor is energized without actual measurement during the period from when the electrochemical sensor is energized until the current signal flowing into the electrochemical sensor is stabilized.
- the inventors of the present invention discovered can effectively utilize the warming-up time of the electrochemical sensor 30 can be effectively utilized and the amount of the test substance can be accurately calculated by measuring the background signal B1 at the warming-up time of the electrochemical sensor 30.
- the "warming-up time” is the time from the application of the voltage to the electrochemical sensor until the measured value becomes steady.
- the measurement time of the change over time of the intensity of the background signal B1 is preferably 20 minutes or more, and more preferably 30 minutes or more from the perspective of obtaining a calculated value of the intensity of the background signal with high accuracy.
- the measurement time of the change over time of the intensity of the background signal B 1 preferably is 90 minutes or less, and more preferably 60 minutes or less from the perspective of preventing a reduction in the quality of life of the subject.
- the processor 115a acquires information on the intensity of the background signal B1 measured by the electrochemical sensor 30. Subsequently, the processor 115a stores the information on the acquired intensity of the background signal B1 in the memory 115b.
- the background signal B1 can be measured by applying a voltage to the electrochemical sensor 30 in a state in which the collection member 40 that does not include the test substance is attached to the electrochemical sensor 30.
- step S102 the control unit 115 of the sensor assembly 20 calculates the estimated background signal Bt which is the background signal at the time of measurement of the test substance.
- the processor 115a of the control unit 115 first obtains from the memory 115b information on the intensity of the background signal B1 and information on the power approximate expression, the exponential approximation formula, the linear approximation formula, or a combination thereof.
- the processor 115a performs the best adaptation to the change over time of the intensity of the background signal B1 for a predetermined time from the power approximate expression, the exponential approximation expression, the linear approximation expression or combinations thereof which are estimation formulae.
- the processor 115a causes the estimation equation to fit with respect to the temporal change of the intensity of the background signal and obtains a constant in the estimation equation. Thereafter, the processor 115a calculates the estimated background signal Bt in the measurement time of the test substance according to the estimation formula. The processor 115a stores the information on the calculated estimated background signal Bt in the memory 115b.
- step S103 the processor 115a of the control unit 115 then causes the electrochemical sensor 30 to measure the unprocessed signal At including the signal attributable to the test substance.
- step S103 the user first removes the tape between the collection member 40 and the interstitial fluid extraction area including the microhole 601 of the forearm. Specifically, the user removes the sensor assembly 20, the collection member 40 and the tape from the forearm. As shown in FIG. 10 , the user then adheres the collection member 40 to the tissue extracting area so that the extraction medium and the interstitial fluid extraction area including the microhole 601 of the forearm are in contact with each other. Next, the user mounts the sensor assembly 20 on the collection member 40.
- the processor 115a causes the electrochemical sensor 30 to measure the unprocessed signal At including the signal attributable to the test substance.
- a method for measuring the untreated signal At including a signal attributable to the test substance include, but are not limited to, an electrochemical measurement method such as a chronoamperometry method, a cyclic voltammetry method, a chrono-coulometry method and the like.
- the processor 115a acquires information on the intensity of the unprocessed signal At including the signal attributable to the test substance measured by the electrochemical sensor 30. Thereafter, the processor 115a stores the information of the unprocessed signal At including the signal derived from the acquired test substance in the memory 115b.
- step S104 the processor 115a of the control unit 115 calculates the signal Ct attributable to the test substance.
- the processor 115a of the control unit 115 first acquires from the memory 115b the information of the unprocessed signal At including the signal attributable to the test substance, and the information of the intensity of the estimated background signal Bt.
- the processor 115a subtracts the value of the intensity of the estimated background signal Bt from the measured value of the intensity of the unprocessed signal At including the signal attributable to the test substance.
- the processor 115a calculates the signal Ct attributable to the test substance.
- the processor 115a stores the information of the signal Ct attributable to the calculated test substance in the memory 115b.
- step S104 the calculation of the signal Ct caused by the test substance in step S104 also may be executed by the terminal 60 instead of being executed by the processor 115a of the sensor assembly.
- the processor 115a outputs the information of the unprocessed signal At including the signal attributable to the test substance, and the information of the intensity of the estimated background signal Bt to the terminal 60.
- step S105 the processor 115a executes the correction of the signal Ct attributable to the test substance.
- the processor 115a first acquires the information on the signal Ct attributable to the test substance, and information on the in-vivo concentration of the substance correlated with the in-vivo concentration of the test substance from the memory 115b.
- the processor 115a uses the in-vivo concentration of the substance correlated with the in-vivo concentration of the test substance, the correction formula and the like, so that the signal Ct attributable to the test substance is converted to a value Dt indicating the amount of the test substance.
- the in-vivo concentration of the substance correlated with the in-vivo concentration of the test substance may be, for example, the blood concentration of the test substance, the concentration of other substances correlated with the test substance in the interstitial fluid, the blood concentration of other substances correlated with the test substance in the blood and the like, but the correlated substance is not particularly limited. From the perspective of improving accuracy, the in-vivo concentration of the substance correlated with the in-vivo concentration of the test substance preferably is the blood concentration of the test substance.
- the blood concentration of the test substance can be measured by, for example, a self-administered blood glucose measuring device or the like.
- the blood concentration of the test substance is used as the in-vivo concentration of the substance correlated with the in-vivo concentration of the test substance
- the blood concentration of the test substance is preferably measured within the measurement time of the background signal B1 from the viewpoint of more accurately estimating the amount of the test substance.
- the correction formula is not particularly limited insofar as the concentration of the test substance can be obtained.
- the blood concentration of the test substance used for correction is a "value obtained by subtracting the estimated background current value (corresponds to the intensity of the estimated background signal Bt) from the measured value of the unprocessed current signal a1 including the current value attributable to the test substance (corresponds to the intensity of the unprocessed signal At including the signal attributable to the test substance), that is it can be regarded as equal to the current value attributable to the test substance.
- a determination is first made regarding the ratio ( the blood concentration of the test substance / the measured value of the current signal) for converting the measurement value of the unprocessed current signal a1 including the current signal attributable to the test substance into the blood concentration of the test substance.
- the processor 115a calculates the amount of the test substance from the current value attributable to the test substance.
- the amount of variation of the current value also can be calculated by the aforementioned power approximation, exponential approximation, linear similarity or a combination thereof.
- the processor 115a stores the information of the value Dt indicating the amount of the test substance in the memory 115b.
- step S106 the processor 115a outputs the information of the value Dt indicating the amount of the test substance stored in the memory in step S105 to the terminal 60.
- the interstitial fluid derivation promotion process after applying the interstitial fluid derivation promotion process to the forearm skin, the measurement of the background signal B1 by the sensor assembly 20, the calculation of the estimated background signal Bt, and the measurement of the unprocessed signal At including the signal attributable to the test substance are performed.
- the interstitial fluid derivation promotion process also may be performed after measurement of the background signal B1 by the sensor assembly 20 and calculation of the estimated background signal Bt.
- the measurement of the background signal B1 can be performed by bringing the sensor assembly 20 and the collection member 40 into contact without placing the sensor assembly 20 and the collection member 40 on the forearm.
- a background signal at the time of measurement of an unprocessed signal including a signal attributable to a test substance is determined based on a background signal at a point within a predetermined time. For example, the background signal at the time the background signal is stabilized may be subtracted from the unprocessed signal including the signal attributable to the test substance. Also, the timing of the measurement of the background signal need not be before the measurement of the unprocessed signal including the signal attributable to the test substance, and may be after the measurement of the unprocessed signal including the signal attributable to the test substance.
- the measurement of the background signal B1 and the calculation of the estimated background signal Bt are carried out when carrying out the test substance continuous monitoring method.
- the measurement of the background signal B1 and the calculation of the estimated background signal Bt may be performed in advance in the manufacturing process of the continuous monitoring system 10 (continuous monitoring method of the second aspect).
- information of the estimation expression and information of the estimated background signal Bt can be stored in the memory 115a of the control unit 115 of the sensor assembly 20 in advance.
- the user also can immediately perform the measurement of the test substance using the continuous monitoring system 10.
- the continuous monitoring method of the second aspect will be described.
- step S201 of the continuous monitoring method according to the second aspect the processor 115a of the control unit 115 of the sensor assembly 20 causes the electrochemical sensor 30 to measure the unprocessed signal At including the signal attributable to the test substance.
- Step S201 is the same as step S 103 in the continuous monitoring method of the first aspect.
- step S202 the processor 115a executes a call of the estimated background signal Bt stored in the memory 115a and acquires these pieces of information.
- Steps S203 to S205 are the same as steps S 104 to S 106 in the continuous monitoring method of the first aspect.
- Example 1 Comparative Example 1, the influence of the presence or absence of calculation of the estimated background current value at an optional time point after a predetermined time has elapsed from the start of the measurement of the background current signal, and the presence or absence of using the estimated background current value were examined.
- a working electrode (diameter: 9 mm) configured by a platinum thin film and a counter electrode configured by a platinum thin film were formed on one surface of a PEN film by vapor deposition.
- a silver/silver chloride ink was applied to the surface of the PEN film on the working electrode and the counter electrode side and dried to form a reference electrode made of silver/silver chloride. An electrode substrate was obtained in this way.
- a hydrogel (lateral: 20 mm, longitudinal: 20 mm, thickness: 0.2 mm) of PVA was obtained by irradiating PVA aqueous solution A (composition: 12% (w/w) PVA, 2% (w/w) potassium chloride, and 86% (w/w) water) with an electron beam having a dose of 25 kGr.
- the human forearm of healthy subjects was disinfected with ethanol.
- a puncture tool equipped with a fine needle manufactured by SYSMEX CORPORATION
- an interstitial fluid extraction region with a diameter of 8 mm containing fine pores was formed on the forearm.
- a mending tape (manufactured by 3M Co., Ltd.) was adhered on the interstitial fluid extraction region formed in Example 1 (4) to suppress exudation of interstitial fluid from micropores in the interstitial fluid extraction region.
- Example 1 (3) The hydrogel obtained in Example 1 (3) was further attached to a mending tape (manufactured by 3M Co., Ltd.) attached to the interstitial fluid extraction region in Example 1 (5). Subsequently, a glucose sensor was attached to the hydrogel on the interstitial fluid extraction region so that the working electrode, the reference electrode and the counter electrode of the glucose sensor respectively came into contact with the hydrogel on the interstitial fluid extraction region. In this way the glucose sensor was attached to the forearm. A mending tape (manufactured by 3M Co., Ltd.), a hydrogel and a glucose sensor are superimposed in this order on the interstitial fluid extraction region where micropores were formed in the human forearm.
- a mending tape manufactured by 3M Co., Ltd.
- Example 1 (6) the glucose sensor attached to the forearm was connected to a potentiostat (trade name: ALS832b, manufactured by BAS, Inc.). Using a reference electrode as a reference, a voltage of 0.45 V was applied to the working electrode of the glucose sensor. A background current signal flowing between the working electrode and the counter electrode was measured for 2690 seconds.
- a potentiostat trade name: ALS832b, manufactured by BAS, Inc.
- the glucose sensor, hydrogel, and mending tape (manufactured by 3M Co., Ltd.) were removed from the interstitial fluid extraction region of the forearm.
- a hydrogel was applied on the interstitial fluid extraction area so as to cover the interstitial fluid extraction area of the forearm.
- the glucose sensor was adhered to the hydrogel on the interstitial fluid extraction area so that the center position of the interstitial fluid extraction area aligned with the center position of the working electrode of the glucose sensor while the working electrode, the reference electrode, and the counter electrode of the glucose sensor were in contact with the hydrogel on the interstitial fluid extraction area. In this way the glucose sensor was attached to the forearm.
- the glucose sensor started the measurement of the unprocessed current signal a1 including a current signal attributable to the glucose test substance in the hydrogel. Measurement of the current signal by the glucose sensor was performed at two-second intervals. In this way a measured value (hereinafter also referred to as "current measured value A1") of the unprocessed current signal a1 including a current signal attributable to glucose was obtained.
- current measured value A1 the current measurement value A1 at the measurement time point of the elapsed time t from the start of the measurement of the unprocessed current signal including the current signal attributable to glucose is also referred to as "current measurement value A1t”.
- a blood glucose self-administered measurement device (trade name: Freestyle, manufactured by Nipro Co., Ltd.) was used at the time of 3600 seconds and 23700 seconds from the start of the measurement of the unprocessed current signal including the current signal attributable to glucose in Example 1 (8) to measure the blood glucose level of the blood obtained by puncturing the fingertip (hereinafter also referred to as "calibration blood glucose level G 3600 " and “calibration blood glucose level G 23700 ").
- the formula (Ia) was obtained.
- y ⁇ 0.002 xt + 87.689
- t represents the elapsed time from the start of the measurement of the unprocessed current signal including the current signal attributable to glucose.
- This formula was used to obtain the estimated blood glucose level from the current measurement value A1t obtained in Example 1 (8).
- Blood glucose levels were measured at intervals of 900 to 1800 seconds using a blood glucose self-administered measurement device from 4500 seconds after the start of measurement of an unprocessed current signal including a current signal attributable to glucose in Example 1 (8).
- the blood glucose level at the measurement time point t from the start of the measurement of the unprocessed current signal including the current signal attributable to glucose is also referred to as "measured blood glucose level Gt".
- the measured blood glucose level Gt was used for comparison with the estimated blood glucose level and was used as the reference blood glucose level.
- the current value Ct attributable to the test substance was calculated using the current measurement value A1t obtained in Example 1 (8) and the estimated background current value Bt at the measurement time point corresponding to the current measurement value A1t, and based on the formula (III).
- Current value Ct attributable to the test substance current measured value Alt ⁇ estimated background current value Bt
- the measurement time point of the current signal in Example 1 (8) was divided at intervals of 5 minutes, and the average value of the current value Ct attributable to the test substance obtained within one delimited period (5 minutes) was calculated.
- the average blood glucose level is the average value of the calibration blood glucose level G 3600 and the calibration blood glucose level G 23700 , where t is the elapsed time from the start of measurement of the background current signal, and i represents the current value Ct attributable to the test substance, and [- 0.002 ⁇ t + 87.689] corresponds to the straight line represented by the formula (Ia).
- FIG. 12 shows the result of examining the change over time in blood glucose level in Example 1.
- open circles indicate change over time in the estimated blood glucose level
- crosses show change over time in the measured blood glucose level.
- the accuracy of the estimated blood glucose level was evaluated by error grid analysis using the estimated blood glucose level and the measured blood glucose level at the same time point.
- the accuracy of the estimated blood glucose level is classified into the areas A to E shown in FIG. 13 and evaluated by comparing the estimated blood glucose level and the reference blood glucose level which is the measured blood glucose level.
- the significance of each region is as follows.
- the accuracy of the estimated blood glucose level is usually judged to have a precision with no practical problem if the plot of the estimated blood glucose level falls within the areas A and B in the error grid analysis.
- FIG. 14 The result of evaluating the estimated blood glucose level by error grid analysis in Example 1 is shown in FIG. 14 .
- A indicates the area A in the error grid analysis.
- the estimated blood glucose level Dt was calculated without measuring the background current value, calculating the estimated background current value, nor calculating the current value Ct attributable to the test substance.
- Example 1 The measurement time point of the current signal in Example 1 (8) was divided at intervals of 5 minutes, and the average value was calculated for the current measurement value A1t obtained in Example 1 (8) within one delimited period (5 minutes).
- Example 1 the same operation as in Example 1 (9) was performed to obtain the calibration blood glucose level G 3600 , the calibration blood glucose level G 23700 , and the measured blood glucose level Gt.
- the formula (Ib) was obtained using the current value at 3600 seconds after the start of measurement and the current value at 23700 seconds elapsed.
- y ⁇ 0.0026 xt + 113.42
- t represents the elapsed time from the start of the measurement of the unprocessed current signal including the current signal attributable to glucose.
- Estimated blood glucose level Dt mean blood glucose level ⁇ i / ⁇ 0.0026 ⁇ t + 113.42
- the average blood glucose level is the average value of the calibration blood glucose level G 3600 and the calibration blood glucose level G 23700 , where t is the elapsed time from the start of measurement of the unprocessed current signal including the current signal attributable to glucose, and i represents the current value Ct attributable to the test substance, and [- 0.0026 ⁇ t + 113.42] corresponds to the straight line represented by the formula (Ib).
- FIG. 15 shows the result of examining the change over time in blood glucose level in Comparative Example 1.
- open circles indicate change over time in the estimated blood glucose level, and crosses show change over time in the measured blood glucose level.
- FIG. 15 the accuracy of the estimated blood glucose level was evaluated by error grid analysis using the estimated blood glucose level and the measured blood glucose level at the same time point.
- FIG. 16 A indicates the area A in the error grid analysis.
- Example 2 the influence on the accuracy of the estimated blood glucose level was examined according to whether or not the estimated background current value was used and whether or not the estimated background current level was calculated at an optional time point after a predetermined time had elapsed after the start of measurement of the background current signal when the timing of the measurement of the calibration blood glucose level and the measured blood glucose level was changed according to Example 2 and comparative Example 2.
- Example 1 The same operation as in Example 1 (1) was carried out to obtain an electrode substrate.
- Example 1 (2) The same operation as in Example 1 (2) was carried out to obtain a glucose sensor.
- Example 1 The same operation as in Example 1 (3) was carried out to obtain a PVA hydrogel.
- Example 1 The same operation as in Example 1 (4) was carried out to form the interstitial fluid extraction area.
- Example 1 The same operation as in Example 1 (5) was carried out to suppress exudation of interstitial fluid from micropores in the interstitial fluid extraction area.
- Example 1 (6) The same operation as in Example 1 (6) was carried out, and application of a hydrogel and attachment of a glucose sensor were accomplished.
- a background current signal was measured in the same manner as in Example 1 (7) except that a small potentiostat (manufactured by Fuso Manufacturing Co., Ltd.) was used.
- Example 1 The same operation as in Example 1 (8) was carried out to obtain current measurement value A1t.
- Example 2 The same operation as in Example 1 (9) was performed to obtain a calibration blood glucose level G 2700 and a calibration blood glucose level G 29100 except that measurement of the calibration blood glucose level was made at the time of 2700 seconds elapsed and at the time of 29100 seconds elapsed from the start of measurement of the unprocessed current signal including the current signal attributable to glucose in Example 2 (8).
- Example 2 The same operation as in Example 1 (9) was carried out to obtain a measured blood glucose level Gt except that the blood glucose level was measured using a self-administered glucose measurement device at 900 to 1800 second intervals after 3600 seconds had elapsed after the start of the measurement of the unprocessed current signal including the current signal attributable to glucose in Example 2 (8).
- t represents the elapsed time from the start of the measurement of the unprocessed current signal including the current signal attributable to glucose.
- the current value Ct attributable to the test substance was calculated using the current measurement value A1t obtained in Example 1 (8), and the estimated background current value Bt at the measurement time point corresponding to the current measurement value A1t, and based on the formula (III).
- the measurement time point of the current signal in Example 1 (8) was divided at intervals of 5 minutes, and the average value of the current value Ct attributable to the test substance obtained within one delimited period (5 minutes) was calculated.
- Estimated blood glucose level Dt mean blood glucose level ⁇ i / 150.151 xexp 0.0027 xt ⁇ 0.00143 ⁇ t + 138.806
- the average blood glucose level is the average value of the calibration blood glucose level G 2700 and the calibration blood glucose level G 29100 , where t is the elapsed time since the measurement start of the unprocessed current signal including the current signal attributable to glucose, i represents the current value Ct attributable to the test substance, and [150.151 ⁇ exp (- 0.0027 ⁇ t) - 0.00143 ⁇ t + 138.
- the current measurement value A1 corresponds to the attenuation curve calculated from the variation of the current measurement value A1 since, even if the blood glucose level is constant, it is assumed that the current measurement value A1 attenuates with the passage of time due to the influence such as shrinkage of the micropore and degradation over time of the electrochemical sensor.
- FIG. 17 shows the result of examining the change over time in blood glucose level in Example 2.
- open circles indicate change over time in the estimated blood glucose level, and crosses show change over time in the measured blood glucose level.
- FIG. 18 the accuracy of the estimated blood glucose level was evaluated by error grid analysis using the estimated blood glucose level and the measured blood glucose level at the same time point.
- the result of evaluating the estimated blood glucose level by error grid analysis in Example 2 is shown in FIG. 18 .
- A indicates the area A in the error grid analysis.
- the average blood glucose level is the average value of the calibration blood glucose level G 2700 and the calibration blood glucose level G 29100 , where t is the elapsed time since the measurement start of the unprocessed current signal including the current signal attributable to glucose, i represents the current measurement value A1 at a measurement time point of elapsed time t after the measurement start of the unprocessed current signal including the current signal attributable to glucose, and [186.5161 ⁇ exp (- 0.002 ⁇ t) - 0.00093 ⁇ t + 150] corresponds to the attenuation curve calculated from the variation of the current measurement value since, even if the blood glucose level is constant, it is assumed that the current measurement value A1 attenuates with the passage of time due to the influence such as shrinkage of the micropore and degradation over time of the electrochemical sensor.
- FIG. 19 shows the result of examining the change over time in blood glucose level in Comparative Example 2.
- open circles indicate change over time in the estimated blood glucose level, and crosses show change over time in the measured blood glucose level.
- FIG. 19 the accuracy of the estimated blood glucose level was evaluated by error grid analysis using the estimated blood glucose level and the measured blood glucose level at the same time point.
- the result of evaluating the estimated blood glucose level by error grid analysis in Comparative Example 2 is shown in FIG. 20 .
- A indicates the area A in the error grid analysis.
- Example 1 The same operation as in Example 1 (1) was carried out to obtain an electrode substrate.
- Example 1 (2) The same operation as in Example 1 (2) was carried out to obtain a glucose sensor.
- Example 1 The same operation as in Example 1 (3) was carried out to obtain a PVA hydrogel.
- the working electrode, the reference electrode and the counter electrode of the glucose sensor obtained in Example 3 (2) were brought into contact with the hydrogel obtained in Example 3 (3), respectively.
- the glucose sensor was connected to a potentiostat (trade name: ALS 832 b, manufactured by BAS, Inc.).
- a reference electrode as a reference, a voltage of 0.45 V was applied to the working electrode of the glucose sensor.
- a background current signal flowing between the working electrode and the counter electrode was measured for 1428 seconds. Note that, during the measurement of the background current signal, drying of the hydrogel was suppressed by dripping PBS onto the hydrogel.
- Example 1 The same operation as in Example 1 (4) was carried out to form the interstitial fluid extraction area.
- Example 1 One month after measurement of the background current signal, the same operation as in Example 1 (5) was performed to suppress exudation of interstitial fluid from micropores in the interstitial fluid extraction region.
- the hydrogel obtained in Example 3 (3) was adhered on the interstitial fluid extraction region so as to cover the interstitial fluid extraction region of the human forearm.
- the glucose sensor was adhered to the hydrogel on the interstitial fluid extraction area so that the center position of the interstitial fluid extraction area aligned with the center position of the working electrode of the glucose sensor while the working electrode, the reference electrode, and the counter electrode of the glucose sensor obtained in Example 3 (2) were in contact with the hydrogel on the interstitial fluid extraction area.
- the glucose sensor was attached to the forearm.
- measurement of the unprocessed current signal including the current signal attributable to the glucose was started by the glucose sensor. Measurement of the current signal by the glucose sensor was performed at two-second intervals. In this way current measurement value A1 was obtained.
- the blood glucose level of the blood was measured at the time of 3600 seconds elapsed and 23700 seconds elapsed from the start of the measurement of the unprocessed current signal including the current signal attributable to glucose in Example 3 (8), and the calibration blood glucose level G 3600 and the calibration blood glucose level G 23700 were obtained.
- the obtained formula (Ic) was used to obtain the estimated blood glucose level from the current measurement value A1t obtained in Example 3 (8).
- Blood glucose levels were measured at intervals of 900 to 1800 seconds using a blood glucose self-administered measurement device from 4500 seconds elapsed after the start of measurement of an unprocessed current signal including a current signal attributable to glucose in Example 3 (8) to obtain the measured blood glucose level Gt.
- the current value Ct attributable to the test substance was calculated using the current measurement value A1t obtained in Example 3 (8) and the estimated background current value Bt at the measurement time point corresponding to the current measurement value A1t, and based on the formula (III).
- the measurement time point of the current signal in Example 3 (8) was divided at intervals of 5 minutes, and the average value of the current value Ct attributable to the test substance obtained within one delimited period (5 minutes) was calculated.
- the average blood glucose level is the average value of the calibration blood glucose level G 3600 and the calibration blood glucose level G 23700 , where t is the elapsed time from the start of measurement of the unprocessed current signal including the current signal attributable to glucose, and i represents the current value Ct attributable to the test substance, and [- 0.0021 ⁇ t + 94.661] corresponds to the straight line represented by the formula (Ic).
- FIG. 21 shows the result of examining the change over time in blood glucose level in Example 3.
- open circles indicate change over time in the estimated blood glucose level, and crosses show change over time in the measured blood glucose level.
- FIG. 21 the accuracy of the estimated blood glucose level was evaluated by error grid analysis using the estimated blood glucose level and the measured blood glucose level at the same time point.
- FIG. 22 A indicates the area A in the error grid analysis.
- Table 1 shows the ratio (hereinafter also referred to as "A area corresponding ratio") at which the estimated blood glucose levels obtained in Examples 1 to 3, and Comparative Examples 1 and 2 correspond to the A area in the error grid analysis, and MARD.
- Table 1 Estimated background current value was used A area corresponding ratio (%) MARD %
- Example 1 YES 100 6.3
- Example 2 YES 100 6.7
- Example 3 YES 100 7.2
- Example 1 the A area corresponding ratio in Examples 1 to 3 in which the estimated background current value calculated based on the measured background current value was used were all 100%.
- the MARD in Examples 1 to 3 were 6.3% (Example 1), 6.7% (Example 2) and 7.2% (Example 3). From these results, it was found that the accuracy of the estimated blood glucose level in Examples 1 to 3 was high.
- Example 1 It was found from Example 1 and Example 3 that an accurate estimated blood glucose level can be obtained in either case of using the estimated background current value calculated based on the background current value measured immediately before the measurement of the unprocessed current signal including the current signal attributable to glucose (Example 1), and the case of using the estimated background current value calculated based on the background current value previously measured by the glucose sensor used to measure glucose (Example 3).
- the working electrode, the reference electrode and the counter electrode of the glucose sensor obtained in Example 3 (2) were brought into contact with the hydrogel obtained in Example 3 (3), respectively.
- the glucose sensor was connected to a potentiostat (trade name: ALS 832 b, manufactured by BAS, Inc.).
- a reference electrode as a reference, a voltage of 0.45 V was applied to the working electrode of the glucose sensor.
- a background current signal flowing between the working electrode and the counter electrode was measured for 24 hours. Note that, during the measurement of the background current signal, drying of the hydrogel was suppressed by dripping PBS onto the hydrogel.
- the background current signal corresponding to 10 minutes, 15 minutes, 20 minutes, 30 minutes, 40 minutes, 50 minutes, 60 minutes and 90 minutes from the start of measurement of the background current signal measurement were used to obtain the estimation equation shown in Table 2.
- the background current when a predetermined time had elapsed from the start of the measurement of the background current signal was calculated using the obtained estimation equation to obtain the estimated background current value.
- An error was found based on the formula (V) using the obtained estimated background current value and the measured background current value (actual measured background current value).
- the results are shown in Table 2 and Table 3.
- "measurement time” means the time of the waveform of the background current signal used in the calculation of the estimated background current value.
Landscapes
- Health & Medical Sciences (AREA)
- Life Sciences & Earth Sciences (AREA)
- Engineering & Computer Science (AREA)
- Physics & Mathematics (AREA)
- Biomedical Technology (AREA)
- Biophysics (AREA)
- General Health & Medical Sciences (AREA)
- Pathology (AREA)
- Molecular Biology (AREA)
- Chemical & Material Sciences (AREA)
- Medical Informatics (AREA)
- Heart & Thoracic Surgery (AREA)
- Animal Behavior & Ethology (AREA)
- Surgery (AREA)
- Public Health (AREA)
- Veterinary Medicine (AREA)
- General Physics & Mathematics (AREA)
- Analytical Chemistry (AREA)
- Hematology (AREA)
- Immunology (AREA)
- Biochemistry (AREA)
- Optics & Photonics (AREA)
- Urology & Nephrology (AREA)
- Medicinal Chemistry (AREA)
- Food Science & Technology (AREA)
- Human Computer Interaction (AREA)
- Signal Processing (AREA)
- Chemical Kinetics & Catalysis (AREA)
- Electrochemistry (AREA)
- Databases & Information Systems (AREA)
- Emergency Medicine (AREA)
- Ecology (AREA)
- Physiology (AREA)
- Computer Vision & Pattern Recognition (AREA)
- Artificial Intelligence (AREA)
- Psychiatry (AREA)
- Measurement Of The Respiration, Hearing Ability, Form, And Blood Characteristics Of Living Organisms (AREA)
- Investigating Or Analysing Biological Materials (AREA)
Abstract
Description
- The invention relates to a sensor assembly, test substance monitoring system, and test substance monitoring method.
- An in-vivo component contained in a specimen such as blood, for example, glucose, is an indicator of diabetes. The in-vivo component must be detected with high accuracy in order to manage the amount of in-vivo component for preventing disease deterioration.
- Japanese Patent Registration No.
4545398 FIG. 24 , themonitoring device 800 described in Japanese Patent Registration No.4545398 detection devices detection devices electrode 811, areference electrode 812, and acounter electrode 813. Glucose is extracted from the subject's skin by onedetection device 801 and the extracted glucose is measured. The signal measurement value obtained by thedetection device 801 includes a signal originating from glucose and a background signal that is not attributable to glucose. Therefore, only the background signal is measured by theother detection device 802 simultaneously with the measurement of glucose by thedetection device 801, and the signal value due to glucose is calculated by subtracting the background signal measurement value acquired by thedetection device 802 from the signal measurement value acquired by thedetection device 801. The amount of glucose is acquired based on the calculated signal measurement value. - However, since the background signal is measured by different detection devices in the
monitoring device 800 described in Japanese Patent Registration No.4545398 detection device 801 and thedetection device 802 due to the individual difference of the detection devices. Therefore, the background signal measurement value obtained by thedetection device 802 may be different from the background signal measurement value that originally should be subtracted from thedetection device 801 in themonitoring device 800 described in Japanese Patent Registration No.4545398 - A sensor assembly according to a first aspect of the present invention includes an electrochemical sensor for measuring a test substance percutaneously extracted from a living body, and a processor for determining the intensity of the background signal at an optional measurement time point of the test substance outside a predetermined time based on the intensity of the background signal measured within the predetermined time by the electrochemical sensor.
- The electrochemical sensor is used for applications in which a test substance is detected by a change in the intensity of an electric signal. A "background signal" is a signal detected regardless of the presence or absence of a test substance, and refers to a signal generated by a sensor assembly without originating from a test substance. A "background signal" also includes a signal attributable to the electrochemical sensor itself. For example, when a hydrogel is used as a collecting member for collecting a test substance and an enzyme sensor is used as an electrochemical sensor, the "background signal" includes a current signal inherent to the electrochemical sensor, a current signal flowing when a component in the hydrogel diffuses on the electrode, a current signal flowing when a component in the hydrogel reacts on the electrode, and a current signal flowing when a component fixed on the electrode reacts. The "predetermined time" may be any time other than the time during which the measurement of the test substance is performed. The "predetermined time" may be, for example, the time just before or immediately after the measurement of the test substance or may be a time when manufacturing the sensor assembly.
- The background signal is usually different for each sensor assembly. In the sensor assembly according to the first aspect of the invention, the electrochemical sensor used for the measurement of the test substance is also used for obtaining the background signal alone, and calculates the intensity of the background signal at the measurement time point of the test substance outside the predetermined time based on the intensity of the background signal at the time of measurement of the test substance within the predetermined time. According to the sensor assembly having such a configuration, therefore, it is possible to determine the intensity of the background signal to be originally subtracted from the intensity of the signal obtained by measuring the test substance since the intensity of the background signal at the time of measurement of the test substance is determined based on the background signal obtained from the electrochemical sensor used for measurement of the test substance. Therefore, it is possible to accurately calculate the amount of the test substance according to the sensor assembly of the first aspect of the present invention.
- The predetermined time may be a period of time from the energizing of the electrochemical sensor to the stabilization of the value measured by the electrochemical sensor. Normally, when an electrochemical sensor is used, after a voltage is applied to the electrochemical sensor, a certain amount of time is required for the current signal flowing in the electrochemical sensor to stabilize and for the value measured by the electrochemical sensor to stabilize after a voltage is applied to the electrochemical sensor. When a test substance is measured using an electrochemical sensor, the measurement value also tends to vary during the period from the application of a voltage to the electrochemical sensor until the measured value by the electrochemical sensor becomes stabilized. However, the present inventors measured the intensity of the background signal during the time from the application of the voltage to the electrochemical sensor until the value measured by the electrochemical sensor became stabilized, and based on the measurement result, it was found that the amount of the test substance can be accurately calculated using this time by determining the intensity of the background signal at the time of measurement.
- The electrochemical sensor is configured to measure a test substance extracted from a living body to a collection member while in a state of contact with a collection member, and the electrochemical sensor also may measure the intensity of the background signal within a predetermined time while in a state of contact with the collection member, the predetermined time being a time before the test substance is extracted to the collecting member after the electrochemical sensor is brought into contact with the collecting member. In this way, the intensity of the background signal to be subtracted as previously described can be more accurately determined since the intensity of the background signal caused by the collection member also can be measured, and the intensity of the background signal at the time of measurement of the test substance can be determined based on this measurement value.
- The processor also may calculate the intensity of the background signal at the time of measurement based on the change over time in the intensity of the background signal measured within a predetermined time. In this way, the intensity of the background signal at the time of measurement of the test substance can be calculated, taking into consideration the temporal fluctuation of the intensity of the background signal.
- The processor preferably calculates the intensity of the background signal at the measurement time point by applying exponential approximation, exponential approximation, linear approximation or a combination thereof to the temporal change of the intensity of the background signal within a predetermined time. The processor also preferably calculates the intensity of the background signal at the measurement time point based on an equation obtained by calculating constants included in the equation by performing power approximation, exponential approximation, linear approximation or performing fitting of combinations thereof with respect to the temporal change of the intensity of the background signal within the predetermined time. The temporal change in the intensity of the background signal is a power function change, an exponential change, a linear change or a combination thereof. Therefore, the calculated value of the intensity of the background signal can be obtained with higher accuracy according to the sensor assembly having such a configuration.
- The processor is configured to obtain a value representing the intensity of the signal attributable to the test substance by subtracting the value of the intensity of the background signal at the measurement time point from the measurement value of the intensity of the unprocessed signal including the signal attributable to the test substance acquired by the electrochemical sensor at the time of measurement of the test substance. "Signal attributable to a test substance" means a signal that varies according to the amount of the test substance. "Unprocessed signal including a signal attributable to a test substance" includes a signal attributable to a test substance and a background signal.
- The electrochemical sensor also may be configured to automatically obtain a value representing the intensity of the signal attributable to the test substance by measuring the intensity of the unprocessed signal including the signal attributable to the test substance and subtracting the intensity of the background signal at the measurement time point when the measurement of the intensity of the background signal and the determination of the intensity of the background signal at the measurement time point are automatically performed in a first measurement performed after the sensor assembly is first activated, and second and subsequent measurements are performed. In this way, the burden on the user can be reduced since the user does not need to manually switch between the background measurement and the measurement of the test substance.
- The processor can obtain a value indicating the amount of the test substance based on the intensity of the signal attributable to the test substance and the in-vivo concentration of a substance correlated with the in-vivo concentration of the test substance. The in-vivo concentration of the substance correlated with the in-vivo concentration of the test substance may be, for example, the blood concentration of the test substance, the concentration of other substances correlated with the test substance in the interstitial fluid, the blood concentration of other substances correlated with the test substance in the blood and the like, but the correlated substance is not particularly limited. The in-vivo concentration of the substance correlated with the in-vivo concentration of the test substance is preferably the blood concentration of the test substance. According to the sensor assembly having such a configuration, it is possible to accurately estimate the amount of the test substance.
- The sensor assembly may be equipped with one electrochemical sensor.
- The sensor assembly further preferably includes a memory for storing the value of the intensity of the background signal at the time of measurement. In this case, the user reduce the time required to prepare for measurement because the intensity of the unprocessed signal including the signal attributable to the test substance can be measured without measuring the intensity of the background signal since the intensity can be measured by using the value of the intensity of the background signal at the measurement time point stored in the memory.
- The electrochemical sensor can measure a test substance at each of a plurality of measurement time points outside the predetermined time. In this case, the processor can determine the intensity of the background signal at each of the plurality of measurement time points based on the intensity of the background signal measured within a predetermined time.
- The electrochemical sensor also may be an enzyme sensor provided with a substrate body, an electrode disposed on the substrate body, and an enzyme immobilized on the surface of the electrode. According to the sensor assembly having such a configuration, it is possible to accurately calculate the amount of a test substance using an enzymatic reaction.
- The test substance also may be glucose. In this case, the enzyme sensor is a glucose sensor including a substrate body, an electrode disposed on the substrate body for detecting hydrogen peroxide, and glucose oxidase immobilized on the surface of the electrode. According to the sensor assembly having such a configuration, the amount of glucose can be calculated with high accuracy.
- A monitoring system according to a second aspect of the invention includes a collection member capable of collecting a test substance contained in interstitial fluid extracted from a living body, and the aforementioned sensor assembly.
- The collection member also may include hydrogel. In this case, the predetermined time may be a time for the diffusion of the substance in the hydrogel to proceed to achieve a state in which the influence on the measurement of the test substance reaches equilibrium. state
- The test substance monitoring method according to a third aspect of the invention is a method of percutaneously extracting and monitoring a test substance from a living body. The test substance monitoring method of the third aspect of the invention includes (A1) a step of bringing a collection member into contact with an electrochemical sensor and measuring the intensity of the background signal within a predetermined time; (A2) a step of determining the intensity of the background signal at an optional measurement time point of the test substance outside the predetermined time based on the intensity of the background signal within the predetermined time; (A3) a step of measuring a test substance extracted into a collection member from a living body by the electrochemical sensor at the measurement time point to obtain a measurement value of the intensity of the unprocessed signal including the signal attributable to the test substance; and (A4) a step of subtracting the value of the intensity of the background signal obtained in the step (A2) from the measured value of the intensity of the unprocessed signal measured in the step (A3) to calculate the intensity of the signal attributable to the test substance. According to the monitoring method of the test substance adopting such an operation, the amount of the test substance can be calculated with high accuracy.
- In step (A1), an electrochemical sensor is brought into contact with a collecting member attached to the living body, and the intensity of the background signal can be measured within a predetermined time from when the electrochemical sensor in contact with the collecting member is energized to when the measured value by the electrochemical sensor stabilizes.
- In step (A1), the intensity of the background signal can be measured within a predetermined time after the electrochemical sensor is brought into contact with the collecting member and before the test substance is collected by the collecting member.
- In step (A2), the intensity of the background signal at each of a plurality of measurement time points of the test substance is determined based on the intensity of the background signal within the predetermined time. In this case, in step (A3), a test substance is measured at each of the plurality of measurement time points, and a measurement value of the intensity of a unprocessed signal including the signal attributable to the test substance is acquired at each measurement time point. In the step (A4), the value of the intensity of the background signal can be subtracted from the measured value of the intensity of the unprocessed signal acquired at each of the plurality of measurement points.
- Disclosed are a novel means capable of accurately calculating the amount of in-vivo component as a test substance, and its uses.
-
-
FIG. 1 is a brief explanatory diagram showing a continuous monitoring system; -
FIG. 2 is a schematic exploded view showing a sensor assembly; -
FIG. 3 is a schematic perspective view showing a sensor assembly; -
FIG. 4 is a block diagram showing a functional configuration of a continuous monitoring system; -
FIG. 5 is a schematic plane view showing a glucose sensor; -
FIG. 6 is a schematic cross sectional view showing a hydrogen peroxide electrode of the glucose sensor; -
FIG. 7 is a schematic cross sectional view showing a collection member; -
FIG. 8 is a flowchart showing a processing procedure by a continuous monitoring system; -
FIG. 9 is a schematic cross sectional view showing skin having micropores formed therein; -
FIG. 10 is a schematic cross sectional view showing a collection member mounted on the skin; -
FIG. 11 is a flowchart showing a processing procedure by a continuous monitoring system; -
FIG. 12 is a graph showing the results of investigating changes over time in blood glucose level in Example 1 -
FIG. 13 is a graph showing a Clarke error grid; -
FIG. 14 is a graph showing a result of evaluating an estimated blood glucose level by error grid analysis in Example 1; -
FIG. 15 is a graph showing a result of investigating the change over time in blood glucose level in Comparative Example 1; -
FIG. 16 is a graph showing a result of evaluating an estimated blood glucose level by error grid analysis in Comparative Example 1; -
FIG. 17 is a graph showing the results of investigating changes over time in blood glucose level in Example 2; -
FIG. 18 is a graph showing a result of evaluating an estimated blood glucose level by error grid analysis in Example 2; -
FIG. 19 is a graph showing a result of investigating the change over time in blood glucose level in Comparative Example 2; -
FIG. 20 is a graph showing a result of evaluating an estimated blood glucose level by error grid analysis in Comparative Example 2; -
FIG. 21 is a graph showing the results of investigating changes over time in blood glucose level in Example 3; -
FIG. 22 is a graph showing a result of evaluating an estimated blood glucose level by error grid analysis in Example 3; -
FIG. 23 is a graph showing a result of measurement of a background current signal and calculation of an estimated background current signal; and -
FIG. 24 is a schematic explanatory view showing a monitoring device described in Japanese Patent Registration No.4545398 - In this specification, the description of numerical ranges by endpoints such as "X to Y" includes all numbers and rational numbers included in each range and endpoints described.
- "Microinvasive interstitial fluid extraction technique" refers to a technique of extracting interstitial fluid from a subject with minimal invasion. In microinvasive interstitial fluid extraction technology, micropores are formed in the skin of the living body by a puncture tool or the like to promote extraction of interstitial fluid. The interstitial fluid extracted from the micropores is collected using a collection member including a gel or the like.
- "In-vivo component" refers to a component contained in a living body, for example, a body fluid extracted from a subject. Examples of in-vivo components include, but are not limited to, glucose, uric acid, lactic acid, galactose and the like. "Test substance" refers to a substance to be detected among in-vivo components. Examples of body fluid include, but are not limited to, interstitial fluid, blood and the like.
- Hereinafter, a continuous monitoring system will be described with reference to the drawings. As shown in
FIG. 1 , thecontinuous monitoring system 10 includes asensor assembly 20, acollection member 40, and a terminal 60. Thecontinuous monitoring system 10 is used by mounting thesensor assembly 20 so as to contact thecollection member 40 installed on the forearm of the subject who has formed micropores.Terminal 60 is used to display the information obtained bysensor assembly 20. For example, a cellular phone terminal, a tablet type computer and the like can be mentioned as the terminal 60, but there is no particular limitation. - As shown in
FIG. 2 , thesensor assembly 20 includes acover 21, an uppermain body 22 incorporating an electric circuit, and a lowermain body 23 for housing theelectrochemical sensor 30. Theupper body 22 includes an electric circuit (not shown), anotch part 22a for attaching thecover 21, ahousing 22b for housing thebattery 25 as a power supply, aswitch 22c for switching on/off of thesensor assembly 20, and aconnection terminal 22d for connecting theelectrochemical sensor 30 to the electric circuit. Thecover 21 is attached to thenotch part 22a so as to cover thehousing 22b in which thebattery 25 is stored. The electric circuit includes a connection terminal to thebattery 25, a processor, a memory and the like. The lowermain body 23 has ahole 23a for aligning the electrode-side surface of theelectrochemical sensor 30 with the micropore-formed area of the subject's forearm. - As shown in
FIG. 3 , theforearm contact surface 23b of thelower body 23 of thesensor assembly 20 is a recess having a curved surface along the curved surface of the forearm so that thesensor assembly 20 can be attached to the forearm. The R value of thecontact surface 23b is normally set to 40 to 50. - Returning to
FIG. 2 , theelectrochemical sensor 30 is connected to the electric circuit via theconnection terminal 22d of the uppermain body 22. Theelectrochemical sensor 30 connected to theconnection terminal 22d also is housed between the uppermain body 22 and the lowermain body 23. At this time, as shown inFIG. 3 , theelectrochemical sensor 30 is housed between the uppermain body 22 and the lowermain body 23 so that the electrodes are positioned on the forearm side. - As shown in
FIG. 4 , thesensor assembly 20 has anelectrochemical sensor 30, acommunication unit 113, and acontrol unit 115. Thesensor assembly 20 is communicably connected to thecommunication unit 121 of the terminal 60 via thecommunication unit 113. - The
electrochemical sensor 30 is disposed so as to be in contact with thecollection member 40. The measurement value of the intensity of the unprocessed signal and the measurement value of the background signal including the signal attributable to the test substance acquired by theelectrochemical sensor 30 are output to thecontrol unit 115. - In the present embodiment, the
communication unit 113 is a wireless communication unit. Note that thecommunication unit 113 also may be a wired communication unit. Since the handling by the user is easy, thecommunication unit 113 is preferably a wireless communication unit. - The
control unit 115 of thesensor assembly 20 includes aprocessor 115a and amemory 115b. - The
processor 115a has the function of acquiring information on measured values of intensities of unprocessed signals and information on measured values of background signals including signals attributable to the test substance output from theelectrochemical sensor 30. Theprocessor 115a stores the information of the measurement value of the intensity of the unprocessed signal including the signal attributable to the acquired test substance and the information of the measurement value of the background signal in thememory 115b as necessary. Theprocessor 115a has a function of executing the calculation of the intensity of the background signal at an arbitrary point in time after elapse of a predetermined time applying a power approximate expression, an exponential approximate expression, a linear approximate expression, or a combination thereof as the estimated expression for the change over time of the intensity of the background signal acquired within a predetermined time by theelectrochemical sensor 30. Theprocessor 115a also stores the information of the calculated value of the intensity of the background signal in thememory 115b as necessary. Furthermore, theprocessor 115a has a function of executing the calculation of the intensity of the signal attributable to the test substance by subtracting the intensity of the background signal at the measurement time point of the intensity of the unprocessed signal including the signal attributable to the test substance from the measured value of the intensity of the unprocessed signal including the signal attributable to the test substance. Theprocessor 115a also stores the information on the intensity of the signal attributable to the test substance in thememory 115b as necessary. Theprocessor 115a also has a function of executing the calculation of the amount of the test substance based on the relationship between the intensity of the signal attributable to the test substance and the in-vivo concentration of a substance correlated with the in-vivo concentration of the test substance. Further, theprocessor 115a stores the information of the amount of the test substance in thememory 115b as necessary. Note that, the start of the predetermined time may be, for example, a point of time when the power supply of thesensor assembly 20 is turned on, a point of several minutes after the point of turning on the power of thesensor assembly 20, a point of time instructed by the user and the like. The end of the predetermined time also includes, for example, the time when the user instructs termination, the time when the background signal becomes lower than a threshold value, a time set in thememory 115b of thesensor assembly 20 set in advance or the like. - The
memory 115b stores information on a power approximate expression, an exponential approximation expression, a linear approximation expression or a combination thereof which is an estimated expression, information on the in-vivo concentration of a substance correlated with the in-vivo concentration of the test substance, information on correction formula and the like. Note that, examples of the in-vivo concentration of the substance correlated with the in vivo concentration of the test substance include, but are not limited to, the blood concentration of the test substance, the concentration in the interstitial fluid of another substance correlated with the test substance, blood concentration of other substances correlated with the test substance and the like. Thememory 115b also may temporarily store information on the measured value of the intensity of the background signal acquired within a predetermined time by theelectrochemical sensor 20, information on the calculated value of the intensity of the background signal at an optional point in time after the lapse of a predetermined time, information on the intensity of a signal attributable to the test substance, information on the amount of a test substance and the like. - Note that the
sensor assembly 20 also may be integrated with thecollection member 40 described later. In this case, measurement of the background signal is performed without setting thesensor assembly 20 on the arm of the subject. - In the following description, examples of an electrochemical sensor are described, including a glucose sensor for use in detection of glucose contained in interstitial fluid extracted from a subject.
- As shown in
FIG. 5 , theelectrochemical sensor 30 includes asubstrate 31, a workingelectrode 32, a counter electrode 33, areference electrode 34, and electrode leads 35, 36, and 37. The workingelectrode 32, the counter electrode 33, thereference electrode 34, and the electrode leads 35, 36, 37 are provided on one surface of thesubstrate 31. - The shape of the
substrate 31 may be a rectangular shape, a polygonal shape, a circular shape, or the like, and is not particularly limited. The material configuring thesubstrate 31 is an insulating material which does not affect the conductivity of at least the workingelectrode 32, the counter electrode 33 and thereference electrode 34. Examples of the material configuring thesubstrate 31 include polyester resins such as polyvinyl alcohol, polyethylene terephthalate, polybutylene terephthalate, polyethylene naphthalate, and polybutylene naphthalate; polyimide; glass epoxy resin; glass; ceramic and the like, but is not particularly limited. The thickness of thesubstrate 31 can be appropriately decided according to the application of the electrochemical sensor and the like. Thesubstrate 31 preferably is sufficiently flexible to be adhered to the skin. - As shown in
FIG. 5 , the workingelectrode 32 is arranged on one side of the surface of thesubstrate 31. The workingelectrode 32 is connected to theelectrode lead 35. Theelectrode lead 35 extends from the workingelectrode 32 toward the other side portion of thesubstrate 31, more specifically, toward the lower side of thesubstrate 31 inFIG. 5 . - As shown in
FIG. 6 , the workingelectrode 32 includes anelectrode layer 131 formed on one surface of thesubstrate 31 and anenzyme layer 132 containing glucose oxidase. Theenzyme layer 132 is provided on the surface of theelectrode layer 131. - The
electrode layer 132 exchanges electrons with hydrogen peroxide attributable to glucose. Theelectrode layer 131 contains a conductive material. A metal material such as platinum, gold and the like can be used as the conductive material used for theelectrode layer 131, but there is no particular limitation. The thickness of theelectrode layer 132 is not particularly limited as long as it is a thickness that maintains conductivity. From the perspective of conductivity, the thickness of theelectrode layer 132 is preferably 0.01 µm or more, more preferably 0.05 µm or more, and from the perspective of manufacturing cost the thickness is preferably 0.5 µm or less, more preferably 0 .3 µm or less. - The
enzyme layer 132 is provided on the surface of theelectrode layer 131. In the embodiment, theenzyme layer 132 includes glucose oxidase. Glucose oxidase is an enzyme that generates hydrogen peroxide using glucose as a substrate. The organism of the source of glucose oxidase is not particularly limited. The amount of glucose oxidase in theenzyme layer 132 is preferably 0.01 U/µL or more, and more preferably 0.1 U/µL or more from the viewpoint of glucose detection sensitivity when converted to the amount of glucose oxidase activity in the solution applied on theelectrode layer 131. From the perspective of cost, the amount of glucose oxidase is preferably 100 U/µL or less, and more preferably 50 U/µL or less. - The working
electrode 32 is brought into contact with body fluid. When glucose is contained in the body fluid, the glucose oxidase existing in theenzyme layer 132 in the workingelectrode 32 oxidizes the glucose, as shown inFIG. 6 . Oxidation of glucose produces hydrogen peroxide and gluconic acid. The generated hydrogen peroxide is electrolyzed on theelectrode layer 131 of the workingelectrode 32. According to theelectrochemical sensor 20, glucose contained in a body fluid can be detected based on a current signal generated by electrolysis of hydrogen peroxide. - Returning to
FIG. 5 , the counter electrode 33 is disposed outside the workingelectrode 32, more specifically, on the surface of thesubstrate 31 on the upper side of the workingelectrode 32 inFIG. 5 . Thecounter electrode 32 is connected to theelectrode lead 36. Theelectrode lead 36 extends from the counter electrode 33 toward the other side portion of thesubstrate 31, more specifically, toward the lower side of thesubstrate 31 inFIG. 5 . The counter electrode 33 includes an electrode layer containing a conductive material. The conductive material may be, for example, metals such as platinum, gold, silver, copper, carbon, palladium, chromium, aluminum, nickel, alloys including at least one of these metals, metal halogens such as chlorides of these metals, carbon materials such as carbon nanotube film, glassher carbon, graphite and the like, semiconductors such as silicon and germanium, and is not particularly limited. The thickness of the electrode layer in the counter electrode 33 can be appropriately determined according to the application of the electrochemical sensor and the like. - In
FIG. 5 , thereference electrode 34 is disposed at a position facing the counter electrode 33 across the workingelectrode 32. Thereference electrode 34 is connected to theelectrode lead 37. Theelectrode lead 37 extends from thereference electrode 34 toward the other side portion of thesubstrate 31, more specifically, toward the lower side of thesubstrate 31 inFIG. 5 . Thereference electrode 34 includes an electrode layer containing a conductive material. The conductive material used for the electrode layer of thereference electrode 34 is the same as the conductive material used for the electrode layer of the counter electrode 33. Specific examples of the reference electrode include a silver-silver chloride electrode and the like, but are not particularly limited. The thickness of the electrode layer in thereference electrode 34 can be appropriately determined according to the application of theelectrochemical sensor 30 and the like. Theelectrochemical sensor 30 also may omit thereference electrode 34. In this case, the counter electrode 33 also may serve as the reference electrode depending on the type of the conductive material used for the counter electrode 33, the thickness of the counter electrode 33 and the like. In the case of measuring a large current, theelectrochemical sensor 30 preferably includes thereference electrode 34 from the perspective of suppressing the influence of the voltage drop and stabilizing the voltage applied to the workingelectrode 32. - Examples of a method of forming the working
electrode 32, the counter electrode 33, and thereference electrode 34 include, for example, a vapor deposition method, a sputtering method, a screen printing method, and the like, but are not particularly limited. The method of forming the workingelectrode 32, the counter electrode 33, and thereference electrode 34 can be appropriately selected according to the type of the conductive material. - The
electrode lead 35, theelectrode lead 36, and theelectrode lead 37 are arranged so as to be parallel to each other at the other side part of thesubstrate 31, more specifically, at the lower side portion of thesubstrate 31 inFIG 5 . - The
electrochemical sensor 30 may be an enzyme sensor other than a glucose sensor, such as a protein sensor, a DNA sensor or the like. In this case, in theelectrochemical sensor 30, instead of glucose oxidase contained in theenzyme layer 132 of the workingelectrode 32, can also use other enzymes, substances specifically binding to the protein of the test substance, or substance specific to the DNA of the test substance. It is possible to detect substances other than glucose according to theelectrochemical sensor 30 of a type other than the glucose sensor. For example, an enzyme that generates hydrogen peroxide by an enzymatic reaction typified by lactate oxidase, galactose oxidase, cholesterol oxidase and the like, an enzyme that generates a substance other than hydrogen peroxide by an enzymatic reaction such as glucose dehydrogenase may be used as the enzyme, but is not particularly limited. When an enzyme that generates a substance other than hydrogen peroxide by an enzymatic reaction is used as the enzyme, platinum, gold, silver, copper, carbon, palladium, chromium, aluminum, nickel or the like can be used as the conductive material of the working electrode, an alloy containing at least one of these metals, a metal halide such as chloride of these metals, a carbon material such as a carbon nanotube film, glassher carbon, graphite, a semiconductor such as silicon, germanium, or the like may be used. Examples of substances that specifically bind to proteins include, but are not limited to, antibodies against proteins, and the like. Examples of substances that specifically bind to DNA include, but are not limited to, complementary strand DNA of the DNA of the test substance, and the like. - The electrode structure of the
electrochemical sensor 30 also may be a three-electrode structure or a two-electrode structure. The three-electrode structure is a three-electrode structure including one workingelectrode 32, one counter electrode 33, and onereference electrode 34 as described above. The two-electrode structure is a two-electrode structure including one working electrode, and an electrode that serves as both a counter electrode and reference electrode. - As shown in
FIG. 7 , thecollection member 40 is a member for collecting interstitial fluid extracted from the skin of the subject by percutaneous sampling. Thecollection member 40 has anextraction medium 41 capable of collecting interstitial fluid and asupport member 42 supporting the extraction medium. Examples of the extraction medium include, but are not limited to, hydrogel, pure water, phosphate buffered saline, tris-buffered physiological saline and the like. A hydrogel is preferable when considering the motion of the subject at the time of percutaneous sampling of the interstitial fluid. The hydrogel only needs to be capable of collecting the test substance in the interstitial fluid or interstitial fluid. Examples of hydrogel materials include, but are not limited to, agarose-based hydrogels; hydrogels based on polyethylene glycol diacrylate; hydrogels based on vinyl acetate containing polyethylene glycol/polyethyleneimine diacrylate and polyethylene glycol-n-vinylpyrrolidone diacrylate and the like. The polymer capable of forming a hydrogel may be either a synthetic polymer or a natural polymer. Examples of synthetic polymers include, but are not limited to, polyvinyl alcohol, polyacrylic acid polymers, cellulose derivatives such as hydroxypropyl cellulose, polymers such as polyethylene glycol, copolymers and block copolymers, and other water-swellable or biocompatible polymers. Examples of natural polymers include, but are not limited to, collagen, hyaluronic acid, gelatin, albumin, polysaccharides, derivatives thereof and the like. The natural polymer may be of a compound type separated from various botanical materials such as psyllium. The hydrogel can also be produced by, for example, the following methods: a) synthesis from a monomer (crosslinking polymerization); b) synthesis from a polymer and a polymerization aid (grafting and crosslinking polymerization); c) synthesis from nonpolymerization aid (crosslinking polymer); d) synthesis from polymer with energy source (crosslinking polymer without auxiliary agent), and e) synthesis from polymer (due to intermolecular bond of reactive polymer crosslinking). - The thickness of the hydrogel preferably is as thin as possible in consideration of the response speed of the
electrochemical sensor 30 to the test substance. The thickness of the hydrogel is preferably 1 to 1000 µm, more preferably 5 to 700 µm, most preferably 10 to 300 µm. The size of the hydrogel may be any size as long as the interstitial fluid extraction region is covered and contact with theelectrochemical sensor 30 can be secured. Note that the hydrogel may contain an enzyme when the test substance is a low molecular weight compound such as glucose, lactic acid or the like. Examples of the enzyme include glucose oxidase, glucose dehydrogenase, lactate oxidase and the like. The method of introducing the enzyme into the hydrogel can be appropriately determined depending on the method of forming the hydrogel. Examples of methods for introducing the enzyme into the hydrogel in the case of preparing a hydrogel by electron beam crosslinking of polyvinyl alcohol include, but are not limited to, a method of adding an enzyme to a polyvinyl solution and performing electron beam crosslinking, and a method in which a functional group is introduced into a polymer constituting the hydrogel and the enzyme is chemically bonded to the functional group, and the like. In this case, the working electrode of theelectrochemical sensor 30 is a working electrode which does not include an enzyme layer and includes an electrode layer. - The
support member 42 has asupport part body 42a having a concave portion and aflange portion 42b formed on the outer peripheral side of thesupport part body 42a. The extraction medium is held in the concave portion of thesupport part body 42a. Anadhesive layer 43 is provided on the surface of theflange portion 42b. In the state before use, arelease paper 44 for sealing theextraction medium 41 held in the concave portion is affixed to theadhesive layer 43. When conducting the measurement, therelease paper 44 is peeled from theadhesive layer 43 to expose theextraction medium 41 and theadhesive layer 43. Thecollection member 40 can be affixed to the skin of the subject by theadhesive layer 43 so that theextraction medium 41 is brought into contact with the skin of the subject. - As shown in
FIG. 4 , the terminal 60 includes acommunication unit 121, acontrol unit 123, and adisplay unit 125. - The terminal 60 is communicably connected to the
communication unit 113 of thesensor assembly 20 via thecommunication unit 121. Thecommunication unit 121 is a wireless communication unit. Note that thecommunication unit 121 also may be a wired communication unit. Since the handling by the user is easy, thecommunication unit 121 is preferably a wireless communication unit. Note that the terminal 60 also may calculate a value indicating the amount of the test substance or the like. - The
control unit 123 includes aprocessor 123a and amemory 123b. - The
processor 123a has the function of obtaining information on the measurement value of the intensity of an unprocessed signal including a signal attributable to the test substance, information on the measurement value of the background signal, information of the calculated value of the intensity of the background signal at an optional time point after a predetermined time has elapsed, information on the intensity of the signal attributable to the test substance, information on the amount of the test substance and the like from the sensor assembly via the communication unit 12. If necessary, theprocessor 123a also stores information on the measured value of the intensity of the unprocessed signal including the signal attributable to the test substance, the information on the measured value of the background signal in the absence of the test substance, information on the calculated value of the intensity of the background signal at an optional time point after a predetermined time has elapsed, information on the intensity of the signal attributable the test substance, information on the amount of the test substance and the like in thememory 123b. Theprocessor 123a also has the function of generating image information for display on thedisplay unit 125 from the information on the measured value of the intensity of the unprocessed signal including the signal attributable to the test substance, the information on the measured value of the background signal in the absence of the test substance, information on the calculated value of the intensity of the background signal at an optional time after a predetermined time has elapsed, information on the intensity of the signal attributable to the test substance, information on the amount of the test substance and the like. Theprocessor 123a has a function of outputting the generated image information to thedisplay unit 125. - The
memory 123b temporarily stores information on the measured value of the intensity of the unprocessed signal including the signal attributable to the test substance, information on the measured value of the background signal in the absence of the test substance, information on the calculated value of the intensity of the background signal at an optional time point after a predetermined time has elapsed, information on the intensity of the signal attributable to the test substance, information on the amount of the test substance and the like. Thememory 123b also may store information on a power approximate expression, an exponential approximate expression, a linear approximation expression or a combination thereof, information on the in-vivo concentration of a substance correlated with the in-vivo concentration of the test substance, information on a correction equation and the like. - The
display unit 125 displays an image based on the image information output from theprocessor 123a. For example, information on the amount of the test substance together with information at an optional point in time after a predetermined time has elapsed are displayed on thedisplay unit 125. - Next, the processing procedure of the test substance continuous monitoring method using the
continuous monitoring system 10 will be described with reference to the drawings.FIG. 8 is a flowchart showing the processing procedure of the test substance continuous monitoring method according to the first embodiment. - Before step S101, the user first applies interstitial fluid derivation promotion processing to the skin of the forearm. Examples of methods for performing the interstitial fluid derivation promotion treatment include, but are not limited to, a method of forming an interstitial fluid extraction region containing micropores in the skin using a puncture tool equipped with a fine needles; a method of treating the skin to form an interstitial fluid extraction region by microinvasive treatment of the skin by a tape, friction, polishing, ultrasonic irradiation. From the perspective of suppressing damage to the skin, it is preferable to use a method of forming an interstitial fluid extraction region using a puncture tool equipped with a microneedle and a method of forming a interstitial fluid extraction region by polishing or ultrasonic waves. In the case of performing ultrasonic irradiation, the frequency of the ultrasonic wave is preferably 10 kHz to 500 kHz, more preferably 20 kHz to 200 kHz, and most preferably 30 to 150 kHz. The case in which interstitial fluid derivation promotion processing is performed by a method of forming an interstitial fluid extraction region using a puncture tool equipped with a microneedle will be described below. As shown in
FIG. 9 , the user uses a puncture needle equipped with a microneedle to form a interstitial fluid extractionregion including micropores 601 in the epidermis of the forearm. Next, the user closes thefine holes 601 in the interstitial fluid extraction region with a tape or the like. The user also adheres thecollection member 40 onto this tape. Next, thesensor assembly 20 is installed on thecollection member 40. - In step S101, the user first activates the
sensor assembly 20. In thesensor assembly 20, theprocessor 115a of thecontrol unit 115 then causes theelectrochemical sensor 30 to measure the background signal B1 for a predetermined time. In step S101, the change over time of the intensity of the background signal for a predetermined time is measured. Examples of methods of measuring the background signal B1 include, but are not particularly limited to, an electrochemical measurement method such as a chronoamperometry method, a cyclic voltammetry method, a chrono-coulometry method and the like. - Measurement of the background signal B1 preferably is performed during the warm-up time of the
electrochemical sensor 30 of thesensor assembly 20. Normally, in the case of performing measurement using an electrochemical sensor, a certain amount of time is required until the current signal flowing in the electrochemical sensor is stabilized and the measured value is stabilized after energization. Therefore, the electrochemical sensor is energized without actual measurement during the period from when the electrochemical sensor is energized until the current signal flowing into the electrochemical sensor is stabilized. However, the inventors of the present invention discovered can effectively utilize the warming-up time of theelectrochemical sensor 30 can be effectively utilized and the amount of the test substance can be accurately calculated by measuring the background signal B1 at the warming-up time of theelectrochemical sensor 30. Note that the "warming-up time" is the time from the application of the voltage to the electrochemical sensor until the measured value becomes steady. The measurement time of the change over time of the intensity of the background signal B1 is preferably 20 minutes or more, and more preferably 30 minutes or more from the perspective of obtaining a calculated value of the intensity of the background signal with high accuracy. The measurement time of the change over time of the intensity of the background signal B 1 preferably is 90 minutes or less, and more preferably 60 minutes or less from the perspective of preventing a reduction in the quality of life of the subject. In step S101, theprocessor 115a acquires information on the intensity of the background signal B1 measured by theelectrochemical sensor 30. Subsequently, theprocessor 115a stores the information on the acquired intensity of the background signal B1 in thememory 115b. - The background signal B1 can be measured by applying a voltage to the
electrochemical sensor 30 in a state in which thecollection member 40 that does not include the test substance is attached to theelectrochemical sensor 30. - Next, in step S102, the
control unit 115 of thesensor assembly 20 calculates the estimated background signal Bt which is the background signal at the time of measurement of the test substance. In step S102, theprocessor 115a of thecontrol unit 115 first obtains from thememory 115b information on the intensity of the background signal B1 and information on the power approximate expression, the exponential approximation formula, the linear approximation formula, or a combination thereof. Next, theprocessor 115a performs the best adaptation to the change over time of the intensity of the background signal B1 for a predetermined time from the power approximate expression, the exponential approximation expression, the linear approximation expression or combinations thereof which are estimation formulae. - The following expression is an example of the estimation equation, but is not particularly limited. (1) y = AxB (where A and B are constants, y is a calculated value of the background signal and x is the measurement time), (2) y = AxB, (3) y = AxB + Cx + D (where A, B and C are constants, y is the calculated value of the background signal and x is the measurement time), (4) y = AeBx (where A and B are constant, y is the calculated value of the background signal and x is the measurement time), (5) y = AeBx + C (where A, B and C are constants, y is the calculated value of the bu cloud signal, (6) y = AeBx + Cx + D where A, B, C and D are constants, y is a background signal, X is the measurement time).
- The
processor 115a causes the estimation equation to fit with respect to the temporal change of the intensity of the background signal and obtains a constant in the estimation equation. Thereafter, theprocessor 115a calculates the estimated background signal Bt in the measurement time of the test substance according to the estimation formula. Theprocessor 115a stores the information on the calculated estimated background signal Bt in thememory 115b. - In step S103, the
processor 115a of thecontrol unit 115 then causes theelectrochemical sensor 30 to measure the unprocessed signal At including the signal attributable to the test substance. In step S103, the user first removes the tape between thecollection member 40 and the interstitial fluid extraction area including themicrohole 601 of the forearm. Specifically, the user removes thesensor assembly 20, thecollection member 40 and the tape from the forearm. As shown inFIG. 10 , the user then adheres thecollection member 40 to the tissue extracting area so that the extraction medium and the interstitial fluid extraction area including themicrohole 601 of the forearm are in contact with each other. Next, the user mounts thesensor assembly 20 on thecollection member 40. Subsequently, in step S103, theprocessor 115a causes theelectrochemical sensor 30 to measure the unprocessed signal At including the signal attributable to the test substance. Examples of a method for measuring the untreated signal At including a signal attributable to the test substance include, but are not limited to, an electrochemical measurement method such as a chronoamperometry method, a cyclic voltammetry method, a chrono-coulometry method and the like. In step S103, theprocessor 115a acquires information on the intensity of the unprocessed signal At including the signal attributable to the test substance measured by theelectrochemical sensor 30. Thereafter, theprocessor 115a stores the information of the unprocessed signal At including the signal derived from the acquired test substance in thememory 115b. - Next, in step S104, the
processor 115a of thecontrol unit 115 calculates the signal Ct attributable to the test substance. In step S104, theprocessor 115a of thecontrol unit 115 first acquires from thememory 115b the information of the unprocessed signal At including the signal attributable to the test substance, and the information of the intensity of the estimated background signal Bt. Next, theprocessor 115a subtracts the value of the intensity of the estimated background signal Bt from the measured value of the intensity of the unprocessed signal At including the signal attributable to the test substance. As a result, theprocessor 115a calculates the signal Ct attributable to the test substance. Theprocessor 115a stores the information of the signal Ct attributable to the calculated test substance in thememory 115b. - It should be noted that the calculation of the signal Ct caused by the test substance in step S104 also may be executed by the terminal 60 instead of being executed by the
processor 115a of the sensor assembly. In this case, before step S104, theprocessor 115a outputs the information of the unprocessed signal At including the signal attributable to the test substance, and the information of the intensity of the estimated background signal Bt to the terminal 60. - Next, in step S105, the
processor 115a executes the correction of the signal Ct attributable to the test substance. In step S105, theprocessor 115a first acquires the information on the signal Ct attributable to the test substance, and information on the in-vivo concentration of the substance correlated with the in-vivo concentration of the test substance from thememory 115b. Next, theprocessor 115a uses the in-vivo concentration of the substance correlated with the in-vivo concentration of the test substance, the correction formula and the like, so that the signal Ct attributable to the test substance is converted to a value Dt indicating the amount of the test substance. - The in-vivo concentration of the substance correlated with the in-vivo concentration of the test substance may be, for example, the blood concentration of the test substance, the concentration of other substances correlated with the test substance in the interstitial fluid, the blood concentration of other substances correlated with the test substance in the blood and the like, but the correlated substance is not particularly limited. From the perspective of improving accuracy, the in-vivo concentration of the substance correlated with the in-vivo concentration of the test substance preferably is the blood concentration of the test substance. The blood concentration of the test substance can be measured by, for example, a self-administered blood glucose measuring device or the like. When the blood concentration of the test substance is used as the in-vivo concentration of the substance correlated with the in-vivo concentration of the test substance, the blood concentration of the test substance is preferably measured within the measurement time of the background signal B1 from the viewpoint of more accurately estimating the amount of the test substance.
- The correction formula is not particularly limited insofar as the concentration of the test substance can be obtained. In step S105, for example, the blood concentration of the test substance used for correction is a "value obtained by subtracting the estimated background current value (corresponds to the intensity of the estimated background signal Bt) from the measured value of the unprocessed current signal a1 including the current value attributable to the test substance (corresponds to the intensity of the unprocessed signal At including the signal attributable to the test substance), that is it can be regarded as equal to the current value attributable to the test substance. In this case, a determination is first made regarding the ratio (= the blood concentration of the test substance / the measured value of the current signal) for converting the measurement value of the unprocessed current signal a1 including the current signal attributable to the test substance into the blood concentration of the test substance. Next, the
processor 115a calculates the amount of the test substance from the current value attributable to the test substance. In step S105, for example, the amount of the test substance may be calculated using the variable amount of the current value taking into consideration the shrinkage of the micropores in the skin and the deterioration over time of the electrochemical sensor and the like as a correction formula, that is:
processor 115a stores the information of the value Dt indicating the amount of the test substance in thememory 115b. - Thereafter, in step S106, the
processor 115a outputs the information of the value Dt indicating the amount of the test substance stored in the memory in step S105 to the terminal 60. - In the test substance continuous monitoring method of the first aspect, after applying the interstitial fluid derivation promotion process to the forearm skin, the measurement of the background signal B1 by the
sensor assembly 20, the calculation of the estimated background signal Bt, and the measurement of the unprocessed signal At including the signal attributable to the test substance are performed. On the other hand, the interstitial fluid derivation promotion process also may be performed after measurement of the background signal B1 by thesensor assembly 20 and calculation of the estimated background signal Bt. In this case, the measurement of the background signal B1 can be performed by bringing thesensor assembly 20 and thecollection member 40 into contact without placing thesensor assembly 20 and thecollection member 40 on the forearm. - In the test substance continuous monitoring method according to the first aspect, a background signal at the time of measurement of an unprocessed signal including a signal attributable to a test substance is determined based on a background signal at a point within a predetermined time. For example, the background signal at the time the background signal is stabilized may be subtracted from the unprocessed signal including the signal attributable to the test substance. Also, the timing of the measurement of the background signal need not be before the measurement of the unprocessed signal including the signal attributable to the test substance, and may be after the measurement of the unprocessed signal including the signal attributable to the test substance.
- In the test substance continuous monitoring method of the first aspect, the measurement of the background signal B1 and the calculation of the estimated background signal Bt are carried out when carrying out the test substance continuous monitoring method. On the other hand, the measurement of the background signal B1 and the calculation of the estimated background signal Bt may be performed in advance in the manufacturing process of the continuous monitoring system 10 (continuous monitoring method of the second aspect). In this case, information of the estimation expression and information of the estimated background signal Bt can be stored in the
memory 115a of thecontrol unit 115 of thesensor assembly 20 in advance. In this case, the user also can immediately perform the measurement of the test substance using thecontinuous monitoring system 10. Hereinafter, the continuous monitoring method of the second aspect will be described. - In step S201 of the continuous monitoring method according to the second aspect, the
processor 115a of thecontrol unit 115 of thesensor assembly 20 causes theelectrochemical sensor 30 to measure the unprocessed signal At including the signal attributable to the test substance. Step S201 is the same as step S 103 in the continuous monitoring method of the first aspect. - Next, in step S202, the
processor 115a executes a call of the estimated background signal Bt stored in thememory 115a and acquires these pieces of information. - Thereafter, in steps S203 to S205, the
processor 115a executes the calculation of the signal Ct attributable to the test substance, the correction of the signal Ct attributable to the test substance, and the output of the value Dt representing the test substance. Steps S203 to S205 are the same as steps S 104 toS 106 in the continuous monitoring method of the first aspect. -
- PEN: polyethylene naphthalate
- PBS: phosphate buffered saline
- PVA: polyvinyl alcohol
- In the following, according to Example 1 and Comparative Example 1, the influence of the presence or absence of calculation of the estimated background current value at an optional time point after a predetermined time has elapsed from the start of the measurement of the background current signal, and the presence or absence of using the estimated background current value were examined.
- A working electrode (diameter: 9 mm) configured by a platinum thin film and a counter electrode configured by a platinum thin film were formed on one surface of a PEN film by vapor deposition. In addition, a silver/silver chloride ink was applied to the surface of the PEN film on the working electrode and the counter electrode side and dried to form a reference electrode made of silver/silver chloride. An electrode substrate was obtained in this way.
- 12.7 µL of an enzyme solution [PBS solution containing 0.25% by mass glutaraldehyde, 42.984 mg/dL bovine serum albumin, 1.5225 U/mL glucose oxidase, and 0.5 U/mL mutarotase] was dripped on the working electrode of the electrode substrate obtained in Example 1. Next, the electrode substrate was allowed to stand in an environment kept at 25°C at a relative humidity of 30% to dry the enzyme solution. In this way an enzyme layer was formed on the working electrode to obtain a glucose sensor.
- A hydrogel (lateral: 20 mm, longitudinal: 20 mm, thickness: 0.2 mm) of PVA was obtained by irradiating PVA aqueous solution A (composition: 12% (w/w) PVA, 2% (w/w) potassium chloride, and 86% (w/w) water) with an electron beam having a dose of 25 kGr.
- The human forearm of healthy subjects was disinfected with ethanol. Using a puncture tool equipped with a fine needle (manufactured by SYSMEX CORPORATION), an interstitial fluid extraction region with a diameter of 8 mm containing fine pores was formed on the forearm.
- A mending tape (manufactured by 3M Co., Ltd.) was adhered on the interstitial fluid extraction region formed in Example 1 (4) to suppress exudation of interstitial fluid from micropores in the interstitial fluid extraction region.
- The hydrogel obtained in Example 1 (3) was further attached to a mending tape (manufactured by 3M Co., Ltd.) attached to the interstitial fluid extraction region in Example 1 (5). Subsequently, a glucose sensor was attached to the hydrogel on the interstitial fluid extraction region so that the working electrode, the reference electrode and the counter electrode of the glucose sensor respectively came into contact with the hydrogel on the interstitial fluid extraction region. In this way the glucose sensor was attached to the forearm. A mending tape (manufactured by 3M Co., Ltd.), a hydrogel and a glucose sensor are superimposed in this order on the interstitial fluid extraction region where micropores were formed in the human forearm.
- In Example 1 (6), the glucose sensor attached to the forearm was connected to a potentiostat (trade name: ALS832b, manufactured by BAS, Inc.). Using a reference electrode as a reference, a voltage of 0.45 V was applied to the working electrode of the glucose sensor. A background current signal flowing between the working electrode and the counter electrode was measured for 2690 seconds.
- After measuring the background current signal in Example 1 (7), the glucose sensor, hydrogel, and mending tape (manufactured by 3M Co., Ltd.) were removed from the interstitial fluid extraction region of the forearm. Immediately thereafter, a hydrogel was applied on the interstitial fluid extraction area so as to cover the interstitial fluid extraction area of the forearm. Next, the glucose sensor was adhered to the hydrogel on the interstitial fluid extraction area so that the center position of the interstitial fluid extraction area aligned with the center position of the working electrode of the glucose sensor while the working electrode, the reference electrode, and the counter electrode of the glucose sensor were in contact with the hydrogel on the interstitial fluid extraction area. In this way the glucose sensor was attached to the forearm. Simultaneously with the mounting of the glucose sensor, the glucose sensor started the measurement of the unprocessed current signal a1 including a current signal attributable to the glucose test substance in the hydrogel. Measurement of the current signal by the glucose sensor was performed at two-second intervals. In this way a measured value (hereinafter also referred to as "current measured value A1") of the unprocessed current signal a1 including a current signal attributable to glucose was obtained. Note that in the following description the current measurement value A1 at the measurement time point of the elapsed time t from the start of the measurement of the unprocessed current signal including the current signal attributable to glucose is also referred to as "current measurement value A1t".
- A blood glucose self-administered measurement device (trade name: Freestyle, manufactured by Nipro Co., Ltd.) was used at the time of 3600 seconds and 23700 seconds from the start of the measurement of the unprocessed current signal including the current signal attributable to glucose in Example 1 (8) to measure the blood glucose level of the blood obtained by puncturing the fingertip (hereinafter also referred to as "calibration blood glucose level G3600" and "calibration blood glucose level G23700"). Using the current value at 3600 seconds after the start of measurement and the current value at 23700 seconds elapsed, the formula (Ia) was obtained.

- In the formula (Ia), t represents the elapsed time from the start of the measurement of the unprocessed current signal including the current signal attributable to glucose.
- This formula was used to obtain the estimated blood glucose level from the current measurement value A1t obtained in Example 1 (8).
- Blood glucose levels were measured at intervals of 900 to 1800 seconds using a blood glucose self-administered measurement device from 4500 seconds after the start of measurement of an unprocessed current signal including a current signal attributable to glucose in Example 1 (8). Note that the blood glucose level at the measurement time point t from the start of the measurement of the unprocessed current signal including the current signal attributable to glucose is also referred to as "measured blood glucose level Gt". The measured blood glucose level Gt was used for comparison with the estimated blood glucose level and was used as the reference blood glucose level.
- An approximation curve was obtained by performing power approximation on the background current value obtained in Example 1 (7). Based on the obtained approximation curve, the formula (IIa) was used as a calculation formula of the background current value at the measurement time point of elapsed time t from the start of measurement of the unprocessed current signal attributable to glucose in Example 1 (8) (hereinafter referred to as "estimated back Ground current value Bt "), that is, formula (IIa):

- (wherein, in the formula (IIa), t represents the elapsed time from the start of the measurement of the unprocessed current signal including the current signal attributable to glucose) was obtained. Based on the formula (IIa), an estimated background current value Bt was obtained.
- The current value Ct attributable to the test substance was calculated using the current measurement value A1t obtained in Example 1 (8) and the estimated background current value Bt at the measurement time point corresponding to the current measurement value A1t, and based on the formula (III).

- The measurement time point of the current signal in Example 1 (8) was divided at intervals of 5 minutes, and the average value of the current value Ct attributable to the test substance obtained within one delimited period (5 minutes) was calculated.
- In order to eliminate the temporal deviation until the blood glucose level of the blood is reflected in the blood glucose value estimated from the amount of glucose in the interstitial fluid, a time correction of 152 seconds was performed on the average value of the current value Ct attributable to the test substance. Next, the estimated blood glucose level Dt was calculated based on the formula (IVa).

- Note that in the formula (IVa) the average blood glucose level is the average value of the calibration blood glucose level G3600 and the calibration blood glucose level G23700, where t is the elapsed time from the start of measurement of the background current signal, and i represents the current value Ct attributable to the test substance, and [- 0.002 × t + 87.689] corresponds to the straight line represented by the formula (Ia).
- Thereafter, the changes over time in the estimated blood glucose level and the measured blood glucose level were examined.
FIG. 12 shows the result of examining the change over time in blood glucose level in Example 1. In the drawing, open circles indicate change over time in the estimated blood glucose level, and crosses show change over time in the measured blood glucose level. Next, inFIG. 12 , the accuracy of the estimated blood glucose level was evaluated by error grid analysis using the estimated blood glucose level and the measured blood glucose level at the same time point. - Note that in the error grid analysis the accuracy of the estimated blood glucose level is classified into the areas A to E shown in
FIG. 13 and evaluated by comparing the estimated blood glucose level and the reference blood glucose level which is the measured blood glucose level. InFIG. 13 , the significance of each region is as follows. -
- Region A: Clinically accurate, leads to correct medical judgment. That is, region A has clinical accuracy.
- Region B: leads to benign judgment or treatment unnecessary. That is, although it is inferior to A, the accuracy has no clinical problem.
- Region C: Over-corrects normal blood glucose level. That is, there is a risk of performing unnecessary treatment.
- Region D: Hyperglycemic value or a hypoglycemic value may be overlooked.
- Region E: Leads to incorrect and dangerous treatment decisions.
- Therefore, the accuracy of the estimated blood glucose level is usually judged to have a precision with no practical problem if the plot of the estimated blood glucose level falls within the areas A and B in the error grid analysis.
- The result of evaluating the estimated blood glucose level by error grid analysis in Example 1 is shown in
FIG. 14 . InFIG. 14 , A indicates the area A in the error grid analysis. - As shown in
FIG. 23 , the background current signal measured in Example 1 (7) shows the change over time of the curve L1a represented by y = 625.3 × t-0.399. The estimated background current value calculated in Example 1 (10) also shows the change over time of the curve L1b represented by y = 625.3 × t-0.399 even after the measurement time of the background current signal obtained in Example 1 (7). Accordingly, it can be understood that the intensity of the background signal at the time of measurement of the unprocessed current signal including the current signal attributable to glucose can be calculated by fitting the equation of power approximation, exponential approximation, linear approximation, or a combination thereof to the change over time of the measured background current value. - From the results shown in
FIG. 14 , it was found that all the 14 plots of the estimated blood glucose level obtained in Example 1 were within the area A. When calculating the variation of the estimated blood glucose level relative to the reference blood glucose level (mean absolute relative difference (hereinafter referred to as "MARD"), the MARD was 6.2%. These results suggested that an highly accurate estimated blood glucose level can be obtained by using the estimated background current value calculated using the background current value measured by the glucose sensor used for glucose measurement. - In Comparative Example 1, the estimated blood glucose level Dt was calculated without measuring the background current value, calculating the estimated background current value, nor calculating the current value Ct attributable to the test substance.
- The measurement time point of the current signal in Example 1 (8) was divided at intervals of 5 minutes, and the average value was calculated for the current measurement value A1t obtained in Example 1 (8) within one delimited period (5 minutes). In addition, the same operation as in Example 1 (9) was performed to obtain the calibration blood glucose level G3600, the calibration blood glucose level G23700, and the measured blood glucose level Gt. The formula (Ib) was obtained using the current value at 3600 seconds after the start of measurement and the current value at 23700 seconds elapsed.

- Note that in the formula (Ib) t represents the elapsed time from the start of the measurement of the unprocessed current signal including the current signal attributable to glucose.
- A time correction of 152 seconds was performed on the average value of the current measurement value A1t. Next, the estimated blood glucose level Dt was calculated based on the formula (IVb).

- Note that in the formula (IVb) the average blood glucose level is the average value of the calibration blood glucose level G3600 and the calibration blood glucose level G23700, where t is the elapsed time from the start of measurement of the unprocessed current signal including the current signal attributable to glucose, and i represents the current value Ct attributable to the test substance, and [- 0.0026 × t + 113.42] corresponds to the straight line represented by the formula (Ib).
- Thereafter, the changes over time in the estimated blood glucose level and the measured blood glucose level were examined.
FIG. 15 shows the result of examining the change over time in blood glucose level in Comparative Example 1. In the drawing, open circles indicate change over time in the estimated blood glucose level, and crosses show change over time in the measured blood glucose level. Next, inFIG. 15 , the accuracy of the estimated blood glucose level was evaluated by error grid analysis using the estimated blood glucose level and the measured blood glucose level at the same time point. The result of evaluating the estimated blood glucose level by error grid analysis in Comparative Example 1 is shown inFIG. 16 . InFIG. 16 , A indicates the area A in the error grid analysis. - From the results shown in
FIG. 16 , it was found that all the 13 plots of the estimated blood glucose level obtained in Comparative Example 1 were within the area A. The MARD also was 17.7%. In Example 1 and Comparative Example 1, the point that the estimated background current value was not calculated at an optional time after a predetermined time had elapsed from the start of the measurement of the background current signal, and the point that the estimated background current value was not used are different. These results suggested that an estimated blood glucose level with high accuracy can be obtained according to the method of Example 1, since the estimated background current value was calculated at an optional time after a predetermined time had elapsed from the start of the measurement of the background current signal, and the estimated background current value was used. - Below, the influence on the accuracy of the estimated blood glucose level was examined according to whether or not the estimated background current value was used and whether or not the estimated background current level was calculated at an optional time point after a predetermined time had elapsed after the start of measurement of the background current signal when the timing of the measurement of the calibration blood glucose level and the measured blood glucose level was changed according to Example 2 and comparative Example 2.
- The same operation as in Example 1 (1) was carried out to obtain an electrode substrate.
- The same operation as in Example 1 (2) was carried out to obtain a glucose sensor.
- The same operation as in Example 1 (3) was carried out to obtain a PVA hydrogel.
- The same operation as in Example 1 (4) was carried out to form the interstitial fluid extraction area.
- The same operation as in Example 1 (5) was carried out to suppress exudation of interstitial fluid from micropores in the interstitial fluid extraction area.
- The same operation as in Example 1 (6) was carried out, and application of a hydrogel and attachment of a glucose sensor were accomplished.
- A background current signal was measured in the same manner as in Example 1 (7) except that a small potentiostat (manufactured by Fuso Manufacturing Co., Ltd.) was used.
- The same operation as in Example 1 (8) was carried out to obtain current measurement value A1t.
- The same operation as in Example 1 (9) was performed to obtain a calibration blood glucose level G2700 and a calibration blood glucose level G29100 except that measurement of the calibration blood glucose level was made at the time of 2700 seconds elapsed and at the time of 29100 seconds elapsed from the start of measurement of the unprocessed current signal including the current signal attributable to glucose in Example 2 (8).
- The same operation as in Example 1 (9) was carried out to obtain a measured blood glucose level Gt except that the blood glucose level was measured using a self-administered glucose measurement device at 900 to 1800 second intervals after 3600 seconds had elapsed after the start of the measurement of the unprocessed current signal including the current signal attributable to glucose in Example 2 (8).
- An approximation curve was obtained by performing power approximation on the background current value obtained in Example 2 (7). Based on the obtained approximate curve, formula (IIb) was obtained as an equation for calculating the estimated background current value Bt.

- Note that in the formula (Ia) t represents the elapsed time from the start of the measurement of the unprocessed current signal including the current signal attributable to glucose.
- Based on the formula (IIb), an estimated background current value Bt was obtained.
- The current value Ct attributable to the test substance was calculated using the current measurement value A1t obtained in Example 1 (8), and the estimated background current value Bt at the measurement time point corresponding to the current measurement value A1t, and based on the formula (III). The measurement time point of the current signal in Example 1 (8) was divided at intervals of 5 minutes, and the average value of the current value Ct attributable to the test substance obtained within one delimited period (5 minutes) was calculated.
- A time correction of 454 seconds was performed on the average value of the current value Ct attributable to the test substance. Next, the estimated blood glucose level Dt was calculated based on the formula (IVc).

- Note that in the formula (IVc) the average blood glucose level is the average value of the calibration blood glucose level G2700 and the calibration blood glucose level G29100, where t is the elapsed time since the measurement start of the unprocessed current signal including the current signal attributable to glucose, i represents the current value Ct attributable to the test substance, and [150.151 × exp (- 0.0027 × t) - 0.00143 × t + 138. 806] corresponds to the attenuation curve calculated from the variation of the current measurement value A1 since, even if the blood glucose level is constant, it is assumed that the current measurement value A1 attenuates with the passage of time due to the influence such as shrinkage of the micropore and degradation over time of the electrochemical sensor.
- Thereafter, the changes over time in the estimated blood glucose level and the measured blood glucose level were examined.
FIG. 17 shows the result of examining the change over time in blood glucose level in Example 2. In the drawing, open circles indicate change over time in the estimated blood glucose level, and crosses show change over time in the measured blood glucose level. Next, inFIG. 17 , the accuracy of the estimated blood glucose level was evaluated by error grid analysis using the estimated blood glucose level and the measured blood glucose level at the same time point. The result of evaluating the estimated blood glucose level by error grid analysis in Example 2 is shown inFIG. 18 . InFIG. 18 , A indicates the area A in the error grid analysis. - From the results shown in
FIG. 18 , it was found that all the 19 plots of the estimated blood glucose level obtained in Example 2 were within the area A. The MARD also was 6.7%. These results suggested that a highly accurate estimated blood glucose level can be obtained using the estimated background current value calculated using the background current value measured with the glucose sensor used for the measurement of glucose even when the measurement timing of the calibration blood glucose level and the measured blood glucose level Gt is changed. - The same operation as in Comparative Example 1 was carried out to calculate the estimated blood glucose level Dt except that the measured current value A1t obtained in Example 2 (8) was used, the measurement time of the calibration blood glucose level was at the time of 2700 seconds elapsed and 29100 seconds elapsed from the start of measurement of the unprocessed current signal including the current signal attributable to glucose, and the measurement of the measured blood glucose level Gt was performed at intervals of 900 to 1800 seconds after 3600 seconds had elapsed from the start of the measurement of the unprocessed current signal including the current signal attributable to glucose. Note that in Comparative Example 2 the formula for calculating the estimated blood glucose level Dt was the formula represented by the formula (IVd).

- Note that in the formula (IVd) the average blood glucose level is the average value of the calibration blood glucose level G2700 and the calibration blood glucose level G29100, where t is the elapsed time since the measurement start of the unprocessed current signal including the current signal attributable to glucose, i represents the current measurement value A1 at a measurement time point of elapsed time t after the measurement start of the unprocessed current signal including the current signal attributable to glucose, and [186.5161 × exp (- 0.002 × t) - 0.00093 × t + 150] corresponds to the attenuation curve calculated from the variation of the current measurement value since, even if the blood glucose level is constant, it is assumed that the current measurement value A1 attenuates with the passage of time due to the influence such as shrinkage of the micropore and degradation over time of the electrochemical sensor.
- Thereafter, the changes over time in the estimated blood glucose level and the measured blood glucose level were examined.
FIG. 19 shows the result of examining the change over time in blood glucose level in Comparative Example 2. In the drawing, open circles indicate change over time in the estimated blood glucose level, and crosses show change over time in the measured blood glucose level. Next, inFIG. 19 , the accuracy of the estimated blood glucose level was evaluated by error grid analysis using the estimated blood glucose level and the measured blood glucose level at the same time point. The result of evaluating the estimated blood glucose level by error grid analysis in Comparative Example 2 is shown inFIG. 20 . InFIG. 20 , A indicates the area A in the error grid analysis. - From the results shown in
FIG. 20 , it was found that 17 of points the 19 plots of the estimated blood glucose level obtained in Comparative Example 2 were within the area A. The MARD also was 8.1 %. In Example 2 and Comparative Example 2, the point that the estimated background current value was not calculated at an optional time after a predetermined time had elapsed from the start of the measurement of the background current signal, and the point that the estimated background current value was not used are different. These results suggested that a highly accurate estimated blood glucose level can be obtained according to the method of Example 2, since the estimated background current value was calculated at an optional time after a predetermined time had elapsed from the start of the measurement of the background current signal, and the estimated background current value was used. - In the following, the influence timing of the measurement of the background current signal on the accuracy of the estimated blood glucose level was examined when the timing of measuring the background current signal is changed from immediately before the measurement of the current signal due to glucose to one month before the measurement of the current signal due to glucose.
- The same operation as in Example 1 (1) was carried out to obtain an electrode substrate.
- The same operation as in Example 1 (2) was carried out to obtain a glucose sensor.
- The same operation as in Example 1 (3) was carried out to obtain a PVA hydrogel.
- The working electrode, the reference electrode and the counter electrode of the glucose sensor obtained in Example 3 (2) were brought into contact with the hydrogel obtained in Example 3 (3), respectively. Next, the glucose sensor was connected to a potentiostat (trade name: ALS 832 b, manufactured by BAS, Inc.). Using a reference electrode as a reference, a voltage of 0.45 V was applied to the working electrode of the glucose sensor. A background current signal flowing between the working electrode and the counter electrode was measured for 1428 seconds. Note that, during the measurement of the background current signal, drying of the hydrogel was suppressed by dripping PBS onto the hydrogel.
- An approximation curve was obtained by performing power approximation on the background current value obtained in Example 3 (4). Based on the obtained approximate curve, formula (IIc) was obtained as an equation for calculating the estimated background current value Bt.

- Note that in the formula (IIc) t represents the elapsed time from the start of the measurement of the unprocessed current signal including the current signal attributable to glucose.
- Based on the formula (IIc), an estimated background current value Bt was obtained.
- The same operation as in Example 1 (4) was carried out to form the interstitial fluid extraction area.
- One month after measurement of the background current signal, the same operation as in Example 1 (5) was performed to suppress exudation of interstitial fluid from micropores in the interstitial fluid extraction region.
- The hydrogel obtained in Example 3 (3) was adhered on the interstitial fluid extraction region so as to cover the interstitial fluid extraction region of the human forearm. Next, the glucose sensor was adhered to the hydrogel on the interstitial fluid extraction area so that the center position of the interstitial fluid extraction area aligned with the center position of the working electrode of the glucose sensor while the working electrode, the reference electrode, and the counter electrode of the glucose sensor obtained in Example 3 (2) were in contact with the hydrogel on the interstitial fluid extraction area. In this way the glucose sensor was attached to the forearm. Simultaneously with the mounting of the glucose sensor, measurement of the unprocessed current signal including the current signal attributable to the glucose was started by the glucose sensor. Measurement of the current signal by the glucose sensor was performed at two-second intervals. In this way current measurement value A1 was obtained.
- The blood glucose level of the blood was measured at the time of 3600 seconds elapsed and 23700 seconds elapsed from the start of the measurement of the unprocessed current signal including the current signal attributable to glucose in Example 3 (8), and the calibration blood glucose level G3600 and the calibration blood glucose level G23700 were obtained. The formula (Ic) was obtained using the current value at 3600 seconds elapsed and the current value at 23700 seconds elapsed from the start of measurement, the formula.

- Note that in the formula (Ic) t represents the elapsed time from the start of the measurement of the unprocessed current signal including the current signal attributable to glucose.
- The obtained formula (Ic) was used to obtain the estimated blood glucose level from the current measurement value A1t obtained in Example 3 (8).
- Blood glucose levels were measured at intervals of 900 to 1800 seconds using a blood glucose self-administered measurement device from 4500 seconds elapsed after the start of measurement of an unprocessed current signal including a current signal attributable to glucose in Example 3 (8) to obtain the measured blood glucose level Gt.
- The current value Ct attributable to the test substance was calculated using the current measurement value A1t obtained in Example 3 (8) and the estimated background current value Bt at the measurement time point corresponding to the current measurement value A1t, and based on the formula (III). The measurement time point of the current signal in Example 3 (8) was divided at intervals of 5 minutes, and the average value of the current value Ct attributable to the test substance obtained within one delimited period (5 minutes) was calculated.
- In order to eliminate the temporal deviation until the blood glucose level of the blood is reflected in the blood glucose value estimated from the amount of glucose in the interstitial fluid, a time correction of 152 seconds was performed on the average value of the current value Ct attributable to the test substance. Next, the estimated blood glucose level Dt was calculated based on the formula (IVd).

- Note that in the formula (IVd) the average blood glucose level is the average value of the calibration blood glucose level G3600 and the calibration blood glucose level G23700, where t is the elapsed time from the start of measurement of the unprocessed current signal including the current signal attributable to glucose, and i represents the current value Ct attributable to the test substance, and [- 0.0021 × t + 94.661] corresponds to the straight line represented by the formula (Ic).
- Thereafter, the changes over time in the estimated blood glucose level and the measured blood glucose level were examined.
FIG. 21 shows the result of examining the change over time in blood glucose level in Example 3. In the drawing, open circles indicate change over time in the estimated blood glucose level, and crosses show change over time in the measured blood glucose level. Next, inFIG. 21 , the accuracy of the estimated blood glucose level was evaluated by error grid analysis using the estimated blood glucose level and the measured blood glucose level at the same time point. The result of evaluating the estimated blood glucose level by error grid analysis in Example 3 is shown inFIG. 22 . InFIG. 22 , A indicates the area A in the error grid analysis. - From the results shown in
FIG. 22 , it was found that all the 14 plots of the estimated blood glucose level obtained in Example 3 were within the area A. The MARD also was 7.2%. The results suggested a highly accurate estimated blood glucose level can be obtained using the estimated background current value calculated using the background current value measured with the glucose sensor used for the measurement of glucose even when the timing of measuring the background current signal is changed from immediately before the measurement of the current signal attributable to glucose to one month before the measurement of the current signal attributable to glucose. - Table 1 shows the ratio (hereinafter also referred to as "A area corresponding ratio") at which the estimated blood glucose levels obtained in Examples 1 to 3, and Comparative Examples 1 and 2 correspond to the A area in the error grid analysis, and MARD.
Table 1 Estimated background current value was used A area corresponding ratio (%) MARD % Example 1 YES 100 6.3 Example 2 YES 100 6.7 Example 3 YES 100 7.2 Comp Ex 1 NO 93.3 11.7 Comp Ex 2 NO 89.4 8.1 - As a result, the A area corresponding ratio in Examples 1 to 3 in which the estimated background current value calculated based on the measured background current value was used were all 100%. In addition, the MARD in Examples 1 to 3 were 6.3% (Example 1), 6.7% (Example 2) and 7.2% (Example 3). From these results, it was found that the accuracy of the estimated blood glucose level in Examples 1 to 3 was high.
- On the other hand, the A region corresponding ratio in Comparative Examples 1 and 2 where the estimated background current value was not used were 93.3% (Comparative Example 1) and 89.4% (Comparative Example 2). In addition, the MARD in Comparative Examples 1 and 2 was 11.7% (Comparative Example 1) and 8.1 % (Comparative Example 2). From these results, it was found that the accuracy of the estimated blood glucose level in Comparative Examples 1 and 2 were lower than those in Examples 1 to 3.
- It was found from Example 1 and Example 3 that an accurate estimated blood glucose level can be obtained in either case of using the estimated background current value calculated based on the background current value measured immediately before the measurement of the unprocessed current signal including the current signal attributable to glucose (Example 1), and the case of using the estimated background current value calculated based on the background current value previously measured by the glucose sensor used to measure glucose (Example 3).
- The working electrode, the reference electrode and the counter electrode of the glucose sensor obtained in Example 3 (2) were brought into contact with the hydrogel obtained in Example 3 (3), respectively. Next, the glucose sensor was connected to a potentiostat (trade name: ALS 832 b, manufactured by BAS, Inc.). Using a reference electrode as a reference, a voltage of 0.45 V was applied to the working electrode of the glucose sensor. A background current signal flowing between the working electrode and the counter electrode was measured for 24 hours. Note that, during the measurement of the background current signal, drying of the hydrogel was suppressed by dripping PBS onto the hydrogel.
- Among the waveforms of the obtained background current signal, the background current signal corresponding to 10 minutes, 15 minutes, 20 minutes, 30 minutes, 40 minutes, 50 minutes, 60 minutes and 90 minutes from the start of measurement of the background current signal measurement were used to obtain the estimation equation shown in Table 2. By using the obtained estimation equation, the background current when a predetermined time had elapsed from the start of the measurement of the background current signal was calculated using the obtained estimation equation to obtain the estimated background current value. An error was found based on the formula (V) using the obtained estimated background current value and the measured background current value (actual measured background current value). The results are shown in Table 2 and Table 3. In the table, "measurement time" means the time of the waveform of the background current signal used in the calculation of the estimated background current value.

Table 2 Measurement time (minutes) Estimation equation Error (%) 2 hr measurement 3 hr measurement 4 hr measurement 10 y=3485.9x-0.466 100.676 111.3405 93.01132 15 y=4455.7x-0.519 60.19827 65.12481 48.52193 20 y=5190.7x-0.549 42.97096 45.586 29.82242 30 y=5980.0x-0.576 29.59108 30.52462 15.49127 40 y=6726.1x-0.597 20.95763 20.79603 6.239419 50 y=7306.4x-0.611 16.03012 15.2192 0.927319 60 y=7738.4x-0.62 13.44947 12.24623 1.931122 90 y=8786.7x-0.64 7.852554 5.846845 8.052785 Table 3 Measurement time (minutes) Error (%) 21 hr measurement 22 hr measurement 23 hr measurement 24 hr measurement Total 10 145.3509 183.049 220.0362 146.0658 102.1817 15 72.91278 98.98955 124.4628 72.19359 47.57708 20 43.80746 65.26409 86.17164 42.63679 32.35367 30 22.33102 40.40681 57.97995 20.89851 24.34722 40 8.680035 24.61694 40.08301 7.106613 21.34515 50 0.876636 15.59394 29.85933 0.769491 20.85662 60 3.432359 10.60996 24.21059 5.122261 21.84386 90 12.41377 0.229226 12.45341 14.17602 24.39749 - From the results shown in Tables 2 and 3, it was found that when the measurement time is 20 to 90 minutes, and preferably 30 to 90 minutes, the error is small between the estimated background current value and the measured background current value.
-
- 10 Continuous monitoring system
- 20 Sensor assembly
- 30 Electrochemical sensor
- 40 Collection member
- 60 Terminal
Claims (15)
- A sensor assembly comprising:an electrochemical sensor for measuring a test substance percutaneously extracted from a living body; anda processor for determining the intensity of the background signal at an optional measurement time point of the test substance outside the predetermined time based on the intensity of the background signal measured within the predetermined time by the electrochemical sensor.
- The sensor assembly according to claim 1, whereinthe predetermined time is the time period from when the electrochemical sensor is energized to when the measured value by the electrochemical sensor stabilizes.
- The sensor assembly according to claim 1 or 2, whereinthe electrochemical sensor is configured to measure a test substance extracted into a collection member from the living body in a state in which the test substance is in contact with the collecting member;the predetermined time is the time before the test substance is extracted to the collection member after the electrochemical sensor is brought into contact with the collecting member; andthe electrochemical sensor measures the intensity of the background signal within the predetermined time in a state in which the test substance is in contact with the collecting member.
- The sensor assembly according to any one of claims 1 or 3, whereinthe processor calculates the intensity of the background signal at the measurement time point based on the change over time in the intensity of the background signal measured within the predetermined time.
- The sensor assembly according to any one of claims 1 to 4, whereinthe processor calculates the intensity of the background signal at the measurement time point by applying power approximation, exponential approximation, linear approximation, or a combination thereof to the temporal change in the intensity of the background signal within the predetermined time.
- The sensor assembly according to any one of claims 1 to 5, whereinthe processor calculates the intensity of the background signal at the measurement time point based on an equation obtained by calculating constants included in the equation by performing power approximation, exponential approximation, linear approximation or performing fitting of combinations thereof with respect to the temporal change of the intensity of the background signal within the predetermined time.
- The sensor assembly according to any one of claims 1 to 6, further comprising:a memory for storing the value of the intensity of the background signal at the measurement time point.
- The sensor assembly according to any one of claims 1 to 7, whereinthe electrochemical sensor measures a test substance at each of a plurality of measurement points in time outside the predetermined time; andthe processor determines the intensity of the background signal at each of the plurality of measurement points in time based on the intensity of the background signal measured within the predetermined time.
- The sensor assembly according to any one of claims 1 to 8, whereinthe processor obtains a value representing the intensity of the signal attributable to the test substance by subtracting the value of the intensity of the background signal at the measurement time point from the measurement value of the intensity of the unprocessed signal including the signal attributable to the test substance acquired by the electrochemical sensor at the measurement time point.
- The sensor assembly according to any one of claims 1 to 9, whereinthe electrochemical sensor is configured to automatically obtain a value representing the intensity of the signal attributable to the test substance by measuring the intensity of the unprocessed signal including the signal attributable to the test substance and subtracting the intensity of the background signal at the measurement time point when the measurement of the intensity of the background signal and the determination of the intensity of the background signal at the measurement time point are automatically performed in a first measurement performed after the sensor assembly is first activated, and second and subsequent measurements are performed.
- The sensor assembly according to any one of claims 1 to 10, whereinthe processor obtains a value indicating the amount of the test substance based on the intensity of the signal attributable to the test substance and the in-vivo concentration of the substance correlated with the in-vivo concentration of the test substance.
- The sensor assembly according to claim 11, whereinthe in-vivo concentration of the substance correlated with the in-vivo concentration of the test substance is the blood concentration of the test substance.
- The sensor assembly according to any one of claims 1 to 12 comprising one such electrochemical sensor.
- A test substance monitoring system comprising:a collection member capable of collecting a test substance contained in the interstitial fluid extracted from a living body; andthe sensor assembly according to any one of claims 1 to 13.
- A monitoring method for percutaneously extracting a test substance, the method comprising:(A1) a step of bringing a collection member into contact with an electrochemical sensor and measuring the intensity of the background signal within a predetermined time;(A2) a step of determining the intensity of the background signal at an optional measurement time point of the test substance outside the predetermined time based on the intensity of the background signal within the predetermined time;(A3) a step of measuring a test substance extracted into a collection member from a living body by the electrochemical sensor at the measurement time point to obtain a measurement value of the intensity of the unprocessed signal including the signal attributable to the test substance; and(A4) a step of subtracting the value of the intensity of the background signal obtained in the step (A2) from the measured value of the intensity of the unprocessed signal measured in the step (A3) to calculate the intensity of the signal attributable to the test substance.
Applications Claiming Priority (1)
| Application Number | Priority Date | Filing Date | Title |
|---|---|---|---|
| JP2016170372A JP6778058B2 (en) | 2016-08-31 | 2016-08-31 | Sensor assembly, test substance monitoring system and test substance monitoring method |
Publications (1)
| Publication Number | Publication Date |
|---|---|
| EP3289976A1 true EP3289976A1 (en) | 2018-03-07 |
Family
ID=59811068
Family Applications (1)
| Application Number | Title | Priority Date | Filing Date |
|---|---|---|---|
| EP17188116.2A Withdrawn EP3289976A1 (en) | 2016-08-31 | 2017-08-28 | Sensor assembly, test substance monitoring system, and test substance monitoring method |
Country Status (4)
| Country | Link |
|---|---|
| US (1) | US20180055424A1 (en) |
| EP (1) | EP3289976A1 (en) |
| JP (1) | JP6778058B2 (en) |
| CN (1) | CN107796855A (en) |
Families Citing this family (4)
| Publication number | Priority date | Publication date | Assignee | Title |
|---|---|---|---|---|
| KR102031340B1 (en) * | 2018-03-14 | 2019-10-11 | 주식회사 필로시스 | System, method, and device to measure blood glucose |
| JP7220598B2 (en) * | 2019-03-15 | 2023-02-10 | 本田技研工業株式会社 | Biological information measuring sensor, biological information measuring device, and biological information measuring method |
| CN115515488A (en) * | 2021-04-22 | 2022-12-23 | 株式会社阿尔比缇 | Microneedle biosensor and method for manufacturing same |
| TWI803097B (en) * | 2021-12-14 | 2023-05-21 | 國立成功大學 | Biochip and electrode unit for dc-biased ac electrokinetic |
Citations (4)
| Publication number | Priority date | Publication date | Assignee | Title |
|---|---|---|---|---|
| US20010016682A1 (en) * | 1998-05-13 | 2001-08-23 | Cygnus, Inc. | Signal processing for measurement of physiological analytes |
| US20020002328A1 (en) * | 1994-06-24 | 2002-01-03 | Cygnus, Inc. | Device and method for sampling of substances using alternating polarity |
| US20030235817A1 (en) * | 2002-03-22 | 2003-12-25 | Miroslaw Bartkowiak | Microprocessors, devices, and methods for use in analyte monitoring systems |
| US20050215872A1 (en) * | 1998-05-13 | 2005-09-29 | Cygnus, Inc. | Monitoring of physiological analytes |
Family Cites Families (6)
| Publication number | Priority date | Publication date | Assignee | Title |
|---|---|---|---|---|
| AUPN661995A0 (en) * | 1995-11-16 | 1995-12-07 | Memtec America Corporation | Electrochemical cell 2 |
| US7150975B2 (en) * | 2002-08-19 | 2006-12-19 | Animas Technologies, Llc | Hydrogel composition for measuring glucose flux |
| CN1497256A (en) * | 2002-09-19 | 2004-05-19 | 王湘生 | Non-invasive method for monitoring blood sugar and its device |
| AU2004277166A1 (en) * | 2003-09-22 | 2005-04-07 | Kim Hyeung-Yun | Sensors and systems for structural health monitoring |
| CN101533007B (en) * | 2003-10-31 | 2013-01-02 | 生命扫描苏格兰有限公司 | Method of reducing the effect of direct interference current in an electrochemical test strip |
| US9429579B2 (en) * | 2006-09-22 | 2016-08-30 | Arkray, Inc. | Blood analysis apparatus |
-
2016
- 2016-08-31 JP JP2016170372A patent/JP6778058B2/en not_active Expired - Fee Related
-
2017
- 2017-08-21 CN CN201710717557.0A patent/CN107796855A/en active Pending
- 2017-08-28 EP EP17188116.2A patent/EP3289976A1/en not_active Withdrawn
- 2017-08-29 US US15/689,909 patent/US20180055424A1/en not_active Abandoned
Patent Citations (5)
| Publication number | Priority date | Publication date | Assignee | Title |
|---|---|---|---|---|
| US20020002328A1 (en) * | 1994-06-24 | 2002-01-03 | Cygnus, Inc. | Device and method for sampling of substances using alternating polarity |
| US20010016682A1 (en) * | 1998-05-13 | 2001-08-23 | Cygnus, Inc. | Signal processing for measurement of physiological analytes |
| US20050215872A1 (en) * | 1998-05-13 | 2005-09-29 | Cygnus, Inc. | Monitoring of physiological analytes |
| JP4545398B2 (en) | 1998-05-13 | 2010-09-15 | アニマス テクノロジーズ エルエルシー | Signal processing for measurement of physiological specimens |
| US20030235817A1 (en) * | 2002-03-22 | 2003-12-25 | Miroslaw Bartkowiak | Microprocessors, devices, and methods for use in analyte monitoring systems |
Also Published As
| Publication number | Publication date |
|---|---|
| US20180055424A1 (en) | 2018-03-01 |
| CN107796855A (en) | 2018-03-13 |
| JP2018033756A (en) | 2018-03-08 |
| JP6778058B2 (en) | 2020-10-28 |
Similar Documents
| Publication | Publication Date | Title |
|---|---|---|
| JP3328290B2 (en) | Ion introduction sampling apparatus and method | |
| KR100328654B1 (en) | Biosensor, iontophoretic sampling system, and methods of use thereof | |
| US9042955B2 (en) | Reference electrodes having an extended lifetime for use in long term amperometric sensors | |
| KR20240005085A (en) | Failure detection in a microneedle array-based continuous analyte monitoring device. | |
| JP3600158B2 (en) | Monitoring physiological analytes | |
| JP5324473B2 (en) | Specimen monitoring device coated with a heterocyclic nitrogen-containing polymer | |
| JP3537136B2 (en) | Method and apparatus for predicting physiological values | |
| CA2311487C (en) | Signal processing for measurement of physiological analytes | |
| US20090294306A1 (en) | Reference electrodes having an extended lifetime for use in long term amperometric sensors | |
| US20090294301A1 (en) | Reference Electrodes Having An Extended Lifetime for Use in Long Term Amperometric Sensors | |
| US20180055424A1 (en) | Sensor assembly, test substance monitoring system, and test substance monitoring method | |
| US8046043B2 (en) | Extraction device, analyzer, extraction method, and analysis method | |
| JP2019516452A (en) | Multiple transdermal extraction and detection apparatus for non-invasive monitoring of substances and method of use | |
| CN100574700C (en) | Systems and methods for analyte sampling and analysis using hydrogels | |
| KR102275188B1 (en) | Nonenzymatic determination of glucose at near neutral ph values based on the use of nafion and platinum black coated microneedle electrode array | |
| US20180030499A1 (en) | Electrode and manufacturing method thereof, enzyme sensor, glucose sensor and in-vivo component measuring device | |
| US20200029869A1 (en) | Nonenzymatic determination of glucose at near neutral ph values based on the use of nafion and platinum black coated microneedle electrode array | |
| JP6538554B2 (en) | Cumulative measurement of analytes | |
| Kim et al. | Importance of skin resistance in the reverse iontophoresis-based noninvasive glucose monitoring system | |
| CN116429854A (en) | A method for improving the accuracy of glucose monitoring in reverse iontophoresis | |
| JP2004290523A (en) | Endermatic analyte measuring system and endermatic analyte measuring method | |
| WO2025186110A1 (en) | Sensor assembly and monitoring method | |
| KR20260065428A (en) | Biosensor for Transdermal type noninvasive continuous glucose measurement system | |
| CN104483359A (en) | Glucose sensor | |
| JP2004249038A (en) | Transdermal analyte measuring system and transdermal analyte measuring method |
Legal Events
| Date | Code | Title | Description |
|---|---|---|---|
| PUAI | Public reference made under article 153(3) epc to a published international application that has entered the european phase |
Free format text: ORIGINAL CODE: 0009012 |
|
| AK | Designated contracting states |
Kind code of ref document: A1 Designated state(s): AL AT BE BG CH CY CZ DE DK EE ES FI FR GB GR HR HU IE IS IT LI LT LU LV MC MK MT NL NO PL PT RO RS SE SI SK SM TR |
|
| AX | Request for extension of the european patent |
Extension state: BA ME |
|
| 17P | Request for examination filed |
Effective date: 20180903 |
|
| RBV | Designated contracting states (corrected) |
Designated state(s): AL AT BE BG CH CY CZ DE DK EE ES FI FR GB GR HR HU IE IS IT LI LT LU LV MC MK MT NL NO PL PT RO RS SE SI SK SM TR |
|
| 17Q | First examination report despatched |
Effective date: 20200709 |
|
| STAA | Information on the status of an ep patent application or granted ep patent |
Free format text: STATUS: THE APPLICATION HAS BEEN WITHDRAWN |
|
| 18W | Application withdrawn |
Effective date: 20201201 |