EP3256848B1 - Method for creating a classifier indicative of a presence of a medical condition - Google Patents
Method for creating a classifier indicative of a presence of a medical condition Download PDFInfo
- Publication number
- EP3256848B1 EP3256848B1 EP16704919.6A EP16704919A EP3256848B1 EP 3256848 B1 EP3256848 B1 EP 3256848B1 EP 16704919 A EP16704919 A EP 16704919A EP 3256848 B1 EP3256848 B1 EP 3256848B1
- Authority
- EP
- European Patent Office
- Prior art keywords
- chromatogram data
- chromatogram
- data
- medical condition
- features
- Prior art date
- Legal status (The legal status is an assumption and is not a legal conclusion. Google has not performed a legal analysis and makes no representation as to the accuracy of the status listed.)
- Active
Links
- 238000000034 method Methods 0.000 title claims description 68
- 235000009413 Ratibida columnifera Nutrition 0.000 claims description 8
- 241000510442 Ratibida peduncularis Species 0.000 claims description 8
- 238000004422 calculation algorithm Methods 0.000 claims description 8
- 238000012706 support-vector machine Methods 0.000 claims description 8
- 238000007637 random forest analysis Methods 0.000 claims description 7
- 230000009466 transformation Effects 0.000 claims description 6
- 238000010200 validation analysis Methods 0.000 claims description 6
- 238000004458 analytical method Methods 0.000 claims description 4
- 239000012855 volatile organic compound Substances 0.000 claims 2
- 230000001131 transforming effect Effects 0.000 claims 1
- 239000000523 sample Substances 0.000 description 38
- 208000002551 irritable bowel syndrome Diseases 0.000 description 19
- 208000022559 Inflammatory bowel disease Diseases 0.000 description 15
- 238000005070 sampling Methods 0.000 description 14
- 206010060862 Prostate cancer Diseases 0.000 description 9
- 208000000236 Prostatic Neoplasms Diseases 0.000 description 9
- 239000011159 matrix material Substances 0.000 description 9
- 230000035945 sensitivity Effects 0.000 description 9
- 206010028980 Neoplasm Diseases 0.000 description 7
- 201000011510 cancer Diseases 0.000 description 7
- 238000002790 cross-validation Methods 0.000 description 7
- 206010005003 Bladder cancer Diseases 0.000 description 6
- 208000007097 Urinary Bladder Neoplasms Diseases 0.000 description 6
- 201000005112 urinary bladder cancer Diseases 0.000 description 6
- 230000008569 process Effects 0.000 description 5
- 229910044991 metal oxide Inorganic materials 0.000 description 4
- 150000004706 metal oxides Chemical class 0.000 description 4
- 238000004891 communication Methods 0.000 description 3
- 208000037265 diseases, disorders, signs and symptoms Diseases 0.000 description 3
- 210000003608 fece Anatomy 0.000 description 3
- 230000006870 function Effects 0.000 description 3
- 238000010438 heat treatment Methods 0.000 description 3
- 210000002307 prostate Anatomy 0.000 description 3
- 210000002700 urine Anatomy 0.000 description 3
- 0 ****CC*OC1C(*)****1 Chemical compound ****CC*OC1C(*)****1 0.000 description 2
- 241000894006 Bacteria Species 0.000 description 2
- 241000193163 Clostridioides difficile Species 0.000 description 2
- 241000233866 Fungi Species 0.000 description 2
- 239000000090 biomarker Substances 0.000 description 2
- 238000003066 decision tree Methods 0.000 description 2
- 238000003745 diagnosis Methods 0.000 description 2
- 210000001035 gastrointestinal tract Anatomy 0.000 description 2
- 238000011551 log transformation method Methods 0.000 description 2
- 244000045947 parasite Species 0.000 description 2
- 238000012545 processing Methods 0.000 description 2
- 239000013074 reference sample Substances 0.000 description 2
- 238000012216 screening Methods 0.000 description 2
- 208000024891 symptom Diseases 0.000 description 2
- 238000012360 testing method Methods 0.000 description 2
- 208000018522 Gastrointestinal disease Diseases 0.000 description 1
- 230000001594 aberrant effect Effects 0.000 description 1
- 230000008859 change Effects 0.000 description 1
- 230000001684 chronic effect Effects 0.000 description 1
- 150000001875 compounds Chemical class 0.000 description 1
- 238000002574 cystoscopy Methods 0.000 description 1
- 238000011161 development Methods 0.000 description 1
- 208000010643 digestive system disease Diseases 0.000 description 1
- 238000004817 gas chromatography Methods 0.000 description 1
- 208000018685 gastrointestinal system disease Diseases 0.000 description 1
- 208000006750 hematuria Diseases 0.000 description 1
- 230000028993 immune response Effects 0.000 description 1
- 230000014759 maintenance of location Effects 0.000 description 1
- 239000003550 marker Substances 0.000 description 1
- 239000000463 material Substances 0.000 description 1
- 238000005259 measurement Methods 0.000 description 1
- 239000002207 metabolite Substances 0.000 description 1
- 238000002705 metabolomic analysis Methods 0.000 description 1
- 230000001431 metabolomic effect Effects 0.000 description 1
- 239000000203 mixture Substances 0.000 description 1
- 238000007781 pre-processing Methods 0.000 description 1
- 239000000126 substance Substances 0.000 description 1
- 238000012549 training Methods 0.000 description 1
Images


Classifications
-
- G—PHYSICS
- G01—MEASURING; TESTING
- G01N—INVESTIGATING OR ANALYSING MATERIALS BY DETERMINING THEIR CHEMICAL OR PHYSICAL PROPERTIES
- G01N30/00—Investigating or analysing materials by separation into components using adsorption, absorption or similar phenomena or using ion-exchange, e.g. chromatography or field flow fractionation
- G01N30/02—Column chromatography
- G01N30/86—Signal analysis
- G01N30/8675—Evaluation, i.e. decoding of the signal into analytical information
- G01N30/8686—Fingerprinting, e.g. without prior knowledge of the sample components
-
- G—PHYSICS
- G01—MEASURING; TESTING
- G01N—INVESTIGATING OR ANALYSING MATERIALS BY DETERMINING THEIR CHEMICAL OR PHYSICAL PROPERTIES
- G01N30/00—Investigating or analysing materials by separation into components using adsorption, absorption or similar phenomena or using ion-exchange, e.g. chromatography or field flow fractionation
- G01N30/02—Column chromatography
- G01N30/86—Signal analysis
- G01N30/8675—Evaluation, i.e. decoding of the signal into analytical information
-
- G—PHYSICS
- G16—INFORMATION AND COMMUNICATION TECHNOLOGY [ICT] SPECIALLY ADAPTED FOR SPECIFIC APPLICATION FIELDS
- G16C—COMPUTATIONAL CHEMISTRY; CHEMOINFORMATICS; COMPUTATIONAL MATERIALS SCIENCE
- G16C20/00—Chemoinformatics, i.e. ICT specially adapted for the handling of physicochemical or structural data of chemical particles, elements, compounds or mixtures
- G16C20/20—Identification of molecular entities, parts thereof or of chemical compositions
-
- G—PHYSICS
- G16—INFORMATION AND COMMUNICATION TECHNOLOGY [ICT] SPECIALLY ADAPTED FOR SPECIFIC APPLICATION FIELDS
- G16H—HEALTHCARE INFORMATICS, i.e. INFORMATION AND COMMUNICATION TECHNOLOGY [ICT] SPECIALLY ADAPTED FOR THE HANDLING OR PROCESSING OF MEDICAL OR HEALTHCARE DATA
- G16H50/00—ICT specially adapted for medical diagnosis, medical simulation or medical data mining; ICT specially adapted for detecting, monitoring or modelling epidemics or pandemics
- G16H50/20—ICT specially adapted for medical diagnosis, medical simulation or medical data mining; ICT specially adapted for detecting, monitoring or modelling epidemics or pandemics for computer-aided diagnosis, e.g. based on medical expert systems
-
- G—PHYSICS
- G16—INFORMATION AND COMMUNICATION TECHNOLOGY [ICT] SPECIALLY ADAPTED FOR SPECIFIC APPLICATION FIELDS
- G16H—HEALTHCARE INFORMATICS, i.e. INFORMATION AND COMMUNICATION TECHNOLOGY [ICT] SPECIALLY ADAPTED FOR THE HANDLING OR PROCESSING OF MEDICAL OR HEALTHCARE DATA
- G16H50/00—ICT specially adapted for medical diagnosis, medical simulation or medical data mining; ICT specially adapted for detecting, monitoring or modelling epidemics or pandemics
- G16H50/70—ICT specially adapted for medical diagnosis, medical simulation or medical data mining; ICT specially adapted for detecting, monitoring or modelling epidemics or pandemics for mining of medical data, e.g. analysing previous cases of other patients
-
- G—PHYSICS
- G16—INFORMATION AND COMMUNICATION TECHNOLOGY [ICT] SPECIALLY ADAPTED FOR SPECIFIC APPLICATION FIELDS
- G16C—COMPUTATIONAL CHEMISTRY; CHEMOINFORMATICS; COMPUTATIONAL MATERIALS SCIENCE
- G16C20/00—Chemoinformatics, i.e. ICT specially adapted for the handling of physicochemical or structural data of chemical particles, elements, compounds or mixtures
- G16C20/70—Machine learning, data mining or chemometrics
Definitions
- the present invention relates to a method for determining a presence of a medical condition in a subject.
- some aspects of the present invention relate to a method for determining a presence of cancer, including prostate cancer, in a subject.
- the present invention provides a method for creating a classifier indicative of a presence of a medical condition in a subject.
- VAN BERKEL ET AL Journal of Chromatography B, 861(2008)101-107 discloses a classification method based on the analysis of volatile organic compounds from human exhaled air using GC/TOF-MS.
- Prostate cancer is the second most common disease worldwide for males with around 1,111,000 new cases each year. Many men with bladder outflow symptoms are often investigated for prostate cancer when they are found to have raised levels of serum PSA. However, PSA levels lacks specificity and, consequently, these men have to undergo invasive tests to confirm or refute the diagnosis of prostate cancer. In many, cancer is not found. This often leaves men concerned, rather than reassured, and an endless cycle of repeated PSA level measurements may follow. Currently, PSA is not considered a diagnostic marker and has not been approved for use in screening programs in most countries. Bladder cancer is the 9 th most common cancer worldwide and the most expensive to manage. There are no biomarkers approved for follow-up and repeated cystoscopies are performed which are invasive, expensive and not without risk.
- IBD Inflammatory bowel disease
- IBS irritable bowel syndrome
- VAN BERKEL ET AL Journal of Chromatography B, 861 (2008) 101-107 discloses the construction of a classifier for the identification of VOCs in exhaled air samples. The method is tested on a smoking/non smoking study population.
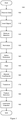
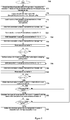
- FIG. 1 illustrates a method 100 according to an embodiment of the invention.
- the method 100 is a method of creating a classifier indicative of whether a subject has one or more medical conditions.
- the medical conditions may comprise one or more of cancer, comprising bladder and/or prostate cancer, irritable bowel disease (IBD), irritable bowel syndrome (IBS), a presence of one or more predetermined bacteria such as Clostridium difficile (C-dif), one or more predetermined parasites, one or more predetermined fungi.
- the method 100 is a computer based method for creating the classifier and storing the classifier in a computer-readable medium, such as non-transitory computer-readable medium.
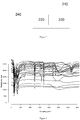
- the method may be performed by an apparatus 200 according to Figure 2 .
- the apparatus 200 comprises a control unit 210 comprising a processing unit 220 and a memory unit 230.
- the apparatus 210 is arranged to receive chromatogram data from a sensing unit 240.
- the chromatogram data is indicative of a presence of volatile compounds in a sample taken or obtained from a subject.
- the sample may be a sample of breath, urine or faeces from the subject, although it will be realised that this list is not exhaustive.
- the sensing unit may comprise one or more Metal Oxide (MO) sensors.
- the sensing unit 240 may be associated with an apparatus such as described in WO/2011/061308 .
- the apparatus 200 may comprise a gas chromatography column coupled to the one or more sensors.
- the column may be associated with an oven for heating the column according to a predetermined protocol.
- the chromatogram data may be communicated between the sensing unit 240 and the control unit 210 by means of a dedicated communication channel i.e. a direct electrical connection, or by means of a communication channel formed over one or more computer networks.
- the chromatogram data may be received at the control unit 210 in the form of one or more files each comprising chromatogram data for a respective sample.
- the sample may be heated according to a predetermined protocol.
- the protocol may define a period of heating the sample at one or more predetermined temperatures before sampling a predetermined volume of gas from the sample.
- An initial temperature of the oven may be held at 40°C for 13.4 minutes, ramped to 100°C at a rate of 5°C/min, hold for 30 minutes and cooled to 40°C using a temperature ramp of 10°C/minute. It will be realised that other protocols for the oven heating may be used.
- the chromatogram data may comprise data indicative of a resistance of the one or more MO sensors at predetermined intervals such as 0.5 seconds, although it will be realised that other intervals may be used.
- Figure 3 illustrates chromatogram data in an embodiment of the invention.
- Figure 3 comprises a plot of a plurality of items of chromatogram data from respective samples.
- the chromatogram data is plotted over time ( x -axis) and indicates a resistance ( y -axis) of the sensor at each respective sample time.
- the chromatogram data is received by the control unit 210 in step 105.
- the chromatogram data may be stored in the memory unit 230 of the control unit 210.
- chromatogram data from a plurality of samples are provided from subjects having the respective one or more medical conditions.
- the classifier is based upon the chromatogram data from those subjects, as will be explained.
- a set of chromatogram data from the plurality of samples having the one or more medical conditions is received in step 105.
- a further set of chromatogram data is provided from a plurality of samples not having the one or more medical conditions which may be referred to as a control set of chromatogram data.
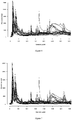
- Figure 4 comprises a plot of the inverted chromatogram data.
- Step 120 the received chromatogram data is processed.
- Step 120 comprises a baseline removal process.
- the baseline is a baseline resistance level of the chromatogram data.
- the baseline may be contributed as a majority, or only by, a mobile phase.
- the mobile phase is the gas which carries metabolites through a column of a gas chromatogram.
- the gas may be synthetic air.
- a threshold may also be determined in step 120.
- the baseline of the chromatogram data is removed by a least squares-fitting process.
- step 120 further comprises determining a resistance threshold.
- the resistance threshold is defined as an average resistance value in the chromatogram data from a sample minus the standard deviation of its resistance values. Any resistance values lower than the resistance threshold are then set to a predetermined value, which may be zero.
- Figure 5 illustrates chromatogram data processed according to an embodiment of step 120.
- step 130 values in the chromatogram data for each sample are normalised.
- the resistance values of a sample are normalized by dividing their values by the highest resistance value registered for the particular sample.
- Figure 6 illustrates chromatogram data processed according to an embodiment of step 130.
- Step 140 a reference chromatogram sample is selected for data alignment.
- Step 140 comprises selecting reference chromatogram data from the chromatogram data provided from step 130.
- selecting the reference chromatogram data comprises determining a coefficient indicative of correlation between each pair of chromatogram data.
- the coefficient may be a Pearson product-moment correlation coefficient, often referred to as a Pearson's coefficient, as will be appreciated by the skilled person.
- a method 700 of selecting the reference chromatogram for aligning the chromatogram data in an embodiment of the invention is illustrated in Figure 8 .
- step 705 two lists containing all the samples in experimental condition 1, for example, cancer samples, are created.
- One of these lists may be named as SampleListRef, while the second list may be named as SampleListTest.
- a sample may be randomly selected from SampleListRef, loaded into memory and removed from SampleListRef. For clarity, this sample will be described here as SampleRef.
- a sample may be randomly selected from SampleListTest, loaded into memory and removed from SampleListTest. For clarity, this sample will be described here as SampleTest.
- selected samples may be first chromatograms in the data set. For example where the chromatogram data are all allocated an ID, a chromatogram having a lowest value of ID may be selected in the first iteration of steps 710 and 715.
- step 720 and 725 the Pearson's correlation coefficient between SampleRef and SampleTest is determined and stored in a matrix, which may be named R .
- the SampleRef is shifted a predetermined number of sampling points with a correlation coefficient with SampleTest being calculated after each sampling point shift and the resultant correlation coefficient stored in the matrix R .
- the SampleRef in some embodiments, will be shifted in both positive and negative time point directions with respect to the SampleTest.
- the shift window is ⁇ 15 sampling points, although it will be realised that other sizes of shift window may be chosen.
- step 775 the maximum value in the matrix R is obtained, stored in a new matrix named M and the contents of R are cleared or reset. Steps 715 to 775 are repeated until the SampleListTest is empty and the method moves to step 785.
- step 785 the mean value of all the values stored in M is calculated, stored in a matrix named C along with information identifying the reference sample, such as the ID of SampleRef and the contents of M are cleared.
- the steps 710 to 785 are repeated until SampleListRef is empty and the method moves to step 795.
- step 795 the sample associated with the highest positive value in matrix C is determined as reference sample for chromatogram alignment.
- Step 795 may comprise storing the ID associated with the chromatogram selected as the reference chromatogram sample to allow other chromatogram data to be aligned at a later time, as will be explained.
- step 150 chromatogram data is aligned.
- the alignment aims to ensure that the same features are compared across samples from the different data classes or medical conditions under analysis.
- Step 150 comprises aligning the chromatogram data in relation to the reference chromatogram sample selected at step 140.
- a method 800 of aligning the chromatogram data according to an embodiment of the invention is illustrated in Figure 9 .
- every chromatogram data is aligned in relation to the reference chromatogram selected at step 140 of the Figure 1 method 100.
- step 805 the reference chromatogram sample selected at step 140 is loaded into memory.
- the reference chromatogram sample will be described here as RefSample.
- step 810 a list containing all the samples in the one or more data sets under analysis, for example, Cancer and Control samples, is created. For clarity, this list will be described here as SamplesToAlign.
- step 815 a random sample from SamplesToAlign is loaded. For clarity, this sample will be described here as SampleAlign.
- steps 820 to 870 the SampleAlign is shifted a predetermined number of sampling points with a single correlation coefficient being calculated between RefSample and SampleAlign after each sampling point shift and the resultant correlation coefficient stored in the matrix R .
- the shift window is ⁇ 15 sampling points, although it will be realised that other number of time points may be chosen. It will be appreciated that the SampleAlign, in some embodiments, will be shifted in both positive and negative time point directions with respect to the RefSample. When the SampleAlign has been shifted up to the extremity or extremities of the shift window, the method moves to step 875.
- the shifting sampling point associated with the highest value in R is determined and stored as SamplingPointsToShift.
- the SampleAlign is shifted the number of sampling points defined in SamplingPointsToShift and the contents of matrix R are cleared. Steps 815 to 880 are repeated until the SamplesToAlign list is empty.
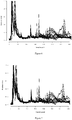
- Figure 7 illustrates chromatogram data aligned according to an embodiment of step 150.
- the values of the aligned chromatogram data are transformed to wavelet coefficients using a Mexican hat mother wavelet, which may also be known as a Ricker Wavelet.
- a Mexican hat mother wavelet which may also be known as a Ricker Wavelet.
- Other mother wavelets may be used.
- the wavelet coefficients may be determined using a plurality of scales of the Mexican hat mother wavelet.
- the plurality of scales may be scales between lower and upper limits.
- the upper and lower limits may be 100 and 1, respectively.
- a coefficient may be determined at each integer scale between the lower and upper limits.
- the coefficients may be determined as a modulus of a calculated coefficient.
- values of the chromatogram data for each sample are converted to the modulus of their wavelet coefficients using the scale of the Mexican hat mother wavelet, although the original values extracted by a Mexican hat mother wavelet may be used.
- the wavelet coefficients are then stored for future use, as will be explained.
- One of the wavelet scale values is chosen as a best match for the chromatogram data.
- the best match may be the wavelet scale having the highest classification accuracy, as will be explained.
- the accuracy of each wavelet scale may be determined based upon one or more of minimum, median, mean and maximum accuracy of a validation process.
- Figure 10 illustrates chromatogram data transformed to wavelet coefficients according to an embodiment of step 160.
- step 170 one or more of log, range and SpatialSign transformation processes are applied to the chromatogram data.
- each value of the chromatogram data has a predetermined value, such as the value 1 added to it.
- the chromatogram data may then be subject to log-transformation using a natural logarithm as base, although it will be realised that other base values may be used for the log-transformation.
- the range transformation is then applied to set the values of the chromatogram data to be in a predetermined range such as a range between 0 and 1.
- the range transformation may determine a transformed value x t at each time point of the chromatogram data where x is a data value of the chromatogram data and min(x) and max( x ) are minimum and maximum value of the chromatogram data, respectively.
- a further transform may be applied which may be known as a SpatialSign transform as described in S. Serneels, E. De Nolf, P. J. Van Espen, Spatial sign preprocessing: A simple way to impart moderate robustness to multivariate estimators. Journal of Chemical Information and Modeling 46, 1402-1409 (2006 ).
- Figure 11 illustrates chromatogram data transformed according to an embodiment of step 170.
- step 180 one or more features of the chromatogram data are selected.
- the one or more features are selected to be indicative of the presence of the one or more medical conditions.
- the one or more features are selected by a feature selection algorithm using random forest. In this algorithm, decision trees are developed based on different sets of samples and random forest is used to calculate a loss of accuracy of classification when the values of features are randomly permutated between sets of samples. One or more features associated with a loss of accuracy of classification are then selected.
- one of two different algorithms known as boruta and rfe based on random forest are applied in step 180 in order to select the features to be used.
- the boruta algorithm involves the development of decision trees based on different sets of samples. Random forest is then applied to calculate the loss of accuracy of classification when the values of features are randomly permutated between sets of samples. Features associated with the loss of accuracy are then selected as indicative features.
- the rfe algorithm works similarly to boruta, however, it eliminates features that produce no change in the accuracy level, instead of selecting features that produce loss of accuracy.
- the boruta and rfe algorithms are described in Feature Selection with the Boruta Package" Journal of Statistical Software 36(11): 1-13 ; and Anderssen, E., K.
- step 180 the one or more selected features are stored for later use.
- a classifier is determined.
- the classifier is for classifying a sample as either being a sample from a subject having the one or more medical conditions or a sample not having the one or more medical conditions.
- the classifier may be determined according to one of: linear discriminant analysis (LDA); partial least squares (PLS); random forest; k-nearest neighborhood (KNN); support vector machine (SVM) with radial basis function kernel (SVMRadial); SVM with linear basis function kernel (SVMLinear); and SVM with polynomial basis function kernel (SVMPoly).
- LDA linear discriminant analysis
- PLS partial least squares
- KNN k-nearest neighborhood
- SVM support vector machine
- SVMRadial radial basis function kernel
- SVMLinear linear basis function kernel
- SVMPoly polynomial basis function kernel
- the classifier may be determined using, for example, a software package such as R package caret ( Kuhn, M., caret: Classification and Regression Training
- a validation process may therefore be used to prevent such overfitting.
- the validation process may be one of repeated k-fold cross-validation and repeated double cross-validation.
- two validation processes are used: 30 repeats of 10-fold cross-validation and 30 repeats of the 3-fold double cross-validation with an inner loop of 10-fold repeated 5 times.
- these two cross-validation processes are repeated on the same data sets, however, applying a Monte Carlo random permutation of class labels in each repeat.
- step 160 the method 100 is repeated for a plurality of wavelet scales.
- the scale that produces the highest classification accuracy is then selected as the best match for the processed chromatogram data.
- a classifier is produced which is capable of classifying chromatogram data as originating from a sample having the one or more medical conditions or not having the one or more medical conditions.
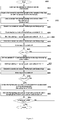
- Figure 12 illustrates a method 1000 of determining a presence of a medical condition in a subject according to an aspect of the invention.
- the method is performed upon a sample taken from the subject.
- the chromatogram data may be provided from an apparatus as described above with reference to Figure 2 .
- the same may be material excreted from the subject.
- the sample may be a sample of breath, urine or faeces from the subject, although it will be realised that this list is not exhaustive.
- the medical condition may comprise one or more of cancer, comprising bladder and/or prostate cancer, irritable bowel disease (IBD), irritable bowel syndrome (IBS), a presence of one or more predetermined bacteria such as Clostridium difficile (C-dif), one or more predetermined parasites, one or more predetermined fungi.
- cancer comprising bladder and/or prostate cancer
- IBD irritable bowel disease
- IBS irritable bowel syndrome
- C-dif Clostridium difficile
- predetermined parasites one or more predetermined parasites
- a number of steps of the method 1000 are as-described in conjunction with the method 100 illustrated in Figure 1 . Therefore repeat description of these steps will be omitted and the reader referred to the description associated with the equivalent step in Figure 1 .
- step 1050 the chromatogram data is received.
- the received chromatogram data will be described here as newSample.
- the newSample has its baseline removed and its data values are normalized in step 1150.
- step 1200 the newSample is then aligned. A method 2000 of aligning the newSample is illustrated in Figure 13 .
- step 2050 the reference chromatogram sample selected at step 140 of method 100 is loaded into memory.
- the reference chromatogram data will be described here as RefSample.
- step 2100 the newSample chromatogram data is loaded into memory.
- steps 2150 to 2650 the retention time of the newSample is shifted a predetermined number of sampling points with a single correlation coefficient being calculated between RefSample and newSample after each sampling point shift and the resultant correlation coefficient stored in the matrix R .
- the shift window is ⁇ 15 sampling points, although it will be realised that other number of shift points may be chosen.
- the newSample chromatogram data in some embodiments, will be shifted in both positive and negative time point directions with respect to the RefSample.
- the method moves to step 2700.
- the sampling point associated with the coefficient in R is determined and stored as SamplingPointsToShift.
- the newSample chromatogram data is shifted the number of sampling points defined in SamplingPointsToShift to align the new sample chromatogram data with the reference chromatogram data from the method illustrated in Figure 1 .
- step 1250 the newSample chromatogram data is transformed to wavelet coefficients using a Mexican hat wavelet and a predetermined scale.
- the predetermined scale may be that scale determined to have produced a highest accuracy in method 100 described with reference to Figure 1 , as explained above.
- step 1300 the wavelet coefficients produced by a predetermined wavelet scale, which may be the wavelet scale associated with a highest accuracy and stored in step 160 of method 100 are loaded.
- the value of the wavelet scale used in step 160 of method 100 is the same as the value of the wavelet scale used in step 1250 of method 1000.
- the wavelet coefficients produced in step 160 of method 100 will be described here as preProcessed data.
- step 1350 the newSample is combined with the preProcessed data in a single dataset named transformData.
- step 1400 the transformData is then transformed as described in step 170 of method 100.
- the features defined in step 180 of method 100 are then selected from transformData.
- the newSample is isolated from the transformData and predicted or classified by the model determined in step 190 of method 100.
- the methods described above were applied to two different datasets. First, they were applied to classify urine samples from patients with prostate cancer, bladder cancer and patients with a mixture of urological symptoms - hematuria and or prostatic symptoms (Control). Table 1 shows the results of the 30 times repeated double cross validation for the seven classifiers built. SVMRadial was able to classify prostate cancer and bladder cancer samples with 89.6% and 96.2% accuracy, respectively. Prostate and bladder cancer samples were differentiated with 93.5% accuracy. Then, the methods described above were applied to classify feces samples from patients with inflammatory bowel disease (IBD), irritable bowel syndrome (IBS) and healthy donors (Control).
- IBD inflammatory bowel disease
- IBS irritable bowel syndrome
- Control healthy donors
- Tables 2 and 3 show the results of the 30 times repeated double cross validation for the seven classifiers built.
- IBD and IBS were differentiated from Control samples with 88.9% and 94.4%, respectively.
- IBD samples were differentiated from IBS samples with 85.2% accuracy.
- IBD samples were differentiated from non-IBD samples with 84.9% accuracy.
- IBS samples were differentiated from non-IBS samples with 92.1% accuracy.
- Control samples were differentiated from non-Control samples with 86.8% accuracy.
- Methods forming embodiments of the invention may be computer-implemented.
- embodiments of the present invention can be realised in the form of hardware, software or a combination of hardware and software. Any such software may be stored in the form of volatile or non-volatile storage such as, for example, a storage device like a ROM, whether erasable or rewritable or not, or in the form of memory such as, for example, RAM, memory chips, device or integrated circuits or on an optically or magnetically readable medium such as, for example, a CD, DVD, magnetic disk or magnetic tape. It will be appreciated that the storage devices and storage media are embodiments of machine-readable storage that are suitable for storing a program or programs that, when executed, implement embodiments of the present invention.
- a program comprising code for implementing a method as claimed and a machine readable storage storing such a program.
- embodiments of the present invention may be conveyed electronically via any medium such as a communication signal carried over a wired or wireless connection.
Description
- The present invention relates to a method for determining a presence of a medical condition in a subject. In particular, although not exclusively, some aspects of the present invention relate to a method for determining a presence of cancer, including prostate cancer, in a subject. The present invention provides a method for creating a classifier indicative of a presence of a medical condition in a subject.
- VAN BERKEL ET AL, Journal of Chromatography B, 861(2008)101-107 discloses a classification method based on the analysis of volatile organic compounds from human exhaled air using GC/TOF-MS.
- Prostate cancer is the second most common disease worldwide for males with around 1,111,000 new cases each year. Many men with bladder outflow symptoms are often investigated for prostate cancer when they are found to have raised levels of serum PSA. However, PSA levels lacks specificity and, consequently, these men have to undergo invasive tests to confirm or refute the diagnosis of prostate cancer. In many, cancer is not found. This often leaves men worried, rather than reassured, and an endless cycle of repeated PSA level measurements may follow. Currently, PSA is not considered a diagnostic marker and has not been approved for use in screening programs in most countries. Bladder cancer is the 9th most common cancer worldwide and the most expensive to manage. There are no biomarkers approved for follow-up and repeated cystoscopies are performed which are invasive, expensive and not without risk. Inflammatory bowel disease (IBD) is a chronic gastrointestinal disease caused by an aberrant immune response in the gut, while irritable bowel syndrome (IBS) is a disorder of the digestive tract with no known cause. There is a pressing clinical need for a better biomarker that may be used for diagnosis and screening of medical conditions including prostate cancer, prostate cancer, IBD and IBS. It would save healthcare providers money, patient misery, and also speed-up much-needed treatment for the patient.
- It is an object of embodiments of the invention to at least mitigate one or more of the problems of the prior art.
- VAN BERKEL ET AL, Journal of Chromatography B, 861 (2008) 101-107 discloses the construction of a classifier for the identification of VOCs in exhaled air samples. The method is tested on a smoking/non smoking study population.
- According to the present invention, there is provided a method of determining a presence of a medical condition in a subject, according to
claim 1. Further aspects of the invention are defined in claims 2-14. - Embodiments of the invention will now be described by way of example only, with reference to the accompanying figures, in which:
-
Figure 1 shows a method according to an embodiment of the invention; -
Figure 2 shows a system for performing the method of the invention; -
Figure 3 shows an illustration of chromatogram data; -
Figure 4 shows an illustration of inverted chromatogram data in an embodiment of the invention; -
Figure 5 shows pre-processed chromatogram data in an embodiment of the invention; -
Figure 6 shows normalised chromatogram data in an embodiment of the invention; -
Figure 7 shows aligned chromatogram data in an embodiment of the invention; -
Figure 8 shows a method of selecting the reference chromatogram sample for data alignment in an embodiment of the invention; -
Figure 9 shows a method of aligning chromatogram data in an embodiment of the invention; -
Figure 10 shows wavelet coefficients determined for chromatogram data in an embodiment of the invention; -
Figure 11 shows transformed chromatogram data in an embodiment of the invention; -
Figure 12 illustrates a method for determining a presence of a medical condition in a subject according to an aspect of the invention; and -
Figure 13 shows a method of aligning received chromatogram data. -
Figure 1 illustrates amethod 100 according to an embodiment of the invention. Themethod 100 is a method of creating a classifier indicative of whether a subject has one or more medical conditions. The medical conditions may comprise one or more of cancer, comprising bladder and/or prostate cancer, irritable bowel disease (IBD), irritable bowel syndrome (IBS), a presence of one or more predetermined bacteria such as Clostridium difficile (C-dif), one or more predetermined parasites, one or more predetermined fungi. Themethod 100 is a computer based method for creating the classifier and storing the classifier in a computer-readable medium, such as non-transitory computer-readable medium. - The method may be performed by an apparatus 200 according to
Figure 2 . The apparatus 200 comprises acontrol unit 210 comprising aprocessing unit 220 and amemory unit 230. Theapparatus 210 is arranged to receive chromatogram data from asensing unit 240. The chromatogram data is indicative of a presence of volatile compounds in a sample taken or obtained from a subject. The sample may be a sample of breath, urine or faeces from the subject, although it will be realised that this list is not exhaustive. - The sensing unit may comprise one or more Metal Oxide (MO) sensors. The
sensing unit 240 may be associated with an apparatus such as described inWO/2011/061308 . The apparatus 200 may comprise a gas chromatography column coupled to the one or more sensors. The column may be associated with an oven for heating the column according to a predetermined protocol. - The chromatogram data may be communicated between the
sensing unit 240 and thecontrol unit 210 by means of a dedicated communication channel i.e. a direct electrical connection, or by means of a communication channel formed over one or more computer networks. The chromatogram data may be received at thecontrol unit 210 in the form of one or more files each comprising chromatogram data for a respective sample. - To produce the chromatogram data, the sample may be heated according to a predetermined protocol. The protocol may define a period of heating the sample at one or more predetermined temperatures before sampling a predetermined volume of gas from the sample.
- An initial temperature of the oven may be held at 40°C for 13.4 minutes, ramped to 100°C at a rate of 5°C/min, hold for 30 minutes and cooled to 40°C using a temperature ramp of 10°C/minute. It will be realised that other protocols for the oven heating may be used.
- A resistance of the MO sensor is determined over a period of time. The chromatogram data may comprise data indicative of a resistance of the one or more MO sensors at predetermined intervals such as 0.5 seconds, although it will be realised that other intervals may be used.
-
Figure 3 illustrates chromatogram data in an embodiment of the invention. -
Figure 3 comprises a plot of a plurality of items of chromatogram data from respective samples. The chromatogram data is plotted over time (x-axis) and indicates a resistance (y-axis) of the sensor at each respective sample time. The chromatogram data is received by thecontrol unit 210 instep 105. The chromatogram data may be stored in thememory unit 230 of thecontrol unit 210. - In order to create the classifier indicative of whether a subject has one or more medical conditions, chromatogram data from a plurality of samples are provided from subjects having the respective one or more medical conditions. The classifier is based upon the chromatogram data from those subjects, as will be explained. Thus a set of chromatogram data from the plurality of samples having the one or more medical conditions is received in
step 105. A further set of chromatogram data is provided from a plurality of samples not having the one or more medical conditions which may be referred to as a control set of chromatogram data. - In
step 110, the resistance signals of the chromatogram data received instep 105 are inverted in order to facilitate their processing using metabolomics tools. This inversion is performed individually for each sample using the following mathematical equation:
Figure 4 comprises a plot of the inverted chromatogram data. - In
step 120 the received chromatogram data is processed. Step 120 comprises a baseline removal process. The baseline is a baseline resistance level of the chromatogram data. The baseline may be contributed as a majority, or only by, a mobile phase. The mobile phase is the gas which carries metabolites through a column of a gas chromatogram. In some embodiments the gas may be synthetic air. - A threshold may also be determined in
step 120. In some embodiments the baseline of the chromatogram data is removed by a least squares-fitting process. - In some embodiments step 120 further comprises determining a resistance threshold. The resistance threshold is defined as an average resistance value in the chromatogram data from a sample minus the standard deviation of its resistance values. Any resistance values lower than the resistance threshold are then set to a predetermined value, which may be zero.
Figure 5 illustrates chromatogram data processed according to an embodiment ofstep 120. - In
step 130 values in the chromatogram data for each sample are normalised. In one embodiment, the resistance values of a sample are normalized by dividing their values by the highest resistance value registered for the particular sample.Figure 6 illustrates chromatogram data processed according to an embodiment ofstep 130. - In step 140 a reference chromatogram sample is selected for data alignment. Step 140 comprises selecting reference chromatogram data from the chromatogram data provided from
step 130. In some embodiments selecting the reference chromatogram data comprises determining a coefficient indicative of correlation between each pair of chromatogram data. The coefficient may be a Pearson product-moment correlation coefficient, often referred to as a Pearson's coefficient, as will be appreciated by the skilled person. - A
method 700 of selecting the reference chromatogram for aligning the chromatogram data in an embodiment of the invention is illustrated inFigure 8 . - Referring to
Figure 8 , instep 705 two lists containing all the samples inexperimental condition 1, for example, cancer samples, are created. One of these lists may be named as SampleListRef, while the second list may be named as SampleListTest. - In step 710 a sample may be randomly selected from SampleListRef, loaded into memory and removed from SampleListRef. For clarity, this sample will be described here as SampleRef.
- In step 715 a sample may be randomly selected from SampleListTest, loaded into memory and removed from SampleListTest. For clarity, this sample will be described here as SampleTest. In a first iteration of
steps steps - In
steps - In
steps 730 to 765 the SampleRef is shifted a predetermined number of sampling points with a correlation coefficient with SampleTest being calculated after each sampling point shift and the resultant correlation coefficient stored in the matrix R. It will be appreciated that the SampleRef, in some embodiments, will be shifted in both positive and negative time point directions with respect to the SampleTest. In one embodiment the shift window is ±15 sampling points, although it will be realised that other sizes of shift window may be chosen. - When the SampleRef has been shifted up to the extremity or extremities of the shift window, the method moves to step 775. It will be appreciated that when arriving at
step 775, in some embodiments, each chromatogram is associated with P coefficients as:
experimental condition 1. Therefore, in one embodiment, each chromatogram data is associated with 31 correlation coefficients for each of the remaining chromatogram data inexperimental condition 1. - In
step 775 the maximum value in the matrix R is obtained, stored in a new matrix named M and the contents of R are cleared or reset.Steps 715 to 775 are repeated until the SampleListTest is empty and the method moves to step 785. - In
step 785 the mean value of all the values stored in M is calculated, stored in a matrix named C along with information identifying the reference sample, such as the ID of SampleRef and the contents of M are cleared. Thesteps 710 to 785 are repeated until SampleListRef is empty and the method moves to step 795. Instep 795 the sample associated with the highest positive value in matrix C is determined as reference sample for chromatogram alignment. Step 795 may comprise storing the ID associated with the chromatogram selected as the reference chromatogram sample to allow other chromatogram data to be aligned at a later time, as will be explained. - Returning to
Figure 1 , instep 150 chromatogram data is aligned. The alignment aims to ensure that the same features are compared across samples from the different data classes or medical conditions under analysis. Step 150 comprises aligning the chromatogram data in relation to the reference chromatogram sample selected atstep 140. Amethod 800 of aligning the chromatogram data according to an embodiment of the invention is illustrated inFigure 9 . - Referring to
Figure 9 , in themethod 800 every chromatogram data is aligned in relation to the reference chromatogram selected atstep 140 of theFigure 1 method 100. - In
step 805 the reference chromatogram sample selected atstep 140 is loaded into memory. For clarity, the reference chromatogram sample will be described here as RefSample. In step 810 a list containing all the samples in the one or more data sets under analysis, for example, Cancer and Control samples, is created. For clarity, this list will be described here as SamplesToAlign. - In step 815 a random sample from SamplesToAlign is loaded. For clarity, this sample will be described here as SampleAlign. In
steps 820 to 870 the SampleAlign is shifted a predetermined number of sampling points with a single correlation coefficient being calculated between RefSample and SampleAlign after each sampling point shift and the resultant correlation coefficient stored in the matrix R. In one embodiment the shift window is ±15 sampling points, although it will be realised that other number of time points may be chosen. It will be appreciated that the SampleAlign, in some embodiments, will be shifted in both positive and negative time point directions with respect to the RefSample. When the SampleAlign has been shifted up to the extremity or extremities of the shift window, the method moves to step 875. It will be appreciated that when arriving atstep 875 in some embodiments the SampleAlign is associated with P coefficients as:
step 875 the shifting sampling point associated with the highest value in R is determined and stored as SamplingPointsToShift. Instep 880 the SampleAlign is shifted the number of sampling points defined in SamplingPointsToShift and the contents of matrix R are cleared.Steps 815 to 880 are repeated until the SamplesToAlign list is empty.Figure 7 illustrates chromatogram data aligned according to an embodiment ofstep 150. - Returning to
Figure 1 , instep 160 the values of the aligned chromatogram data are transformed to wavelet coefficients using a Mexican hat mother wavelet, which may also be known as a Ricker Wavelet. Other mother wavelets may be used. In one embodiment the wavelet coefficients may be determined using a plurality of scales of the Mexican hat mother wavelet. The plurality of scales may be scales between lower and upper limits. In one embodiment the upper and lower limits may be 100 and 1, respectively. In one embodiment a coefficient may be determined at each integer scale between the lower and upper limits. The coefficients may be determined as a modulus of a calculated coefficient. That is, values of the chromatogram data for each sample are converted to the modulus of their wavelet coefficients using the scale of the Mexican hat mother wavelet, although the original values extracted by a Mexican hat mother wavelet may be used. The wavelet coefficients are then stored for future use, as will be explained. One of the wavelet scale values is chosen as a best match for the chromatogram data. The best match may be the wavelet scale having the highest classification accuracy, as will be explained. The accuracy of each wavelet scale may be determined based upon one or more of minimum, median, mean and maximum accuracy of a validation process.Figure 10 illustrates chromatogram data transformed to wavelet coefficients according to an embodiment ofstep 160. - In
step 170 one or more of log, range and SpatialSign transformation processes are applied to the chromatogram data. In one embodiment, prior to the log, range and SpatialSign transformation processes, each value of the chromatogram data has a predetermined value, such as thevalue 1 added to it. The chromatogram data may then be subject to log-transformation using a natural logarithm as base, although it will be realised that other base values may be used for the log-transformation. In one embodiment the range transformation is then applied to set the values of the chromatogram data to be in a predetermined range such as a range between 0 and 1. The range transformation may determine a transformed value xt at each time point of the chromatogram data where x is a data value of the chromatogram data and min(x) and max(x) are minimum and maximum value of the chromatogram data, respectively. The range transformation may be performed using the equation:
- In some embodiments a further transform may be applied which may be known as a SpatialSign transform as described in S. Serneels, E. De Nolf, P. J. Van Espen, Spatial sign preprocessing: A simple way to impart moderate robustness to multivariate estimators. Journal of Chemical Information and Modeling 46, 1402-1409 (2006 ).
Figure 11 illustrates chromatogram data transformed according to an embodiment ofstep 170. - In
step 180 one or more features of the chromatogram data are selected. The one or more features are selected to be indicative of the presence of the one or more medical conditions. In embodiments of the invention, the one or more features are selected by a feature selection algorithm using random forest. In this algorithm, decision trees are developed based on different sets of samples and random forest is used to calculate a loss of accuracy of classification when the values of features are randomly permutated between sets of samples. One or more features associated with a loss of accuracy of classification are then selected. - In some embodiments of the invention, one of two different algorithms known as boruta and rfe based on random forest are applied in
step 180 in order to select the features to be used. The boruta algorithm involves the development of decision trees based on different sets of samples. Random forest is then applied to calculate the loss of accuracy of classification when the values of features are randomly permutated between sets of samples. Features associated with the loss of accuracy are then selected as indicative features. The rfe algorithm works similarly to boruta, however, it eliminates features that produce no change in the accuracy level, instead of selecting features that produce loss of accuracy. The boruta and rfe algorithms are described in Feature Selection with the Boruta Package" Journal of Statistical Software 36(11): 1-13; and Anderssen, E., K. Dyrstad, F. Westad and H. Martens (2006), "Reducing over-optimism in variable selection by cross-model validation" Chemometrics and Intelligent Laboratory Systems 84(1-2): 69-74. Instep 180 the one or more selected features are stored for later use. - In step 190 a classifier is determined. The classifier is for classifying a sample as either being a sample from a subject having the one or more medical conditions or a sample not having the one or more medical conditions. The classifier may be determined according to one of: linear discriminant analysis (LDA); partial least squares (PLS); random forest; k-nearest neighborhood (KNN); support vector machine (SVM) with radial basis function kernel (SVMRadial); SVM with linear basis function kernel (SVMLinear); and SVM with polynomial basis function kernel (SVMPoly). The classifier may be determined using, for example, a software package such as R package caret (Kuhn, M., caret: Classification and Regression Training. 2014).
- Building and testing the classifier on the same dataset may produce biased and overoptimistic results due to potential overfitting. In step 190 a validation process may therefore be used to prevent such overfitting. The validation process may be one of repeated k-fold cross-validation and repeated double cross-validation. In particular, in exemplary embodiments of the invention two validation processes are used: 30 repeats of 10-fold cross-validation and 30 repeats of the 3-fold double cross-validation with an inner loop of 10-fold repeated 5 times. In addition, these two cross-validation processes are repeated on the same data sets, however, applying a Monte Carlo random permutation of class labels in each repeat.
- As mentioned in the above description of
step 160, themethod 100 is repeated for a plurality of wavelet scales. The scale that produces the highest classification accuracy is then selected as the best match for the processed chromatogram data. As a result of embodiments of themethod 100 illustrated inFigure 1 , a classifier is produced which is capable of classifying chromatogram data as originating from a sample having the one or more medical conditions or not having the one or more medical conditions. -
Figure 12 illustrates amethod 1000 of determining a presence of a medical condition in a subject according to an aspect of the invention. The method is performed upon a sample taken from the subject. The chromatogram data may be provided from an apparatus as described above with reference toFigure 2 . The same may be material excreted from the subject. The sample may be a sample of breath, urine or faeces from the subject, although it will be realised that this list is not exhaustive. As noted above, the medical condition may comprise one or more of cancer, comprising bladder and/or prostate cancer, irritable bowel disease (IBD), irritable bowel syndrome (IBS), a presence of one or more predetermined bacteria such as Clostridium difficile (C-dif), one or more predetermined parasites, one or more predetermined fungi. - A number of steps of the
method 1000 are as-described in conjunction with themethod 100 illustrated inFigure 1 . Therefore repeat description of these steps will be omitted and the reader referred to the description associated with the equivalent step inFigure 1 . - In
step 1050 the chromatogram data is received. For clarity, the received chromatogram data will be described here as newSample. In some aspects, as previously described, instep 1100 the newSample has its baseline removed and its data values are normalized instep 1150. Instep 1200 the newSample is then aligned. Amethod 2000 of aligning the newSample is illustrated inFigure 13 . - Referring to
Figure 13 , instep 2050 the reference chromatogram sample selected atstep 140 ofmethod 100 is loaded into memory. For clarity, the reference chromatogram data will be described here as RefSample. Instep 2100 the newSample chromatogram data is loaded into memory. - In
steps 2150 to 2650 the retention time of the newSample is shifted a predetermined number of sampling points with a single correlation coefficient being calculated between RefSample and newSample after each sampling point shift and the resultant correlation coefficient stored in the matrix R. In one embodiment the shift window is ±15 sampling points, although it will be realised that other number of shift points may be chosen. It will be appreciated that the newSample chromatogram data, in some embodiments, will be shifted in both positive and negative time point directions with respect to the RefSample. When the newSample chromatogram data has been shifted up to the extremity or extremities of the shift window, the method moves to step 2700. It will be appreciated that when arriving atstep 2700 in some embodiments the newSample chromatogram data is associated with P coefficients as:
step 2700 the sampling point associated with the coefficient in R is determined and stored as SamplingPointsToShift. Instep 2750 the newSample chromatogram data is shifted the number of sampling points defined in SamplingPointsToShift to align the new sample chromatogram data with the reference chromatogram data from the method illustrated inFigure 1 . - Returning to
Figure 12 , instep 1250 the newSample chromatogram data is transformed to wavelet coefficients using a Mexican hat wavelet and a predetermined scale. The predetermined scale may be that scale determined to have produced a highest accuracy inmethod 100 described with reference toFigure 1 , as explained above. - In
step 1300 the wavelet coefficients produced by a predetermined wavelet scale, which may be the wavelet scale associated with a highest accuracy and stored instep 160 ofmethod 100 are loaded. The value of the wavelet scale used instep 160 ofmethod 100 is the same as the value of the wavelet scale used instep 1250 ofmethod 1000. For clarity, the wavelet coefficients produced instep 160 ofmethod 100 will be described here as preProcessed data. Instep 1350 the newSample is combined with the preProcessed data in a single dataset named transformData. - In
step 1400 the transformData is then transformed as described instep 170 ofmethod 100. The features defined instep 180 ofmethod 100 are then selected from transformData. The newSample is isolated from the transformData and predicted or classified by the model determined instep 190 ofmethod 100. - The methods described above were applied to two different datasets. First, they were applied to classify urine samples from patients with prostate cancer, bladder cancer and patients with a mixture of urological symptoms - hematuria and or prostatic symptoms (Control). Table 1 shows the results of the 30 times repeated double cross validation for the seven classifiers built. SVMRadial was able to classify prostate cancer and bladder cancer samples with 89.6% and 96.2% accuracy, respectively. Prostate and bladder cancer samples were differentiated with 93.5% accuracy. Then, the methods described above were applied to classify feces samples from patients with inflammatory bowel disease (IBD), irritable bowel syndrome (IBS) and healthy donors (Control). Tables 2 and 3 show the results of the 30 times repeated double cross validation for the seven classifiers built. IBD and IBS were differentiated from Control samples with 88.9% and 94.4%, respectively. IBD samples were differentiated from IBS samples with 85.2% accuracy. IBD samples were differentiated from non-IBD samples with 84.9% accuracy. IBS samples were differentiated from non-IBS samples with 92.1% accuracy. Finally, Control samples were differentiated from non-Control samples with 86.8% accuracy. Thus it can be appreciated that the invention enables to determine whether a sample is from a person having a predetermined condition with accuracy.
- Methods forming embodiments of the invention may be computer-implemented.
- It will be appreciated that embodiments of the present invention can be realised in the form of hardware, software or a combination of hardware and software. Any such software may be stored in the form of volatile or non-volatile storage such as, for example, a storage device like a ROM, whether erasable or rewritable or not, or in the form of memory such as, for example, RAM, memory chips, device or integrated circuits or on an optically or magnetically readable medium such as, for example, a CD, DVD, magnetic disk or magnetic tape. It will be appreciated that the storage devices and storage media are embodiments of machine-readable storage that are suitable for storing a program or programs that, when executed, implement embodiments of the present invention. Accordingly, there is provided a program comprising code for implementing a method as claimed and a machine readable storage storing such a program. Still further, embodiments of the present invention may be conveyed electronically via any medium such as a communication signal carried over a wired or wireless connection.
- The invention is not restricted to the details of any foregoing embodiments. The claims should not be construed to cover merely the foregoing embodiments, but also any embodiments which fall within the scope of the claims.
Table 1 Prostate vs Control Accuracy (%) Sensitivity (%) Specificity (%) Classifier Mean SE Median Mean SE Median Mean SE Median SVMRadial 89.6 0.5 90.7 85.6 0.8 85.0 92.7 0.5 92.0 SVMPoly 88.8 0.4 88.6 85.5 0.8 85.0 91.4 0.6 91.7 RF 88.3 0.4 88.6 82.0 0.8 84.2 93.3 0.6 93.9 PLS 87.7 0.5 88.6 85.6 0.8 85.0 89.4 0.7 91.7 LDA 87.7 0.5 88.6 85.4 0.8 85.0 89.6 0.7 91.7 SVMLinear 83.8 0.5 83.7 81.6 1.0 82.1 85.5 0.7 87.5 KNN 83.0 0.5 83.0 81.7 0.8 84.2 84.0 0.7 83.7 Bladder vs Control Accuracy (%) Sensitivity (%) Specificity (%) Classifier Mean SE Median Mean SE Median Mean SE Median SVMPoly 96.2 0.3 96.9 87.2 1.2 87.5 99.2 0.2 100.0 SVMRadial 96.2 0.3 96.9 85.0 1.1 87.5 99.9 0.1 100.0 PLS 94.4 0.4 93.9 86.3 1.1 87.5 97.1 0.4 98.0 LDA 93.6 0.5 93.8 87.4 1.1 87.5 95.7 0.5 95.8 SVMLinear 93.6 0.3 93.8 85.6 1.1 87.5 96.3 0.4 96.0 KNN 91.0 0.5 90.8 81.3 1.4 87.5 94.2 0.5 95.8 RF 86.8 0.4 87.5 46.8 1.6 50.0 100.0 0.0 100.0 Bladder vs Prostate Accuracy (%) Sensitivity (%) Specificity (%) Classifier Mean SE Median Mean SE Median Mean SE Median SVMPoly 93.5 0.4 92.9 83.5 1.1 87.5 97.6 0.4 100.0 SVMRadial 93.0 0.4 92.9 82.8 1.1 87.5 97.2 0.4 100.0 SVMLinear 91.8 0.5 92.6 85.6 1.5 87.5 94.4 0.5 94.7 KNN 91.2 0.4 92.6 81.9 1.2 87.5 95.1 0.5 95.0 PLS 90.9 0.6 92.6 80.0 1.5 87.5 95.3 0.5 95.0 RF 89.5 0.5 88.9 70.3 1.5 75.0 97.5 0.3 100.0 LDA 87.8 0.7 88.9 77.9 1.6 75.0 91.9 0.7 94.7 Table 2 IBD vs Control Accuracy (%) Sensitivity (%) Specificity (%) Classifier Mean SE Median Mean SE Median Mean SE Median SVMPoly 88.9 0.6 88.0 94.1 0.8 93.3 80.8 1.2 80.0 SVMRadial 86.6 0.7 87.5 92.8 0.9 93.3 77.0 1.3 77.8 SVMLinear 86.5 0.6 87.5 89.8 0.7 86.7 81.3 1.3 80.0 PLS 85.9 0.8 87.5 90.3 1.0 93.3 79.2 1.5 80.0 LDA 85.9 0.7 85.8 89.3 0.9 93.3 80.6 1.2 80.0 RF 84.9 0.6 84.0 95.6 0.5 100 68.2 1.5 70.0 KNN 82.4 0.7 83.3 91.9 0.8 93.3 : 67.6 1.5 70.0 IBS vs Control Accuracy (%) Sensitivity (%) Specificity (%) Classifier Mean SE Median Mean SE Median Mean SE Median SVMRadial 94.4 0.6 94.4 93.9 1.0 100 94.9 0.8 100 SVMPoly 94.4 0.5 94.4 94.0 1.0 100 94.8 0.7 100 SVMLinear 93.4 0.6 94.4 93.2 1.2 100 93.6 0.7 90.0 PLS 92.9 0.7 94.4 90.1 1.1 87.5 95.3 0.8 100 RF 92.9 0.7 94.4 92.2 1.1 100 93.5 0.8 90.0 KNN 91.9 0.7 94.1 91.3 1.1 87.5 92.6 0.9 90.0 LDA 78.7 1.1 77.8 76.8 1.4 75.0 80.3 1.7 80.0 IBD vs IBS Accuracy (%) Sensitivity (%) Specificity (%) Classifier Mean SE Median Mean SE Median Mean SE Median RF 85.2 0.6 87.0 96.3 0.5 100 64.4 1.8 62.5 SVMRadial 82.2 0.7 82.6 90.7 0.9 93.3 66.1 1.8 62.5 SVMPoly 82.2 0.7 82.6 91.6 0.8 93.3 64.6 2.0 62.5 SVMLinear 81.6 0.8 82.6 85.6 1.1 86.7 74.0 1.7 75.0 PLS 80.3 0.8 82.6 89.0 0.8 86.7 64.0 1.7 62.5 KNN 77.7 0.8 78.3 91.7 0.9 93.3 51.5 1.9 50.0 LDA 75.3 0.9 78.3 82.1 1.1 86.7 62.5 2.0 62.5 Table 3 IBD vs non-IBD Accuracy (%) Sensitivity (%) Specificity (%) Classifier Mean SE Median Mean SE Median Mean SE Median SVMPoly 84.9 0.5 84.8 82.2 1.0 80.0 87.2 0.8 88.6 SVMRadial 84.0 0.5 84.4 80.1 1.0 80.0 87.3 0.8 88.2 SVMLinear 82.8 0.7 81.8 81.4 1.2 80.0 84.1 1.0 83.3 RF 81.9 0.7 81.8 79.5 1.1 80.0 84.0 1.0 83.3 LDA 81.5 0.5 81.8 80.7 1.0 80.0 82.2 0.8 83.3 PLS 80.4 0.5 81.3 78.8 1.1 80.0 81.7 0.9 82.4 KNN 76.5 0.7 75.8 75.3 1.1 73.3 77.6 1.0 77.8 IBS vs non-IBS Accuracy (%) Sensitivity (%) Specificity (%) Classifier Mean SE Median Mean SE Median Mean SE Median PLS 92.1 0.5 90.9 80.3 1.5 81.3 96.0 0.4 96.0 SVMRadial 89.7 0.4 90.6 61.4 1.7 62.5 98.9 0.2 100.0 SVMLinear 89.6 0.5 90.6 78.6 1.6 75.0 93.2 0.5 92.0 SVMPoly 89.5 0.4 90.6 66.1 1.6 62.5 97.1 0.4 100.0 LDA 88.6 0.5 87.9 76.8 1.6 75.0 92.4 0.6 92.0 RF 83.4 0.5 84.4 36.9 1.9 37.5 98.5 0.2 100.0 KNN 82.9 0.5 81.8 39.2 1.9 37.5 97.0 0.4 96.0 Control vs non-Control Accuracy (%) Sensitivity (%) Specificity (%) Classifier Mean SE Median Mean SE Median Mean SE Median SVMPoly 86.8 0.4 87.5 64.5 1.6 60.0 96.2 0.5 95.7 SVMRadial 85.0 0.4 84.8 61.2 1.7 60.0 95.1 0.5 95.7 LDA 85.0 0.6 86.2 74.6 1.6 77.8 89.5 0.7 91.3 SVMLinear 84.5 0.6 84.8 73.5 1.6 77.8 89.2 0.7 91.3 RF 83.5 0.5 84.4 51.0 1.9 50.0 97.2 0.3 95.7 PLS 82.8 0.7 84.4 67.3 1.5 70.0 89.4 0.8 91.3 KNN 80.2 0.6 81.3 54.0 1.9 55.6 91.2 0.6 91.3
Claims (14)
- A method of creating a classifier indicative of a presence of a medical condition in a subject, comprising:receiving (105) chromatogram data indicative of a profile of volatile organic compounds in a sample from each of a first plurality of subjects having the medical condition and a second plurality of subjects without the medical condition;selecting (140) one of the chromatogram data as reference chromatogram data;aligning (150) the remaining chromatogram data in relation to the reference chromatogram data;characterized by:extracting (160) one or more features from the aligned chromatogram data using a Mexican hat wavelet transform of one or more scales;selecting (180) one or more said extracted features of the chromatogram data indicative of the medical condition; andconstructing (190) a classifier from said feature selection for determining a boundary between chromatogram data indicative of the medical condition and chromatogram data indicative of an absence of the medical condition.
- The method of claim 1, wherein the selecting (140) the reference chromatogram data comprises:determining a correlation coefficient between each of a first plurality of chromatogram data; andselecting (140) chromatogram data having a highest positive correlation coefficient as the reference chromatogram data.
- The method of claim 2, wherein:the correlation coefficient is determined between each of the first plurality of chromatogram data at each of a plurality of sample points within a predetermined shift window; andthe selecting (140) the chromatogram data comprises selecting a shift interval of the chromatogram data having a highest positive correlation coefficient.
- The method of claim 3, wherein remaining chromatogram data is aligned in relation to the sample point of the reference chromatogram data having the highest positive correlation coefficient; optionally the correlation coefficient is a Pearson product-moment correlation coefficient.
- The method of any preceding claim, wherein the extracting (160) of the one or more features from the chromatogram data comprises determining a coefficient for the chromatogram data at each of plurality of scales of the Mexican hat wavelet; optionally the plurality of scales are between upper and lower limits; optionally the upper and lower limits are 100 and 1, respectively.
- The method of claim 5, comprising selecting (140) one of the plurality of scales as a best match for the chromatogram data; optionally the scale is selected as a best match based on an accuracy of a validation process.
- The method of any preceding claim, wherein the one or more features of the chromatogram data indicative of the medical condition are selected using a selection algorithm based upon random forest; optionally in said algorithm one or more features of the chromatogram data are selected which, when omitted, lead to a loss of accuracy.
- The method of any preceding claim, comprising transforming a range of the chromatogram data.
- The method of claim 8, wherein:
the range transformation is applied to set the values of the chromatogram data to be in a predetermined range; optionally the range is between 0 and 1; and/or
the range of the chromatogram data is transformed according to the equation:
- The method of any preceding claim, wherein the classifier is constructed according to one of: linear discriminant analysis (LDA); partial least squares (PLS); random forest; k-nearest neighborhood (KNN); support vector machine (SVM) with radial basis function kernel (SVMRadial); SVM with linear basis function kernel (SVMLinear); and SVM with polynomial basis function kernel (SVMPoly).
- A method of determining a presence of a medical condition in a subject, comprising:receiving (105) chromatogram data indicative of a profile of volatile organic compounds in a sample from the subject;aligning (150) the chromatogram data with reference chromatogram data;extracting (105) one or more predetermined features from the chromatogram data using a Mexican hat wavelet transform of one or more predetermined scales wherein the one or more predetermined features are features selected in a method according to any preceding claim; anddetermining whether the extracted features are indicative of the presence of a medical condition in the subject using the classifier constructed with the method according to any preceding claim.
- The method of claim 11, wherein the determining whether the extracted features are indicative of the presence of the medical condition in the subject is based upon values of the extracted features.
- The method of claim 11 or 12, wherein the aligning (150) the chromatogram data comprises:determining a correlation coefficient between the chromatogram data and the reference chromatogram data at each of a plurality of sample points within a predetermined shift window; andaligning (150) the chromatogram data to the reference chromatogram data at a sample point time having a greatest correlation coefficient.
- Computer software which, when executed by a computer, is arranged to perform a method according to any preceding claim; optionally the computer software is stored on a computer-readable medium.
Applications Claiming Priority (2)
| Application Number | Priority Date | Filing Date | Title |
|---|---|---|---|
| GB201502447A GB201502447D0 (en) | 2015-02-13 | 2015-02-13 | Method and apparatus for sample analysis |
| PCT/GB2016/050344 WO2016128764A1 (en) | 2015-02-13 | 2016-02-12 | Method and apparatus for creating a classifier indicative of a presence of a medical condition |
Publications (2)
| Publication Number | Publication Date |
|---|---|
| EP3256848A1 EP3256848A1 (en) | 2017-12-20 |
| EP3256848B1 true EP3256848B1 (en) | 2019-05-15 |
Family
ID=52781579
Family Applications (1)
| Application Number | Title | Priority Date | Filing Date |
|---|---|---|---|
| EP16704919.6A Active EP3256848B1 (en) | 2015-02-13 | 2016-02-12 | Method for creating a classifier indicative of a presence of a medical condition |
Country Status (8)
| Country | Link |
|---|---|
| US (1) | US11635414B2 (en) |
| EP (1) | EP3256848B1 (en) |
| CN (1) | CN107223248B (en) |
| CA (1) | CA2975352A1 (en) |
| DK (1) | DK3256848T3 (en) |
| ES (1) | ES2741050T3 (en) |
| GB (1) | GB201502447D0 (en) |
| WO (1) | WO2016128764A1 (en) |
Families Citing this family (3)
| Publication number | Priority date | Publication date | Assignee | Title |
|---|---|---|---|---|
| CN109085282A (en) * | 2018-06-22 | 2018-12-25 | 东南大学 | A kind of chromatographic peaks analytic method based on wavelet transformation and Random Forest model |
| JP2022527571A (en) * | 2019-03-19 | 2022-06-02 | オプティナ・ダイアグノスティクス・インコーポレイテッド | Methods and systems for identifying subjects who may be affected by the medical condition |
| CN116522252B (en) * | 2023-04-26 | 2024-01-05 | 中国气象局公共气象服务中心(国家预警信息发布中心) | Solar radiation calibration method, device, electronic equipment and storage medium |
Family Cites Families (31)
| Publication number | Priority date | Publication date | Assignee | Title |
|---|---|---|---|---|
| CN1064712C (en) * | 1991-12-23 | 2001-04-18 | 华中理工大学 | Automatic examination network system of pathogenic bacteria difficult of clinical routine examination and its method |
| US5995868A (en) | 1996-01-23 | 1999-11-30 | University Of Kansas | System for the prediction, rapid detection, warning, prevention, or control of changes in activity states in the brain of a subject |
| US5885841A (en) * | 1996-09-11 | 1999-03-23 | Eli Lilly And Company | System and methods for qualitatively and quantitatively comparing complex admixtures using single ion chromatograms derived from spectroscopic analysis of such admixtures |
| WO2001091626A2 (en) | 2000-06-01 | 2001-12-06 | Science Applications International Corporation | Systems and methods for monitoring health and delivering drugs transdermally |
| GB0216650D0 (en) | 2002-07-18 | 2002-08-28 | Univ Bristol | Detection of disease by analysis of emissions |
| US7519488B2 (en) * | 2004-05-28 | 2009-04-14 | Lawrence Livermore National Security, Llc | Signal processing method and system for noise removal and signal extraction |
| US20070055151A1 (en) * | 2005-01-20 | 2007-03-08 | Shertukde Hemchandra M | Apparatus and methods for acoustic diagnosis |
| CN101262890B (en) | 2005-07-15 | 2015-08-26 | 安吉奥化学公司 | Aprotinin polypeptides is as the purposes of carrier in drug conjugate |
| WO2007109704A2 (en) | 2006-03-22 | 2007-09-27 | Cornell Research Foundation, Inc. | Medical imaging visibility index system and method for cancer lesions |
| US7736905B2 (en) * | 2006-03-31 | 2010-06-15 | Biodesix, Inc. | Method and system for determining whether a drug will be effective on a patient with a disease |
| CA2701352A1 (en) * | 2007-10-02 | 2009-04-09 | Ann-Charlotte Almstrand | Collection and measurement of exhaled particles |
| EP3144672B1 (en) | 2007-11-21 | 2018-08-22 | Cosmosid Inc. | Genome identification system |
| AU2008334948B2 (en) | 2007-12-13 | 2014-11-20 | Alnylam Pharmaceuticals, Inc. | Methods and compositions for prevention or treatment of RSV infection |
| EP2265173B1 (en) | 2008-04-16 | 2014-06-11 | Philips Intellectual Property & Standards GmbH | Method and system for sleep/wake condition estimation |
| US8580231B2 (en) | 2008-05-23 | 2013-11-12 | Northwestern University | Compositions and methods comprising magnetic resonance contrast agents |
| US10568541B2 (en) * | 2008-12-01 | 2020-02-25 | TricornTech Taiwan | Breath analysis systems and methods for asthma, tuberculosis and lung cancer diagnostics and disease management |
| CN101929989A (en) | 2009-06-24 | 2010-12-29 | 陈喆 | Distinguishing and aligning method of metabolic spectrum peak position |
| US8999245B2 (en) * | 2009-07-07 | 2015-04-07 | Tricorn Tech Corporation | Cascaded gas chromatographs (CGCs) with individual temperature control and gas analysis systems using same |
| US20120196935A1 (en) * | 2009-09-18 | 2012-08-02 | The Regents Of The University Of California | Methods for detecting autodigestion |
| GB0920315D0 (en) * | 2009-11-20 | 2010-01-06 | Univ Bristol | A diagnostic apparatus |
| GB0922505D0 (en) | 2009-12-23 | 2010-02-10 | Plant Bioscience Ltd | Use |
| WO2011083473A1 (en) | 2010-01-07 | 2011-07-14 | Technion Research And Development Foundation Ltd. | Volatile organic compounds as diagnostic markers for various types of cancer |
| EP2542577A1 (en) | 2010-03-01 | 2013-01-09 | Lostam Biopharmaceuticals Ltd | Improved therapeutic antibodies against flagellated pseudomonas aeruginosa |
| CA2824387C (en) | 2011-02-09 | 2019-09-24 | Natera, Inc. | Methods for non-invasive prenatal ploidy calling |
| EP2694095B1 (en) | 2011-04-05 | 2018-03-07 | Longevity Biotech, Inc. | Compositions comprising glucagon analogs and methods of making and using the same |
| WO2012151199A1 (en) | 2011-05-02 | 2012-11-08 | Immunomedics, Inc. | Ultrafiltration concentration of allotype selected antibodies for small-volume administration |
| GB201110344D0 (en) | 2011-06-20 | 2011-08-03 | Univ Bristol | Apparatus for collecting a sample |
| IL305223A (en) | 2012-01-27 | 2023-10-01 | Abbvie Inc | Composition and method for diagnosis and treatment of diseases associated with neurite degeneration |
| US8765725B2 (en) | 2012-05-08 | 2014-07-01 | Aciex Therapeutics, Inc. | Preparations of hydrophobic therapeutic agents, methods of manufacture and use thereof |
| KR20130134901A (en) | 2012-05-31 | 2013-12-10 | 서울대학교산학협력단 | Method for predicting biological activity of unknown natural compounds using non-linear quantitative pattern-activity relationships model |
| EP3260858A4 (en) * | 2015-02-16 | 2017-12-27 | Shimadzu Corporation | Noise level estimation method, measurement data processing device, and program for measurement data processing |
-
2015
- 2015-02-13 GB GB201502447A patent/GB201502447D0/en not_active Ceased
-
2016
- 2016-02-12 DK DK16704919.6T patent/DK3256848T3/en active
- 2016-02-12 US US15/550,734 patent/US11635414B2/en active Active
- 2016-02-12 CN CN201680009486.2A patent/CN107223248B/en active Active
- 2016-02-12 EP EP16704919.6A patent/EP3256848B1/en active Active
- 2016-02-12 ES ES16704919T patent/ES2741050T3/en active Active
- 2016-02-12 CA CA2975352A patent/CA2975352A1/en not_active Abandoned
- 2016-02-12 WO PCT/GB2016/050344 patent/WO2016128764A1/en active Application Filing
Non-Patent Citations (1)
| Title |
|---|
| None * |
Also Published As
| Publication number | Publication date |
|---|---|
| GB201502447D0 (en) | 2015-04-01 |
| CA2975352A1 (en) | 2016-08-18 |
| US20180038839A1 (en) | 2018-02-08 |
| ES2741050T3 (en) | 2020-02-07 |
| US11635414B2 (en) | 2023-04-25 |
| WO2016128764A1 (en) | 2016-08-18 |
| CN107223248A (en) | 2017-09-29 |
| DK3256848T3 (en) | 2019-08-19 |
| CN107223248B (en) | 2021-11-02 |
| EP3256848A1 (en) | 2017-12-20 |
Similar Documents
| Publication | Publication Date | Title |
|---|---|---|
| Khan et al. | Construction of saliency map and hybrid set of features for efficient segmentation and classification of skin lesion | |
| Van Berkel et al. | Development of accurate classification method based on the analysis of volatile organic compounds from human exhaled air | |
| Mortazavi et al. | Analysis of machine learning techniques for heart failure readmissions | |
| Paul et al. | Chemometric applications in metabolomic studies using chromatography-mass spectrometry | |
| Tiele et al. | Breath-based non-invasive diagnosis of Alzheimer’s disease: A pilot study | |
| EP3256848B1 (en) | Method for creating a classifier indicative of a presence of a medical condition | |
| JP6743892B2 (en) | Mass spectrometry data analyzer and analysis method | |
| Rundo et al. | Advanced deep learning embedded motion radiomics pipeline for predicting anti-PD-1/PD-L1 immunotherapy response in the treatment of bladder cancer: preliminary results | |
| CN103815921A (en) | One repetition maximum (1rm) estimating apparatus and method | |
| Mantini et al. | Independent component analysis for the extraction of reliable protein signal profiles from MALDI-TOF mass spectra | |
| Tibermacine et al. | Radiomics modelling in rectal cancer to predict disease-free survival: evaluation of different approaches | |
| Sujono et al. | Asthma identification using gas sensors and support vector machine | |
| Ettema et al. | Detecting multiple sclerosis via breath analysis using an eNose, a pilot study | |
| Oller-Moreno et al. | GCIMS: An R package for untargeted gas chromatography–Ion mobility spectrometry data processing | |
| Bi et al. | Dual stacked partial least squares for analysis of near-infrared spectra | |
| De et al. | Evaluation of heart failure biomarker tests: a survey of statistical considerations | |
| Stegeman et al. | Cancer risk models and preselection for screening | |
| Wiemer et al. | Bioinformatics in proteomics: application, terminology, and pitfalls | |
| Wang et al. | Reversible jump MCMC approach for peak identification for stroke SELDI mass spectrometry using mixture model | |
| Khanjani et al. | Insufficient lymph node assessment in gastric adenocarcinoma | |
| van der Sar et al. | Evaluation of different classification methods using electronic nose data to diagnose sarcoidosis | |
| Lin et al. | Discrimination of osteonecrosis and normal tissues by near-infrared spectroscopy and successive projections algorithm-linear discriminant analysis | |
| Wang et al. | Semiparametric empirical likelihood confidence intervals for AUC under a density ratio model | |
| Truntzer et al. | Comparison of classification methods that combine clinical data and high-dimensional mass spectrometry data | |
| Kim et al. | Developing cancer prediction model based on stepwise selection by AUC measure for proteomics data |
Legal Events
| Date | Code | Title | Description |
|---|---|---|---|
| STAA | Information on the status of an ep patent application or granted ep patent |
Free format text: STATUS: THE INTERNATIONAL PUBLICATION HAS BEEN MADE |
|
| PUAI | Public reference made under article 153(3) epc to a published international application that has entered the european phase |
Free format text: ORIGINAL CODE: 0009012 |
|
| STAA | Information on the status of an ep patent application or granted ep patent |
Free format text: STATUS: REQUEST FOR EXAMINATION WAS MADE |
|
| 17P | Request for examination filed |
Effective date: 20170807 |
|
| AK | Designated contracting states |
Kind code of ref document: A1 Designated state(s): AL AT BE BG CH CY CZ DE DK EE ES FI FR GB GR HR HU IE IS IT LI LT LU LV MC MK MT NL NO PL PT RO RS SE SI SK SM TR |
|
| AX | Request for extension of the european patent |
Extension state: BA ME |
|
| DAV | Request for validation of the european patent (deleted) | ||
| DAX | Request for extension of the european patent (deleted) | ||
| RIC1 | Information provided on ipc code assigned before grant |
Ipc: G16H 50/20 20180101ALI20181220BHEP Ipc: G01N 30/86 20060101AFI20181220BHEP Ipc: G06F 19/00 20180101ALI20181220BHEP Ipc: G16H 50/70 20180101ALI20181220BHEP |
|
| RIC1 | Information provided on ipc code assigned before grant |
Ipc: G16H 50/70 20180101ALI20190110BHEP Ipc: G01N 30/86 20060101AFI20190110BHEP Ipc: G16H 50/20 20180101ALI20190110BHEP |
|
| GRAP | Despatch of communication of intention to grant a patent |
Free format text: ORIGINAL CODE: EPIDOSNIGR1 |
|
| STAA | Information on the status of an ep patent application or granted ep patent |
Free format text: STATUS: GRANT OF PATENT IS INTENDED |
|
| INTG | Intention to grant announced |
Effective date: 20190222 |
|
| GRAS | Grant fee paid |
Free format text: ORIGINAL CODE: EPIDOSNIGR3 |
|
| GRAA | (expected) grant |
Free format text: ORIGINAL CODE: 0009210 |
|
| STAA | Information on the status of an ep patent application or granted ep patent |
Free format text: STATUS: THE PATENT HAS BEEN GRANTED |
|
| AK | Designated contracting states |
Kind code of ref document: B1 Designated state(s): AL AT BE BG CH CY CZ DE DK EE ES FI FR GB GR HR HU IE IS IT LI LT LU LV MC MK MT NL NO PL PT RO RS SE SI SK SM TR |
|
| REG | Reference to a national code |
Ref country code: CH Ref legal event code: EP |
|
| REG | Reference to a national code |
Ref country code: DE Ref legal event code: R096 Ref document number: 602016013992 Country of ref document: DE |
|
| REG | Reference to a national code |
Ref country code: IE Ref legal event code: FG4D |
|
| REG | Reference to a national code |
Ref country code: CH Ref legal event code: NV Representative=s name: TR-IP CONSULTING LLC, CH |
|
| REG | Reference to a national code |
Ref country code: NO Ref legal event code: T2 Effective date: 20190515 Ref country code: DK Ref legal event code: T3 Effective date: 20190816 |
|
| REG | Reference to a national code |
Ref country code: NL Ref legal event code: FP |
|
| REG | Reference to a national code |
Ref country code: SE Ref legal event code: TRGR |
|
| REG | Reference to a national code |
Ref country code: LT Ref legal event code: MG4D |
|
| PG25 | Lapsed in a contracting state [announced via postgrant information from national office to epo] |
Ref country code: HR Free format text: LAPSE BECAUSE OF FAILURE TO SUBMIT A TRANSLATION OF THE DESCRIPTION OR TO PAY THE FEE WITHIN THE PRESCRIBED TIME-LIMIT Effective date: 20190515 Ref country code: LT Free format text: LAPSE BECAUSE OF FAILURE TO SUBMIT A TRANSLATION OF THE DESCRIPTION OR TO PAY THE FEE WITHIN THE PRESCRIBED TIME-LIMIT Effective date: 20190515 Ref country code: AL Free format text: LAPSE BECAUSE OF FAILURE TO SUBMIT A TRANSLATION OF THE DESCRIPTION OR TO PAY THE FEE WITHIN THE PRESCRIBED TIME-LIMIT Effective date: 20190515 Ref country code: FI Free format text: LAPSE BECAUSE OF FAILURE TO SUBMIT A TRANSLATION OF THE DESCRIPTION OR TO PAY THE FEE WITHIN THE PRESCRIBED TIME-LIMIT Effective date: 20190515 Ref country code: PT Free format text: LAPSE BECAUSE OF FAILURE TO SUBMIT A TRANSLATION OF THE DESCRIPTION OR TO PAY THE FEE WITHIN THE PRESCRIBED TIME-LIMIT Effective date: 20190915 |
|
| PG25 | Lapsed in a contracting state [announced via postgrant information from national office to epo] |
Ref country code: GR Free format text: LAPSE BECAUSE OF FAILURE TO SUBMIT A TRANSLATION OF THE DESCRIPTION OR TO PAY THE FEE WITHIN THE PRESCRIBED TIME-LIMIT Effective date: 20190816 Ref country code: RS Free format text: LAPSE BECAUSE OF FAILURE TO SUBMIT A TRANSLATION OF THE DESCRIPTION OR TO PAY THE FEE WITHIN THE PRESCRIBED TIME-LIMIT Effective date: 20190515 Ref country code: BG Free format text: LAPSE BECAUSE OF FAILURE TO SUBMIT A TRANSLATION OF THE DESCRIPTION OR TO PAY THE FEE WITHIN THE PRESCRIBED TIME-LIMIT Effective date: 20190815 Ref country code: LV Free format text: LAPSE BECAUSE OF FAILURE TO SUBMIT A TRANSLATION OF THE DESCRIPTION OR TO PAY THE FEE WITHIN THE PRESCRIBED TIME-LIMIT Effective date: 20190515 |
|
| PG25 | Lapsed in a contracting state [announced via postgrant information from national office to epo] |
Ref country code: EE Free format text: LAPSE BECAUSE OF FAILURE TO SUBMIT A TRANSLATION OF THE DESCRIPTION OR TO PAY THE FEE WITHIN THE PRESCRIBED TIME-LIMIT Effective date: 20190515 Ref country code: SK Free format text: LAPSE BECAUSE OF FAILURE TO SUBMIT A TRANSLATION OF THE DESCRIPTION OR TO PAY THE FEE WITHIN THE PRESCRIBED TIME-LIMIT Effective date: 20190515 Ref country code: CZ Free format text: LAPSE BECAUSE OF FAILURE TO SUBMIT A TRANSLATION OF THE DESCRIPTION OR TO PAY THE FEE WITHIN THE PRESCRIBED TIME-LIMIT Effective date: 20190515 |
|
| REG | Reference to a national code |
Ref country code: ES Ref legal event code: FG2A Ref document number: 2741050 Country of ref document: ES Kind code of ref document: T3 Effective date: 20200207 |
|
| REG | Reference to a national code |
Ref country code: CH Ref legal event code: PCAR Free format text: NEW ADDRESS: ROUTE DU COUTSET 18, 1485 NUVILLY (CH) |
|
| REG | Reference to a national code |
Ref country code: DE Ref legal event code: R097 Ref document number: 602016013992 Country of ref document: DE |
|
| PG25 | Lapsed in a contracting state [announced via postgrant information from national office to epo] |
Ref country code: SM Free format text: LAPSE BECAUSE OF FAILURE TO SUBMIT A TRANSLATION OF THE DESCRIPTION OR TO PAY THE FEE WITHIN THE PRESCRIBED TIME-LIMIT Effective date: 20190515 |
|
| PLBE | No opposition filed within time limit |
Free format text: ORIGINAL CODE: 0009261 |
|
| STAA | Information on the status of an ep patent application or granted ep patent |
Free format text: STATUS: NO OPPOSITION FILED WITHIN TIME LIMIT |
|
| PG25 | Lapsed in a contracting state [announced via postgrant information from national office to epo] |
Ref country code: TR Free format text: LAPSE BECAUSE OF FAILURE TO SUBMIT A TRANSLATION OF THE DESCRIPTION OR TO PAY THE FEE WITHIN THE PRESCRIBED TIME-LIMIT Effective date: 20190515 |
|
| 26N | No opposition filed |
Effective date: 20200218 |
|
| PG25 | Lapsed in a contracting state [announced via postgrant information from national office to epo] |
Ref country code: PL Free format text: LAPSE BECAUSE OF FAILURE TO SUBMIT A TRANSLATION OF THE DESCRIPTION OR TO PAY THE FEE WITHIN THE PRESCRIBED TIME-LIMIT Effective date: 20190515 |
|
| PG25 | Lapsed in a contracting state [announced via postgrant information from national office to epo] |
Ref country code: SI Free format text: LAPSE BECAUSE OF FAILURE TO SUBMIT A TRANSLATION OF THE DESCRIPTION OR TO PAY THE FEE WITHIN THE PRESCRIBED TIME-LIMIT Effective date: 20190515 |
|
| PG25 | Lapsed in a contracting state [announced via postgrant information from national office to epo] |
Ref country code: MC Free format text: LAPSE BECAUSE OF FAILURE TO SUBMIT A TRANSLATION OF THE DESCRIPTION OR TO PAY THE FEE WITHIN THE PRESCRIBED TIME-LIMIT Effective date: 20190515 |
|
| PGFP | Annual fee paid to national office [announced via postgrant information from national office to epo] |
Ref country code: NO Payment date: 20210218 Year of fee payment: 6 |
|
| PGFP | Annual fee paid to national office [announced via postgrant information from national office to epo] |
Ref country code: SE Payment date: 20210212 Year of fee payment: 6 Ref country code: AT Payment date: 20210219 Year of fee payment: 6 |
|
| PG25 | Lapsed in a contracting state [announced via postgrant information from national office to epo] |
Ref country code: MT Free format text: LAPSE BECAUSE OF FAILURE TO SUBMIT A TRANSLATION OF THE DESCRIPTION OR TO PAY THE FEE WITHIN THE PRESCRIBED TIME-LIMIT Effective date: 20190515 Ref country code: CY Free format text: LAPSE BECAUSE OF FAILURE TO SUBMIT A TRANSLATION OF THE DESCRIPTION OR TO PAY THE FEE WITHIN THE PRESCRIBED TIME-LIMIT Effective date: 20190515 |
|
| PG25 | Lapsed in a contracting state [announced via postgrant information from national office to epo] |
Ref country code: RO Free format text: LAPSE BECAUSE OF FAILURE TO SUBMIT A TRANSLATION OF THE DESCRIPTION OR TO PAY THE FEE WITHIN THE PRESCRIBED TIME-LIMIT Effective date: 20190515 Ref country code: MK Free format text: LAPSE BECAUSE OF FAILURE TO SUBMIT A TRANSLATION OF THE DESCRIPTION OR TO PAY THE FEE WITHIN THE PRESCRIBED TIME-LIMIT Effective date: 20190515 Ref country code: IS Free format text: LAPSE BECAUSE OF FAILURE TO SUBMIT A TRANSLATION OF THE DESCRIPTION OR TO PAY THE FEE WITHIN THE PRESCRIBED TIME-LIMIT Effective date: 20190915 |
|
| REG | Reference to a national code |
Ref country code: NO Ref legal event code: MMEP |
|
| REG | Reference to a national code |
Ref country code: SE Ref legal event code: EUG |
|
| REG | Reference to a national code |
Ref country code: AT Ref legal event code: MM01 Ref document number: 1134043 Country of ref document: AT Kind code of ref document: T Effective date: 20220212 |
|
| PG25 | Lapsed in a contracting state [announced via postgrant information from national office to epo] |
Ref country code: SE Free format text: LAPSE BECAUSE OF NON-PAYMENT OF DUE FEES Effective date: 20220213 Ref country code: NO Free format text: LAPSE BECAUSE OF NON-PAYMENT OF DUE FEES Effective date: 20220228 Ref country code: AT Free format text: LAPSE BECAUSE OF NON-PAYMENT OF DUE FEES Effective date: 20220212 |
|
| PGFP | Annual fee paid to national office [announced via postgrant information from national office to epo] |
Ref country code: NL Payment date: 20230220 Year of fee payment: 8 |
|
| PGFP | Annual fee paid to national office [announced via postgrant information from national office to epo] |
Ref country code: LU Payment date: 20230216 Year of fee payment: 8 Ref country code: IE Payment date: 20230215 Year of fee payment: 8 Ref country code: FR Payment date: 20230217 Year of fee payment: 8 Ref country code: ES Payment date: 20230317 Year of fee payment: 8 Ref country code: DK Payment date: 20230220 Year of fee payment: 8 Ref country code: CH Payment date: 20230307 Year of fee payment: 8 |
|
| PGFP | Annual fee paid to national office [announced via postgrant information from national office to epo] |
Ref country code: IT Payment date: 20230228 Year of fee payment: 8 Ref country code: BE Payment date: 20230220 Year of fee payment: 8 |
|
| P01 | Opt-out of the competence of the unified patent court (upc) registered |
Effective date: 20230525 |
|
| PGFP | Annual fee paid to national office [announced via postgrant information from national office to epo] |
Ref country code: DE Payment date: 20240216 Year of fee payment: 9 Ref country code: GB Payment date: 20240212 Year of fee payment: 9 |