EP3238633A1 - Diagnostic ultrasound apparatus, diagnostic ultrasound apparatus operation method, and diagnostic ultrasound apparatus operation program - Google Patents
Diagnostic ultrasound apparatus, diagnostic ultrasound apparatus operation method, and diagnostic ultrasound apparatus operation program Download PDFInfo
- Publication number
- EP3238633A1 EP3238633A1 EP15872408.8A EP15872408A EP3238633A1 EP 3238633 A1 EP3238633 A1 EP 3238633A1 EP 15872408 A EP15872408 A EP 15872408A EP 3238633 A1 EP3238633 A1 EP 3238633A1
- Authority
- EP
- European Patent Office
- Prior art keywords
- ultrasound
- frequency
- unit
- change rate
- diagnosis apparatus
- Prior art date
- Legal status (The legal status is an assumption and is not a legal conclusion. Google has not performed a legal analysis and makes no representation as to the accuracy of the status listed.)
- Withdrawn
Links
- 238000002604 ultrasonography Methods 0.000 title claims abstract description 334
- 238000000034 method Methods 0.000 title claims description 34
- 230000008859 change Effects 0.000 claims abstract description 157
- 238000001228 spectrum Methods 0.000 claims abstract description 130
- 238000003745 diagnosis Methods 0.000 claims abstract description 107
- 238000004364 calculation method Methods 0.000 claims abstract description 97
- 238000004458 analytical method Methods 0.000 claims abstract description 54
- 239000000523 sample Substances 0.000 claims description 53
- 238000000611 regression analysis Methods 0.000 claims description 48
- 230000000007 visual effect Effects 0.000 claims description 16
- 238000013500 data storage Methods 0.000 claims description 14
- 238000012545 processing Methods 0.000 description 74
- 230000003321 amplification Effects 0.000 description 57
- 238000003199 nucleic acid amplification method Methods 0.000 description 57
- 230000006870 function Effects 0.000 description 55
- 238000010586 diagram Methods 0.000 description 36
- 238000012937 correction Methods 0.000 description 34
- 230000005540 biological transmission Effects 0.000 description 19
- 230000000694 effects Effects 0.000 description 14
- 210000004027 cell Anatomy 0.000 description 12
- 238000012886 linear function Methods 0.000 description 10
- 210000000056 organ Anatomy 0.000 description 7
- 210000001519 tissue Anatomy 0.000 description 7
- 238000006243 chemical reaction Methods 0.000 description 6
- 230000009466 transformation Effects 0.000 description 5
- NAWXUBYGYWOOIX-SFHVURJKSA-N (2s)-2-[[4-[2-(2,4-diaminoquinazolin-6-yl)ethyl]benzoyl]amino]-4-methylidenepentanedioic acid Chemical compound C1=CC2=NC(N)=NC(N)=C2C=C1CCC1=CC=C(C(=O)N[C@@H](CC(=C)C(O)=O)C(O)=O)C=C1 NAWXUBYGYWOOIX-SFHVURJKSA-N 0.000 description 3
- 230000007423 decrease Effects 0.000 description 3
- 238000003384 imaging method Methods 0.000 description 3
- 238000005070 sampling Methods 0.000 description 3
- 230000002159 abnormal effect Effects 0.000 description 2
- 210000000013 bile duct Anatomy 0.000 description 2
- 210000003445 biliary tract Anatomy 0.000 description 2
- 210000000621 bronchi Anatomy 0.000 description 2
- 238000004891 communication Methods 0.000 description 2
- 230000001419 dependent effect Effects 0.000 description 2
- 238000001514 detection method Methods 0.000 description 2
- 238000005401 electroluminescence Methods 0.000 description 2
- 230000002708 enhancing effect Effects 0.000 description 2
- 238000001914 filtration Methods 0.000 description 2
- 210000000232 gallbladder Anatomy 0.000 description 2
- 210000001035 gastrointestinal tract Anatomy 0.000 description 2
- 238000005286 illumination Methods 0.000 description 2
- 238000003780 insertion Methods 0.000 description 2
- 230000037431 insertion Effects 0.000 description 2
- 210000001165 lymph node Anatomy 0.000 description 2
- 238000005259 measurement Methods 0.000 description 2
- 210000000496 pancreas Anatomy 0.000 description 2
- 230000000241 respiratory effect Effects 0.000 description 2
- 230000004044 response Effects 0.000 description 2
- 230000035945 sensitivity Effects 0.000 description 2
- 210000003437 trachea Anatomy 0.000 description 2
- 210000003932 urinary bladder Anatomy 0.000 description 2
- 208000001976 Endocrine Gland Neoplasms Diseases 0.000 description 1
- 240000001973 Ficus microcarpa Species 0.000 description 1
- 206010028980 Neoplasm Diseases 0.000 description 1
- 230000003187 abdominal effect Effects 0.000 description 1
- 230000009471 action Effects 0.000 description 1
- 230000002238 attenuated effect Effects 0.000 description 1
- 210000004204 blood vessel Anatomy 0.000 description 1
- 210000000481 breast Anatomy 0.000 description 1
- 201000011510 cancer Diseases 0.000 description 1
- 208000031513 cyst Diseases 0.000 description 1
- 238000006073 displacement reaction Methods 0.000 description 1
- 210000001198 duodenum Anatomy 0.000 description 1
- 201000011523 endocrine gland cancer Diseases 0.000 description 1
- 210000003238 esophagus Anatomy 0.000 description 1
- 239000000284 extract Substances 0.000 description 1
- 210000002429 large intestine Anatomy 0.000 description 1
- 238000012417 linear regression Methods 0.000 description 1
- 239000004973 liquid crystal related substance Substances 0.000 description 1
- 210000004185 liver Anatomy 0.000 description 1
- 210000004072 lung Anatomy 0.000 description 1
- 210000005075 mammary gland Anatomy 0.000 description 1
- 238000012986 modification Methods 0.000 description 1
- 230000004048 modification Effects 0.000 description 1
- 208000022669 mucinous neoplasm Diseases 0.000 description 1
- 230000003287 optical effect Effects 0.000 description 1
- 210000000277 pancreatic duct Anatomy 0.000 description 1
- 230000008569 process Effects 0.000 description 1
- 210000002307 prostate Anatomy 0.000 description 1
- 230000009467 reduction Effects 0.000 description 1
- 210000002784 stomach Anatomy 0.000 description 1
- 210000001685 thyroid gland Anatomy 0.000 description 1
- 230000007704 transition Effects 0.000 description 1
- 210000000626 ureter Anatomy 0.000 description 1
- 210000003708 urethra Anatomy 0.000 description 1
- 230000003245 working effect Effects 0.000 description 1
Images


Classifications
-
- A—HUMAN NECESSITIES
- A61—MEDICAL OR VETERINARY SCIENCE; HYGIENE
- A61B—DIAGNOSIS; SURGERY; IDENTIFICATION
- A61B8/00—Diagnosis using ultrasonic, sonic or infrasonic waves
- A61B8/52—Devices using data or image processing specially adapted for diagnosis using ultrasonic, sonic or infrasonic waves
- A61B8/5269—Devices using data or image processing specially adapted for diagnosis using ultrasonic, sonic or infrasonic waves involving detection or reduction of artifacts
-
- A—HUMAN NECESSITIES
- A61—MEDICAL OR VETERINARY SCIENCE; HYGIENE
- A61B—DIAGNOSIS; SURGERY; IDENTIFICATION
- A61B8/00—Diagnosis using ultrasonic, sonic or infrasonic waves
- A61B8/12—Diagnosis using ultrasonic, sonic or infrasonic waves in body cavities or body tracts, e.g. by using catheters
-
- A—HUMAN NECESSITIES
- A61—MEDICAL OR VETERINARY SCIENCE; HYGIENE
- A61B—DIAGNOSIS; SURGERY; IDENTIFICATION
- A61B8/00—Diagnosis using ultrasonic, sonic or infrasonic waves
- A61B8/46—Ultrasonic, sonic or infrasonic diagnostic devices with special arrangements for interfacing with the operator or the patient
- A61B8/461—Displaying means of special interest
-
- A—HUMAN NECESSITIES
- A61—MEDICAL OR VETERINARY SCIENCE; HYGIENE
- A61B—DIAGNOSIS; SURGERY; IDENTIFICATION
- A61B8/00—Diagnosis using ultrasonic, sonic or infrasonic waves
- A61B8/52—Devices using data or image processing specially adapted for diagnosis using ultrasonic, sonic or infrasonic waves
- A61B8/5207—Devices using data or image processing specially adapted for diagnosis using ultrasonic, sonic or infrasonic waves involving processing of raw data to produce diagnostic data, e.g. for generating an image
-
- G—PHYSICS
- G01—MEASURING; TESTING
- G01S—RADIO DIRECTION-FINDING; RADIO NAVIGATION; DETERMINING DISTANCE OR VELOCITY BY USE OF RADIO WAVES; LOCATING OR PRESENCE-DETECTING BY USE OF THE REFLECTION OR RERADIATION OF RADIO WAVES; ANALOGOUS ARRANGEMENTS USING OTHER WAVES
- G01S15/00—Systems using the reflection or reradiation of acoustic waves, e.g. sonar systems
- G01S15/88—Sonar systems specially adapted for specific applications
- G01S15/89—Sonar systems specially adapted for specific applications for mapping or imaging
- G01S15/8906—Short-range imaging systems; Acoustic microscope systems using pulse-echo techniques
- G01S15/8977—Short-range imaging systems; Acoustic microscope systems using pulse-echo techniques using special techniques for image reconstruction, e.g. FFT, geometrical transformations, spatial deconvolution, time deconvolution
-
- G—PHYSICS
- G01—MEASURING; TESTING
- G01S—RADIO DIRECTION-FINDING; RADIO NAVIGATION; DETERMINING DISTANCE OR VELOCITY BY USE OF RADIO WAVES; LOCATING OR PRESENCE-DETECTING BY USE OF THE REFLECTION OR RERADIATION OF RADIO WAVES; ANALOGOUS ARRANGEMENTS USING OTHER WAVES
- G01S7/00—Details of systems according to groups G01S13/00, G01S15/00, G01S17/00
- G01S7/52—Details of systems according to groups G01S13/00, G01S15/00, G01S17/00 of systems according to group G01S15/00
- G01S7/52017—Details of systems according to groups G01S13/00, G01S15/00, G01S17/00 of systems according to group G01S15/00 particularly adapted to short-range imaging
- G01S7/52023—Details of receivers
- G01S7/52036—Details of receivers using analysis of echo signal for target characterisation
-
- G—PHYSICS
- G01—MEASURING; TESTING
- G01S—RADIO DIRECTION-FINDING; RADIO NAVIGATION; DETERMINING DISTANCE OR VELOCITY BY USE OF RADIO WAVES; LOCATING OR PRESENCE-DETECTING BY USE OF THE REFLECTION OR RERADIATION OF RADIO WAVES; ANALOGOUS ARRANGEMENTS USING OTHER WAVES
- G01S7/00—Details of systems according to groups G01S13/00, G01S15/00, G01S17/00
- G01S7/52—Details of systems according to groups G01S13/00, G01S15/00, G01S17/00 of systems according to group G01S15/00
- G01S7/52017—Details of systems according to groups G01S13/00, G01S15/00, G01S17/00 of systems according to group G01S15/00 particularly adapted to short-range imaging
- G01S7/52053—Display arrangements
- G01S7/52057—Cathode ray tube displays
- G01S7/52074—Composite displays, e.g. split-screen displays; Combination of multiple images or of images and alphanumeric tabular information
-
- A—HUMAN NECESSITIES
- A61—MEDICAL OR VETERINARY SCIENCE; HYGIENE
- A61B—DIAGNOSIS; SURGERY; IDENTIFICATION
- A61B8/00—Diagnosis using ultrasonic, sonic or infrasonic waves
- A61B8/13—Tomography
- A61B8/14—Echo-tomography
Abstract
Description
- The present invention relates to an ultrasound diagnosis apparatus configured to generate an ultrasound image based on an ultrasound signal obtained by an ultrasound probe that transmits ultrasound to a subject and receives the ultrasound reflected from the subject. The present invention also relates to a method for operating the ultrasound diagnosis apparatus, and a program for operating the ultrasound diagnosis apparatus.
- In an ultrasound diagnosis apparatus that generates an ultrasound image based on an ultrasound signal obtained by an ultrasound probe that transmits ultrasound to a subject and receives the ultrasound reflected from the subject, there is a known technique of calculating an attenuation rate of the ultrasound inside the subject (for example, refer to Patent Literature 1). In this technique, a Gaussian pulse is transmitted from an ultrasound probe to a subject, and along with this, performs quadrature detection onto a reception signal output from the ultrasound probe to obtain a phase φ(t) indicating a phase of an ultrasound echo, so as to obtain second-order differential value d2φ/dt2 for time t from which a speckle component has been removed. In
Patent Literature 1, an attenuation rate α is calculated using arelational equation 
Patent Literature 1 merely describes acquisition of the sound velocity v using another technique and does not disclose details of the technique. - There is a known ultrasound diagnosis apparatus that differentiates a noise region as a low S/N region and displays this information on the low S/N region with an attenuation image as an image based on the attenuation rate (for example, refer to Patent Literature 2). This technique stops transmission of ultrasound under a condition equal to a case of transmitting and receiving an ultrasound signal having a center frequency of 4 MHz and generates a noise image based on a noise signal received from individual positions of the subject. During the examination, brightness of the noise image is compared with brightness of a B-mode image with 4 MHz, a pixel having the same brightness is extracted as a low S/N region, and then, information on the pixel on this low S/N region and the attenuation image generated separately are displayed on a monitor.
-
- Patent Literature 1:
JP 2010-82230 A - Patent Literature 2:
JP 2013-5876 A -
Patent Literature 1 discloses a technique of obtaining sound velocity with another method. With this, however, it is generally difficult to correctly obtain the sound velocity differing according to individual transmission path of the ultrasound. Accordingly, calculating the attenuation rate accurately using Formula (1) is considered to be difficult. - In another respect, Formula (1) assumes the transmission waveform of the Gaussian pulse. However, even with considerable modifications on a dumper, or the like, of the ultrasound transducer, the transmission waveform typically includes tailing. Therefore, it may not be appropriate to assume the transmission waveform of the Gaussian pulse, and accordingly, it is difficult to assure capability to calculate the attenuation rate accurately in calculating the attenuation rate from Formula (1). Moreover, although
Patent Literature 1 describes it is allowable to transmit ultrasound having transmission waveform of other than the Gaussian pulse to the subject,Patent Literature 1 does not disclose a specific calculation method of the attenuation rate in that case. - The technique described in
Patent Literature 1 includes, in a process to derive Formula (1), removal of a speckle component as a noise component, by employing a center value in a region of interest on a tomographic plane, or by dividing the tomographic plane into a speckle region and non-speckle region. In implementing this technique, however, it is necessary to manually specify a region within an image, such as a region of interest and a speckle region, leading to complicated processing.Patent Literature 1 does not provide specific description about a configuration nor working effects of removing the speckle component with a second-order phase difference, which includes a number of questions for persons skilled in the art. - As described above, with the technique described in
Patent Literature 1, it is difficult to calculate the attenuation rate of the ultrasound accurately and easily. - Next, a problem included in the technique described in
Patent Literature 2 will be described. In the technique described inPatent Literature 2, acenter frequency 4 MHz is given as a transmission/reception condition. The transmission waveform of an ultrasound diagnosis apparatus usually includes components surrounding the center frequency. In particular, to improve distance resolution, it is necessary to increase the transmission/reception band so as to reduce pulse width.
In this case, S/N is not necessarily high enough in all frequency components within the transmission/reception band. Therefore, with the technique described inPatent Literature 2, the use of a frequency component with insufficient S/N might reduce calculation accuracy of the attenuation rate, leading to lower reliability of an image based on the attenuation rate. - The present invention has been made in view of the foregoing and an object of the present invention is to provide an ultrasound diagnosis apparatus, a method for operating the ultrasound diagnosis apparatus, and a program for operating the ultrasound diagnosis apparatus that are capable of calculating an attenuation rate of ultrasound accurately and easily, and enhancing reliability of images based on the attenuation rate.
- In order to solve the above described problems and achieve the object, an ultrasound diagnosis apparatus according to the invention is configured to generate an ultrasound image based on an ultrasound signal obtained by an ultrasound probe having an ultrasound transducer that transmits ultrasound to a subject and receives the ultrasound reflected from the subject. The ultrasound diagnosis apparatus includes: a frequency analysis unit configured to analyze a frequency of the ultrasound signal to calculate a frequency spectrum of the ultrasound signal for each reception depth; a change rate calculation unit configured to calculate, in a predetermined order, a distance change rate and a frequency change rate in the frequency spectrum calculated by the frequency analysis unit or in a function defined by using the frequency spectrum, thereby to calculate a second-order change rate of the frequency spectrum or of the function; and an attenuation rate estimation unit configured to estimate an attenuation rate of the ultrasound signal, per unit distance and per unit frequency, in a predetermined region within a scanning region of the ultrasound transducer using the second-order change rate calculated by the change rate calculation unit.
- The ultrasound diagnosis apparatus according to the above-described invention further includes: a noise level data storage unit configured to store noise level data in accordance with a frequency and a reception depth; and a band setting unit configured to compare the noise level data stored in the noise level data storage unit with data of the frequency spectrum, thereby to set a frequency band of the frequency spectrum for calculation by the change rate calculation unit. The change rate calculation unit is configured to calculate the frequency change rate in the frequency band set by the band setting unit.
- In the ultrasound diagnosis apparatus according to the above-described invention, the band setting unit is configured to compare the data of the frequency spectrum with the noise level data, at a same frequency, thereby to extract a noise frequency band that is a band of a frequency corresponding to noise, and is configured to exclude the noise frequency band to set the frequency band.
- In the ultrasound diagnosis apparatus according to the above-described invention, the band setting unit is configured to extract, as the noise frequency band, a frequency band higher than a predetermined frequency.
- In the ultrasound diagnosis apparatus according to the above-described invention, the band setting unit is configured to extract, as the noise frequency band, a region in which a value of the data of the frequency spectrum is equal to or less than a threshold.
- In the ultrasound diagnosis apparatus according to the above-described invention, the threshold is a value equal to or higher than the noise level data.
- In the ultrasound diagnosis apparatus according to the above-described invention, the change rate calculation unit is configured to calculate the second-order change rate for each of sound rays of the ultrasound, and the attenuation rate estimation unit is configured to calculate an attenuation rate for each of the sound rays using the second-order change rate for each of the sound rays, and is configured to calculate statistics of the attenuation rate for each of all the sound rays in the scanning region to estimate the attenuation rate.
- In the ultrasound diagnosis apparatus according to the above-described invention, the change rate calculation unit is configured to: perform, in the frequency band, regression analysis using a frequency as a variable, on a function defined by a difference between the frequency spectrum and the frequency spectrum at a reference reception depth, thereby to calculate a regression line; perform second regression analysis on a slope of the regression line using a reciprocating distance between the ultrasound transducer and the subject as a variable, thereby to calculate a second regression line; and determine a slope of the second regression line as the second-order change rate.
- In the ultrasound diagnosis apparatus according to the above-described invention, the change rate calculation unit is configured to: perform regression analysis using a reciprocating distance between the ultrasound transducer and the subject as a variable, on the frequency spectrum in a distance section defined per frequency based on the frequency band, thereby to calculate a regression line; perform second regression analysis on a slope of the regression line using a frequency as a variable, thereby to calculate a second regression line; and determine a slope of the second regression line as the second-order change rate.
- The ultrasound diagnosis apparatus according to the above-described invention further includes: a B-mode image data generation unit configured to generate B-mode image data as the ultrasound image displayed by converting amplitude of the ultrasound signal into brightness; and a combined image data generation unit configured to generate combined image data using information on the attenuation rate estimated by the attenuation rate estimation unit and using the B-mode image data generated by the B-mode image data generation unit.
- In the ultrasound diagnosis apparatus according to the above-described invention, the attenuation rate estimation unit is configured to calculate statistics of an attenuation rate for each of a plurality of partial regions obtained by dividing the scanning region to estimate the attenuation rate of each of the partial regions, and the ultrasound diagnosis apparatus further includes an attenuation rate map data generation unit configured to attach visual information in accordance with a value of the attenuation rate of each of the partial regions to generate attenuation rate map data.
- The ultrasound diagnosis apparatus according to the above-described invention further includes: a B-mode image data generation unit configured to generate B-mode image data as the ultrasound image displayed by converting amplitude of the ultrasound signal into brightness; and a combined image data generation unit configured to generate combined image data using the attenuation rate map data generated by the attenuation rate map data generation unit and using the B-mode image data generated by the B-mode image data generation unit.
- In the ultrasound diagnosis apparatus according to the above-described invention, the noise level data storage unit stores the noise level data corresponding to the ultrasound transducer included in the ultrasound probe that is connectable to the ultrasound diagnosis apparatus.
- A method for operating an ultrasound diagnosis apparatus according to the invention is provided. The ultrasound diagnosis apparatus is configured to generate an ultrasound image based on an ultrasound signal obtained by an ultrasound probe having an ultrasound transducer that transmits ultrasound to a subject and receives the ultrasound reflected from the subject. The method includes: a frequency analysis step of, by a frequency analysis unit, analyzing a frequency of the ultrasound signal to calculate a frequency spectrum of the ultrasound signal for each reception depth; a change rate calculation step of, by a change rate calculation unit, calculating, in a predetermined order, a distance change rate and a frequency change rate in the frequency spectrum or in a function defined by using the frequency spectrum, thereby calculating a second-order change rate of the frequency spectrum or of the function; and an attenuation rate estimation step of, by an attenuation rate estimation unit, estimating an attenuation rate of the ultrasound signal, per unit distance and per unit frequency, in a predetermined region within a scanning region of the ultrasound transducer using the second-order change rate.
- A program for operating an ultrasound diagnosis apparatus according to the invention is provided. The ultrasound diagnosis apparatus is configured to generate an ultrasound image based on an ultrasound signal obtained by an ultrasound probe having an ultrasound transducer that transmits ultrasound to a subject and receives the ultrasound reflected from the subject. The program causes the ultrasound diagnosis apparatus to execute: a frequency analysis step of, by a frequency analysis unit, analyzing a frequency of the ultrasound signal to calculate a frequency spectrum of the ultrasound signal for each reception depth; a change rate calculation step of, by a change rate calculation unit, calculating, in a predetermined order, a distance change rate and a frequency change rate in the frequency spectrum or in a function defined by using the frequency spectrum, thereby calculating a second-order change rate of the frequency spectrum or of the function; and an attenuation rate estimation step of, by an attenuation rate estimation unit, estimating an attenuation rate of the ultrasound signal, per unit distance and per unit frequency, in a predetermined region within a scanning region of the ultrasound transducer using the second-order change rate.
- According to the present invention, it is possible to calculate an attenuation rate of ultrasound accurately and easily and to enhance reliability of images based on the attenuation rate.
-
-
FIG. 1 is a block diagram illustrating a functional configuration of an ultrasound diagnosis system equipped with an ultrasound diagnosis apparatus according to a first embodiment of the present invention. -
FIG. 2 is a diagram schematically illustrating noise level data stored in a noise level data storage unit included in the ultrasound diagnosis apparatus according to the first embodiment of the present invention. -
FIG. 3 is a diagram illustrating a relationship between a reception depth and an amplification factor in amplification processing performed by a signal amplification unit included in the ultrasound diagnosis apparatus according to the first embodiment of the present invention. -
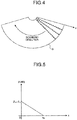
FIG. 4 is a diagram schematically illustrating a scanning region of an ultrasound transducer, and reception data for B-mode. -
FIG. 5 is a diagram illustrating a relationship between a reception depth and an amplification factor in amplification correction processing performed by an amplification correction unit included in the ultrasound diagnosis apparatus according to the first embodiment of the present invention. -
FIG. 6 is a diagram schematically illustrating data arrangement of a sound ray of an ultrasound signal. -
FIG. 7 is a diagram schematically illustrating a data string of a frequency spectrum. -
FIG. 8 is a diagram illustrating exemplary data of a frequency spectrum. -
FIG. 9 is a diagram illustrating a relationship between data of a frequency spectrum and noise level data. -
FIG. 10 is a diagram schematically illustrating frequency spectrum data that visually express a frequency band as a regression analysis target set by a band setting unit included in the ultrasound diagnosis apparatus according to the first embodiment of the present invention. -
FIG. 11 is a diagram illustrating typical distance functions and a regression line for each of the functions. -
FIG. 12 is a diagram illustrating a relationship between a slope of the regression line and a distance. -
FIG. 13 is a flowchart illustrating outline of processing executed by the ultrasound diagnosis apparatus according to the first embodiment of the present invention. -
FIG. 14 is a diagram illustrating exemplary display of a combined image displayed on a display device. -
FIG. 15 is a flowchart illustrating outline of frequency analysis processing executed by the ultrasound diagnosis apparatus according to the first embodiment of the present invention. -
FIG. 16 is a diagram illustrating a relationship between data of a frequency spectrum with a constant frequency, and the distance. -
FIG. 17 is a diagram illustrating a relationship between a slope of a regression line for the data of frequency spectrum, and the frequency. -
FIG. 18 is a block diagram illustrating a functional configuration of an ultrasound diagnosis system according to a third embodiment of the present invention. -
FIG. 19 is a flowchart illustrating outline of processing executed by an ultrasound diagnosis apparatus according to the third embodiment of the present invention. -
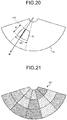
FIG. 20 is a diagram illustrating an exemplary setting of a partial region in a scanning region of an ultrasound transducer. -
FIG. 21 is diagram illustrating exemplary display of a combined image with attenuation rate map data displayed on the display device. - Hereinafter, modes for carrying out the present invention (hereinafter, referred to as embodiment(s)) will be described with reference to the attached drawings.
-
FIG. 1 is a block diagram illustrating a functional configuration of an ultrasound diagnosis system equipped with an ultrasound diagnosis apparatus according to a first embodiment of the present invention. Anultrasound diagnosis system 1 illustrated inFIG. 1 includes anultrasound endoscope 2, anultrasound diagnosis apparatus 3, and adisplay device 4. Theultrasound endoscope 2 transmits ultrasound to a subject and receives the ultrasound reflected from the subject. Theultrasound diagnosis apparatus 3 generates an ultrasound image based on an ultrasound signal obtained by theultrasound endoscope 2. Thedisplay device 4 displays the ultrasound image generated by theultrasound diagnosis apparatus 3. - The
ultrasound endoscope 2 includes, on its distal end, anultrasound transducer 21. Theultrasound transducer 21 converts an electrical pulse signal received from theultrasound diagnosis apparatus 3 into an ultrasound pulse (acoustic pulse) and emits it to the subject. Theultrasound transducer 21 also converts an ultrasound echo reflected from the subject into an electrical echo signal expressed by a voltage change and outputs the signal. Theultrasound endoscope 2 may cause theultrasound transducer 21 to perform mechanical scan, or may provide, as theultrasound transducer 21, a plurality of elements in an array, and may cause the ultrasound transducer to perform electronic scan by electronically switching elements related to transmission/reception or imposing delay onto transmission/reception of each of elements. - The
ultrasound endoscope 2 typically includes imaging optics and imaging elements. Theultrasound endoscope 2 can be inserted into gastrointestinal tracts (esophagus, stomach, duodenum, and large intestine) or respiratory organs (trachea, bronchus) of the subject and can image gastrointestinal tract, respiratory organs, and their surrounding organs (pancreas, gall bladder, bile duct, biliary tract, lymph nodes, mediastinal organs, blood vessels, or the like). Theultrasound endoscope 2 includes a light guide that guides illumination light emitted to the subject at the time of imaging. The light guide is configured such that a distal end portion thereof reaches a distal end of an insertion portion of theultrasound endoscope 2 into the subject, while a proximal end thereof is connected to a light source device that generates illumination light. - The
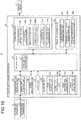
ultrasound diagnosis apparatus 3 includes acontrol unit 31, astorage unit 32, a transmitting and receivingunit 33, asignal processing unit 34, acomputing unit 35, animage processing unit 36, and aninput unit 37. Thecontrol unit 31 controls the overallultrasound diagnosis system 1. Thestorage unit 32 stores various types of information needed for operation of theultrasound diagnosis apparatus 3. The transmitting and receivingunit 33 is electrically connected with theultrasound endoscope 2, transmits a transmission signal (pulse signal) formed with a high-voltage pulse to theultrasound transducer 21 based on a predetermined waveform and transmission timing, and together with this, receives an echo signal, namely, an electrical reception signal, from theultrasound transducer 21, generates digital radio frequency (RF) signal data (hereinafter, referred to as RF data), and outputs the generated data. Thesignal processing unit 34 generates digital reception data for B-mode based on the RF data received from the transmitting and receivingunit 33. Thecomputing unit 35 performs predetermined calculation on the RF data received from the transmitting and receivingunit 33. Theimage processing unit 36 generates various image data. Theinput unit 37 includes a user interface such as a keyboard, a mouse, and a touch panel, and receives input of various types of information. - The
control unit 31 includes a type identification unit 311 configured to determine the type of theultrasound endoscope 2 connected to theultrasound diagnosis apparatus 3. The type identification unit 311 identifies the type of theultrasound transducer 21 by obtaining ID stored in a memory inside theultrasound endoscope 2 connected to theultrasound diagnosis apparatus 3. Information related to the type of theultrasound transducer 21 identified by the type identification unit 311 is stored in a typeinformation storage unit 321 of thestorage unit 32, described below. The type identification unit 311 may be configured to identify the type of theultrasound transducer 21 based on the type name of theultrasound endoscope 2 on which theinput unit 37 has received input. - The
control unit 31 includes a central processing unit (CPU) having calculation and control functions, various calculation circuits, or the like. Thecontrol unit 31 integrally controls theultrasound diagnosis apparatus 3 by reading information stored in thestorage unit 32 and various programs including an operation program of theultrasound diagnosis apparatus 3, from thestorage unit 32, and executing various types of calculation processing related to an operation method of theultrasound diagnosis apparatus 3. - The
storage unit 32 includes a typeinformation storage unit 321, a noise leveldata storage unit 322, and a bandinformation storage unit 323. The typeinformation storage unit 321 stores type information of theultrasound transducer 21, identified by the type identification unit 311. The noise leveldata storage unit 322 stores noise level data for individual types of theultrasound transducer 21 connectable to theultrasound diagnosis apparatus 3. The bandinformation storage unit 323 stores frequency band information as a target of regression analysis performed by thecomputing unit 35, for individual types of theultrasound transducer 21 connectable to theultrasound diagnosis apparatus 3. -
FIG. 2 is a diagram schematically illustrating noise level data stored in the noise leveldata storage unit 322. InFIG. 2 , a curved surface indicated by dots provides noise level data n(f, L). The noise level data n(f, L) is a function having a frequency f of the ultrasound echo, and a reciprocating distance L (a distance being twice the reception depth) between a surface of theultrasound transducer 21 and the subject (reflector) as discrete variables. The noise level data n(f, L) are discrete digital data expressed, for example, in decibel value (dB) obtained by dividing a voltage V corresponding to the noise by a reference voltage Vc and then taking a common logarithm of this amount. Hereinafter, the reciprocating distance L between the surface of theultrasound transducer 21 and the subject will be referred to simply as a distance L, in some cases. - The noise level
data storage unit 322 stores noise level data for individual types of theultrasound transducer 21 connectable to theultrasound diagnosis apparatus 3. The noise level data are, for example, preliminary measured and stored for individual types of theultrasound transducer 21 as factory presets. It is also allowable to store, as noise level data, echo signals received when transmission by the transmitting and receivingunit 33 is stopped. In this case, it is possible to obtain more specific noise level data that account for not only the type of theultrasound transducer 21 but also individual variation in theultrasound transducer 21 of a same type and the noise level difference within a same subject due to a change over time. - The band
information storage unit 323 stores, as band information as a regression analysis target by thecomputing unit 35, information related to a minimum value fmin and a maximum value fmax of the frequency band for individual types of theultrasound transducer 21 connectable to theultrasound diagnosis apparatus 3. Similarly to the noise level data, the band information is preliminary measured and stored for individual types of theultrasound transducer 21, as factory presets. - In addition to the above, the
storage unit 32 also stores information needed for various types of processing performed by the transmitting and receivingunit 33, thesignal processing unit 34, and thecomputing unit 35. - The
storage unit 32 stores various programs including an operation program for executing an operation method of theultrasound diagnosis apparatus 3. The various programs can be recorded in a computer-readable recording medium such as a hard disk, flash memory, CD-ROM, DVD-ROM, flexible disk, or the like, and can be distributed broadly. It is also possible to obtain the above-described various programs by downloading them via a communication network. Herein, the communication network refers to one implemented by, for example, a known public network, a local area network (LAN), a wide area network (WAN), regardless of wired or wireless. - The
storage unit 32 with the above-described configuration is implemented using a read only memory (ROM) in which various programs are pre-installed, a random access memory (RAM) storing calculation parameters and data for individual processing, a hard disk drive (HDD), or the like. - The transmitting and receiving
unit 33 includes asignal amplification unit 331 that amplifies an echo signal. Thesignal amplification unit 331 performs sensitivity time control (STC) correction that amplifies an echo signal having a larger reception depth by using a higher amplification factor.FIG. 3 is a diagram illustrating a relationship between a reception depth and an amplification factor in amplification processing performed by thesignal amplification unit 331. A reception depth z illustrated inFIG. 3 is an amount calculated based on elapsed time from a point of starting reception of ultrasound. As illustrated inFIG. 3 , in a case where the reception depth z is smaller than a threshold zth, an amplification factor β (dB) increases linearly along with an increase in the reception depth z from β0 to βth (> β0). In a case where the reception depth z is equal to or higher than the threshold zth, the amplification factor β (dB) takes a constant value βth. The value of the threshold zth is a value at which an ultrasound signal received from the subject is nearly completely attenuated and noise is dominant. More typically, in a case where the reception depth z is smaller than the threshold zth, the amplification factor β may preferably increase monotonically along with an increase in the reception depth z. The relationship illustrated inFIG. 3 is pre-stored in thestorage unit 32. - The transmitting and receiving
unit 33 performs processing such as filtering on the echo signal amplified by thesignal amplification unit 331, thereafter, generates RF data of time domain by performing A/D conversion on the signal, and outputs the RF data to thesignal processing unit 34 and thecomputing unit 35. In a case where theultrasound endoscope 2 is configured to perform scanning electronically with theultrasound transducer 21 having a plurality of elements arranged in array, the transmitting and receivingunit 33 includes a beam- combining multichannel circuit corresponding to the plurality of elements. - The frequency band of the pulse signal transmitted by the transmitting and receiving
unit 33 is preferably a broadband substantially covering a linear response frequency band for electroacoustic conversion from pulse signals to ultrasound pulses on theultrasound transducer 21. With this configuration, it is possible to perform accurate approximation in approximation processing of a frequency spectrum described below. - The transmitting and receiving
unit 33 has a function of transmitting various control signals output by thecontrol unit 31, to theultrasound endoscope 2, and together with this, has a function of receiving various types of information including identification ID from theultrasound endoscope 2 and transmitting the information to thecontrol unit 31. - The
signal processing unit 34 performs known processing such as a band-pass filter, envelope detection, logarithmic transformation, on the RF data, and generates digital reception data for B-mode. In logarithmic transformation, a value is represented in decibel value by dividing RF data by the reference voltage Vc and then taking a common logarithm of this amount. In the reception data for B-mode, amplitude or intensity of the reception signal indicating intensity of ultrasound pulse reflection is arranged along the transmission-reception direction (depth direction).FIG. 4 is a diagram schematically illustrating a scanning region of the ultrasound transducer 21 (hereinafter, also referred to simply as a scanning region) and reception data for B-mode. A scanning region S illustrated inFIG. 4 is fan-shaped. This corresponds to a case where theultrasound transducer 21 is a convex transducer. InFIG. 4 , the reception depth of the reception data for B-mode is illustrated as z. In a case where the ultrasound pulse emitted from the surface of theultrasound transducer 21 is reflected from a reflector that is in the reception depth z and returned to theultrasound transducer 21 as an ultrasound echo, there is a relationship of z = L/2 as described above between the reciprocating distance L and the reception depth z. Thesignal processing unit 34 outputs generated reception data for B-mode to a B-mode imagedata generation unit 361 of theimage processing unit 36. Thesignal processing unit 34 is realized by a central processing unit (CPU), circuits for various types of calculation, or the like. - The
computing unit 35 includes anamplification correction unit 351, afrequency analysis unit 352, aband setting unit 353, a changerate calculation unit 354, and an attenuationrate estimation unit 355. Theamplification correction unit 351 performs amplification correction on the RF data output by the transmitting and receivingunit 33 such that an amplification factor is constant regardless of the reception depth. Thefrequency analysis unit 352 calculates a frequency spectrum for each of the reception depths, by performing frequency analysis with fast Fourier transform (FFT) performed on the amplification-corrected RF data. Theband setting unit 353 sets a frequency band as a calculation target by comparing noise level data with frequency spectrum data. The changerate calculation unit 354 calculates a second-order change rate by calculating, with a predetermined order, a distance change rate and a frequency change rate in a function defined by the frequency spectrum calculated by thefrequency analysis unit 352. The attenuationrate estimation unit 355 estimates an attenuation rate per unit distance and per unit frequency, of the ultrasound pulse in a scanning region using the second-order change rate calculated by the changerate calculation unit 354. Thecomputing unit 35 includes a CPU and circuits for various types of calculation. Thecomputing unit 35 can be configured with a CPU, or the like, shared with thecontrol unit 31 and thesignal processing unit 34. -
FIG. 5 is a diagram illustrating a relationship between a reception depth and an amplification factor in amplification correction processing performed by theamplification correction unit 351. As illustrated inFIG. 5 , the amplification factor β (dB) in amplification processing performed by theamplification correction unit 351 takes a maximum value βth - β0 when the reception depth z is zero, decreases linearly with the change in the reception depth z from zero until reaching the threshold zth, and takes zero when the reception depth z is equal to or higher than the threshold zth. The relationship illustrated inFIG. 5 is pre-stored in thestorage unit 32. By amplification correction performed by theamplification correction unit 351 on the RF data based on the relationship illustrated inFIG. 5 , it is possible to offset the effect of STC correction on thesignal amplification unit 331 and to output a signal with a constant amplification factor βth. The relationship between the reception depth z and the amplification factor β in the amplification correction processing performed by theamplification correction unit 351 understandably differs depending upon the relationship between the reception depth and the amplification factor in the amplification correction processing performed by thesignal amplification unit 331. - A reason for performing such amplification correction will be described. The STC correction is correction processing to exclude the effect of attenuation from amplitude of an analog signal waveform, by amplifying the amplitude of the analog signal waveform uniformly across an overall frequency band, with an amplification factor monotonically increasing with respect to the increase in the reception depth. Accordingly, in the case of generating a B-mode image in which amplitude of an echo signal is converted into brightness and displayed and in the case of scanning a uniform tissue, performing STC correction produces a constant brightness value regardless of depth. That is, it is possible to exclude the effect of attenuation from the brightness value of the B-mode image. Meanwhile, by utilizing a result of calculation and analysis of the frequency spectrum of the ultrasound, as in the first embodiment, it is difficult, even with the STC correction, to accurately exclude the effect of attenuation along with propagation of the ultrasound. The reason is that the attenuation differs depending on the frequency but the amplification factor of STC correction changes only for the distance, namely, takes a constant value for the frequency without any change.
- In order to solve the above-described situation, namely the situation that, when utilizing a result of calculation and analysis of the frequency spectrum of the ultrasound, it is difficult, even with the STC correction, to accurately exclude the effect of attenuation along with the propagation of the ultrasound, one possibility may be that, while an STC-corrected reception signal is output in generating a B-mode image, a reception signal that has not undergone STC correction would be output, by performing new transmission besides the transmission to generate a B-mode image, in generating an image based on the frequency spectrum. In this case, however, the frame rate of image data generated based on the reception signal may be reduced.
- In order to cope with this situation, the first embodiment performs correction of amplification factor, on the STC-corrected signal for B-mode image, by the
amplification correction unit 351, in order to exclude the effect of STC correction, while maintaining frame rate of the image data to be generated. - The
frequency analysis unit 352 generates sample data by sampling, in a predetermined time interval, RF data (line data) of individual sound rays amplification-corrected by theamplification correction unit 351. Subsequently, thefrequency analysis unit 352 performs FFT processing on the sample data group, thereby calculating frequency spectrum on a plurality of locations (data positions) on the RF data. -
FIG. 6 is a diagram schematically illustrating data arrangement of a sound ray of an ultrasound signal. In a sound ray SRk illustrated inFIG. 6 , a white or black rectangle indicates data on one sample point. The data positioned at the more right direction of the sound ray SRk indicates sample data that is obtained from a deeper position in a case where measurement is performed from theultrasound transducer 21 along the sound ray SRk (refer to arrows inFIG. 6 ). The sound ray SRk is discretized with a time interval corresponding to a sampling frequency (e.g. 50 MHz) in A/D conversion performed by the transmitting and receivingunit 33.FIG. 6 illustrates a case where an eighth data position of the sound ray SRk with the number k is set as an initial value Z(k) 0 in the reception depth z direction. It is however allowable to set the position of the initial value arbitrarily. A result of calculation by thefrequency analysis unit 352 is obtained as a complex number and stored in thestorage unit 32. - A data group Fj (j = 1, 2, ..., K) illustrated in
FIG. 6 is a sample data group as a target of FFT processing. In general, in order to perform FFT processing, it is necessary that the sample data group has the number of data that is power of two. In this sense, while the sample data group Fj (j = 1, 2, ..., K-1) has the number of data of 16 (= 24), indicating it is a normal data group, the sample data group FK has the number of data of 12, indicating it is an abnormal data group. When FFT processing is performed on an abnormal data group, processing of generating a normal sample data group is performed by inserting zero data to cover the shortfall. This issue will be described in detail below, in the explanation of processing of the frequency analysis unit 352 (refer toFIG. 15 ). - The
frequency analysis unit 352 generates a frequency component V(f, L) of a voltage amplitude by performing FFT processing on each of sample data groups removed from the RF data. The frequency component V(f, L) of the voltage amplitude is frequency density of the voltage. Furthermore, thefrequency analysis unit 352 divides the frequency component V(f, L) of the voltage amplitude by the reference voltage Vc, and then, performs logarithmic transformation processing, namely, takes a common logarithm (log) and expresses it in a decibel unit. Thefrequency analysis unit 352 then multiplies the data with a suitable constant A, generates frequency spectrum data (hereinafter, also referred to as spectrum data) F(f, L) given by the next Formula (2), and outputs the generated data to theband setting unit 353.
- Herein, log represents common logarithm (hereinafter, the same will be applied).
- The spectrum data F(f, L) are a component of a frequency f of a sample data group.
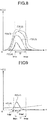
FIG. 7 is a diagram schematically illustrating a data string of the spectrum data stored in thestorage unit 32. InFIG. 7 , the vertical direction represents the frequency f, and the horizontal direction represents a reciprocating distance L from the surface of theultrasound transducer 21. The frequency f takesdiscrete values 0, Δf, 2Δf, .... For example, in a cell ofcolumn 0, spectrum data F(f, 0) obtained from Formula (2) based on the sample data group removed in thedistance section 0 ≤ L < ΔL are stored. In a cell of column ΔL, spectrum data F(f, ΔL) obtained from Formula (2) based on the sample data group removed at the section ΔL ≤ L < 2ΔL of the distance L. InFIG. 7 , only the spectrum data F(Δf, ΔL) are exemplified in cells of frequency Δf, and distance ΔL. In practice, however, it is obvious that spectrum data corresponding to the frequency and distance of each of the cells are stored in all the cells. An exemplary length ΔL (corresponding to step size D of sample data group inFIG. 6 ) of the section removed as the sample data group is about 1.0 cm. An exemplary amount of change Δf in the frequency is 0.5 MHz. -
FIG. 8 is a diagram illustrating exemplary spectrum data.FIG. 8 illustrates a relationship between each of the spectrum data F(f, L1), F(f, L2), F(f, L3), and F(f, L4) on four mutually different distances, and the frequency f. The four distances L1, L2, L3, and L4 are constants satisfying 0 < L1 < L2 < L3 < L4. Although more spectrum data F(f, L) are calculated in practice as it is clear fromFIG. 7 ,FIG. 8 exemplifies four representative spectrum data alone. As illustrated inFIG. 8 , the spectrum data F(f, L) decreases as the distance L increases. The average frequency of the spectrum data F(f, L) shifts to the low-frequency side as the distance L increases. This is due to the effect of attenuation that depends on the frequency when the ultrasound propagates inside the subject. - In general, the spectrum data F(f, L) indicate different tendencies depending on attributes of the tissue that has undergone ultrasound scanning. This is because the spectrum data F(f, L) has a correlation with the size, number density, acoustic impedance, or the like, of a scatterer that scatters the ultrasound. Herein, exemplary "attributes" include malignant tumor tissues, benign tumor tissues, endocrine tumor tissues, mucinous tumor tissues, normal tissues, cysts, and vessels.
- The
band setting unit 353 includes acomparison unit 353a configured to compare the spectrum data F(f, L) with the noise level data n(f, L). To compare the above-described two types of data, thecomparison unit 353a reads frequencies fmin and fmax at both ends of a frequency band U = {f|fmin ≤ f ≤ fmax}, as a target of regression analysis described below, from the bandinformation storage unit 323, according to theultrasound transducer 21 connected to theultrasound diagnosis apparatus 3. The frequency band U corresponds to a relatively flat section on a transmission waveform of the ultrasound on a surface (L = 0) of theultrasound transducer 21, and each of the minimum value fmin and the maximum value fmax varies according to the type ofultrasound transducer 21. - On the frequency band U read from the band
information storage unit 323, thecomparison unit 353a compares the spectrum data F(f, L) with the noise level data n(f, L), per frequency f, and per distance L. In comparison of four spectrum data F(f, Lp) (p = 1, 2, 3, and 4) illustrated inFIG. 8 with corresponding noise level data n(f, Lp), assumption can be made, for example, such that, F(f, Lp) > n(f, Lp) is established at an arbitrary frequency f included in the frequency band U when p = 1, 2, and 3, whereas the following two inequalities are established in the frequency band U when p = 4.

-
FIG. 9 is a diagram illustrating a relationship between the spectrum data F(f, L4) and the noise level data n(f, L4). In the case illustrated inFIG. 9 , F(f, L4) ≤ n(f, L4) is established in two frequency bands f ≤ fmin', and f ≥ fmax', with the noise level data being dominant. Hereinafter, the frequency band in which the noise level data is dominant as in these two frequency bands will be referred to as a noise frequency band. As illustrated inFIG. 9 , among the frequency fmin' and fmax', the one included in the frequency band U is fmax'. - The
band setting unit 353 sets a frequency band as a regression analysis target based on a result of comparison by thecomparison unit 353a. In the cases illustrated inFIGS. 8 and 9 , theband setting unit 353 sets a regression analysis target for the distance Lp (p = 1, 2, and 3) as an initial frequency band U, and together with this, sets a frequency band of the regression analysis target with the distance L = L4 as U' = {f|fmin ≤ f < fmax'}, then, outputs the frequency band information to the attenuationrate estimation unit 355. -
FIG. 10 is a diagram schematically illustrating a data string of the spectrum data that visually expresses a frequency band as a regression analysis target set by theband setting unit 353. InFIG. 10 , description of the spectrum data F(f, L) of each of the cells is omitted. InFIG. 10 , any of three different patterns is attached to the cell depending on the type of the spectrum data F(f, L). The spectrum data F(f, L) stored in a while cell indicate that the frequency f is included in the frequency band U and that the data has a value that satisfies F(f, L) > n(f, L). The spectrum data F(f, L) stored in a hatched cell indicate that the frequency f is outside the frequency band U and that the data has a value that satisfies F(f, L) > n(f, L). Furthermore, the spectrum data F(f, L) stored in a dotted cell indicate that the frequency f is outside the frequency band U and that the data has a value that satisfies F(f, L) ≤ n(f, L). As described above, the frequency band at the distance L = Lp (p = 1, 2, and 3) is U and the frequency band at the distance L = L4 is U'. Lmax(fp) (p = 1, 2, 3, and 4) illustrated inFIG. 10 will be described below. - The change
rate calculation unit 354 sequentially calculates, in an order from frequency to distance, a change rate, being a number defined by the spectrum data F(f, L), for the frequency f and the distance L with respect to a linear function of the frequency f, namely, function ψ(f, L) = F(f, L) - F(f, 0). - The attenuation
rate estimation unit 355 estimates an attenuation rate per unit distance and per unit frequency, of the ultrasound pulse on a scanning region using the second-order change rate calculated by the changerate calculation unit 354. - Processing performed by the change
rate calculation unit 354 and the attenuationrate estimation unit 355 will be described in detail. First, a method of estimating the attenuation rate per unit distance and per unit frequency, of the spectrum data F(f, L), will be described. It is known that an acoustic pressure amplitude P(f, L) at the frequency f, of the ultrasound from the reflector existing at a distance L can be given by
- using a positive constant µ. Since µfL > 0 is established, Formula (3) indicates that the acoustic pressure amplitude P(f, L) attenuates exponentially to an increase in the frequency f and the distance L.
- If an ultrasound attenuation at a frequency f in the distance section from L to L + ΔL is denoted by Loss(f, L) [dB], the attenuation is defined by


- Note that the relationship between the above-described constant µ and the attenuation rate ζ will be given as follows. By substituting Formula (3) into P(f, L) of Formula (5), the attenuation rate ζ is given by

- In obtaining y(f) having sensitivity of the
ultrasound transducer 21 as a function of the frequency f, an amplitude component V(f, L) after completion of FFT processing on the RF data, is given by the following Formula (7).
- By substituting Formula (3) into P(f, L) of Formula (7),

- By substituting Formula (8) in Formula (2),


- By causing second order partial differential operators ∂2/∂L∂f and ∂2/∂f∂L to act on both sides of Formula (10), respectively, the following formula will be obtained.

- Accordingly, by calculating a second-order partial derivative ∂2F(f, L)/∂f∂L or ∂2F(f, L)/∂L∂f of the spectrum data F(f, L), it is possible to estimate the attenuation rate ζ.
- In many cases, with the above-described method of estimating the attenuation rate, it is, in practices, difficult to calculate the partial differential of the spectrum data F(f, L). The reason is, although according to the definition of partial differential, it would be necessary, in calculation of partial differential, to calculate limiting values Δf → 0 and ΔL → 0 (Δf and ΔL respectively denote minute displacements of f and L), the actual spectrum data F(f, L) are defined discretely, making it difficult to calculate these limiting values. To solve this issue, there is a known technique of approximating partial differential calculation of the spectrum data F(f, L) by obtaining difference among adjacent discrete values of the frequency f and the distance L. With this technique, however, partial derivative might include much noise attributable to fluctuations of the spectrum data F(f, L).
- In the first embodiment, the change
rate calculation unit 354 performs regression analysis on the function ψ(f, L) = F(f, L) - F(f, 0) of the spectrum data F(f, L) and performs approximation using a regression line. The second-order partial derivative of this function ψ(f, L) would be


- The function ψ(f, L) is represented as

- using Formula (10). Approximation by the regression line is approximation by the linear function. Therefore, the closer the function approximated is to the linear function, the closer the regression line is to the function to be approximated, meaning it is possible to provide good approximation. Herein, as indicated in Formula (15), the function ψ(f, L) is the linear function of the frequency f. However, the spectrum data F(f, L) is not necessarily close to the linear function of the frequency f. Therefore, in a case where a partial derivative of the function for the frequency f is approximated by a slope of the regression line of the function (namely, change rate), accuracy in approximation would be more enhanced when the function ψ(f, L) is used, than the case of using the spectrum data F(f, L).
- The change
rate calculation unit 354 calculates, by using regression analysis, the change rate (namely, a slope of a regression line) for the frequency f of the function ψ(f, L), as an approximate value of the partial derivative ∂ψ(f, L)/∂f for the frequency f of the function ψ(f, L). Subsequently, the changerate calculation unit 354 calculates a change rate for the distance L (namely, a slope of a second regression line) by further performing regression analysis (second regression analysis) on the change rate for the frequency f of the function ψ(f, L), and determines this value as an approximate value of the second-order partial derivative ∂2ψ/∂L∂f. Hereinafter, an approximate value of the second-order partial derivative ∂2ψ/∂L∂f will be referred to as a second-order change rate. - Processing performed by the change
rate calculation unit 354 will be described more specifically. First, the changerate calculation unit 354 obtains a slope and intercept of the regression line having the frequency f of the function ψ(f, L) as a variable, in a frequency band that is set by theband setting unit 353. -
FIG. 11 is a diagram illustrating a relationship between the function ψ(f, Lp) and the frequency f when the distance L = Lp, as an example, and the regression line of each of the function for the frequency f (p = 1, 2, 3, and 4). Regression lines J1, J2, and J3 are regression lines calculated by the changerate calculation unit 354 in performing regression analysis in the frequency band U. A regression line J4' is a regression line calculated by the changerate calculation unit 354 in performing regression analysis in the frequency band U'. For comparison,FIG. 11 also illustrates a regression line J4 calculated by the changerate calculation unit 354 performing regression analysis with the distance L = L4, in the frequency band U. Hereinafter, a slope of a regression line Jp will be defined as Sf(Lp). A slope of the regression line J4' is defined as Sf'(L4). - The slope Sf(Lp) of the regression line Jp monotonically decreases at p = 1, 2, and 3, along with the increase in the distance L. In contrast, a slope Sf(L4) of the regression line J4 is greater than a slope Sf(L3) of the regression line J3 (namely, Sf(L4) > Sf(L3)). A slope Sf'(L4) of the distance L = L4 in the frequency band U' is smaller than a slope Sf(L3) of the regression line J3(Sf'(L4) < Sf(L3)). This is because, as it is clear from
FIG. 8 , the function ψ(f, L4) takes a minimum value in the vicinity of the frequency fmax', and takes a value greater than the minimum value at the frequency fmax. - Subsequently, the change
rate calculation unit 354 calculates the second regression line for the distance L by performing the second regression analysis while assuming the slope Sf(L) as a function of the distance L.FIG. 12 is a diagram illustrating a relationship between the slope Sf(L) and the distance L. As described above, the changerate calculation unit 354 has calculated the exemplary slopes Sf(L1), Sf(L2), Sf(L3), and Sf'(L4) and all the other slopes. Subsequently, based on these slopes, the changerate calculation unit 354 calculates a second regression line Q1 by further performing second regression analysis for the reciprocating distance L. InFIG. 12 , the second regression line Q1 is illustrated in a solid line. As described above, the changerate calculation unit 354 has calculated the exemplary slopes Sf(L1), Sf(L2), Sf(L3), and Sf'(L4) and all the other slopes in the frequency band U. For comparison, inFIG. 12 , the second regression line Q2 calculated by further performing second regression analysis for the reciprocating distance L based on these slopes will be illustrated in a broken line. By comparison between the second regression lines Q1, and Q2, it can be seen that the second regression line Q1 is better fit to the values of the slope Sf(L). As shown in Formula (15), the function ψ(f, L) is a linear function of the frequency f, and in addition, in the first embodiment, the effect of noise has been removed by appropriately setting the frequency bands U and U'. Therefore, the slopes (namely, primary change rates) Sf(L1), Sf(L2), Sf(L3), and Sf'(L4) of the regression lines J1, J2, J3, and J4' respectively provide good approximation to first-order partial derivatives ∂ψ(f, L1)/∂f, ∂ψ(f, L2)/∂f, ∂ψ(f, L3)/∂f, and ∂ψ(f, L4)/∂f of the function ψ(f, L), for the frequency f. Furthermore, as shown in Formula (15), the function ψ(f, L) is not only a linear function of the frequency f but also a linear function of the reciprocating distance L. Therefore, the slope (namely, second-order change rate) of the second regression line Q1 provides good approximation to the partial derivative for the reciprocating distance L of the first-order partial derivative ∂ψ(f, L)/∂f, that is, the second-order partial derivative ∂2ψ(f, L)/∂L∂f on the left side of Formula (13). - The attenuation
rate estimation unit 355 calculates the attenuation rate ζ for each of sound rays of ultrasound by substituting the second-order change rate value calculated by the changerate calculation unit 354 into Formula (13). Subsequently, the attenuationrate estimation unit 355 calculates an average value of the attenuation rates ζ obtained for all the sound rays, outputs the calculation result, as an attenuation rate for the scanning region, to a combined imagedata generation unit 362 included in theimage processing unit 36. Alternatively, the attenuationrate estimation unit 355 may determine statistics including mode, median, and a maximum value of the attenuation rate ζ for all the sound rays, as the attenuation rate of the scanning region. - The
image processing unit 36 includes the B-mode imagedata generation unit 361 and the combined imagedata generation unit 362. The B-mode imagedata generation unit 361 generates B-mode image data that is an ultrasound image displayed by converting amplitude of an echo signal into brightness. The combined imagedata generation unit 362 generates combined image data by combining information on the attenuation rate ζ estimated by the attenuationrate estimation unit 355 and the B-mode image data. - The B-mode image
data generation unit 361 performs signal processing using known techniques, including gain processing and contrast processing, on reception data for B-mode from thesignal processing unit 34, and together with this, generates B-mode image data by performing data decimation corresponding to a data step size determined in accordance with the display range of the image on thedisplay device 4, or by other methods. The B-mode image is a gray-scale image in which values of R (red), G (green) and B (blue), namely, variables when the RGB color system is employed as a color space, match with each other. - The B-mode image
data generation unit 361 performs coordinate transformation on the reception data for B-mode so as to rearrange the scanning region to be correctly represented in space, further fills gaps among individual reception data for B-mode by performing interpolation processing for individual reception data for B-mode, and generates B-mode image data, which are digital data. The B-mode image data are digital data of the B-mode image that can represent a state of an organ within a fan-shaped scanning region illustrated inFIG. 4 . The B-mode imagedata generation unit 361 outputs the generated B-mode image data to the combined imagedata generation unit 362. - The combined image
data generation unit 362 generates character data indicating a value of the attenuation rate of the scanning region, and by combining the B-mode image data with the character data to be displayed adjacent to the B-mode image, generates combined image data. The combined imagedata generation unit 362 outputs the generated combined image data to thedisplay device 4. - The
display device 4 includes a monitor formed with liquid crystal, organic electro luminescence (EL), or the like. Thedisplay device 4 displays various types of information including a combined image corresponding to the combined image data generated by theultrasound diagnosis apparatus 3. -
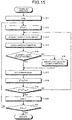
FIG. 13 is a flowchart illustrating outline of processing executed by theultrasound diagnosis apparatus 3 having the above-described configuration. Specifically, the flowchart illustrates outline of processing on and after reception of the echo signals by theultrasound diagnosis apparatus 3 from theultrasound endoscope 2. Hereinafter, processing performed by theultrasound diagnosis apparatus 3 will be described with reference toFIG. 13 . First, theultrasound diagnosis apparatus 3 receives from theultrasound endoscope 2 an echo signal as a result of measurement by the ultrasound transducer 21 (step S1). - After receiving the echo signal from the
ultrasound transducer 21, thesignal amplification unit 331 amplifies the echo signal (step S2). Thesignal amplification unit 331 performs, for example, echo signal amplification (STC correction) based on the relationship between the amplification factor and the reception depth illustrated inFIG. 3 . At this time, a frequency band for various types of processing of echo signal on thesignal amplification unit 331 is preferably a broad band that substantially covers a linear response frequency band for acoustic-electric conversion from an ultrasound echo to an echo signal by theultrasound transducer 21. A purpose of this is to enable accurate approximation in approximation processing of frequency spectrum described below. - As described above, the
signal amplification unit 331 amplifies the echo signal, the transmitting and receivingunit 33 generates RF data by performing filtering and A/D conversion on the amplified echo signal, and thesignal processing unit 34 performs various types of processing on the RF data and generates the reception data for B-mode. The B-mode imagedata generation unit 361 performs appropriate coordinate transformation and interpolation processing toward the reception data for B-mode input from thesignal processing unit 34, generates B-mode image data, and outputs the data to the display device 4 (step S3). Thedisplay device 4 that has received the B-mode image data displays a B-mode image corresponding to the B-mode image data. - The
amplification correction unit 351 performs amplification correction on the RF data output from the transmitting and receivingunit 33 such that the amplification factor is constant regardless of the reception depth (step S4). For example, theamplification correction unit 351 performs amplification correction to achieve a relationship between the amplification factor and the reception depth, illustrated inFIG. 5 . - Thereafter, the
frequency analysis unit 352 calculates spectrum data (step S5) by performing frequency analysis by FFT on the RF data for individual sound rays after amplification correction. Detailed processing of step S5 will be described below. - Subsequently, the
band setting unit 353 sets a frequency band for a regression analysis target (step S6). For example, in the cases illustrated inFIGS. 8 and 9 , the frequency band U is set for L = L1, L2, and L3, while the frequency band U' is set for L = L4. - The change
rate calculation unit 354 calculates the second-order change rate, that is, an approximate value of the second-order partial derivative ∂2ψ(f, L)/∂L∂f of the function ψ(f, L) by performing regression analysis twice based on the frequency band set by the band setting unit 353 (step S7). For example, the changerate calculation unit 354 calculates, as the second-order change rate, slope of the regression line Q1 illustrated inFIG. 12 . - Thereafter, the attenuation
rate estimation unit 355 estimates an attenuation rate of the ultrasound pulse in the scanning region (step S8). The attenuationrate estimation unit 355 calculates attenuation rates for each of sound rays by substituting the second-order change rate value calculated by the changerate calculation unit 354 into the left side of Formula (13). Thereafter, the attenuationrate estimation unit 355 calculates an average value of the overall calculated attenuation rates of the sound rays, and outputs the average value to the combined imagedata generation unit 362 as an attenuation rate of the scanning region. - The combined image
data generation unit 362 generates combined image data based on the B-mode image data and the attenuation rate of the scanning region, and outputs the combined image data to the display device 4 (step S9). After receiving the combined image data, thedisplay device 4 displays a combined image corresponding to the combined image data.FIG. 14 is a diagram illustrating exemplary display of the combined image displayed on thedisplay device 4. A combinedimage 101 illustrated inFIG. 14 includes a B-modeimage display section 102 and an attenuationrate display section 103. InFIG. 14 , display of a specific B-mode image is omitted. - After step S9, the
ultrasound diagnosis apparatus 3 finishes a series of processing. Theultrasound diagnosis apparatus 3 periodically repeats processing of steps S1 to S9. - Next, frequency analysis processing of step S5 will be described with reference to the flowchart in
FIG. 15 First, thefrequency analysis unit 352 sets a counter k for identifying a sound ray as an analysis target, to k0 (step S11). This initial value k0 is either a value that has been arbitrarily input by indication by a user via theinput unit 37, or a value that has been preset on thestorage unit 32. - Subsequently, the
frequency analysis unit 352 sets (step S12) an initial value Z(k) 0 of a data position (corresponding to reception depth) Z(k), representing a series of data group (sample data group) generated for FFT calculation as described above. For example,FIG. 6 illustrates a case, as described above, where a first data position of a sound ray SRk has been set as the initial value Z(k) 0. - Thereafter, the
frequency analysis unit 352 acquires a sample data group (step S13), and applies a window function stored in thestorage unit 32 to the acquired sample data group (step S14). By applying the window function to the sample data group in this manner, it is possible to avoid discontinuity of the sample data group on a border and prevent occurrence of artifacts. The window function applied in step S14 is any of Hamming, Hanning, Blackman, or the like, and is pre-stored in thestorage unit 32. - Subsequently, the
frequency analysis unit 352 determines whether the sample data group of the data position Z(k) is a normal data group (step S15). As discussed with reference toFIG. 6 , it is necessary that the sample data group has the number of data that is power of two. Hereinafter, the number of data of the sample data group is determined to be 2n (n: positive integer). Setting in the first embodiment is performed such that the data position Z(k) may be arranged at a center of the sample data group to which Z(k) belongs, as much as possible. Specifically, since the number of data of the sample data group is 2n, Z(k) is set to a 2n/2 (= 2n-1) th position close to the center of the sample data group. In this case, the sample data group being normal means that data having the number of 2n-1 -1 (= N) exist on a side shallower than the data position Z(k), and that the data having the number of 2n-1 (= M) exist on a side deeper than the data position Z(k). In the case illustrated inFIG. 6 , the sample data group Fj (j = 1, 2, ..., K-1) is normal. Note thatFIG. 6 exemplifies a case of n = 4 (N = 7 and M = 8). - In a case where the result of determination in step S15 indicates that the sample data group of the data position Z(k) is normal (step S15: Yes), the
frequency analysis unit 352 moves on to step S17 described below. - In a case where the result of determination in step S15 indicates that the sample data group of the data position Z(k) is not normal (step S15: No), the
frequency analysis unit 352 generates a normal sample data group (step S16) by inserting zero data to cover the shortfall. The sample data group determined to be not normal in step S15 (e.g., sample data group FK inFIG. 6 ) has undergone action of the window function before addition of the zero data. Therefore, insertion of zero data to the sample data group would not cause discontinuity of data. After step S16, thefrequency analysis unit 352 moves on to step S17 to be described below. - In step S17, the
frequency analysis unit 352 obtains spectrum data as frequency distribution of amplitude by performing FFT computation using the sample data group (step S17). As a result, spectrum data illustrated in individual columns inFIG. 7 are obtained. - Subsequently, the
frequency analysis unit 352 changes the data position Z(k) by a step size D (step S18). The step size D is assumed to be pre-stored in thestorage unit 32.FIG. 6 illustrates an exemplary case of D = 15. An interval ΔL of the reciprocating distance L illustrated inFIG. 7 is defined as twice the value (= sampling size × D) used for conversion from the step size D into the distance. Accordingly, determination of the step size D can uniquely define the interval ΔL. The step size D is desirably equal to the data step size used in generation of B-mode image data by the B-mode imagedata generation unit 361. However, when reduction of calculation on thefrequency analysis unit 352 is desired, a greater value than the data step size may be set as the step size D. - Thereafter, the
frequency analysis unit 352 determines (step S19) whether the data position Z(k) is greater than a maximum value Z(k) max in the sound ray SRk. In a case where the data position Z(k) is greater than the maximum value Z(k) max (step S19: Yes), thefrequency analysis unit 352 increments the counter k by one (step S20). This means transition of processing to an adjacent sound ray. In contrast, in a case where the data position Z(k) is equal to or less than the maximum value Z(k) max (step S19: No), thefrequency analysis unit 352 returns to step S13. - After step S20, the
frequency analysis unit 352 determines whether the counter k is greater than the maximum value kmax (step S21). If the counter k is greater than kmax (step S21: Yes), thefrequency analysis unit 352 finishes a series of frequency analysis processing. In contrast, the counter k is equal to or less than kmax (step S21: No), thefrequency analysis unit 352 returns to step S12. This maximum value kmax is either a value that has been arbitrarily input by indication by a user via theinput unit 37, or a value that has been preset on thestorage unit 32. - In this manner, the
frequency analysis unit 352 performs a plurality of times of FFT calculations for individual sound rays having the number (kmax - k0 + 1) within a region of interest. - According to the first embodiment of the present invention described above, the attenuation rate of an ultrasound signal per unit distance and per unit frequency, in a scanning region of the ultrasound transducer is estimated by using the second-order change rate obtained by calculating the distance change rate and the frequency change rate in this order in the function defined using the frequency spectrum. With this procedure, it is possible to calculate the attenuation rate of the ultrasound accurately and easily, and to enhance reliability of an image based on the attenuation rate.
- According to the first embodiment, it is not necessary to obtain sound velocity as in the cited
literature 1, and the transmission waveform is not assumed to be a Gaussian shape. Therefore, it is possible to calculate the attenuation rate accurately. Note that the second-order change rate in the first embodiment is the second-order change rate of the function of the frequency and the distance (or reception depth) and completely differs from "second-order change rate of a phase" in the above-describedPatent Literature 1. This also applies to second and third embodiments described below. - According to the first embodiment, the frequency band as a calculation target is set by comparison with the noise level data corresponding to the spectrum data, and thus, it is possible to calculate the attenuation rate uniquely in a region that has a sufficiently high S/N and is effective for estimating the attenuation rate. With this configuration, it is possible to calculate the attenuation rate with high accuracy and to enhance reliability of an image based on the attenuation rate.
- According to the first embodiment, it is not necessary to perform complicated processing such as manually specifying a region within an image. Accordingly, it is possible to easily calculate the attenuation rate.
- According to the first embodiment, linear regression analysis is used, and thus, it is possible to easily calculate the frequency change rate and the distance change rate.
- According to the first embodiment, the function ψ(f, L) of the spectrum data, as a linear function of frequency, is used. Accordingly, it is possible to enhance accuracy of approximation using the slope of the regression line.
- According to the first embodiment, the noise level data storage unit stores noise level data corresponding to the ultrasound transducer for each of a plurality of types or devices. Therefore, it is possible to calculate accurately the attenuation rate of the ultrasound for all connectable ultrasound transducers.
- Alternatively, in the first embodiment, it is allowable to configure that the
comparison unit 353a does not compare the spectrum data F(f, L) with the noise level data n(f, L) itself, but there may be provided a margin instead of linear function a·n(f, L) + b (a ≥ 1, b ≥ 0; a, b: constant) of the noise level data n(f, L). In this case, it is possible to further reduce the effect of noise on the second-order change rate calculated by the changerate calculation unit 354 and on the attenuation rate estimated by the attenuationrate estimation unit 355, and to further enhance accuracy in calculating the attenuation rate. - In view of the fact that a low S/N typically occurs on the side of high frequency on which attenuation depending on the frequency is severe, it is allowable to configure such that, when the
band setting unit 353 sets a frequency band as a regression analysis target, the minimum frequency is fixed with an initial value fmin, while the maximum frequency value is changed in the range of f > fmin, from the initial value fmax. In this case, by excluding the high-frequency side on which attenuation is severe when the changerate calculation unit 354 and the attenuationrate estimation unit 355 perform calculation, it is possible to enhance accuracy in estimating attenuation rate. - Alternatively, it is allowable to configure such that the
ultrasound diagnosis apparatus 3 estimates the attenuation rate of a partial region of the scanning region instead of estimating the attenuation rate of the scanning region. In this case, the region may preferably be set by the user via theinput unit 37. - In a second embodiment of the present invention, a method for calculating the second-order change rate performed by the change rate calculation unit of the ultrasound diagnosis apparatus differs from the method in the first embodiment. The ultrasound diagnosis apparatus according to the second embodiment has a configuration similar to the configuration of the
ultrasound diagnosis apparatus 3 described in the first embodiment. - In the second embodiment, the change
rate calculation unit 354 first calculates a change rate of the spectrum data F(f, L) with respect to the distance L using regression analysis and determines the calculated value as an approximate value of a partial derivative ∂ψ(f, L)/∂L. Thereafter, the changerate calculation unit 354 calculates a change rate of the partial derivative ∂F(f, L)/∂L for the frequency f using the second regression analysis, thereby calculating an approximate value of the second-order partial derivative ∂2F(f, L)/∂f∂L, namely, the second-order change rate. - In this case, since the spectrum data F(f, 0) for distance L = 0 is not a function of the distance L, ∂F(f, L)/∂L = ∂ψ(f, L)/∂L
- is established. Therefore, in the second embodiment, the change
rate calculation unit 354 does not need to calculate the function ψ(f, L), but is able to calculate the second-order change rate from the spectrum data F(f, L). - The change
rate calculation unit 354 extracts a regression analysis limit Lmax(f) per frequency f. The regression analysis limit Lmax(f) is a maximum value of the distance L on the frequency f. In the data strings of the spectrum data illustrated inFIG. 10 , the regression analysis limit Lmax(fp) corresponding to each of the frequency f = fp (p = 1, 2, 3, and 4) is illustrated. In the case illustrated inFIG. 10 , the regression analysis limit Lmax(fp) corresponds to a value of the distance L included in the right-end cell on a distribution range of the white cell on the frequency fp. - The change
rate calculation unit 354 executes regression analysis of the spectrum data F(f, L) for the distance L and calculates the slope SL(f) of the regression line in thedistance section 0 ≤ L ≤ Lmax(f).FIG. 16 is a diagram illustrating a relationship between the spectrum data F(f, L) and the distance L when the frequency f is constnat. Specifically, the figure illustrates a relationship between each of spectrum data F(f, L1), F(f, L2), F(f, L3), and F(f, L4) on four mutually different distances, and the distance L. Here, the frequency fp is a constant satisfying 0 < f1 < f2 < f3 < f4. As illustrated inFIG. 16 , on the spectrum data F(f, L), the larger the frequency f, the severer the attenuation along with the increase in the distance L because of an effect of frequency-dependent attenuation at propagation of the ultrasound within the subject. Note that, although inFIG. 16 only four representative spectrum data are illustrated as inFIG. 8 , more spectrum data F(f, L) than this example may be calculated in general. -
FIG. 16 illustrates a regression line Kp of the spectrum data F(fp, L) in thedistance section 0 ≤ L ≤ Lmax(fp). The spectrum data F(fp, L) appears substantially linear from L = 0 until the regression analysis limit Lmax(fp) is reached. This linearity, however, is disturbed after exceeding the regression analysis limit Lmax(fp) due to the effect of noise and the effect generated by attenuation of the spectrum data F(fp, L) itself to reach a level close to zero. - The higher the frequency f, the steeper the slope of the regression line Kp becomes, due to the effects of frequency-dependent attenuation. In other words, when the slope of the regression line Kp is defined as SL(fp), SL(f1) > SL(f2) > SL(f3) > SL(f4) is established.
- For comparison, calculating of a regression line using the regression analysis limit Lmax(f1) of the lowest frequency f1 among the four frequencies, for four spectrum data F(fp, L) illustrated in
FIG. 16 will be discussed.FIG. 16 illustrates, as an example, a regression line K4' calculated when the regression analysis limit Lmax(f1) is applied to the spectrum data F(f4, L). A slope SL'(f4) of the regression line K4' is greater than the slope SL(f4), that is, SL'(f4) > SL(f4) is established because the spectrum data F(f4, L) fall to the noise level in the vicinity of L = Lmax(f4). In cases of p = 1, 2, and 3, similar relationships are established although not illustrated. - The change
rate calculation unit 354 calculates a second regression line for the frequency f by performing second regression analysis having the slope SL(f) as a function of the frequency f.FIG. 17 is a diagram illustrating a relationship between the slope SL(f) and the frequency f. InFIG. 17 , the black dots indicate the relationship between the slope SL(fp) and the frequency fp calculated by the changerate calculation unit 354 in performing regression analysis of the spectrum data F(fp, L) in thedistance section 0 ≤ L ≤ Lmax(fp). In contrast, the white dots are data for comparison and indicate the relationship between the slope SL'(fp) of the regression line Kp' and the frequency fp, calculated by the changerate calculation unit 354 in performing regression analysis of the spectrum data F(fp, L) in thedistance section 0 ≤ L ≤ Lmax(f1). - As described above, the change
rate calculation unit 354 calculates the exemplary slopes SL(f1), SL(f2), SL(f3), and SL(f4), and all the other slopes, in thedistance section 0 ≤ L ≤ Lmax(f). Based on the slopes, the changerate calculation unit 354 further performs the second regression analysis for the frequency f, thereby calculating a second regression line Q3. The second regression line Q3 is illustrated in a solid line inFIG. 17 . For comparison, the changerate calculation unit 354 calculates the slopes SL'(f1), SL'(f2), SL'(f3), and SL'(f4), and all the other slopes, in atentative distance section 0 ≤ L ≤ Lmax(f1), and based on these slopes, performs the second regression analysis for the frequency f. A second regression line Q4 for this case is illustrated in a broken line inFIG. 17 . By comparing the second regression lines Q3 and Q4, it can be seen that the second regression line Q3 is better fit to the value of the slope SL(f). The slope of the second regression line Q3 provides an approximate value for a second-order partial derivative ∂2ψ(f, L)/∂f∂L on the left side of Formula (14), namely, the second-order change rate. - According to the second embodiment of the present invention described above, the attenuation rate of an ultrasound signal per unit distance and per unit frequency, in a scanning region of the ultrasound transducer is estimated using the second-order change rate obtained by calculating the frequency change rate and the distance change rate, in this order, on the frequency spectrum. With this configuration, it is possible, similarly to the first embodiment, to calculate the attenuation rate of the ultrasound accurately and easily, and to enhance reliability of an image based on the attenuation rate.
- In the second embodiment, regression analysis for the distance is executed prior to the regression analysis for the frequency. This enables regression analysis to be performed on the spectrum data as they are, making it possible to reduce computational complexity.
-
FIG. 18 is a block diagram illustrating a functional configuration of an ultrasound diagnosis system according to a third embodiment of the present invention. Anultrasound diagnosis system 11 illustrated inFIG. 18 includes theultrasound endoscope 2, anultrasound diagnosis apparatus 12, and thedisplay device 4. - In the
ultrasound diagnosis apparatus 12, configurations of astorage unit 121 and animage processing unit 122 differ from thestorage unit 32 and theimage processing unit 36 in theultrasound diagnosis apparatus 3, respectively. - The
storage unit 121 includes the typeinformation storage unit 321, the noise leveldata storage unit 322, the bandinformation storage unit 323, and in addition to these, includes a visualinformation storage unit 324 configured to store visual information attached to an image according to an attenuation rate value. Herein, the visual information may be any of luminance, hue, brightness, and saturation, with any of which a value corresponding to the attenuation rate value is associated. The visualinformation storage unit 324 may be configured to store a plurality of types of visual information in association with the attenuation rate. In this case, it is only required to configure to allow the user to select desired visual information via theinput unit 37. - The
image processing unit 122 includes an attenuation rate mapdata generation unit 363, in addition to the B-mode imagedata generation unit 361 and the combined imagedata generation unit 362. The attenuation rate mapdata generation unit 363 generates attenuation rate map data by attaching the visual information according to the attenuation rate value estimated by the attenuationrate estimation unit 355, to the image, with reference to the visualinformation storage unit 324. -
FIG. 19 is a flowchart illustrating outline of processing executed by theultrasound diagnosis apparatus 12 having the above-described configuration. Specifically, the flowchart illustrates outline of processing on and after reception of the echo signals by theultrasound diagnosis apparatus 12 from theultrasound endoscope 2. Steps S31 to S36 inFIG. 19 correspond to steps S1 to S6 inFIG. 13 , respectively. Hereinafter, processing after step S36 will be described. - After step S36, the change
rate calculation unit 354 calculates second-order change rate of spectrum data (step S37). At this time, the changerate calculation unit 354 calculates the second-order change rate for each of a plurality of partial regions, pre-divided and preset within a scanning region. Note that, in the third embodiment, the calculation order of the frequency change rate and the distance change rate, at the time of calculation of the second-order change rate by the changerate calculation unit 354, is not particularly limited. -
FIG. 20 is a diagram schematically illustrating a setting example of the partial region. A partial region R inFIG. 20 is a fan-shaped region having a length (depth range) w in the depth direction and NR sound rays. In a scanning region S, transmission-reception directions are divided by the depth range w, with the scanning direction being divided for each of the NR sound rays. InFIG. 20 , among a plurality of transmission-reception directions within the scanning region S, spectrum data within the partial region R among the spectrum data calculated on a transmission-reception direction dr are indicated by black dots, while spectrum data located on a border of the partial regions R are indicated by white dots. - The change
rate calculation unit 354 determines a reference position (position where the distance is zero) of the distance of the spectrum data in the partial region R as a position closest to the surface of theultrasound transducer 21 within the partial region R, and obtains a value (2z') that is twice the difference z' in depth from this reference position, and then, performs calculation using this 2z' as a new distance. In a case where the reference position of the partial region R when the surface of theultrasound transducer 21 is determined as the reference position of distance is L = Lmin, the spectrum data at the white dots positions described above would be represented as F(f, Lmin). The changerate calculation unit 354 may calculate the second-order change rate in the partial region R by using the spectrum data F(f, Lmin) instead of the spectrum data F(f, 0) in Formula (10). - Using a result of calculation by the change
rate calculation unit 354, the attenuationrate estimation unit 355 estimates, for a plurality of partial regions included in the scanning region, an attenuation rate for the partial region (step S38). First, the attenuationrate estimation unit 355 calculates an attenuation rate for each of the sound rays using all the second-order change rates calculated in the partial regions. Thereafter, the attenuationrate estimation unit 355 calculates an average value of the attenuation rate obtained for all the sound rays, calculated in a same partial region, and outputs the average value to the attenuation rate mapdata generation unit 363 as an estimated value of the attenuation rate for the corresponding partial region. Alternatively, the attenuationrate estimation unit 355 may determine statistics including mode, median, and a maximum value of the attenuation rate for all the sound rays calculated in the same partial region, as the attenuation rate of the corresponding partial region. - Thereafter, the attenuation rate map
data generation unit 363 generates attenuation rate map data by allocating visual information corresponding to the attenuation rate of each of the partial regions to each of the partial regions with reference to the visualinformation storage unit 324, and then, outputs the generated attenuation rate map data to the combined image data generation unit 362 (step S39). It is also allowable that the combined imagedata generation unit 362 generates combined image data that further displays the estimated value for the attenuation rate for each of the partial regions, as textual information. - The combined image
data generation unit 362 generates the combined image data by superposing the attenuation rate map data on the B-mode image data, and outputs the combined image data to the display device 4 (step S40). After receiving the combined image data, thedisplay device 4 displays a combined image corresponding to the combined image data.FIG. 21 is diagram illustrating exemplary display of a combined image with attenuation rate map data displayed on thedisplay device 4. In acombined image 201 illustrated inFIG. 21 , different visual information is allocated for each of the regions. InFIG. 21 , the visual information is illustrated schematically with patterns. InFIG. 21 , to simplify description, specific display of the B-mode image is omitted. - In the third embodiment, it would be preferable that an exemplary depth range w is approximately 1 cm. In a case where the depth range w is approximately 1 cm, it is desirable that the range ΔL of the section removed as the RF data when the
frequency analysis unit 352 performs the FFT processing would be approximately 2 mm. At this time, the range Δz' (= ΔL/2) of the depth z' of the reference position corresponding to the interval ΔL would be approximately 1 mm. - According to the third embodiment of the present invention described above, the attenuation rate of an ultrasound signal per unit distance and unit frequency in a scanning region of the ultrasound transducer is estimated by using the second-order change rate obtained by calculating, in a predetermined order, the frequency spectrum or the distance change rate and the frequency change rate in the function defined using the frequency spectrum. With this procedure, similarly to the first and second embodiments, it is possible to calculate the attenuation rate of the ultrasound accurately and easily, and to enhance reliability of an image based on the attenuation rate.
- According to the third embodiment, the scanning region of the ultrasound transducer is divided into a plurality of partial regions. By calculating the statistics of the attenuation rate obtained on each of the partial regions, estimation of the attenuation rate for each of the partial regions is performed. Thereafter, the attenuation rate map data is generated by attaching visual information according to the value of the attenuation rate in each of the partial regions. As a result, it is possible to provide information that makes it easier for the user to grasp distribution of the attenuation rate.
- In the third embodiment, it is also allowable to set adjacent fan-shaped regions to be arranged to mutually overlap, among the fan-shaped regions, each of which is a minimum unit of the attenuation rate map.
- In the third embodiment, it is also allowable to perform calculation of the attenuation rate of each of the fan-shaped regions in parallel, instead of performing it in sequence.
- It is also allowable in the third embodiment, that the combined image data are generated in a manner such that one fan-shaped region is set as a region of interest (ROI) based on a setting signal received by the
input unit 37, and that the values of the attenuation rate within the region of interest are further combined. - Embodiments of the present invention have been described hereinabove, however, the present invention is not intended to be limited to the above-described first to third embodiments. For example, the ultrasound diagnosis apparatus can be configured by connecting circuits having individual functions via a bus, or can be configured such that a part of the function is incorporated into a circuit structure of another function. Specifically, functions of the change rate calculation unit may be incorporated into a circuit having a function of the attenuation rate estimation unit.
- An ultrasound miniature probe that has a small diameter and has no optical system may be employed as the ultrasound probe. In typical cases, the ultrasound miniature probe is inserted into biliary tract, bile duct, pancreatic duct, trachea, bronchus, urethra, and ureter, and is applicable to the observation of the surrounding organs (pancreas, lung, prostate gland, bladder, and lymph nodes, or the like).
- An external ultrasound probe that emits ultrasound from the surface of the subject may also be employed as the ultrasound probe. The external ultrasound probe is typically used to observe abdominal organs (liver, gall bladder, and bladder), breast (mammary gland, in particular), and the thyroid.
- The ultrasound transducer may be any of a linear transducer, radial transducer, and a convex transducer. In a case where the ultrasound transducer is a linear transducer, the scanning region has a quadrangular shape (rectangle or square). In a case where the ultrasound transducer is a radial transducer or a convex transducer, the scanning region is fan-shaped or circular.
- In this manner, the present invention may include various forms of embodiments without deviating from the technical spirit and scope of the general inventive concept as defined in the appended claims of this invention.
- The ultrasound diagnosis apparatus, the ultrasound diagnosis apparatus operation method, and the ultrasound diagnosis apparatus operation program, according to the present invention, are useful for calculating the attenuation rate of ultrasound accurately and easily, and enhancing reliability of images based on the attenuation rate.
-
- 1, 11
- ULTRASOUND DIAGNOSIS SYSTEM
- 2
- ULTRASOUND ENDOSCOPE
- 3, 12
- ULTRASOUND DIAGNOSIS APPARATUS
- 4
- DISPLAY DEVICE
- 21
- ULTRASOUND TRANSDUCER
- 31
- CONTROL UNIT
- 32, 121
- STORAGE UNIT
- 33
- TRANSMITTING AND RECEIVING UNIT
- 34
- SIGNAL PROCESSING UNIT
- 35
- COMPUTING UNIT
- 36, 122
- IMAGE PROCESSING UNIT
- 37
- INPUT UNIT
- 101, 201
- COMBINED IMAGE
- 102
- B-MODE IMAGE DISPLAY SECTION
- 103
- ATTENUATION RATE DISPLAY SECTION
- 311
- TYPE IDENTIFICATION UNIT
- 321
- TYPE INFORMATION STORAGE UNIT
- 322
- NOISE LEVEL DATA STORAGE UNIT
- 323
- BAND INFORMATION STORAGE UNIT
- 324
- VISUAL INFORMATION STORAGE UNIT
- 331
- SIGNAL AMPLIFICATION UNIT
- 351
- AMPLIFICATION CORRECTION UNIT
- 352
- FREQUENCY ANALYSIS UNIT
- 353
- BAND SETTING UNIT
- 353a
- COMPARISON UNIT
- 354
- CHANGE RATE CALCULATION UNIT
- 355
- ATTENUATION RATE ESTIMATION UNIT
- 361
- B-MODE IMAGE DATA GENERATION UNIT
- 362
- COMBINED IMAGE DATA GENERATION UNIT
- 363
- ATTENUATION RATE MAP DATA GENERATION UNIT
Claims (15)
- An ultrasound diagnosis apparatus configured to generate an ultrasound image based on an ultrasound signal obtained by an ultrasound probe having an ultrasound transducer that transmits ultrasound to a subject and receives the ultrasound reflected from the subject, the ultrasound diagnosis apparatus comprising:a frequency analysis unit configured to analyze a frequency of the ultrasound signal to calculate a frequency spectrum of the ultrasound signal for each reception depth;a change rate calculation unit configured to calculate, in a predetermined order, a distance change rate and a frequency change rate in the frequency spectrum calculated by the frequency analysis unit or in a function defined by using the frequency spectrum, thereby to calculate a second-order change rate of the frequency spectrum or of the function; andan attenuation rate estimation unit configured to estimate an attenuation rate of the ultrasound signal, per unit distance and per unit frequency, in a predetermined region within a scanning region of the ultrasound transducer using the second-order change rate calculated by the change rate calculation unit.
- The ultrasound diagnosis apparatus according to claim 1, further comprising:a noise level data storage unit configured to store noise level data in accordance with a frequency and a reception depth; anda band setting unit configured to compare the noise level data stored in the noise level data storage unit with data of the frequency spectrum, thereby to set a frequency band of the frequency spectrum for calculation by the change rate calculation unit, whereinthe change rate calculation unit is configured to calculate the frequency change rate in the frequency band set by the band setting unit.
- The ultrasound diagnosis apparatus according to claim 2, wherein the band setting unit is configured to compare the data of the frequency spectrum with the noise level data, at a same frequency, thereby to extract a noise frequency band that is a band of a frequency corresponding to noise, and is configured to exclude the noise frequency band to set the frequency band.
- The ultrasound diagnosis apparatus according to claim 3, wherein the band setting unit is configured to extract, as the noise frequency band, a frequency band higher than a predetermined frequency.
- The ultrasound diagnosis apparatus according to claim 3, wherein the band setting unit is configured to extract, as the noise frequency band, a region in which a value of the data of the frequency spectrum is equal to or less than a threshold.
- The ultrasound diagnosis apparatus according to claim 5, wherein the threshold is a value equal to or higher than the noise level data.
- The ultrasound diagnosis apparatus according to claim 1, wherein
the change rate calculation unit is configured to calculate the second-order change rate for each of sound rays of the ultrasound, and
the attenuation rate estimation unit is configured to calculate an attenuation rate for each of the sound rays using the second-order change rate for each of the sound rays, and is configured to calculate statistics of the attenuation rate for each of all the sound rays in the scanning region to estimate the attenuation rate. - The ultrasound diagnosis apparatus according to claim 2, wherein the change rate calculation unit is configured to:perform, in the frequency band, regression analysis using a frequency as a variable, on a function defined by a difference between the frequency spectrum and the frequency spectrum at a reference reception depth, thereby to calculate a regression line;perform second regression analysis on a slope of the regression line using a reciprocating distance between the ultrasound transducer and the subject as a variable, thereby to calculate a second regression line; anddetermine a slope of the second regression line as the second-order change rate.
- The ultrasound diagnosis apparatus according to claim 2, wherein the change rate calculation unit is configured to:perform regression analysis using a reciprocating distance between the ultrasound transducer and the subject as a variable, on the frequency spectrum in a distance section defined per frequency based on the frequency band, thereby to calculate a regression line;perform second regression analysis on a slope of the regression line using a frequency as a variable, thereby to calculate a second regression line; anddetermine a slope of the second regression line as the second-order change rate.
- The ultrasound diagnosis apparatus according to claim 1, further comprising:a B-mode image data generation unit configured to generate B-mode image data as the ultrasound image displayed by converting amplitude of the ultrasound signal into brightness; anda combined image data generation unit configured to generate combined image data using information on the attenuation rate estimated by the attenuation rate estimation unit and using the B-mode image data generated by the B-mode image data generation unit.
- The ultrasound diagnosis apparatus according to claim 1, wherein
the attenuation rate estimation unit is configured to calculate statistics of an attenuation rate for each of a plurality of partial regions obtained by dividing the scanning region to estimate the attenuation rate of each of the partial regions, and
the ultrasound diagnosis apparatus further comprises an attenuation rate map data generation unit configured to attach visual information in accordance with a value of the attenuation rate of each of the partial regions to generate attenuation rate map data. - The ultrasound diagnosis apparatus according to claim 11, further comprising:a B-mode image data generation unit configured to generate B-mode image data as the ultrasound image displayed by converting amplitude of the ultrasound signal into brightness; anda combined image data generation unit configured to generate combined image data using the attenuation rate map data generated by the attenuation rate map data generation unit and using the B-mode image data generated by the B-mode image data generation unit.
- The ultrasound diagnosis apparatus according to claim 2, wherein the noise level data storage unit stores the noise level data corresponding to the ultrasound transducer included in the ultrasound probe that is connectable to the ultrasound diagnosis apparatus.
- A method for operating an ultrasound diagnosis apparatus, the ultrasound diagnosis apparatus being configured to generate an ultrasound image based on an ultrasound signal obtained by an ultrasound probe having an ultrasound transducer that transmits ultrasound to a subject and receives the ultrasound reflected from the subject, the method comprising:a frequency analysis step of, by a frequency analysis unit, analyzing a frequency of the ultrasound signal to calculate a frequency spectrum of the ultrasound signal for each reception depth;a change rate calculation step of, by a change rate calculation unit, calculating, in a predetermined order, a distance change rate and a frequency change rate in the frequency spectrum or in a function defined by using the frequency spectrum, thereby calculating a second-order change rate of the frequency spectrum or of the function; andan attenuation rate estimation step of, by an attenuation rate estimation unit, estimating an attenuation rate of the ultrasound signal, per unit distance and per unit frequency, in a predetermined region within a scanning region of the ultrasound transducer using the second-order change rate.
- A program for operating an ultrasound diagnosis apparatus, the ultrasound diagnosis apparatus being configured to generate an ultrasound image based on an ultrasound signal obtained by an ultrasound probe having an ultrasound transducer that transmits ultrasound to a subject and receives the ultrasound reflected from the subject, the program causing the ultrasound diagnosis apparatus to execute:a frequency analysis step of, by a frequency analysis unit, analyzing a frequency of the ultrasound signal to calculate a frequency spectrum of the ultrasound signal for each reception depth;a change rate calculation step of, by a change rate calculation unit, calculating, in a predetermined order, a distance change rate and a frequency change rate in the frequency spectrum or in a function defined by using the frequency spectrum, thereby calculating a second-order change rate of the frequency spectrum or of the function; andan attenuation rate estimation step of, by an attenuation rate estimation unit, estimating an attenuation rate of the ultrasound signal, per unit distance and per unit frequency, in a predetermined region within a scanning region of the ultrasound transducer using the second-order change rate.
Applications Claiming Priority (2)
| Application Number | Priority Date | Filing Date | Title |
|---|---|---|---|
| JP2014259470 | 2014-12-22 | ||
| PCT/JP2015/078247 WO2016103839A1 (en) | 2014-12-22 | 2015-10-05 | Diagnostic ultrasound apparatus, diagnostic ultrasound apparatus operation method, and diagnostic ultrasound apparatus operation program |
Publications (2)
| Publication Number | Publication Date |
|---|---|
| EP3238633A1 true EP3238633A1 (en) | 2017-11-01 |
| EP3238633A4 EP3238633A4 (en) | 2018-09-05 |
Family
ID=56149876
Family Applications (1)
| Application Number | Title | Priority Date | Filing Date |
|---|---|---|---|
| EP15872408.8A Withdrawn EP3238633A4 (en) | 2014-12-22 | 2015-10-05 | Diagnostic ultrasound apparatus, diagnostic ultrasound apparatus operation method, and diagnostic ultrasound apparatus operation program |
Country Status (4)
| Country | Link |
|---|---|
| US (2) | US10010306B2 (en) |
| EP (1) | EP3238633A4 (en) |
| CN (1) | CN105939674B (en) |
| WO (1) | WO2016103839A1 (en) |
Families Citing this family (6)
| Publication number | Priority date | Publication date | Assignee | Title |
|---|---|---|---|---|
| DE10320679A1 (en) * | 2003-04-30 | 2004-12-02 | Infineon Technologies Ag | Process for treating a workpiece, especially a substrate for a mask for producing semiconductor elements, comprises using water in a super-critical state |
| DE102015206630B4 (en) * | 2015-04-14 | 2022-05-05 | Siemens Healthcare Gmbh | Multispectral CT imaging |
| CN106473777A (en) * | 2016-12-12 | 2017-03-08 | 广东技术师范学院 | A kind of diagnostic ultrasound equipment, method of work and working procedure |
| JP7280713B2 (en) * | 2019-02-27 | 2023-05-24 | キヤノンメディカルシステムズ株式会社 | ultrasound diagnostic equipment |
| JP7236312B2 (en) * | 2019-04-04 | 2023-03-09 | 富士フイルムヘルスケア株式会社 | Ultrasound diagnostic device, signal processing device, and program |
| CN110231006B (en) * | 2019-06-10 | 2020-07-17 | 苏州博昇科技有限公司 | Air coupling ultrasonic interference method |
Family Cites Families (15)
| Publication number | Priority date | Publication date | Assignee | Title |
|---|---|---|---|---|
| CN100536788C (en) * | 2004-10-20 | 2009-09-09 | 株式会社东芝 | Ultrasonic doppler diagnosis device |
| US20070043290A1 (en) * | 2005-08-03 | 2007-02-22 | Goepp Julius G | Method and apparatus for the detection of a bone fracture |
| JP2010082230A (en) * | 2008-09-30 | 2010-04-15 | Fujifilm Corp | Ultrasonic signal processing apparatus and method |
| EP2370163B1 (en) * | 2008-11-28 | 2017-11-15 | St. Jude Medical AB | An implantable medical device, a method and a system for valve condition determination |
| CN101766497B (en) * | 2008-12-31 | 2013-03-06 | 深圳迈瑞生物医疗电子股份有限公司 | Method for processing signal of sound spectrogram image and system therefor |
| WO2010127429A1 (en) * | 2009-05-08 | 2010-11-11 | University Of Toronto | Ultrasonic scanning system and ultrasound image enhancement method |
| CN101690671A (en) * | 2009-09-29 | 2010-04-07 | 深圳市蓝韵实业有限公司 | Dynamic demodulation device of Doppler ultrasonic imaging system |
| US8485975B2 (en) * | 2010-06-07 | 2013-07-16 | Atheropoint Llc | Multi-resolution edge flow approach to vascular ultrasound for intima-media thickness (IMT) measurement |
| CN103200876B (en) * | 2010-11-11 | 2015-09-09 | 奥林巴斯医疗株式会社 | The method of operating of ultrasound observation apparatus, ultrasound observation apparatus |
| JPWO2012063930A1 (en) * | 2010-11-11 | 2014-05-12 | オリンパスメディカルシステムズ株式会社 | Ultrasonic diagnostic apparatus, method for operating ultrasonic diagnostic apparatus, and operation program for ultrasonic diagnostic apparatus |
| EP2661228B1 (en) * | 2011-01-05 | 2014-12-24 | Koninklijke Philips N.V. | Device and method for determining actual tissue layer boundaries of a body |
| JP2012165893A (en) * | 2011-02-15 | 2012-09-06 | Fujifilm Corp | Ultrasonic diagnostic apparatus and ultrasonic image generation method |
| JP5925438B2 (en) | 2011-06-23 | 2016-05-25 | 株式会社東芝 | Ultrasonic diagnostic equipment |
| WO2014192954A1 (en) * | 2013-05-29 | 2014-12-04 | オリンパスメディカルシステムズ株式会社 | Ultrasonic observation device, operation method for ultrasonic observation device, and operation program for ultrasonic observation device |
| CN104207804A (en) * | 2014-09-26 | 2014-12-17 | 南京大学 | Method for imaging internode distance of biological tissues through sound speed and sound attenuation |
-
2015
- 2015-10-05 CN CN201580006715.0A patent/CN105939674B/en active Active
- 2015-10-05 WO PCT/JP2015/078247 patent/WO2016103839A1/en active Application Filing
- 2015-10-05 EP EP15872408.8A patent/EP3238633A4/en not_active Withdrawn
-
2016
- 2016-07-29 US US15/223,167 patent/US10010306B2/en active Active
-
2018
- 2018-07-02 US US16/025,517 patent/US10299766B2/en active Active
Also Published As
| Publication number | Publication date |
|---|---|
| US20160331352A1 (en) | 2016-11-17 |
| US20180303464A1 (en) | 2018-10-25 |
| CN105939674B (en) | 2019-09-24 |
| WO2016103839A1 (en) | 2016-06-30 |
| US10010306B2 (en) | 2018-07-03 |
| CN105939674A (en) | 2016-09-14 |
| US10299766B2 (en) | 2019-05-28 |
| EP3238633A4 (en) | 2018-09-05 |
Similar Documents
| Publication | Publication Date | Title |
|---|---|---|
| US10299766B2 (en) | Ultrasound diagnosis apparatus, method for operating ultrasound diagnosis apparatus, and computer-readable recording medium | |
| JP5974210B2 (en) | Ultrasonic observation apparatus, operation method of ultrasonic observation apparatus, and operation program of ultrasonic observation apparatus | |
| EP3275376A1 (en) | Ultrasonic observation device, ultrasonic observation device operation method, and ultrasonic observation device operation program | |
| WO2018142937A1 (en) | Ultrasound observation apparatus, method for operating ultrasound observation apparatus, and program for operating ultrasound observation apparatus | |
| US10201329B2 (en) | Ultrasound observation apparatus, method for operating ultrasound observation apparatus, and computer-readable recording medium | |
| US20180271478A1 (en) | Ultrasound observation device, method of operating ultrasound observation device, and computer-readable recording medium | |
| CN106659478B (en) | Ultrasonic observation device and method for operating ultrasonic observation device | |
| US9662093B2 (en) | Ultrasound observation apparatus, method for operating ultrasound observation apparatus, and computer-readable recording medium | |
| JP2018192117A (en) | Ultrasound observation apparatus, method for operating ultrasound observation apparatus, and program for operating ultrasound observation apparatus | |
| JP5932183B1 (en) | Ultrasonic diagnostic apparatus, method for operating ultrasonic diagnostic apparatus, and operation program for ultrasonic diagnostic apparatus | |
| US11207056B2 (en) | Ultrasound diagnostic apparatus, method for operating ultrasound diagnostic apparatus, and computer-readable recording medium | |
| JP5981072B1 (en) | Ultrasonic observation apparatus, operation method of ultrasonic observation apparatus, and operation program of ultrasonic observation apparatus | |
| EP3295875A1 (en) | Ultrasound diagnostic device, method of operating ultrasound diagnostic device, and program for operating ultrasound diagnostic device | |
| EP3366220A1 (en) | Ultrasonic observation apparatus, operation method for ultrasonic observation apparatus, and operation program for ultrasonic observation apparatus | |
| EP3238632B1 (en) | Ultrasound observation apparatus, method for operating ultrasound observation apparatus, and program for operating ultrasound observation apparatus | |
| WO2015198713A1 (en) | Ultrasound observation device, ultrasound observation device operating method, and ultrasound observation device operating program | |
| JP6010274B1 (en) | Ultrasonic observation apparatus, operation method of ultrasonic observation apparatus, and operation program of ultrasonic observation apparatus | |
| JP6138402B2 (en) | Ultrasonic observation apparatus, operation method of ultrasonic observation apparatus, and operation program of ultrasonic observation apparatus | |
| JP5953457B1 (en) | Ultrasonic observation apparatus, operation method of ultrasonic observation apparatus, and operation program of ultrasonic observation apparatus | |
| JP5927367B1 (en) | Ultrasonic observation apparatus, operation method of ultrasonic observation apparatus, and operation program of ultrasonic observation apparatus |
Legal Events
| Date | Code | Title | Description |
|---|---|---|---|
| STAA | Information on the status of an ep patent application or granted ep patent |
Free format text: STATUS: THE INTERNATIONAL PUBLICATION HAS BEEN MADE |
|
| PUAI | Public reference made under article 153(3) epc to a published international application that has entered the european phase |
Free format text: ORIGINAL CODE: 0009012 |
|
| STAA | Information on the status of an ep patent application or granted ep patent |
Free format text: STATUS: REQUEST FOR EXAMINATION WAS MADE |
|
| 17P | Request for examination filed |
Effective date: 20170721 |
|
| AK | Designated contracting states |
Kind code of ref document: A1 Designated state(s): AL AT BE BG CH CY CZ DE DK EE ES FI FR GB GR HR HU IE IS IT LI LT LU LV MC MK MT NL NO PL PT RO RS SE SI SK SM TR |
|
| AX | Request for extension of the european patent |
Extension state: BA ME |
|
| DAV | Request for validation of the european patent (deleted) | ||
| DAX | Request for extension of the european patent (deleted) | ||
| A4 | Supplementary search report drawn up and despatched |
Effective date: 20180806 |
|
| RIC1 | Information provided on ipc code assigned before grant |
Ipc: A61B 8/12 20060101ALI20180731BHEP Ipc: G01S 15/89 20060101ALI20180731BHEP Ipc: G01S 7/52 20060101ALI20180731BHEP Ipc: A61B 8/14 20060101AFI20180731BHEP Ipc: A61B 8/00 20060101ALI20180731BHEP Ipc: A61B 8/08 20060101ALI20180731BHEP |
|
| RIC1 | Information provided on ipc code assigned before grant |
Ipc: A61B 8/08 20060101ALI20200228BHEP Ipc: G01S 7/52 20060101ALI20200228BHEP Ipc: G01S 15/89 20060101ALI20200228BHEP Ipc: A61B 8/14 20060101AFI20200228BHEP Ipc: A61B 8/00 20060101ALI20200228BHEP Ipc: A61B 8/12 20060101ALI20200228BHEP |
|
| GRAP | Despatch of communication of intention to grant a patent |
Free format text: ORIGINAL CODE: EPIDOSNIGR1 |
|
| STAA | Information on the status of an ep patent application or granted ep patent |
Free format text: STATUS: GRANT OF PATENT IS INTENDED |
|
| INTG | Intention to grant announced |
Effective date: 20200416 |
|
| STAA | Information on the status of an ep patent application or granted ep patent |
Free format text: STATUS: THE APPLICATION IS DEEMED TO BE WITHDRAWN |
|
| 18D | Application deemed to be withdrawn |
Effective date: 20200827 |