EP3229688B1 - Device and method to recommend diagnostic procedure based on co-registered angiographic image and physiological information measured by intravascular device - Google Patents
Device and method to recommend diagnostic procedure based on co-registered angiographic image and physiological information measured by intravascular device Download PDFInfo
- Publication number
- EP3229688B1 EP3229688B1 EP15805298.5A EP15805298A EP3229688B1 EP 3229688 B1 EP3229688 B1 EP 3229688B1 EP 15805298 A EP15805298 A EP 15805298A EP 3229688 B1 EP3229688 B1 EP 3229688B1
- Authority
- EP
- European Patent Office
- Prior art keywords
- vessel
- measurements
- pressure
- patient
- instances
- Prior art date
- Legal status (The legal status is an assumption and is not a legal conclusion. Google has not performed a legal analysis and makes no representation as to the accuracy of the status listed.)
- Active
Links
- 238000000034 method Methods 0.000 title claims description 94
- 238000002405 diagnostic procedure Methods 0.000 title claims description 30
- 238000005259 measurement Methods 0.000 claims description 118
- 238000009530 blood pressure measurement Methods 0.000 claims description 60
- 230000035479 physiological effects, processes and functions Effects 0.000 claims description 50
- 238000003384 imaging method Methods 0.000 claims description 29
- 238000002608 intravascular ultrasound Methods 0.000 claims description 23
- 238000004458 analytical method Methods 0.000 claims description 14
- 238000012014 optical coherence tomography Methods 0.000 claims description 14
- 238000013146 percutaneous coronary intervention Methods 0.000 claims description 10
- 238000002591 computed tomography Methods 0.000 claims description 5
- 238000002586 coronary angiography Methods 0.000 claims description 3
- 208000010125 myocardial infarction Diseases 0.000 claims description 3
- 208000031481 Pathologic Constriction Diseases 0.000 description 76
- 230000036262 stenosis Effects 0.000 description 74
- 208000037804 stenosis Diseases 0.000 description 74
- 230000003902 lesion Effects 0.000 description 32
- 210000005166 vasculature Anatomy 0.000 description 29
- 239000012530 fluid Substances 0.000 description 24
- 238000012544 monitoring process Methods 0.000 description 20
- 230000000875 corresponding effect Effects 0.000 description 19
- 210000004351 coronary vessel Anatomy 0.000 description 15
- 238000012545 processing Methods 0.000 description 14
- 244000208734 Pisonia aculeata Species 0.000 description 13
- 238000004891 communication Methods 0.000 description 12
- 238000004364 calculation method Methods 0.000 description 11
- 230000008867 communication pathway Effects 0.000 description 10
- 230000000007 visual effect Effects 0.000 description 7
- 238000012800 visualization Methods 0.000 description 7
- 230000002547 anomalous effect Effects 0.000 description 5
- 210000004204 blood vessel Anatomy 0.000 description 5
- 230000008859 change Effects 0.000 description 5
- 230000003287 optical effect Effects 0.000 description 5
- 208000004434 Calcinosis Diseases 0.000 description 4
- 238000011156 evaluation Methods 0.000 description 4
- 239000000203 mixture Substances 0.000 description 4
- 230000008569 process Effects 0.000 description 4
- CCEKAJIANROZEO-UHFFFAOYSA-N sulfluramid Chemical group CCNS(=O)(=O)C(F)(F)C(F)(F)C(F)(F)C(F)(F)C(F)(F)C(F)(F)C(F)(F)C(F)(F)F CCEKAJIANROZEO-UHFFFAOYSA-N 0.000 description 4
- 230000009471 action Effects 0.000 description 3
- 210000003484 anatomy Anatomy 0.000 description 3
- 238000002583 angiography Methods 0.000 description 3
- 238000002399 angioplasty Methods 0.000 description 3
- 210000001367 artery Anatomy 0.000 description 3
- 239000003795 chemical substances by application Substances 0.000 description 3
- 230000002596 correlated effect Effects 0.000 description 3
- 201000010099 disease Diseases 0.000 description 3
- 208000037265 diseases, disorders, signs and symptoms Diseases 0.000 description 3
- 230000000544 hyperemic effect Effects 0.000 description 3
- 230000000670 limiting effect Effects 0.000 description 3
- 230000036961 partial effect Effects 0.000 description 3
- 238000003860 storage Methods 0.000 description 3
- 238000002604 ultrasonography Methods 0.000 description 3
- 208000007536 Thrombosis Diseases 0.000 description 2
- 210000000709 aorta Anatomy 0.000 description 2
- 230000004872 arterial blood pressure Effects 0.000 description 2
- 238000005452 bending Methods 0.000 description 2
- 239000008280 blood Substances 0.000 description 2
- 210000004369 blood Anatomy 0.000 description 2
- 230000017531 blood circulation Effects 0.000 description 2
- 230000002308 calcification Effects 0.000 description 2
- 230000003247 decreasing effect Effects 0.000 description 2
- 238000003745 diagnosis Methods 0.000 description 2
- 238000010586 diagram Methods 0.000 description 2
- 238000009826 distribution Methods 0.000 description 2
- 238000002651 drug therapy Methods 0.000 description 2
- 238000009472 formulation Methods 0.000 description 2
- 230000023597 hemostasis Effects 0.000 description 2
- 238000004519 manufacturing process Methods 0.000 description 2
- 238000013507 mapping Methods 0.000 description 2
- 238000012986 modification Methods 0.000 description 2
- 230000004048 modification Effects 0.000 description 2
- 230000002093 peripheral effect Effects 0.000 description 2
- 239000004065 semiconductor Substances 0.000 description 2
- 238000001356 surgical procedure Methods 0.000 description 2
- 210000001519 tissue Anatomy 0.000 description 2
- 230000002792 vascular Effects 0.000 description 2
- 238000007794 visualization technique Methods 0.000 description 2
- OYPRJOBELJOOCE-UHFFFAOYSA-N Calcium Chemical compound [Ca] OYPRJOBELJOOCE-UHFFFAOYSA-N 0.000 description 1
- 208000036829 Device dislocation Diseases 0.000 description 1
- 206010020565 Hyperaemia Diseases 0.000 description 1
- 206010020772 Hypertension Diseases 0.000 description 1
- 238000002679 ablation Methods 0.000 description 1
- 230000004075 alteration Effects 0.000 description 1
- 230000003190 augmentative effect Effects 0.000 description 1
- 238000009529 body temperature measurement Methods 0.000 description 1
- 229910052791 calcium Inorganic materials 0.000 description 1
- 239000011575 calcium Substances 0.000 description 1
- 239000003086 colorant Substances 0.000 description 1
- 238000004040 coloring Methods 0.000 description 1
- 230000000295 complement effect Effects 0.000 description 1
- 238000005094 computer simulation Methods 0.000 description 1
- 239000002872 contrast media Substances 0.000 description 1
- 238000012937 correction Methods 0.000 description 1
- 230000007423 decrease Effects 0.000 description 1
- 230000001934 delay Effects 0.000 description 1
- 230000001419 dependent effect Effects 0.000 description 1
- 206010012601 diabetes mellitus Diseases 0.000 description 1
- 230000000694 effects Effects 0.000 description 1
- 230000036541 health Effects 0.000 description 1
- 210000005003 heart tissue Anatomy 0.000 description 1
- 230000000004 hemodynamic effect Effects 0.000 description 1
- 230000003116 impacting effect Effects 0.000 description 1
- 238000007689 inspection Methods 0.000 description 1
- 230000003993 interaction Effects 0.000 description 1
- 208000028867 ischemia Diseases 0.000 description 1
- 210000003141 lower extremity Anatomy 0.000 description 1
- 239000003550 marker Substances 0.000 description 1
- 230000007246 mechanism Effects 0.000 description 1
- 230000001338 necrotic effect Effects 0.000 description 1
- 230000004962 physiological condition Effects 0.000 description 1
- 230000001737 promoting effect Effects 0.000 description 1
- 238000011002 quantification Methods 0.000 description 1
- 230000002829 reductive effect Effects 0.000 description 1
- 230000004044 response Effects 0.000 description 1
- 230000000284 resting effect Effects 0.000 description 1
- 238000012552 review Methods 0.000 description 1
- 238000005096 rolling process Methods 0.000 description 1
- 239000000523 sample Substances 0.000 description 1
- 238000006467 substitution reaction Methods 0.000 description 1
- 230000001225 therapeutic effect Effects 0.000 description 1
- 238000002560 therapeutic procedure Methods 0.000 description 1
- 239000002699 waste material Substances 0.000 description 1
Images


Classifications
-
- A—HUMAN NECESSITIES
- A61—MEDICAL OR VETERINARY SCIENCE; HYGIENE
- A61B—DIAGNOSIS; SURGERY; IDENTIFICATION
- A61B6/00—Apparatus for radiation diagnosis, e.g. combined with radiation therapy equipment
- A61B6/46—Apparatus for radiation diagnosis, e.g. combined with radiation therapy equipment with special arrangements for interfacing with the operator or the patient
- A61B6/467—Apparatus for radiation diagnosis, e.g. combined with radiation therapy equipment with special arrangements for interfacing with the operator or the patient characterised by special input means
- A61B6/469—Apparatus for radiation diagnosis, e.g. combined with radiation therapy equipment with special arrangements for interfacing with the operator or the patient characterised by special input means for selecting a region of interest [ROI]
-
- A—HUMAN NECESSITIES
- A61—MEDICAL OR VETERINARY SCIENCE; HYGIENE
- A61B—DIAGNOSIS; SURGERY; IDENTIFICATION
- A61B6/00—Apparatus for radiation diagnosis, e.g. combined with radiation therapy equipment
- A61B6/50—Clinical applications
- A61B6/504—Clinical applications involving diagnosis of blood vessels, e.g. by angiography
-
- A—HUMAN NECESSITIES
- A61—MEDICAL OR VETERINARY SCIENCE; HYGIENE
- A61B—DIAGNOSIS; SURGERY; IDENTIFICATION
- A61B34/00—Computer-aided surgery; Manipulators or robots specially adapted for use in surgery
- A61B34/10—Computer-aided planning, simulation or modelling of surgical operations
-
- A—HUMAN NECESSITIES
- A61—MEDICAL OR VETERINARY SCIENCE; HYGIENE
- A61B—DIAGNOSIS; SURGERY; IDENTIFICATION
- A61B5/00—Measuring for diagnostic purposes; Identification of persons
- A61B5/02—Detecting, measuring or recording pulse, heart rate, blood pressure or blood flow; Combined pulse/heart-rate/blood pressure determination; Evaluating a cardiovascular condition not otherwise provided for, e.g. using combinations of techniques provided for in this group with electrocardiography or electroauscultation; Heart catheters for measuring blood pressure
- A61B5/02007—Evaluating blood vessel condition, e.g. elasticity, compliance
-
- A—HUMAN NECESSITIES
- A61—MEDICAL OR VETERINARY SCIENCE; HYGIENE
- A61B—DIAGNOSIS; SURGERY; IDENTIFICATION
- A61B5/00—Measuring for diagnostic purposes; Identification of persons
- A61B5/02—Detecting, measuring or recording pulse, heart rate, blood pressure or blood flow; Combined pulse/heart-rate/blood pressure determination; Evaluating a cardiovascular condition not otherwise provided for, e.g. using combinations of techniques provided for in this group with electrocardiography or electroauscultation; Heart catheters for measuring blood pressure
- A61B5/021—Measuring pressure in heart or blood vessels
- A61B5/0215—Measuring pressure in heart or blood vessels by means inserted into the body
- A61B5/02158—Measuring pressure in heart or blood vessels by means inserted into the body provided with two or more sensor elements
-
- A—HUMAN NECESSITIES
- A61—MEDICAL OR VETERINARY SCIENCE; HYGIENE
- A61B—DIAGNOSIS; SURGERY; IDENTIFICATION
- A61B6/00—Apparatus for radiation diagnosis, e.g. combined with radiation therapy equipment
- A61B6/02—Devices for diagnosis sequentially in different planes; Stereoscopic radiation diagnosis
- A61B6/03—Computerised tomographs
- A61B6/032—Transmission computed tomography [CT]
-
- A—HUMAN NECESSITIES
- A61—MEDICAL OR VETERINARY SCIENCE; HYGIENE
- A61B—DIAGNOSIS; SURGERY; IDENTIFICATION
- A61B6/00—Apparatus for radiation diagnosis, e.g. combined with radiation therapy equipment
- A61B6/44—Constructional features of apparatus for radiation diagnosis
- A61B6/4417—Constructional features of apparatus for radiation diagnosis related to combined acquisition of different diagnostic modalities
-
- A—HUMAN NECESSITIES
- A61—MEDICAL OR VETERINARY SCIENCE; HYGIENE
- A61B—DIAGNOSIS; SURGERY; IDENTIFICATION
- A61B6/00—Apparatus for radiation diagnosis, e.g. combined with radiation therapy equipment
- A61B6/46—Apparatus for radiation diagnosis, e.g. combined with radiation therapy equipment with special arrangements for interfacing with the operator or the patient
- A61B6/461—Displaying means of special interest
-
- A—HUMAN NECESSITIES
- A61—MEDICAL OR VETERINARY SCIENCE; HYGIENE
- A61B—DIAGNOSIS; SURGERY; IDENTIFICATION
- A61B6/00—Apparatus for radiation diagnosis, e.g. combined with radiation therapy equipment
- A61B6/52—Devices using data or image processing specially adapted for radiation diagnosis
- A61B6/5211—Devices using data or image processing specially adapted for radiation diagnosis involving processing of medical diagnostic data
- A61B6/5217—Devices using data or image processing specially adapted for radiation diagnosis involving processing of medical diagnostic data extracting a diagnostic or physiological parameter from medical diagnostic data
-
- A—HUMAN NECESSITIES
- A61—MEDICAL OR VETERINARY SCIENCE; HYGIENE
- A61B—DIAGNOSIS; SURGERY; IDENTIFICATION
- A61B6/00—Apparatus for radiation diagnosis, e.g. combined with radiation therapy equipment
- A61B6/52—Devices using data or image processing specially adapted for radiation diagnosis
- A61B6/5211—Devices using data or image processing specially adapted for radiation diagnosis involving processing of medical diagnostic data
- A61B6/5229—Devices using data or image processing specially adapted for radiation diagnosis involving processing of medical diagnostic data combining image data of a patient, e.g. combining a functional image with an anatomical image
- A61B6/5247—Devices using data or image processing specially adapted for radiation diagnosis involving processing of medical diagnostic data combining image data of a patient, e.g. combining a functional image with an anatomical image combining images from an ionising-radiation diagnostic technique and a non-ionising radiation diagnostic technique, e.g. X-ray and ultrasound
-
- A—HUMAN NECESSITIES
- A61—MEDICAL OR VETERINARY SCIENCE; HYGIENE
- A61B—DIAGNOSIS; SURGERY; IDENTIFICATION
- A61B8/00—Diagnosis using ultrasonic, sonic or infrasonic waves
- A61B8/04—Measuring blood pressure
-
- A—HUMAN NECESSITIES
- A61—MEDICAL OR VETERINARY SCIENCE; HYGIENE
- A61B—DIAGNOSIS; SURGERY; IDENTIFICATION
- A61B8/00—Diagnosis using ultrasonic, sonic or infrasonic waves
- A61B8/06—Measuring blood flow
-
- A—HUMAN NECESSITIES
- A61—MEDICAL OR VETERINARY SCIENCE; HYGIENE
- A61B—DIAGNOSIS; SURGERY; IDENTIFICATION
- A61B8/00—Diagnosis using ultrasonic, sonic or infrasonic waves
- A61B8/08—Detecting organic movements or changes, e.g. tumours, cysts, swellings
- A61B8/0891—Detecting organic movements or changes, e.g. tumours, cysts, swellings for diagnosis of blood vessels
-
- G—PHYSICS
- G16—INFORMATION AND COMMUNICATION TECHNOLOGY [ICT] SPECIALLY ADAPTED FOR SPECIFIC APPLICATION FIELDS
- G16H—HEALTHCARE INFORMATICS, i.e. INFORMATION AND COMMUNICATION TECHNOLOGY [ICT] SPECIALLY ADAPTED FOR THE HANDLING OR PROCESSING OF MEDICAL OR HEALTHCARE DATA
- G16H50/00—ICT specially adapted for medical diagnosis, medical simulation or medical data mining; ICT specially adapted for detecting, monitoring or modelling epidemics or pandemics
- G16H50/30—ICT specially adapted for medical diagnosis, medical simulation or medical data mining; ICT specially adapted for detecting, monitoring or modelling epidemics or pandemics for calculating health indices; for individual health risk assessment
-
- A—HUMAN NECESSITIES
- A61—MEDICAL OR VETERINARY SCIENCE; HYGIENE
- A61B—DIAGNOSIS; SURGERY; IDENTIFICATION
- A61B34/00—Computer-aided surgery; Manipulators or robots specially adapted for use in surgery
- A61B34/10—Computer-aided planning, simulation or modelling of surgical operations
- A61B2034/101—Computer-aided simulation of surgical operations
-
- A—HUMAN NECESSITIES
- A61—MEDICAL OR VETERINARY SCIENCE; HYGIENE
- A61B—DIAGNOSIS; SURGERY; IDENTIFICATION
- A61B90/00—Instruments, implements or accessories specially adapted for surgery or diagnosis and not covered by any of the groups A61B1/00 - A61B50/00, e.g. for luxation treatment or for protecting wound edges
- A61B90/36—Image-producing devices or illumination devices not otherwise provided for
- A61B90/37—Surgical systems with images on a monitor during operation
- A61B2090/373—Surgical systems with images on a monitor during operation using light, e.g. by using optical scanners
- A61B2090/3735—Optical coherence tomography [OCT]
-
- A—HUMAN NECESSITIES
- A61—MEDICAL OR VETERINARY SCIENCE; HYGIENE
- A61B—DIAGNOSIS; SURGERY; IDENTIFICATION
- A61B5/00—Measuring for diagnostic purposes; Identification of persons
- A61B5/68—Arrangements of detecting, measuring or recording means, e.g. sensors, in relation to patient
- A61B5/6846—Arrangements of detecting, measuring or recording means, e.g. sensors, in relation to patient specially adapted to be brought in contact with an internal body part, i.e. invasive
- A61B5/6847—Arrangements of detecting, measuring or recording means, e.g. sensors, in relation to patient specially adapted to be brought in contact with an internal body part, i.e. invasive mounted on an invasive device
- A61B5/6852—Catheters
-
- A—HUMAN NECESSITIES
- A61—MEDICAL OR VETERINARY SCIENCE; HYGIENE
- A61B—DIAGNOSIS; SURGERY; IDENTIFICATION
- A61B5/00—Measuring for diagnostic purposes; Identification of persons
- A61B5/72—Signal processing specially adapted for physiological signals or for diagnostic purposes
- A61B5/7235—Details of waveform analysis
- A61B5/7264—Classification of physiological signals or data, e.g. using neural networks, statistical classifiers, expert systems or fuzzy systems
-
- G—PHYSICS
- G16—INFORMATION AND COMMUNICATION TECHNOLOGY [ICT] SPECIALLY ADAPTED FOR SPECIFIC APPLICATION FIELDS
- G16H—HEALTHCARE INFORMATICS, i.e. INFORMATION AND COMMUNICATION TECHNOLOGY [ICT] SPECIALLY ADAPTED FOR THE HANDLING OR PROCESSING OF MEDICAL OR HEALTHCARE DATA
- G16H50/00—ICT specially adapted for medical diagnosis, medical simulation or medical data mining; ICT specially adapted for detecting, monitoring or modelling epidemics or pandemics
- G16H50/20—ICT specially adapted for medical diagnosis, medical simulation or medical data mining; ICT specially adapted for detecting, monitoring or modelling epidemics or pandemics for computer-aided diagnosis, e.g. based on medical expert systems
Definitions
- the present disclosure relates generally to the assessment of vessels and, in particular, the assessment of the severity of a blockage or other restriction to the flow of fluid through a vessel and the treatment thereof. Aspects of the present disclosure are particularly suited for evaluation of biological vessels in some instances. For example, some particular embodiments of the present disclosure are specifically configured for the evaluation of human blood vessels.
- FFR fractional flow reserve
- a distal pressure measurement taken on the distal side of the stenosis
- a proximal pressure measurement taken on the proximal side of the stenosis
- FFR provides an index of stenosis severity that allows determination as to whether the blockage limits blood flow within the vessel to an extent that treatment is required.
- the normal value of FFR in a healthy vessel is 1.00, while values less than about 0.80 are generally deemed significant and require treatment.
- Common treatment options include percutaneous coronary intervention (PCI or angioplasty), stenting, or coronary artery bypass graft (CABG) surgery. As with all medical procedures, certain risks are associated with PCI, stenting, and CABG procedures.
- a stenosis is sometimes observed visually and roughly estimated based on experience.
- a patient's vasculature can be visualized using angiography.
- the locations of stenoses in a vessel can be difficult to visualize in a grayscale angiographic image.
- the use of pressure data can improve the interpretation of information gleaned from an angiogram.
- the severity of stenosis can also be better understood when efficiently visualized in relation to an angiographic image in connection with such data.
- intravascular imaging such as intravascular ultrasound (IVUS) or optical coherence tomography (OCT).
- IVUS intravascular ultrasound
- OCT optical coherence tomography
- intravascular imaging can be utilized to provide a cross-sectional image of the vessel and/or characterize the type(s) of tissue/plaque present.
- Embodiments of the present disclosure are directed to providing an objective recommendation based on co-registered physiological data.
- One general aspect includes a method of evaluating a vessel of a patient, the method comprising: obtaining image data for the vessel of the patient; obtaining physiological measurements for the vessel of the patient; co-registering the obtained physiological measurements with the obtained image data such that the physiological measurements are associated with corresponding portions of the vessel of the patient; analyzing the co-registered physiology measurements to identify a region of interest; and outputting, to a user interface, a suggested diagnostic procedure for the region of interest based on the analysis of the co-registered physiology measurements.
- the obtained physiological measurements include pressure measurements, including a pressure ratio.
- the suggested diagnostic procedure includes an intravascular imaging procedure.
- the suggested intravascular imaging procedure may include at least one of an intravascular ultrasound (IVUS) procedure and an optical coherence tomography (OCT) procedure.
- the suggested diagnostic procedure may also include an intravascular flow measurement procedure.
- the obtained physiological measurements include flow measurements.
- the suggested diagnostic procedure includes at least one of an intravascular imaging procedure and an intravascular pressure measurement procedure.
- the obtained image data may include image data received from an extravascular imaging system, which may include at least one of a two-dimensional angiographic image, a three-dimensional angiographic image, or a computed tomography angiographic (CTA) image.
- CTA computed tomography angiographic
- a system for evaluating a vessel of a patient comprising: a processing system in communication with at least one intravascular device, the processing system configured to: obtain image data for the vessel of the patient; obtain physiological measurements for the vessel of the patient from the at least one intravascular device; co-register the obtained physiological measurements with the obtained image data such that the physiological measurements are associated with corresponding portions of the vessel of the patient; analyze the co-registered physiology measurements to identify a region of interest; and output, to a user interface, a suggested diagnostic procedure for the region of interest based on the analysis of the co-registered physiology measurements.
- the at least one intravascular devices includes a pressure-sensing intravascular device and wherein the obtained physiological measurements include pressure measurements.
- the processing system may be configured to calculate a pressure ratio based on the obtained pressure measurements.
- the suggested diagnostic procedure may also include an intravascular imaging procedure.
- the suggested intravascular imaging procedure includes at least one of an intravascular ultrasound (IVUS) procedure and an optical coherence tomography (OCT) procedure.
- the suggested diagnostic procedure may include an intravascular flow measurement procedure, or may include at least one of an intravascular imaging procedure and an intravascular pressure measurement procedure.
- the obtained physiological measurements include flow measurements.
- the obtained image data includes image data received from an extravascular imaging system, or may include at least one of a two-dimensional angiographic image, a three-dimensional angiographic image, or a computed tomography angiographic (CTA) image.
- CTA computed tomography angiographic
- Physiological measurement data and the coronary angiogram typically behave as complementary, yet segregated sources of information.
- the coronary angiogram has been used to make treatment decisions.
- physiological data including, but not limited to, pressure and/or flow measurements, both at hyperemia and rest
- better decisions can be made based on the severity of a blockage by measuring the change in underlying physiological conditions from the beginning of a target artery to the end. Treating a patient based on the severity of this change or delta has shown to improve outcomes and reduce waste from unnecessary procedures.
- the physiological data, as collected real-time is linked or co-registered to a schematic of the coronary arteries or an angiogram.
- the data may also be visually depicted in a way that allows a clinician to interact and assess where severity changes, by sliding markings as placed on the image of the vessel and correlated with the collected physiological data.
- One or more embodiments described herein are also able to prompt user action(s) based on the on collected physiological data. For example, additional diagnostic procedure(s) may be suggested based on potentially problematic anatomical features identified from the obtained physiological data. Additionally, embodiments may recommend performing a particular diagnostic procedure again to confirm the results of a previous medical procedure (e.g., where the obtained physiological data is at odds with expected values). Furthermore, some embodiments prompt a user to consider particular medical procedures in light of the obtained physiological data, such as a percutaneous coronary intervention (PCI) or a coronary artery bypass graft (CABG) surgery.
- PCI percutaneous coronary intervention
- CABG coronary artery bypass graft
- One aspect of the present disclosure includes super-imposing real-time collected pressure and/or flow data (or other physiologic data) onto an angiogram, or a schematic of anatomy and representing the data in a way that helps a clinician determine how/where to intervene (including but not limited to CABG mapping and PCI planning).
- the collected physiology data may include real-time data obtained during a procedure.
- One aspect of the present disclosure includes using the pressure, flow or other physiologic data to identify "regions of interest" where additional diagnostic information would be particularly useful for the purposes of determining how or where to intervene. Because these regions often represent potential medical issues that are best identified and/or characterized using a particular diagnostic procedure, a user can be prompted to gather further information on these regions of interest using the preferred diagnostic procedure(s). These prompts and the recommended diagnostic procedures can be presented to the clinician in a user interface showing the obtained physiological data.
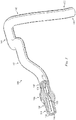
- FIG. 1 is a diagrammatic perspective view of the vessel 100
- FIG. 2 is a partial cross-sectional perspective view of a portion of the vessel 100 taken along section line 2-2 of FIG. 1
- the vessel 100 includes a proximal portion 102 and a distal portion 104.
- a lumen 106 extends along the length of the vessel 100 between the proximal portion 102 and the distal portion 104.
- the lumen 106 is configured to allow the flow of fluid through the vessel.
- the vessel 100 is a blood vessel.
- the vessel 100 is a coronary artery.
- the lumen 106 is configured to facilitate the flow of blood through the vessel 100.
- the vessel 100 includes a stenosis 108 between the proximal portion 102 and the distal portion 104.
- the stenosis 108 is generally representative of any blockage or other structural arrangement that results in a restriction to the flow of fluid through the lumen 106 of the vessel 100.
- Embodiments of the present disclosure are suitable for use in a wide variety of vascular applications, including without limitation coronary, peripheral (including but not limited to lower limb, carotid, and neurovascular), renal, and/or venous.
- the stenosis 108 may be a result of plaque buildup, including without limitation plaque components such as fibrous, fibro-lipidic (fibro fatty), necrotic core, calcified (dense calcium), blood, fresh thrombus, and mature thrombus.
- plaque components such as fibrous, fibro-lipidic (fibro fatty), necrotic core, calcified (dense calcium), blood, fresh thrombus, and mature thrombus.
- the composition of the stenosis will depend on the type of vessel being evaluated. In that regard, it is understood that the concepts of the present disclosure are applicable to virtually any type of blockage or other narrowing of a vessel that results in decreased fluid flow.
- the lumen 106 of the vessel 100 has a diameter 110 proximal of the stenosis 108 and a diameter 112 distal of the stenosis.
- the diameters 110 and 112 are substantially equal to one another.
- the diameters 110 and 112 are intended to represent healthy portions, or at least healthier portions, of the lumen 106 in comparison to stenosis 108. Accordingly, these healthier portions of the lumen 106 are illustrated as having a substantially constant cylindrical profile and, as a result, the height or width of the lumen has been referred to as a diameter.
- these portions of the lumen 106 will also have plaque buildup, a non-symmetric profile, and/or other irregularities, but to a lesser extent than stenosis 108 and, therefore, will not have a cylindrical profile.
- the diameters 110 and 112 are understood to be representative of a relative size or cross-sectional area of the lumen and do not imply a circular cross-sectional profile.
- stenosis 108 includes plaque buildup 114 that narrows the lumen 106 of the vessel 100.
- the plaque buildup 114 does not have a uniform or symmetrical profile, making angiographic evaluation of such a stenosis unreliable.
- the plaque buildup 114 includes an upper portion 116 and an opposing lower portion 118.
- the lower portion 118 has an increased thickness relative to the upper portion 116 that results in a non-symmetrical and non-uniform profile relative to the portions of the lumen proximal and distal of the stenosis 108.
- the plaque buildup 114 decreases the available space for fluid to flow through the lumen 106.
- the cross-sectional area of the lumen 106 is decreased by the plaque buildup 114.
- the lumen 106 has a height 120, which is representative of a reduced size or cross-sectional area relative to the diameters 110 and 112 proximal and distal of the stenosis 108.
- the stenosis 108, including plaque buildup 114 is exemplary in nature and should be considered limiting in any way. In that regard, it is understood that the stenosis 108 has other shapes and/or compositions that limit the flow of fluid through the lumen 106 in other instances. While the vessel 100 is illustrated in FIGS.
- instruments 130 and 132 may be any form of device, instrument, or probe sized and shaped to be positioned within a vessel.
- instrument 130 is generally representative of a guide wire
- instrument 132 is generally representative of a catheter.
- instrument 130 extends through a central lumen of instrument 132.
- the instruments 130 and 132 take other forms.
- the instruments 130 and 132 are of similar form in some embodiments.
- both instruments 130 and 132 are guide wires.
- both instruments 130 and 132 are catheters.
- the instruments 130 and 132 are of different form in some embodiments, such as the illustrated embodiment, where one of the instruments is a catheter and the other is a guide wire. Further, in some instances, the instruments 130 and 132 are disposed coaxial with one another, as shown in the illustrated embodiment of FIG. 3 . In other instances, one of the instruments extends through an off-center lumen of the other instrument. In yet other instances, the instruments 130 and 132 extend side-by-side. In some particular embodiments, at least one of the instruments is as a rapid-exchange device, such as a rapid-exchange catheter. In such embodiments, the other instrument is a buddy wire or other device configured to facilitate the introduction and removal of the rapid-exchange device. Further still, in other instances, instead of two separate instruments 130 and 132 a single instrument is utilized. In some embodiments, the single instrument incorporates aspects of the functionalities (e.g., data acquisition) of both instruments 130 and 132.
- the single instrument incorporates aspects of the functionalities (e.g., data acquisition) of both instruments
- Instrument 130 is configured to obtain diagnostic information about the vessel 100.
- the instrument 130 includes one or more sensors, transducers, and/or other monitoring elements configured to obtain the diagnostic information about the vessel.
- the diagnostic information includes one or more of pressure, flow (velocity), images (including images obtained using ultrasound ( e.g., IVUS), OCT, thermal, and/or other imaging techniques), temperature, and/or combinations thereof.
- the one or more sensors, transducers, and/or other monitoring elements are positioned adjacent a distal portion of the instrument 130 in some instances.
- the one or more sensors, transducers, and/or other monitoring elements are positioned less than 30 cm, less than 10 cm, less than 5 cm, less than 3 cm, less than 2 cm, and/or less than 1 cm from a distal tip 134 of the instrument 130 in some instances. In some instances, at least one of the one or more sensors, transducers, and/or other monitoring elements is positioned at the distal tip of the instrument 130.
- the instrument 130 can include at least one element configured to monitor pressure within the vessel 100.
- the pressure monitoring element can take the form a piezo-resistive pressure sensor, a piezo-electric pressure sensor, a capacitive pressure sensor, an electromagnetic pressure sensor, a fluid column (the fluid column being in communication with a fluid column sensor that is separate from the instrument and/or positioned at a portion of the instrument proximal of the fluid column), an optical pressure sensor, and/or combinations thereof.
- one or more features of the pressure monitoring element are implemented as a solid-state component manufactured using semiconductor and/or other suitable manufacturing techniques.
- the instrument 130 is sized such that it can be positioned through the stenosis 108 without significantly impacting fluid flow across the stenosis, which would impact the distal pressure reading. Accordingly, in some instances the instrument 130 has an outer diameter of 0.018" or less. In some embodiments, the instrument 130 has an outer diameter of 0.014" or less. In other embodiments, the instrument 130 has an outer diameter of 0.035" or less.
- Instrument 132 is also configured to obtain diagnostic information about the vessel 100. In some instances, instrument 132 is configured to obtain the same diagnostic information as instrument 130. In other instances, instrument 132 is configured to obtain different diagnostic information than instrument 130, which may include additional diagnostic information, less diagnostic information, and/or alternative diagnostic information.
- the diagnostic information obtained by instrument 132 includes one or more of pressure, flow (velocity), images (including images obtained using ultrasound ( e.g., IVUS), OCT, thermal, and/or other imaging techniques), temperature, and/or combinations thereof. Instrument 132 includes one or more sensors, transducers, and/or other monitoring elements configured to obtain this diagnostic information. In that regard, the one or more sensors, transducers, and/or other monitoring elements are positioned adjacent a distal portion of the instrument 132 in some instances.
- the one or more sensors, transducers, and/or other monitoring elements are positioned less than 30 cm, less than 10 cm, less than 5 cm, less than 3 cm, less than 2 cm, and/or less than 1 cm from a distal tip 136 of the instrument 132 in some instances. In some instances, at least one of the one or more sensors, transducers, and/or other monitoring elements is positioned at the distal tip of the instrument 132.
- instrument 132 can also include at least one element configured to monitor pressure within the vessel 100.
- the pressure monitoring element can take the form a piezo-resistive pressure sensor, a piezo-electric pressure sensor, a capacitive pressure sensor, an electromagnetic pressure sensor, a fluid column (the fluid column being in communication with a fluid column sensor that is separate from the instrument and/or positioned at a portion of the instrument proximal of the fluid column), an optical pressure sensor, and/or combinations thereof.
- one or more features of the pressure monitoring element are implemented as a solid-state component manufactured using semiconductor and/or other suitable manufacturing techniques.
- Currently available catheter products suitable for use with one or more of Siemens AXIOM Sensis, Mennen Horizon XVu, and Philips Xper IM Physiomonitoring 5 and include pressure monitoring elements can be utilized for instrument 132 in some instances.
- At least one of the instruments 130 and 132 is configured to monitor a pressure within the vessel 100 distal of the stenosis 108 and at least one of the instruments 130 and 132 is configured to monitor a pressure within the vessel proximal of the stenosis.
- the instruments 130, 132 are sized and shaped to allow positioning of the at least one element configured to monitor pressure within the vessel 100 to be positioned proximal and/or distal of the stenosis 108 as necessary based on the configuration of the devices.
- FIG. 3 illustrates a position 138 suitable for measuring pressure distal of the stenosis 108.
- the position 138 is less than 5 cm, less than 3 cm, less than 2 cm, less than 1 cm, less than 5 mm, and/or less than 2.5 mm from the distal end of the stenosis 108 (as shown in FIG. 2 ) in some instances.
- FIG. 3 also illustrates a plurality of suitable positions for measuring pressure proximal of the stenosis 108.
- positions 140, 142, 144, 146, and 148 each represent a position that is suitable for monitoring the pressure proximal of the stenosis in some instances.
- the positions 140, 142, 144, 146, and 148 are positioned at varying distances from the proximal end of the stenosis 108 ranging from more than 20 cm down to about 5 mm or less.
- the proximal pressure measurement will be spaced from the proximal end of the stenosis. Accordingly, in some instances, the proximal pressure measurement is taken at a distance equal to or greater than an inner diameter of the lumen of the vessel from the proximal end of the stenosis.
- the proximal pressure measurement is generally taken at a position proximal of the stenosis and distal of the aorta, within a proximal portion of the vessel.
- the proximal pressure measurement is taken from a location inside the aorta. In other instances, the proximal pressure measurement is taken at the root or ostium of the coronary artery.
- At least one of the instruments 130 and 132 is configured to monitor pressure within the vessel 100 while being moved through the lumen 106.
- instrument 130 is configured to be moved through the lumen 106 and across the stenosis 108.
- the instrument 130 is positioned distal of the stenosis 108 and moved proximally (i.e., pulled back) across the stenosis to a position proximal of the stenosis in some instances.
- the instrument 130 is positioned proximal of the stenosis 108 and moved distally across the stenosis to a position distal of the stenosis.
- Movement of the instrument 130 is controlled manually by medical personnel (e.g., hand of a surgeon) in some embodiments.
- movement of the instrument 130, either proximally or distally is controlled automatically by a movement control device (e.g., a pullback device, such as the Trak Back® II Device available from Volcano Corporation).
- a movement control device e.g., a pullback device, such as the Trak Back® II Device available from Volcano Corporation.
- the movement control device controls the movement of the instrument 130 at a selectable and known speed (e.g., 2.0 mm/s, 1.0 mm/s, 0.5 mm/s, 0.2 mm/s, etc.) in some instances.
- the position of the distal tip 134 relative to the patient's vasculature may be estimated with sufficient precision to provide for the co-registration of data obtained by the instrument 130 with a computer model of the patient's vasculature obtained from angiography. Movement of the instrument 130 through the vessel is continuous for each pullback or push through, in some instances. In other instances, the instrument 130 is moved step-wise through the vessel ( i.e., repeatedly moved a fixed amount of distance and/or a fixed amount of time). Some aspects of the visual depictions discussed below are particularly suited for embodiments where at least one of the instruments 130 and 132 is moved through the lumen 106. Further, in some particular instances, aspects of the visual depictions discussed below are particularly suited for embodiments where a single instrument is moved through the lumen 106, with or without the presence of a second instrument.
- the instruments 130 and 132 may be used to provide instantaneous wave free ratio (iFR ®) measurements instead of, or in addition, to traditional FFR measurements as described above.
- iFR ® measurements may be obtained using products produced by the Volcano Corporation.
- FFR data and iFR data may be used together to assess the patient.
- the FFR or iFR data may be used to determine whether the disease is focal or diffuse.
- the pullback curve based on FFR or iFR may be used to determine whether the patient's disease is focal or diffuse.
- FIG. 4 shown therein is a system 150 according to an embodiment of the present disclosure.
- FIG. 4 is a diagrammatic, schematic view of the system 150.
- the system 150 includes an instrument 152.
- instrument 152 is suitable for use as at least one of instruments 130 and 132 discussed above.
- the instrument 152 includes features similar to those discussed above with respect to instruments 130 and 132 in some instances.
- the instrument 152 is a guide wire having a distal portion 154 and a housing 156 positioned adjacent the distal portion.
- the housing 156 is spaced approximately 3 cm from a distal tip of the instrument 152.
- the housing 156 is configured to house one or more sensors, transducers, and/or other monitoring elements configured to obtain the diagnostic information about the vessel.
- the housing 156 contains at least a pressure sensor configured to monitor a pressure within a lumen in which the instrument 152 is positioned.
- a shaft 158 extends proximally from the housing 156.
- a torque device 160 is positioned over and coupled to a proximal portion of the shaft 158.
- a proximal end portion 162 of the instrument 152 is coupled to a connector 164.
- a cable 166 extends from connector 164 to a connector 168.
- connector 168 is configured to be plugged into an interface 170.
- interface 170 is a patient interface module (PIM) in some instances.
- PIM patient interface module
- the cable 166 is replaced with a wireless connection.
- various communication pathways between the instrument 152 and the interface 170 may be utilized, including physical connections (including electrical, optical, and/or fluid connections), wireless connections, and/or combinations thereof.
- the interface 170 is communicatively coupled to a computing device 172 via a connection 174.
- Computing device 172 is generally representative of any device suitable for performing the processing and analysis techniques discussed within the present disclosure.
- the computing device 172 includes a processor, random access memory, and a storage medium.
- the computing device 172 is programmed to execute steps associated with the data acquisition and analysis described herein. Accordingly, it is understood that any steps related to data acquisition, data processing, instrument control, and/or other processing or control aspects of the present disclosure may be implemented by the computing device using corresponding instructions stored on or in a non-transitory computer-readable medium accessible by the computing device.
- the computing device 172 is a console device.
- the computing device 172 is similar to the s5TM Imaging System or the s5iTM Imaging System, each available from Volcano Corporation. In some instances, the computing device 172 is portable ( e.g., handheld, on a rolling cart, etc.). Further, it is understood that in some instances the computing device 172 comprises a plurality of computing devices. In that regard, it is particularly understood that the different processing and/or control aspects of the present disclosure may be implemented separately or within predefined groupings using a plurality of computing devices. Any divisions and/or combinations of the processing and/or control aspects described below across multiple computing devices are within the scope of the present disclosure.
- the computing device 172 may acquire data from many different sources. For example, as described herein the computing device 172 may communicate through the interface 170 to collect physiological measurements from instruments, such as instruments 130 and 132, positioned within a patient's vasculature. Additionally, the computing device 172 may include a network interface card or similar interface to communicate with a network 180. The computing device 172 may access angiography data to produce a model of the patient's vasculature or may access a pre-computed model. For example, an existing model of the patient's vasculature may have been generated based on previously acquired data. The computing device 172 may be coupled to a display 182 by which images, data, and user interfaces may be presented to a clinician before, after, and/or during a procedure.
- a display 182 by which images, data, and user interfaces may be presented to a clinician before, after, and/or during a procedure.
- connection 174 facilitate communication between the one or more sensors, transducers, and/or other monitoring elements of the instrument 152 and the computing device 172.
- this communication pathway is exemplary in nature and should not be considered limiting in any way.
- any communication pathway between the instrument 152 and the computing device 172 may be utilized, including physical connections (including electrical, optical, and/or fluid connections), wireless connections, and/or combinations thereof.
- the connection 174 is wireless in some instances.
- the connection 174 includes a communication link over a network (e.g., intranet, internet, telecommunications network, and/or other network).
- the computing device 172 may be coupled to the interface 170 by the network 180.
- the computing device 172 is positioned remote from an operating area where the instrument 152 is being used in some instances.
- Having the connection 174 include the connection to the network 180 can facilitate communication between the instrument 152 and the remote computing device 172 regardless of whether the computing device is in an adjacent room, an adjacent building, or in a different state/country.
- the communication pathway between the instrument 152 and the computing device 172 is a secure connection in some instances.
- the data communicated over one or more portions of the communication pathway between the instrument 152 and the computing device 172 is encrypted.
- the system 150 also includes an instrument 175.
- instrument 175 is suitable for use as at least one of instruments 130 and 132 discussed above. Accordingly, in some instances the instrument 175 includes features similar to those discussed above with respect to instruments 130 and 132 in some instances.
- the instrument 175 is a catheter-type device.
- the instrument 175 includes one or more sensors, transducers, and/or other monitoring elements adjacent a distal portion of the instrument configured to obtain the diagnostic information about the vessel.
- the instrument 175 includes a pressure sensor configured to monitor a pressure within a lumen in which the instrument 175 is positioned.
- the instrument 175 is in communication with an interface 176 via connection 177.
- interface 176 is a hemodynamic monitoring system or other control device, such as Siemens AXIOM Sensis, Mennen Horizon XVu, and Philips Xper IM Physiomonitoring 5.
- instrument 175 is a pressure-sensing catheter that includes fluid column extending along its length.
- interface 176 includes a hemostasis valve fluidly coupled to the fluid column of the catheter, a manifold fluidly coupled to the hemostasis valve, and tubing extending between the components as necessary to fluidly couple the components.
- the fluid column of the catheter is in fluid communication with a pressure sensor via the valve, manifold, and tubing.
- the pressure sensor is part of interface 176.
- the pressure sensor is a separate component positioned between the instrument 175 and the interface 176.
- the interface 176 is communicatively coupled to the computing device 172 via a connection 178.
- interface 176 and connections 177 and 178 facilitate communication between the one or more sensors, transducers, and/or other monitoring elements of the instrument 175 and the computing device 172.
- this communication pathway is exemplary in nature and should not be considered limiting in any way.
- any communication pathway between the instrument 175 and the computing device 172 may be utilized, including physical connections (including electrical, optical, and/or fluid connections), wireless connections, and/or combinations thereof, and connections through the network 180.
- the connection 178 is wireless in some instances.
- connection 178 includes a communication link over a network (e.g., intranet, internet, telecommunications network, and/or other network) like the network 180.
- a network e.g., intranet, internet, telecommunications network, and/or other network
- the computing device 172 is positioned remote from an operating area where the instrument 175 is being used in some instances. Having the connection 178 include a connection over the network 180 can facilitate communication between the instrument 175 and the remote computing device 172 regardless of whether the computing device is in an adjacent room, an adjacent building, or in a different state/country.
- the communication pathway between the instrument 175 and the computing device 172 is a secure connection in some instances.
- the data communicated over one or more portions of the communication pathway between the instrument 175 and the computing device 172 is encrypted.
- the system 150 does not include interface 170 and/or interface 176.
- the connector 168 (or other similar connector in communication with instrument 152 or instrument 175) may plug into a port associated with computing device 172.
- the instruments 152, 175 may communicate wirelessly with the computing device 172.
- the communication pathway between either or both of the instruments 152, 175 and the computing device 172 may have no intermediate nodes (i.e., a direct connection), one intermediate node between the instrument and the computing device, or a plurality of intermediate nodes between the instrument and the computing device.
- Diagnostic information within a vasculature of interest can be obtained using one or more of instruments 130, 132, 152, and 175.
- diagnostic information is obtained for one or more coronaries arteries, peripheral arteries, cerebrovascular vessels, etc.
- the diagnostic information can include pressure-related values, flow-related values, etc.
- Pressure-related values can include distal pressure values, proximal pressure values, Pd, Pa, FFR, Pd/Pa, iFR, etc.
- Flow-related values can include coronary flow reserve (CFR) (e.g., maximum increase in blood flow through the coronary arteries above the normal resting volume), basal stenosis resistance index (BSR), etc.
- CFR coronary flow reserve
- BSR basal stenosis resistance index
- the diagnostic information can include angiographic images and/or other two-dimensional or three-dimensional depictions of a patient's vasculature. Such angiographic images may be accessed via the network 180. For example, angiographic images of the patient's vasculature and/or associated models may be stored in a data center and accessed by the computing device 172 for use during a procedure.
- the diagnostic information and/or data obtained by instruments 130, 132, 152, and/or 175 are correlated or co-registered to angiographic image(s) and/or other two-dimensional or three-dimensional depictions of a patient's vasculature. Co-registration can be completed using techniques disclosed in U.S. Patent No.
- diagnostic information and/or data is correlated to vessel images using techniques similar to those described in U.S. Patent Application No. 14/144,240 , titled “DEVICES, SYSTEMS, AND METHODS FOR ASSESSMENT OF VESSELS” and filed on December 30, 2013, and which claims priority to U.S. Provisional Patent Application No.
- angiogram data as may be provided to the clinician in a user interface 500, such as may be provided by the computing device 172 of FIG. 4 .
- the user interface 500 includes a window 502 that may be presented in the display 182 as seen in FIG. 4 .
- the window displays angiogram data that includes cardiac tissue 506 and vasculature 508 obtained using a contrast agent.
- the angiogram 504 may be a three-dimensional angiogram that may be manipulated by the clinician to provide different views, including different perspective views and/or cross-sectional views, of the patient's vasculature.
- the data may be parsed by an image-processing component provided by the system 150 of FIG. 4 to segment the patient's vasculature and estimate certain features thereof.
- the parsing of the data may be performed to extract image-based physiology measurements which may be automatically displayed without the continued interaction of a clinician.
- the image-based physiology measurements may be extracted after an angiogram collection process is complete.
- the image-based physiology measurements may include a dominance classification, a degree of occlusion of a lesion, which may be expressed as a percent diameter stenosis, a classification of a lesion, a degree of bending of a vessel of the vessel system, a length of a lesion, and/or a degree of calcification of a lesion.
- one region of interest 510 is shown on the Left Coronary Artery while another region of interest 512 is shown on a branch of the Right Coronary Artery.
- regions of interest 510, 512 may be assigned by the computing system 174 and shown on the user interface 500 based on anomalous measurements such as sharp changes in pressure readings.
- the user interface 500 may also display a recommendation for each region of interest as shown in FIG. 5 which may include a diagnostic procedure. For the region of interest 510 on the LCA, the user interface 500 recommends that a clinician perform an IVUS procedure on the region of interest 510. Multiple recommendations may also be displayed on the user interface 500 for problematic areas such as at region of interest 512, where the branch in the RCA could cause anomalous readings. For this region of interest 512, the user interface 500 recommends that the clinician perform an iFR or FFR procedure followed by an IVUS procedure for added certainty.
- These recommendations may be based on multiple modalities of physiological data including, but not limited to, pressure measurements, flow (velocity) measurements, images (including images obtained using ultrasound ( e.g., IVUS), OCT, thermal measurements, (and data collected from other imaging techniques), temperature measurements, and/or combinations thereof.
- the clinician may navigate the instruments 130 and/or 132 through the patient's vasculature, collecting physiology measurements therein.
- the physiology measurements may be stored in a memory of the computing device 172 and also displayed on the display 182.
- co-registration techniques and others that may be known to those of skill in the art may be used to co-register physiology measurements to specific portions of the patient's vasculature 508.
- FIG. 6 shown therein is a depiction of a user interface 600 for evaluating a vessel based on obtained physiology measurements (as depicted, pressure measurements, but may also include flow volume, flow velocity, and/or other intravascular physiology measurements or calculations based thereon) according to embodiments of the present disclosure.
- the user interface may be displayed on a touch-sensitive display. A clinician can view, analyze, and interact with the pressure data and/or visual representations of the pressure data.
- the screen display 600 includes multiple tabs, including an iFR tab 602, an FFR tab 604, a patient tab 606, and a settings tab 608.
- the iFR tab 602 has been selected and displayed to a user.
- the iFR tab 602 includes a graph 610 and a corresponding pressure waveform plot 612.
- the screen display 600 also includes a window 614 that shows a calculated pressure ratio (e.g., FFR, iFR, or otherwise).
- the screen display 600 also includes a window 616 showing the runs or pullbacks available for display to the user. In the illustrated embodiment, two different runs are available and identified by a corresponding time stamp. In that regard, a user can select the desired run from the window 616 and the data shown in the graph 610 and pressure waveform plot 612 will update accordingly.
- the screen display 600 also includes zoom buttons 618, 620 that allow a user to zoom out or in, respectively, on the graph 610 and the pressure waveform plot 612.
- the screen display 600 includes a ruler 622 showing the relative scale of the graph 610 and the pressure waveform plot 612.
- the ruler 622 provides a dimensional scale of the graphical display of the graph 610 and/or the pressure waveform plot 612 relative to the vessel length and/or the pullback length.
- the scale of the ruler 622 automatically updates in response to selective actuation of the zoom buttons 618, 620 in some implementations.
- the screen display 600 also includes a slider 624.
- the slider 624 allows the user to move along the length of the vessel and/or the corresponding pullback data.
- the left end of the slider 624 corresponds to the beginning of the pullback and the right end of the slider corresponds to the end of the pullback.
- a user can see corresponding portions of the pressure data in the graph 610 and the pressure waveform plot 612. Accordingly, a user can focus on certain portions of the vessel and pullback data using the zoom buttons 618, 620 in combination with the slider 624.
- the numerical value of the pressure ratio displayed in window 614 is updated based on the position of the slider and/or.
- the numerical value of the pressure ratio displayed in window 614 is based solely on the pressure data being displayed in the graph 610 and the pressure waveform plot 612. However, in other instances the numerical value of the pressure ratio displayed in window 614 is based one of or a combination of the pressure data being displayed in the graph 610 and the pressure waveform plot 612 and pressure data not displayed in the graph 610 and the pressure waveform plot 612.
- the graph 610 and pressure waveform plot 612 of screen display 600 illustrate aspects of pressure measurements obtained as one instrument is moved through the vessel and another instrument is maintained at a fixed location.
- the pressure measurements are representative of a pressure ratio between a fixed location within the vessel and the moving position of the instrument as the instrument is moved through the vessel.
- a proximal pressure measurement is obtained at a fixed location within the vessel while the instrument is pulled back through the vessel from a first position distal of the position where the proximal pressure measurement is obtained to a second position more proximal than the first position (i.e., closer to the fixed position of the proximal pressure measurement).
- the instrument is pushed through the vessel from a first position distal of the proximal pressure measurement location to a second position further distal (i.e., further away from the fixed position of the proximal pressure measurement).
- a distal pressure measurement is obtained at a fixed location within the vessel and the instrument is pulled back through the vessel from a first position proximal of the fixed location of the distal pressure measurement to a second position more proximal than the first position (i.e., further away from the fixed position of the distal pressure measurement).
- a distal pressure measurement is obtained at a fixed location within the vessel and the instrument is pushed through the vessel from a first position proximal of the fixed location of the distal pressure measurement to a second position less proximal than the first position (i.e., closer the fixed position of the distal pressure measurement).
- the pressure differential between the two pressure measurements within the vessel is calculated as a ratio of the two pressure measurements (e.g., the moving pressure measurement divided by the fixed location pressure measurement), in some instances.
- the pressure differential is calculated for each heartbeat cycle of the patient.
- the calculated pressure differential is the average pressure differential across a heartbeat cycle in some embodiments.
- the average pressure differential across the heartbeat cycle is utilized to calculate the pressure differential.
- only a portion of the heartbeat cycle is utilized to calculate the pressure differential.
- the pressure differential is an average over the portion or diagnostic window of the heartbeat cycle, in some instances.
- a diagnostic window is selected using one or more of the techniques described in U.S. Patent Application No. 13/460,296, filed April 30, 2012 and titled "DEVICES, SYSTEMS, AND METHODS FOR ASSESSING A VESSEL".
- the diagnostic windows and associated techniques are particularly suitable for use without application of a hyperemic agent to the patient.
- the diagnostic window for evaluating differential pressure across a stenosis without the use of a hyperemic agent is identified based on characteristics and/or components of one or more of proximal pressure measurements, distal pressure measurements, proximal velocity measurements, distal velocity measurements, ECG waveforms, and/or other identifiable and/or measurable aspects of vessel performance.
- various signal processing and/or computational techniques can be applied to the characteristics and/or components of one or more of proximal pressure measurements, distal pressure measurements, proximal velocity measurements, distal velocity measurements, ECG waveforms, and/or other identifiable and/or measurable aspects of vessel performance to identify a suitable diagnostic window.
- the graph 610 shows the pressure ratio over time.
- the graph 610 shows the pressure ratio calculated over the time of a pullback.
- the graph 610 shows an iFR pressure ratio value during a pullback.
- the iFR pressure ratio may be calculated as described in one or more of PCT Patent Application Publication No. WO 2012/093260, filed January 6, 2012 and titled "APPARATUS AND METHOD OF CHARACTERISING A NARROWING IN A FLUID FILLED TUBE," PCT Patent Application Publication No.
- the graph 610 can illustrate the pressure ratio and/or the underlying pressure measurements in any suitable way.
- the representation of the data in graph 610 can be utilized to identify gradients/changes in the pressure ratio and/or the underlying pressure measurements that can be indicative of a significant lesion in the vessel.
- the visual representation of the data can include the pressure measurement(s); a ratio of the pressure measurements; a difference in the pressure measurements; a gradient of the pressure measurement(s), the ratio of the pressure measurements, and/or the difference in the pressure measurements; first or second derivatives of the pressure measurement(s), the ratio of the pressure measurements, and/or the difference in the pressure measurements; and/or combinations thereof.
- the pressure waveform plot 612 shows the corresponding pressure data.
- the pressure waveform plot 612 can include the pressure waveform for the pressure sensing device moved through the vessel during the pullback, the pressure waveform for the stationary pressure sensing device, or both.
- the pressure waveform plot 612 includes the pressure waveforms for both.
- the pressure waveform plot 612 is augmented to highlight or otherwise accentuate the pressure data corresponding to the diagnostic window utilized for the pressure ratio calculations.
- the screen display 600 includes a button 626 indicating that the data is being displayed in a "Live” mode, which indicates that the screen display 600, including graph 610, pressure waveform plot 612, and/or the window 614, is being updated in real time as a procedure is being performed.
- the button 626 of the screen display 600 will indicated that it is in "Playback” or “Review” mode, which indicates that the screen display 600 is showing data obtained previously.
- the "Live” mode it should be noted that the determination of the diagnostic window and/or the calculation of the pressure differential are performed in approximately real time or live to identify the diagnostic window of the heartbeat cycle and calculate the pressure differential.
- calculating the pressure differential in "real time” or “live” within the context of the present disclosure is understood to encompass calculations that occur within 10 seconds of data acquisition. It is recognized, however, that often "real time” or “live” calculations are performed within 1 second of data acquisition. In some instances, the "real time” or “live” calculations are performed concurrent with data acquisition. In some instances the calculations are performed by a processor in the delays between data acquisitions. For example, if data is acquired from the pressure sensing devices for 1 ms every 5 ms, then in the 4 ms between data acquisitions the processor can perform the calculations. It is understood that these timings are for example only and that data acquisition rates, processing times, and/or other parameters surrounding the calculations will vary. In other embodiments, the pressure differential calculation is performed 10 or more seconds after data acquisition. For example, in some embodiments, the data utilized to identify the diagnostic window and/or calculate the pressure differential are stored for later analysis.
- a physician or other treating medical personnel can determine what, if any, treatment should be administered.
- a calculated pressure differential above a threshold value e.g., 0.80 on a scale of 0.00 to 1.00
- a first treatment mode e.g., no treatment, drug therapy, etc.
- a calculated pressure differential below the threshold value is indicative of a second, more invasive treatment mode (e.g., angioplasty, stent, etc.).
- the threshold value is a fixed, preset value.
- the threshold value is selected for a particular patient and/or a particular stenosis of a patient.
- the threshold value for a particular patient may be based on one or more of empirical data, patient characteristics, patient history, physician preference, available treatment options, and/or other parameters.
- region of interest 630 may be assigned by the system 150 based on anomalous readings from the instruments such as drastic pressure changes in the vessel.
- the region of interest 630 is centered around a sharp pressure change in the vessel.
- the screen display 600 may show one or more options for taking further diagnostic measurements of the region of interest 630. Therefore, the screen display 600 shown in FIG. 6 prompts a medical professional to perform an IVUS measurement on the identified section of the vessel which may be further confirmed by a three-dimensional angiogram.
- the coloring and/or other visually distinguishing aspect of the pressure differential measurements depicted in graph 610 and/or window 614 of the screen display 600 of FIG. 6 are configured based on the threshold value in some instances.
- a first color e.g., green, white, or otherwise
- a second color e.g., yellow, gray, or otherwise
- a third color e.g., red, black, or otherwise
- red, black, or otherwise can be utilized to represent values equal to or below the threshold value (e.g., where the threshold value is 0.80 on a scale of 0.00 to 1.00, values of 0.80 and below).
- the graph 610 includes one or more horizontal lines or other depictions representing the threshold value(s). It is appreciated that any number of color combinations, scalings, categories, and/or other characteristics can be utilized to visually represent the relative value of the pressure differential to the threshold value. However, for the sake of brevity Applicants will not explicitly describe the numerous variations herein.
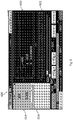
- FIG. 7 shown therein is a plurality of bifurcation lesions that may be detected and classified using imaging data, such as may be provided by IVUS inspection.
- the bifurcations lesions shown are examples of situations where IVUS may be particularly useful in diagnosing vessels and determining appropriate treatment options.
- IVUS may be used in conjunction with other diagnostic procedures to resolve anomalous measurements and provide accurate data.
- FIG. 9 the bifurcation lesions discussed in conjunction with FIG. 7 will be referred to in FIG. 9 .
- the imaging data may include an indication of whether an imaged surface is tissue or plaque, such as a calcium deposit.
- the bifurcation 700 includes a main vessel 702 and a side vessel 704, and includes a stenosis 706 within the main vessel 702 only and positioned before the branching of the side vessel 704.
- the bifurcation 710 depicts a stenosis 716 positioned within the main vessel 702 only and after the branching of the side vessel 704.
- Bifurcation 720 includes a stenosis 726 situated adjacent to the branching of the side vessel 704, but limited to the main vessel 702.
- the stenosis 726 includes portions both before and after the branching of the side vessel 704 the bifurcation 730 includes a stenosis 736 that is situated adjacent to the branching of the side vessel 704, similar to the stenosis 726.
- the stenosis 736 includes portions within the side vessel 704.
- the bifurcation 740 includes a stenosis 746 situated within the side vessel 704 only.
- the bifurcation 750 includes a stenosis 756 adjacent to the branching and including a portion before the branching in the main vessel 702 and a portion after the branching in the side vessel 704.
- the bifurcation 760 depicts a stenosis 766 having portions proximate the branching and after the branching in both the main vessel 702 and the side vessel 704.
- the system 150 may perform image-processing and image-recognition to classify lesions occurring in each of the segments of interests.
- the segments may be labeled with the conventional names for each of the segments.
- Information regarding the segments, including classifications and associated severities, may be provided to a computing device 172.
- FIG. 8 shown therein is an annotated depiction of stylized images of a vessel according to embodiments of the present disclosure.
- the stylized user interface 800 of FIG. 8 may be presented to a clinician in a display, as a window 801, and incorporates angiogram data with an overlay of co-registered physiology measurements as described herein.
- multiple types of data may be used by the system to formulate and recommend diagnostic procedures to a clinician.
- physiology measurements collected using pressure sensors or other sensors may be co-registered with the angiogram data or, in some embodiments, with a two-dimensional or three-dimensional model prepared therefrom.
- angiogram data and the co-registered physiology measurements may be presented separately and not overlaid as illustrated.
- FIG. 8 includes stylized images 840 and 860 of the right coronary artery and of the left coronary artery, respectively.
- FIG. 8 can be displayed on a display 182 of system 150 for assessing a patient's vasculature. That is, one or more components (e.g., a processor and/or processing circuit) of the system can render information, including angiogram data and physiology measurements, to provide display data to cause the display of the images shown in FIG. 8 .
- the representations of the LCA 860 and the RCA 840 may be further stylized and/or presented without the underlying angiogram data.
- the images of the stylized vessels in FIG. 8 are annotated with one or more visualizations configured to assist in identifying one or more lesions and/or stenoses, and/or assess the severity thereof. These annotations may be automatically provided by performing image-recognition on angiogram data and/or other data, such as IVUS imaging data.
- the visualizations are based on physiology values obtained from one or more instruments (e.g., instruments 130 and/or 132) as at least one of the instruments is moved through the vessel.
- the stylized vessels of FIG. 8 can be colorized and/or otherwise visualized using a heat map that illustrates changes in pressure measurements (or other physiology measurements, such as flow volume, flow velocity, calcium deposits, etc.) obtained as the instrument is moved through the vessel.
- a proximal pressure measurement is obtained at a fixed location within the vessel while the instrument is pulled back through the vessel from a first position distal of the position where the proximal pressure measurement is obtained to a second position more proximal than the first position ( i.e., closer the fixed position of the distal pressure measurement), such as is discussed herein in connection with FIG. 6 .
- FIG. 8 includes depictions of co-registered physiology measurements.
- a clinician or other treating medical personnel can determine what, if any, treatment should be administered.
- a calculated pressure differential above a threshold value e.g., 0.80 on a scale of 0.00 to 1.00
- a first treatment mode e.g., no treatment, drug therapy, etc.
- a calculated pressure differential below the threshold value is indicative of a second, more invasive treatment mode (e.g., angioplasty, stent, etc.).
- the threshold value is a fixed, preset value.
- the threshold value is selected for a particular patient and/or a particular stenosis of a patient.
- the threshold value for a particular patient may be based on one or more of empirical data, patient characteristics, patient history, physician preference, available treatment options, and/or other parameters.
- Markers 802 show pressure readings of specific sections of the vessel and can be described as tick marks. In some embodiments, markers 802 can extend transversely across the vessel. In other embodiments, markers 802 can take different shapes (e.g., circles, squares, etc.), be in different positions relative to the vessel (beside, within, etc.), be differently sized, etc.
- the markers and corresponding measurements can be utilized to both identify the location of the lesion or stenosis within the vessel and assess the severity of the lesion or stenosis. For example, under some conditions, the angiogram data may appear to show a normal vessel, while the physiology measurements presented on the user interface 800 (and shown overlaid on the angiogram data) may provide additional information.
- FIG. 8 includes visualizations for providing diagnostic information collected by one or more instruments at a corresponding location of the vessel on the display.
- value indicators 804 can be disposed adjacent to markers 802 to indicate the location within the patient's vasculature to which the measurement corresponds.
- value indicators 804 are displayed further away from markers 802, but an additional visual element (e.g., an arrow, a straight line, a curved line, marker 802 and value indicator 804 are the same or similar colors, etc.) is provided to indicate the location of the measurement.
- an additional visual element e.g., an arrow, a straight line, a curved line, marker 802 and value indicator 804 are the same or similar colors, etc.
- the value indicators 804 include only the value of the physiological measurement (e.g., "0.90"), while in other embodiments, the value indicators 804 include the value and type of physiological measurement (e.g., "0.90 FFR").
- value indicators 810, 812, 814, 816 show various FFR values in the vessels.
- One of the value indicators 816 may be selected by the clinician and the corresponding measurement is displayed in window 830.
- additional information such as the time the measurement was taken, severity of the stenosis or lesion, etc. can also be provided by the value indicators 804.
- a user may provide a user input (e.g., a selection from a drop-down menu, toggle through the available options, etc.) selecting the types of information that should be displayed in value indicators 804.
- markers 802 and/or value indicator 804 can be positioned automatically based on the physiology measurements.
- the system can be configured to select locations within the vessel that are clinically significant based on the diagnostic information (e.g., locations where the physiology measurements change significantly, such as points at which pressure changes).
- the one or more visualizations of FIG. 8 can include markers 802 and/or value indicator 804 for various predefined segments of the patient's vasculature.
- the segments identified by value indicators 804 include, but are not limited to, right coronary artery (RCA), left main coronary artery, circumflex coronary artery, left anterior descending (LAD), RCA proximal, RCA mid, RCA distal, LAD proximal, LAD mid, LAD apical, first diagonal, additional first diagonal, second diagonal, additional second diagonal, proximal circumflex, intermediate/anterolateral, obtuse marginal, distal circumflex, left posterolateral, posterior descending, among others.
- These value indicators 804 may also be automatically generated based on the angiogram data using image-recognition and modeling techniques.
- Labels 804 can be textual indications providing the names of major and/or minor vessels or segments thereof and can include alphabetical, numeric, and/or other symbolic characters.
- the value indicators 804 are included automatically by the system 150 upon performing an image-recognition process on the angiogram information such as that depicted in the user interface 500 of FIG. 5 .
- the angiogram information may include, information characterizing or describing features of the vessel system such as the contours, location, branches, and other features of the vessel(s) to automatically identify individual vessels within the patient's vasculature. In this way, a model of the patient's vasculature may be generated and parsed to identify specific sections warranting the appropriate label. While abbreviations and particular vessels are used in FIG. 8 , it is understood that any suitable label can be used.
- the co-registered physiology measurements maybe used to ensure the accuracy of prompts. For example, when the physiology measurements indicate that a lesion automatically detected from the angiogram data causes an insignificant pressure drop within the vasculature, a factor may attached in the analysis of the system 150 to appropriately weigh the severity of the corresponding lesion. While the visual data may provide sufficient information to obtain a disease quantification score, the physiology data may indicate the relative significance of each identified lesion.
- Markers 802 and value indicators 804 may also be used by the system to issue recommendations or prompts to a medical professional.
- markers 802 are set in potential risk areas, such as probable locations of lesions or stenosis. These markers 802 are recorded during diagnostic sessions and may be reviewed after medical procedures have taken place.
- value indicator 816 shows a reading of 0.76 which may be indicative of a stenosis. Therefore, the system 150 issues a recommended procedure prompt in window 841 to use IVUS to confirm that the stent was accurately deployed and is functioning properly.
- FIG. 9 shows a system 150 displaying a magnified view of the stylized RCA 840 in the user interface 800 of FIG. 8 .
- a clinician may use the user interface to view magnified images of any section of the vessel system including a region of interest to better understand the condition of the vessel.
- anatomy and physiology can be analyzed to direct diagnostic procedures in stenosis located at bifurcations.
- a main vessel 850 branches into a main branch 860 and a side branch 870.
- FFR measurements are taken at various sites that are marked by markers and visual indicators 812, 814, 816 along the vessel.
- the system 150 prompts a user in window 841 to perform a pressure assessment of the side branch 860 before or after delivery of therapy. For example, a user may be prompted to perform an iFR or FFR measurement when a stent is deployed in an area known to be prone to stent under-deployment. In some instances, use of iFR or FFR on the side branch of a bifurcation can be utilized to determine whether to treat that side branch.
- the other side branch may look to have a significant blockage on the angio image, but iFR or FFR may show that the blockage is not physiologically significant such that there is no need to treat the side branch.
- Co-registered data may also be useful in identifying anatomical features that are best resolved with a particular diagnostic modality such as intravascular imaging.
- the system is configured to issue a prompt to a user when indications of such features are present in the obtained physiological data.
- the angiographic image of the vessel indicates a narrowing 870 in a vessel.
- the initial images of the narrowing 870 may be captured with an external imaging system such as automated quantitative coronary angiography (QCA).
- IVUS is particularly useful in diagnosing narrowed vessels because of the precision of the images available.
- a user may be prompted to perform intravascular imaging, such as IVUS or OCT.
- the system 150 can prompt the user to perform IVUS measurements on the narrowed section 870.
- the system 150 highlights or otherwise marks the region of interest (e.g., with outline 880 or other suitable indicator) and issues a corresponding prompt 890 on the user interface 800 in proximity of the region of interest. Additionally, the recommended procedure is shown in window 841.
- system 150 may recommend other diagnostic procedures such as 3-D angio. In any case, the use of a variety of data sources allows potentially problematic anatomic anomalies to be more easily identified and addressed.
- the one or more visualizations of FIGS. 5-10 can include or be supplemented with information regarding characteristics of the lesion or stenosis and/or the vessel using one or more other vessel data-gathering modalities prompted by the system.
- the other representations of the lesion or stenosis and/or the vessel can include, e.g., IVUS (including virtual histology), OCT, ICE, Thermal, Infrared, flow, Doppler flow, and/or other vessel data-gathering modalities.
- the additional information can provide a more complete and/or accurate understanding of the vessel characteristics and/or assist in evaluating a risk associated with a lesion or stenosis. For example, in some instances the additional information can be utilized to make treatment decisions for borderline cases.
- FIGS. 5-10 numerous other visualization techniques may be utilized to convey the information of FIGS. 5-10 in the context of an angiographic image or other image of the vessel (including both intravascular and extravascular imaging techniques, such as IVUS, OCT, ICE, CTA, etc.) to help the user evaluate the vessel.
- intravascular and extravascular imaging techniques such as IVUS, OCT, ICE, CTA, etc.
- the concepts are equally applicable to other types of vessel imaging techniques, including intravascular and extravascular imaging.
- a user is able to select what information should be included or excluded from the displayed image.
- these visualization techniques related to conveying the pressure measurement data in the context of an angiographic or other image of the vessel can be utilized individually and in any combinations.
- a user is able to select what visualization mode(s) and/or portions thereof will be utilized and the system outputs the display accordingly. Further, in some implementations the user is able to manually annotate the displayed image to include notes and/or input one or more of the measured parameters.
- the images of vessels in FIG. 5-10 can include three-dimensional, two-dimensional, angiographic, a computed tomography angiographic (CTA), and/or other suitable forms of images.
- a three-dimensional image may be rotated about a vertical axis.
- a two-dimensional image may include multiple views about a vertical axis such that different two-dimensional views are shown when the image is rotated.
- the three dimensional model is displayed adjacent to a corresponding two dimensional depiction of the vessel.
- the user may select both the type of depiction(s) (two dimensional (including imaging modality type) and/or three dimensional) along with what visualization mode(s) and/or portions thereof will be utilized.
- the system will output a corresponding display based on the user's preferences/selections and/or system defaults.
- FIG. 11 is a flow diagram of a method 1000 of evaluating a vessel system of a patient to recommend a diagnostic procedure for the patient according to an embodiment of the present disclosure.
- Method 1000 can be implemented by a system described herein, such as system 150 of FIG. 4 .
- the method 1000 is illustrated as a plurality of enumerated steps or operations. Embodiments of the method 1000 may include additional steps or operations before, after, in between, or as part of the enumerated steps.
- method 1000 can include obtaining image data from an image of a vessel system. This may be done by contacting networked storage such as an electronic health record storage system to obtain data such as angiogram data.
- the angiogram data may include a two dimensional angiographic image, a three dimensional angiographic image, and/or a computed tomography angiographic (CTA) image.
- An example of the angiogram data may be seen in the user interface 500 of FIG. 5 which includes the angiogram 504.
- the method 1000 can include obtaining physiology measurements from a vessel of a patient.
- a first instrument and a second instrument are positioned within the vessel of the patient while the second instrument is moved longitudinally through the vessel from a first position to a second position.
- One or more diagnostic measurements e.g., pressure-based including FFR and iFR, flow-based including CFR, etc.
- areas of a patient's vasculature that have a relatively high FFR are characterized as not having a lesion or stenosis, while areas with a relatively low FFR (e.g., less than 0.80) are characterized as having a lesion or stenosis.
- the severity can be evaluated based on the heat map described herein.
- the physiology measurements may be obtained in a manner that provides at least some location information associated with the measurements.
- the method 1000 can include co-registering the physiology measurements with the image data.
- the physiological measurements are associated with corresponding portions of the vessel of the patient, producing co-registered physiology measurements.
- the co-registered physiology measurements can be displayed in an overlaid fashion, such that the physiology measurements maybe visualized in association with the angiogram image data.
- An example may be seen in the user interface 800 of FIGS. 8-10 .
- the system 150 may provide additional perspective to a clinician or clinicians.
- the window 801 may indicate the physical dimensions of the patient's vasculature, which may be sufficient to identify one or more lesions therein, while the physiology measurements indicate the impact or effect of lesions with the vasculature.
- co-registering the physiology measurements with the image data may include associating, in a data file, each physiology measurement with a location within the vessel system, identifying a corresponding location for each physiology measurement with the image data, and associating in the co-registered physiology measurements data file, each physiology measurement with its corresponding location within the image of the vessel system.
- co-registering the physiology measurements may produce a new data file that includes the co-registered physiology measurements.
- the method 1000 can include analyzing the co-registered physiological measurements to identify a region of interest within the vessel system.
- a region of interest may be based on the performance of past medical procedures. For example, if a stent was previously placed in the analysis area, the system 150 may automatically flag the area as a region of interest and recommend further analysis to confirm the accurate placement and functionality of the stent. The placement of the stent may be compared to pre-procedure projections such as a virtual stent to see if expected results have been reached.
- a region of interest may be based on pressure measurements. As explained in conjunction with FIG.
- regions of interest may be based on anatomical physiological data such as unexpected narrowing of a vessel or the existence of a side branch near a stenosis. Further physiology information that may be considered includes dominance classification, a degree of occlusion of the lesion, a classification of the lesion, a degree of bending of a vessel of the vessel system, a length of the lesion, a degree of calcification of the lesion, etc. The method of analyzing regions of interests based on the anatomical physiology is discussed in conjunction with FIG. 10 .
- the method 1000 includes formulating a recommendation of a diagnostic or medical procedure based on the analysis of the co-registered physiology measurements.
- This recommendation includes confirming measurements taken by the system 150, collecting further measurements, running a diagnostic procedure such as iFR measurements, PCI planning or CABG mapping, or performing a medical procedure.
- the formulation of this recommendation takes into account multiple sources of co-registered information and assigns unequal weights to the various sources as necessary.
- the recommendation assigns great importance on whether the patient had a previous myocardial infarction and/or previous PCI, especially in the location at issue, while assigning lesser importance to the actual FFR measurement in a vessel.
- the recommendation may also be based on comparison of current physiological measurements with previously recorded physiological measurements from a database.
- Other sources of information that form part of the analysis and formulation of the recommendation include patient history such as age, gender, or preexisting conditions such as diabetes or hypertension.
- the method 1000 can include displaying the recommendation to a user.
- the recommendation is automatically displayed on a user interface 800 such as that shown in FIGS. 8-10 .
- the recommendation may be displayed on the screen of the display or in a separate window such as window 841.
- recommendations are displayed alongside imagery to show the exact region of interest that the recommendation pertains to, as shown in FIG. 10 .
- recommendations may involve multiple procedures as discussed in conjunction with FIG. 5 . Recommendation of procedures may be read by medical professionals during the course of a procedure to help guide diagnoses. Additionally, the recommendation may be used as an educational tool. For instance, the recommendation and factors used by the system 150 in the analysis used to formulate the recommendation may be presented to a patient, or the family members or guardian of a patient to help explain the reasoning of the medical professional or the likelihood of future procedures.
Description
- The present disclosure relates generally to the assessment of vessels and, in particular, the assessment of the severity of a blockage or other restriction to the flow of fluid through a vessel and the treatment thereof. Aspects of the present disclosure are particularly suited for evaluation of biological vessels in some instances. For example, some particular embodiments of the present disclosure are specifically configured for the evaluation of human blood vessels.
- A currently accepted technique for assessing the severity of a stenosis in a blood vessel, including ischemia causing lesions, is fractional flow reserve (FFR). FFR is a calculation of the ratio of a distal pressure measurement (taken on the distal side of the stenosis) relative to a proximal pressure measurement (taken on the proximal side of the stenosis). FFR provides an index of stenosis severity that allows determination as to whether the blockage limits blood flow within the vessel to an extent that treatment is required. According to
US 2014/039276 A1 , the normal value of FFR in a healthy vessel is 1.00, while values less than about 0.80 are generally deemed significant and require treatment. Common treatment options include percutaneous coronary intervention (PCI or angioplasty), stenting, or coronary artery bypass graft (CABG) surgery. As with all medical procedures, certain risks are associated with PCI, stenting, and CABG procedures. - The severity of a stenosis is sometimes observed visually and roughly estimated based on experience. For example, in
US 2014/121513 A1 , a patient's vasculature can be visualized using angiography. However, even with experience and expertise, the locations of stenoses in a vessel can be difficult to visualize in a grayscale angiographic image. The use of pressure data can improve the interpretation of information gleaned from an angiogram. Moreover, the severity of stenosis can also be better understood when efficiently visualized in relation to an angiographic image in connection with such data. Further, a more complete diagnosis of the patient can be made with intravascular imaging, such as intravascular ultrasound (IVUS) or optical coherence tomography (OCT). For example, in some instances intravascular imaging can be utilized to provide a cross-sectional image of the vessel and/or characterize the type(s) of tissue/plaque present. - In order for a surgeon to make a better-informed decision regarding treatment options, additional information about the characteristics of the vessel is desirable. However, medical personnel must balance the desire for additional information with the costs (e.g., money, time, resources, risks to the patient, etc.) of obtaining the additional information.
- Accordingly, there remains a need for improved devices, systems, and methods for assessing the severity of a blockage in a vessel and, in particular, a stenosis in a blood vessel. Moreover, there remains a need for improved devices, systems, and methods that prompt a user to take particular action(s) to improve the diagnosis of a patient and, thereby, improve patient treatment outcomes.
- This is solved by the subject-matter of the independent claims; further embodiments are incorporated in the dependent claims. Embodiments of the present disclosure are directed to providing an objective recommendation based on co-registered physiological data. One general aspect includes a method of evaluating a vessel of a patient, the method comprising: obtaining image data for the vessel of the patient; obtaining physiological measurements for the vessel of the patient; co-registering the obtained physiological measurements with the obtained image data such that the physiological measurements are associated with corresponding portions of the vessel of the patient; analyzing the co-registered physiology measurements to identify a region of interest; and outputting, to a user interface, a suggested diagnostic procedure for the region of interest based on the analysis of the co-registered physiology measurements.
- According to the invention, the obtained physiological measurements include pressure measurements, including a pressure ratio. In an aspect, the suggested diagnostic procedure includes an intravascular imaging procedure. The suggested intravascular imaging procedure may include at least one of an intravascular ultrasound (IVUS) procedure and an optical coherence tomography (OCT) procedure. The suggested diagnostic procedure may also include an intravascular flow measurement procedure. In an aspect, the obtained physiological measurements include flow measurements. In one embodiment, the suggested diagnostic procedure includes at least one of an intravascular imaging procedure and an intravascular pressure measurement procedure. The obtained image data may include image data received from an extravascular imaging system, which may include at least one of a two-dimensional angiographic image, a three-dimensional angiographic image, or a computed tomography angiographic (CTA) image.
- A system for evaluating a vessel of a patient is also provided, the system comprising: a processing system in communication with at least one intravascular device, the processing system configured to: obtain image data for the vessel of the patient; obtain physiological measurements for the vessel of the patient from the at least one intravascular device; co-register the obtained physiological measurements with the obtained image data such that the physiological measurements are associated with corresponding portions of the vessel of the patient; analyze the co-registered physiology measurements to identify a region of interest; and output, to a user interface, a suggested diagnostic procedure for the region of interest based on the analysis of the co-registered physiology measurements.
- In an aspect, the at least one intravascular devices includes a pressure-sensing intravascular device and wherein the obtained physiological measurements include pressure measurements. Furthermore, the processing system may be configured to calculate a pressure ratio based on the obtained pressure measurements. The suggested diagnostic procedure may also include an intravascular imaging procedure. In one embodiment, the suggested intravascular imaging procedure includes at least one of an intravascular ultrasound (IVUS) procedure and an optical coherence tomography (OCT) procedure. The suggested diagnostic procedure may include an intravascular flow measurement procedure, or may include at least one of an intravascular imaging procedure and an intravascular pressure measurement procedure.
- In one embodiment, the obtained physiological measurements include flow measurements. In an aspect, the obtained image data includes image data received from an extravascular imaging system, or may include at least one of a two-dimensional angiographic image, a three-dimensional angiographic image, or a computed tomography angiographic (CTA) image.
- Illustrative embodiments of the present disclosure will be described with reference to the accompanying drawings, of which:
-
FIG. 1 is a diagrammatic perspective view of a vessel having a stenosis according to an embodiment of the present disclosure. -
FIG. 2 is a diagrammatic, partial cross-sectional perspective view of a portion of the vessel ofFIG. 1 taken along section line 2-2 ofFIG. 1 . -
FIG. 3 is a diagrammatic, partial cross-sectional perspective view of the vessel ofFIGS. 1 and2 with instruments positioned therein according to an embodiment of the present disclosure. -
FIG. 4 is a diagrammatic, schematic view of a system according to an embodiment of the present disclosure. -
FIG. 5 is a stylized image of a patient's vasculature as seen in an angiogram image according to an embodiment of the present disclosure. -
FIG. 6 is a graphical user interface screen display according to an embodiment of the present disclosure. -
FIG. 7 is a series of stylized images of a vessel illustrating classification of vessel obstructions according to an embodiment of the present disclosure. -
FIG. 8 is a stylized image of a patient's vasculature as seen in a user interface according to an embodiment of the present disclosure. -
FIG. 9 is a magnified view of the stylized image of a patient's vasculature ofFIG. 8 as seen in a user interface according to an embodiment of the present disclosure. -
FIG. 10 is a magnified view of the stylized image of a patient's vasculature ofFIG. 8 as seen in a user interface according to another embodiment of the present disclosure. -
FIG. 11 is a flow diagram of a method for prompting diagnostic action(s) based on obtained physiological data. - These drawings may be better understood by reference to the following detailed description.
- For the purposes of promoting an understanding of the principles of the present disclosure, reference will now be made to the embodiments illustrated in the drawings, and specific language will be used to describe the same. It is nevertheless understood that no limitation to the scope of the disclosure is intended. Any alterations and further modifications to the described devices, systems, and methods, and any further application of the principles of the present disclosure are fully contemplated and included within the present disclosure as would normally occur to one skilled in the art to which the disclosure relates. In particular, it is fully contemplated that the features, components, and/or steps described with respect to one embodiment may be combined with the features, components, and/or steps described with respect to other embodiments of the present disclosure. For the sake of brevity, however, the numerous iterations of these combinations will not be described separately.
- Physiological measurement data and the coronary angiogram typically behave as complementary, yet segregated sources of information. The coronary angiogram has been used to make treatment decisions. More recently, physiological data (including, but not limited to, pressure and/or flow measurements, both at hyperemia and rest) have shown that better decisions can be made based on the severity of a blockage by measuring the change in underlying physiological conditions from the beginning of a target artery to the end. Treating a patient based on the severity of this change or delta has shown to improve outcomes and reduce waste from unnecessary procedures. In one or more aspects of the present disclosure, the physiological data, as collected real-time, is linked or co-registered to a schematic of the coronary arteries or an angiogram. The data may also be visually depicted in a way that allows a clinician to interact and assess where severity changes, by sliding markings as placed on the image of the vessel and correlated with the collected physiological data. One or more embodiments described herein are also able to prompt user action(s) based on the on collected physiological data. For example, additional diagnostic procedure(s) may be suggested based on potentially problematic anatomical features identified from the obtained physiological data. Additionally, embodiments may recommend performing a particular diagnostic procedure again to confirm the results of a previous medical procedure (e.g., where the obtained physiological data is at odds with expected values). Furthermore, some embodiments prompt a user to consider particular medical procedures in light of the obtained physiological data, such as a percutaneous coronary intervention (PCI) or a coronary artery bypass graft (CABG) surgery.
- One aspect of the present disclosure includes super-imposing real-time collected pressure and/or flow data (or other physiologic data) onto an angiogram, or a schematic of anatomy and representing the data in a way that helps a clinician determine how/where to intervene (including but not limited to CABG mapping and PCI planning). In some embodiments, the collected physiology data may include real-time data obtained during a procedure. One aspect of the present disclosure includes using the pressure, flow or other physiologic data to identify "regions of interest" where additional diagnostic information would be particularly useful for the purposes of determining how or where to intervene. Because these regions often represent potential medical issues that are best identified and/or characterized using a particular diagnostic procedure, a user can be prompted to gather further information on these regions of interest using the preferred diagnostic procedure(s). These prompts and the recommended diagnostic procedures can be presented to the clinician in a user interface showing the obtained physiological data.
- Referring to
FIGS. 1 and2 , shown therein is avessel 100 having a stenosis according to an embodiment of the present disclosure. In that regard,FIG. 1 is a diagrammatic perspective view of thevessel 100, whileFIG. 2 is a partial cross-sectional perspective view of a portion of thevessel 100 taken along section line 2-2 ofFIG. 1 . Referring more specifically toFIG. 1 , thevessel 100 includes aproximal portion 102 and adistal portion 104. Alumen 106 extends along the length of thevessel 100 between theproximal portion 102 and thedistal portion 104. In that regard, thelumen 106 is configured to allow the flow of fluid through the vessel. In some instances, thevessel 100 is a blood vessel. In some particular instances, thevessel 100 is a coronary artery. In such instances, thelumen 106 is configured to facilitate the flow of blood through thevessel 100. - As shown, the
vessel 100 includes astenosis 108 between theproximal portion 102 and thedistal portion 104. Thestenosis 108 is generally representative of any blockage or other structural arrangement that results in a restriction to the flow of fluid through thelumen 106 of thevessel 100. Embodiments of the present disclosure are suitable for use in a wide variety of vascular applications, including without limitation coronary, peripheral (including but not limited to lower limb, carotid, and neurovascular), renal, and/or venous. Where thevessel 100 is a blood vessel, thestenosis 108 may be a result of plaque buildup, including without limitation plaque components such as fibrous, fibro-lipidic (fibro fatty), necrotic core, calcified (dense calcium), blood, fresh thrombus, and mature thrombus. Generally, the composition of the stenosis will depend on the type of vessel being evaluated. In that regard, it is understood that the concepts of the present disclosure are applicable to virtually any type of blockage or other narrowing of a vessel that results in decreased fluid flow. - Referring more particularly to
FIG. 2 , thelumen 106 of thevessel 100 has adiameter 110 proximal of thestenosis 108 and a diameter 112 distal of the stenosis. In some instances, thediameters 110 and 112 are substantially equal to one another. In that regard, thediameters 110 and 112 are intended to represent healthy portions, or at least healthier portions, of thelumen 106 in comparison tostenosis 108. Accordingly, these healthier portions of thelumen 106 are illustrated as having a substantially constant cylindrical profile and, as a result, the height or width of the lumen has been referred to as a diameter. However, it is understood that in many instances these portions of thelumen 106 will also have plaque buildup, a non-symmetric profile, and/or other irregularities, but to a lesser extent thanstenosis 108 and, therefore, will not have a cylindrical profile. In such instances, thediameters 110 and 112 are understood to be representative of a relative size or cross-sectional area of the lumen and do not imply a circular cross-sectional profile. - As shown in
FIG. 2 ,stenosis 108 includesplaque buildup 114 that narrows thelumen 106 of thevessel 100. In some instances, theplaque buildup 114 does not have a uniform or symmetrical profile, making angiographic evaluation of such a stenosis unreliable. In the illustrated embodiment, theplaque buildup 114 includes an upper portion 116 and an opposinglower portion 118. In that regard, thelower portion 118 has an increased thickness relative to the upper portion 116 that results in a non-symmetrical and non-uniform profile relative to the portions of the lumen proximal and distal of thestenosis 108. As shown, theplaque buildup 114 decreases the available space for fluid to flow through thelumen 106. In particular, the cross-sectional area of thelumen 106 is decreased by theplaque buildup 114. At the narrowest point between the upper andlower portions 116, 118 thelumen 106 has aheight 120, which is representative of a reduced size or cross-sectional area relative to thediameters 110 and 112 proximal and distal of thestenosis 108. Note that thestenosis 108, includingplaque buildup 114 is exemplary in nature and should be considered limiting in any way. In that regard, it is understood that thestenosis 108 has other shapes and/or compositions that limit the flow of fluid through thelumen 106 in other instances. While thevessel 100 is illustrated inFIGS. 1 and2 as having asingle stenosis 108 and the description of the embodiments below is primarily made in the context of a single stenosis, it is nevertheless understood that the devices, systems, and methods described herein have similar application for a vessel having multiple stenosis regions. - Referring now to
FIG. 3 , thevessel 100 is shown withinstruments 130 and 132 positioned therein according to an embodiment of the present disclosure. In general,instruments 130 and 132 may be any form of device, instrument, or probe sized and shaped to be positioned within a vessel. In the illustrated embodiment,instrument 130 is generally representative of a guide wire, while instrument 132 is generally representative of a catheter. In that regard,instrument 130 extends through a central lumen of instrument 132. However, in other embodiments, theinstruments 130 and 132 take other forms. In that regard, theinstruments 130 and 132 are of similar form in some embodiments. For example, in some instances, bothinstruments 130 and 132 are guide wires. In other instances, bothinstruments 130 and 132 are catheters. On the other hand, theinstruments 130 and 132 are of different form in some embodiments, such as the illustrated embodiment, where one of the instruments is a catheter and the other is a guide wire. Further, in some instances, theinstruments 130 and 132 are disposed coaxial with one another, as shown in the illustrated embodiment ofFIG. 3 . In other instances, one of the instruments extends through an off-center lumen of the other instrument. In yet other instances, theinstruments 130 and 132 extend side-by-side. In some particular embodiments, at least one of the instruments is as a rapid-exchange device, such as a rapid-exchange catheter. In such embodiments, the other instrument is a buddy wire or other device configured to facilitate the introduction and removal of the rapid-exchange device. Further still, in other instances, instead of twoseparate instruments 130 and 132 a single instrument is utilized. In some embodiments, the single instrument incorporates aspects of the functionalities (e.g., data acquisition) of bothinstruments 130 and 132. -
Instrument 130 is configured to obtain diagnostic information about thevessel 100. In that regard, theinstrument 130 includes one or more sensors, transducers, and/or other monitoring elements configured to obtain the diagnostic information about the vessel. The diagnostic information includes one or more of pressure, flow (velocity), images (including images obtained using ultrasound (e.g., IVUS), OCT, thermal, and/or other imaging techniques), temperature, and/or combinations thereof. The one or more sensors, transducers, and/or other monitoring elements are positioned adjacent a distal portion of theinstrument 130 in some instances. In that regard, the one or more sensors, transducers, and/or other monitoring elements are positioned less than 30 cm, less than 10 cm, less than 5 cm, less than 3 cm, less than 2 cm, and/or less than 1 cm from adistal tip 134 of theinstrument 130 in some instances. In some instances, at least one of the one or more sensors, transducers, and/or other monitoring elements is positioned at the distal tip of theinstrument 130. - The
instrument 130 can include at least one element configured to monitor pressure within thevessel 100. The pressure monitoring element can take the form a piezo-resistive pressure sensor, a piezo-electric pressure sensor, a capacitive pressure sensor, an electromagnetic pressure sensor, a fluid column (the fluid column being in communication with a fluid column sensor that is separate from the instrument and/or positioned at a portion of the instrument proximal of the fluid column), an optical pressure sensor, and/or combinations thereof. In some instances, one or more features of the pressure monitoring element are implemented as a solid-state component manufactured using semiconductor and/or other suitable manufacturing techniques. Examples of commercially available guide wire products that include suitable pressure monitoring elements include, without limitation, the Verrata® pressure guide wire, the PrimeWire Prestige ® PLUS pressure guide wire, and the ComboWire® XT pressure and flow guide wire, each available from Volcano Corporation, as well as the PressureWire™ Certus guide wire and the PressureWire™ Aeris guide wire, each available from St. Jude Medical, Inc. Generally, theinstrument 130 is sized such that it can be positioned through thestenosis 108 without significantly impacting fluid flow across the stenosis, which would impact the distal pressure reading. Accordingly, in some instances theinstrument 130 has an outer diameter of 0.018" or less. In some embodiments, theinstrument 130 has an outer diameter of 0.014" or less. In other embodiments, theinstrument 130 has an outer diameter of 0.035" or less. - Instrument 132 is also configured to obtain diagnostic information about the
vessel 100. In some instances, instrument 132 is configured to obtain the same diagnostic information asinstrument 130. In other instances, instrument 132 is configured to obtain different diagnostic information thaninstrument 130, which may include additional diagnostic information, less diagnostic information, and/or alternative diagnostic information. The diagnostic information obtained by instrument 132 includes one or more of pressure, flow (velocity), images (including images obtained using ultrasound (e.g., IVUS), OCT, thermal, and/or other imaging techniques), temperature, and/or combinations thereof. Instrument 132 includes one or more sensors, transducers, and/or other monitoring elements configured to obtain this diagnostic information. In that regard, the one or more sensors, transducers, and/or other monitoring elements are positioned adjacent a distal portion of the instrument 132 in some instances. In that regard, the one or more sensors, transducers, and/or other monitoring elements are positioned less than 30 cm, less than 10 cm, less than 5 cm, less than 3 cm, less than 2 cm, and/or less than 1 cm from adistal tip 136 of the instrument 132 in some instances. In some instances, at least one of the one or more sensors, transducers, and/or other monitoring elements is positioned at the distal tip of the instrument 132. - Similar to
instrument 130, instrument 132 can also include at least one element configured to monitor pressure within thevessel 100. The pressure monitoring element can take the form a piezo-resistive pressure sensor, a piezo-electric pressure sensor, a capacitive pressure sensor, an electromagnetic pressure sensor, a fluid column (the fluid column being in communication with a fluid column sensor that is separate from the instrument and/or positioned at a portion of the instrument proximal of the fluid column), an optical pressure sensor, and/or combinations thereof. In some instances, one or more features of the pressure monitoring element are implemented as a solid-state component manufactured using semiconductor and/or other suitable manufacturing techniques. Currently available catheter products suitable for use with one or more of Siemens AXIOM Sensis, Mennen Horizon XVu, and Philips Xper IM Physiomonitoring 5 and include pressure monitoring elements can be utilized for instrument 132 in some instances. - In accordance with aspects of the present disclosure, at least one of the
instruments 130 and 132 is configured to monitor a pressure within thevessel 100 distal of thestenosis 108 and at least one of theinstruments 130 and 132 is configured to monitor a pressure within the vessel proximal of the stenosis. In that regard, theinstruments 130, 132 are sized and shaped to allow positioning of the at least one element configured to monitor pressure within thevessel 100 to be positioned proximal and/or distal of thestenosis 108 as necessary based on the configuration of the devices. In that regard,FIG. 3 illustrates aposition 138 suitable for measuring pressure distal of thestenosis 108. In that regard, theposition 138 is less than 5 cm, less than 3 cm, less than 2 cm, less than 1 cm, less than 5 mm, and/or less than 2.5 mm from the distal end of the stenosis 108 (as shown inFIG. 2 ) in some instances.FIG. 3 also illustrates a plurality of suitable positions for measuring pressure proximal of thestenosis 108. In that regard, positions 140, 142, 144, 146, and 148 each represent a position that is suitable for monitoring the pressure proximal of the stenosis in some instances. In that regard, thepositions stenosis 108 ranging from more than 20 cm down to about 5 mm or less. Generally, the proximal pressure measurement will be spaced from the proximal end of the stenosis. Accordingly, in some instances, the proximal pressure measurement is taken at a distance equal to or greater than an inner diameter of the lumen of the vessel from the proximal end of the stenosis. In the context of coronary artery pressure measurements, the proximal pressure measurement is generally taken at a position proximal of the stenosis and distal of the aorta, within a proximal portion of the vessel. However, in some particular instances of coronary artery pressure measurements, the proximal pressure measurement is taken from a location inside the aorta. In other instances, the proximal pressure measurement is taken at the root or ostium of the coronary artery. - In some embodiments, at least one of the
instruments 130 and 132 is configured to monitor pressure within thevessel 100 while being moved through thelumen 106. In some instances,instrument 130 is configured to be moved through thelumen 106 and across thestenosis 108. In that regard, theinstrument 130 is positioned distal of thestenosis 108 and moved proximally (i.e., pulled back) across the stenosis to a position proximal of the stenosis in some instances. In other instances, theinstrument 130 is positioned proximal of thestenosis 108 and moved distally across the stenosis to a position distal of the stenosis. Movement of theinstrument 130, either proximally or distally, is controlled manually by medical personnel (e.g., hand of a surgeon) in some embodiments. In other embodiments, movement of theinstrument 130, either proximally or distally, is controlled automatically by a movement control device (e.g., a pullback device, such as the Trak Back® II Device available from Volcano Corporation). In that regard, the movement control device controls the movement of theinstrument 130 at a selectable and known speed (e.g., 2.0 mm/s, 1.0 mm/s, 0.5 mm/s, 0.2 mm/s, etc.) in some instances. Because the movement of theinstrument 130 is selectable and known, the position of thedistal tip 134 relative to the patient's vasculature may be estimated with sufficient precision to provide for the co-registration of data obtained by theinstrument 130 with a computer model of the patient's vasculature obtained from angiography. Movement of theinstrument 130 through the vessel is continuous for each pullback or push through, in some instances. In other instances, theinstrument 130 is moved step-wise through the vessel (i.e., repeatedly moved a fixed amount of distance and/or a fixed amount of time). Some aspects of the visual depictions discussed below are particularly suited for embodiments where at least one of theinstruments 130 and 132 is moved through thelumen 106. Further, in some particular instances, aspects of the visual depictions discussed below are particularly suited for embodiments where a single instrument is moved through thelumen 106, with or without the presence of a second instrument. - In some instances, the
instruments 130 and 132 may be used to provide instantaneous wave free ratio (iFR ®) measurements instead of, or in addition, to traditional FFR measurements as described above. Such iFR ® measurements may be obtained using products produced by the Volcano Corporation. In some embodiments, FFR data and iFR data may be used together to assess the patient. The FFR or iFR data may be used to determine whether the disease is focal or diffuse. In some embodiments, the pullback curve based on FFR or iFR may be used to determine whether the patient's disease is focal or diffuse. - Referring now to
FIG. 4 , shown therein is asystem 150 according to an embodiment of the present disclosure. In that regard,FIG. 4 is a diagrammatic, schematic view of thesystem 150. As shown, thesystem 150 includes aninstrument 152. In that regard, in someinstances instrument 152 is suitable for use as at least one ofinstruments 130 and 132 discussed above. Accordingly, in some instances theinstrument 152 includes features similar to those discussed above with respect toinstruments 130 and 132 in some instances. In the illustrated embodiment, theinstrument 152 is a guide wire having adistal portion 154 and ahousing 156 positioned adjacent the distal portion. In that regard, thehousing 156 is spaced approximately 3 cm from a distal tip of theinstrument 152. Thehousing 156 is configured to house one or more sensors, transducers, and/or other monitoring elements configured to obtain the diagnostic information about the vessel. In the illustrated embodiment, thehousing 156 contains at least a pressure sensor configured to monitor a pressure within a lumen in which theinstrument 152 is positioned. Ashaft 158 extends proximally from thehousing 156. Atorque device 160 is positioned over and coupled to a proximal portion of theshaft 158. Aproximal end portion 162 of theinstrument 152 is coupled to aconnector 164. Acable 166 extends fromconnector 164 to aconnector 168. In some instances,connector 168 is configured to be plugged into aninterface 170. In that regard,interface 170 is a patient interface module (PIM) in some instances. In some instances, thecable 166 is replaced with a wireless connection. In that regard, it is understood that various communication pathways between theinstrument 152 and theinterface 170 may be utilized, including physical connections (including electrical, optical, and/or fluid connections), wireless connections, and/or combinations thereof. - The
interface 170 is communicatively coupled to acomputing device 172 via aconnection 174.Computing device 172 is generally representative of any device suitable for performing the processing and analysis techniques discussed within the present disclosure. In some embodiments, thecomputing device 172 includes a processor, random access memory, and a storage medium. In that regard, in some particular instances thecomputing device 172 is programmed to execute steps associated with the data acquisition and analysis described herein. Accordingly, it is understood that any steps related to data acquisition, data processing, instrument control, and/or other processing or control aspects of the present disclosure may be implemented by the computing device using corresponding instructions stored on or in a non-transitory computer-readable medium accessible by the computing device. In some instances, thecomputing device 172 is a console device. In some particular instances, thecomputing device 172 is similar to the s5™ Imaging System or the s5i™ Imaging System, each available from Volcano Corporation. In some instances, thecomputing device 172 is portable (e.g., handheld, on a rolling cart, etc.). Further, it is understood that in some instances thecomputing device 172 comprises a plurality of computing devices. In that regard, it is particularly understood that the different processing and/or control aspects of the present disclosure may be implemented separately or within predefined groupings using a plurality of computing devices. Any divisions and/or combinations of the processing and/or control aspects described below across multiple computing devices are within the scope of the present disclosure. - The
computing device 172 may acquire data from many different sources. For example, as described herein thecomputing device 172 may communicate through theinterface 170 to collect physiological measurements from instruments, such asinstruments 130 and 132, positioned within a patient's vasculature. Additionally, thecomputing device 172 may include a network interface card or similar interface to communicate with a network 180. Thecomputing device 172 may access angiography data to produce a model of the patient's vasculature or may access a pre-computed model. For example, an existing model of the patient's vasculature may have been generated based on previously acquired data. Thecomputing device 172 may be coupled to a display 182 by which images, data, and user interfaces may be presented to a clinician before, after, and/or during a procedure. - Together,
connector 164,cable 166,connector 168,interface 170, andconnection 174 facilitate communication between the one or more sensors, transducers, and/or other monitoring elements of theinstrument 152 and thecomputing device 172. However, this communication pathway is exemplary in nature and should not be considered limiting in any way. In that regard, it is understood that any communication pathway between theinstrument 152 and thecomputing device 172 may be utilized, including physical connections (including electrical, optical, and/or fluid connections), wireless connections, and/or combinations thereof. In that regard, it is understood that theconnection 174 is wireless in some instances. In some instances, theconnection 174 includes a communication link over a network (e.g., intranet, internet, telecommunications network, and/or other network). For example, in some embodiments thecomputing device 172 may be coupled to theinterface 170 by the network 180. In that regard, it is understood that thecomputing device 172 is positioned remote from an operating area where theinstrument 152 is being used in some instances. Having theconnection 174 include the connection to the network 180 can facilitate communication between theinstrument 152 and theremote computing device 172 regardless of whether the computing device is in an adjacent room, an adjacent building, or in a different state/country. Further, it is understood that the communication pathway between theinstrument 152 and thecomputing device 172 is a secure connection in some instances. Further still, it is understood that, in some instances, the data communicated over one or more portions of the communication pathway between theinstrument 152 and thecomputing device 172 is encrypted. - The
system 150 also includes aninstrument 175. In that regard, in someinstances instrument 175 is suitable for use as at least one ofinstruments 130 and 132 discussed above. Accordingly, in some instances theinstrument 175 includes features similar to those discussed above with respect toinstruments 130 and 132 in some instances. In the illustrated embodiment, theinstrument 175 is a catheter-type device. In that regard, theinstrument 175 includes one or more sensors, transducers, and/or other monitoring elements adjacent a distal portion of the instrument configured to obtain the diagnostic information about the vessel. In the illustrated embodiment, theinstrument 175 includes a pressure sensor configured to monitor a pressure within a lumen in which theinstrument 175 is positioned. Theinstrument 175 is in communication with aninterface 176 viaconnection 177. In some instances,interface 176 is a hemodynamic monitoring system or other control device, such as Siemens AXIOM Sensis, Mennen Horizon XVu, and Philips Xper IM Physiomonitoring 5. In one particular embodiment,instrument 175 is a pressure-sensing catheter that includes fluid column extending along its length. In such an embodiment,interface 176 includes a hemostasis valve fluidly coupled to the fluid column of the catheter, a manifold fluidly coupled to the hemostasis valve, and tubing extending between the components as necessary to fluidly couple the components. In that regard, the fluid column of the catheter is in fluid communication with a pressure sensor via the valve, manifold, and tubing. In some instances, the pressure sensor is part ofinterface 176. In other instances, the pressure sensor is a separate component positioned between theinstrument 175 and theinterface 176. Theinterface 176 is communicatively coupled to thecomputing device 172 via aconnection 178. - Similar to the connections between
instrument 152 and thecomputing device 172,interface 176 andconnections instrument 175 and thecomputing device 172. However, this communication pathway is exemplary in nature and should not be considered limiting in any way. In that regard, it is understood that any communication pathway between theinstrument 175 and thecomputing device 172 may be utilized, including physical connections (including electrical, optical, and/or fluid connections), wireless connections, and/or combinations thereof, and connections through the network 180. In that regard, it is understood that theconnection 178 is wireless in some instances. In some instances, theconnection 178 includes a communication link over a network (e.g., intranet, internet, telecommunications network, and/or other network) like the network 180. In that regard, it is understood that thecomputing device 172 is positioned remote from an operating area where theinstrument 175 is being used in some instances. Having theconnection 178 include a connection over the network 180 can facilitate communication between theinstrument 175 and theremote computing device 172 regardless of whether the computing device is in an adjacent room, an adjacent building, or in a different state/country. Further, it is understood that the communication pathway between theinstrument 175 and thecomputing device 172 is a secure connection in some instances. Further still, it is understood that, in some instances, the data communicated over one or more portions of the communication pathway between theinstrument 175 and thecomputing device 172 is encrypted. - It is understood that one or more components of the
system 150 are not included, are implemented in a different arrangement/order, and/or are replaced with an alternative device/mechanism in other embodiments of the present disclosure. For example, in some instances, thesystem 150 does not includeinterface 170 and/orinterface 176. In such instances, the connector 168 (or other similar connector in communication withinstrument 152 or instrument 175) may plug into a port associated withcomputing device 172. Alternatively, theinstruments computing device 172. Generally speaking, the communication pathway between either or both of theinstruments computing device 172 may have no intermediate nodes (i.e., a direct connection), one intermediate node between the instrument and the computing device, or a plurality of intermediate nodes between the instrument and the computing device. - Diagnostic information within a vasculature of interest can be obtained using one or more of
instruments - In some embodiments, the diagnostic information can include angiographic images and/or other two-dimensional or three-dimensional depictions of a patient's vasculature. Such angiographic images may be accessed via the network 180. For example, angiographic images of the patient's vasculature and/or associated models may be stored in a data center and accessed by the
computing device 172 for use during a procedure. The diagnostic information and/or data obtained byinstruments U.S. Patent No. 6,930,014 , titled "VASCULAR IMAGE CO-REGISTRATION", based on the known pullback speed/distance, based on a known starting point, based on a known ending point, and/or combinations thereof. In some embodiments, diagnostic information and/or data is correlated to vessel images using techniques similar to those described inU.S. Patent Application No. 14/144,240 U.S. Provisional Patent Application No. 61/747,480 U.S. Patent Application No. 14/335,603 U.S. Provisional Patent Application No. 61/856,509 - Referring now to
FIG. 5 , shown therein is an exemplary depiction of angiogram data as may be provided to the clinician in auser interface 500, such as may be provided by thecomputing device 172 ofFIG. 4 . Theuser interface 500 includes a window 502 that may be presented in the display 182 as seen inFIG. 4 . The window displays angiogram data that includes cardiac tissue 506 andvasculature 508 obtained using a contrast agent. In some embodiments, the angiogram 504 may be a three-dimensional angiogram that may be manipulated by the clinician to provide different views, including different perspective views and/or cross-sectional views, of the patient's vasculature. - After obtaining the angiogram data, the data may be parsed by an image-processing component provided by the
system 150 ofFIG. 4 to segment the patient's vasculature and estimate certain features thereof. The parsing of the data may be performed to extract image-based physiology measurements which may be automatically displayed without the continued interaction of a clinician. For example, the image-based physiology measurements may be extracted after an angiogram collection process is complete. - When processing the angiogram data, quantitative coronary angiography (QCA) may be used to assess and identify blockages from the image-based data. A QCA process may be initiated automatically to identify any blockages. While the clinician may provide a qualitative evaluation based on his or her own experience, the information from the QCA process may be used in subsequent steps to prompt additional diagnostic procedures and/or generate an objective intervention recommendation. The image-based physiology measurements may include a dominance classification, a degree of occlusion of a lesion, which may be expressed as a percent diameter stenosis, a classification of a lesion, a degree of bending of a vessel of the vessel system, a length of a lesion, and/or a degree of calcification of a lesion.
- Still referring to
FIG. 5 , one region of interest 510 is shown on the Left Coronary Artery while another region ofinterest 512 is shown on a branch of the Right Coronary Artery. - These regions of
interest 510, 512 may be assigned by thecomputing system 174 and shown on theuser interface 500 based on anomalous measurements such as sharp changes in pressure readings. Theuser interface 500 may also display a recommendation for each region of interest as shown inFIG. 5 which may include a diagnostic procedure. For the region of interest 510 on the LCA, theuser interface 500 recommends that a clinician perform an IVUS procedure on the region of interest 510. Multiple recommendations may also be displayed on theuser interface 500 for problematic areas such as at region ofinterest 512, where the branch in the RCA could cause anomalous readings. For this region ofinterest 512, theuser interface 500 recommends that the clinician perform an iFR or FFR procedure followed by an IVUS procedure for added certainty. These recommendations may be based on multiple modalities of physiological data including, but not limited to, pressure measurements, flow (velocity) measurements, images (including images obtained using ultrasound (e.g., IVUS), OCT, thermal measurements, (and data collected from other imaging techniques), temperature measurements, and/or combinations thereof. - During subsequent procedures, the clinician may navigate the
instruments 130 and/or 132 through the patient's vasculature, collecting physiology measurements therein. The physiology measurements may be stored in a memory of thecomputing device 172 and also displayed on the display 182. As is discussed in further detail below, co-registration techniques and others that may be known to those of skill in the art may be used to co-register physiology measurements to specific portions of the patient'svasculature 508. - Referring now to
FIG. 6 , shown therein is a depiction of a user interface 600 for evaluating a vessel based on obtained physiology measurements (as depicted, pressure measurements, but may also include flow volume, flow velocity, and/or other intravascular physiology measurements or calculations based thereon) according to embodiments of the present disclosure. The user interface may be displayed on a touch-sensitive display. A clinician can view, analyze, and interact with the pressure data and/or visual representations of the pressure data. - Referring more specifically to
FIG. 6 , shown therein is a screen display 600 according to an embodiment of the present disclosure. The screen display 600 includes multiple tabs, including aniFR tab 602, anFFR tab 604, apatient tab 606, and a settings tab 608. InFig. 5 , theiFR tab 602 has been selected and displayed to a user. As shown, theiFR tab 602 includes agraph 610 and a correspondingpressure waveform plot 612. The screen display 600 also includes awindow 614 that shows a calculated pressure ratio (e.g., FFR, iFR, or otherwise). The screen display 600 also includes awindow 616 showing the runs or pullbacks available for display to the user. In the illustrated embodiment, two different runs are available and identified by a corresponding time stamp. In that regard, a user can select the desired run from thewindow 616 and the data shown in thegraph 610 andpressure waveform plot 612 will update accordingly. - The screen display 600 also includes
zoom buttons graph 610 and thepressure waveform plot 612. To this end, the screen display 600 includes aruler 622 showing the relative scale of thegraph 610 and thepressure waveform plot 612. In some instances, theruler 622 provides a dimensional scale of the graphical display of thegraph 610 and/or thepressure waveform plot 612 relative to the vessel length and/or the pullback length. The scale of theruler 622 automatically updates in response to selective actuation of thezoom buttons - The screen display 600 also includes a slider 624. The slider 624 allows the user to move along the length of the vessel and/or the corresponding pullback data. For example, in some instances the left end of the slider 624 corresponds to the beginning of the pullback and the right end of the slider corresponds to the end of the pullback. By moving the slider 624 between the first and second ends, a user can see corresponding portions of the pressure data in the
graph 610 and thepressure waveform plot 612. Accordingly, a user can focus on certain portions of the vessel and pullback data using thezoom buttons window 614 is updated based on the position of the slider and/or. In that regard, in some instances the numerical value of the pressure ratio displayed inwindow 614 is based solely on the pressure data being displayed in thegraph 610 and thepressure waveform plot 612. However, in other instances the numerical value of the pressure ratio displayed inwindow 614 is based one of or a combination of the pressure data being displayed in thegraph 610 and thepressure waveform plot 612 and pressure data not displayed in thegraph 610 and thepressure waveform plot 612. - In that regard, the
graph 610 andpressure waveform plot 612 of screen display 600 illustrate aspects of pressure measurements obtained as one instrument is moved through the vessel and another instrument is maintained at a fixed location. In that regard, in some instances the pressure measurements are representative of a pressure ratio between a fixed location within the vessel and the moving position of the instrument as the instrument is moved through the vessel. For example, in some instances a proximal pressure measurement is obtained at a fixed location within the vessel while the instrument is pulled back through the vessel from a first position distal of the position where the proximal pressure measurement is obtained to a second position more proximal than the first position (i.e., closer to the fixed position of the proximal pressure measurement). For clarity in understanding the concepts of the present disclosure, this arrangement will be utilized to describe many of the embodiments of the present disclosure. However, it is understood that the concepts are equally applicable to other arrangements. For example, in some instances, the instrument is pushed through the vessel from a first position distal of the proximal pressure measurement location to a second position further distal (i.e., further away from the fixed position of the proximal pressure measurement). In other instances, a distal pressure measurement is obtained at a fixed location within the vessel and the instrument is pulled back through the vessel from a first position proximal of the fixed location of the distal pressure measurement to a second position more proximal than the first position (i.e., further away from the fixed position of the distal pressure measurement). In still other instances, a distal pressure measurement is obtained at a fixed location within the vessel and the instrument is pushed through the vessel from a first position proximal of the fixed location of the distal pressure measurement to a second position less proximal than the first position (i.e., closer the fixed position of the distal pressure measurement). - The pressure differential between the two pressure measurements within the vessel (e.g., a fixed location pressure measurement and a moving pressure measurement) is calculated as a ratio of the two pressure measurements (e.g., the moving pressure measurement divided by the fixed location pressure measurement), in some instances. In some instances, the pressure differential is calculated for each heartbeat cycle of the patient. In that regard, the calculated pressure differential is the average pressure differential across a heartbeat cycle in some embodiments. For example, in some instances where a hyperemic agent is applied to the patient, the average pressure differential across the heartbeat cycle is utilized to calculate the pressure differential. In other embodiments, only a portion of the heartbeat cycle is utilized to calculate the pressure differential. The pressure differential is an average over the portion or diagnostic window of the heartbeat cycle, in some instances.
- In some embodiments a diagnostic window is selected using one or more of the techniques described in
U.S. Patent Application No. 13/460,296, filed April 30, 2012 - In the illustrated embodiment of
FIG. 6 , thegraph 610 shows the pressure ratio over time. In particular, thegraph 610 shows the pressure ratio calculated over the time of a pullback. More specifically, thegraph 610 shows an iFR pressure ratio value during a pullback. In that regard, the iFR pressure ratio may be calculated as described in one or more ofPCT Patent Application Publication No. WO 2012/093260, filed January 6, 2012 and titled "APPARATUS AND METHOD OF CHARACTERISING A NARROWING IN A FLUID FILLED TUBE,"PCT Patent Application Publication No. WO 2012/093266, filed January 6, 2012 and titled "APPARATUS AND METHOD OF ASSESSING A NARROWING IN A FLUID FILLED TUBE,"U.S. Patent Application No. 13/460,296, filed April 30, 2012 PCT Patent Application Publication No. WO 2013/028612, filed August 20, 2012 and titled "DEVICES, SYSTEMS, AND METHODS FOR VISUALLY DEPICTING A VESSEL AND EVALUATING TREATMENT OPTIONS,"U.S. Provisional Patent Application No. 61/856,509, filed July 19, 2013 U.S. Provisional Patent Application No. 61/856,518, filed July 19, 2013 - The
graph 610 can illustrate the pressure ratio and/or the underlying pressure measurements in any suitable way. Generally speaking, the representation of the data ingraph 610 can be utilized to identify gradients/changes in the pressure ratio and/or the underlying pressure measurements that can be indicative of a significant lesion in the vessel. In that regard, the visual representation of the data can include the pressure measurement(s); a ratio of the pressure measurements; a difference in the pressure measurements; a gradient of the pressure measurement(s), the ratio of the pressure measurements, and/or the difference in the pressure measurements; first or second derivatives of the pressure measurement(s), the ratio of the pressure measurements, and/or the difference in the pressure measurements; and/or combinations thereof. - Likewise, the
pressure waveform plot 612 shows the corresponding pressure data. In that regard, thepressure waveform plot 612 can include the pressure waveform for the pressure sensing device moved through the vessel during the pullback, the pressure waveform for the stationary pressure sensing device, or both. In the illustrated embodiment, thepressure waveform plot 612 includes the pressure waveforms for both. In some instances thepressure waveform plot 612 is augmented to highlight or otherwise accentuate the pressure data corresponding to the diagnostic window utilized for the pressure ratio calculations. - As shown in
FIG. 6 , the screen display 600 includes abutton 626 indicating that the data is being displayed in a "Live" mode, which indicates that the screen display 600, includinggraph 610,pressure waveform plot 612, and/or thewindow 614, is being updated in real time as a procedure is being performed. In other instances, thebutton 626 of the screen display 600 will indicated that it is in "Playback" or "Review" mode, which indicates that the screen display 600 is showing data obtained previously. With respect to the "Live" mode, it should be noted that the determination of the diagnostic window and/or the calculation of the pressure differential are performed in approximately real time or live to identify the diagnostic window of the heartbeat cycle and calculate the pressure differential. In that regard, calculating the pressure differential in "real time" or "live" within the context of the present disclosure is understood to encompass calculations that occur within 10 seconds of data acquisition. It is recognized, however, that often "real time" or "live" calculations are performed within 1 second of data acquisition. In some instances, the "real time" or "live" calculations are performed concurrent with data acquisition. In some instances the calculations are performed by a processor in the delays between data acquisitions. For example, if data is acquired from the pressure sensing devices for 1 ms every 5 ms, then in the 4 ms between data acquisitions the processor can perform the calculations. It is understood that these timings are for example only and that data acquisition rates, processing times, and/or other parameters surrounding the calculations will vary. In other embodiments, the pressure differential calculation is performed 10 or more seconds after data acquisition. For example, in some embodiments, the data utilized to identify the diagnostic window and/or calculate the pressure differential are stored for later analysis. - By comparing the calculated pressure differential to a threshold or predetermined value, a physician or other treating medical personnel can determine what, if any, treatment should be administered. In that regard, in some instances, a calculated pressure differential above a threshold value (e.g., 0.80 on a scale of 0.00 to 1.00) is indicative of a first treatment mode (e.g., no treatment, drug therapy, etc.), while a calculated pressure differential below the threshold value is indicative of a second, more invasive treatment mode (e.g., angioplasty, stent, etc.). In some instances, the threshold value is a fixed, preset value. In other instances, the threshold value is selected for a particular patient and/or a particular stenosis of a patient. In that regard, the threshold value for a particular patient may be based on one or more of empirical data, patient characteristics, patient history, physician preference, available treatment options, and/or other parameters.
- Also shown on
FIG. 6 is region ofinterest 630. The region ofinterest 630 may be assigned by thesystem 150 based on anomalous readings from the instruments such as drastic pressure changes in the vessel. In this embodiment, the region ofinterest 630 is centered around a sharp pressure change in the vessel. When such a region ofinterest 630 is identified by thesystem 150, the screen display 600 may show one or more options for taking further diagnostic measurements of the region ofinterest 630. Therefore, the screen display 600 shown inFIG. 6 prompts a medical professional to perform an IVUS measurement on the identified section of the vessel which may be further confirmed by a three-dimensional angiogram. - The coloring and/or other visually distinguishing aspect of the pressure differential measurements depicted in
graph 610 and/orwindow 614 of the screen display 600 ofFIG. 6 are configured based on the threshold value in some instances. For example, a first color (e.g., green, white, or otherwise) can be utilized to represent values well above the threshold value (e.g., where the threshold value is 0.80 on a scale of 0.00 to 1.00, values above 0.90), a second color (e.g., yellow, gray, or otherwise) can be utilized to represent values near but above the threshold value (e.g., where the threshold value is 0.80 on a scale of 0.00 to 1.00, values between 0.81 and 0.90), and a third color (e.g., red, black, or otherwise) can be utilized to represent values equal to or below the threshold value (e.g., where the threshold value is 0.80 on a scale of 0.00 to 1.00, values of 0.80 and below). Further, in some instances thegraph 610 includes one or more horizontal lines or other depictions representing the threshold value(s). It is appreciated that any number of color combinations, scalings, categories, and/or other characteristics can be utilized to visually represent the relative value of the pressure differential to the threshold value. However, for the sake of brevity Applicants will not explicitly describe the numerous variations herein. - Referring now to
FIG. 7 , shown therein is a plurality of bifurcation lesions that may be detected and classified using imaging data, such as may be provided by IVUS inspection. The bifurcations lesions shown are examples of situations where IVUS may be particularly useful in diagnosing vessels and determining appropriate treatment options. As previously shown inFIG. 5 , IVUS may be used in conjunction with other diagnostic procedures to resolve anomalous measurements and provide accurate data. Furthermore, the bifurcation lesions discussed in conjunction withFIG. 7 will be referred to inFIG. 9 . The imaging data may include an indication of whether an imaged surface is tissue or plaque, such as a calcium deposit. Thebifurcation 700 includes amain vessel 702 and aside vessel 704, and includes astenosis 706 within themain vessel 702 only and positioned before the branching of theside vessel 704. Thebifurcation 710 depicts astenosis 716 positioned within themain vessel 702 only and after the branching of theside vessel 704.Bifurcation 720 includes astenosis 726 situated adjacent to the branching of theside vessel 704, but limited to themain vessel 702. Thestenosis 726 includes portions both before and after the branching of theside vessel 704 thebifurcation 730 includes astenosis 736 that is situated adjacent to the branching of theside vessel 704, similar to thestenosis 726. However, thestenosis 736 includes portions within theside vessel 704. Thebifurcation 740 includes astenosis 746 situated within theside vessel 704 only. Thebifurcation 750 includes astenosis 756 adjacent to the branching and including a portion before the branching in themain vessel 702 and a portion after the branching in theside vessel 704. Thebifurcation 760 depicts astenosis 766 having portions proximate the branching and after the branching in both themain vessel 702 and theside vessel 704. Using IVUS data or other suitable data, thesystem 150 may perform image-processing and image-recognition to classify lesions occurring in each of the segments of interests. The segments may be labeled with the conventional names for each of the segments. Information regarding the segments, including classifications and associated severities, may be provided to acomputing device 172. - Referring now to
FIG. 8 , shown therein is an annotated depiction of stylized images of a vessel according to embodiments of the present disclosure. Thestylized user interface 800 ofFIG. 8 may be presented to a clinician in a display, as awindow 801, and incorporates angiogram data with an overlay of co-registered physiology measurements as described herein. As described herein, multiple types of data may be used by the system to formulate and recommend diagnostic procedures to a clinician. For example, physiology measurements collected using pressure sensors or other sensors may be co-registered with the angiogram data or, in some embodiments, with a two-dimensional or three-dimensional model prepared therefrom. In other embodiments, angiogram data and the co-registered physiology measurements may be presented separately and not overlaid as illustrated.FIG. 8 includesstylized images FIG. 8 can be displayed on a display 182 ofsystem 150 for assessing a patient's vasculature. That is, one or more components (e.g., a processor and/or processing circuit) of the system can render information, including angiogram data and physiology measurements, to provide display data to cause the display of the images shown inFIG. 8 . In some embodiments, the representations of theLCA 860 and theRCA 840 may be further stylized and/or presented without the underlying angiogram data. - The images of the stylized vessels in
FIG. 8 are annotated with one or more visualizations configured to assist in identifying one or more lesions and/or stenoses, and/or assess the severity thereof. These annotations may be automatically provided by performing image-recognition on angiogram data and/or other data, such as IVUS imaging data. The visualizations are based on physiology values obtained from one or more instruments (e.g.,instruments 130 and/or 132) as at least one of the instruments is moved through the vessel. The stylized vessels ofFIG. 8 can be colorized and/or otherwise visualized using a heat map that illustrates changes in pressure measurements (or other physiology measurements, such as flow volume, flow velocity, calcium deposits, etc.) obtained as the instrument is moved through the vessel. In some instances a proximal pressure measurement is obtained at a fixed location within the vessel while the instrument is pulled back through the vessel from a first position distal of the position where the proximal pressure measurement is obtained to a second position more proximal than the first position (i.e., closer the fixed position of the distal pressure measurement), such as is discussed herein in connection withFIG. 6 . Accordingly,FIG. 8 includes depictions of co-registered physiology measurements. - By comparing the calculated pressure differential to a threshold or predetermined value, a clinician or other treating medical personnel can determine what, if any, treatment should be administered. In that regard, in some instances, a calculated pressure differential above a threshold value (e.g., 0.80 on a scale of 0.00 to 1.00) is indicative of a first treatment mode (e.g., no treatment, drug therapy, etc.), while a calculated pressure differential below the threshold value is indicative of a second, more invasive treatment mode (e.g., angioplasty, stent, etc.). In some instances, the threshold value is a fixed, preset value. In other instances, the threshold value is selected for a particular patient and/or a particular stenosis of a patient. In that regard, the threshold value for a particular patient may be based on one or more of empirical data, patient characteristics, patient history, physician preference, available treatment options, and/or other parameters.
-
Markers 802 show pressure readings of specific sections of the vessel and can be described as tick marks. In some embodiments,markers 802 can extend transversely across the vessel. In other embodiments,markers 802 can take different shapes (e.g., circles, squares, etc.), be in different positions relative to the vessel (beside, within, etc.), be differently sized, etc. The markers and corresponding measurements can be utilized to both identify the location of the lesion or stenosis within the vessel and assess the severity of the lesion or stenosis. For example, under some conditions, the angiogram data may appear to show a normal vessel, while the physiology measurements presented on the user interface 800 (and shown overlaid on the angiogram data) may provide additional information. -
FIG. 8 includes visualizations for providing diagnostic information collected by one or more instruments at a corresponding location of the vessel on the display. In that regard,value indicators 804 can be disposed adjacent tomarkers 802 to indicate the location within the patient's vasculature to which the measurement corresponds. In other embodiments,value indicators 804 are displayed further away frommarkers 802, but an additional visual element (e.g., an arrow, a straight line, a curved line,marker 802 andvalue indicator 804 are the same or similar colors, etc.) is provided to indicate the location of the measurement. In some embodiments, thevalue indicators 804 include only the value of the physiological measurement (e.g., "0.90"), while in other embodiments, thevalue indicators 804 include the value and type of physiological measurement (e.g., "0.90 FFR"). In the example ofFIG. 8 ,value indicators value indicators 816 may be selected by the clinician and the corresponding measurement is displayed inwindow 830. In yet other embodiments, additional information, such as the time the measurement was taken, severity of the stenosis or lesion, etc. can also be provided by thevalue indicators 804. For example, a user may provide a user input (e.g., a selection from a drop-down menu, toggle through the available options, etc.) selecting the types of information that should be displayed invalue indicators 804. - In some embodiments,
markers 802 and/orvalue indicator 804 can be positioned automatically based on the physiology measurements. The system can be configured to select locations within the vessel that are clinically significant based on the diagnostic information (e.g., locations where the physiology measurements change significantly, such as points at which pressure changes). Similarly, the one or more visualizations ofFIG. 8 can includemarkers 802 and/orvalue indicator 804 for various predefined segments of the patient's vasculature. The segments identified byvalue indicators 804 include, but are not limited to, right coronary artery (RCA), left main coronary artery, circumflex coronary artery, left anterior descending (LAD), RCA proximal, RCA mid, RCA distal, LAD proximal, LAD mid, LAD apical, first diagonal, additional first diagonal, second diagonal, additional second diagonal, proximal circumflex, intermediate/anterolateral, obtuse marginal, distal circumflex, left posterolateral, posterior descending, among others. Thesevalue indicators 804 may also be automatically generated based on the angiogram data using image-recognition and modeling techniques.Labels 804 can be textual indications providing the names of major and/or minor vessels or segments thereof and can include alphabetical, numeric, and/or other symbolic characters. In some embodiments, thevalue indicators 804 are included automatically by thesystem 150 upon performing an image-recognition process on the angiogram information such as that depicted in theuser interface 500 ofFIG. 5 . The angiogram information may include, information characterizing or describing features of the vessel system such as the contours, location, branches, and other features of the vessel(s) to automatically identify individual vessels within the patient's vasculature. In this way, a model of the patient's vasculature may be generated and parsed to identify specific sections warranting the appropriate label. While abbreviations and particular vessels are used inFIG. 8 , it is understood that any suitable label can be used. - The co-registered physiology measurements maybe used to ensure the accuracy of prompts. For example, when the physiology measurements indicate that a lesion automatically detected from the angiogram data causes an insignificant pressure drop within the vasculature, a factor may attached in the analysis of the
system 150 to appropriately weigh the severity of the corresponding lesion. While the visual data may provide sufficient information to obtain a disease quantification score, the physiology data may indicate the relative significance of each identified lesion. -
Markers 802 andvalue indicators 804 may also be used by the system to issue recommendations or prompts to a medical professional. In some embodiments,markers 802 are set in potential risk areas, such as probable locations of lesions or stenosis. Thesemarkers 802 are recorded during diagnostic sessions and may be reviewed after medical procedures have taken place. In the example shown inFIG. 8 ,value indicator 816 shows a reading of 0.76 which may be indicative of a stenosis. Therefore, thesystem 150 issues a recommended procedure prompt inwindow 841 to use IVUS to confirm that the stent was accurately deployed and is functioning properly. -
FIG. 9 shows asystem 150 displaying a magnified view of thestylized RCA 840 in theuser interface 800 ofFIG. 8 . A clinician may use the user interface to view magnified images of any section of the vessel system including a region of interest to better understand the condition of the vessel. According to one embodiment of the present disclosure, anatomy and physiology can be analyzed to direct diagnostic procedures in stenosis located at bifurcations. For example, amain vessel 850 branches into amain branch 860 and aside branch 870. FFR measurements are taken at various sites that are marked by markers andvisual indicators FIG. 7 for exemplary plaque distributions), which can lead to pressure anomalies. IVUS is often used to determine the location of the plaques in a bifurcation so that the lesion can be appropriately classified prior to determining the therapeutic plan. If co-registered iFR or FFR data shows a possible stenosis near a bifurcation (as seen by an FFR measurement of 0.76 for value indicator 816), then thesystem 150 prompts a user inwindow 841 to perform a pressure assessment of theside branch 860 before or after delivery of therapy. For example, a user may be prompted to perform an iFR or FFR measurement when a stent is deployed in an area known to be prone to stent under-deployment. In some instances, use of iFR or FFR on the side branch of a bifurcation can be utilized to determine whether to treat that side branch. For example, after treatment of one side of the bifurcation with a stent, ablation, or otherwise, the other side branch may look to have a significant blockage on the angio image, but iFR or FFR may show that the blockage is not physiologically significant such that there is no need to treat the side branch. Co-registered data may also be useful in identifying anatomical features that are best resolved with a particular diagnostic modality such as intravascular imaging. The system is configured to issue a prompt to a user when indications of such features are present in the obtained physiological data. In the example ofFIG. 10 , the angiographic image of the vessel indicates a narrowing 870 in a vessel. The initial images of the narrowing 870 may be captured with an external imaging system such as automated quantitative coronary angiography (QCA). IVUS is particularly useful in diagnosing narrowed vessels because of the precision of the images available. Based on the QCA or other physiological data, a user may be prompted to perform intravascular imaging, such as IVUS or OCT. In this regard, thesystem 150 can prompt the user to perform IVUS measurements on the narrowedsection 870. In some embodiments, there can be more than one prompt issued for a given data set. In this case, thesystem 150 highlights or otherwise marks the region of interest (e.g., withoutline 880 or other suitable indicator) and issues acorresponding prompt 890 on theuser interface 800 in proximity of the region of interest. Additionally, the recommended procedure is shown inwindow 841. In addition to IVUS,system 150 may recommend other diagnostic procedures such as 3-D angio. In any case, the use of a variety of data sources allows potentially problematic anatomic anomalies to be more easily identified and addressed. - The one or more visualizations of
FIGS. 5-10 can include or be supplemented with information regarding characteristics of the lesion or stenosis and/or the vessel using one or more other vessel data-gathering modalities prompted by the system. The other representations of the lesion or stenosis and/or the vessel can include, e.g., IVUS (including virtual histology), OCT, ICE, Thermal, Infrared, flow, Doppler flow, and/or other vessel data-gathering modalities. The additional information can provide a more complete and/or accurate understanding of the vessel characteristics and/or assist in evaluating a risk associated with a lesion or stenosis. For example, in some instances the additional information can be utilized to make treatment decisions for borderline cases. - It is understood that numerous other visualization techniques may be utilized to convey the information of
FIGS. 5-10 in the context of an angiographic image or other image of the vessel (including both intravascular and extravascular imaging techniques, such as IVUS, OCT, ICE, CTA, etc.) to help the user evaluate the vessel. In that regard, while the examples of the present disclosure are provided with respect to angiographic images, it is understood that the concepts are equally applicable to other types of vessel imaging techniques, including intravascular and extravascular imaging. In some instances, a user is able to select what information should be included or excluded from the displayed image. In that regard, it should be noted that these visualization techniques related to conveying the pressure measurement data in the context of an angiographic or other image of the vessel can be utilized individually and in any combinations. For example, in some implementations a user is able to select what visualization mode(s) and/or portions thereof will be utilized and the system outputs the display accordingly. Further, in some implementations the user is able to manually annotate the displayed image to include notes and/or input one or more of the measured parameters. - The images of vessels in
FIG. 5-10 can include three-dimensional, two-dimensional, angiographic, a computed tomography angiographic (CTA), and/or other suitable forms of images. In some embodiments, a three-dimensional image may be rotated about a vertical axis. In some embodiments, a two-dimensional image may include multiple views about a vertical axis such that different two-dimensional views are shown when the image is rotated. In some implementations, the three dimensional model is displayed adjacent to a corresponding two dimensional depiction of the vessel. In that regard, the user may select both the type of depiction(s) (two dimensional (including imaging modality type) and/or three dimensional) along with what visualization mode(s) and/or portions thereof will be utilized. The system will output a corresponding display based on the user's preferences/selections and/or system defaults. -
FIG. 11 is a flow diagram of amethod 1000 of evaluating a vessel system of a patient to recommend a diagnostic procedure for the patient according to an embodiment of the present disclosure.Method 1000 can be implemented by a system described herein, such assystem 150 ofFIG. 4 . As illustrated inFIG. 11 , themethod 1000 is illustrated as a plurality of enumerated steps or operations. Embodiments of themethod 1000 may include additional steps or operations before, after, in between, or as part of the enumerated steps. Atstep 1002,method 1000 can include obtaining image data from an image of a vessel system. This may be done by contacting networked storage such as an electronic health record storage system to obtain data such as angiogram data. The angiogram data may include a two dimensional angiographic image, a three dimensional angiographic image, and/or a computed tomography angiographic (CTA) image. An example of the angiogram data may be seen in theuser interface 500 ofFIG. 5 which includes the angiogram 504. - At
step 1004, themethod 1000 can include obtaining physiology measurements from a vessel of a patient. In one embodiment, a first instrument and a second instrument are positioned within the vessel of the patient while the second instrument is moved longitudinally through the vessel from a first position to a second position. One or more diagnostic measurements (e.g., pressure-based including FFR and iFR, flow-based including CFR, etc.) can be used to gather the physiology measurements to characterize the existence and/or severity of a lesion or lesions within the vasculature of a patient. For example, when FFR is used, areas of a patient's vasculature that have a relatively high FFR (e.g., greater than 0.80) are characterized as not having a lesion or stenosis, while areas with a relatively low FFR (e.g., less than 0.80) are characterized as having a lesion or stenosis. The severity can be evaluated based on the heat map described herein. The physiology measurements may be obtained in a manner that provides at least some location information associated with the measurements. - At
step 1006, themethod 1000 can include co-registering the physiology measurements with the image data. In this way, the physiological measurements are associated with corresponding portions of the vessel of the patient, producing co-registered physiology measurements. The co-registered physiology measurements can be displayed in an overlaid fashion, such that the physiology measurements maybe visualized in association with the angiogram image data. An example may be seen in theuser interface 800 ofFIGS. 8-10 . By co-registering the physiology measurements with the image data, thesystem 150 may provide additional perspective to a clinician or clinicians. Thewindow 801 may indicate the physical dimensions of the patient's vasculature, which may be sufficient to identify one or more lesions therein, while the physiology measurements indicate the impact or effect of lesions with the vasculature. In some embodiments, co-registering the physiology measurements with the image data may include associating, in a data file, each physiology measurement with a location within the vessel system, identifying a corresponding location for each physiology measurement with the image data, and associating in the co-registered physiology measurements data file, each physiology measurement with its corresponding location within the image of the vessel system. In some embodiments, co-registering the physiology measurements may produce a new data file that includes the co-registered physiology measurements. - At
step 1008, themethod 1000 can include analyzing the co-registered physiological measurements to identify a region of interest within the vessel system. There are several ways to identify a probable risk area. First, a region of interest may be based on the performance of past medical procedures. For example, if a stent was previously placed in the analysis area, thesystem 150 may automatically flag the area as a region of interest and recommend further analysis to confirm the accurate placement and functionality of the stent. The placement of the stent may be compared to pre-procedure projections such as a virtual stent to see if expected results have been reached. Second, a region of interest may be based on pressure measurements. As explained in conjunction withFIG. 8 , anomalous pressure measurements (such as unusually low FFR readings taken in context with the given vessel anatomy) may automatically prompt a recommendation to take further measurements, conduct another type of diagnostic procedure, or in extreme cases, undertake a medical procedure. Third, regions of interest may be based on anatomical physiological data such as unexpected narrowing of a vessel or the existence of a side branch near a stenosis. Further physiology information that may be considered includes dominance classification, a degree of occlusion of the lesion, a classification of the lesion, a degree of bending of a vessel of the vessel system, a length of the lesion, a degree of calcification of the lesion, etc. The method of analyzing regions of interests based on the anatomical physiology is discussed in conjunction withFIG. 10 . - At
step 1010, themethod 1000 according to the invention includes formulating a recommendation of a diagnostic or medical procedure based on the analysis of the co-registered physiology measurements. This recommendation includes confirming measurements taken by thesystem 150, collecting further measurements, running a diagnostic procedure such as iFR measurements, PCI planning or CABG mapping, or performing a medical procedure. The formulation of this recommendation takes into account multiple sources of co-registered information and assigns unequal weights to the various sources as necessary. According to the invention, the recommendation assigns great importance on whether the patient had a previous myocardial infarction and/or previous PCI, especially in the location at issue, while assigning lesser importance to the actual FFR measurement in a vessel. The recommendation may also be based on comparison of current physiological measurements with previously recorded physiological measurements from a database. Other sources of information that form part of the analysis and formulation of the recommendation include patient history such as age, gender, or preexisting conditions such as diabetes or hypertension. - At
step 1012, themethod 1000 can include displaying the recommendation to a user. In some embodiments, the recommendation is automatically displayed on auser interface 800 such as that shown inFIGS. 8-10 . The recommendation may be displayed on the screen of the display or in a separate window such aswindow 841. In some cases, recommendations are displayed alongside imagery to show the exact region of interest that the recommendation pertains to, as shown inFIG. 10 . Furthermore, recommendations may involve multiple procedures as discussed in conjunction withFIG. 5 . Recommendation of procedures may be read by medical professionals during the course of a procedure to help guide diagnoses. Additionally, the recommendation may be used as an educational tool. For instance, the recommendation and factors used by thesystem 150 in the analysis used to formulate the recommendation may be presented to a patient, or the family members or guardian of a patient to help explain the reasoning of the medical professional or the likelihood of future procedures. - Persons skilled in the art will also recognize that the apparatus, systems, and methods described above can be modified in various ways. Accordingly, persons of ordinary skill in the art will appreciate that the embodiments encompassed by the present disclosure are not limited to the particular exemplary embodiments described above. In that regard, although illustrative embodiments have been shown and described, a wide range of modification, change, and substitution is contemplated in the foregoing disclosure. It is understood that such variations may be made to the foregoing without departing from the scope of the present disclosure. Accordingly, it is appropriate that the appended claims be construed broadly and in a manner consistent with the present disclosure.
Claims (14)
- A system (150) for evaluating a vessel of a patient, the system comprising:
a computing device (172) connectable with at least one intravascular device, the computing device configured to:obtain image data from an image of the vessel of the patient;obtain physiological measurements from the vessel of the patient from the at least one intravascular device (130,132, 152, 175), wherein the obtained physiological measurements include FFR measurements;co-register the obtained physiological measurements with the obtained image data of the vessel such that the physiological measurements are associated with corresponding portions of the vessel of the patient, producing co-registered physiological measurements; characterized in that the computing device (172) is further configured toanalyze the co-registered physiology measurements to identify a region of interest (880); andoutput, to a user interface (800), a suggested diagnostic procedure (841) for the region of interest (880) based on the analysis of the co-registered physiological measurements, wherein the suggested diagnostic procedure is a recommendation and the recommendation is further based on multiple sources of co-registered information, wherein unequal weights are assigned to the multiple sources, wherein whether the patient had a previous myocardial infarction and/or previous percutaneous coronary intervention in the identified region of interest has a larger weight than an actual FFR measurement in the vessel. - The system of claim 1, wherein the obtained physiological measurements include pressure measurements.
- The system of claim 2, wherein the computing device is further configured to calculate a pressure ratio based on the obtained pressure measurements.
- The system of claim 1, wherein the suggested diagnostic procedure includes an intravascular imaging procedure.
- The system of claim 4, wherein the suggested intravascular imaging procedure includes at least one of an intravascular ultrasound (IVUS) procedure and an optical coherence tomography (OCT) procedure.
- The system of claim 1, wherein the suggested diagnostic procedure includes an intravascular flow measurement procedure.
- The system of claim 1, wherein the obtained physiological measurements include flow measurements.
- The system of claim 7, wherein the suggested diagnostic procedure includes at least one of an intravascular imaging procedure and an intravascular pressure measurement procedure.
- The system of claim 1, wherein the obtained image data includes image data received from an extravascular imaging system.
- The system of claim 9, wherein the obtained image data includes at least one of a two-dimensional angiographic image, a three-dimensional angiographic image, and a computed tomography angiographic (CTA) image.
- The system of claim 1, further comprising the at least one intravascular device.
- The system of claim 1 or 11, further comprising the user interface for visualizing the suggested diagnostic procedure for the region of interest based on the analysis of the co-registered physiology measurements.
- The system of claim 10, wherein the image data indicative of anatomical physiology is based on quantitative coronary angiography (QCA).
- A method (1000) of evaluating a vessel of a patient, the method comprising:obtaining image data from an image of the vessel of the patient;obtaining physiological measurements from the vessel of the patient from the at least one intravascular device (130,132, 152, 175), wherein the obtained physiological measurements include FFR measurements;co-registering the obtained physiological measurements with the obtained image data of the vessel such that the physiological measurements are associated with corresponding portions of the vessel of the patient, producing co-registered physiological measurements; characterized in that the method further comprisesanalyzing the co-registered physiology measurements to identify a region of interest (880); andoutputting, to a user interface (800), a suggested diagnostic procedure for the region of interest based on the analysis of the co-registered physiological measurements, wherein the suggested diagnostic procedure is a recommendation and the recommendation is further based on multiple sources of co-registered information, wherein unequal weights are assigned to the multiple sources, wherein whether the patient had a previous myocardial infarction and/or previous percutaneous coronary intervention in the identified region of interest has a larger weight than an actual FFR measurement in the vessel.
Priority Applications (1)
| Application Number | Priority Date | Filing Date | Title |
|---|---|---|---|
| EP20194520.1A EP3777689A1 (en) | 2014-12-08 | 2015-11-24 | Diagnostic and imaging direction based on anatomical and/or physiological parameters |
Applications Claiming Priority (2)
| Application Number | Priority Date | Filing Date | Title |
|---|---|---|---|
| US201462089080P | 2014-12-08 | 2014-12-08 | |
| PCT/IB2015/059064 WO2016092398A1 (en) | 2014-12-08 | 2015-11-24 | Device and method to recommend diagnostic procedure based on co-registered angiographic image and physiological information measured by intravascular device |
Related Child Applications (2)
| Application Number | Title | Priority Date | Filing Date |
|---|---|---|---|
| EP20194520.1A Division EP3777689A1 (en) | 2014-12-08 | 2015-11-24 | Diagnostic and imaging direction based on anatomical and/or physiological parameters |
| EP20194520.1A Division-Into EP3777689A1 (en) | 2014-12-08 | 2015-11-24 | Diagnostic and imaging direction based on anatomical and/or physiological parameters |
Publications (2)
| Publication Number | Publication Date |
|---|---|
| EP3229688A1 EP3229688A1 (en) | 2017-10-18 |
| EP3229688B1 true EP3229688B1 (en) | 2020-10-28 |
Family
ID=54783968
Family Applications (2)
| Application Number | Title | Priority Date | Filing Date |
|---|---|---|---|
| EP15805298.5A Active EP3229688B1 (en) | 2014-12-08 | 2015-11-24 | Device and method to recommend diagnostic procedure based on co-registered angiographic image and physiological information measured by intravascular device |
| EP20194520.1A Pending EP3777689A1 (en) | 2014-12-08 | 2015-11-24 | Diagnostic and imaging direction based on anatomical and/or physiological parameters |
Family Applications After (1)
| Application Number | Title | Priority Date | Filing Date |
|---|---|---|---|
| EP20194520.1A Pending EP3777689A1 (en) | 2014-12-08 | 2015-11-24 | Diagnostic and imaging direction based on anatomical and/or physiological parameters |
Country Status (4)
| Country | Link |
|---|---|
| US (2) | US10751015B2 (en) |
| EP (2) | EP3229688B1 (en) |
| JP (1) | JP6925268B2 (en) |
| WO (1) | WO2016092398A1 (en) |
Cited By (3)
| Publication number | Priority date | Publication date | Assignee | Title |
|---|---|---|---|---|
| US11135454B2 (en) | 2015-06-24 | 2021-10-05 | The Regents Of The University Of Michigan | Histotripsy therapy systems and methods for the treatment of brain tissue |
| US11648424B2 (en) | 2018-11-28 | 2023-05-16 | Histosonics Inc. | Histotripsy systems and methods |
| US11813485B2 (en) | 2020-01-28 | 2023-11-14 | The Regents Of The University Of Michigan | Systems and methods for histotripsy immunosensitization |
Families Citing this family (29)
| Publication number | Priority date | Publication date | Assignee | Title |
|---|---|---|---|---|
| US10780298B2 (en) | 2013-08-22 | 2020-09-22 | The Regents Of The University Of Michigan | Histotripsy using very short monopolar ultrasound pulses |
| EP3314603A1 (en) | 2015-06-25 | 2018-05-02 | Koninklijke Philips N.V. | Interactive intravascular procedure training and associated devices, systems, and methods |
| JP6540442B2 (en) * | 2015-10-07 | 2019-07-10 | 株式会社デンソー | Display method and display control device |
| JP6964122B2 (en) * | 2016-07-14 | 2021-11-10 | コーニンクレッカ フィリップス エヌ ヴェKoninklijke Philips N.V. | Devices, systems and methods that provide feedback on the quality of intravascular characterization |
| US11576637B2 (en) * | 2017-04-06 | 2023-02-14 | Koninklijke Philips N.V. | Standardized coronary artery disease metric |
| CN110998744B (en) * | 2017-08-01 | 2024-04-05 | 西门子医疗有限公司 | Noninvasive assessment and treatment guidance for coronary artery disease in diffuse and tandem lesions |
| EP3461416A1 (en) * | 2017-09-28 | 2019-04-03 | Koninklijke Philips N.V. | Guiding an intravascular us catheter |
| JP2019076526A (en) | 2017-10-25 | 2019-05-23 | テルモ株式会社 | Treatment method |
| JP2019076527A (en) | 2017-10-25 | 2019-05-23 | テルモ株式会社 | Treatment method |
| JP2019076531A (en) | 2017-10-25 | 2019-05-23 | テルモ株式会社 | Treatment method |
| JP2019080749A (en) | 2017-10-30 | 2019-05-30 | テルモ株式会社 | Treatment method |
| JP2019080876A (en) | 2017-10-31 | 2019-05-30 | テルモ株式会社 | Method for medical treatment |
| JP2019080875A (en) | 2017-10-31 | 2019-05-30 | テルモ株式会社 | Treatment method |
| JP7024103B2 (en) * | 2018-02-23 | 2022-02-22 | ボストン サイエンティフィック サイムド,インコーポレイテッド | Evaluation method of blood vessels by sequential physiological measurement |
| US11850073B2 (en) | 2018-03-23 | 2023-12-26 | Boston Scientific Scimed, Inc. | Medical device with pressure sensor |
| WO2019195721A1 (en) | 2018-04-06 | 2019-10-10 | Boston Scientific Scimed, Inc. | Medical device with pressure sensor |
| WO2019204219A1 (en) * | 2018-04-18 | 2019-10-24 | Boston Scientific Scimed, Inc. | System for assessing a vessel with sequential physiological measurements |
| WO2020025352A1 (en) * | 2018-07-30 | 2020-02-06 | Koninklijke Philips N.V. | Intravascular imaging procedure-specific workflow guidance and associated devices, systems, and methods |
| US11049294B2 (en) * | 2018-10-02 | 2021-06-29 | Canon Medical Systems Corporation | Activity-dependent, spatially-varying regularization parameter design for regularized image reconstruction |
| JP7187247B2 (en) * | 2018-10-11 | 2022-12-12 | キヤノンメディカルシステムズ株式会社 | Medical image processing device, X-ray diagnostic device, and medical image processing system |
| US11241208B2 (en) * | 2018-11-19 | 2022-02-08 | Terumo Kabushiki Kaisha | Diagnostic method, method for validation of diagnostic method, and treatment method |
| CN109700475B (en) * | 2018-12-27 | 2021-01-08 | 浙江大学 | Method, device, equipment and storage medium for determining coronary bypass parameters |
| USD926199S1 (en) | 2019-05-17 | 2021-07-27 | Opsens, Inc. | Display screen or portion thereof with graphical user interface |
| CN110364256A (en) * | 2019-06-21 | 2019-10-22 | 平安科技(深圳)有限公司 | A kind of disease forecasting system and method for the blood-vessel image identification based on big data |
| JP2022550267A (en) * | 2019-09-09 | 2022-12-01 | メッドハブ リミテッド | Automated analysis of image data to determine blood flow reserve ratio |
| US20220084658A1 (en) * | 2020-09-17 | 2022-03-17 | Fujifilm Medical Systems U.S.A., Inc. | Systems and Methods for Automated Vessel Labeling |
| CN114680823A (en) * | 2020-12-25 | 2022-07-01 | 深圳迈瑞生物医疗电子股份有限公司 | Monitoring equipment, medical central station system and monitoring data reviewing method |
| WO2023054366A1 (en) * | 2021-10-01 | 2023-04-06 | 富士フイルム株式会社 | Medical image processing system |
| WO2023110801A1 (en) * | 2021-12-16 | 2023-06-22 | Koninklijke Philips N.V. | Guidewire and catheter selection and real-time guidance |
Family Cites Families (28)
| Publication number | Priority date | Publication date | Assignee | Title |
|---|---|---|---|---|
| US20040122709A1 (en) * | 2002-12-18 | 2004-06-24 | Avinash Gopal B. | Medical procedure prioritization system and method utilizing integrated knowledge base |
| KR100506816B1 (en) | 2003-01-06 | 2005-08-09 | 삼성전자주식회사 | Storage node of a capacitor in a semiconductor device and method for forming the storage node |
| WO2005106474A2 (en) * | 2004-04-14 | 2005-11-10 | Edda Technology, Inc. | Liver disease diagnosis system, method and graphical user interface |
| JP5345782B2 (en) * | 2005-01-11 | 2013-11-20 | ヴォルケイノウ・コーポレーション | Blood vessel information acquisition device |
| US7729746B2 (en) * | 2005-11-04 | 2010-06-01 | Siemens Aktiengesellschaft | Three-dimensional co-registration between intravascular and angiographic data |
| US11064964B2 (en) * | 2007-03-08 | 2021-07-20 | Sync-Rx, Ltd | Determining a characteristic of a lumen by measuring velocity of a contrast agent |
| US8374686B2 (en) * | 2009-12-04 | 2013-02-12 | Medtronic, Inc. | Continuous monitoring of risk burden for sudden cardiac death risk stratification |
| US20110301479A1 (en) * | 2010-06-03 | 2011-12-08 | Medtronic, Inc. | System and Method for Assessing a Likelihood of a Patient to Experience a Future Cardiac Arrhythmia Using Dynamic Changes in a Biological Parameter |
| US20120101369A1 (en) | 2010-06-13 | 2012-04-26 | Angiometrix Corporation | Methods and systems for determining vascular bodily lumen information and guiding medical devices |
| US8157742B2 (en) * | 2010-08-12 | 2012-04-17 | Heartflow, Inc. | Method and system for patient-specific modeling of blood flow |
| US8645653B2 (en) | 2010-10-14 | 2014-02-04 | Hitachi, Ltd | Data migration system and data migration method |
| GB201100137D0 (en) | 2011-01-06 | 2011-02-23 | Davies Helen C S | Apparatus and method of assessing a narrowing in a fluid tube |
| GB201100136D0 (en) | 2011-01-06 | 2011-02-23 | Davies Helen C S | Apparatus and method of characterising a narrowing in a filled tube |
| BR112013031673A2 (en) * | 2011-06-13 | 2016-12-06 | Angiometrix Corp | guidewire device configured to evaluate one or more vascular body lumens |
| US20150024398A1 (en) | 2011-08-05 | 2015-01-22 | Ibis Biosciences, Inc. | Analysis of genetic biomarkers for forensic analysis and fingerprinting |
| US9339348B2 (en) | 2011-08-20 | 2016-05-17 | Imperial Colege of Science, Technology and Medicine | Devices, systems, and methods for assessing a vessel |
| EP2744400B1 (en) | 2011-08-20 | 2017-05-24 | Volcano Corporation | Devices, systems, and methods for visually depicting a vessel and evaluating treatment options |
| JP6173438B2 (en) * | 2012-05-14 | 2017-08-02 | コーニンクレッカ フィリップス エヌ ヴェKoninklijke Philips N.V. | Determination of coronary flow reserve ratio (FFR) for stenosis of blood vessels |
| JP6181180B2 (en) * | 2012-08-03 | 2017-08-16 | ボルケーノ コーポレイション | System for evaluating vessels |
| CN104582572B (en) | 2012-08-16 | 2018-04-13 | 东芝医疗系统株式会社 | Image processing apparatus, medical diagnostic imaging apparatus and blood pressure monitor |
| US9675301B2 (en) * | 2012-10-19 | 2017-06-13 | Heartflow, Inc. | Systems and methods for numerically evaluating vasculature |
| CN104812306A (en) * | 2012-11-29 | 2015-07-29 | 株式会社东芝 | Medical information processing device, medical image diagnostic device and medical information processing method |
| WO2014084382A1 (en) * | 2012-11-30 | 2014-06-05 | 株式会社 東芝 | Medical-image processing device |
| CA2895976A1 (en) * | 2012-12-21 | 2014-06-26 | Volcano Corporation | Steerable intravascular devices and associated devices, systems, and methods |
| US10368836B2 (en) * | 2012-12-26 | 2019-08-06 | Volcano Corporation | Gesture-based interface for a multi-modality medical imaging system |
| US10076301B2 (en) * | 2012-12-31 | 2018-09-18 | Volcano Corporation | Devices, systems, and methods for assessment of vessels |
| US11224349B2 (en) | 2013-07-19 | 2022-01-18 | Image Guide Therapy Corporation | Devices, systems, and methods for assessing a vessel with automated drift correction |
| EP3021758A4 (en) | 2013-07-19 | 2017-03-15 | Volcano Corporation | Devices, systems, and methods for assessment of vessels |
-
2015
- 2015-11-24 JP JP2017530045A patent/JP6925268B2/en active Active
- 2015-11-24 EP EP15805298.5A patent/EP3229688B1/en active Active
- 2015-11-24 EP EP20194520.1A patent/EP3777689A1/en active Pending
- 2015-11-24 WO PCT/IB2015/059064 patent/WO2016092398A1/en active Application Filing
- 2015-12-07 US US14/961,627 patent/US10751015B2/en active Active
-
2020
- 2020-08-24 US US17/001,329 patent/US11813099B2/en active Active
Non-Patent Citations (1)
| Title |
|---|
| None * |
Cited By (4)
| Publication number | Priority date | Publication date | Assignee | Title |
|---|---|---|---|---|
| US11135454B2 (en) | 2015-06-24 | 2021-10-05 | The Regents Of The University Of Michigan | Histotripsy therapy systems and methods for the treatment of brain tissue |
| US11648424B2 (en) | 2018-11-28 | 2023-05-16 | Histosonics Inc. | Histotripsy systems and methods |
| US11813484B2 (en) | 2018-11-28 | 2023-11-14 | Histosonics, Inc. | Histotripsy systems and methods |
| US11813485B2 (en) | 2020-01-28 | 2023-11-14 | The Regents Of The University Of Michigan | Systems and methods for histotripsy immunosensitization |
Also Published As
| Publication number | Publication date |
|---|---|
| WO2016092398A1 (en) | 2016-06-16 |
| US11813099B2 (en) | 2023-11-14 |
| EP3777689A1 (en) | 2021-02-17 |
| JP2017536212A (en) | 2017-12-07 |
| JP6925268B2 (en) | 2021-08-25 |
| US20160157807A1 (en) | 2016-06-09 |
| US20200390411A1 (en) | 2020-12-17 |
| EP3229688A1 (en) | 2017-10-18 |
| US10751015B2 (en) | 2020-08-25 |
Similar Documents
| Publication | Publication Date | Title |
|---|---|---|
| US11813099B2 (en) | Diagnostic and imaging direction based on anatomical and/or physiological parameters | |
| US20220246271A1 (en) | Devices, systems, and methodsfor vessel assessment and intervention recommendation | |
| US20220000427A1 (en) | Automated identification and classification of intravascular lesions | |
| US11688502B2 (en) | Percutaneous coronary intervention (PCI) planning interface and associated devices, systems, and methods | |
| US20210244299A1 (en) | Devices, systems, and methods for vessel assessment | |
| US11779286B2 (en) | Percutaneous coronary intervention (PCI) planning interface with pressure data and vessel data and associated devices, systems, and methods | |
| US10076301B2 (en) | Devices, systems, and methods for assessment of vessels |
Legal Events
| Date | Code | Title | Description |
|---|---|---|---|
| STAA | Information on the status of an ep patent application or granted ep patent |
Free format text: STATUS: THE INTERNATIONAL PUBLICATION HAS BEEN MADE |
|
| PUAI | Public reference made under article 153(3) epc to a published international application that has entered the european phase |
Free format text: ORIGINAL CODE: 0009012 |
|
| STAA | Information on the status of an ep patent application or granted ep patent |
Free format text: STATUS: REQUEST FOR EXAMINATION WAS MADE |
|
| 17P | Request for examination filed |
Effective date: 20170710 |
|
| AK | Designated contracting states |
Kind code of ref document: A1 Designated state(s): AL AT BE BG CH CY CZ DE DK EE ES FI FR GB GR HR HU IE IS IT LI LT LU LV MC MK MT NL NO PL PT RO RS SE SI SK SM TR |
|
| AX | Request for extension of the european patent |
Extension state: BA ME |
|
| STAA | Information on the status of an ep patent application or granted ep patent |
Free format text: STATUS: EXAMINATION IS IN PROGRESS |
|
| 17Q | First examination report despatched |
Effective date: 20180220 |
|
| DAV | Request for validation of the european patent (deleted) | ||
| DAX | Request for extension of the european patent (deleted) | ||
| RAP1 | Party data changed (applicant data changed or rights of an application transferred) |
Owner name: KONINKLIJKE PHILIPS N.V. Owner name: VOLCANO CORPORATION |
|
| GRAP | Despatch of communication of intention to grant a patent |
Free format text: ORIGINAL CODE: EPIDOSNIGR1 |
|
| STAA | Information on the status of an ep patent application or granted ep patent |
Free format text: STATUS: GRANT OF PATENT IS INTENDED |
|
| INTG | Intention to grant announced |
Effective date: 20200520 |
|
| GRAS | Grant fee paid |
Free format text: ORIGINAL CODE: EPIDOSNIGR3 |
|
| GRAA | (expected) grant |
Free format text: ORIGINAL CODE: 0009210 |
|
| STAA | Information on the status of an ep patent application or granted ep patent |
Free format text: STATUS: THE PATENT HAS BEEN GRANTED |
|
| AK | Designated contracting states |
Kind code of ref document: B1 Designated state(s): AL AT BE BG CH CY CZ DE DK EE ES FI FR GB GR HR HU IE IS IT LI LT LU LV MC MK MT NL NO PL PT RO RS SE SI SK SM TR |
|
| REG | Reference to a national code |
Ref country code: GB Ref legal event code: FG4D |
|
| REG | Reference to a national code |
Ref country code: CH Ref legal event code: EP |
|
| REG | Reference to a national code |
Ref country code: AT Ref legal event code: REF Ref document number: 1327372 Country of ref document: AT Kind code of ref document: T Effective date: 20201115 |
|
| REG | Reference to a national code |
Ref country code: DE Ref legal event code: R096 Ref document number: 602015061220 Country of ref document: DE |
|
| REG | Reference to a national code |
Ref country code: IE Ref legal event code: FG4D |
|
| RAP2 | Party data changed (patent owner data changed or rights of a patent transferred) |
Owner name: KONINKLIJKE PHILIPS N.V. Owner name: PHILIPS IMAGE GUIDED THERAPY CORPORATION |
|
| REG | Reference to a national code |
Ref country code: AT Ref legal event code: MK05 Ref document number: 1327372 Country of ref document: AT Kind code of ref document: T Effective date: 20201028 |
|
| REG | Reference to a national code |
Ref country code: NL Ref legal event code: MP Effective date: 20201028 |
|
| PG25 | Lapsed in a contracting state [announced via postgrant information from national office to epo] |
Ref country code: GR Free format text: LAPSE BECAUSE OF FAILURE TO SUBMIT A TRANSLATION OF THE DESCRIPTION OR TO PAY THE FEE WITHIN THE PRESCRIBED TIME-LIMIT Effective date: 20210129 Ref country code: RS Free format text: LAPSE BECAUSE OF FAILURE TO SUBMIT A TRANSLATION OF THE DESCRIPTION OR TO PAY THE FEE WITHIN THE PRESCRIBED TIME-LIMIT Effective date: 20201028 Ref country code: PT Free format text: LAPSE BECAUSE OF FAILURE TO SUBMIT A TRANSLATION OF THE DESCRIPTION OR TO PAY THE FEE WITHIN THE PRESCRIBED TIME-LIMIT Effective date: 20210301 Ref country code: FI Free format text: LAPSE BECAUSE OF FAILURE TO SUBMIT A TRANSLATION OF THE DESCRIPTION OR TO PAY THE FEE WITHIN THE PRESCRIBED TIME-LIMIT Effective date: 20201028 Ref country code: NL Free format text: LAPSE BECAUSE OF FAILURE TO SUBMIT A TRANSLATION OF THE DESCRIPTION OR TO PAY THE FEE WITHIN THE PRESCRIBED TIME-LIMIT Effective date: 20201028 Ref country code: NO Free format text: LAPSE BECAUSE OF FAILURE TO SUBMIT A TRANSLATION OF THE DESCRIPTION OR TO PAY THE FEE WITHIN THE PRESCRIBED TIME-LIMIT Effective date: 20210128 |
|
| REG | Reference to a national code |
Ref country code: LT Ref legal event code: MG4D |
|
| PG25 | Lapsed in a contracting state [announced via postgrant information from national office to epo] |
Ref country code: ES Free format text: LAPSE BECAUSE OF FAILURE TO SUBMIT A TRANSLATION OF THE DESCRIPTION OR TO PAY THE FEE WITHIN THE PRESCRIBED TIME-LIMIT Effective date: 20201028 Ref country code: AT Free format text: LAPSE BECAUSE OF FAILURE TO SUBMIT A TRANSLATION OF THE DESCRIPTION OR TO PAY THE FEE WITHIN THE PRESCRIBED TIME-LIMIT Effective date: 20201028 Ref country code: BG Free format text: LAPSE BECAUSE OF FAILURE TO SUBMIT A TRANSLATION OF THE DESCRIPTION OR TO PAY THE FEE WITHIN THE PRESCRIBED TIME-LIMIT Effective date: 20210128 Ref country code: IS Free format text: LAPSE BECAUSE OF FAILURE TO SUBMIT A TRANSLATION OF THE DESCRIPTION OR TO PAY THE FEE WITHIN THE PRESCRIBED TIME-LIMIT Effective date: 20210228 Ref country code: LV Free format text: LAPSE BECAUSE OF FAILURE TO SUBMIT A TRANSLATION OF THE DESCRIPTION OR TO PAY THE FEE WITHIN THE PRESCRIBED TIME-LIMIT Effective date: 20201028 Ref country code: PL Free format text: LAPSE BECAUSE OF FAILURE TO SUBMIT A TRANSLATION OF THE DESCRIPTION OR TO PAY THE FEE WITHIN THE PRESCRIBED TIME-LIMIT Effective date: 20201028 Ref country code: SE Free format text: LAPSE BECAUSE OF FAILURE TO SUBMIT A TRANSLATION OF THE DESCRIPTION OR TO PAY THE FEE WITHIN THE PRESCRIBED TIME-LIMIT Effective date: 20201028 |
|
| PG25 | Lapsed in a contracting state [announced via postgrant information from national office to epo] |
Ref country code: HR Free format text: LAPSE BECAUSE OF FAILURE TO SUBMIT A TRANSLATION OF THE DESCRIPTION OR TO PAY THE FEE WITHIN THE PRESCRIBED TIME-LIMIT Effective date: 20201028 |
|
| REG | Reference to a national code |
Ref country code: CH Ref legal event code: PL |
|
| REG | Reference to a national code |
Ref country code: DE Ref legal event code: R097 Ref document number: 602015061220 Country of ref document: DE |
|
| PG25 | Lapsed in a contracting state [announced via postgrant information from national office to epo] |
Ref country code: EE Free format text: LAPSE BECAUSE OF FAILURE TO SUBMIT A TRANSLATION OF THE DESCRIPTION OR TO PAY THE FEE WITHIN THE PRESCRIBED TIME-LIMIT Effective date: 20201028 Ref country code: CZ Free format text: LAPSE BECAUSE OF FAILURE TO SUBMIT A TRANSLATION OF THE DESCRIPTION OR TO PAY THE FEE WITHIN THE PRESCRIBED TIME-LIMIT Effective date: 20201028 Ref country code: SM Free format text: LAPSE BECAUSE OF FAILURE TO SUBMIT A TRANSLATION OF THE DESCRIPTION OR TO PAY THE FEE WITHIN THE PRESCRIBED TIME-LIMIT Effective date: 20201028 Ref country code: MC Free format text: LAPSE BECAUSE OF FAILURE TO SUBMIT A TRANSLATION OF THE DESCRIPTION OR TO PAY THE FEE WITHIN THE PRESCRIBED TIME-LIMIT Effective date: 20201028 Ref country code: LU Free format text: LAPSE BECAUSE OF NON-PAYMENT OF DUE FEES Effective date: 20201124 Ref country code: LT Free format text: LAPSE BECAUSE OF FAILURE TO SUBMIT A TRANSLATION OF THE DESCRIPTION OR TO PAY THE FEE WITHIN THE PRESCRIBED TIME-LIMIT Effective date: 20201028 Ref country code: SK Free format text: LAPSE BECAUSE OF FAILURE TO SUBMIT A TRANSLATION OF THE DESCRIPTION OR TO PAY THE FEE WITHIN THE PRESCRIBED TIME-LIMIT Effective date: 20201028 Ref country code: RO Free format text: LAPSE BECAUSE OF FAILURE TO SUBMIT A TRANSLATION OF THE DESCRIPTION OR TO PAY THE FEE WITHIN THE PRESCRIBED TIME-LIMIT Effective date: 20201028 |
|
| REG | Reference to a national code |
Ref country code: BE Ref legal event code: MM Effective date: 20201130 |
|
| PG25 | Lapsed in a contracting state [announced via postgrant information from national office to epo] |
Ref country code: LI Free format text: LAPSE BECAUSE OF NON-PAYMENT OF DUE FEES Effective date: 20201130 Ref country code: DK Free format text: LAPSE BECAUSE OF FAILURE TO SUBMIT A TRANSLATION OF THE DESCRIPTION OR TO PAY THE FEE WITHIN THE PRESCRIBED TIME-LIMIT Effective date: 20201028 Ref country code: CH Free format text: LAPSE BECAUSE OF NON-PAYMENT OF DUE FEES Effective date: 20201130 |
|
| PLBE | No opposition filed within time limit |
Free format text: ORIGINAL CODE: 0009261 |
|
| STAA | Information on the status of an ep patent application or granted ep patent |
Free format text: STATUS: NO OPPOSITION FILED WITHIN TIME LIMIT |
|
| 26N | No opposition filed |
Effective date: 20210729 |
|
| PG25 | Lapsed in a contracting state [announced via postgrant information from national office to epo] |
Ref country code: IE Free format text: LAPSE BECAUSE OF NON-PAYMENT OF DUE FEES Effective date: 20201124 Ref country code: IT Free format text: LAPSE BECAUSE OF FAILURE TO SUBMIT A TRANSLATION OF THE DESCRIPTION OR TO PAY THE FEE WITHIN THE PRESCRIBED TIME-LIMIT Effective date: 20201028 Ref country code: AL Free format text: LAPSE BECAUSE OF FAILURE TO SUBMIT A TRANSLATION OF THE DESCRIPTION OR TO PAY THE FEE WITHIN THE PRESCRIBED TIME-LIMIT Effective date: 20201028 |
|
| PG25 | Lapsed in a contracting state [announced via postgrant information from national office to epo] |
Ref country code: SI Free format text: LAPSE BECAUSE OF FAILURE TO SUBMIT A TRANSLATION OF THE DESCRIPTION OR TO PAY THE FEE WITHIN THE PRESCRIBED TIME-LIMIT Effective date: 20201028 |
|
| PGFP | Annual fee paid to national office [announced via postgrant information from national office to epo] |
Ref country code: FR Payment date: 20211126 Year of fee payment: 7 |
|
| PG25 | Lapsed in a contracting state [announced via postgrant information from national office to epo] |
Ref country code: IS Free format text: LAPSE BECAUSE OF FAILURE TO SUBMIT A TRANSLATION OF THE DESCRIPTION OR TO PAY THE FEE WITHIN THE PRESCRIBED TIME-LIMIT Effective date: 20210228 Ref country code: TR Free format text: LAPSE BECAUSE OF FAILURE TO SUBMIT A TRANSLATION OF THE DESCRIPTION OR TO PAY THE FEE WITHIN THE PRESCRIBED TIME-LIMIT Effective date: 20201028 Ref country code: MT Free format text: LAPSE BECAUSE OF FAILURE TO SUBMIT A TRANSLATION OF THE DESCRIPTION OR TO PAY THE FEE WITHIN THE PRESCRIBED TIME-LIMIT Effective date: 20201028 Ref country code: CY Free format text: LAPSE BECAUSE OF FAILURE TO SUBMIT A TRANSLATION OF THE DESCRIPTION OR TO PAY THE FEE WITHIN THE PRESCRIBED TIME-LIMIT Effective date: 20201028 |
|
| PG25 | Lapsed in a contracting state [announced via postgrant information from national office to epo] |
Ref country code: MK Free format text: LAPSE BECAUSE OF FAILURE TO SUBMIT A TRANSLATION OF THE DESCRIPTION OR TO PAY THE FEE WITHIN THE PRESCRIBED TIME-LIMIT Effective date: 20201028 |
|
| PG25 | Lapsed in a contracting state [announced via postgrant information from national office to epo] |
Ref country code: BE Free format text: LAPSE BECAUSE OF NON-PAYMENT OF DUE FEES Effective date: 20201130 |
|
| REG | Reference to a national code |
Ref country code: DE Ref legal event code: R081 Ref document number: 602015061220 Country of ref document: DE Owner name: PHILIPS IMAGE GUIDED THERAPY CORP., SAN DIEGO, US Free format text: FORMER OWNERS: KONINKLIJKE PHILIPS N.V., EINDHOVEN, NL; VOLCANO CORPORATION, SAN DIEGO, CA, US Ref country code: DE Ref legal event code: R081 Ref document number: 602015061220 Country of ref document: DE Owner name: KONINKLIJKE PHILIPS N.V., NL Free format text: FORMER OWNERS: KONINKLIJKE PHILIPS N.V., EINDHOVEN, NL; VOLCANO CORPORATION, SAN DIEGO, CA, US |
|
| PG25 | Lapsed in a contracting state [announced via postgrant information from national office to epo] |
Ref country code: FR Free format text: LAPSE BECAUSE OF NON-PAYMENT OF DUE FEES Effective date: 20221130 |
|
| PGFP | Annual fee paid to national office [announced via postgrant information from national office to epo] |
Ref country code: GB Payment date: 20231121 Year of fee payment: 9 |
|
| PGFP | Annual fee paid to national office [announced via postgrant information from national office to epo] |
Ref country code: DE Payment date: 20231127 Year of fee payment: 9 |