EP3201317B1 - Biomarkers for rheumatoid arthritis and usage thereof - Google Patents
Biomarkers for rheumatoid arthritis and usage thereof Download PDFInfo
- Publication number
- EP3201317B1 EP3201317B1 EP15847187.0A EP15847187A EP3201317B1 EP 3201317 B1 EP3201317 B1 EP 3201317B1 EP 15847187 A EP15847187 A EP 15847187A EP 3201317 B1 EP3201317 B1 EP 3201317B1
- Authority
- EP
- European Patent Office
- Prior art keywords
- mlg
- dna
- biomarker
- sequences
- sample
- Prior art date
- Legal status (The legal status is an assumption and is not a legal conclusion. Google has not performed a legal analysis and makes no representation as to the accuracy of the status listed.)
- Active
Links
Images



Classifications
-
- C—CHEMISTRY; METALLURGY
- C12—BIOCHEMISTRY; BEER; SPIRITS; WINE; VINEGAR; MICROBIOLOGY; ENZYMOLOGY; MUTATION OR GENETIC ENGINEERING
- C12Q—MEASURING OR TESTING PROCESSES INVOLVING ENZYMES, NUCLEIC ACIDS OR MICROORGANISMS; COMPOSITIONS OR TEST PAPERS THEREFOR; PROCESSES OF PREPARING SUCH COMPOSITIONS; CONDITION-RESPONSIVE CONTROL IN MICROBIOLOGICAL OR ENZYMOLOGICAL PROCESSES
- C12Q1/00—Measuring or testing processes involving enzymes, nucleic acids or microorganisms; Compositions therefor; Processes of preparing such compositions
- C12Q1/68—Measuring or testing processes involving enzymes, nucleic acids or microorganisms; Compositions therefor; Processes of preparing such compositions involving nucleic acids
- C12Q1/6876—Nucleic acid products used in the analysis of nucleic acids, e.g. primers or probes
- C12Q1/6888—Nucleic acid products used in the analysis of nucleic acids, e.g. primers or probes for detection or identification of organisms
- C12Q1/689—Nucleic acid products used in the analysis of nucleic acids, e.g. primers or probes for detection or identification of organisms for bacteria
-
- A—HUMAN NECESSITIES
- A61—MEDICAL OR VETERINARY SCIENCE; HYGIENE
- A61K—PREPARATIONS FOR MEDICAL, DENTAL OR TOILETRY PURPOSES
- A61K35/00—Medicinal preparations containing materials or reaction products thereof with undetermined constitution
- A61K35/66—Microorganisms or materials therefrom
- A61K35/74—Bacteria
- A61K35/741—Probiotics
- A61K35/744—Lactic acid bacteria, e.g. enterococci, pediococci, lactococci, streptococci or leuconostocs
- A61K35/747—Lactobacilli, e.g. L. acidophilus or L. brevis
-
- A—HUMAN NECESSITIES
- A61—MEDICAL OR VETERINARY SCIENCE; HYGIENE
- A61P—SPECIFIC THERAPEUTIC ACTIVITY OF CHEMICAL COMPOUNDS OR MEDICINAL PREPARATIONS
- A61P3/00—Drugs for disorders of the metabolism
- A61P3/04—Anorexiants; Antiobesity agents
-
- A—HUMAN NECESSITIES
- A61—MEDICAL OR VETERINARY SCIENCE; HYGIENE
- A61P—SPECIFIC THERAPEUTIC ACTIVITY OF CHEMICAL COMPOUNDS OR MEDICINAL PREPARATIONS
- A61P3/00—Drugs for disorders of the metabolism
- A61P3/08—Drugs for disorders of the metabolism for glucose homeostasis
- A61P3/10—Drugs for disorders of the metabolism for glucose homeostasis for hyperglycaemia, e.g. antidiabetics
-
- C—CHEMISTRY; METALLURGY
- C07—ORGANIC CHEMISTRY
- C07K—PEPTIDES
- C07K14/00—Peptides having more than 20 amino acids; Gastrins; Somatostatins; Melanotropins; Derivatives thereof
- C07K14/195—Peptides having more than 20 amino acids; Gastrins; Somatostatins; Melanotropins; Derivatives thereof from bacteria
- C07K14/335—Peptides having more than 20 amino acids; Gastrins; Somatostatins; Melanotropins; Derivatives thereof from bacteria from Lactobacillus (G)
-
- C—CHEMISTRY; METALLURGY
- C12—BIOCHEMISTRY; BEER; SPIRITS; WINE; VINEGAR; MICROBIOLOGY; ENZYMOLOGY; MUTATION OR GENETIC ENGINEERING
- C12Q—MEASURING OR TESTING PROCESSES INVOLVING ENZYMES, NUCLEIC ACIDS OR MICROORGANISMS; COMPOSITIONS OR TEST PAPERS THEREFOR; PROCESSES OF PREPARING SUCH COMPOSITIONS; CONDITION-RESPONSIVE CONTROL IN MICROBIOLOGICAL OR ENZYMOLOGICAL PROCESSES
- C12Q1/00—Measuring or testing processes involving enzymes, nucleic acids or microorganisms; Compositions therefor; Processes of preparing such compositions
- C12Q1/68—Measuring or testing processes involving enzymes, nucleic acids or microorganisms; Compositions therefor; Processes of preparing such compositions involving nucleic acids
- C12Q1/6876—Nucleic acid products used in the analysis of nucleic acids, e.g. primers or probes
- C12Q1/6883—Nucleic acid products used in the analysis of nucleic acids, e.g. primers or probes for diseases caused by alterations of genetic material
-
- C—CHEMISTRY; METALLURGY
- C12—BIOCHEMISTRY; BEER; SPIRITS; WINE; VINEGAR; MICROBIOLOGY; ENZYMOLOGY; MUTATION OR GENETIC ENGINEERING
- C12Q—MEASURING OR TESTING PROCESSES INVOLVING ENZYMES, NUCLEIC ACIDS OR MICROORGANISMS; COMPOSITIONS OR TEST PAPERS THEREFOR; PROCESSES OF PREPARING SUCH COMPOSITIONS; CONDITION-RESPONSIVE CONTROL IN MICROBIOLOGICAL OR ENZYMOLOGICAL PROCESSES
- C12Q2600/00—Oligonucleotides characterized by their use
- C12Q2600/106—Pharmacogenomics, i.e. genetic variability in individual responses to drugs and drug metabolism
-
- C—CHEMISTRY; METALLURGY
- C12—BIOCHEMISTRY; BEER; SPIRITS; WINE; VINEGAR; MICROBIOLOGY; ENZYMOLOGY; MUTATION OR GENETIC ENGINEERING
- C12Q—MEASURING OR TESTING PROCESSES INVOLVING ENZYMES, NUCLEIC ACIDS OR MICROORGANISMS; COMPOSITIONS OR TEST PAPERS THEREFOR; PROCESSES OF PREPARING SUCH COMPOSITIONS; CONDITION-RESPONSIVE CONTROL IN MICROBIOLOGICAL OR ENZYMOLOGICAL PROCESSES
- C12Q2600/00—Oligonucleotides characterized by their use
- C12Q2600/118—Prognosis of disease development
-
- C—CHEMISTRY; METALLURGY
- C12—BIOCHEMISTRY; BEER; SPIRITS; WINE; VINEGAR; MICROBIOLOGY; ENZYMOLOGY; MUTATION OR GENETIC ENGINEERING
- C12Q—MEASURING OR TESTING PROCESSES INVOLVING ENZYMES, NUCLEIC ACIDS OR MICROORGANISMS; COMPOSITIONS OR TEST PAPERS THEREFOR; PROCESSES OF PREPARING SUCH COMPOSITIONS; CONDITION-RESPONSIVE CONTROL IN MICROBIOLOGICAL OR ENZYMOLOGICAL PROCESSES
- C12Q2600/00—Oligonucleotides characterized by their use
- C12Q2600/156—Polymorphic or mutational markers
-
- C—CHEMISTRY; METALLURGY
- C12—BIOCHEMISTRY; BEER; SPIRITS; WINE; VINEGAR; MICROBIOLOGY; ENZYMOLOGY; MUTATION OR GENETIC ENGINEERING
- C12Q—MEASURING OR TESTING PROCESSES INVOLVING ENZYMES, NUCLEIC ACIDS OR MICROORGANISMS; COMPOSITIONS OR TEST PAPERS THEREFOR; PROCESSES OF PREPARING SUCH COMPOSITIONS; CONDITION-RESPONSIVE CONTROL IN MICROBIOLOGICAL OR ENZYMOLOGICAL PROCESSES
- C12Q2600/00—Oligonucleotides characterized by their use
- C12Q2600/158—Expression markers
Definitions
- the present disclosure relates to the biomedical field, and particularly to biomarkers and methods for predicting risk of a disease, in particular rheumatoid arthritis (RA).
- RA rheumatoid arthritis
- RA Rheumatoid arthritis
- DMARD disease-modifying antirheumatic drugs
- Gut microbiota is a key environmental factor for human health, with established roles in obesity, diabetes, colon cancer, etc.
- Oral microbiota is relatively understudied compared to the gut microbiota. Metagenomic analysis of the role of the oral microbiome in diseases has been lacking. It is also unknown to what extent oral and gut microbial disease markers might converge in their identity or function.
- the present disclosure relates to the biomedical field, and particularly to biomarkers and methods for predicting risk of a disease, in particular rheumatoid arthritis (RA).
- RA rheumatoid arthritis
- Disclosed in the present teaching are systems for obtaining a probability of a subject having a disease or evaluating a treatment regarding the disease.
- a system for obtaining a probability of a subject having a disease comprises a processor and a storage medium containing program instructions for execution by the processor.
- the program instructions cause the processor to execute the following steps.
- a sample is collected from the subject.
- DNA is extracted from the sample.
- Sequences of the DNA are obtained.
- a relative abundance of a biomarker is then calculated based on the sequences of the DNA.
- the biomarker comprises a DNA sequence in a genome of Lactobacillus salivarius.
- a probability of the subject having the disease is obtained based on the relative abundance.
- the system comprises a processor and a storage medium containing program instructions for execution by the processor.
- the program instructions cause the processor to execute the following steps. For each subject of a plurality of subjects having the disease, first DNA sequences extracted from a first sample and second DNA sequences extracted from a second sample are obtained. The first sample is collected from the subject before the subject receives the treatment. The second sample is collected from the subject after the subject receives the treatment. For each subject, a first relative abundance of a biomarker is calculated based on the first DNA sequences; and a second relative abundance of the biomarker is calculated based on the second DNA sequences.
- the biomarker comprises a DNA sequence in a genome of Lactobacillus salivarius. The treatment is then evaluated based on the first relative abundances and the second relative abundances calculated for the plurality of subjects.
- a different system for evaluating a treatment regarding a disease or identifying therapeutic agents is further disclosed.
- the system comprises a processor and a storage medium containing program instructions for execution by the processor.
- the program instructions cause the processor to execute the following steps. For each subject of a plurality of subjects having the disease, sequences of DNA are obtained, where the DNA is extracted from a sample that has been obtained from the subject after receiving the treatment; and a relative abundance of a biomarker is calculated based on the sequences of the DNA.
- the biomarker comprises a DNA sequence in a genome of Lactobacillus salivarius.
- the treatment is then evaluated based on the relative abundances calculated for the plurality of subjects.
- Also disclosed in the present teaching are methods for obtaining a probability of a subject having a disease or evaluating a treatment regarding the disease or identifying therapeutic agents.
- DNA is extracted from a sample collected from a subject. Sequences of the DNA are obtained. A relative abundance of a biomarker is then calculated based on the sequences of the DNA.
- the biomarker comprises a DNA sequence in a genome of Lactobacillus salivarius. A probability of the subject having a disease is obtained based on the relative abundance.
- a method for evaluating a treatment regarding a disease or identifying therapeutic agents is disclosed as follows. For each subject of a plurality of subjects having the disease, first DNA sequences extracted from a first sample and second DNA sequences extracted from a second sample are obtained. The first sample is collected from the subject before the subject receives the treatment. The second sample is collected from the subject after the subject receives the treatment. For each subject, a first relative abundance of a biomarker is calculated based on the first DNA sequences; and a second relative abundance of the biomarker is calculated based on the second DNA sequences. The biomarker comprises a DNA sequence in a genome of Lactobacillus salivarius. The treatment is then evaluated based on the first relative abundances and the second relative abundances calculated for the plurality of subjects.
- a method for evaluating a treatment regarding a disease or identifying therapeutic agents as follows. For each subject of a plurality of subjects having the disease, sequences of DNA are obtained, where the DNA is extracted from a sample that has been obtained from the subject after receiving the treatment; and a relative abundance of a biomarker is calculated based on the sequences of the DNA.
- the biomarker comprises a DNA sequence in a genome of Lactobacillus salivarius. The treatment is then evaluated based on the relative abundances calculated for the plurality of subjects.
- the computer program product comprises a computer-readable storage medium having program code stored thereon.
- the program code is executable by a processor and comprises instructions to cause the processor to execute the following steps.
- a sample is collected from the subject.
- DNA is extracted from the sample.
- Sequences of the DNA are obtained.
- a relative abundance of a biomarker is then calculated based on the sequences of the DNA.
- the biomarker comprises a DNA sequence in a genome of Lactobacillus salivarius.
- a probability of the subject having the disease is obtained based on the relative abundance.
- biomarker for obtaining a probability of a subject having a disease or evaluating a treatment regarding the disease or identifying therapeutic agents.
- the biomarker comprises at least one DNA sequence in a genome of Lactobacillus salivarius or at least one of the following metagenomic linkage groups (MLGs): MLG consisting of MLG ID NO: 2169; MLG consisting of MLG ID NO: 16600; and MLG consisting of MLG ID NO: 4643; see Table 2-2.
- MLG metagenomic linkage groups
- the present invention now provides methods for more specifically obtaining a probability of a subject having rheumatoid arthritis and evaluating treatment for rheumatoid arthritis or identifying therapeutic agents therefor relying on the above MLGs as set out in the accompanying claims and further described below.
- the present disclosure describes biomarkers and methods for utilizing the biomarkers to predict risk of a disease and determine an effect of a treatment regarding the disease, in particular the disease of RA.
- Infectious agents have long been implicated with RA.
- identity and pathogenicity of the RA-associated agent(s) have been largely unclear, a question further complicated by a recent reinstatement that the human body is a super-organism hosting trillions of beneficial as well as harmful microorganisms.
- RA is believed to initiate and lurk in some other body site(s) for years before the onset of joint inflammation. Investigation of the microbiome may reveal probiotics that prevent or mitigate RA.
- Gut microbiota is a key environmental factor for human health, with established roles in obesity, diabetes, colon cancer, etc.. Besides functioning in nutrient and xenobiotic metabolism, microbes in distal gut crosstalk with the neuro-immune-endocrine system and blood stream to impact the entire human body. The gut microbiota is stably associated with a given individual, adding to its value in disease-related investigations.
- a biomarker generally refers to a measurable indicator of some biological state or condition.
- the term "biomarker” as used in the present teaching refers to a measurable substance in an organism whose presence is indicative of some phenomenon such as disease, infection, or environmental exposure.
- a biomarker in a sample from a RA patient or a normal person may be utilized to evaluate RA risk of the person.
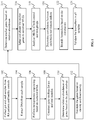
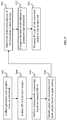
- FIG. 1 shows a flowchart of an exemplary process in which biomarkers are identified and validated for evaluating RA risk.
- gut and/or oral samples are collected at 102 from both RA patients and healthy control people.
- the gut samples may include fecal samples, while the oral samples may include dental and salivary samples.
- DNA extraction is performed on each sample at 104.
- the extracted DNA is sequenced, e.g. by a metagenomic sequencing, at 106.
- gene catalogs are constructed for gut and oral samples.
- the gene catalog for gut samples may be replaced or integrated with an existing gene catalog, while there are few existing gene catalogs for oral samples.
- relative abundances of genes in the samples are determined.
- a relative abundance of a given gene in a sample can be calculated as below.
- the copy number of each gene in the sequenced data from the sample is calculated as a ratio between the times which a gene can be detected in the sample and the length of the gene.
- the relative abundance of the given gene can be calculated as a ratio between the copy number of the given gene and a summation of the copy numbers of all genes in the sample.
- the genes are annotated based on their identities and functionalities.
- Marker genes can be determined at 114 based on their respective relative abundances, e.g. when a marker gene shows difference in relative abundances between control and RA groups. These marker genes are selected and clustered at 116 to construct MLGs.
- the term "MLG" as used in the present teaching may refer to a group of genetic material in a metagenome that is probably physically linked as a unit rather than being independently distributed.
- the MLGs of both control and RA groups are analyzed. Correlations between each MLG and clinical indices are determined at 120.
- one or more biomarkers are identified from the MLGs based on the correlations, e.g.
- biomarker when a biomarker shows positive correlation with a predominant antibody of the mucosal immune system or with a major serum immunoglobulin.
- the biomarkers are validated in all samples. For example, a biomarker may be validated if it is consistently found enriched in gut and/or oral samples from the RA patients.
- a validated biomarker comprises a DNA sequence in a genome of Lactobacillus salivarius.
- the validated biomarker may comprise at least a partial sequence of SEQ ID NO: 1 to 593; SEQ ID NO: 594 to 1536; or SEQ ID NO: 1537 to 2594, as stated in Table 2-2.
- a sequence listing submitted herewith includes nucleotide and/or amino acid sequences corresponding to the above mentioned SEQ IDs.
- MLG ID NO: 2169 contains at least 593 RA-associated genes identified from fecal samples. These 593 genes have the polynucleotide sequences of SEQ ID NOs: 1-593, respectively.
- MLG ID NO: 16600 contains at least 943 RA-associated genes identified from dental samples. These 943 genes have the polynucleotide sequences of SEQ ID NOs: 594-1536, respectively.
- MLG ID NO: 4643 contains at least 1058 RA-associated genes identified from salivary samples. These 1058 genes have the polynucleotide sequences of SEQ ID NOs: 1537-2594, respectively.
- the examples relate to methods for identifying and validating biomarkers for evaluating RA risk.
- metagenomic shotgun sequencing was performed for 212 fecal samples (77 treatment-naive RA cases, 80 unrelated healthy controls; 17 treatment-naive RA cases and 17 related healthy controls; 21 DMARD-treated cases) (Tables 1-1, 1-2, 1-3). This may be used to investigate the gut microbiome in RA patients.
- the data were then integrated into an existing gut microbial reference gene catalog to obtain a set of 5.9 million genes (from 481 samples), which allowed saturating mapping of the sequencing reads (80.3 ⁇ 2.3%, mean ⁇ s.d.) ( Li, J. et al. An integrated catalog of reference genes in the human gut microbiome. Nat. Biotechnol. (2014 )).
- Dental plaques and saliva were also sampled from treatment-naive RA patients and healthy controls, and metagenomic sequencing performed on the 105 dental and 98 saliva samples (dental/salivary samples from 54/51 treatment-naive RA cases and 51/47 healthy controls; 69 of the subjects having the complete set of fecal, dental and salivary samples) (Tables 1-1, 1-2, 1-3). This may show that dysbiosis is also evident in the oral microbiome, after demonstrating the dysbiosis in the RA gut microbiome. De novo assembly of these sequences led to a gene catalog of 3.2 million genes, with 76.6 ⁇ 1.8% and 70.7 ⁇ 7.3% (mean ⁇ s.d.) mapping of the dental and salivary sequencing reads, respectively.
- RA was diagnosed at Peking Union Medical College Hospital according to the 2010 ACR/EULAR (American College Of Rheumatology /European League against Rheumatism) classification criteria. All phenotypic information was collected upon the subjects' initial visit to the hospital following standard procedures. 21 fecal samples from DMARD-treated patients were only included in the 212 samples used for gut microbial gene catalog construction, and were not analyzed in this example. RA patients were between 18 and 65 years old, with disease duration of at least 6 weeks, at least 1 swollen joint and 3 tender joints enlisted. Patients were excluded if they had a history of chronic serious infection, any current infection or any type of cancer. Pregnant or lactating women were excluded.
- the healthy control group met the following inclusion criteria: 18-65 years of age; having a normal level on recently screening for liver and kidney function, routine blood test, erythrocyte sedimentation rate, fasting blood glucose, blood lipid, and blood pressure. Subjects were excluded if they had a history of chronic serious infection, any current infection, any type of cancer or autoimmune disease. Pregnant or lactating women were excluded. Subjects who had received antibiotic treatment within 1 month before participating in this study were also excluded.
- MTX methotrexate
- QW means once a week
- TID means three times a day
- T2 means Tripterygium wilfordii (thunder god vine) glycosides.
- Lysis was terminated by incubation at 95 °C for 10 minutes, and the sampled were frozen at -80 °C until transport. DNA extraction was performed following the protocol for fecal samples. For saliva, 100 ⁇ l of saliva was added into 100 ⁇ l of 2x lysis buffer. The posterior pharynx wall was swabbed and added to the same tube. The samples were then lysed and extracted as the dental samples.
- Metagenomic sequencing and assembly is described as below. Paired-end metagenomic sequencing was performed on the Illumina platform (insert size 350bp, read length 100bp), and the sequencing reads were quality-controlled and de novo assembled into contigs using SOAPdenovo v2.04 ( Luo, R. et al. SOAPdenovo2: an empirically improved memory-efficient short-read de novo assembler. Gigascience 1, 18 (2012 ), as described previously (Qin et al. 2012, supra). The average rate of host contamination was 0.37% for fecal, 5.55% for dental and 40.85% for saliva samples.
- Gene catalog construction is described as below. Gene prediction from the assembled contigs was performed using GeneMark v2.7d. Redundant genes were removed using BLAT with the cutoff of 90% overlap and 95% identity (no gaps allowed), resulting in a non-redundant gene catalog of 3,800,011 genes for 212 fecal samples (containing 21 of the DMARD-treated samples), and a catalog of 3,234,997 genes for the 203 treatment-naive oral samples (105 dental plaques samples and 98 saliva samples). The gene catalog from fecal samples was further integrated into an existing gut microbial reference catalog of 4.3 million genes using BLAT (95% identity, 90% overlap) (Qin et al. 2012, supra), resulting in a final catalog of 5.9 million genes. Relative abundances of the genes were determined by aligning high-quality sequencing reads to the gut or oral reference gene catalog. A detailed procedure for the aligning can be found in Qin et al. 2012, supra.
- Taxonomic annotation and abundance calculation are described as below. Taxonomic assignment of the predicted genes was performed according to the IMG database (v400) based on an in-house pipeline detailed previously (Qin et al. 2012, supra), with 70% overlap and 65% identity for assignment to phylum, 85% identity to genus, and 95% identity to species. The relative abundance of a taxon was calculated from the relative abundance of its genes.
- a relative abundance of a given gene in a sample can be calculated as below.
- the copy number of each gene in the sequenced data from the sample is calculated as a ratio between the times which a gene can be detected in the sample (i.e. the number of mapped reads) and the length of the gene.
- the relative abundance of the given gene can be calculated as a ratio between the copy number of the given gene and a summation of the copy numbers of all genes in the sample.
- MLG Metagenome-wide association study
- MLG can be used to reduce and structurally organize the abundant metagenomic data and to help making a taxonomic description. Based a gene profile, a MLG can be identified as a group of genes that co-exists among different individual samples and has a consistent abundance level and taxonomic assignment.
- marker genes For constructing dental MLGs, 371990 marker genes (Wilcoxon rank-sum test, FDR ⁇ 0.1) were selected from 1900774 genes (present in at least 10% of the samples). For salivary MLGs, 258055 marker genes (Wilcoxon rank-sum test, FDR ⁇ 0.1) were selected from 2030636 genes (present in at least 10% of the samples).
- Taxonomic assignment and abundance profiling of the MLGs were performed according to the taxonomy and the relative abundance of their constituent genes, as previously described (Qin et al. 2012, supra). All genes from one MLG were aligned to the reference microbial genomes at the nucleotide level and the (National Center for Biotechnology Information) NCBI-nr database at the protein level. From the alignments with the reference microbial genomes, one can obtain a list of well-mapped bacterial genomes for each MLG and order these bacterial genomes according to the proportion of genes that could be mapped onto the bacterial genome, as well as the average identity of the alignments.
- Assignment to species may require more than 90% of genes in an MLG to align with the species' genome with more than 95% identity, 70% overlap of query. Assigning an MLG to a genus may require more than 80% of its genes to align with a genome with 85% identity in both DNA and protein sequences.
- MLGs were further clustered according to Spearman's correlation between their abundances in all samples regardless of case-control status.
- CCA Canonical correspondence analysis
- 117,219 gene markers differentially enriched in RA patients or controls (Wilcoxon rank-sum test, FDR ⁇ 0.3) were identified. This may help to accurately delineate features of the RA-associated gut microbiota.
- Metagenomic linkage groups (MLGs) were computed based on abundance covariations between the genes among samples (Qin et al. 2012, supra). The 88 MLGs that contained at least 100 genes were separated according to their direction of enrichment in canonical coordinate analysis (CCA), confirming that they were mainly associated with the RA status.
- the 171 dental and 142 salivary MLGs that contained at least 100 genes were separated according to their direction of enrichment in CCA, confirming their association with RA.
- the relative abundance of a MLG in a sample can be estimated based on the relative abundance values of genes from this MLG. For this MLG, one may discard genes that were among the 5% with the highest and lowest relative abundance, respectively, and then fit a Poisson distribution to the rest. The estimated mean of the Poisson distribution can be interpreted as the relative abundance of this MLG. The profile of MLGs among all samples may be obtained for further analyses. The relative abundance of a biomarker in a sample may be calculated in a similar way.
- FIG. 2 illustrates analysis results for influence of phenotypes on gut, dental, and salivary MLGs, according to an embodiment of the present teaching.
- FIG. 2 shows CCA result for influence of phenotypes on the gut (a), dental (b) or salivary (c) MLGs. Categorical or continuous phenotypes missing in half of the samples were not analyzed.
- Solid points represent control-enriched MLGs, while hollow points represent RA-enriched MLGs.
- RA-enriched MLGs e.g. Clostridium asparagiforme, Bacteroides sp. and Lactobacillus sp. (most related to L. salivarius, Table 2-1, Table 2-2) were correlated positively with the predominant antibody of the mucosal immune system, IgA, or with the major serum immunoglobulin, IgG.
- anaerobes such as Lactobacillus salivarius, Atopobium sp. and Cryptobacterium curtum were found in both the salivary and dental samples of the RA patients.
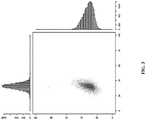
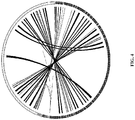
- FIG. 3 and FIG. 4 show Lactobacillus sp. draft genome.
- FIG. 3 shows a GC-depth graph for Lactobacillus sp. after advanced assembly, according to an embodiment of the present teaching.
- FIG. 4 shows co-linearity between the assembly (from sample D201) and the Lactobacillus salivarius CECT 5713 reference draft genome from NCBI (NC_017481.1), according to an embodiment of the present teaching.
- Functions encoded by the genome were largely similar to those in Lactobacillus salivarius CECT 5713 or other Lactobacillus strains, except that this RA-enriched Lactobacillus sp. encodes different cell wall modifications which might be recognized by the host immune system.
- a biomarker for evaluating or diagnosing RA comprises a DNA sequence in a genome of Lactobacillus salivarius.
- the biomarker for evaluating or diagnosing RA may comprise at least a partial sequence of SEQ ID NO: 1 to 593; SEQ ID NO: 594 to 1536; or SEQ ID NO: 1537 to 2594, as stated in Table 2-2.
- the sequence listing submitted herewith includes nucleotide and/or amino acid sequences corresponding to the above mentioned SEQ IDs.
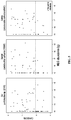
- FIG. 5 shows patient stratification based on a RA-associated bacterium, according to an embodiment of the present teaching.
- MLG identification numbers are indicated in parentheses after the annotations.
- the disease classification followed the European League against Rheumatism (EULAR) criterion, i.e. 3.2 ⁇ DAS28 ⁇ 5.1, moderate; DAS28 > 5.1, very active (Table 4).
- EULAR European League against Rheumatism
- FIGs. 6-8 show correlation between gut and oral MLGs.
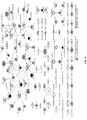
- FIG. 6 shows correlations between the relative abundances of gut and dental MLGs, according to an embodiment of the present teaching.
- FIG. 7 shows correlations between the relative abundances of gut and salivary MLGs, according to an embodiment of the present teaching.
- TIGRESS Trustful Inference of Gene Regulation using Stability Selection
- Boruta CLR
- Bicor Biweight midcorrelation
- MINE Maximum Information Nonparametric Exploration. Size of the nodes reflects number of genes in each MLG. MLGs were colored according to body site and direction of enrichment. MLG identification numbers are listed in parentheses if more than one MLG annotated to the same species or unclassified species in a genus (sp.). Possible strain names are listed in Table 2-1 for all MLGs with more than 50% of genes annotated to the strain(s), even if the criteria for pinpointing a species or a genus has not been met. Solid lines (edges) represent Spearman's correlation coefficient (cc) > 0.4, p ⁇ 0.05; dotted lines (edges) represent cc ⁇ -0.4, p ⁇ 0.05.
- FIG. 8 shows correlations between the relative abundances of dental and salivary MLGs, according to an embodiment of the present teaching.
- MLGs were colored according to body site and direction of enrichment.
- MLG identification numbers are listed in parentheses if more than one MLG annotated to the same species or unclassified species in a genus (sp.).
- Possible strain names are listed in Table 2-1 for all MLGs with more than 50% of genes annotated to the strain(s), even if the criteria for pinpointing a species or a genus has not been met.
- Solid lines (edges) represent Spearman's correlation coefficient (cc) > 0.6, p ⁇ 0.05; dotted lines (edges) represent cc ⁇ -0.6, p ⁇ 0.05.
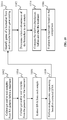
- FIG. 9 shows a flowchart of an exemplary process in which a biomarker is utilized for evaluating RA risk, according to an embodiment of the present teaching.
- gut and/or oral samples are collected at 902 from an individual to evaluate RA risk of the individual.
- the gut samples may include fecal samples, while the oral samples may include dental and salivary samples.
- DNA extraction is performed on each sample at 904.
- the extracted DNA is sequenced, e.g. by a metagenomic sequencing at 906, to obtain sequences of the DNA.
- the sequences of the DNA may be obtained by polymerase chain reaction (PCR) with a primer that hybridizes to at least some of the DNA.
- the sequences of the DNA may be obtained by using one or more probes that specifically recognize at least some of the DNA.
- PCR polymerase chain reaction
- the biomarker may be RA-enriched MLGs, e.g. Clostridium asparagiforme, Bacteroides sp. and Lactobacillus sp. (most related to L. salivarius) and/or anaerobes such as Lactobacillus salivarius, Atopobium sp. and Cryptobacterium curtum.
- Lactobacillus salivarius is a preferred biomarker for evaluating RA risk.
- the term "gene" as used in the present teaching may refer to any DNA sequence.
- Relative abundances of the biomarker in each sample are determined at 910. For example, one can list genes of the biomarker among the sequences of the DNA in a sample in order of the genes' respective relative abundances. After removing the top 5% genes with highest relative abundance and the bottom 5% genes with lowest relative abundance, relative abundances of the remaining genes of the biomarker can be averaged or fit with a Poisson distribution to determine a relative abundance of the biomarker in the sample.
- the relative abundances are compared to predetermined thresholds.
- a predetermined threshold may be associated with a type of sample, e.g. fecal, dental or salivary samples, and determined based on statistics analysis related to the biomarker.
- MLG relative abundance for classification is listed in Table 6, for different types of samples.
- MLG relative abundance is larger than the threshold, the person is at risk of RA
- RA risk can be evaluated based on a classifier that is generated based on a training set.
- the classifier can indicate a probability of an individual having RA.
- the training set may comprise relative abundances of the biomarker in samples from a plurality of subjects having RA and a plurality of subjects not having RA.
- the classifier may be generated based on a Multivariate statistical model, e.g. a randomForest model. For example, for a certain relative abundance of a biomarker, a corresponding probability of RA can be determined based on the classifier. Then, the RA risk of the individual can be evaluated based on the probability. For example, the probability greater than a predetermined threshold indicates that the subject has or is at risk of having RA.
- DMARD treatment's modification of the RA microbiome is described as below.
- MLGs before and after treatment (for 3 months, except for 6 samples) in fecal samples from 40 individuals (Table 1-3). This may help to examine whether the treatment by DMARD restores a healthy microbiome.
- MTX anchor drug methotrexate
- T2 Trigger glycosides
- MTX+T2 the traditional Chinese medicinal component Tripterygium wilfordii (thunder god vine) glycosides
- RA-enriched MLGs such as BDM-3355 (BDM, Before DMARD) and Bacteroides sp.
- DMARD treatment showed promising modulation of the oral microbiome as well, with some of the control-enriched dental or salivary MLGs e.g. Aggregatibacter sp. over-represented in patients with good response compared to those with moderate or no improvement.
- Control-enriched dental MLGs such as Con-16138, Prevotella intermedia were most abundant in patients treated with MTX+T2 compared to T2 alone or MTX alone, while RA-9938, RA-10684 and RA-9998 were most reduced in patients treated with MTX alone.
- Differential modulations of RA- or control-associated MLGs by MTX, MTX+T2 or T2 were also observed in the saliva samples.
- FIG. 10 shows a flowchart of an exemplary process in which a biomarker is utilized for evaluating a treatment regarding RA, according to an embodiment of the present teaching.
- gut and/or oral samples are collected at 1002 from RA patients before a treatment.
- the gut samples may include fecal samples, while the oral samples may include dental and salivary samples.
- the treatment may be a DMARD treatment like MTX, T2, or MTX+T2, or may be any treatment regarding RA.
- gut and/or oral samples are collected from the same RA patients after they receive treatment.
- DNA extraction is performed on each sample at 1006.
- the extracted DNA is sequenced at 1008, e.g. by a metagenomic sequencing, to obtain sequences of the DNA.
- the sequences of the DNA may be obtained by PCR with a primer that hybridizes to at least some of the DNA.
- the sequences of the DNA may be obtained by using one or more probes that specifically recognize at least some of the DNA.
- the biomarker may be RA-enriched MLGs, e.g. Clostridium asparagiforme, Bacteroides sp. and Lactobacillus sp. (most related to L. salivarius) and/or anaerobes such as Lactobacillus salivarius, Atopobium sp. and Cryptobacterium curtum.
- Lactobacillus salivarius is a preferred biomarker for evaluating a treatment regarding RA
- Relative abundances of the biomarker in each sample are determined at 1012. For example, one can list genes of the biomarker in a sample in order of their respective relative abundances. After removing the top 5% genes with highest relative abundance and the bottom 5% genes with lowest relative abundance, relative abundances of the remaining genes of the biomarker can be averaged or fit with a Poisson distribution to determine a relative abundance of the biomarker in the sample. This may be performed for samples before and after the treatment.
- the relative abundances of L. salivarius in a same type of sample e.g. fecal, dental or salivary samples
- the relative abundances before and after the treatment may be compared to see whether L. salivarius is less abundant after the treatment. If so, the treatment shows some effect at least on this patient. Similar comparisons can be performed on all RA patients with collected samples.
- the treatment is then evaluated based on the comparison(s) at 1016. For example, for all RA patients in evaluation, the relative abundances of L. salivarius before and after the treatment can be compared to see whether L. salivarius is less abundant after the treatment. In one embodiment, if relative abundance of L. salivarius is reduced after the treatment for more than a given percentage of the RA patients, the treatment may be determined to be effective. In another embodiment, if the average relative abundance of L. salivarius among the RA patients decreases by a given number after the treatment, the treatment may be determined to be effective.
- a treatment regarding RA may be evaluated merely based on the sample collected from the RA patients after the treatment.
- the relative abundances of the biomarker e.g. L. salivarius
- the relative abundances can be compared with a predetermined threshold to determine whether the treatment brings down the relative abundance of the biomarker to a safe range that indicates no or low RA risk. If so, the treatment may be evaluated as effective.
- the treatment may also be evaluated with a classifier.
- a biomarker e.g. L. salivarius
- the present disclosure includes but not limited to: L. salivarius for use as a biomarker; L. salivarius for use as a measurable indicator of RA; L. salivarius for use of evaluating or predicting risk of RA in a subject; L. salivarius for use of diagnosing RA in a subject; and L. salivarius for use of evaluating a treatment regarding a disease, e.g. RA
- a biomarker may be used for evaluating or predicting risk of RA in a subject to be tested.
- a sample is collected from the subject.
- DNA is extracted from the sample. Sequences of the DNA are obtained. Then, a relative abundance of the biomarker is calculated based on the sequences of the DNA.
- the biomarker may comprise a DNA sequence in a genome of Lactobacillus salivarius.
- a probability of the subject having a disease can be obtained based on the relative abundance.
- the risk of RA in the subject may be evaluated or predicted based on the probability.
- a biomarker may be used for evaluating a treatment regarding a disease, e.g. RA.
- a sample from the subject is collected after the subject receives the treatment.
- DNA is extracted from the sample.
- Sequences of the DNA are obtained.
- a relative abundance of the biomarker is calculated based on the sequences of the DNA.
- the biomarker may comprise a DNA sequence in a genome of Lactobacillus salivarius.
- the treatment may be evaluated based on the relative abundances calculated for the plurality of subjects.
- a biomarker may be used for evaluating a treatment regarding a disease, e.g. RA.
- a disease e.g. RA.
- a first sample is collected from the subject before the subject receives the treatment
- a second sample is collected from the subject after the subject receives the treatment.
- a first relative abundance of a biomarker is calculated based on the first sample.
- a second relative abundance of the biomarker is calculated based on the second sample.
- the biomarker comprises a DNA sequence in genome of Lactobacillus salivarius. The treatment may then be evaluated based on the first relative abundances and the second relative abundances calculated for the plurality of subjects.
- a biomarker for evaluating a treatment regarding a disease comprises a DNA sequence in a genome of Lactobacillus salivarius.
- the biomarker for evaluating a treatment regarding a disease may comprise at least a partial sequence of SEQ ID NO: 1 to 593; SEQ ID NO: 594 to 1536; or SEQ ID NO: 1537 to 2594, as stated in Table 2-2.
- the sequence listing submitted herewith includes nucleotide and/or amino acid sequences corresponding to the above mentioned SEQ IDs.
- Table 1-1 Samples used for gene catalog construction Group case control total number Samples used for catalog construction fecal samples 115 (including 21 from DMARD-treated patients) 97 212 dental plaques samples 54 51 105 saliva samples 51(including 4 from DMARD-treated patients) 47 98 Table 1-2.
- Lactobacillus salivarius Lactobacillus salivarius Possible strain 1 Lactobacillus salivarius CECT 5713 Lactobacillus salivarius CECT 5713 Lactobacillus salivarius CECT 5713 # genes annotated to strain (65% identity) 504 897 988 Fraction genes annotated to strain 0.850 0.951 0.934 Average identity (%) 98.78 99.81 99.81 Possible strain 2 Lactobacillus salivarius ACS-116-V-Col5a Lactobacillus salivarius UCC118 Lactobacillus salivarius ACS-116-V-Col5a # genes annotated to strain (65% identity) 499 750 818 Fraction genes annotated to strain 0.841 0.795 0.773 Average identity (%) 98.69 98.92 98.99 Possible strain 3 Lactobacillus salivarius HO66, ATCC 11741 Lactobacillus salivarius ACS-116-V-Col5a Lactobacillus salivarius UCC118 # genes annotated to strain (65% identity) 4
Landscapes
- Chemical & Material Sciences (AREA)
- Health & Medical Sciences (AREA)
- Life Sciences & Earth Sciences (AREA)
- Organic Chemistry (AREA)
- Proteomics, Peptides & Aminoacids (AREA)
- General Health & Medical Sciences (AREA)
- Analytical Chemistry (AREA)
- Engineering & Computer Science (AREA)
- Molecular Biology (AREA)
- Microbiology (AREA)
- Genetics & Genomics (AREA)
- Wood Science & Technology (AREA)
- Zoology (AREA)
- Biophysics (AREA)
- Biochemistry (AREA)
- Medicinal Chemistry (AREA)
- Bioinformatics & Cheminformatics (AREA)
- Mycology (AREA)
- Biotechnology (AREA)
- Physics & Mathematics (AREA)
- General Engineering & Computer Science (AREA)
- Immunology (AREA)
- Animal Behavior & Ethology (AREA)
- Veterinary Medicine (AREA)
- Public Health (AREA)
- Pharmacology & Pharmacy (AREA)
- Gastroenterology & Hepatology (AREA)
- Epidemiology (AREA)
- Diabetes (AREA)
- Pathology (AREA)
- Nuclear Medicine, Radiotherapy & Molecular Imaging (AREA)
- Hematology (AREA)
- Obesity (AREA)
- Chemical Kinetics & Catalysis (AREA)
- General Chemical & Material Sciences (AREA)
- Endocrinology (AREA)
- Emergency Medicine (AREA)
- Child & Adolescent Psychology (AREA)
- Measuring Or Testing Involving Enzymes Or Micro-Organisms (AREA)
- Botany (AREA)
Description
- The present disclosure relates to the biomedical field, and particularly to biomarkers and methods for predicting risk of a disease, in particular rheumatoid arthritis (RA).
- Rheumatoid arthritis (RA) is a debilitating autoimmune disorder affecting tens of millions of people worldwide and increases mortality in the patients with its cardiovascular and other systemic complications. Despite success in alleviating the condition in many RA patients using disease-modifying antirheumatic drugs (DMARD), development of specific and more effective therapies has been hindered by insufficient understanding of factors that trigger or promote the disease. Investigation of the microbiome may reveal probiotics that prevent or mitigate RA. Gut microbiota is a key environmental factor for human health, with established roles in obesity, diabetes, colon cancer, etc. Oral microbiota is relatively understudied compared to the gut microbiota. Metagenomic analysis of the role of the oral microbiome in diseases has been lacking. It is also unknown to what extent oral and gut microbial disease markers might converge in their identity or function.
- As noted above, the present disclosure relates to the biomedical field, and particularly to biomarkers and methods for predicting risk of a disease, in particular rheumatoid arthritis (RA).
- Disclosed in the present teaching are systems for obtaining a probability of a subject having a disease or evaluating a treatment regarding the disease.
- A system for obtaining a probability of a subject having a disease is disclosed. The system comprises a processor and a storage medium containing program instructions for execution by the processor. The program instructions cause the processor to execute the following steps. A sample is collected from the subject. DNA is extracted from the sample. Sequences of the DNA are obtained. A relative abundance of a biomarker is then calculated based on the sequences of the DNA. The biomarker comprises a DNA sequence in a genome of Lactobacillus salivarius. A probability of the subject having the disease is obtained based on the relative abundance.
- Also disclosed is a system for evaluating a treatment regarding a disease or identifying therapeutic agents is disclosed. The system comprises a processor and a storage medium containing program instructions for execution by the processor. The program instructions cause the processor to execute the following steps. For each subject of a plurality of subjects having the disease, first DNA sequences extracted from a first sample and second DNA sequences extracted from a second sample are obtained. The first sample is collected from the subject before the subject receives the treatment. The second sample is collected from the subject after the subject receives the treatment. For each subject, a first relative abundance of a biomarker is calculated based on the first DNA sequences; and a second relative abundance of the biomarker is calculated based on the second DNA sequences. The biomarker comprises a DNA sequence in a genome of Lactobacillus salivarius. The treatment is then evaluated based on the first relative abundances and the second relative abundances calculated for the plurality of subjects.
- A different system for evaluating a treatment regarding a disease or identifying therapeutic agents is further disclosed. The system comprises a processor and a storage medium containing program instructions for execution by the processor. The program instructions cause the processor to execute the following steps. For each subject of a plurality of subjects having the disease, sequences of DNA are obtained, where the DNA is extracted from a sample that has been obtained from the subject after receiving the treatment; and a relative abundance of a biomarker is calculated based on the sequences of the DNA. The biomarker comprises a DNA sequence in a genome of Lactobacillus salivarius. The treatment is then evaluated based on the relative abundances calculated for the plurality of subjects.
- Also disclosed in the present teaching are methods for obtaining a probability of a subject having a disease or evaluating a treatment regarding the disease or identifying therapeutic agents.
- In such a method DNA is extracted from a sample collected from a subject. Sequences of the DNA are obtained. A relative abundance of a biomarker is then calculated based on the sequences of the DNA. The biomarker comprises a DNA sequence in a genome of Lactobacillus salivarius. A probability of the subject having a disease is obtained based on the relative abundance.
- A method for evaluating a treatment regarding a disease or identifying therapeutic agents is disclosed as follows. For each subject of a plurality of subjects having the disease, first DNA sequences extracted from a first sample and second DNA sequences extracted from a second sample are obtained. The first sample is collected from the subject before the subject receives the treatment. The second sample is collected from the subject after the subject receives the treatment. For each subject, a first relative abundance of a biomarker is calculated based on the first DNA sequences; and a second relative abundance of the biomarker is calculated based on the second DNA sequences. The biomarker comprises a DNA sequence in a genome of Lactobacillus salivarius. The treatment is then evaluated based on the first relative abundances and the second relative abundances calculated for the plurality of subjects.
- Further disclosed is a method for evaluating a treatment regarding a disease or identifying therapeutic agents as follows. For each subject of a plurality of subjects having the disease, sequences of DNA are obtained, where the DNA is extracted from a sample that has been obtained from the subject after receiving the treatment; and a relative abundance of a biomarker is calculated based on the sequences of the DNA. The biomarker comprises a DNA sequence in a genome of Lactobacillus salivarius. The treatment is then evaluated based on the relative abundances calculated for the plurality of subjects.
- Also disclosed in the present teaching is a computer program product for obtaining a probability of a subject having a disease. The computer program product comprises a computer-readable storage medium having program code stored thereon. The program code is executable by a processor and comprises instructions to cause the processor to execute the following steps. A sample is collected from the subject. DNA is extracted from the sample. Sequences of the DNA are obtained. A relative abundance of a biomarker is then calculated based on the sequences of the DNA. The biomarker comprises a DNA sequence in a genome of Lactobacillus salivarius. A probability of the subject having the disease is obtained based on the relative abundance.
- Also disclosed in the present teaching is a biomarker for obtaining a probability of a subject having a disease or evaluating a treatment regarding the disease or identifying therapeutic agents. The biomarker comprises at least one DNA sequence in a genome of Lactobacillus salivarius or at least one of the following metagenomic linkage groups (MLGs): MLG consisting of MLG ID NO: 2169; MLG consisting of MLG ID NO: 16600; and MLG consisting of MLG ID NO: 4643; see Table 2-2.
- The present invention now provides methods for more specifically obtaining a probability of a subject having rheumatoid arthritis and evaluating treatment for rheumatoid arthritis or identifying therapeutic agents therefor relying on the above MLGs as set out in the accompanying claims and further described below.
- Exemplary embodiments of the invention are described in detail herein with reference to the following figures:
-
FIG. 1 shows a flowchart of an exemplary process in which biomarkers are identified and validated for evaluating RA risk; -
FIG. 2 illustrates analysis results for influence of phenotypes on gut, dental, and salivary metagenomic linkage groups (MLGs); -
FIG. 3 shows a GC-depth graph for Lactobacillus sp. after advanced assembly; -
FIG. 4 shows co-linearity between an assembly and Lactobacillus salivarius; -
FIG. 5 shows patient stratification based on a RA-associated bacterium; -
FIG. 6 shows correlations between the relative abundances of gut and dental MLGs; -
FIG. 7 shows correlations between the relative abundances of gut and salivary MLGs; -
FIG. 8 shows correlations between the relative abundances of dental and salivary MLGs; -
FIG. 9 shows a flowchart of an exemplary process in which a biomarker is utilized for evaluating RA risk, according to an embodiment of the present teaching; and -
FIG. 10 shows a flowchart of an exemplary process in which a biomarker is utilized for evaluating a treatment regarding RA, according to an embodiment of the present teaching. - Terms used herein have meanings as commonly understood by a person of ordinary skill in the areas relevant to the present teaching. Terms such as "a", "an" and "the" are not intended to refer to only a singular entity, but include the general class of which a specific example may be used for illustration. The terminology herein is used to describe one or more exemplary embodiments of the present teaching, but their usage does not delimit the present teaching, except as outlined in the claims.
- The present disclosure describes biomarkers and methods for utilizing the biomarkers to predict risk of a disease and determine an effect of a treatment regarding the disease, in particular the disease of RA. Infectious agents have long been implicated with RA. However, identity and pathogenicity of the RA-associated agent(s) have been largely unclear, a question further complicated by a recent reinstatement that the human body is a super-organism hosting trillions of beneficial as well as harmful microorganisms.
- RA is believed to initiate and lurk in some other body site(s) for years before the onset of joint inflammation. Investigation of the microbiome may reveal probiotics that prevent or mitigate RA. Gut microbiota is a key environmental factor for human health, with established roles in obesity, diabetes, colon cancer, etc.. Besides functioning in nutrient and xenobiotic metabolism, microbes in distal gut crosstalk with the neuro-immune-endocrine system and blood stream to impact the entire human body. The gut microbiota is stably associated with a given individual, adding to its value in disease-related investigations. The heterogeneity of the gut microbiome in the human population suggests that treatment of diseases should be personalized according to the gut microbiome, whose role in drug activation or inactivation, immune modulation, etc. remains largely unclear. Oral microbiota is relatively understudied compared to the gut microbiota, with the Human Microbiome Project (HMP) only sampling ∼100 healthy individuals for WGS (whole genome sequencing). Metagenomic analysis of the role of the oral microbiome in diseases has been lacking, despite that dental and salivary samples are more readily available at clinical visits than fecal samples. It is also unknown to what extent oral and gut microbial disease markers might converge in their identity or function.
- A biomarker generally refers to a measurable indicator of some biological state or condition. The term "biomarker" as used in the present teaching refers to a measurable substance in an organism whose presence is indicative of some phenomenon such as disease, infection, or environmental exposure. In particular, a biomarker in a sample from a RA patient or a normal person may be utilized to evaluate RA risk of the person.
-
FIG. 1 shows a flowchart of an exemplary process in which biomarkers are identified and validated for evaluating RA risk. First, gut and/or oral samples are collected at 102 from both RA patients and healthy control people. The gut samples may include fecal samples, while the oral samples may include dental and salivary samples. DNA extraction is performed on each sample at 104. The extracted DNA is sequenced, e.g. by a metagenomic sequencing, at 106. Then at 108, gene catalogs are constructed for gut and oral samples. The gene catalog for gut samples may be replaced or integrated with an existing gene catalog, while there are few existing gene catalogs for oral samples. - Based on the gene catalogs, at 110, relative abundances of genes in the samples are determined. A relative abundance of a given gene in a sample can be calculated as below. First, the copy number of each gene in the sequenced data from the sample is calculated as a ratio between the times which a gene can be detected in the sample and the length of the gene. Second, the relative abundance of the given gene can be calculated as a ratio between the copy number of the given gene and a summation of the copy numbers of all genes in the sample.
- At 112, the genes are annotated based on their identities and functionalities. Marker genes can be determined at 114 based on their respective relative abundances, e.g. when a marker gene shows difference in relative abundances between control and RA groups. These marker genes are selected and clustered at 116 to construct MLGs. The term "MLG" as used in the present teaching may refer to a group of genetic material in a metagenome that is probably physically linked as a unit rather than being independently distributed. At 118, the MLGs of both control and RA groups are analyzed. Correlations between each MLG and clinical indices are determined at 120. At 122, one or more biomarkers are identified from the MLGs based on the correlations, e.g. when a biomarker shows positive correlation with a predominant antibody of the mucosal immune system or with a major serum immunoglobulin. At 124, the biomarkers are validated in all samples. For example, a biomarker may be validated if it is consistently found enriched in gut and/or oral samples from the RA patients.
- According to an embodiment of the present disclosure, a validated biomarker comprises a DNA sequence in a genome of Lactobacillus salivarius. According to various embodiments of the present disclosure, the validated biomarker may comprise at least a partial sequence of SEQ ID NO: 1 to 593; SEQ ID NO: 594 to 1536; or SEQ ID NO: 1537 to 2594, as stated in Table 2-2. A sequence listing submitted herewith includes nucleotide and/or amino acid sequences corresponding to the above mentioned SEQ IDs.
- For example, referring to Table 2-2, MLG ID NO: 2169 contains at least 593 RA-associated genes identified from fecal samples. These 593 genes have the polynucleotide sequences of SEQ ID NOs: 1-593, respectively.
- Similarly, referring to Table 2-2, MLG ID NO: 16600 contains at least 943 RA-associated genes identified from dental samples. These 943 genes have the polynucleotide sequences of SEQ ID NOs: 594-1536, respectively.
- Similarly, referring to Table 2-2, MLG ID NO: 4643 contains at least 1058 RA-associated genes identified from salivary samples. These 1058 genes have the polynucleotide sequences of SEQ ID NOs: 1537-2594, respectively.
- The present teaching is further exemplified in the following non-limiting examples. Unless otherwise stated, parts and percentages are by weight and degrees are Celsius. As apparent to one of ordinary skill in the art, these examples, while indicating preferred embodiments of the present teaching, are given by way of illustration only, and the agents are all commercially available.
- The examples relate to methods for identifying and validating biomarkers for evaluating RA risk. In one example, metagenomic shotgun sequencing was performed for 212 fecal samples (77 treatment-naive RA cases, 80 unrelated healthy controls; 17 treatment-naive RA cases and 17 related healthy controls; 21 DMARD-treated cases) (Tables 1-1, 1-2, 1-3). This may be used to investigate the gut microbiome in RA patients. The data were then integrated into an existing gut microbial reference gene catalog to obtain a set of 5.9 million genes (from 481 samples), which allowed saturating mapping of the sequencing reads (80.3 ± 2.3%, mean ± s.d.) (Li, J. et al. An integrated catalog of reference genes in the human gut microbiome. Nat. Biotechnol. (2014)).
- Dental plaques and saliva were also sampled from treatment-naive RA patients and healthy controls, and metagenomic sequencing performed on the 105 dental and 98 saliva samples (dental/salivary samples from 54/51 treatment-naive RA cases and 51/47 healthy controls; 69 of the subjects having the complete set of fecal, dental and salivary samples) (Tables 1-1, 1-2, 1-3). This may show that dysbiosis is also evident in the oral microbiome, after demonstrating the dysbiosis in the RA gut microbiome. De novo assembly of these sequences led to a gene catalog of 3.2 million genes, with 76.6 ± 1.8% and 70.7 ± 7.3% (mean ± s.d.) mapping of the dental and salivary sequencing reads, respectively.
- The study cohort is described as below. RA was diagnosed at Peking Union Medical College Hospital according to the 2010 ACR/EULAR (American College Of Rheumatology /European League Against Rheumatism) classification criteria. All phenotypic information was collected upon the subjects' initial visit to the hospital following standard procedures. 21 fecal samples from DMARD-treated patients were only included in the 212 samples used for gut microbial gene catalog construction, and were not analyzed in this example. RA patients were between 18 and 65 years old, with disease duration of at least 6 weeks, at least 1 swollen joint and 3 tender joints enlisted. Patients were excluded if they had a history of chronic serious infection, any current infection or any type of cancer. Pregnant or lactating women were excluded. All patients were informed of the risk of infertility and patients with a desire to have children were excluded. Even though some of the patients had suffered from RA for years, they were DMARD-naive because they had not been diagnosed with RA at local hospitals before visiting Peking Union Medical College Hospital, and had only taken painkillers to relieve RA symptoms.
- The healthy control group met the following inclusion criteria: 18-65 years of age; having a normal level on recently screening for liver and kidney function, routine blood test, erythrocyte sedimentation rate, fasting blood glucose, blood lipid, and blood pressure. Subjects were excluded if they had a history of chronic serious infection, any current infection, any type of cancer or autoimmune disease. Pregnant or lactating women were excluded. Subjects who had received antibiotic treatment within 1 month before participating in this study were also excluded.
- The treatment was performed with methotrexate (MTX)-based DMARDs. 97% of the patients received MTX alone (7.5 mg QW initially, 15 mg (max 0.3mg/kg) QW from 4 weeks and on; supplemented with 10mg QW folate), T2 alone (20mg TID), or MTX plus T2. Other drugs used on the remaining patients included Leflunomide (LEF), prednisolone (pred), hydroxychloroquine (HCQ) and etanercept, which were not compared due to the small sample size. As used in the present teaching, "QW" means once a week; "TID" means three times a day; and "T2" means Tripterygium wilfordii (thunder god vine) glycosides. Based on reduction in DAS28-ESR after treatment, the patient samples were divided into good, moderate and no improvement, according to the EULAR response criteria. As patients from all over China came to visit Peking Union Medical College Hospital, not all patient samples were available after treatment.
- The study was approved by the institutional review boards at Peking Union Medical College Hospital and (Beijing Genomics Institute) BGI-Shenzhen.
- Sample collection is described as below. Fecal samples were collected at Peking Union Medical College Hospital, transported frozen, and extracted at BGI-Shenzhen as previously described (Qin, J. et al. A metagenome-wide association study of gut microbiota in )). Dental plaques were scraped from dental surfaces using ophthalmology forceps until there was 3µl of volume. The sample was transferred into 200µl of 1x lysis buffer containing 10 mM Tris, 1 mM EDTA (Ethylene Diamine Tetraacetic Acid), 0.5% Tween 20 and 200µg/ml proteinase K (Fermentas) and incubated for 2 hours at 55 °C. Lysis was terminated by incubation at 95 °C for 10 minutes, and the sampled were frozen at -80 °C until transport. DNA extraction was performed following the protocol for fecal samples. For saliva, 100µl of saliva was added into 100µl of 2x lysis buffer. The posterior pharynx wall was swabbed and added to the same tube. The samples were then lysed and extracted as the dental samples.
- All available samples were analyzed (Tables 1-1, 1-2, 1-3). Some of the fecal samples were excluded due to constipation, or inappropriate sample preservation; some of the oral samples were excluded due to low concentration of microbial DNA.
- Metagenomic sequencing and assembly is described as below. Paired-end metagenomic sequencing was performed on the Illumina platform (insert size 350bp, read length 100bp), and the sequencing reads were quality-controlled and de novo assembled into contigs using SOAPdenovo v2.04 (Luo, R. et al. SOAPdenovo2: an empirically improved memory-efficient short-read de novo assembler. ), as described previously (Qin et al. 2012, supra). The average rate of host contamination was 0.37% for fecal, 5.55% for dental and 40.85% for saliva samples.
- Gene catalog construction is described as below. Gene prediction from the assembled contigs was performed using GeneMark v2.7d. Redundant genes were removed using BLAT with the cutoff of 90% overlap and 95% identity (no gaps allowed), resulting in a non-redundant gene catalog of 3,800,011 genes for 212 fecal samples (containing 21 of the DMARD-treated samples), and a catalog of 3,234,997 genes for the 203 treatment-naive oral samples (105 dental plaques samples and 98 saliva samples). The gene catalog from fecal samples was further integrated into an existing gut microbial reference catalog of 4.3 million genes using BLAT (95% identity, 90% overlap) (Qin et al. 2012, supra), resulting in a final catalog of 5.9 million genes. Relative abundances of the genes were determined by aligning high-quality sequencing reads to the gut or oral reference gene catalog. A detailed procedure for the aligning can be found in Qin et al. 2012, supra.
- Taxonomic annotation and abundance calculation are described as below. Taxonomic assignment of the predicted genes was performed according to the IMG database (v400) based on an in-house pipeline detailed previously (Qin et al. 2012, supra), with 70% overlap and 65% identity for assignment to phylum, 85% identity to genus, and 95% identity to species. The relative abundance of a taxon was calculated from the relative abundance of its genes.
- In one example, a relative abundance of a given gene in a sample can be calculated as below. First, the copy number of each gene in the sequenced data from the sample is calculated as a ratio between the times which a gene can be detected in the sample (i.e. the number of mapped reads) and the length of the gene. Second, the relative abundance of the given gene can be calculated as a ratio between the copy number of the given gene and a summation of the copy numbers of all genes in the sample.
- Significant differences in relative abundance of a taxon between patients and healthy controls were identified by a Wilcoxon rank-sum test with p< 0.05.
- Metagenome-wide association study (MGWAS) is described as below. For case-control comparison of the fecal microbiome, removal of genes detected in less than 10% of the samples led to a set of 2,007,643 genes. 117,219 genes showed differences in relative abundance between controls and cases (Wilcoxon rank-sum test, FDR < 0.3). These marker genes were then clustered into MLGs according to their abundance variation across all samples (Qin et al. 2012, supra). MLG is a generalized concept in lieu of a species concept for a metagenome. The term "MLG" as used in the present teaching may refer to a group of genetic material in a metagenome that is probably physically linked as a unit rather than being independently distributed. This may help to avoid the need to completely determine the specific microbial species present in the metagenome, which is important given that there are a large number of unknown organisms and that there is frequent lateral gene transfer (LGT) between bacteria. MLG can be used to reduce and structurally organize the abundant metagenomic data and to help making a taxonomic description. Based a gene profile, a MLG can be identified as a group of genes that co-exists among different individual samples and has a consistent abundance level and taxonomic assignment.
- For constructing dental MLGs, 371990 marker genes (Wilcoxon rank-sum test, FDR < 0.1) were selected from 1900774 genes (present in at least 10% of the samples). For salivary MLGs, 258055 marker genes (Wilcoxon rank-sum test, FDR < 0.1) were selected from 2030636 genes (present in at least 10% of the samples).
- Taxonomic assignment and abundance profiling of the MLGs were performed according to the taxonomy and the relative abundance of their constituent genes, as previously described (Qin et al. 2012, supra). All genes from one MLG were aligned to the reference microbial genomes at the nucleotide level and the (National Center for Biotechnology Information) NCBI-nr database at the protein level. From the alignments with the reference microbial genomes, one can obtain a list of well-mapped bacterial genomes for each MLG and order these bacterial genomes according to the proportion of genes that could be mapped onto the bacterial genome, as well as the average identity of the alignments.
- Assignment to species may require more than 90% of genes in an MLG to align with the species' genome with more than 95% identity, 70% overlap of query. Assigning an MLG to a genus may require more than 80% of its genes to align with a genome with 85% identity in both DNA and protein sequences.
- MLGs were further clustered according to Spearman's correlation between their abundances in all samples regardless of case-control status.
- Correlation of MLGs from different body sites is analyzed in the same manner in the 69 subjects (36 controls, 33 treatment-naive cases) having fecal, dental and salivary samples.
- Canonical correspondence analysis (CCA) was performed on the MLG abundance profile of the control and RA samples to assess the impact from each of the factors listed (Feng, Q. et al. Gut microbiome development along the colorectal adenoma carcinoma sequence. Nat. Commun. 6, 6528 (2015)).
- 117,219 gene markers differentially enriched in RA patients or controls (Wilcoxon rank-sum test, FDR < 0.3) were identified. This may help to accurately delineate features of the RA-associated gut microbiota. Metagenomic linkage groups (MLGs) were computed based on abundance covariations between the genes among samples (Qin et al. 2012, supra). The 88 MLGs that contained at least 100 genes were separated according to their direction of enrichment in canonical coordinate analysis (CCA), confirming that they were mainly associated with the RA status.
- The 171 dental and 142 salivary MLGs that contained at least 100 genes were separated according to their direction of enrichment in CCA, confirming their association with RA.
- Association between MLGs and clinical indices is described as below. Spearman's correlation was performed between the relative abundance of each MLG and continuous variables measured clinically, as previously described (Karlsson, F. H. et al. Gut metagenome in European women with normal, impaired and diabetic glucose control. Nature 498, 99-103 (2013)).
- Numerical covariations were investigated between the relative abundance of the MLGs and the clinical indices using Spearman's correlation. This may help to explore the diagnostic or prognostic value of the gut microbiome for RA.
- In one example, the relative abundance of a MLG in a sample can be estimated based on the relative abundance values of genes from this MLG. For this MLG, one may discard genes that were among the 5% with the highest and lowest relative abundance, respectively, and then fit a Poisson distribution to the rest. The estimated mean of the Poisson distribution can be interpreted as the relative abundance of this MLG. The profile of MLGs among all samples may be obtained for further analyses. The relative abundance of a biomarker in a sample may be calculated in a similar way.
-
FIG. 2 illustrates analysis results for influence of phenotypes on gut, dental, and salivary MLGs, according to an embodiment of the present teaching. In this example,FIG. 2 shows CCA result for influence of phenotypes on the gut (a), dental (b) or salivary (c) MLGs. Categorical or continuous phenotypes missing in half of the samples were not analyzed. Solid points represent control-enriched MLGs, while hollow points represent RA-enriched MLGs. RA-enriched MLGs, e.g. Clostridium asparagiforme, Bacteroides sp. and Lactobacillus sp. (most related to L. salivarius, Table 2-1, Table 2-2) were correlated positively with the predominant antibody of the mucosal immune system, IgA, or with the major serum immunoglobulin, IgG. - Meanwhile, anaerobes such as Lactobacillus salivarius, Atopobium sp. and Cryptobacterium curtum were found in both the salivary and dental samples of the RA patients.
- Assembly of more RA-relevant genomes is described as below. One can then assemble bacterial genomes directly from MLGs and its associated metagenomic sequencing reads using a software package in the SOAP (short oligonucleotide alignment program) family, e.g. SOAPMeta (patent application
PCT/CN2012/079492 -
FIG. 3 andFIG. 4 show Lactobacillus sp. draft genome.FIG. 3 shows a GC-depth graph for Lactobacillus sp. after advanced assembly, according to an embodiment of the present teaching.FIG. 4 shows co-linearity between the assembly (from sample D201) and the Lactobacillus salivarius CECT 5713 reference draft genome from NCBI (NC_017481.1), according to an embodiment of the present teaching. Functions encoded by the genome were largely similar to those in Lactobacillus salivarius CECT 5713 or other Lactobacillus strains, except that this RA-enriched Lactobacillus sp. encodes different cell wall modifications which might be recognized by the host immune system. - Concordance between the gut and oral microbiome is described as below. Despite differences between the gut and oral bacterial taxa associated with RA, Lactobacillus salivarius was consistently found to be enriched in the RA patients, the gut and salivary MLGs were positively correlated with IgG, and the dental L. salivarius showed the second highest odds ratio among all dental MLGs (Table 2-1). These results make them strong candidates as biomarkers for RA. Furthermore, L. salivarius was more abundant in very active (DAS28 >5.1) RA cases compared to mild-to-moderately active (DAS28 ≤5.1) RA cases (Table 4, p = 0.017, 0.036, 0.084 in feces, dental plaques and saliva, respectively, Wilcoxon rank-sum test), underscoring its potential for non-invasive prognosis.
- According to an embodiment of the present disclosure, a biomarker for evaluating or diagnosing RA comprises a DNA sequence in a genome of Lactobacillus salivarius. According to various embodiments of the present disclosure, the biomarker for evaluating or diagnosing RA may comprise at least a partial sequence of SEQ ID NO: 1 to 593; SEQ ID NO: 594 to 1536; or SEQ ID NO: 1537 to 2594, as stated in Table 2-2. The sequence listing submitted herewith includes nucleotide and/or amino acid sequences corresponding to the above mentioned SEQ IDs.
-
FIG. 5 shows patient stratification based on a RA-associated bacterium, according to an embodiment of the present teaching. Relative abundances of Lactobacillus salivarius MLGs in fecal, dental and salivary are plotted, and the difference between very active and moderately active RA cases is significant in the fecal and dental samples (p = 0.017, 0.036, 0.084 respectively, Wilcoxon rank-sum test). MLG identification numbers are indicated in parentheses after the annotations. The disease classification followed the European League Against Rheumatism (EULAR) criterion, i.e. 3.2 < DAS28 ≤ 5.1, moderate; DAS28 > 5.1, very active (Table 4). - One can compute correlations between the relative abundances of fecal, dental and salivary MLGs among samples (n = 69). This may help to better understand the distribution of RA-associated bacteria across body sites. L. salivarius from the three sites (Lactobacillus sp. in the gut) showed positive correlation with each other (Table 5), confirming presence of the bacterium in multiple body sites.
- If classification based on two sites was used to overrule the few misclassifications based on the other site, none of the subjects were misclassified except for one related control, highlighting the power of examining the microbiome at multiple sites (Table 6). Moreover, these results indicate that fecal, dental and salivary microbial markers could all be highly useful for the diagnosis and management of RA, while the dental microbiome (with probability of RA 0.94) might be more sensitive than the gut microbiome (with probability of RA 0.73).
-
FIGs. 6-8 show correlation between gut and oral MLGs.FIG. 6 shows correlations between the relative abundances of gut and dental MLGs, according to an embodiment of the present teaching.FIG. 7 shows correlations between the relative abundances of gut and salivary MLGs, according to an embodiment of the present teaching. According to bothFIG. 6 andFIG. 7 , Spearman's correlation between the relative abundances of gut and dental or salivary MLGs (≥ 100 genes) were calculated for subjects with the full set of fecal, dental and salivary samples (n = 69). Similar correlations were observed using other measures, i.e. TIGRESS (Trustful Inference of Gene Regulation using Stability Selection), Boruta, CLR (Context Likelihood of Relatedness), Bicor (Biweight midcorrelation), MINE (Maximal Information Nonparametric Exploration). Size of the nodes reflects number of genes in each MLG. MLGs were colored according to body site and direction of enrichment. MLG identification numbers are listed in parentheses if more than one MLG annotated to the same species or unclassified species in a genus (sp.). Possible strain names are listed in Table 2-1 for all MLGs with more than 50% of genes annotated to the strain(s), even if the criteria for pinpointing a species or a genus has not been met. Solid lines (edges) represent Spearman's correlation coefficient (cc) > 0.4, p < 0.05; dotted lines (edges) represent cc < -0.4, p < 0.05. -
FIG. 8 shows correlations between the relative abundances of dental and salivary MLGs, according to an embodiment of the present teaching. In accordance withFIG. 8 , MLGs were colored according to body site and direction of enrichment. MLG identification numbers are listed in parentheses if more than one MLG annotated to the same species or unclassified species in a genus (sp.). Possible strain names are listed in Table 2-1 for all MLGs with more than 50% of genes annotated to the strain(s), even if the criteria for pinpointing a species or a genus has not been met. Solid lines (edges) represent Spearman's correlation coefficient (cc) > 0.6, p < 0.05; dotted lines (edges) represent cc < -0.6, p < 0.05. -
FIG. 9 shows a flowchart of an exemplary process in which a biomarker is utilized for evaluating RA risk, according to an embodiment of the present teaching. First, gut and/or oral samples are collected at 902 from an individual to evaluate RA risk of the individual. The gut samples may include fecal samples, while the oral samples may include dental and salivary samples. DNA extraction is performed on each sample at 904. The extracted DNA is sequenced, e.g. by a metagenomic sequencing at 906, to obtain sequences of the DNA. In one embodiment, the sequences of the DNA may be obtained by polymerase chain reaction (PCR) with a primer that hybridizes to at least some of the DNA. In another embodiment, the sequences of the DNA may be obtained by using one or more probes that specifically recognize at least some of the DNA. - Then at 908, genes of a biomarker are identified from each sample based on gene catalog. For example, the biomarker may be RA-enriched MLGs, e.g. Clostridium asparagiforme, Bacteroides sp. and Lactobacillus sp. (most related to L. salivarius) and/or anaerobes such as Lactobacillus salivarius, Atopobium sp. and Cryptobacterium curtum. In one embodiment, Lactobacillus salivarius is a preferred biomarker for evaluating RA risk. The term "gene" as used in the present teaching may refer to any DNA sequence.
- Relative abundances of the biomarker in each sample are determined at 910. For example, one can list genes of the biomarker among the sequences of the DNA in a sample in order of the genes' respective relative abundances. After removing the top 5% genes with highest relative abundance and the bottom 5% genes with lowest relative abundance, relative abundances of the remaining genes of the biomarker can be averaged or fit with a Poisson distribution to determine a relative abundance of the biomarker in the sample.
- At 912, the relative abundances are compared to predetermined thresholds. A predetermined threshold may be associated with a type of sample, e.g. fecal, dental or salivary samples, and determined based on statistics analysis related to the biomarker. RA risk of the individual is evaluated based on the comparisons at 914. For example, as L. salivarius is more abundant in very active (DAS28 >5.1) RA cases compared to mild-to-moderately active (DAS28 ≤5.1) RA cases, the threshold may be set as a relative abundance of L. salivarius that corresponds to DAS28 =5.1. Then, RA risk of the individual is high if the relative abundance of the L. salivarius is higher than the threshold. In another embodiment, the relative abundances of different types of samples may be combined to evaluate RA risk.
- Various exemplary thresholds of MLG relative abundance for classification are listed in Table 6, for different types of samples. When MLG relative abundance is larger than the threshold, the person is at risk of RA
- In another embodiment, RA risk can be evaluated based on a classifier that is generated based on a training set. For a given relative abundance of a biomarker, the classifier can indicate a probability of an individual having RA. The training set may comprise relative abundances of the biomarker in samples from a plurality of subjects having RA and a plurality of subjects not having RA. The classifier may be generated based on a Multivariate statistical model, e.g. a randomForest model. For example, for a certain relative abundance of a biomarker, a corresponding probability of RA can be determined based on the classifier. Then, the RA risk of the individual can be evaluated based on the probability. For example, the probability greater than a predetermined threshold indicates that the subject has or is at risk of having RA.
- DMARD treatment's modification of the RA microbiome is described as below. One may compute MLGs before and after treatment (for 3 months, except for 6 samples) in fecal samples from 40 individuals (Table 1-3). This may help to examine whether the treatment by DMARD restores a healthy microbiome. Most of the patients received the anchor drug methotrexate (MTX), the traditional Chinese medicinal component Tripterygium wilfordii (thunder god vine) glycosides (T2), or both (MTX+T2) as DMARD. Before-treatment or RA-enriched MLGs such as BDM-3355 (BDM, Before DMARD) and Bacteroides sp. (with motifs similar to collagen XI and HLA-DR4/1) were more diminished after treatment with T2 than with MTX or MTX+T2, while after-treatment-enriched MLGs such as ADM-2636 (most related to Escherichia coli) and ADM-2944 (ADM, After DMARD) were more increased after T2. But the use of MTX or MTX+T2 may be better in other aspects, e.g. higher levels of Bacteroides caccae and Haemophilus sp.. These data can indicate that different DMARD modulates the gut microbiome differently, and may suggest that surveying the gut microbiome would help optimize the choice of DMARD and auxiliary therapies.
- DMARD treatment showed promising modulation of the oral microbiome as well, with some of the control-enriched dental or salivary MLGs e.g. Aggregatibacter sp. over-represented in patients with good response compared to those with moderate or no improvement. Control-enriched dental MLGs such as Con-16138, Prevotella intermedia were most abundant in patients treated with MTX+T2 compared to T2 alone or MTX alone, while RA-9938, RA-10684 and RA-9998 were most reduced in patients treated with MTX alone. Differential modulations of RA- or control-associated MLGs by MTX, MTX+T2 or T2 were also observed in the saliva samples. Notably, no significant difference in Lactobacillus salivarius was detected in any of the above-mentioned comparisons, indicating that the gut and oral microbiome were still not exactly healthy after treatment. Thus, both the gut and the oral microbiome respond partially to DMARD and should be managed according to the severity of RA and the DMARD of choice.
-
FIG. 10 shows a flowchart of an exemplary process in which a biomarker is utilized for evaluating a treatment regarding RA, according to an embodiment of the present teaching. First, gut and/or oral samples are collected at 1002 from RA patients before a treatment. The gut samples may include fecal samples, while the oral samples may include dental and salivary samples. As discussed before, the treatment may be a DMARD treatment like MTX, T2, or MTX+T2, or may be any treatment regarding RA. At 1004, gut and/or oral samples are collected from the same RA patients after they receive treatment. DNA extraction is performed on each sample at 1006. The extracted DNA is sequenced at 1008, e.g. by a metagenomic sequencing, to obtain sequences of the DNA. In one embodiment, the sequences of the DNA may be obtained by PCR with a primer that hybridizes to at least some of the DNA. In another embodiment, the sequences of the DNA may be obtained by using one or more probes that specifically recognize at least some of the DNA. - Then at 1010, genes of a biomarker are identified from each sample based on gene catalog. For example, the biomarker may be RA-enriched MLGs, e.g. Clostridium asparagiforme, Bacteroides sp. and Lactobacillus sp. (most related to L. salivarius) and/or anaerobes such as Lactobacillus salivarius, Atopobium sp. and Cryptobacterium curtum. In one embodiment, Lactobacillus salivarius is a preferred biomarker for evaluating a treatment regarding RA
- Relative abundances of the biomarker in each sample are determined at 1012. For example, one can list genes of the biomarker in a sample in order of their respective relative abundances. After removing the top 5% genes with highest relative abundance and the bottom 5% genes with lowest relative abundance, relative abundances of the remaining genes of the biomarker can be averaged or fit with a Poisson distribution to determine a relative abundance of the biomarker in the sample. This may be performed for samples before and after the treatment.
- At 1014, one can compare the relative abundances of the biomarker before and after the treatment for each RA patient. For example, the relative abundances of L. salivarius in a same type of sample (e.g. fecal, dental or salivary samples) may be determined both before a RA patient receives the treatment and after the RA patient receives the treatment. Then, the relative abundances before and after the treatment may be compared to see whether L. salivarius is less abundant after the treatment. If so, the treatment shows some effect at least on this patient. Similar comparisons can be performed on all RA patients with collected samples.
- The treatment is then evaluated based on the comparison(s) at 1016. For example, for all RA patients in evaluation, the relative abundances of L. salivarius before and after the treatment can be compared to see whether L. salivarius is less abundant after the treatment. In one embodiment, if relative abundance of L. salivarius is reduced after the treatment for more than a given percentage of the RA patients, the treatment may be determined to be effective. In another embodiment, if the average relative abundance of L. salivarius among the RA patients decreases by a given number after the treatment, the treatment may be determined to be effective.
- In another embodiment, a treatment regarding RA may be evaluated merely based on the sample collected from the RA patients after the treatment. In that case, the relative abundances of the biomarker, e.g. L. salivarius, can be calculated for all patients after the treatment. Then, the relative abundances can be compared with a predetermined threshold to determine whether the treatment brings down the relative abundance of the biomarker to a safe range that indicates no or low RA risk. If so, the treatment may be evaluated as effective. The treatment may also be evaluated with a classifier.
- In accordance with various embodiments, a biomarker, e.g. L. salivarius, may have different uses. The present disclosure includes but not limited to: L. salivarius for use as a biomarker; L. salivarius for use as a measurable indicator of RA; L. salivarius for use of evaluating or predicting risk of RA in a subject; L. salivarius for use of diagnosing RA in a subject; and L. salivarius for use of evaluating a treatment regarding a disease, e.g. RA
- In one example, a biomarker may be used for evaluating or predicting risk of RA in a subject to be tested. A sample is collected from the subject. DNA is extracted from the sample. Sequences of the DNA are obtained. Then, a relative abundance of the biomarker is calculated based on the sequences of the DNA. The biomarker may comprise a DNA sequence in a genome of Lactobacillus salivarius. A probability of the subject having a disease can be obtained based on the relative abundance. The risk of RA in the subject may be evaluated or predicted based on the probability.
- In another example, a biomarker may be used for evaluating a treatment regarding a disease, e.g. RA. For each subject of a plurality of subjects having the disease, a sample from the subject is collected after the subject receives the treatment. DNA is extracted from the sample. Sequences of the DNA are obtained. Then, a relative abundance of the biomarker is calculated based on the sequences of the DNA. The biomarker may comprise a DNA sequence in a genome of Lactobacillus salivarius. The treatment may be evaluated based on the relative abundances calculated for the plurality of subjects.
- In yet another example, a biomarker may be used for evaluating a treatment regarding a disease, e.g. RA. For each subject of a plurality of subjects having the disease, a first sample is collected from the subject before the subject receives the treatment, and a second sample is collected from the subject after the subject receives the treatment. A first relative abundance of a biomarker is calculated based on the first sample. A second relative abundance of the biomarker is calculated based on the second sample. The biomarker comprises a DNA sequence in genome of Lactobacillus salivarius. The treatment may then be evaluated based on the first relative abundances and the second relative abundances calculated for the plurality of subjects.
- According to an embodiment of the present disclosure, a biomarker for evaluating a treatment regarding a disease, e.g. RA, comprises a DNA sequence in a genome of Lactobacillus salivarius. According to various embodiments of the present disclosure, the biomarker for evaluating a treatment regarding a disease, e.g. RA, may comprise at least a partial sequence of SEQ ID NO: 1 to 593; SEQ ID NO: 594 to 1536; or SEQ ID NO: 1537 to 2594, as stated in Table 2-2. The sequence listing submitted herewith includes nucleotide and/or amino acid sequences corresponding to the above mentioned SEQ IDs.
- Although explanatory embodiments have been shown and described, it would be appreciated by those skilled in the art that the above embodiments cannot be construed to limit the present disclosure.
Table 1-1. Samples used for gene catalog construction Group case control total number Samples used for catalog construction fecal samples 115 (including 21 from DMARD-treated patients) 97 212 dental plaques samples 54 51 105 saliva samples 51(including 4 from DMARD-treated patients) 47 98 Table 1-2. Sample information of training sets (chosen from samples used for gene catalog construction in Table 1-1) Group case control total number Training sets fecal samples 77 80 157 dental plaques samples 50 50 100 saliva samples 47 47 94 Table 1-3 Sample information of test sets Group case control total number Test sets fecal samples 17 17 34 fecal samples 40(DMARD-treated patients) -- 40 dental plaques samples 37(DMARD-treated patients) -- 37 saliva samples 24(DMARD-treated patients) -- 24 Table 2-1 fecal, dental and salivary MLGs gut MLG dental MLG salivary MLG MLG ID 2169 16600 4643 P-value 1.16E-03 2.13E-04 5.72E-04 Enrichment (1,case; 0,control) 1 1 1 Gene number (>=30) 593 943 1058 Case occurrence 0.44 0.48 0.61 Control occurrence 0.21 0.18 0.28 Abundance mean in all cases 1.40E-07 3.67E-07 1.91E-07 Abundance mean in all controls 8.50E-08 4.79E-09 4.72E-08 Abundance mean in cases that contained the MLG 3.16E-07 7.63E-07 3.14E-07 Abundance mean in controls that contained the MLG 4.00E-07 2.71E-08 1.71E-07 Odds Ratio (95% CI) 1.09 (0.78,1.52) 222562231.41 (0.02,2859615161906952192) 1.93 (0.73,5.07) MLG annotation (95% identity for species, 85% identity for genus) Lactobacillus sp. Lactobacillus salivarius Lactobacillus salivarius Possible strain 1Lactobacillus salivarius CECT 5713 Lactobacillus salivarius CECT 5713 Lactobacillus salivarius CECT 5713 # genes annotated to strain (65% identity) 504 897 988 Fraction genes annotated to strain 0.850 0.951 0.934 Average identity (%) 98.78 99.81 99.81 Possible strain 2Lactobacillus salivarius ACS-116-V-Col5a Lactobacillus salivarius UCC118 Lactobacillus salivarius ACS-116-V-Col5a # genes annotated to strain (65% identity) 499 750 818 Fraction genes annotated to strain 0.841 0.795 0.773 Average identity (%) 98.69 98.92 98.99 Possible strain 3Lactobacillus salivarius HO66, ATCC 11741 Lactobacillus salivarius ACS-116-V-Col5a Lactobacillus salivarius UCC118 # genes annotated to strain (65% identity) 490 741 809 Fraction genes annotated to strain 0.826 0.786 0.765 Average identity (%) 98.64 98.98 98.97 Table 2-2 SEQ ID of the fecal dental and salivary MLGs MLG ID SEQ ID NO: gene number mlg_id:2169 1∼593 593 mlg_id:16600 594∼1536 943 mlg_id:4643 1537∼2594 1058 Table 3 Statistics of the Lactobacillus sp. assemblies. Assembly scaftigs Total length (bp) gaps Average length (bp) N50 (bp) N90 (bp) Max (bp) Min (bp) GC content (%) Before 42 1916673 NA 45635.07 109309 24416 332613 622 32.59 Loop 1 46 1929732 333 41950.7 109513 24424 327455 225 32.62 Loop 2 48 1960062 707 40834.6 109613 24415 660567 203 32.66 Corrected 46 1929666 0 41949.3 109513 24424 327432 225 32.62 Table 4 Relative abundances of Lactobacillus salivarius MLGs in fecal, dental and salivary samples Relative abundances in fecal samples Relative abundances in dental samples Relative abundances in salivary samples fecal - Sample Abundance(1g10) DAS28 Dental-Sample Abundance(1g10) DAS28 Saliva-Sample Abundance(1g10) DAS28 D98 -9 7.79868052 D100 -9 3.42175802 D100 -9 3.421758017 D93 -6.611867753 7.6226307 D102 -9 4.8480466 D104 -5.453765687 8.529890674 D90 -6.191158497 3.96041196 D104 -6.040186126 8.52989067 D108 -6.806143016 8.473621894 D86 -8.057385587 6.92415126 D108 -7.980872312 8.47362189 D113 -9 4.729856872 D82 -9 7.13190469 D113 -9 4.72985687 D114 -9 6.853552298 D80 -9 6.76503311 D114 -9 6.8535523 D117 -9 7.920189059 D79 -9 4.0279844 D117 -9 7.92018906 D118 -6.042913878 5.312956797 D77 -7.366135759 6.39025936 D118 -6.934469737 5.3129568 D121 -9 6.642354428 D73 -6.383737346 8.40886812 D121 -9 6.64235443 D122 -6.91342831 7.996274077 D69 -9 5.37571817 D122 -8.016378923 7.99627408 D124 -9 6.340241035 D64 -9 5.54410235 D124 -9 6.34024104 D126 -8.389174221 5.713773541 D60 -7.445724768 3.97640265 D126 -8.948624905 5.71377354 D130 -7.289872807 5.123969264 D57 -7.796649862 8.19776002 D130 -7.319871381 5.12396926 D132 -6.917376771 6.888682261 D55 -6.528149782 6.18476371 D132 -7.914671086 6.88868226 D133 -6.112482915 6.330335876 D53 -7.734095793 6.94704402 D144 -8.481614523 7.94002895 D135 -9 6.155991353 D44 -6.382198292 5.50022386 D145 -7.353369588 5.33562662 D144 -7.761404179 7.940028946 D41 -6.133536313 8.01285296 D147 -4.810120267 6.54878405 D145 -6.463645065 5.335626622 D33 -9 8.46060172 D15 -9 7.0018003 D147 -5.698438864 6.548784045 D31 -9 5.31457462 D150 -9 7.42699601 D15 -7.613225033 7.001800303 D29 -9 5.07110729 D157 -8.403261181 5.77013589 D150 -9 7.426996005 D264 -7.876604295 7.68636877 D158 -6.48957812 7.3559855 D158 -8.036378515 7.3559855 D255 -9 3.35880461 D166 -9 4.68402861 D166 -9 4.684028613 D246 -9 5.50895943 D172 -9 6.56338253 D172 -9 6.56338253 D235 -9 5.36245034 D177 -8.062208673 4.11058331 D173 -9 4.753267564 D226 -9 3.75826991 D178 -9 5.89379791 D177 -7.764858329 4.110583305 D225 -9 5.26730818 D179 -7.377381185 5.45372598 D178 -9 5.893797906 D220 -8.256023129 8.19234 D182 -9 7.6346388 D179 -6.666584727 5.453725981 D219 -9 4.33281686 D185 -7.268685456 4.82480113 D182 -7.495572436 7.634638802 D218 -9 4.9372116 D188 -9 6.83496525 D185 -7.098613687 4.824801134 D216 -8.891583288 6.59381524 D190 -8.76674422 5.2882132 D188 -8.143731806 6.834965253 D213 -9 4.25625778 D23 -9 7.36348085 D190 -8.742451499 5.288213199 D212 -9 4.89075966 D25 -9 6.85099036 D25 -9 6.850990358 D210 -8.979008268 7.00624114 D29 -9 5.07110729 D41 -6.853197457 8.01285296 D209 -9 4.31299239 D31 -9 5.31457462 D43 -6.797317376 6.197520423 D208 -6.483913355 5.745 D33 -9 8.46060172 D44 -6.910799717 5.500223864 D206 -9 7.25794987 D41 -5.796743841 8.01285296 D51 -9 6.847803418 D205 -9 7.6508574 D43 -8.428210194 6.19752042 D53 -7.390874351 6.947044019 D204 -9 4.1459103 D51 -9 6.84780342 D57 -6.60695896 8.197760021 D202 -9 7.63088447 D53 -8.198886903 6.94704402 D60 -7.791470779 3.976402649 D201 -5.283022546 4.78379104 D55 -6.129609376 6.18476371 D62 -7.180662842 5.942224198 D197 -9 5.04328483 D57 -6.738165176 8.19776002 D69 -9 5.375718166 D196 -9 5.45729602 D60 -9 3.97640265 D73 -6.556695801 8.408868116 D195 -7.523916323 5.88705343 D62 -8.039281704 5.9422242 D82 -9 7.131904686 D194 -9 5.07491254 D69 -9 5.37571817 D86 -6.868622111 6.924151262 D191 -6.376571261 5.96637345 D73 -7.012094288 8.40886812 D8_N -9 5.073854483 D190 -8.662513207 5.2882132 D77 -6.835456013 6.39025936 D9 -7.736997083 8.574788032 D188 -8.169182242 6.83496525 D79 -9 4.0279844 D90 -8.720697158 3.960411962 D187 -8.31142368 8.59106614 D82 -9 7.13190469 D93 -6.901748442 7.6226307 D185 -7.45074993 4.82480113 D86 -7.974661284 6.92415126 D94 -9 5.82920269 D184 -9 3.58951489 D89 -9 5.377 D98 -9 7.798680516 D179 -6.478104047 5.45372598 D8_N -9 5.07385448 D99 -9 8.242071089 D178 -9 5.89379791 D9 -8.822539013 8.57478803 D177 -8.36954905 4.11058331 D90 -9 3.96041196 D174 -8.450552033 6.58470347 D94 -9 5.82920269 D173 -9 4.75326756 D169 -7.394270982 7.01915442 D168 -8.77581245 6.38421883 D166 -9 4.68402861 D163 -9 4.9850232 D159 -8.762169575 6.28026633 D158 -9 7.3559855 D157 -9 5.77013589 D153 -9 6.21962859 D141 -9 6.49456205 D138 -8.908362017 7.33999124 D135 -8.697956283 6.15599135 D134 -9 4.75253438 D133 -7.661497584 6.33033588 D132 -9 6.88868226 D121 -9 6.64235443 D118 -5.847384965 5.3129568 D114 -9 6.8535523 D113 -9 4.72985687 D108 -9 8.47362189 D102 -9 4.8480466 D100 -9 3.42175802 Table 5 Spearman's correlation and best matched strain for Lactobacillus salivarius-like MLGs from the gut and oral sites. (Strain information as in Table 2-1.) Species of interest L. salivarius MLG ID gut 2169 saliva 4643 saliva 4643 MLG ID dental 16600 dental 16600 gut 2169 Spearman's cc 0.5634221 0.8238949 0.7096382 p-value 4.65E-07 3.51E-18 8.73E-12 MLG ID gut 2169 saliva 4643 saliva 4643 # genes 593 1058 1058 Possible strain 1 Lactobacillus salivarius CECT 5713 Lactobacillus salivarius CECT 5713 Lactobacillus salivarius CECT 5713 Genes annotated to strain (65% identity) 504 988 988 Fraction of genes annotated 0.850 0.934 0.934 Average identity (%) 98.78 99.81 99.81 MLG ID dental 16600 dental 16600 gut 2169 # genes 943 943 593 Possible strain 1 Lactobacillus salivarius CECT 5713 Lactobacillus salivarius CECT 5713 Lactobacillus salivarius CECT 5713 Genes annotated to strain (65% identity) 897 897 504 Fraction of genes annotated 0.951 0.951 0.850 Average identity (%) 99.81 99.81 98.78 Table 6 classification results of fecal, dental and salivary MLGs in the 69 samples classification gut sample dental sample saliva sample combination of 3 sits samples threshold* of MLG relative abundance for classification >1.175e-9 >5.326e-9 >8.095e-10 gut sample>1.175e-9 , dental sample>5.326e-9 and saliva sample>8.095e-10 total number over the threshold 26 17 32 13 RA number in total number 19 16 23 12 probability of RA (RA number/total number) 0.730769231 0.941176471 0.71875 0.923076923 * When MLG relative abundance is larger than the threshold, the person is in risk of RA
Claims (2)
- A method for obtaining a probability of a subject having rheumatoid arthritis, comprising:obtaining sequences of DNA extracted from a sample that has been obtained from the subject;calculating the relative abundance of a biomarker based on the sequences of the DNA, wherein the biomarker comprises a DNA sequence in a genome of Lactobacillus salivarius; andobtaining a probability of the subject having rheumatoid arthritis based on the relative abundance by comparing the relative abundance to a predetermined threshold,wherein the sample comprises at least one of a fecal sample, a dental sample, and a salivary sample andwherein calculating the relative abundance of the biomarker based on the sequences of the DNA comprises:(i) calculating a copy number of each DNA sequence of the biomarker among the sequences of the DNA;(ii) for each DNA sequence of the biomarker that is among the sequences of the DNA, calculating a relative abundance of the DNA sequence based on a ratio between the copy number of the DNA sequence and a summation of the copy numbers of all DNA sequences in the sample; and(iii) calculating the relative abundance of the biomarker based on at least some of the relative abundances of the DNA sequences of the biomarker;wherein the biomarker comprises at least one of the following metagenomic linkage groups (MLGs):MLG corresponding to the fecal sample and consisting of MLG ID NO: 2169;MLG corresponding to the dental sample and consisting of MLG ID NO: 16600; andMLG corresponding to the salivary sample and consisting of MLG ID NO: 4643;wherein:MLG ID NO: 2169 consists of genes having polynucleotide sequences of SEQ ID NOs: 1-593; MLG ID NO: 16600 consists of genes having polynucleotide sequences of SEQ ID NOs: 594-1536; andMLG ID NO: 4643 consists of genes having polynucleotide sequences of SEQ ID NOs: 1537-2594.
- A method for evaluating a treatment for rheumatoid arthritis (RA) or identifying a therapeutic agent therefor, comprising either:(A) for each subject of a plurality of subjects having RA:obtaining first DNA sequences extracted from a first sample that has been obtained from the subject before receiving the treatment,calculating a first relative abundance of a biomarker based on the first DNA sequences,wherein the biomarker comprises a DNA sequence in a genome of Lactobacillus salivarius,obtaining second DNA sequences extracted from a second sample that has been obtained from the subject after receiving the treatment, andcalculating a second relative abundance of the biomarker based on the second DNA sequences; andevaluating the treatment based on the first relative abundances and the second relative abundances calculated for the plurality of subjects by comparing the relative abundancebefore and after the treatment,
wherein said first and second samples are of the same type and each comprises at least one of a fecal sample, a dental sample, and a salivary sample, andwherein calculating the first relative abundance or the second relative abundance of the biomarker based on the sequences of the DNA comprises:(i) calculating a copy number of each DNA sequence of the biomarker among the sequences of the DNA;(ii) for each DNA sequence of the biomarker that is among the sequences of the DNA, calculating a relative abundance of the DNA sequence based on a ratio between the copy number of the DNA sequence and a summation of the copy numbers of all DNA sequences in the sample; and(iii) calculating the relative abundance of the biomarker based on at least some of the relative abundances of the DNA sequences of the biomarker;wherein the biomarker comprises at least one of the following MLGs:MLG consisting of MLG ID NO: 2169;MLG consisting of MLG ID NO: 16600; andMLG consisting of MLG ID NO: 4643.wherein:MLG ID NO: 2169 consists of genes having polynucleotide sequences of SEQ ID NOs: 1-593;MLG ID NO: 16600 consists of genes having polynucleotide sequences of SEQ ID NOs: 594-1536; andMLG ID NO: 4643 consists of genes having polynucleotide sequences of SEQ ID NOs: 1537-2594.or(B) for each subject of a plurality of subjects having RA:obtaining sequences of DNA extracted from a sample that has been obtained from the subject after receiving the treatment, andcalculating a relative abundance of a biomarker based on the sequences of the DNA,wherein the biomarker comprises a DNA sequence in a genome of Lactobacillus salivarius; andevaluating the treatment based on the relative abundances calculated for the plurality of subjects by comparing the relative abundance to a predetermined threshold,wherein the sample comprises at least one of a fecal sample, a dental sample, and a salivary sample, andwherein calculating the relative abundance of the biomarker based on the sequences of the DNA comprises:(i) calculating a copy number of each DNA sequence of the biomarker among the sequences of the DNA;(ii) for each DNA sequence of the biomarker that is among the sequences of the DNA, calculating a relative abundance of the DNA sequence based on a ratio between the copy number of the DNA sequence and a summation of the copy numbers of all DNA sequences in the sample; and(iii) calculating the relative abundance of the biomarker based on at least some of the relative abundances of the DNA sequences of the biomarker;wherein the biomarker comprises at least one of the following MLGs:MLG consisting of MLG ID NO: 2169;MLG consisting of MLG ID NO: 16600; andMLG consisting of MLG ID NO: 4643;wherein:MLG ID NO: 2169 consists of genes having polynucleotide sequences of SEQ ID NOs: 1-593; MLG ID NO: 16600 consists of genes having polynucleotide sequences of SEQ ID NOs: 594-1536; andMLG ID NO: 4643 consists of genes having polynucleotide sequences of SEQ ID NOs: 1537-2594.
Applications Claiming Priority (4)
| Application Number | Priority Date | Filing Date | Title |
|---|---|---|---|
| PCT/CN2014/088068 WO2016049936A1 (en) | 2014-09-30 | 2014-09-30 | Biomarkers for rheumatoid arthritis and usage therof |
| PCT/CN2014/088060 WO2016049930A1 (en) | 2014-09-30 | 2014-09-30 | Biomarkers for rheumatoid arthritis and usage therof |
| PCT/CN2014/088069 WO2016049937A1 (en) | 2014-09-30 | 2014-09-30 | Biomarkers for rheumatoid arthritis and usage therof |
| PCT/CN2015/083488 WO2016050110A1 (en) | 2014-09-30 | 2015-07-07 | Biomarkers for rheumatoid arthritis and usage thereof |
Publications (3)
| Publication Number | Publication Date |
|---|---|
| EP3201317A4 EP3201317A4 (en) | 2017-08-09 |
| EP3201317A1 EP3201317A1 (en) | 2017-08-09 |
| EP3201317B1 true EP3201317B1 (en) | 2019-12-11 |
Family
ID=55629412
Family Applications (1)
| Application Number | Title | Priority Date | Filing Date |
|---|---|---|---|
| EP15847187.0A Active EP3201317B1 (en) | 2014-09-30 | 2015-07-07 | Biomarkers for rheumatoid arthritis and usage thereof |
Country Status (10)
| Country | Link |
|---|---|
| US (1) | US10883146B2 (en) |
| EP (1) | EP3201317B1 (en) |
| JP (1) | JP6485843B2 (en) |
| KR (1) | KR101986442B1 (en) |
| CN (2) | CN108064272B (en) |
| AU (1) | AU2015327511B2 (en) |
| CA (1) | CA2963013C (en) |
| DK (1) | DK3201317T3 (en) |
| RU (1) | RU2691375C2 (en) |
| WO (2) | WO2016050110A1 (en) |
Families Citing this family (9)
| Publication number | Priority date | Publication date | Assignee | Title |
|---|---|---|---|---|
| US11514289B1 (en) | 2016-03-09 | 2022-11-29 | Freenome Holdings, Inc. | Generating machine learning models using genetic data |
| CN111051532B (en) * | 2017-10-12 | 2023-06-09 | 完美(中国)有限公司 | Biomarker for chronic hepatitis B and application thereof |
| CN108034708B (en) * | 2017-12-14 | 2020-05-22 | 中国中医科学院中药研究所 | A system for determining the individual efficacy of tripterygium glycosides in the treatment of rheumatoid arthritis by the expression of multiple mRNAs |
| CN109065168B (en) * | 2018-08-29 | 2021-09-14 | 昆明理工大学 | Method for evaluating disease risk based on spatio-temporal clustering statistics |
| CN111161794B (en) * | 2018-12-30 | 2024-03-22 | 深圳碳云智能数字生命健康管理有限公司 | Intestinal microorganism sequencing data processing method, device, storage medium and processor |
| CN111161795A (en) * | 2019-01-15 | 2020-05-15 | 深圳碳云智能数字生命健康管理有限公司 | Intestinal microbial sequencing data processing method, device, storage medium and processor |
| JP2021010343A (en) * | 2019-07-08 | 2021-02-04 | 三菱ケミカル株式会社 | How to predict health condition by oral bacteria |
| CN113488107B (en) * | 2021-07-07 | 2022-07-19 | 广州华银康医疗集团股份有限公司 | Method, apparatus and storage medium for screening immunohistochemical library sequencing biomarkers |
| CN114369671A (en) * | 2021-11-25 | 2022-04-19 | 上海锐翌生物科技有限公司 | Marker microorganism for rheumatic arthritis and application thereof |
Family Cites Families (8)
| Publication number | Priority date | Publication date | Assignee | Title |
|---|---|---|---|---|
| PE20030274A1 (en) * | 2001-07-26 | 2003-05-08 | Alimentary Health Ltd | LACTOBACILLUS SALIVARIUS STRAINS |
| RU2362808C1 (en) * | 2008-02-13 | 2009-07-27 | Государственное образовательное учреждение дополнительного профессионального образования Российская медицинская академия последипломного образования Федерального агентства по здравоохранению и социальному развитию (ГОУ ДПО РМАПО Росздрава) | Way of diagnostics of microbiota disbalance of various human biotopes and degree of its expression |
| CN101886132B (en) * | 2009-07-15 | 2013-09-18 | 北京百迈客生物科技有限公司 | Method for screening molecular markers correlative with properties based on sequencing technique and BSA (Bulked Segregant Analysis) technique |
| CN101921748B (en) * | 2010-06-30 | 2012-11-14 | 上海华大基因科技有限公司 | DNA molecular label for high-throughput detection of human papilloma virus |
| JP6338530B2 (en) * | 2011-11-10 | 2018-06-06 | ジェネンテック, インコーポレイテッド | Methods for treating, diagnosing, and monitoring Alzheimer's disease |
| JP5863035B2 (en) | 2012-03-07 | 2016-02-16 | 国立大学法人 東京大学 | Method for detecting inflammatory bowel disease and method for examining human salivary bacterial flora |
| WO2014019180A1 (en) * | 2012-08-01 | 2014-02-06 | 深圳华大基因研究院 | Method and system for determining biomarker in abnormal state |
| WO2014019271A1 (en) * | 2012-08-01 | 2014-02-06 | Bgi Shenzhen | Biomarkers for diabetes and usages thereof |
-
2015
- 2015-07-07 DK DK15847187.0T patent/DK3201317T3/en active
- 2015-07-07 CN CN201580053212.9A patent/CN108064272B/en active Active
- 2015-07-07 US US15/515,367 patent/US10883146B2/en active Active
- 2015-07-07 WO PCT/CN2015/083488 patent/WO2016050110A1/en not_active Ceased
- 2015-07-07 EP EP15847187.0A patent/EP3201317B1/en active Active
- 2015-07-07 CN CN201580053213.3A patent/CN108064263B/en active Active
- 2015-07-07 WO PCT/CN2015/083490 patent/WO2016050111A1/en not_active Ceased
- 2015-07-07 AU AU2015327511A patent/AU2015327511B2/en active Active
- 2015-07-07 RU RU2017115001A patent/RU2691375C2/en active
- 2015-07-07 KR KR1020177011630A patent/KR101986442B1/en active Active
- 2015-07-07 CA CA2963013A patent/CA2963013C/en active Active
- 2015-07-07 JP JP2017518141A patent/JP6485843B2/en active Active
Non-Patent Citations (1)
| Title |
|---|
| None * |
Also Published As
| Publication number | Publication date |
|---|---|
| CN108064263A (en) | 2018-05-22 |
| CN108064272B (en) | 2021-07-09 |
| CN108064272A (en) | 2018-05-22 |
| HK1248764A1 (en) | 2018-10-19 |
| WO2016050111A1 (en) | 2016-04-07 |
| JP2017530708A (en) | 2017-10-19 |
| US20170226565A1 (en) | 2017-08-10 |
| CN108064263B (en) | 2022-04-26 |
| DK3201317T3 (en) | 2020-01-20 |
| EP3201317A4 (en) | 2017-08-09 |
| RU2691375C2 (en) | 2019-06-11 |
| KR20170063879A (en) | 2017-06-08 |
| HK1248753A1 (en) | 2018-10-19 |
| CA2963013C (en) | 2022-10-04 |
| EP3201317A1 (en) | 2017-08-09 |
| AU2015327511A1 (en) | 2017-04-20 |
| RU2017115001A (en) | 2018-11-05 |
| JP6485843B2 (en) | 2019-03-20 |
| WO2016050110A1 (en) | 2016-04-07 |
| AU2015327511B2 (en) | 2018-12-06 |
| US10883146B2 (en) | 2021-01-05 |
| KR101986442B1 (en) | 2019-06-05 |
| RU2017115001A3 (en) | 2018-11-05 |
| CA2963013A1 (en) | 2016-04-07 |
Similar Documents
| Publication | Publication Date | Title |
|---|---|---|
| US10883146B2 (en) | Biomarkers for rheumatoid arthritis and usage thereof | |
| Kassem et al. | Merkel cell polyomavirus sequences are frequently detected in nonmelanoma skin cancer of immunosuppressed patients | |
| Gerasimidis et al. | The effect of DNA extraction methodology on gut microbiota research applications | |
| US9421233B2 (en) | Fungal mycobiome as probiotics, diagnostics and therapeutics | |
| Martin et al. | The impact of Helicobacter pylori infection on the gastric microbiota of the rhesus macaque | |
| WO2014019271A1 (en) | Biomarkers for diabetes and usages thereof | |
| WO2017152137A2 (en) | Microbial consortium and uses thereof | |
| CN107208149B (en) | Biomarkers for colorectal cancer-related diseases | |
| US10793911B2 (en) | Host DNA as a biomarker of Crohn's disease | |
| KR20230160233A (en) | Biological markers of intestinal dysbiosis useful in predicting response of cancer patients to anti-PD1 drugs | |
| Folkvardsen et al. | A major Mycobacterium tuberculosis outbreak caused by one specific genotype in a low-incidence country: exploring gene profile virulence explanations | |
| CN119242782B (en) | Biomarker for diagnosing hypertension of children, kit and application thereof | |
| WO2019115755A1 (en) | A new inflammation associated, low cell count enterotype | |
| Banu et al. | Molecular epidemiology of tuberculosis in rural Matlab, Bangladesh | |
| US11898210B2 (en) | Tools for assessing FimH blockers therapeutic efficiency | |
| Kim et al. | In-depth metataxonomic investigation reveals low richness, high intervariability, and diverse phylotype candidates of archaea in the human urogenital tract | |
| EP3775281B1 (en) | Methods for predicting the risk of developing pulmonary colonization/infection by pseudomonas aeruginosa | |
| Sutera et al. | Genomic trajectories to fluoroquinolone resistance in Francisella tularensis subsp. holarctica live vaccine strain | |
| EP3250676B1 (en) | Biomarkers for colorectal cancer related diseases | |
| Olsen et al. | Intra-host genomic variation of serologically nontypeable Haemophilus influenzae isolates from otitis media | |
| HK1248753B (en) | Biomarkers for rheumatoid arthritis and usage thereof | |
| WO2020081186A1 (en) | Methods of treating and diagnosing inflammatory bowel disease | |
| WO2025250619A1 (en) | Methods of diagnosing, treating, ameliorating, and/or preventing bacterial vaginosis (bv) | |
| Panaiotov et al. | Complete Genome Sequence, Genome Stability and Phylogeny of the Vaccine Strain Mycobacterium bovis BCG SL222 Sofia. Vaccines 2021, 9, 237 | |
| Winglee | Genomic insights into Mycobacterium tuberculosis and its interaction with the microbiota |
Legal Events
| Date | Code | Title | Description |
|---|---|---|---|
| STAA | Information on the status of an ep patent application or granted ep patent |
Free format text: STATUS: THE INTERNATIONAL PUBLICATION HAS BEEN MADE |
|
| PUAI | Public reference made under article 153(3) epc to a published international application that has entered the european phase |
Free format text: ORIGINAL CODE: 0009012 |
|
| STAA | Information on the status of an ep patent application or granted ep patent |
Free format text: STATUS: REQUEST FOR EXAMINATION WAS MADE |
|
| 17P | Request for examination filed |
Effective date: 20170410 |
|
| A4 | Supplementary search report drawn up and despatched |
Effective date: 20170707 |
|
| AK | Designated contracting states |
Kind code of ref document: A1 Designated state(s): AL AT BE BG CH CY CZ DE DK EE ES FI FR GB GR HR HU IE IS IT LI LT LU LV MC MK MT NL NO PL PT RO RS SE SI SK SM TR |
|
| AX | Request for extension of the european patent |
Extension state: BA ME |
|
| DAV | Request for validation of the european patent (deleted) | ||
| DAX | Request for extension of the european patent (deleted) | ||
| STAA | Information on the status of an ep patent application or granted ep patent |
Free format text: STATUS: EXAMINATION IS IN PROGRESS |
|
| 17Q | First examination report despatched |
Effective date: 20180413 |
|
| REG | Reference to a national code |
Ref country code: DE Ref legal event code: R079 Ref document number: 602015043621 Country of ref document: DE Free format text: PREVIOUS MAIN CLASS: C12N0001200000 Ipc: A61K0035747000 |
|
| RIC1 | Information provided on ipc code assigned before grant |
Ipc: C07K 14/335 20060101ALI20190502BHEP Ipc: A61K 35/747 20150101AFI20190502BHEP Ipc: C12Q 1/6883 20180101ALI20190502BHEP |
|
| GRAP | Despatch of communication of intention to grant a patent |
Free format text: ORIGINAL CODE: EPIDOSNIGR1 |
|
| STAA | Information on the status of an ep patent application or granted ep patent |
Free format text: STATUS: GRANT OF PATENT IS INTENDED |
|
| INTG | Intention to grant announced |
Effective date: 20190705 |
|
| GRAS | Grant fee paid |
Free format text: ORIGINAL CODE: EPIDOSNIGR3 |
|
| GRAA | (expected) grant |
Free format text: ORIGINAL CODE: 0009210 |
|
| STAA | Information on the status of an ep patent application or granted ep patent |
Free format text: STATUS: THE PATENT HAS BEEN GRANTED |
|
| AK | Designated contracting states |
Kind code of ref document: B1 Designated state(s): AL AT BE BG CH CY CZ DE DK EE ES FI FR GB GR HR HU IE IS IT LI LT LU LV MC MK MT NL NO PL PT RO RS SE SI SK SM TR |
|
| REG | Reference to a national code |
Ref country code: GB Ref legal event code: FG4D |
|
| REG | Reference to a national code |
Ref country code: CH Ref legal event code: EP |
|
| REG | Reference to a national code |
Ref country code: AT Ref legal event code: REF Ref document number: 1211492 Country of ref document: AT Kind code of ref document: T Effective date: 20191215 |
|
| REG | Reference to a national code |
Ref country code: DE Ref legal event code: R096 Ref document number: 602015043621 Country of ref document: DE |
|
| REG | Reference to a national code |
Ref country code: FI Ref legal event code: FGE |
|
| REG | Reference to a national code |
Ref country code: IE Ref legal event code: FG4D |
|
| REG | Reference to a national code |
Ref country code: DK Ref legal event code: T3 Effective date: 20200116 |
|
| REG | Reference to a national code |
Ref country code: SE Ref legal event code: TRGR |
|
| REG | Reference to a national code |
Ref country code: NL Ref legal event code: MP Effective date: 20191211 |
|
| REG | Reference to a national code |
Ref country code: LT Ref legal event code: MG4D |
|
| PG25 | Lapsed in a contracting state [announced via postgrant information from national office to epo] |
Ref country code: NO Free format text: LAPSE BECAUSE OF FAILURE TO SUBMIT A TRANSLATION OF THE DESCRIPTION OR TO PAY THE FEE WITHIN THE PRESCRIBED TIME-LIMIT Effective date: 20200311 Ref country code: LT Free format text: LAPSE BECAUSE OF FAILURE TO SUBMIT A TRANSLATION OF THE DESCRIPTION OR TO PAY THE FEE WITHIN THE PRESCRIBED TIME-LIMIT Effective date: 20191211 Ref country code: BG Free format text: LAPSE BECAUSE OF FAILURE TO SUBMIT A TRANSLATION OF THE DESCRIPTION OR TO PAY THE FEE WITHIN THE PRESCRIBED TIME-LIMIT Effective date: 20200311 Ref country code: LV Free format text: LAPSE BECAUSE OF FAILURE TO SUBMIT A TRANSLATION OF THE DESCRIPTION OR TO PAY THE FEE WITHIN THE PRESCRIBED TIME-LIMIT Effective date: 20191211 Ref country code: GR Free format text: LAPSE BECAUSE OF FAILURE TO SUBMIT A TRANSLATION OF THE DESCRIPTION OR TO PAY THE FEE WITHIN THE PRESCRIBED TIME-LIMIT Effective date: 20200312 |
|
| PG25 | Lapsed in a contracting state [announced via postgrant information from national office to epo] |
Ref country code: HR Free format text: LAPSE BECAUSE OF FAILURE TO SUBMIT A TRANSLATION OF THE DESCRIPTION OR TO PAY THE FEE WITHIN THE PRESCRIBED TIME-LIMIT Effective date: 20191211 Ref country code: RS Free format text: LAPSE BECAUSE OF FAILURE TO SUBMIT A TRANSLATION OF THE DESCRIPTION OR TO PAY THE FEE WITHIN THE PRESCRIBED TIME-LIMIT Effective date: 20191211 |
|
| PG25 | Lapsed in a contracting state [announced via postgrant information from national office to epo] |
Ref country code: AL Free format text: LAPSE BECAUSE OF FAILURE TO SUBMIT A TRANSLATION OF THE DESCRIPTION OR TO PAY THE FEE WITHIN THE PRESCRIBED TIME-LIMIT Effective date: 20191211 |
|
| PG25 | Lapsed in a contracting state [announced via postgrant information from national office to epo] |
Ref country code: RO Free format text: LAPSE BECAUSE OF FAILURE TO SUBMIT A TRANSLATION OF THE DESCRIPTION OR TO PAY THE FEE WITHIN THE PRESCRIBED TIME-LIMIT Effective date: 20191211 Ref country code: NL Free format text: LAPSE BECAUSE OF FAILURE TO SUBMIT A TRANSLATION OF THE DESCRIPTION OR TO PAY THE FEE WITHIN THE PRESCRIBED TIME-LIMIT Effective date: 20191211 Ref country code: ES Free format text: LAPSE BECAUSE OF FAILURE TO SUBMIT A TRANSLATION OF THE DESCRIPTION OR TO PAY THE FEE WITHIN THE PRESCRIBED TIME-LIMIT Effective date: 20191211 Ref country code: PT Free format text: LAPSE BECAUSE OF FAILURE TO SUBMIT A TRANSLATION OF THE DESCRIPTION OR TO PAY THE FEE WITHIN THE PRESCRIBED TIME-LIMIT Effective date: 20200506 Ref country code: EE Free format text: LAPSE BECAUSE OF FAILURE TO SUBMIT A TRANSLATION OF THE DESCRIPTION OR TO PAY THE FEE WITHIN THE PRESCRIBED TIME-LIMIT Effective date: 20191211 |
|
| PG25 | Lapsed in a contracting state [announced via postgrant information from national office to epo] |
Ref country code: IS Free format text: LAPSE BECAUSE OF FAILURE TO SUBMIT A TRANSLATION OF THE DESCRIPTION OR TO PAY THE FEE WITHIN THE PRESCRIBED TIME-LIMIT Effective date: 20200411 Ref country code: SM Free format text: LAPSE BECAUSE OF FAILURE TO SUBMIT A TRANSLATION OF THE DESCRIPTION OR TO PAY THE FEE WITHIN THE PRESCRIBED TIME-LIMIT Effective date: 20191211 Ref country code: SK Free format text: LAPSE BECAUSE OF FAILURE TO SUBMIT A TRANSLATION OF THE DESCRIPTION OR TO PAY THE FEE WITHIN THE PRESCRIBED TIME-LIMIT Effective date: 20191211 |
|
| REG | Reference to a national code |
Ref country code: DE Ref legal event code: R097 Ref document number: 602015043621 Country of ref document: DE |
|
| REG | Reference to a national code |
Ref country code: AT Ref legal event code: MK05 Ref document number: 1211492 Country of ref document: AT Kind code of ref document: T Effective date: 20191211 |
|
| PLBE | No opposition filed within time limit |
Free format text: ORIGINAL CODE: 0009261 |
|
| STAA | Information on the status of an ep patent application or granted ep patent |
Free format text: STATUS: NO OPPOSITION FILED WITHIN TIME LIMIT |
|
| 26N | No opposition filed |
Effective date: 20200914 |
|
| PG25 | Lapsed in a contracting state [announced via postgrant information from national office to epo] |
Ref country code: AT Free format text: LAPSE BECAUSE OF FAILURE TO SUBMIT A TRANSLATION OF THE DESCRIPTION OR TO PAY THE FEE WITHIN THE PRESCRIBED TIME-LIMIT Effective date: 20191211 Ref country code: SI Free format text: LAPSE BECAUSE OF FAILURE TO SUBMIT A TRANSLATION OF THE DESCRIPTION OR TO PAY THE FEE WITHIN THE PRESCRIBED TIME-LIMIT Effective date: 20191211 |
|
| PG25 | Lapsed in a contracting state [announced via postgrant information from national office to epo] |
Ref country code: IT Free format text: LAPSE BECAUSE OF FAILURE TO SUBMIT A TRANSLATION OF THE DESCRIPTION OR TO PAY THE FEE WITHIN THE PRESCRIBED TIME-LIMIT Effective date: 20191211 |
|
| PG25 | Lapsed in a contracting state [announced via postgrant information from national office to epo] |
Ref country code: PL Free format text: LAPSE BECAUSE OF FAILURE TO SUBMIT A TRANSLATION OF THE DESCRIPTION OR TO PAY THE FEE WITHIN THE PRESCRIBED TIME-LIMIT Effective date: 20191211 Ref country code: MC Free format text: LAPSE BECAUSE OF FAILURE TO SUBMIT A TRANSLATION OF THE DESCRIPTION OR TO PAY THE FEE WITHIN THE PRESCRIBED TIME-LIMIT Effective date: 20191211 |
|
| REG | Reference to a national code |
Ref country code: CH Ref legal event code: PL |
|
| REG | Reference to a national code |
Ref country code: BE Ref legal event code: MM Effective date: 20200731 |
|
| PG25 | Lapsed in a contracting state [announced via postgrant information from national office to epo] |
Ref country code: CH Free format text: LAPSE BECAUSE OF NON-PAYMENT OF DUE FEES Effective date: 20200731 Ref country code: IE Free format text: LAPSE BECAUSE OF NON-PAYMENT OF DUE FEES Effective date: 20200707 Ref country code: FR Free format text: LAPSE BECAUSE OF NON-PAYMENT OF DUE FEES Effective date: 20200731 Ref country code: LU Free format text: LAPSE BECAUSE OF NON-PAYMENT OF DUE FEES Effective date: 20200707 Ref country code: LI Free format text: LAPSE BECAUSE OF NON-PAYMENT OF DUE FEES Effective date: 20200731 |
|
| PG25 | Lapsed in a contracting state [announced via postgrant information from national office to epo] |
Ref country code: BE Free format text: LAPSE BECAUSE OF NON-PAYMENT OF DUE FEES Effective date: 20200731 |
|
| PG25 | Lapsed in a contracting state [announced via postgrant information from national office to epo] |
Ref country code: TR Free format text: LAPSE BECAUSE OF FAILURE TO SUBMIT A TRANSLATION OF THE DESCRIPTION OR TO PAY THE FEE WITHIN THE PRESCRIBED TIME-LIMIT Effective date: 20191211 Ref country code: MT Free format text: LAPSE BECAUSE OF FAILURE TO SUBMIT A TRANSLATION OF THE DESCRIPTION OR TO PAY THE FEE WITHIN THE PRESCRIBED TIME-LIMIT Effective date: 20191211 Ref country code: CY Free format text: LAPSE BECAUSE OF FAILURE TO SUBMIT A TRANSLATION OF THE DESCRIPTION OR TO PAY THE FEE WITHIN THE PRESCRIBED TIME-LIMIT Effective date: 20191211 |
|
| PG25 | Lapsed in a contracting state [announced via postgrant information from national office to epo] |
Ref country code: MK Free format text: LAPSE BECAUSE OF FAILURE TO SUBMIT A TRANSLATION OF THE DESCRIPTION OR TO PAY THE FEE WITHIN THE PRESCRIBED TIME-LIMIT Effective date: 20191211 |
|
| P01 | Opt-out of the competence of the unified patent court (upc) registered |
Effective date: 20230708 |
|
| PGFP | Annual fee paid to national office [announced via postgrant information from national office to epo] |
Ref country code: FI Payment date: 20250626 Year of fee payment: 11 |
|
| PGFP | Annual fee paid to national office [announced via postgrant information from national office to epo] |
Ref country code: DK Payment date: 20250627 Year of fee payment: 11 |
|
| PGFP | Annual fee paid to national office [announced via postgrant information from national office to epo] |
Ref country code: DE Payment date: 20250711 Year of fee payment: 11 |
|
| PGFP | Annual fee paid to national office [announced via postgrant information from national office to epo] |
Ref country code: GB Payment date: 20250723 Year of fee payment: 11 |
|
| PGFP | Annual fee paid to national office [announced via postgrant information from national office to epo] |
Ref country code: SE Payment date: 20250729 Year of fee payment: 11 |
|
| PGFP | Annual fee paid to national office [announced via postgrant information from national office to epo] |
Ref country code: CZ Payment date: 20250702 Year of fee payment: 11 |