EP3200689B1 - Système médical pour la cartographie de tissus cardiaques - Google Patents
Système médical pour la cartographie de tissus cardiaques Download PDFInfo
- Publication number
- EP3200689B1 EP3200689B1 EP15784203.0A EP15784203A EP3200689B1 EP 3200689 B1 EP3200689 B1 EP 3200689B1 EP 15784203 A EP15784203 A EP 15784203A EP 3200689 B1 EP3200689 B1 EP 3200689B1
- Authority
- EP
- European Patent Office
- Prior art keywords
- signal
- frequency
- derivatives
- time
- electrodes
- Prior art date
- Legal status (The legal status is an assumption and is not a legal conclusion. Google has not performed a legal analysis and makes no representation as to the accuracy of the status listed.)
- Active
Links
- 238000013507 mapping Methods 0.000 title claims description 35
- 210000005003 heart tissue Anatomy 0.000 title description 3
- 230000000694 effects Effects 0.000 claims description 33
- 230000000007 visual effect Effects 0.000 claims description 22
- 238000012545 processing Methods 0.000 description 64
- 238000000034 method Methods 0.000 description 43
- 230000000875 corresponding effect Effects 0.000 description 42
- 210000001519 tissue Anatomy 0.000 description 36
- 238000001228 spectrum Methods 0.000 description 33
- 230000004913 activation Effects 0.000 description 30
- 230000001413 cellular effect Effects 0.000 description 25
- 230000000747 cardiac effect Effects 0.000 description 19
- 238000002679 ablation Methods 0.000 description 18
- 210000003484 anatomy Anatomy 0.000 description 11
- 230000002159 abnormal effect Effects 0.000 description 10
- 239000000523 sample Substances 0.000 description 10
- 230000008859 change Effects 0.000 description 9
- 230000007170 pathology Effects 0.000 description 9
- 238000002560 therapeutic procedure Methods 0.000 description 9
- 230000002107 myocardial effect Effects 0.000 description 8
- 230000001766 physiological effect Effects 0.000 description 8
- 230000002459 sustained effect Effects 0.000 description 7
- 230000001747 exhibiting effect Effects 0.000 description 6
- 206010003658 Atrial Fibrillation Diseases 0.000 description 5
- 230000005284 excitation Effects 0.000 description 5
- 238000005259 measurement Methods 0.000 description 5
- 230000001746 atrial effect Effects 0.000 description 4
- 230000004069 differentiation Effects 0.000 description 4
- 230000009977 dual effect Effects 0.000 description 4
- 238000004519 manufacturing process Methods 0.000 description 4
- 230000008569 process Effects 0.000 description 4
- 238000010317 ablation therapy Methods 0.000 description 3
- 210000005242 cardiac chamber Anatomy 0.000 description 3
- 238000010304 firing Methods 0.000 description 3
- 230000004044 response Effects 0.000 description 3
- 230000003595 spectral effect Effects 0.000 description 3
- 230000001225 therapeutic effect Effects 0.000 description 3
- 230000036982 action potential Effects 0.000 description 2
- 238000004458 analytical method Methods 0.000 description 2
- 238000013459 approach Methods 0.000 description 2
- 206010003119 arrhythmia Diseases 0.000 description 2
- 230000006793 arrhythmia Effects 0.000 description 2
- 230000001419 dependent effect Effects 0.000 description 2
- 238000002405 diagnostic procedure Methods 0.000 description 2
- 238000010586 diagram Methods 0.000 description 2
- 208000037265 diseases, disorders, signs and symptoms Diseases 0.000 description 2
- 230000006870 function Effects 0.000 description 2
- 210000005246 left atrium Anatomy 0.000 description 2
- 210000005240 left ventricle Anatomy 0.000 description 2
- 239000000463 material Substances 0.000 description 2
- 230000001902 propagating effect Effects 0.000 description 2
- 230000033764 rhythmic process Effects 0.000 description 2
- 210000005245 right atrium Anatomy 0.000 description 2
- 210000005241 right ventricle Anatomy 0.000 description 2
- 238000010183 spectrum analysis Methods 0.000 description 2
- 230000002861 ventricular Effects 0.000 description 2
- 230000001464 adherent effect Effects 0.000 description 1
- 238000003491 array Methods 0.000 description 1
- 210000001367 artery Anatomy 0.000 description 1
- 230000009286 beneficial effect Effects 0.000 description 1
- 230000008901 benefit Effects 0.000 description 1
- 210000004204 blood vessel Anatomy 0.000 description 1
- 210000004556 brain Anatomy 0.000 description 1
- 238000004364 calculation method Methods 0.000 description 1
- 239000003086 colorant Substances 0.000 description 1
- 230000008602 contraction Effects 0.000 description 1
- 230000002596 correlated effect Effects 0.000 description 1
- 230000002999 depolarising effect Effects 0.000 description 1
- 238000013461 design Methods 0.000 description 1
- 238000001514 detection method Methods 0.000 description 1
- 238000002001 electrophysiology Methods 0.000 description 1
- 230000007831 electrophysiology Effects 0.000 description 1
- 210000001105 femoral artery Anatomy 0.000 description 1
- 210000003191 femoral vein Anatomy 0.000 description 1
- 210000000232 gallbladder Anatomy 0.000 description 1
- 210000002837 heart atrium Anatomy 0.000 description 1
- 230000000977 initiatory effect Effects 0.000 description 1
- 238000010801 machine learning Methods 0.000 description 1
- 238000012423 maintenance Methods 0.000 description 1
- 229910052751 metal Inorganic materials 0.000 description 1
- 239000002184 metal Substances 0.000 description 1
- 150000002739 metals Chemical class 0.000 description 1
- 238000012986 modification Methods 0.000 description 1
- 230000004048 modification Effects 0.000 description 1
- 210000005036 nerve Anatomy 0.000 description 1
- 230000000926 neurological effect Effects 0.000 description 1
- HLXZNVUGXRDIFK-UHFFFAOYSA-N nickel titanium Chemical compound [Ti].[Ti].[Ti].[Ti].[Ti].[Ti].[Ti].[Ti].[Ti].[Ti].[Ti].[Ni].[Ni].[Ni].[Ni].[Ni].[Ni].[Ni].[Ni].[Ni].[Ni].[Ni].[Ni].[Ni].[Ni] HLXZNVUGXRDIFK-UHFFFAOYSA-N 0.000 description 1
- 229910001000 nickel titanium Inorganic materials 0.000 description 1
- 230000000414 obstructive effect Effects 0.000 description 1
- 229920000642 polymer Polymers 0.000 description 1
- 238000000926 separation method Methods 0.000 description 1
- 229920002379 silicone rubber Polymers 0.000 description 1
- 239000004945 silicone rubber Substances 0.000 description 1
- 230000003068 static effect Effects 0.000 description 1
- 238000012066 statistical methodology Methods 0.000 description 1
- 230000000638 stimulation Effects 0.000 description 1
- 230000009897 systematic effect Effects 0.000 description 1
- 238000002626 targeted therapy Methods 0.000 description 1
- 210000004291 uterus Anatomy 0.000 description 1
- 210000003462 vein Anatomy 0.000 description 1
- 238000012800 visualization Methods 0.000 description 1
Images


Classifications
-
- A—HUMAN NECESSITIES
- A61—MEDICAL OR VETERINARY SCIENCE; HYGIENE
- A61B—DIAGNOSIS; SURGERY; IDENTIFICATION
- A61B5/00—Measuring for diagnostic purposes; Identification of persons
- A61B5/72—Signal processing specially adapted for physiological signals or for diagnostic purposes
- A61B5/7235—Details of waveform analysis
- A61B5/725—Details of waveform analysis using specific filters therefor, e.g. Kalman or adaptive filters
-
- A—HUMAN NECESSITIES
- A61—MEDICAL OR VETERINARY SCIENCE; HYGIENE
- A61B—DIAGNOSIS; SURGERY; IDENTIFICATION
- A61B5/00—Measuring for diagnostic purposes; Identification of persons
- A61B5/02—Detecting, measuring or recording pulse, heart rate, blood pressure or blood flow; Combined pulse/heart-rate/blood pressure determination; Evaluating a cardiovascular condition not otherwise provided for, e.g. using combinations of techniques provided for in this group with electrocardiography or electroauscultation; Heart catheters for measuring blood pressure
- A61B5/024—Detecting, measuring or recording pulse rate or heart rate
- A61B5/0245—Detecting, measuring or recording pulse rate or heart rate by using sensing means generating electric signals, i.e. ECG signals
-
- A—HUMAN NECESSITIES
- A61—MEDICAL OR VETERINARY SCIENCE; HYGIENE
- A61B—DIAGNOSIS; SURGERY; IDENTIFICATION
- A61B5/00—Measuring for diagnostic purposes; Identification of persons
- A61B5/24—Detecting, measuring or recording bioelectric or biomagnetic signals of the body or parts thereof
- A61B5/25—Bioelectric electrodes therefor
- A61B5/279—Bioelectric electrodes therefor specially adapted for particular uses
- A61B5/28—Bioelectric electrodes therefor specially adapted for particular uses for electrocardiography [ECG]
- A61B5/283—Invasive
- A61B5/287—Holders for multiple electrodes, e.g. electrode catheters for electrophysiological study [EPS]
-
- A—HUMAN NECESSITIES
- A61—MEDICAL OR VETERINARY SCIENCE; HYGIENE
- A61B—DIAGNOSIS; SURGERY; IDENTIFICATION
- A61B5/00—Measuring for diagnostic purposes; Identification of persons
- A61B5/24—Detecting, measuring or recording bioelectric or biomagnetic signals of the body or parts thereof
- A61B5/316—Modalities, i.e. specific diagnostic methods
- A61B5/318—Heart-related electrical modalities, e.g. electrocardiography [ECG]
- A61B5/346—Analysis of electrocardiograms
- A61B5/347—Detecting the frequency distribution of signals
-
- A—HUMAN NECESSITIES
- A61—MEDICAL OR VETERINARY SCIENCE; HYGIENE
- A61B—DIAGNOSIS; SURGERY; IDENTIFICATION
- A61B5/00—Measuring for diagnostic purposes; Identification of persons
- A61B5/24—Detecting, measuring or recording bioelectric or biomagnetic signals of the body or parts thereof
- A61B5/316—Modalities, i.e. specific diagnostic methods
- A61B5/318—Heart-related electrical modalities, e.g. electrocardiography [ECG]
- A61B5/346—Analysis of electrocardiograms
- A61B5/349—Detecting specific parameters of the electrocardiograph cycle
- A61B5/361—Detecting fibrillation
-
- A—HUMAN NECESSITIES
- A61—MEDICAL OR VETERINARY SCIENCE; HYGIENE
- A61B—DIAGNOSIS; SURGERY; IDENTIFICATION
- A61B5/00—Measuring for diagnostic purposes; Identification of persons
- A61B5/24—Detecting, measuring or recording bioelectric or biomagnetic signals of the body or parts thereof
- A61B5/316—Modalities, i.e. specific diagnostic methods
- A61B5/318—Heart-related electrical modalities, e.g. electrocardiography [ECG]
- A61B5/367—Electrophysiological study [EPS], e.g. electrical activation mapping or electro-anatomical mapping
-
- A—HUMAN NECESSITIES
- A61—MEDICAL OR VETERINARY SCIENCE; HYGIENE
- A61B—DIAGNOSIS; SURGERY; IDENTIFICATION
- A61B5/00—Measuring for diagnostic purposes; Identification of persons
- A61B5/68—Arrangements of detecting, measuring or recording means, e.g. sensors, in relation to patient
- A61B5/6846—Arrangements of detecting, measuring or recording means, e.g. sensors, in relation to patient specially adapted to be brought in contact with an internal body part, i.e. invasive
- A61B5/6847—Arrangements of detecting, measuring or recording means, e.g. sensors, in relation to patient specially adapted to be brought in contact with an internal body part, i.e. invasive mounted on an invasive device
- A61B5/6852—Catheters
- A61B5/6858—Catheters with a distal basket, e.g. expandable basket
-
- A—HUMAN NECESSITIES
- A61—MEDICAL OR VETERINARY SCIENCE; HYGIENE
- A61B—DIAGNOSIS; SURGERY; IDENTIFICATION
- A61B5/00—Measuring for diagnostic purposes; Identification of persons
- A61B5/72—Signal processing specially adapted for physiological signals or for diagnostic purposes
- A61B5/7235—Details of waveform analysis
- A61B5/7253—Details of waveform analysis characterised by using transforms
-
- A—HUMAN NECESSITIES
- A61—MEDICAL OR VETERINARY SCIENCE; HYGIENE
- A61B—DIAGNOSIS; SURGERY; IDENTIFICATION
- A61B2505/00—Evaluating, monitoring or diagnosing in the context of a particular type of medical care
- A61B2505/05—Surgical care
-
- A—HUMAN NECESSITIES
- A61—MEDICAL OR VETERINARY SCIENCE; HYGIENE
- A61B—DIAGNOSIS; SURGERY; IDENTIFICATION
- A61B5/00—Measuring for diagnostic purposes; Identification of persons
- A61B5/72—Signal processing specially adapted for physiological signals or for diagnostic purposes
- A61B5/7203—Signal processing specially adapted for physiological signals or for diagnostic purposes for noise prevention, reduction or removal
Definitions
- the present disclosure pertains to medical devices, and methods for manufacturing medical devices. More particularly, the present disclosure pertains to medical devices and methods for mapping and/or ablating cardiac tissue.
- intracorporeal medical devices have been developed for medical use, for example, intravascular use. Some of these devices include guidewires, catheters, and the like. These devices are manufactured by any one of a variety of different manufacturing methods and may be used according to any one of a variety of methods. Of the known medical devices and methods, each has certain advantages and disadvantages. There is an ongoing need to provide alternative medical devices as well as alternative methods for manufacturing and using medical devices.
- This disclosure provides design, material, manufacturing method, and use alternatives for medical devices.
- An example system for mapping the electrical activity of the heart includes a catheter shaft.
- the catheter shaft includes a plurality of electrodes and the plurality of electrodes includes a first and a second electrode.
- the system also includes a processor.
- the processor is capable of collecting a first signal corresponding to a first electrode over a time period and generating a first time-frequency distribution corresponding to the first signal.
- the first time-frequency distribution includes a first dominant frequency value representation occurring at one or more first base frequencies.
- the processor is also capable of applying a filter to the first signal or derivatives thereof to determine whether the first dominant frequency value representation includes a single first dominant frequency value at a first base frequency or two or more first dominant frequency values at two or more base frequencies.
- the system for mapping the electrical activity of the heart includes a catheter shaft.
- the catheter shaft includes a plurality of electrodes and the plurality of electrodes includes a first and a second electrode.
- the system also includes a processor.
- the processor is capable of collecting a first signal corresponding to a first electrode over a time period and generating a first time-frequency distribution corresponding to the first signal.
- the first time-frequency distribution includes a first dominant frequency value representation occurring at one or more first base frequencies.
- the processor is also capable of applying a comb filter to the first signal or derivatives thereof to determine whether the first dominant frequency value representation includes a single first dominant frequency value at a first base frequency or two or more first dominant frequency values at two or more base frequencies.
- the system is capable of collecting a second signal corresponding to the second electrode. Collecting the second signal occurs over the time period.
- the system is also capable of generating a second time-frequency distribution corresponding to the second signal.
- the second time-frequency distribution includes a second dominant frequency value representation and the second dominant frequency value representation includes one or more second dominant frequency values occurring at one or more second base frequencies.
- the system is further capable of determining an attraction point and the attraction point is defined when the one or more first dominant frequency values substantially relate to the one or more second dominant frequency values.
- the processor is capable of collecting a second signal corresponding to the second electrode. Collecting the second signal occurs over the time period.
- the system is also capable of generating a second time-frequency distribution corresponding to the second signal. Further, the second time-frequency distribution includes a second dominant frequency value representation and the second dominant frequency value representation includes one or more second dominant frequency values occurring at one or more second base frequencies.
- the system is further capable of determining an attraction point and the attraction point is defined when the one or more first dominant frequency values substantially relate to the one or more second dominant frequency values.
- the system is also capable of applying the filter to the second signal, a derivative of the second signal, and/or the attraction point.
- applying the filter to the first signal or derivatives thereof, to the second signal or derivatives thereof or to both signals or derivatives thereof includes applying the filter prior to determining the attraction point.
- applying the filter to the first signal or derivatives thereof, to the second signal or derivatives thereof or to both signals or derivatives thereof includes applying the filter after determining the attraction point.
- generating the first time-frequency distribution utilizes at least one Fourier transform, Short-Time Fourier transform, or a Wavelet transform.
- generating the time-frequency distribution includes generating a spectrogram of the first signal.
- the system is also capable of utilizing one or more harmonic components of the first signal or derivatives thereof and includes identifying frequency values at integer multiples of the one or more base frequencies. Further, the frequency values corresponding to the integer multiples are added to the one or more base frequency values.
- the system is also capable of generating a visual display and the visual display includes displaying the at least one visual indicator and the visual indicator corresponds to the first and/or second signal or derivative thereof.
- the system is also capable of generating a visual display and further includes displaying at least one sinusoid corresponding to the one or more first and/or second base frequencies.
- the visual display includes displaying a phase map.
- the visual indicator is a color, texture or both.
- the visual display includes a movie displayed on an anatomical chamber.
- Another example system for mapping the electrical activity of the heart includes a catheter shaft.
- the catheter shaft includes a plurality of electrodes.
- the plurality of electrodes includes a first and a second electrode.
- the system also includes a processor.
- the processor is capable of collecting a signal corresponding to an electrode over a time period and generating a time-frequency distribution corresponding to the signal. Further, the time-frequency distribution includes a dominant frequency value representation and the dominant frequency representation includes one or more dominant frequency values occurring at one or more base frequencies.
- the system is also capable of modifying the signal using one or more harmonic components of the signal or derivatives thereof to determine if the one or more dominant frequency values includes a single dominant frequency value or a plurality of dominant frequency values and the system is also capable of analyzing the modified signal to identify if the one or more dominant frequency values includes a single dominant frequency value or a plurality of dominant frequency values.
- using the one or more harmonic components of the signal or derivatives thereof includes identifying frequency values at integer multiples of the one or more base frequencies and the frequency values corresponding to the integer multiples are added to the one or more dominant frequency values occurring at the one or more base frequencies.
- analyzing the modified signal includes comparing the magnitude of the one or more dominant frequency values in the modified signal.
- comparing the one or more dominant frequency values includes comparing the magnitude of the dominant frequency values after the frequency values corresponding to the integer multiples of the one or more base frequencies are added to the one or more dominant frequency values occurring at the one or more base frequencies.
- the processor is capable of creating a visual display including one or more sinusoids corresponding to the signal or derivatives thereof.
- An example method for mapping the electrical activity of the heart includes collecting a first signal corresponding to a first electrode over a time period and collecting a second signal corresponding to the second electrode. Further, collecting the second signal occurs over the time period. The method is also capable of generating a first time-frequency distribution corresponding to the first signal. Further, the first time-frequency distribution includes a first dominant frequency value representation occurring at one or more first base frequencies. The method is also capable of generating a second time-frequency distribution corresponding to the second signal. The second time-frequency distribution includes a second dominant frequency value representation. Further, the second dominant frequency value representation includes one or more second dominant frequency values occurring at one or more second base frequencies.
- the method also includes applying a filter to the first signal or derivatives thereof to determine whether the first dominant frequency value representation includes a single first dominant frequency value at a first base frequency or two or more first dominant frequency values at two or more base frequencies and determining an attraction point.
- the attraction point is defined when the one or more first dominant frequency values substantially relate to the one or more second dominant frequency values.
- references in the specification to "an example”, “some examples”, “other examples”, etc., indicate that the example described may include one or more particular features, structures, and/or characteristics. However, such recitations do not necessarily mean that all examples include the particular features, structures, and/or characteristics. Additionally, when particular features, structures, and/or characteristics are described in connection with one example, it should be understood that such features, structures, and/or characteristics may also be used in connection with other examples whether or not explicitly described unless clearly stated to the contrary. Also, when particular features, structures, and/or characteristics are described in connection with one example, it is implicit that other examples may include less than all of the disclosed features, structures, and/or characteristics in all combinations.
- Mapping the electrophysiology of heart rhythm disorders often involves the introduction of a basket catheter (e.g. Boston Scientific Constellation catheter) or other mapping/sensing device having a plurality of sensors into a cardiac chamber.
- the sensors for example electrodes, detect physiological signals, such as cardiac electrical activity, at sensor locations. It may be desirable to have detected cardiac electrical activity processed into electrogram signals that accurately represent cellular excitation through cardiac tissue relative to the sensor locations.
- a processing system may then analyze and output the signal to a display device. Further, the processing system may output the signal as processed output, such as a static or dynamic activation map.
- a user such as a physician, may use the processed output to perform a diagnostic procedure.
- FIG. 1 is a schematic view of a system 10 for accessing a targeted tissue region in the body for diagnostic and/or therapeutic purposes.
- FIG. 1 generally shows the system 10 deployed in the left atrium of the heart.
- system 10 can be deployed in other regions of the heart, such as the left ventricle, right atrium, or right ventricle. While the illustrated embodiment shows system 10 being used for ablating myocardial tissue, system 10 (and the methods described herein) may alternatively be configured for use in other tissue ablation applications, such as procedures for ablating tissue in the prostrate, brain, gall bladder, uterus, nerves, blood vessels and other regions of the body, including in systems that are not necessarily catheter-based.
- System 10 includes a mapping catheter or probe 14 and an ablation catheter or probe 16.
- Each probe 14/16 may be separately introduced into the selected heart region 12 through a vein or artery (e.g., the femoral vein or artery) using a suitable percutaneous access technique.
- mapping probe 14 and ablation probe 16 can be assembled in an integrated structure for simultaneous introduction and deployment in the heart region12.
- Mapping probe 14 may include flexible catheter body 18.
- the distal end of catheter body 18 carries three-dimensional multiple electrode structure 20.
- structure 20 takes the form of a basket defining an open interior space 22 (see FIG. 2 ), although other multiple electrode structures could be used.
- Structure 20 carries a plurality of mapping electrodes 24 (not explicitly shown on FIG. 1 , but shown on FIG. 2 ) each having an electrode location on structure 20 and a conductive member.
- Each electrode 24 may be configured to sense or detect intrinsic physiological activity, for example represented as electrical signals, in an anatomical region adjacent to each electrode 24.
- electrodes 24 may be configured to detect activation signals of the intrinsic physiological activity within the anatomical structure.
- intrinsic cardiac electrical activity may comprise repeating or semi-repeating waves of electrical activity with relatively large spikes in activity at the beginning of activation events. Electrodes 24 may sense such activation events and the times at which such activation events occur.
- electrodes 24 may sense activation events at different times as an electrical activity wave propagates through the heart. For instance, an electrical wave may begin near a first group of electrodes 24, which may sense an activation event at relatively the same time or within a relatively small window of time. As the electrical wave propagates through the heart, a second group of electrodes 24 may sense the activation event of the electrical wave at times later than the first group of electrodes 24.
- Electrodes 24 are electrically coupled to processing system 32.
- a signal wire (not shown) may be electrically coupled to each electrode 24 on structure 20.
- the signal wires may extend through body 18 of probe 14 and electrically couple each electrode 24 to an input of processing system 32.
- Electrodes 24 sense cardiac electrical activity in the anatomical region, e.g., myocardial tissue, adjacent to their physical location within the heart.
- the sensed cardiac electrical activity (e.g., electrical signals generated by the heart which may include activation signals) may be processed by processing system 32 to assist a user, for example a physician, by generating processed output - e.g.
- processing system 32 may identify a near-field signal component (e.g., activation signals originating from cellular tissue adjacent to mapping electrodes 24) or an obstructive far-field signal component (e.g., activation signals originating from non-adjacent tissue).
- a near-field signal component e.g., activation signals originating from cellular tissue adjacent to mapping electrodes 24
- an obstructive far-field signal component e.g., activation signals originating from non-adjacent tissue.
- the near-field signal component may include activation signals originating from atrial myocardial tissue whereas the far-field signal component may include activation signals originating from ventricular myocardial tissue.
- the near-field activation signal component may be further analyzed to find the presence of a pathology and to determine a location suitable for ablation for treatment of the pathology (e.g., ablation therapy).
- Processing system 32 may include dedicated circuitry (e.g., discrete logic elements and one or more microcontrollers; application-specific integrated circuits (ASICs); or specially configured programmable devices, such as, for example, programmable logic devices (PLDs) or field programmable gate arrays (FPGAs)) for receiving and/or processing the acquired physiological activity.
- processing system 32 includes a general purpose microprocessor and/or a specialized microprocessor (e.g., a digital signal processor, or DSP, which may be optimized for processing activation signals) that executes instructions to receive, analyze and display information associated with the received physiological activity.
- processing system 32 can include program instructions, which when executed, perform part of the signal processing.
- Program instructions can include, for example, firmware, microcode or application code that is executed by microprocessors or microcontrollers.
- processing system 32 can take any suitable form for receiving electrical signals and processing the received electrical signals.
- processing system 32 may be configured to measure the sensed cardiac electrical activity in the myocardial tissue adjacent to electrodes 24.
- processing system 32 may be configured to detect cardiac electrical activity associated with a dominant rotor or divergent activation pattern in the anatomical feature being mapped. Dominant rotors and/or divergent activation patterns may have a role in the initiation and maintenance of atrial fibrillation, and ablation of the rotor path, rotor core, and/or divergent foci may be effective in terminating the atrial fibrillation.
- Processing system 32 processes the sensed cardiac electrical activity to generate a display of relevant characteristics.
- Such processed output may include isochronal maps, activation time maps, phase maps, action potential duration (APD) maps, Hilbert transform diagrams, vector field maps, contour maps, reliability maps, electrograms, cardiac action potentials and the like.
- the relevant characteristics may assist a user to identify a site suitable for ablation therapy.
- Ablation probe 16 includes flexible catheter body 34 that carries one or more ablation electrodes 36.
- the one or more ablation electrodes 36 are electrically connected to radio frequency (RF) generator 37 that is configured to deliver ablation energy to the one or more ablation electrodes 36.
- RF radio frequency
- Ablation probe 16 may be movable with respect to the anatomical feature to be treated, as well as structure 20.
- Ablation probe 16 may be positionable between or adjacent to electrodes 24 of structure 20 as the one or more ablation electrodes 36 are positioned with respect to the tissue to be treated.
- Processing system 32 may output data to a suitable device, for example display device 40, which may display relevant information for a user.
- a suitable device for example display device 40, which may display relevant information for a user.
- device 40 is a CRT, LED, or other type of display, or a printer.
- Device 40 presents the relevant characteristics in a format useful to the user.
- processing system 32 may generate position-identifying output for display on device 40 that aids the user in guiding ablation electrode(s) 36 into contact with tissue at the site identified for ablation.
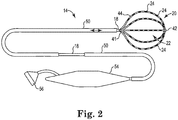
- FIG. 2 illustrates mapping catheter 14 and shows electrodes 24 at the distal end suitable for use in system 10 shown in FIG. 1 .
- Mapping catheter 14 may include flexible catheter body 18, the distal end of which may carry three-dimensional multiple electrode structure 20 with mapping electrodes or sensors 24.
- Mapping electrodes 24 may sense cardiac electrical activity, including activation signals, in the myocardial tissue. The sensed cardiac electrical activity may be processed by the processing system 32 to assist a user in identifying the site or sites having a heart rhythm disorder or other myocardial pathology via generated and displayed relevant characteristics. This information can then be used to determine an appropriate location for applying appropriate therapy, such as ablation, to the identified sites, and to navigate the one or more ablation electrodes 36 to the identified sites.
- appropriate therapy such as ablation
- the illustrated three-dimensional multiple electrode structure 20 comprises base member 41 and end cap 42 between which flexible splines 44 generally extend in a circumferentially spaced relationship.
- structure 20 may take the form of a basket defining an open interior space 22.
- the splines 44 are made of a resilient inert material, such as Nitinol, other metals, silicone rubber, suitable polymers, or the like and are connected between base member 41 and end cap 42 in a resilient, pretensioned condition, to bend and conform to the tissue surface they contact.
- eight splines 44 form three-dimensional multiple electrode structure 20. Additional or fewer splines 44 could be used in other examples.
- each spline 44 carries eight mapping electrodes 24. Additional or fewer mapping electrodes 24 could be disposed on each spline 44 in other examples of three-dimensional multiple electrode structure 20.
- structure 20 is relatively small (e.g., 40 mm or less in diameter). In alternative examples, structure 20 is even smaller or larger (e.g., less than or greater than 40 mm in diameter).
- Slidable sheath 50 may be movable along the major axis of catheter body18. Moving sheath 50 distally relative to catheter body 18 may cause sheath 50 to move over structure 20, thereby collapsing structure 20 into a compact, low profile condition suitable for introduction into and/or removal from an interior space of an anatomical structure, such as, for example, the heart. In contrast, moving sheath 50 proximally relative to the catheter body may expose structure 20, allowing structure 20 to elastically expand and assume the pretensioned position illustrated in FIG. 2 .
- a signal wire may be electrically coupled to each mapping electrode 24.
- the signal wires may extend through body 18 of mapping catheter 20 (or otherwise through and/or along body 18) into handle 54, in which they are coupled to external connector 56, which may be a multiple pin connector.
- Connector 56 electrically couples mapping electrodes 24 to processing system 32.
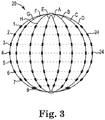
- FIG. 3 is a schematic side view of an example of basket structure 20 including a plurality of mapping electrodes 24.
- the basket structure includes 64 mapping electrodes 24.
- Mapping electrodes 24 are disposed in groups of eight electrodes (labeled 1, 2, 3, 4, 5, 6, 7, and 8) on each of eight splines (labeled A, B, C, D, E, F, G, and H). While an arrangement of sixty-four mapping electrodes 24 is shown disposed on basket structure 20, mapping electrodes 24 may alternatively be arranged in different numbers (more or fewer splines and/or electrodes), on different structures, and/or in different positions.
- multiple basket structures can be deployed in the same or different anatomical structures to simultaneously obtain signals from different anatomical structures.
- processing system 32 may be configured to record the cardiac electrical activity from each electrode 24 channel. Further, the recorded cardiac electrical activity may be related to the physiological activity of the adjacent anatomical structure. For instance, cardiac electrical activity sensed by electrodes 24 may include activation signals which may indicate an onset of physiological activity (e.g. contraction of the heart). Further, cardiac electrical activity corresponding to physiological activity may be sensed in response to intrinsic physiological activity (e.g. intrinsically generated electrical signals) or based on a predetermined pacing protocol instituted by at least one of the plurality of electrodes 24 (e.g. delivered electrical signals delivered by a pacing device).
- intrinsic physiological activity e.g. intrinsically generated electrical signals
- a predetermined pacing protocol instituted by at least one of the plurality of electrodes 24 (e.g. delivered electrical signals delivered by a pacing device).
- system 10 may be utilized in other areas of the body in addition to computed, simulated and/or theoretical computations.
- embodiments may be applied to neurological activity, endocardial and/or epicardial activity, unipolar measurements, bipolar measurements, both unipolar and bipolar measurements, or the like.
- the disclosed embodiments and/or techniques may be applied to any electrical measurement and/or any electrical activity, real or computed.
- the arrangement, size, spacing and location of electrodes along a constellation catheter or other mapping/sensing device, in combination with the specific geometry of the targeted anatomical structure, may contribute to the ability (or inability) of electrodes 24 to sense, measure, collect and transmit electrical activity of cellular tissue.
- splines 44 of a mapping catheter, constellation catheter or other similar sensing device are bendable, they may conform to a specific anatomical region in a variety of shapes and/or configurations. Further, at any given position in the anatomical region, structure 20 may be manipulated such that one or more splines 44 may not contact adjacent cellular tissue. For example, splines 44 may twist, bend, or lie atop one another, thereby separating splines 44 from nearby cellular tissue.
- Electrodes 24 are disposed on one or more of splines 44, they also may not maintain contact with adjacent cellular tissue. Electrodes 24 that do not maintain contact with cellular tissue may be incapable of sensing, detecting, measuring, collecting and/or transmitting electrical activity information. Further, because electrodes 24 may be incapable of sensing, detecting, measuring, collecting and/or transmitting electrical activity information, processing system 32 may be incapable of accurately displaying diagnostic information and/or processed output. For example, some necessary information may be missing and/or displayed inaccurately.
- electrodes 24 may not be in contact with adjacent cellular tissue for other reasons. For example, manipulation of mapping catheter 14 may result in movement of electrodes 24, thereby creating poor electrode-to-tissue contact. Further, electrodes 24 may be positioned adjacent fibrous, dead or functionally refractory tissue. Electrodes 24 positioned adjacent fibrous, dead or functionally refractory tissue may not be able to sense changes in electrical potential because fibrous, dead or functionally refractory tissue may be incapable of depolarizing and/or responding to changes in electrical potential. Finally, far-field ventricular events and electrical line noise may distort measurement of tissue activity.
- electrodes 24 that contact healthy, responsive cellular tissue may sense a change in the voltage potential of a propagating cellular activation wavefront.
- the change in voltage potential of cellular tissue may be sensed, collected and displayed as an electrogram.
- An electrogram may be a visual representation of the change in voltage potential of the cellular tissue over time.
- a fiducial point may be understood as a characteristic of an electrogram that can be utilized as an identifying characteristic of cellular activation. Fiducial points may correspond to the peak magnitude, change in slope, and/or deflection of the electrical signal. It is contemplated that fiducial points may include other characteristics of an electrogram or other signal used to generate diagnostic and/or processed output. Further, fiducial points may be identified manually by a clinician and/or automatically by processing system 32.
- An electrogram representing a change in voltage potential over time may be defined as visually displaying the electrical signal in the "time domain.” However, it is generally understood that any electrical signal has a corollary representation in the "frequency domain.” Transforms (e.g. Fourier, Fast Fourier, Wavelet, Wigner-Ville) may be utilized to transform signals between the time domain and frequency domain, as desired. Electrical signals also have a corollary representation in the analytic domain which can be obtained through transforms such as the Hilbert transform.
- Transforms e.g. Fourier, Fast Fourier, Wavelet, Wigner-Ville
- cellular firing in a rotating pattern may indicate the presence of dominant rotors and/or divergent activation patterns.
- electrical activity may change form, strength or direction when propagating around, within, among or adjacent to diseased or abnormal cellular tissue. Identification of these localized areas of diseased or abnormal tissue may provide a user with a location for which to perform a therapeutic and/or diagnostic procedure.
- identification of an area including reentrant or rotor currents may be indicative of an area of diseased or abnormal cellular tissue.
- the diseased or abnormal cellular tissue may be targeted for an ablative procedure.
- Various processed outputs, such as those described above, may be used to identify areas of circular, adherent, rotor or other abnormal cellular excitation wavefront propagation.
- the process of generating processed output may begin by collecting signals (e.g. a first signal corresponding to the first electrode and a second signal corresponding to the second electrode) from one or more of sixty-four electrodes 24 on structure 20.
- the sensed signals may be collected and displayed in the time domain.
- signals displayed in the time domain may be transformed into the frequency domain to further generate processed output.
- transforms such as the Fourier Transform, Fast Fourier Transform, or any other transform that produces frequency and power information for a signal may be utilized to transform signals between the time and frequency domains.
- Fig. 4 illustrates an example electrogram signal in the time domain 60 along with its corresponding frequency representation in the frequency domain 62.
- a time-frequency representation may be referred to as a spectrogram.
- the terms time-frequency representation and spectrogram are used interchangeably.
- a spectrogram may represent the magnitude of frequencies corresponding to cellular tissue response as it varies with time (or another variable).
- transforms such as the Fourier Transform, Short-Time Fourier Transform, Wavelet transform, or any other transform that produces frequency and power information for a signal may be utilized to generate a spectrogram.
- Fig. 5 shows a three-dimensional visual representation of example spectrogram 58.
- Spectrogram 58 may correspond to an example electrode 24 on multiple electrode structure 20. It should be understood that while spectrogram 58 is displayed visually in Fig. 5 , processing system 32 may generate the data necessary to reconstruct a spectrogram without actually creating a visual display of the spectrogram. Further, processing system 32 may utilize the collected data independent of visually displaying a spectrogram.
- the spectrogram may display a frequency spectrum 60 which varies in magnitude over a range of frequencies 62.
- frequency range 62 may correspond to frequencies included in the original, collected electrical signals and/or a frequency range selected by a user.
- processing system 32 may select a range of frequencies for which data is utilized from one or more of the signals collected from the sixty-four electrodes 24 on structure 20.
- a frequency range of 3-7 Hz has been shown (empirically) to be a frequency range in which abnormal cardiac electrical activity occurs.
- atrial fibrillation may occur predominantly in the frequency range of 3-7 Hz. It is contemplated that other abnormal atrial events may also occur within this frequency range.
- abnormal cardiac activity may occur in frequency ranges other than 3-7 Hz.
- the selected and/or filtered frequency range may be greater or less than 3-7 Hz (e.g. each limit could be modified by ⁇ 2-10 Hz). Selecting or ignoring data within a particular frequency range (e.g. in accordance with the range expected for a certain application) may improve the techniques and/or processed output of the embodiments disclosed herein.
- the frequency range may be a narrower range (e.g. 3-7 Hz, 2-10 Hz, 5-20Hz), or may be a larger range (e.g. 0-60 Hz, 5-100 Hz, 0-200 Hz).
- frequency spectrum 60 may correspond to a portion of the time interval over which original electrical signals were sensed and collected. Further, a frequency spectrum may change over the time interval. For example, a second frequency spectrum 64 may occur at a second time interval (as compared to the time interval corresponding to frequency spectrum 62). As shown, frequency spectrum 64 may be different from frequency spectrum 60. The difference between frequency spectrum 64 and frequency spectrum 60 may be due to a change in the magnitude of the spectrum with respect to frequency values over time. Further, the change in magnitude of the spectrum with respect to frequency values over time may correspond to a changing cellular tissue response underlying the original sensed and collected electrical signals.
- a two-dimensional spectrogram 66 is shown in Fig. 6 .
- spectrogram 66 may convey the same information as spectrogram 58.
- the information may be presented in a different format.
- the time interval may be displayed on the Y-axis, while the frequency range may be displayed on the X-axis.
- the magnitude values for each frequency may be conveyed visually.
- the magnitude values may be conveyed by a color spectrum.
- a range of colors may indicate the relative magnitude of a given frequency.
- the example disclosed herein is merely illustrative -- other methods for displaying the spectrogram (including frequency variability over time) and/or the magnitude of a given frequency are contemplated.
- magnitude values may be indicated by texture.
- electrical signals sensed and collected by electrodes 24 may exhibit the same or very similar frequency characteristics over a given time interval.
- electrical signals sensed and collected by electrodes 24 may exhibit the same or similar magnitudes at a given frequency over a given time interval.
- a given electrode may sense and collect electrical signals that exhibit a consistent magnitude at a given frequency over an interval of time.
- similar frequency characteristics may be displayed, reproduced and/or identified on a spectrogram.
- a spectrogram may convey magnitude values that are consistent at a given frequency over an interval of time.
- Fig. 6 shows example spectrogram 66 displaying a time interval in which magnitude values are consistent at a given frequency and/or range of frequencies.
- a frequency at which magnitude values are consistent at a given frequency and over a time interval is identified by bolded circle 68.
- bolded circle 68 shows magnitude values that are substantially equivalent to one another (as indicated by the consistent cross-hatching) at the same frequency over a given time interval.
- the example frequency (indicated by bolded circle 68) at which the magnitude values are substantially equivalent is approximately 4.7 Hz.
- the magnitude values occur over an approximate time interval of 45 seconds to 67.5 seconds. It is contemplated that in some instances the magnitude values may not be consistent across a given frequency or time interval.
- the magnitude values may remain consistent at a single frequency or across a range of frequencies. As illustrated in Fig. 6 , the frequency magnitudes remain consistent over a frequency range of approximately 4 to 5 Hz. In some instances, a single frequency at which magnitude values remain substantially consistent may be referred to as the "dominant frequency.” Similarly, a frequency band at which magnitude values remain substantially consistent may be referred to as a "dominant frequency band.” For example, in Fig. 6 , 4.5 Hz may be considered a dominant frequency. Similarly, 4-5 Hz may be considered a dominant frequency band. It is understood that more than one dominant frequency and/or dominant frequency band may be present in a given spectrogram.
- the embodiments described above may be applicable to one or more of electrodes 24 on multiple electrode structure 20.
- a unique spectrogram characteristic may be referred to as a "mode.” It is contemplated that a variety of characteristics/modes may be used to compare the spectrograms of electrodes 24 on multiple electrode structure 20.
- the specific characteristic/mode may be a frequency value having a maximum magnitude (herein called a "maximum frequency value”), a chirp, a sustained frequency value having a maximum magnitude (herein called a "sustained maximum frequency value”), a local frequency value having a maximum magnitude (herein called a "local maximum frequency value”) and/or other dominant frequency characteristics. These are just examples. Other characteristics/modes are contemplated.
- the mode may be referred to as a "dominant characteristic.”
- the dominant characteristic may occur at a frequency referred to as a "dominant frequency” and at a time point referred to as a "dominant time point.”
- the value e.g.
- a dominant characteristic occurring at a frequency referred to as a "dominant frequency” and at a time point referred to as a “dominant time point” may be referred to as a "dominant frequency values” and/or a “dominant frequency value representation.” Further, in some instances the mode may be referred to as a "dominant frequency value.” Additionally, it is contemplated that other user-defined dominant frequency values may be defined as modes. In some instances a single spectrogram for a single electrode may exhibit one or more modes identified by processing system 32.
- processing system 32 may group electrodes that exhibit a particular characteristic. Further, processing system 32 may selectively group electrodes exhibiting a particular characteristic only when the common characteristic occurs at substantially the same frequency and at substantially the same time point and/or time interval. In other words, processing system 32 may selectively group electrodes exhibiting a particular characteristic when the particular characteristics of the individual electrodes substantially relate to one another.
- the characteristic used to group electrodes may be a maximum magnitude occurring at a particular frequency. A maximum magnitude occurring at a particular frequency The maximum magnitude occurring at that particular frequency may occur at a single time point or may occur over a time interval.
- the characteristic utilized to group electrodes may be a frequency value having a maximum magnitude (herein called a "maximum frequency value”), a chirp, a sustained frequency value having a maximum magnitude (herein called a “sustained maximum frequency value”), a local frequency value having a maximum magnitude (herein called a "local maximum frequency value”) and/or other dominant frequency characteristic present on a given spectrogram for any electrode 24.
- processing system 32 may selectively group electrodes that exhibit a particular common characteristic occurring at a common frequency and common time point or time interval.
- processing system 32 may initially analyze the spectrogram of a given electrode for a particular frequency characteristic (e.g. a sustained frequency value having a maximum magnitude, etc.). Once processing system 32 identifies the frequency characteristic, processing system 32 may then determine the frequency and the time point at which the frequency characteristic occurred. Having determined the frequency characteristic, the frequency at which the characteristic occurs and the time point at which the characteristic occurs, processing system 32 may analyze the spectrograms of the remaining electrodes 24 in search of a match to the common characteristic, common frequency and common time point of the initial electrode.
- a particular frequency characteristic e.g. a sustained frequency value having a maximum magnitude, etc.
- Electrodes having spectrograms exhibiting the common characteristic, frequency and time point may then be grouped together.
- a common characteristic, frequency and time point may be referred to as an "attraction point.”
- the grouping of electrodes having spectrograms that exhibit the characteristic, frequency and time point may be referred to as an "attraction point.”
- a single spectrogram from a given electrode may exhibit one or more characteristics and/or dominant frequency values over the time interval of the spectrogram.
- different types of identifiable characteristics e.g. maximum frequency value, a chirp, sustained maximum frequency value, a local maximum frequency value and/or other dominant frequency characteristic present on a given spectrogram for any electrode 24
- Processing system 32 may analyze, compare, correlate, match and/or group one or more of the characteristics among one or more of all electrodes 24. Further, the matching characteristics may result in one or more different attraction points and resulting modes.
- a mode may define an electrical activation pattern.
- one or more modes of electrical activation patterns may be defined by and/or include one or more attraction points. Additionally, the modes of electrical activation patterns may correspond to one or more anatomical features.
- Fig. 7 shows example spectrogram 70 displaying maximum magnitude values 72, 74 for two example electrodes.
- the characteristic being identified on spectrogram 70 for each electrode is maximum magnitude.
- the characteristic may be a maximum frequency value, a chirp, sustained maximum frequency value, a local maximum frequency value and/or other dominant frequency characteristic present on a given spectrogram for any electrode 24.
- the maximum magnitude values 72, 74 (and frequency and time point at which they occur) are identified by the left and right diagonal cross-hatching shown.
- bolded circle 78 illustrates a frequency and time interval for which the maximum magnitude values 72, 74 of both electrodes substantially match (as indicated by the common cross-hatching).
- bolded circle 78 illustrates that the individual electrodes exhibiting the maximum magnitude values 72, 74 share a common magnitude at a common frequency over a common time point. As stated above, this particular combination may be referred to as an attraction point. Further, the electrodes exhibiting maximum magnitude values 72, 74 may sustain the same mode over this particular time interval. It should be understood that, in practice, electrodes exhibiting a particular mode may often be related spatially on multiple electrode structure 20. Therefore, in some instances, identification of particular electrode modes may provide a specific spatial location for the application of targeted therapy. The mode and corresponding location information may also inform a best therapy to apply or eliminate therapy alternatives that may be ineffective for a given circumstance. The therapy may include ablation therapy, pharmaceutical therapy, stimulation therapy, or the like.
- attraction points may be defined as a particular characteristic occurring at a single frequency and at a single point in time.
- a particular frequency characteristic may include a threshold value that must be met in order for processing system 32 to use that particular characteristic when searching for attraction points among the spectrograms of electrodes 24.
- the threshold may be a minimum expected magnitude value whereby the characteristic is satisfied when the magnitude value equals or substantially exceeds the threshold value.
- an attraction point may be defined when a particular characteristic or mode occurring at a particular frequency and time point is commonly shared among a group of spectrograms. Additionally, an attraction point may also be defined not only when a characteristic occurs at a single frequency or time point, but also when a particular characteristic occurs over a range of frequencies or a time interval. For example, in some instances processing system 32 may identify an attraction point between two example electrodes despite the fact that the frequencies at which the common characteristic occurs varies between the two electrodes. Similarly, in some instances processing system 32 may define an attraction point between two example electrodes despite the fact that the time points at which the common characteristic occurs varies between the two electrodes. Additionally, in some instances processing system 32 may define an attraction point between two example electrodes despite the fact that both the frequencies and the time points at which the common characteristic occurs varies between the two electrodes.
- processing system 32 being preprogrammed to implement, utilize and/or process the steps, methods, calculations and/or algorithms.
- processing system may be configured to allow input from a user (e.g. clinician) relating to particular characteristics and/or input variables. Allowing user defined input may permit a user to "customize" a particular algorithm or system output.
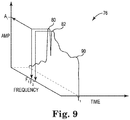
- processing system 32 may seek, target and/or select one or more specifically defined spectrogram characteristics. It is understood that a given spectrogram may include one or more modes. For example, Fig. 8 shows example spectrogram 76 for a single electrode 24. Further, Fig. 8 shows a peak magnitude 78 (corresponding to example magnitude value A1) occurring at frequency F1 and at time point T1. In this illustration, processing system may seek, target and/or select peak magnitude 78 as the characteristic for which to compare and determine attraction points among remaining electrodes 24. Alternatively, spectra from multiple electrodes may be compared to emphasize characteristic features that are common among them. In some instance, a group of electrodes may directly correlate to a particular anatomical feature (e.g. location in a cardiac chamber). Therefore, identifying common spectra characteristics associated with a particular group of electrodes may allow identification of the corresponding anatomical feature.
- anatomical feature e.g. location in a cardiac chamber
- multiple sets of spectrogram characteristics may involve different and/or overlapping groups of electrodes (and therefore, different and/or overlapping anatomical features). These groups of electrodes and corresponding anatomical features may be defined by multiple modes occurring over the same time period. The multiple modes may be independent of each other or dependent on each other (e.g. influence each other) over time. Identification of individual modes and/or the relationship between multiple dependent modes may be assessed from local electrode groups, globally over all electrodes, from individual electrodes and/or from any combination of electrodes as modes are identified and associated with different electrode sub-groups.
- a given mode may be "deconstructed" to identify the underlying electrical activity contributing to a particular pathology over a particular epoch of time.
- a particular spectrogram may exhibit a relatively complex spectral pattern in both frequency and overtime (e.g. spectrogram characteristics, modes, etc.).
- processing techniques may be applied which correlate a particular mode with a particular electrical pattern. For example, processing techniques may be able to determine that a particular mode correlates to a rotor, ectopic electrical activity, etc., with different relative powers over time. These patterns may then be deconstructed into multiple modes over time and targeted by a particular therapy.
- a particular type of observed pathology may be the result of collaboration between dominant and sub-dominant modes. Understanding the relationship between multiple modes may indicate whether to treat one or more particular electrical patterns (corresponding to the one or more modes).
- a given dominant spectral characteristic may (on its face) be recognizable as a targeted mode.
- the observed spectra characteristic may include two or more sub dominant modes contributing to the electrical pattern over time.
- the two or more modes e.g. dominant and sub-dominant
- therapy may be tailored to the particular pathology corresponding to each individual mode and electrical pattern.
- a spectrogram characteristic may include one or more characteristics for which processing system 32 may not be able to initially identify.
- Fig. 9 shows example spectrum 76 as described above.
- peak magnitude 78 includes two separate peak magnitude values 80, 82 occurring at example frequencies F1 and F2, respectively. It should be understood that frequencies F1 and F2 may be very close in value, and therefore, indistinguishable by processing system 32 during initial processing steps.
- peak magnitude values 80, 82 shown in Fig. 9 may reflect frequency values occurring at frequencies that are derived from two distinct cellular pathologies (e.g. arrhythmias). In that case, it would be inaccurate to group peak magnitude values 80, 82 (and their corresponding frequencies) into the same attraction point and/or mode.
- the electrode from which spectrogram 76 is derived may be grouped into two different modes corresponding to the two distinct peak frequencies at which the peak frequency values occur. Therefore, to more accurately determine attraction points and/or modes it may be desirable to apply signal processing techniques (e.g. frequency estimate techniques) to refine and/or modify the frequency spectrum signals contributing to a given spectrogram.
- the frame of the time-frequency representation may be widened in the time dimension, thus yielding a higher resolution in frequency.
- the harmonic components of a given frequency spectrum may be desirable to utilize the harmonic components of a given frequency spectrum to refine and/or modify the frequency spectrum.
- the power values at integer multiples of any base frequency e.g. dominant frequency, frequency at which a maximum frequency value occurs, etc.
- the power values occurring at the integer multiples of the base frequency may be combined with that of the base frequency, thereby producing a modified measure of the relative power or magnitude of the harmonic spectrum as a function of base frequency. This measure is expected to produce a peak at the frequency corresponding to that of the underlying periodicity and in practice may be a modified or refined value of the base frequency.
- this technique may be utilized for more than one frequency along a frequency spectrum, thereby modifying the frequency values along a portion or the entire frequency spectrum yielding what may be referred to as a "periodicity spectrum.” Therefore, this technique may provide differentiation among closely related magnitude frequency peaks.
- this technique may be referred to as applying a comb filter across a signal, derivative of a signal and/or a frequency spectrum. Additionally, this technique may also be applied across the frequency spectrum for the entire time interval of a given spectrogram, resulting in a time-frequency representation of the periodicity spectrum.
- a comb filter may be applied directly to one or more attraction points.
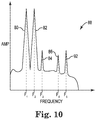
- Fig. 10 shows a two-dimensional representation 88 of the frequency spectrum 90 of Fig. 9 , including dual magnitude peaks 80, 82 and harmonic peaks 84, 86 occurring at first integer multiples of magnitude peaks 80,82, respectively.
- the magnitude value 84 occurring at the first integer multiple F3 (e.g. 2 ⁇ F1) of base frequency F1 (corresponding to peak magnitude 80) to the magnitude value of peak 80.
- the magnitude value 86 occurring at the first integer multiple F4 (e.g. 2 ⁇ F2) of base frequency F2 (corresponding to peak magnitude 82) to the magnitude value of peak 82.
- Fig. 10 further displays spurious peak 92 occurring at non-integer multiple F5.
- Fig. 11 illustrates the differentiation of peak magnitudes 80 and 82 after magnitude values 84 and 86 are added to the base frequency values occurring at frequencies F1 and F2.
- the magnitude peaks 80 and 82 show vertical separation from one another.
- This differentiation may allow processing system 32 to identify and group the frequency spectrum characteristics more accurately. Specifically, it may allow processing system 32 to either include or exclude the electrode from which the frequency spectrum 88 was derived from one or more modes.
- magnitude values 84 and 86 are substantially reduced with respect to both magnitude values 80 and 82 and magnitude values 84 and 86 in Fig. 10 .
- the magnitude value of spurious peak 92 is substantially reduced with respect to its value in Fig. 10 .
- the baseline magnitude values surrounding peaks 84, 86 and 92 trend downward (in comparison to the magnitude values shown in Fig. 10 ) as the frequency increases.
- the harmonic technique (e.g. including the use of a filter such as a comb filter) disclosed herein may be applied before attraction points are identified, after attraction points have been identified or both before and after attraction points have been identified. It is also contemplated that the harmonic technique may be applied to spectra combined from multiple electrodes. Further, it is contemplated that after a harmonic technique is applied and magnitude peaks are differentiated, one or more of the magnitude peaks may be included in an attraction point. Similarly, one or more of the peaks may be excluded from an attraction point.
- a filter such as a comb filter
- processing system 32 may utilize the frequency at which the attraction points and/or modes occur to create a diagnostic display corresponding to the spatial relationship of the electrodes contributing to the attraction points and/or modes.
- processing system 32 may determine the sinusoid representation and/or phase value correlated to the dominant frequency of the attraction points and/or modes collected from electrodes 24 on structure 20.
- the Fourier transform may be used to determine and/or generate a sinusoid and/or phase value for each electrode 24 at the selected frequency (e.g. frequency of the attraction points and/or modes).
- a sinusoid model may be estimated for each electrode 24 using estimation methods well-documented in the art of signal processing and apply them to the electrode waveform over the time epoch associated with the attraction point.
- each derived sinusoid with a corresponding phase offset may be utilized to create a dynamic "movie" or "dynamic map” corresponding to the particular attraction point and/or mode from which the selected frequency was derived.
- a movie or dynamic map may provide a medium that allows better visualization of wavefront propagation and/or the focal impulse of a particular pathology via a summary characteristic (e.g. activation time, phase, etc).
- the visual display e.g. movie, dynamic map, phase map etc.
- the visual display may be portrayed on an anatomical representation of a cardiac chamber of interest.
- the visual display e.g. movie, dynamic map, phase map, etc.
- processing system 32 may selectively eliminate some of the collected signals before performing the techniques and/or embodiments disclosed herein. For example, it may be beneficial to eliminate signals collected by electrodes that are not in electrical contact, or in poor electrical contact, with excitable cellular tissue of the heart. Such signals may not provide useful information and can skew results of the above described techniques.
- processing system 32 may instead interpolate or estimate the value of any signal which is not otherwise providing desirable information.
- processing system 32 may utilize the interpolated or estimated data (e.g. signal data) to better calculate, determine or generate useful processed data and/or smooth, refine, or present processed data in a more desirable manner.
- any of the disclosed methods may be implemented across multiple beats, excitations or cardiac pacing time intervals. Further, data collected over multiple heart beats and/or excitations may be analyzed using statistical methodologies and applied to the disclosed methods. For example, activation times may be collected over a series of heart beats and/or pulses. A statistical distribution of the collected activation times may be calculated, analyzed and incorporated into disclosed methods.
Claims (14)
- Système (10) pour cartographier l'activité électrique du cœur, le système (10) comprenant :un arbre de cathéter, dans lequel les électrodes d'une pluralité d'électrodes (24) lui sont couplées et dans lequel la pluralité d'électrodes (24) inclut des première et seconde électrodes ;un processeur (32), dans lequel le processeur (32) est configuré pour :collecter un premier signal qui correspond à la première électrode sur une période temporelle ;collecter un second signal qui correspond à la seconde électrode, dans lequel la collecte du second signal est réalisée sur la période temporelle ;générer une première distribution temps - fréquence qui correspond au premier signal, dans lequel la première distribution temps - fréquence inclut une représentation de première(s) valeur(s) de fréquence dominante(s) survenant à une ou plusieurs première(s) fréquence(s) de base,appliquer un filtre au premier signal ou à ses dérivées pour déterminer si oui ou non la représentation de première(s) valeur(s) de fréquence dominante(s) inclut une unique première valeur de fréquence dominante à une première fréquence de base ou deux premières valeurs de fréquence dominantes ou plus à deux fréquences de base ou plus ;générer une seconde distribution temps - fréquence qui correspond au second signal, dans lequel la seconde distribution temps - fréquence inclut une représentation de seconde(s) valeur(s) de fréquence dominante(s), dans lequel la représentation de seconde(s) valeur(s) de fréquence dominante(s) inclut une ou plusieurs seconde(s) valeur(s) de fréquence dominante(s) survenant à une ou plusieurs seconde(s) fréquence(s) de base, etdéterminer un point d'attraction (78), dans lequel le point d'attraction (78) est défini lorsqu'une caractéristique des une ou plusieurs premières valeurs de fréquence dominantes est rapportée sensiblement à la caractéristique des une ou plusieurs secondes valeurs de fréquence dominantes.
- Système (10) selon la revendication 1, comprenant en outre l'application du filtre au second signal, à une dérivée du second signal et/ou au point d'attraction (78).
- Système (10) selon l'une quelconque des revendications 1 et 2, dans lequel l'application du filtre au premier signal ou à ses dérivées, au second signal ou à ses dérivées ou aux deux signaux ou à leurs dérivées inclut l'application du filtre avant la détermination du point d'attraction (78).
- Système (10) selon l'une quelconque des revendications 1 à 3, dans lequel l'application du filtre au premier signal ou à ses dérivées, au second signal ou à ses dérivées ou aux deux signaux ou à leurs dérivées inclut l'application du filtre après la détermination du point d'attraction (78).
- Système (10) selon l'une quelconque des revendications 1 à 4, dans lequel la génération de la première distribution temps - fréquence utilise au moins une transformation de Fourier, une transformation de Fourier à court terme ou une transformation en ondelettes.
- Système (10) selon l'une quelconque des revendications 1 à 5, dans lequel la génération de la première distribution temps - fréquence inclut la génération d'un spectrogramme du premier signal.
- Système (10) selon l'une quelconque des revendications 1 à 6, dans lequel l'application d'un filtre au premier signal ou à ses dérivées comprend en outre l'utilisation d'une ou de plusieurs composante(s) d'harmonique du premier signal ou de ses dérivées.
- Système (10) selon l'une quelconque des revendications 1 à 7, dans lequel l'application d'un filtre au premier signal ou à ses dérivées comprend en outre l'application d'un filtre en peigne au premier signal ou à ses dérivées.
- Système (10) selon la revendication 7, dans lequel l'utilisation d'une ou de plusieurs composante(s) d'harmonique du premier signal ou de ses dérivées inclut l'identification de valeurs de fréquence à des multiples entiers des une ou plusieurs fréquences de base, et dans lequel les valeurs de fréquence qui correspondent aux multiples entiers sont additionnées aux une ou plusieurs valeurs de fréquence de base.
- Système (10) selon l'une quelconque des revendications 1 à 9, comprenant en outre la génération d'un affichage visuel (40), et dans lequel l'affichage visuel (40) inclut l'affichage d'au moins un indicateur visuel, et dans lequel l'indicateur visuel correspond au premier signal ou au second signal ou à ses dérivées ou aux premier et second signaux ou à leurs dérivées.
- Système (10) selon la revendication 10, dans lequel la génération d'un affichage visuel (40) inclut l'affichage d'au moins une sinusoïde qui correspond aux une ou plusieurs premières et/ou secondes fréquences de base.
- Système (10) selon l'une quelconque des revendications 10 et 11, dans lequel l'affichage visuel (40) inclut l'affichage d'une carte de phase(s).
- Système (10) selon l'une quelconque des revendications 10 à 12, dans lequel l'indicateur visuel est une couleur, une texture ou les deux.
- Système (10) selon l'une quelconque des revendications 10 à 13, dans lequel l'affichage visuel inclut un film cinématographique/une vidéo qui est affiché(e) sur une chambre anatomique.
Applications Claiming Priority (2)
| Application Number | Priority Date | Filing Date | Title |
|---|---|---|---|
| US201462059625P | 2014-10-03 | 2014-10-03 | |
| PCT/US2015/053831 WO2016054575A1 (fr) | 2014-10-03 | 2015-10-02 | Système médical pour la cartographie de tissus cardiaques |
Publications (2)
| Publication Number | Publication Date |
|---|---|
| EP3200689A1 EP3200689A1 (fr) | 2017-08-09 |
| EP3200689B1 true EP3200689B1 (fr) | 2021-01-13 |
Family
ID=54337883
Family Applications (1)
| Application Number | Title | Priority Date | Filing Date |
|---|---|---|---|
| EP15784203.0A Active EP3200689B1 (fr) | 2014-10-03 | 2015-10-02 | Système médical pour la cartographie de tissus cardiaques |
Country Status (5)
| Country | Link |
|---|---|
| US (2) | US10085659B2 (fr) |
| EP (1) | EP3200689B1 (fr) |
| JP (1) | JP2017535318A (fr) |
| CN (1) | CN106999075B (fr) |
| WO (1) | WO2016054575A1 (fr) |
Families Citing this family (12)
| Publication number | Priority date | Publication date | Assignee | Title |
|---|---|---|---|---|
| US11389232B2 (en) | 2006-06-28 | 2022-07-19 | Kardium Inc. | Apparatus and method for intra-cardiac mapping and ablation |
| US9119633B2 (en) | 2006-06-28 | 2015-09-01 | Kardium Inc. | Apparatus and method for intra-cardiac mapping and ablation |
| US8906011B2 (en) | 2007-11-16 | 2014-12-09 | Kardium Inc. | Medical device for use in bodily lumens, for example an atrium |
| US9693832B2 (en) | 2012-05-21 | 2017-07-04 | Kardium Inc. | Systems and methods for selecting, activating, or selecting and activating transducers |
| US9198592B2 (en) | 2012-05-21 | 2015-12-01 | Kardium Inc. | Systems and methods for activating transducers |
| US10827977B2 (en) | 2012-05-21 | 2020-11-10 | Kardium Inc. | Systems and methods for activating transducers |
| CN107072566A (zh) | 2014-10-03 | 2017-08-18 | 波士顿科学医学有限公司 | 用于映射心脏组织的医疗装置 |
| EP3200689B1 (fr) | 2014-10-03 | 2021-01-13 | Boston Scientific Scimed Inc. | Système médical pour la cartographie de tissus cardiaques |
| US10368936B2 (en) | 2014-11-17 | 2019-08-06 | Kardium Inc. | Systems and methods for selecting, activating, or selecting and activating transducers |
| US10722184B2 (en) | 2014-11-17 | 2020-07-28 | Kardium Inc. | Systems and methods for selecting, activating, or selecting and activating transducers |
| WO2019152986A1 (fr) * | 2018-02-05 | 2019-08-08 | Mayo Foundation For Medical Education And Research | Systèmes et procédés de mappage et de modulation de repolarisation |
| CN108957451A (zh) * | 2018-07-19 | 2018-12-07 | 李熙 | 一种内陆架海区永久固定式数据网络平台的构建方法 |
Citations (1)
| Publication number | Priority date | Publication date | Assignee | Title |
|---|---|---|---|---|
| WO2005115232A1 (fr) * | 2004-05-17 | 2005-12-08 | C.R. Bard, Inc. | Systeme de detection et de cartographie de la longueur du cycle de fibrillation auriculaire (afcl) a haute densite |
Family Cites Families (42)
| Publication number | Priority date | Publication date | Assignee | Title |
|---|---|---|---|---|
| US5007427A (en) * | 1987-05-07 | 1991-04-16 | Capintec, Inc. | Ambulatory physiological evaluation system including cardiac monitoring |
| US6233491B1 (en) | 1993-03-16 | 2001-05-15 | Ep Technologies, Inc. | Cardiac mapping and ablation systems |
| US5876336A (en) | 1994-10-11 | 1999-03-02 | Ep Technologies, Inc. | Systems and methods for guiding movable electrode elements within multiple-electrode structure |
| US5795304A (en) | 1996-03-27 | 1998-08-18 | Drexel University | System and method for analyzing electrogastrophic signal |
| WO1998034540A1 (fr) | 1997-02-05 | 1998-08-13 | Instrumentarium Corporation | Appareil permettant la surveillance d'un signal, representatif d'organes ou de fonctions vitales, emis par procede mecanique, et le traitement des resultats |
| US5772604A (en) | 1997-03-14 | 1998-06-30 | Emory University | Method, system and apparatus for determining prognosis in atrial fibrillation |
| CN1326489C (zh) | 1997-11-20 | 2007-07-18 | 精工爱普生株式会社 | 脉波诊断装置 |
| WO2001082099A1 (fr) | 1999-05-01 | 2001-11-01 | The Court Of Napier University | Procede pour l'analyse de signaux medicaux |
| US6850796B1 (en) | 1999-08-31 | 2005-02-01 | David W. Mortara | Method and apparatus to optimally measure cardiac depolarization/repolarization instability |
| US6735465B2 (en) | 2001-10-24 | 2004-05-11 | Scimed Life Systems, Inc. | Systems and processes for refining a registered map of a body cavity |
| US7123954B2 (en) | 2002-09-19 | 2006-10-17 | Sanjiv Mathur Narayan | Method for classifying and localizing heart arrhythmias |
| US8788029B2 (en) | 2004-10-05 | 2014-07-22 | Cuoretech Pty Ltd. | Heart analysis method and apparatus |
| US7376458B2 (en) | 2004-11-29 | 2008-05-20 | Cameron Health, Inc. | Method for defining signal templates in implantable cardiac devices |
| US7117030B2 (en) * | 2004-12-02 | 2006-10-03 | The Research Foundation Of State University Of New York | Method and algorithm for spatially identifying sources of cardiac fibrillation |
| US7774051B2 (en) | 2006-05-17 | 2010-08-10 | St. Jude Medical, Atrial Fibrillation Division, Inc. | System and method for mapping electrophysiology information onto complex geometry |
| US7729752B2 (en) | 2006-06-13 | 2010-06-01 | Rhythmia Medical, Inc. | Non-contact cardiac mapping, including resolution map |
| US8010186B1 (en) | 2006-07-19 | 2011-08-30 | Pacesetter, Inc. | System and related methods for identifying a fibrillation driver |
| GB0618522D0 (en) | 2006-09-20 | 2006-11-01 | Imp Innovations Ltd | Atrial fibrillation analysis |
| US7751873B2 (en) | 2006-11-08 | 2010-07-06 | Biotronik Crm Patent Ag | Wavelet based feature extraction and dimension reduction for the classification of human cardiac electrogram depolarization waveforms |
| US8086304B2 (en) | 2007-11-30 | 2011-12-27 | Data Sciences International Inc. | Physiologic signal processing to determine a cardiac condition |
| US8285352B2 (en) | 2008-07-15 | 2012-10-09 | Nellcor Puritan Bennett Llc | Systems and methods for identifying pulse rates |
| US20100016676A1 (en) | 2008-07-15 | 2010-01-21 | Nellcor Puritan Bennett Ireland | Systems And Methods For Adaptively Filtering Signals |
| EP2345024B1 (fr) * | 2008-11-10 | 2017-11-08 | Cardioinsight Technologies, Inc. | Visualisation de données électrophysiologiques |
| US8543195B1 (en) | 2009-11-03 | 2013-09-24 | VivaQuant, LLC | ECG sensing with noise filtering |
| CN102753095B (zh) | 2010-02-11 | 2016-02-03 | 皇家飞利浦电子股份有限公司 | 用于确定呼吸信号的方法和设备 |
| WO2012044261A1 (fr) * | 2010-09-29 | 2012-04-05 | The Office Of National Telecommunications Commission | Système et procédé de commande de dispositifs électriques basée sur ssvep |
| CN103354730B (zh) * | 2010-12-30 | 2016-01-27 | 圣犹达医疗用品电生理部门有限公司 | 用于诊断心律失常和引导导管治疗的系统和方法 |
| US20120172724A1 (en) * | 2010-12-31 | 2012-07-05 | Hill Anthony D | Automatic identification of intracardiac devices and structures in an intracardiac echo catheter image |
| US9277872B2 (en) | 2011-01-13 | 2016-03-08 | Rhythmia Medical, Inc. | Electroanatomical mapping |
| US8433398B2 (en) | 2011-03-10 | 2013-04-30 | Siemens Medical Solutions Usa, Inc. | Signal analysis system for heart condition determination |
| WO2012151301A1 (fr) | 2011-05-02 | 2012-11-08 | Topera, Inc. | Système et méthode de ciblage des troubles du rythme cardiaque par ablation selon une forme définie |
| US8958645B2 (en) | 2012-04-19 | 2015-02-17 | Canon Kabushiki Kaisha | Systems and methods for topic-specific video presentation |
| US8989835B2 (en) | 2012-08-17 | 2015-03-24 | The Nielsen Company (Us), Llc | Systems and methods to gather and analyze electroencephalographic data |
| EP2897522B1 (fr) | 2012-09-21 | 2020-03-25 | Cardioinsight Technologies, Inc. | Mappage physiologique pour l'arythmie |
| WO2014084162A1 (fr) * | 2012-11-27 | 2014-06-05 | 国立大学法人九州工業大学 | Suppresseur de bruit d'un signal, procédé et programme associés |
| US9737267B2 (en) | 2013-01-17 | 2017-08-22 | Cardioinsight Technologies, Inc. | Composite singularity mapping |
| US8812091B1 (en) | 2013-03-15 | 2014-08-19 | Apn Health, Llc | Multi-channel cardiac measurements |
| EP3139827A1 (fr) | 2014-05-09 | 2017-03-15 | Boston Scientific Scimed, Inc. | Dispositifs médicaux pour le mappage de tissu cardiaque |
| JP2017514597A (ja) | 2014-05-09 | 2017-06-08 | ボストン サイエンティフィック サイムド,インコーポレイテッドBoston Scientific Scimed,Inc. | 心臓組織をマッピングする医療用デバイス |
| EP3200689B1 (fr) | 2014-10-03 | 2021-01-13 | Boston Scientific Scimed Inc. | Système médical pour la cartographie de tissus cardiaques |
| WO2016054583A1 (fr) | 2014-10-03 | 2016-04-07 | Boston Scientific Scimed Inc. | Dispositifs médicaux permettant la cartographie de tissu cardiaque |
| CN107072566A (zh) | 2014-10-03 | 2017-08-18 | 波士顿科学医学有限公司 | 用于映射心脏组织的医疗装置 |
-
2015
- 2015-10-02 EP EP15784203.0A patent/EP3200689B1/fr active Active
- 2015-10-02 US US14/874,097 patent/US10085659B2/en active Active
- 2015-10-02 CN CN201580065468.1A patent/CN106999075B/zh active Active
- 2015-10-02 JP JP2017517657A patent/JP2017535318A/ja active Pending
- 2015-10-02 WO PCT/US2015/053831 patent/WO2016054575A1/fr active Application Filing
-
2018
- 2018-10-01 US US16/148,904 patent/US10264985B2/en active Active
Patent Citations (1)
| Publication number | Priority date | Publication date | Assignee | Title |
|---|---|---|---|---|
| WO2005115232A1 (fr) * | 2004-05-17 | 2005-12-08 | C.R. Bard, Inc. | Systeme de detection et de cartographie de la longueur du cycle de fibrillation auriculaire (afcl) a haute densite |
Non-Patent Citations (2)
| Title |
|---|
| MINH PHUONG NGUYEN ET AL: "A new approach for frequency analysis of complex fractionated atrial electrograms", PROCEEDINGS OF THE 31ST ANNUAL INTERNATIONAL CONFERENCE OF THE IEEE ENGINEERING IN MEDICINE AND BIOLOGY SOCIETY: ENGINEERING THE FUTURE OF BIOMEDICINE, EMBC 2009, IEEE, 3 September 2009 (2009-09-03), pages 368 - 371, XP031882471, ISBN: 978-1-4244-3296-7, DOI: 10.1109/IEMBS.2009.5334668 * |
| SANDRA MONZON ET AL: "Sparse spectral analysis of atrial fibrillation electrograms", MACHINE LEARNING FOR SIGNAL PROCESSING (MLSP), 2012 IEEE INTERNATIONAL WORKSHOP ON, IEEE, 23 September 2012 (2012-09-23), pages 1 - 6, XP032470817, ISBN: 978-1-4673-1024-6, DOI: 10.1109/MLSP.2012.6349721 * |
Also Published As
| Publication number | Publication date |
|---|---|
| US20190029535A1 (en) | 2019-01-31 |
| US20160183810A1 (en) | 2016-06-30 |
| EP3200689A1 (fr) | 2017-08-09 |
| WO2016054575A1 (fr) | 2016-04-07 |
| US10264985B2 (en) | 2019-04-23 |
| CN106999075A (zh) | 2017-08-01 |
| CN106999075B (zh) | 2020-09-08 |
| US10085659B2 (en) | 2018-10-02 |
| JP2017535318A (ja) | 2017-11-30 |
Similar Documents
| Publication | Publication Date | Title |
|---|---|---|
| US10264985B2 (en) | Medical system for mapping cardiac tissue | |
| US9795314B2 (en) | Medical devices for mapping cardiac tissue | |
| US9763625B2 (en) | Medical devices for mapping cardiac tissue | |
| US20170221262A1 (en) | Medical devices for mapping cardiac tissue and methods for displaying mapping data | |
| US9687167B2 (en) | Medical devices for mapping cardiac tissue | |
| US20150254419A1 (en) | Medical devices for mapping cardiac tissue and methods for displaying mapping data | |
| US9649040B2 (en) | Medical devices for mapping cardiac tissue | |
| US20160183830A1 (en) | Medical devices for mapping cardiac tissue | |
| US20150196214A1 (en) | Medical devices for mapping cardiac tissue |
Legal Events
| Date | Code | Title | Description |
|---|---|---|---|
| STAA | Information on the status of an ep patent application or granted ep patent |
Free format text: STATUS: THE INTERNATIONAL PUBLICATION HAS BEEN MADE |
|
| PUAI | Public reference made under article 153(3) epc to a published international application that has entered the european phase |
Free format text: ORIGINAL CODE: 0009012 |
|
| STAA | Information on the status of an ep patent application or granted ep patent |
Free format text: STATUS: REQUEST FOR EXAMINATION WAS MADE |
|
| 17P | Request for examination filed |
Effective date: 20170403 |
|
| AK | Designated contracting states |
Kind code of ref document: A1 Designated state(s): AL AT BE BG CH CY CZ DE DK EE ES FI FR GB GR HR HU IE IS IT LI LT LU LV MC MK MT NL NO PL PT RO RS SE SI SK SM TR |
|
| AX | Request for extension of the european patent |
Extension state: BA ME |
|
| DAV | Request for validation of the european patent (deleted) | ||
| DAX | Request for extension of the european patent (deleted) | ||
| GRAP | Despatch of communication of intention to grant a patent |
Free format text: ORIGINAL CODE: EPIDOSNIGR1 |
|
| STAA | Information on the status of an ep patent application or granted ep patent |
Free format text: STATUS: GRANT OF PATENT IS INTENDED |
|
| INTG | Intention to grant announced |
Effective date: 20200804 |
|
| GRAS | Grant fee paid |
Free format text: ORIGINAL CODE: EPIDOSNIGR3 |
|
| GRAA | (expected) grant |
Free format text: ORIGINAL CODE: 0009210 |
|
| STAA | Information on the status of an ep patent application or granted ep patent |
Free format text: STATUS: THE PATENT HAS BEEN GRANTED |
|
| AK | Designated contracting states |
Kind code of ref document: B1 Designated state(s): AL AT BE BG CH CY CZ DE DK EE ES FI FR GB GR HR HU IE IS IT LI LT LU LV MC MK MT NL NO PL PT RO RS SE SI SK SM TR |
|
| REG | Reference to a national code |
Ref country code: GB Ref legal event code: FG4D |
|
| REG | Reference to a national code |
Ref country code: CH Ref legal event code: EP |
|
| REG | Reference to a national code |
Ref country code: IE Ref legal event code: FG4D |
|
| REG | Reference to a national code |
Ref country code: DE Ref legal event code: R096 Ref document number: 602015064774 Country of ref document: DE |
|
| REG | Reference to a national code |
Ref country code: AT Ref legal event code: REF Ref document number: 1353928 Country of ref document: AT Kind code of ref document: T Effective date: 20210215 |
|
| REG | Reference to a national code |
Ref country code: AT Ref legal event code: MK05 Ref document number: 1353928 Country of ref document: AT Kind code of ref document: T Effective date: 20210113 |
|
| REG | Reference to a national code |
Ref country code: NL Ref legal event code: MP Effective date: 20210113 |
|
| REG | Reference to a national code |
Ref country code: LT Ref legal event code: MG9D |
|
| PG25 | Lapsed in a contracting state [announced via postgrant information from national office to epo] |
Ref country code: NO Free format text: LAPSE BECAUSE OF FAILURE TO SUBMIT A TRANSLATION OF THE DESCRIPTION OR TO PAY THE FEE WITHIN THE PRESCRIBED TIME-LIMIT Effective date: 20210413 Ref country code: BG Free format text: LAPSE BECAUSE OF FAILURE TO SUBMIT A TRANSLATION OF THE DESCRIPTION OR TO PAY THE FEE WITHIN THE PRESCRIBED TIME-LIMIT Effective date: 20210413 Ref country code: GR Free format text: LAPSE BECAUSE OF FAILURE TO SUBMIT A TRANSLATION OF THE DESCRIPTION OR TO PAY THE FEE WITHIN THE PRESCRIBED TIME-LIMIT Effective date: 20210414 Ref country code: HR Free format text: LAPSE BECAUSE OF FAILURE TO SUBMIT A TRANSLATION OF THE DESCRIPTION OR TO PAY THE FEE WITHIN THE PRESCRIBED TIME-LIMIT Effective date: 20210113 Ref country code: FI Free format text: LAPSE BECAUSE OF FAILURE TO SUBMIT A TRANSLATION OF THE DESCRIPTION OR TO PAY THE FEE WITHIN THE PRESCRIBED TIME-LIMIT Effective date: 20210113 Ref country code: LT Free format text: LAPSE BECAUSE OF FAILURE TO SUBMIT A TRANSLATION OF THE DESCRIPTION OR TO PAY THE FEE WITHIN THE PRESCRIBED TIME-LIMIT Effective date: 20210113 Ref country code: PT Free format text: LAPSE BECAUSE OF FAILURE TO SUBMIT A TRANSLATION OF THE DESCRIPTION OR TO PAY THE FEE WITHIN THE PRESCRIBED TIME-LIMIT Effective date: 20210513 |
|
| PG25 | Lapsed in a contracting state [announced via postgrant information from national office to epo] |
Ref country code: SE Free format text: LAPSE BECAUSE OF FAILURE TO SUBMIT A TRANSLATION OF THE DESCRIPTION OR TO PAY THE FEE WITHIN THE PRESCRIBED TIME-LIMIT Effective date: 20210113 Ref country code: PL Free format text: LAPSE BECAUSE OF FAILURE TO SUBMIT A TRANSLATION OF THE DESCRIPTION OR TO PAY THE FEE WITHIN THE PRESCRIBED TIME-LIMIT Effective date: 20210113 Ref country code: LV Free format text: LAPSE BECAUSE OF FAILURE TO SUBMIT A TRANSLATION OF THE DESCRIPTION OR TO PAY THE FEE WITHIN THE PRESCRIBED TIME-LIMIT Effective date: 20210113 Ref country code: RS Free format text: LAPSE BECAUSE OF FAILURE TO SUBMIT A TRANSLATION OF THE DESCRIPTION OR TO PAY THE FEE WITHIN THE PRESCRIBED TIME-LIMIT Effective date: 20210113 Ref country code: AT Free format text: LAPSE BECAUSE OF FAILURE TO SUBMIT A TRANSLATION OF THE DESCRIPTION OR TO PAY THE FEE WITHIN THE PRESCRIBED TIME-LIMIT Effective date: 20210113 |
|
| PG25 | Lapsed in a contracting state [announced via postgrant information from national office to epo] |
Ref country code: IS Free format text: LAPSE BECAUSE OF FAILURE TO SUBMIT A TRANSLATION OF THE DESCRIPTION OR TO PAY THE FEE WITHIN THE PRESCRIBED TIME-LIMIT Effective date: 20210513 |
|
| REG | Reference to a national code |
Ref country code: DE Ref legal event code: R097 Ref document number: 602015064774 Country of ref document: DE |
|
| PG25 | Lapsed in a contracting state [announced via postgrant information from national office to epo] |
Ref country code: SM Free format text: LAPSE BECAUSE OF FAILURE TO SUBMIT A TRANSLATION OF THE DESCRIPTION OR TO PAY THE FEE WITHIN THE PRESCRIBED TIME-LIMIT Effective date: 20210113 Ref country code: CZ Free format text: LAPSE BECAUSE OF FAILURE TO SUBMIT A TRANSLATION OF THE DESCRIPTION OR TO PAY THE FEE WITHIN THE PRESCRIBED TIME-LIMIT Effective date: 20210113 Ref country code: EE Free format text: LAPSE BECAUSE OF FAILURE TO SUBMIT A TRANSLATION OF THE DESCRIPTION OR TO PAY THE FEE WITHIN THE PRESCRIBED TIME-LIMIT Effective date: 20210113 |
|
| PLBE | No opposition filed within time limit |
Free format text: ORIGINAL CODE: 0009261 |
|
| STAA | Information on the status of an ep patent application or granted ep patent |
Free format text: STATUS: NO OPPOSITION FILED WITHIN TIME LIMIT |
|
| PG25 | Lapsed in a contracting state [announced via postgrant information from national office to epo] |
Ref country code: DK Free format text: LAPSE BECAUSE OF FAILURE TO SUBMIT A TRANSLATION OF THE DESCRIPTION OR TO PAY THE FEE WITHIN THE PRESCRIBED TIME-LIMIT Effective date: 20210113 Ref country code: RO Free format text: LAPSE BECAUSE OF FAILURE TO SUBMIT A TRANSLATION OF THE DESCRIPTION OR TO PAY THE FEE WITHIN THE PRESCRIBED TIME-LIMIT Effective date: 20210113 Ref country code: SK Free format text: LAPSE BECAUSE OF FAILURE TO SUBMIT A TRANSLATION OF THE DESCRIPTION OR TO PAY THE FEE WITHIN THE PRESCRIBED TIME-LIMIT Effective date: 20210113 |
|
| 26N | No opposition filed |
Effective date: 20211014 |
|
| PG25 | Lapsed in a contracting state [announced via postgrant information from national office to epo] |
Ref country code: ES Free format text: LAPSE BECAUSE OF FAILURE TO SUBMIT A TRANSLATION OF THE DESCRIPTION OR TO PAY THE FEE WITHIN THE PRESCRIBED TIME-LIMIT Effective date: 20210113 Ref country code: AL Free format text: LAPSE BECAUSE OF FAILURE TO SUBMIT A TRANSLATION OF THE DESCRIPTION OR TO PAY THE FEE WITHIN THE PRESCRIBED TIME-LIMIT Effective date: 20210113 |
|
| PG25 | Lapsed in a contracting state [announced via postgrant information from national office to epo] |
Ref country code: SI Free format text: LAPSE BECAUSE OF FAILURE TO SUBMIT A TRANSLATION OF THE DESCRIPTION OR TO PAY THE FEE WITHIN THE PRESCRIBED TIME-LIMIT Effective date: 20210113 |
|
| PG25 | Lapsed in a contracting state [announced via postgrant information from national office to epo] |
Ref country code: IT Free format text: LAPSE BECAUSE OF FAILURE TO SUBMIT A TRANSLATION OF THE DESCRIPTION OR TO PAY THE FEE WITHIN THE PRESCRIBED TIME-LIMIT Effective date: 20210113 |
|
| REG | Reference to a national code |
Ref country code: CH Ref legal event code: PL |
|
| PG25 | Lapsed in a contracting state [announced via postgrant information from national office to epo] |
Ref country code: IS Free format text: LAPSE BECAUSE OF FAILURE TO SUBMIT A TRANSLATION OF THE DESCRIPTION OR TO PAY THE FEE WITHIN THE PRESCRIBED TIME-LIMIT Effective date: 20210513 |
|
| REG | Reference to a national code |
Ref country code: BE Ref legal event code: MM Effective date: 20211031 |
|
| PG25 | Lapsed in a contracting state [announced via postgrant information from national office to epo] |
Ref country code: MC Free format text: LAPSE BECAUSE OF FAILURE TO SUBMIT A TRANSLATION OF THE DESCRIPTION OR TO PAY THE FEE WITHIN THE PRESCRIBED TIME-LIMIT Effective date: 20210113 |
|
| PG25 | Lapsed in a contracting state [announced via postgrant information from national office to epo] |
Ref country code: LU Free format text: LAPSE BECAUSE OF NON-PAYMENT OF DUE FEES Effective date: 20211002 Ref country code: BE Free format text: LAPSE BECAUSE OF NON-PAYMENT OF DUE FEES Effective date: 20211031 |
|
| PG25 | Lapsed in a contracting state [announced via postgrant information from national office to epo] |
Ref country code: LI Free format text: LAPSE BECAUSE OF NON-PAYMENT OF DUE FEES Effective date: 20211031 Ref country code: CH Free format text: LAPSE BECAUSE OF NON-PAYMENT OF DUE FEES Effective date: 20211031 |
|
| PG25 | Lapsed in a contracting state [announced via postgrant information from national office to epo] |
Ref country code: FR Free format text: LAPSE BECAUSE OF NON-PAYMENT OF DUE FEES Effective date: 20211031 |
|
| PG25 | Lapsed in a contracting state [announced via postgrant information from national office to epo] |
Ref country code: IE Free format text: LAPSE BECAUSE OF NON-PAYMENT OF DUE FEES Effective date: 20211002 |
|
| PG25 | Lapsed in a contracting state [announced via postgrant information from national office to epo] |
Ref country code: HU Free format text: LAPSE BECAUSE OF FAILURE TO SUBMIT A TRANSLATION OF THE DESCRIPTION OR TO PAY THE FEE WITHIN THE PRESCRIBED TIME-LIMIT; INVALID AB INITIO Effective date: 20151002 |
|
| PG25 | Lapsed in a contracting state [announced via postgrant information from national office to epo] |
Ref country code: NL Free format text: LAPSE BECAUSE OF NON-PAYMENT OF DUE FEES Effective date: 20210113 Ref country code: CY Free format text: LAPSE BECAUSE OF FAILURE TO SUBMIT A TRANSLATION OF THE DESCRIPTION OR TO PAY THE FEE WITHIN THE PRESCRIBED TIME-LIMIT Effective date: 20210113 |
|
| PGFP | Annual fee paid to national office [announced via postgrant information from national office to epo] |
Ref country code: GB Payment date: 20230920 Year of fee payment: 9 |
|
| PGFP | Annual fee paid to national office [announced via postgrant information from national office to epo] |
Ref country code: DE Payment date: 20230920 Year of fee payment: 9 |