EP3147822A1 - Procede d'extraction de caracteristiques morphologiques d'une empreinte digitale - Google Patents
Procede d'extraction de caracteristiques morphologiques d'une empreinte digitale Download PDFInfo
- Publication number
- EP3147822A1 EP3147822A1 EP16189504.0A EP16189504A EP3147822A1 EP 3147822 A1 EP3147822 A1 EP 3147822A1 EP 16189504 A EP16189504 A EP 16189504A EP 3147822 A1 EP3147822 A1 EP 3147822A1
- Authority
- EP
- European Patent Office
- Prior art keywords
- image
- phase
- peak
- fingerprint
- intensity
- Prior art date
- Legal status (The legal status is an assumption and is not a legal conclusion. Google has not performed a legal analysis and makes no representation as to the accuracy of the status listed.)
- Granted
Links
Images







Classifications
-
- A—HUMAN NECESSITIES
- A61—MEDICAL OR VETERINARY SCIENCE; HYGIENE
- A61B—DIAGNOSIS; SURGERY; IDENTIFICATION
- A61B5/00—Measuring for diagnostic purposes; Identification of persons
- A61B5/117—Identification of persons
- A61B5/1171—Identification of persons based on the shapes or appearances of their bodies or parts thereof
- A61B5/1172—Identification of persons based on the shapes or appearances of their bodies or parts thereof using fingerprinting
-
- G—PHYSICS
- G06—COMPUTING OR CALCULATING; COUNTING
- G06V—IMAGE OR VIDEO RECOGNITION OR UNDERSTANDING
- G06V40/00—Recognition of biometric, human-related or animal-related patterns in image or video data
- G06V40/10—Human or animal bodies, e.g. vehicle occupants or pedestrians; Body parts, e.g. hands
- G06V40/12—Fingerprints or palmprints
- G06V40/1347—Preprocessing; Feature extraction
- G06V40/1359—Extracting features related to ridge properties; Determining the fingerprint type, e.g. whorl or loop
-
- A—HUMAN NECESSITIES
- A61—MEDICAL OR VETERINARY SCIENCE; HYGIENE
- A61B—DIAGNOSIS; SURGERY; IDENTIFICATION
- A61B5/00—Measuring for diagnostic purposes; Identification of persons
- A61B5/0059—Measuring for diagnostic purposes; Identification of persons using light, e.g. diagnosis by transillumination, diascopy, fluorescence
- A61B5/0073—Measuring for diagnostic purposes; Identification of persons using light, e.g. diagnosis by transillumination, diascopy, fluorescence by tomography, i.e. reconstruction of 3D images from 2D projections
-
- A—HUMAN NECESSITIES
- A61—MEDICAL OR VETERINARY SCIENCE; HYGIENE
- A61B—DIAGNOSIS; SURGERY; IDENTIFICATION
- A61B5/00—Measuring for diagnostic purposes; Identification of persons
- A61B5/0059—Measuring for diagnostic purposes; Identification of persons using light, e.g. diagnosis by transillumination, diascopy, fluorescence
- A61B5/0062—Arrangements for scanning
- A61B5/0066—Optical coherence imaging
-
- A—HUMAN NECESSITIES
- A61—MEDICAL OR VETERINARY SCIENCE; HYGIENE
- A61B—DIAGNOSIS; SURGERY; IDENTIFICATION
- A61B5/00—Measuring for diagnostic purposes; Identification of persons
- A61B5/68—Arrangements of detecting, measuring or recording means, e.g. sensors, in relation to patient
- A61B5/6801—Arrangements of detecting, measuring or recording means, e.g. sensors, in relation to patient specially adapted to be attached to or worn on the body surface
- A61B5/6813—Specially adapted to be attached to a specific body part
- A61B5/6825—Hand
- A61B5/6826—Finger
-
- G—PHYSICS
- G01—MEASURING; TESTING
- G01B—MEASURING LENGTH, THICKNESS OR SIMILAR LINEAR DIMENSIONS; MEASURING ANGLES; MEASURING AREAS; MEASURING IRREGULARITIES OF SURFACES OR CONTOURS
- G01B9/00—Measuring instruments characterised by the use of optical techniques
- G01B9/02—Interferometers
- G01B9/02083—Interferometers characterised by particular signal processing and presentation
- G01B9/02087—Combining two or more images of the same region
-
- G—PHYSICS
- G01—MEASURING; TESTING
- G01B—MEASURING LENGTH, THICKNESS OR SIMILAR LINEAR DIMENSIONS; MEASURING ANGLES; MEASURING AREAS; MEASURING IRREGULARITIES OF SURFACES OR CONTOURS
- G01B9/00—Measuring instruments characterised by the use of optical techniques
- G01B9/02—Interferometers
- G01B9/0209—Low-coherence interferometers
- G01B9/02091—Tomographic interferometers, e.g. based on optical coherence
-
- G—PHYSICS
- G01—MEASURING; TESTING
- G01N—INVESTIGATING OR ANALYSING MATERIALS BY DETERMINING THEIR CHEMICAL OR PHYSICAL PROPERTIES
- G01N33/00—Investigating or analysing materials by specific methods not covered by groups G01N1/00 - G01N31/00
- G01N33/48—Biological material, e.g. blood, urine; Haemocytometers
-
- G—PHYSICS
- G06—COMPUTING OR CALCULATING; COUNTING
- G06T—IMAGE DATA PROCESSING OR GENERATION, IN GENERAL
- G06T7/00—Image analysis
- G06T7/97—Determining parameters from multiple pictures
-
- G—PHYSICS
- G06—COMPUTING OR CALCULATING; COUNTING
- G06V—IMAGE OR VIDEO RECOGNITION OR UNDERSTANDING
- G06V10/00—Arrangements for image or video recognition or understanding
- G06V10/20—Image preprocessing
- G06V10/30—Noise filtering
-
- G—PHYSICS
- G06—COMPUTING OR CALCULATING; COUNTING
- G06V—IMAGE OR VIDEO RECOGNITION OR UNDERSTANDING
- G06V20/00—Scenes; Scene-specific elements
- G06V20/60—Type of objects
- G06V20/64—Three-dimensional [3D] objects
-
- G—PHYSICS
- G06—COMPUTING OR CALCULATING; COUNTING
- G06V—IMAGE OR VIDEO RECOGNITION OR UNDERSTANDING
- G06V40/00—Recognition of biometric, human-related or animal-related patterns in image or video data
- G06V40/10—Human or animal bodies, e.g. vehicle occupants or pedestrians; Body parts, e.g. hands
- G06V40/12—Fingerprints or palmprints
- G06V40/13—Sensors therefor
-
- G—PHYSICS
- G06—COMPUTING OR CALCULATING; COUNTING
- G06V—IMAGE OR VIDEO RECOGNITION OR UNDERSTANDING
- G06V40/00—Recognition of biometric, human-related or animal-related patterns in image or video data
- G06V40/10—Human or animal bodies, e.g. vehicle occupants or pedestrians; Body parts, e.g. hands
- G06V40/12—Fingerprints or palmprints
- G06V40/1347—Preprocessing; Feature extraction
-
- G—PHYSICS
- G06—COMPUTING OR CALCULATING; COUNTING
- G06V—IMAGE OR VIDEO RECOGNITION OR UNDERSTANDING
- G06V40/00—Recognition of biometric, human-related or animal-related patterns in image or video data
- G06V40/10—Human or animal bodies, e.g. vehicle occupants or pedestrians; Body parts, e.g. hands
- G06V40/12—Fingerprints or palmprints
- G06V40/1382—Detecting the live character of the finger, i.e. distinguishing from a fake or cadaver finger
- G06V40/1394—Detecting the live character of the finger, i.e. distinguishing from a fake or cadaver finger using acquisition arrangements
-
- G—PHYSICS
- G06—COMPUTING OR CALCULATING; COUNTING
- G06T—IMAGE DATA PROCESSING OR GENERATION, IN GENERAL
- G06T2207/00—Indexing scheme for image analysis or image enhancement
- G06T2207/10—Image acquisition modality
- G06T2207/10072—Tomographic images
- G06T2207/10101—Optical tomography; Optical coherence tomography [OCT]
-
- G—PHYSICS
- G06—COMPUTING OR CALCULATING; COUNTING
- G06T—IMAGE DATA PROCESSING OR GENERATION, IN GENERAL
- G06T2207/00—Indexing scheme for image analysis or image enhancement
- G06T2207/20—Special algorithmic details
- G06T2207/20212—Image combination
- G06T2207/20221—Image fusion; Image merging
-
- G—PHYSICS
- G06—COMPUTING OR CALCULATING; COUNTING
- G06V—IMAGE OR VIDEO RECOGNITION OR UNDERSTANDING
- G06V2201/00—Indexing scheme relating to image or video recognition or understanding
- G06V2201/12—Acquisition of 3D measurements of objects
- G06V2201/121—Acquisition of 3D measurements of objects using special illumination
Definitions
- the present invention relates to a process for extracting morphological characteristics from biological materials, in particular fingerprints, in particular internal or external, using signals delivered by coherent optical tomography acquisition devices, in particular for biometrics.
- OCT Coherent Optical Tomographic Imaging
- an SW-OCT imaging device is an interference device made from an interferometer (Michelson or Mach-Zender type) and a tunable source. Each measurement consists of the recording of the interferometric signal as a function of the frequency of the source. The complex signals (intensity and phase) are therefore natively recorded in the spectral domain.
- any variation of the spatial phase at times of different measurements is associated with a Doppler effect.
- the spectral phase relative to a scattering center evolves linearly with the frequency ⁇ of the source.
- the slope of the phase in the spectral domain defined by d ⁇ m / d ⁇ , makes it possible to know the spatial position of the scattering center (or the flight time put by the light to reach the scattering center).
- the internal impressions are better preserved than the external impressions, not undergoing the same alterations in their surface properties as the latter, such as scars, stains, for example ink or dirt, or the variation surface moisture of the finger, especially due to perspiration or ambient humidity conditions.
- the internal fingerprint is therefore a very relevant biometric information because it is more stable over time and less dependent on environmental variations. It can also enable the authentication of a person whose external fingerprint is damaged.
- the internal fingerprint can also detect an attempted identity fraud.
- a known method of fraud difficult to detect by the known biometric sensors, consists in depositing on the finger of the usurper an overlayer where is imprinted in relief a fingerprint of another person. This overlay is difficult to detect, especially because under it is a real finger with oxygenated blood, and the temperature of the overlay is close to that of the surface of a real finger.
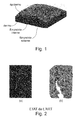
- the figure 1 represents a typical image obtained from a finger by coherent optical tomography.
- the level of the backscattered signal is represented as a function of the spatial position.
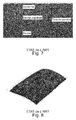
- Figure 3 (a) the probe of the OCT sensor is moved by means of two galvanometric mirrors along the X and Y axes. For each position of the probe, a measurement obtained by interferometry is recorded, as described in the article of AF Fercher et al. "Optical Coherence Tomography - Principal and Applications,” published in “Reports on Progress in Physics," 2003, No. 66, pp. 239-303. .
- This consists of a measurement of the backscattered intensity as a function of flight time, that is to say the time it takes for the light to pass through the different layers of the examined sample.
- the propagation distance from the probe can be found by multiplying the flight time by the speed of light.
- a reflectivity profile of the light in depth is then obtained, called “ A-scan " and represented at Figure 3 (b) .
- A-scan " profile in intensity of a finger is represented in figure 4 .
- the signal of interest corresponding to the signal coming from the outer surface portion of the finger is between the first numbered peak 1 and the third numbered peak 3.
- the peak numbered 1 corresponds to the air / skin interface, that is to say to the external fingerprint. This is the interface where the optical index jump is greatest, due to the inhomogeneity of the two media, inducing the higher amplitude of the peak.
- the numbered number 1 corresponds to the air / overlayer interface.
- the signal intensity decreases globally. This decrease is due to the phenomena of absorption and diffusion as the penetration of light into the fabric or overlay, and thus during its penetration into the different layers of the skin or the overcoat.
- the detection of the peak intensity peak position makes it possible to locate the air / skin or air / overlay interface.
- the known methods are based on a spatial filtering along the Z axis. This filtering makes it possible to obtain an average level of the backscattered intensity around the depth at which the internal imprint is located.
- the filtering zone then corresponds to the spatial neighborhood of the second main peak of each " A-scan " profile, directly linked to the 3D surface of the internal cavity.
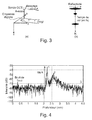
- the image thus obtained, called the intensity image is presented to the Figure 2 (a) .
- the Figure 2 (b) represents the image processed by a software system, called " matcher " in English, responsible for putting the image in the form of binary data and locating the minutiae of the imprint, the characteristic points of the imprint used for the identification . Some areas where the footprint contrast is low appear in white. For the same finger, the position of these zones may vary depending on the experimental conditions, or the positioning of the finger relative to the sensor. The performance obtained from the intensity image may present areas that are difficult to exploit because of the quality of the images, as visible in the Figure 2 (b) .
- this intensity contrast information is also very variable depending on the state of the surface of the finger, if it is stained, for example by ink, or wet.
- fingerprinting performance is very degraded in the case of wet fingers in acquisitions made by known sensors, such as, for example, capacitive or optical sensors with contact, giving two-dimensional images, or optical sensors without so-called “ 2 1 ⁇ 2 dimensions ", as mentioned in the articles of R.
- Cappelli et al. Perfectances evaluation of fingerprint verification systems", IEEE Transactions on Pattern Analysis and Maching Intelligence, Vol. 28, No. 1, 2006 , and of LC Jain et al. "Intelligent Biometric Techniques in Fingerprint and Face Recognition", Chapter 2, Vol.
- FIG 5 presents an experimental example of an OCT image in cross-section extracted in the traditional way, representative of a fingertip with presence of microdroplets on its surface, simulating the behavior of a finger under conditions of high humidity or transpiration.
- the intensity image of this wet finger example, presented at figure 6 contains white spots, due among other things to the presence of droplets that locally modify the optical properties of the finger, creating a parasitic lens effect for example.
- Known fingerprint readers to authenticate people thus prove to be non-operational under high humidity conditions, since no reliable image of the fingerprint of a wet finger can be provided.
- A. Bossen et al. The acquisition is performed by finger contact on a glass plate, leading to a flattening of the finger.
- the figure 7 represents a cross section where the papillary dermis, that is to say the internal imprint, is clearly visible.
- the junction zone or " junction zone " in English, located between the dermis and the epidermis.
- the width and position of this area was empirically set between 0.1mm and 0.9mm inside the finger, so as to contain the interface of the internal footprint.
- the complete three-dimensional junction zone can be obtained from the signals of the different A-scans A xy (z), for a probe position positioned at (x, y). It will then contain all the 3D internal footprint.
- This method makes it possible to obtain a so - called intensity image of 2D textures, denoted I (x, y), related to the average intensity information, where x and y are the coordinates of the pixels of the image.
- Image processing methods have been applied to the I (x, y) image to improve its contrast.
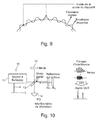
- the image I (x, y) can be projected on the 3D surface of the internal cavity, obtained thanks to the phase measurements.
- the internal 3D imprint obtained with this method is visible at the figure 8 .
- the performance of this approach in the context of biometrics is not sufficient either because of the degraded quality of the images obtained.
- US 2014/0241596 and US 2015/016127 disclose methods for representing blood flows in the vascular networks of the finger, to verify that it is the image of a living finger that is acquired.
- the relevant information here is Doppler type information, and it is proposed to make phase differences between successive A-scans (depth reflectivity profiles). This treatment necessarily implies that the phase in question is a phase in the "spatial" domain. There is no measurement performed on the phase in the spectral domain.
- Article Internal fingerprint detection zone in optical coherence tomography fingertip scans Journal of electronic imaging 24 (2) Mar / apr 2015 also aims to segment the internal footprint.
- the interface of the internal footprint is roughly segmented from a clustering method. "Features" to describe the A-scans are chosen for the implementation of "clustering”.
- a more accurate estimate of the position of the papillary junction is performed by B-scan applied image processing operations. -scan.
- the internal imprint is not segmented from distance measurements via the phase in the spectral domain. Moreover, no fusion of images is performed.
- the invention aims to satisfy this need, and it achieves this through a method of extracting morphological characteristics from a sample of biological material, in particular fingerprints, in particular internal or external, using a tomography acquisition system.
- coherent optics delivering a signal representative of the sample, method in which an image containing intensity information and an image containing phase information are formed from at least the signal supplied by the acquisition system and representative of the sample, in order to extract morphological characteristics from the 'sample.
- the image containing intensity information and the image containing phase information are not equivalent in terms of information content. Even if their qualities are comparable, the information they contain is complementary, and make it possible to facilitate and optimize the extraction of the morphological characteristics of the sample to be used.
- the method according to the invention can thus be used in the field of highly secure biometrics, aimed at detecting fraud in the identification of persons, by using in particular the internal fingerprint to compare it to the external fingerprint, or the reliable biometric identification in difficult conditions, for example in the case of wet or dirty fingers, or in the case of an external fingerprint more or less deleted.
- the backscattered intensity maxima are always located at the external footprint, and not at the water layer or droplets.
- the recovery of the position of these intensity maxima thanks to the knowledge of the flight time of the light, makes it possible to reconstruct suitably the 3D structure of the external imprint.
- the accurate measurement of the flight time is advantageously performed from the knowledge of the phase of the signal in the spectral domain.
- the resulting phase image is thus of much better quality, providing more robust biometric identification performance than that obtained from the only intensity images, as obtained by the known biometric sensors or with the imaging methods. OCT of the state of the art.
- phase information corresponding to the flight time of the light, makes it possible to compensate for the variability of the light scattering intensity involved in the properties of the image, and in particular the fact that they are sensitive to light. angle of incidence of the light beam with the normal of the surface of the sample to be studied.
- the second peak of the intensity of an " A-scan " profile, numbered 2 at the figure 4 is assigned to the internal fingerprint, or overlay interface / finger in the case of fraud. It reflects the strong inhomogeneities of the skin in the papillary dermis, a layer of skin located between the dermis and the epidermis, corresponding to a change in cellular organization, visible at the figure 7 . Thus, in the same manner as previously described, it is advantageous to reconstruct a 3D representation of the internal cavity by recovering the position of the second peak of greater reflectivity for each " A-scan " profile of the tomographic volume.
- a depth reflectivity profile of the light being established from the signal representative of the sample delivered by the acquisition system this reflectivity profile having several peaks of maximum reflectivity, it can be determined, in order to form the image containing phase information, the position of a maximum reflectivity peak of said reflectivity profile, chosen according to the type of data to be extracted.
- the peak of interest for the external cavity preferably corresponds to the first peak of maximum reflectivity of the reflectivity profile, and the peak of interest for the internal cavity corresponds preferably to the second peak.
- 3D surfaces associated with the external or internal impressions can be obtained, depending on the peak considered.
- a spatial filtering of the signal can be carried out, especially a bandpass filtering of the interferogram in the spatial domain, consisting at least of retaining the interferometric signal contained in a window centered on the peak of interest and predefined width, in particular the order of magnitude of the axial resolution of the acquisition system OCT.
- a transformation is then advantageously applied to this signal in order to obtain spectral information, in particular spectral information in intensity and in phase concerning the broadcast recorded at the air / finger interface in the case of an external fingerprint or at the interface epidermis / dermis in the case of an internal fingerprint, the transformation being in particular a Hilbert transform to obtain the complex interferometric signal.
- the slope of the phase is advantageously calculated by a linear regression of the spectral dependence of the phase, obtained from the spectral information obtained by transforming the spatially filtered signal.
- the reference used to measure the phase information is preferably the average envelope of the surface of the finger.
- This average envelope corresponds to the envelope surface of the finger without the grooves, as shown in FIG. figure 9 .
- a 3D surface can be encoded as a topographic image S (x, y), where at each (x, y) is associated a depth value, or preferably here, a flight time or phase value.
- the average envelope, called Em (x, y) is then obtained by applying an averaging filter, in particular a 2D low-pass filter, on the topographic image S (x, y). Since the grooves are of higher spatial frequencies, they are advantageously eliminated during the filtering operation.
- the average envelope corresponds to an internal surface of the finger, located at the level of the internal imprint, obtained by filtering the tomographic image associated with the 3D surface of the internal imprint.
- the reference of the flight time or phase measurements is no longer taken at the level of the sensor probe but at the level of the average envelope. Consequently, the resulting image advantageously represents not the phase values ⁇ , but rather their variations ⁇ , which makes it possible to have a more contrasting texture image.
- the contrast of this texture image can be further improved by applying an adaptive histogram equalization and then a contrast adjustment using a sigmoid function, the medium of which is determined by the Otsu method, of considering that the image to binarize contains only two classes of pixels, the foreground and the background, and calculates the optimal threshold that separates these two classes so that their intra-class variance is minimal.
- the texture image P (x, y) can be projected on the 3D surface of the internal footprint represented in FIG. Figure 11 (a) .
- the invention makes it possible to detect fraud by using overlays, by comparing the fingerprint associated with the first peak of maximum reflectivity with that associated with the second peak. If these fingerprints are different, there is fraud.
- the position is determined by applying bandpass filtering to isolate the peak of reflectivity corresponding to the desired interface and by applying to the reflectogram thus filtered an inverse transformation, in particular an inverse Fourier transformation, to generate a filtered interferogram, in the spectral domain.
- a 3D surface can be generated from the knowledge of the position z 0 at each point x, y of the reflectivity peak considered, and therefore of the interface concerned.
- the first peak can give the position of the air / skin interface corresponding to the external imprint, and the second that of the epidermis / dermis interface corresponding to the internal interface.
- a 2D low-pass filtering can be applied to such a surface to obtain an average envelope Em (x, y) of the position of the interface.
- This envelope can be taken as a reference to generate by subtraction a texture image in phase P (x, y).
- This in-phase texture image can be merged with an intensity texture image I (x, y) to obtain a fusion texture image, which can then be projected onto a 3D surface to obtain a 3D textured imprint surface. flattened.
- the image containing intensity information and the image containing phase information are merged to form a single image.
- each image respectively containing intensity information and phase information is analyzed in order to establish for each image a confidence card containing a quality value for each pixel, according to the neighboring pixels.
- the cards of confidence of the images are based in particular on the presence of a good contrast and on the local quality of the grooves present on the images, in the case of a fingerprint.
- Each pixel of the fusion image F between the image I containing intensity information and the image P containing phase information is advantageously derived from a linear combination of the values of the corresponding pixels of the two images, weighted by the quality values of trust cards:
- the image of fusion between the image containing intensity information and the image containing phase information is thus advantageously formed pixel by pixel, according to the neighborhood of each pixel, thanks to the confidence cards.
- the quality value of a pixel ( C P ( x, y ) or C I ( x, y )), can be obtained from reliability maps of fingerprint orientation fields, or " orientation field reliability map " in English, as described in the articles of J. Zhou and J. Gu, "A Model-based for the Fingerprint's Orientation Field", IEEE Transactions on Image Processing, vol. 13, no. 6, 2004 , and of MS Khalil, "Deducting Fingerprint Singular Points Using Orientation Field Reliability", First Conference on Robotics, Vision and Signal Processing, pp. 234-286, 2011 .
- the groove orientation fields represent the direction of the grooves for each position in the footprint.
- a low quality fingerprint image region can be characterized by the fact that the texture of the grooves is not apparent, the periodic structure characteristic of the grooves not being found there. In such areas, the orientation estimate is poor because there is no overriding orientation. Therefore, the value of reliability is low. Conversely, in highly structured fingerprint regions, the presence of a particular direction can be reliably estimated. The value of reliability for these regions is high.
- the structure of the internal cavity may be quite inhomogeneous, unlike that of the external cavity, which is continuous, leading to an ambiguity on the position of the second peak of maximum reflectivity.
- the structure of the internal imprint can also vary greatly from one individual to another. Detecting the position of the internal cavity by time of flight measurements can be tricky, since the interface is not necessarily well defined.
- the backscattering of light in the skin involves complex physical phenomena that are difficult to predict due to the interferences between the multiple waves backscattered by the biological structures. It is not obvious that, in a fingerprint, the peaks of the grooves correspond to maxima of reflectivity and the hollows to minima, or vice versa.
- the fusion of the images in phase and in intensity makes it possible to make the most of the information available on all the two images, and thus to significantly improve the quality of the final image obtained on the desired surface. For example, in the area of biometrics, this results in a significant improvement in identification performance based on the subcutaneous imprint, using known biometric identification algorithms.
- the location accuracy of peak reflectivity peaks partly in the quality of 3D and 2D images in phase.
- the location accuracy different from the axial resolution, is a little known concept of the prior art, and little exploited in biomedical applications.
- Axial resolution is the minimum distance required between two scattering centers in order to be able to distinguish them correctly, and is only dependent on the spectral width of the light source. It can be measured from the width at half height of a peak associated with a single diffusion center, for example the first peak numbered 1.
- the location accuracy is advantageously related to the error in locating the maxima of the envelope of the different " A-scan " profiles.
- a statistical study is performed, consisting of simulating the peak associated with a single diffusion center, whose position is fixed during the simulation, taking into account the different noise contributions from the photo-detector of the acquisition system, mainly thermal noise and shot noise that have distributions comparable to white noise. This noise can have a greater or lesser impact, depending on its power, on the measured position of the maximum peak.
- the error made on the position can be measured by the difference between the position of the maximum of the profile "A-scan” simulated noisy and the profile "A-scan” reference used, known beforehand.
- We then define the location accuracy of the acquisition system by the standard deviation of this location error. The standard deviation is advantageously obtained from a large number of random draws of noisy " A-scan " profiles.
- the invention relates to a device for extracting morphological characteristics from a sample of biological material, in particular fingerprints, in particular internal or external, comprising a coherent optical tomography acquisition system delivering a signal representative of the sample, the device being configured to form, from at least the signal delivered by the acquisition system and representative of the sample, an image containing intensity information and an image containing phase information, in order to extract characteristics morphological characteristics of the sample.
- the device is further configured to fuse the image containing intensity information and the image containing phase information to form a single image.
- the field of view of the device corresponding to the maximum spatial extent in the XY plane that can be recorded, can be extended, reaching for example 2 mm by 2 mm, or 4 mm 2 , better 2 cm by 2 cm, or 4 cm 2 . This makes it possible to obtain a large number of minutiae, in the case of the extraction of a fingerprint.
- FIG. figure 10 An OCT device 10 making it possible to implement the invention is represented in FIG. figure 10 .
- This device 10 comprises a scanning source 11 configured to scan the sample at different depths, a mirror 12, a partial mirror 13, and a Michelson interferometer 14.
- Each wavelength scan, or " A-scan " in English, produces interference fringes from the reflections of the sample at different depths.
- a time domain reflectogram 104 is obtained, which allows (step 105) an estimation of the position of the peak of interest (air / finger interface, epidermis / dermis, .%) by direct measurement of the flight time, using the envelope of each A-scan.
- This reflectogram 104 may be subjected to bandpass filtering in the spatial domain around the peak of interest (step 106), which isolates this peak, and then, by an inverse Fourier transform 107, a filtered interferogram in the spectral domain. .
- a Hilbert transform 109 may make it possible to recover a complex signal in the spectral domain, the argument of which provides the spectral phase 110 and a treatment statistic 111 by linear regression the direction coefficient d ⁇ ( ⁇ ) / d ⁇ of the slope, and therefore the flight time 102 of the peak of interest, that is to say its spatial position.
- the image generated from the spectral phase information consists in this example in the gray level representation of the flight time ⁇ (x, y). In this representation, the spatial resolution of the measurement is not degraded. The variation of flight time along the x and y axes gives access to the morphological characteristics of the footprint.
- Bossen proposes to represent I (x, y) where I (x, y) represents the average intensity of the surrounding A-scan envelope. peak of interest.
- the spatial averaging zone considered, typically between 100 ⁇ m and 900 ⁇ m, is much wider than the spatial resolution of the instrument. In this representation, it is the variation of intensity I along the x and y axes that gives access to the morphological characteristics of the impression.
- the figure 24 illustrates the possibility for each measurement 101 in x, y and associated reflectogram A-scan 104 to apply the method described with reference to the figure 23 for accurately measuring the position 110 of the peak of interest via the knowledge of the spectral phase ⁇ ( ⁇ ), in order to obtain 3D surface images of the external imprint 115 and the internal imprint 116.
- the reference used to measure the phase information is preferably the average envelope of the surface of the finger.
- This average envelope corresponds to the envelope surface of the finger without the furrows.
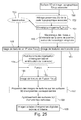
- a 3D surface can be encoded as a topographic image S (x, y) 150, where each (x, y) is associated with a flight time or phase value.
- the average envelope 151 called Em (x, y), is then obtained by applying an averaging filter 152, in particular a 2D low-pass filter, to the topographic image S (x, y). Since the grooves are of higher spatial frequencies, they are removed during the filtering operation.
- the reference of flight time or phase measurements is no longer taken at the level of the sensor probe but at the level of the average envelope. Consequently, the resulting image 155 advantageously represents not the spectral phase values ⁇ m , but rather their ⁇ variations, which makes it possible to have a more contrasted texture image.
- the figure 26 illustrates an example of the result obtained by performing these operations.
- the contrast of this texture image can be further improved by applying adaptive histogram equalization (step 154) and then a contrast adjustment using a sigmoid function, the medium of which is determined by the Otsu method, of considering that Image to binarize contains only two classes of pixels, the foreground and the background, and to calculate the optimal threshold that separates these two classes so that their intra-class variance is minimal.
- Knowing the average envelope also allows the intensity levels to be averaged (step 160) to obtain an intensity texture image 161, which may also undergo contrast adjustment processing (step 154).
- the P (x, y) and I (x, y) phase images can be merged at step 165 to obtain a merging texture image 166.
- These texture images can be projected (step 167) onto the images. corresponding 3D surfaces.
- a flattening (step 168) of the 3D surfaces thus textured can be performed to obtain flattened internal and external fingerprint images 169.
- the intensity image of the same internal footprint represented in Figure 11 (b) , has unusable areas with very low contrast. These zones are random because they depend inter alia on the local diffusion properties of the biological tissue but also on the angle of incidence of the probe of the coherent optical tomography acquisition system, especially in the case of a contactless measurement where the measurement is not reproducible.
- the Figure 12 (a) represents a raw phase image, the figure 12 (b) representing the corresponding image delivered at the exit of the " matcher ". These images compare to the intensity images presented in figure 2 , previously described. The positions of the unexploitable areas of the image of the figure 12 (b) are different from that of the Figure 2 (b) . Thus, using both the characteristics extracted from the image in intensity and those of the image in phase makes it possible to improve the identification of the person corresponding to this fingerprint.
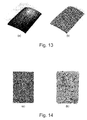
- the Figure 13 (a) represents a 3D image of the external footprint on which the phase information was projected, obtained from the tomographic volume of the figure 1 , according to the invention.
- This example does not make it possible to obtain good impression images directly, since the furrows can not be discerned properly.
- the reference for measuring the flight time ie the probe of the acquisition system OCT, is not located at an equal distance for all the points of the surface of the finger.
- the average envelope of the surface of the finger is taken as a reference for the flight time.
- the furrows in this case are clearly visible.
- the image containing intensity information and the image containing phase information are merged to form a single image, using the confidence cards of each image delivering pixel-by-pixel quality values.
- An image formed by the fusion of the image in intensity of the Figure 2 (a) and the image in phase of the Figure 12 (a) is visible at the Figure 14 (a) , the image corresponding to the output of the " matcher " being represented at Figure 14 (b) . Thanks to the fusion, the resulting image is of much better quality, the unusable areas having almost disappeared.
- the figure 15 represents internal fingerprints, the associated minutiae, and the reliability map of the orientation of the grooves for the images in phase, in intensity and for the fusion of the two.
- Complementary images were considered in order to use the known representation of fingerprints.
- the images on the first line correspond to the flattened internal impression images in the three representations.
- the images in the second line represent the same images after pretreatment and binarization steps, the Verifinger software, developed by Neurotechnology, having been used in the example described.
- the minutiae extracted from the binarized image represented by the black dots, exploited by the matchers , are used for the identification step by matching the minutiae of two fingerprint images. digitalis.
- the image quality is poor for some regions, as represented by black circles. For such regions, the fingerprint grooves are not visible. As a result, the quality of these regions is not sufficient to ensure correct minutia detection, as illustrated by the white holes in the binarized images.
- the dark pixels correspond to the low values of reliability while the bright pixels correspond to the high values.
- intensity and phase representations low values of reliability are associated with areas of poor quality. It should be noted that, preferably and in the example described, the problematic regions are not located at the same place in the two representations.
- the image of internal fingerprint after the fusion of images in intensity and phase is of much better quality, this image having been reconstructed by choosing the best regions of the two representations.
- the structure of the grooves is better preserved throughout the image.
- the regions with holes in the binarized image have disappeared, which leads to a more robust minutia detection.
- the reliability map for the post-merge image is a good illustration of the improvement in overall image quality, with clearer and more expansive areas.
- the figure 16 represents a comparison of the performances obtained for results from the different representations, on a basis comprising one hundred fingers, in terms of false acceptance rate FAR as a function of the rate of false FRR discharges.
- FAR detection error tradeoff
- These detection error tradeoff (DET) curves giving the false acceptance rate as a function of the false rejection rate, are known to evaluate the performance of the biometric systems. The more these curves are located downwards, the better the performances, a minimum false rejection rate being sought for a given false acceptance rate.
- the small dashed curve corresponds to the reference curve, obtained with an in-phase image of the external cavity, this fingerprint being by nature easily accessible to the various sensors.
- the broad dotted curve and the broken dashed curve respectively correspond to the curves of the internal impressions extracted by the intensity and phase images, and are at approximately the same level.
- the false rejection rate is degraded by a factor of 2-3 compared to the false rejection rate associated with the reference curve. This result demonstrates the difficulty of accessing the internal footprint.
- the curve in solid lines is calculated from the images after fusion.
- the false rejection rate is reduced by a factor of approximately 3-4 compared to the one associated with the curves corresponding to the phase and intensity internal cavity images.
- the false rejection rate is about 7% for post-merge images, compared to 26% for phased images and 20% for intensity images.
- the rate false rejection is around 4% for post-merge images, compared to 20% for phased images and 14% for intensity images. It should also be noted that performance is better with post-merge images than with in-phase external footprint images, with internal footprints better preserved than external footprints.
- Probability densities of client and impostor scores are represented in the figure 17 , obtained on a database of images of internal impressions extracted according to the invention, comprising 102 different fingers from 15 individuals, each finger having been acquired 4 times.
- the internal impression images in the three representations, intensity, phase and after fusion, were extracted from the tomographic volumes.
- each internal impression image was compared with all other images in the database, resulting in a total of 166056 fingerprint comparisons.
- the comparison of two images from the same finger is called customer correspondence or " genuine matching " in English, and the comparison of two images from different fingers is called impostor matching .
- Similarity scores are calculated with NBIS (NIST Biometric Image Software).
- the MINDTCT algorithm extracts the minutiae of a fingerprint image and the " matcher " BOZORTH3 returns the similarity score between two images.
- the final decision is made by comparing the similarity score obtained at a threshold, chosen according to the score densities and the desired performances. As client and impostor densities overlap, errors of false rejection or false acceptances are made during decision making. Verification performance is finally evaluated using the performance curves obtained by varying the matching threshold.
- the performances obtained demonstrate that the internal imprint allows identification of persons with performances comparable to those obtained by the known biometric readers on the external fingerprint of a dry finger. Identifying people with dirty or wet fingers is also more effective than is possible using known biometric systems.
- the figure 21 presents a comparison of the performances obtained by the use of the internal cavity extracted by fusion according to the invention with those obtained by the use of the external cavity extracted by the sensors according to the prior art, for example a 2D capacitive sensor . Similar FRRs are obtained for a fixed FAR.
- the performances obtained by using the internal cavity extracted by fusion according to the invention are better than those obtained by the sensors according to the prior art, for example a 2D capacitive sensor.
- the performances of the capacitive 2D sensor in the wet case are necessarily worse than those presented in the normal case, illustrated by the dashed curve of the figure 21 .
- the figures 18 and 19 show fingerprints obtained in the case of wet fingers. As visible at figure 18 , the intensity image has very low contrast zones in the wetlands.
- the corresponding images in phase and after fusion, obtained according to the invention, are represented respectively in FIGS. Figures 19 (a) and 19 (b) .
- the image in phase is of better quality than the image in intensity, presenting almost no defects which can harm the identification of the footprint and directly exploitable, and the image after fusion is also of very good quality.
- the Figures 22 (a) and 22 (b) represent the fingerprint images of a wet finger for two known 2D sensors, respectively an optical sensor and a capacitive sensor. Black stains due to excessive finger humidity are visible in the images. These tasks significantly degrade the quality of the images, and therefore decrease authentication performance. The corresponding binarized images show that the stained areas have not been recognized in the fingerprint. In comparison, the phase image obtained according to the invention, represented in FIG. figure 22 (c) , is of much better quality.
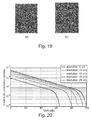
- the figure 20 represents the standard deviation of the location error as a function of the signal-to-noise ratio SNR, defined as the ratio between the peak intensity level and that of the background noise, as previously described with reference to the figure 4 for different axial resolutions, from 5 ⁇ m to 25 ⁇ m.
- SNR signal-to-noise ratio
- the location error is estimated between 60 nm and 350 nm.
- the location error is well below the axial resolution of the acquisition system, evaluated at about 10 ⁇ m in the example considered.
- the location accuracy is also well below the order of magnitude of the wavelength of the light source used, approximately equal to 1300 nm.
- the invention makes it possible to distinguish correctly by phase measurements the hollows and the vertices of the grooves of the fingerprints.
- the invention can make it possible to provide an OCT biometric sensor that performs well in imaging, at a lower cost than known sensors.
- 3D fingerprint identification requires tools that are more complex to implement than traditional 2D image matching tools, as described in the article.
- A. Kumar and C. Kwong "Toward Contacless, Low-Cost and 3D Acurrate Fingerprint Identification", CVPR IEEE Conference, 2013, pp. 3438-3443 .
- the 3D fingerprints obtained according to the invention are advantageously transformed into 2D images by means of a texture matching method on 3D surfaces , close to that described in the article of the invention.
- G. Zigelman et al. “Texture mapping using flattening surface via multidimensional scaling", IEEE transaction on Visualization and Computer Graphics, vol. 8, no. 2, 2002 .
- the invention can be used in the morphological study and analysis of biological materials, particularly in the medical field, for example for medical imaging requiring the study of the morphology of material surfaces. Biologicals located deep beneath the skin.
- the invention can be used to detect another fraud technique, consisting of erasing the external fingerprint, which renders inoperative any technique authentication by the external imprint. If you want to detect fraud, rather than authenticate the person, seeing no external fingerprint but seeing an internal fingerprint can trigger an indicator of possible fraud.
Landscapes
- Engineering & Computer Science (AREA)
- Health & Medical Sciences (AREA)
- Life Sciences & Earth Sciences (AREA)
- Physics & Mathematics (AREA)
- General Physics & Mathematics (AREA)
- General Health & Medical Sciences (AREA)
- Theoretical Computer Science (AREA)
- Pathology (AREA)
- Biomedical Technology (AREA)
- Molecular Biology (AREA)
- Multimedia (AREA)
- Medical Informatics (AREA)
- Animal Behavior & Ethology (AREA)
- Public Health (AREA)
- Veterinary Medicine (AREA)
- Surgery (AREA)
- Heart & Thoracic Surgery (AREA)
- Biophysics (AREA)
- Human Computer Interaction (AREA)
- Nuclear Medicine, Radiotherapy & Molecular Imaging (AREA)
- Radiology & Medical Imaging (AREA)
- Computer Vision & Pattern Recognition (AREA)
- Chemical & Material Sciences (AREA)
- Signal Processing (AREA)
- Analytical Chemistry (AREA)
- Urology & Nephrology (AREA)
- Food Science & Technology (AREA)
- Medicinal Chemistry (AREA)
- Hematology (AREA)
- Biochemistry (AREA)
- Immunology (AREA)
- Measurement Of The Respiration, Hearing Ability, Form, And Blood Characteristics Of Living Organisms (AREA)
- Length Measuring Devices By Optical Means (AREA)
- Image Input (AREA)
- Collating Specific Patterns (AREA)
Abstract
Description
- La présente invention concerne un procédé d'extraction de caractéristiques morphologiques de matériels biologiques, en particulier des empreintes digitales, notamment internes ou externes, utilisant des signaux délivrés par des dispositifs d'acquisition par tomographie optique cohérente, notamment pour la biométrie.
- La technique d'imagerie tomographique optique cohérente (OCT) est une technique d'imagerie optique sans contact puissante qui est actuellement couramment utilisée dans le secteur médical. Elle commence à être utilisée pour des applications grand public, notamment pour des applications biométriques. Les problématiques propres à ce type d'applications s'avèrent actuellement différentes et étroitement liées à l'étude de propriétés de surfaces délimitées à partir d'informations natives tridimensionnelles.
- Par construction, un dispositif d'imagerie SW-OCT est un dispositif interférentiel réalisé à partir d'un interféromètre (de type Michelson ou Mach-Zender) et une source accordable. Chaque mesure consiste en l'enregistrement du signal interférométrique en fonction de la fréquence de la source. Les signaux complexes (intensité et phase) sont donc nativement enregistrés dans le domaine spectral.
- Ces signaux sont usuellement représentés dans le domaine spatial (ou temporel puisque la position peut être ramenée à un temps de vol de la lumière) après transformée de Fourier du signal enregistré. Le signal complexe ainsi obtenu est appelé A-scan.
- Pour un objet statique (i.e. non soumis à une déformation temporelle et par ailleurs immobile), au voisinage de chaque centre de diffusion considéré comme achromatique (ou de réflexion), la phase spatiale évolue linéairement avec distance selon l'axe z.
- Lorsque l'objet possède des propriétés dynamiques (déformation et/ou déplacement), toute variation de la phase spatiale en des instants de mesures différents est associée à un effet Doppler.
- La phase spectrale relative à un centre diffusant évolue linéairement avec la fréquence υ de la source. A un coefficient de proportionnalité près, la pente de la phase dans le domaine spectral, définie par dφm/dυ, permet de connaître la position spatiale du centre diffusant (ou le temps de vol mis par la lumière pour atteindre le centre diffusant).
- Dans l'étude de la morphologie des différentes couches de matériels biologiques situés sous la peau, comme représenté à la
figure 1 , les méthodes connues exploitent seulement les informations d'intensité, notamment pour la segmentation d'images en intensité afin de délimiter des surfaces séparant deux matériels biologiques distincts. Cette segmentation est délicate, l'intensité du signal délivré par le capteur OCT étant étroitement dépendante des tissus situés au-dessus du tissu d'intérêt. Cela crée une variabilité dans la segmentation des images utilisées qui nuit à l'extraction de la surface recherchée. Dans le domaine de la biométrie, les images de l'empreinte digitale interne située sous la peau, à l'interface « épiderme / derme » obtenue après segmentation présentent des zones non exploitables avec ce type de capture et ne permettent donc pas toujours une identification des personnes aisée et fiable. Pourtant, les empreintes internes sont mieux préservées que les empreintes externes, ne subissant pas les mêmes altérations de leur propriétés de surface que ces dernières, comme des cicatrices, des tâches, par exemple de l'encre ou de la saleté, ou encore la variation de l'humidité surfacique du doigt, notamment due à la transpiration ou aux conditions d'humidité ambiante. L'empreinte digitale interne est donc une information biométrique très pertinente car plus stable au cours du temps et moins tributaire des variations environnementales. Elle peut par ailleurs permettre l'authentification d'une personne dont l'empreinte digitale externe est abîmée. - L'empreinte digitale interne peut également permettre de détecter une tentative de fraude d'identité. En effet, une méthode de fraude connue, difficile à détecter par les capteurs biométriques connus, consiste à déposer sur le doigt de l'usurpateur une surcouche où est inscrite en relief une empreinte digitale d'une autre personne. Cette surcouche est difficile à détecter, notamment car sous celle-ci se trouve un doigt réel avec du sang oxygéné, et la température de la surcouche est proche de celle de la surface d'un doigt réel.
- La
figure 1 représente une image typique obtenue d'un doigt par tomographie optique cohérente. Sur cette figure, on a représenté le niveau du signal rétrodiffusé en fonction de la position spatiale. Comme représenté à lafigure 3(a) . la sonde du capteur OCT est déplacée à l'aide de deux miroirs galvanométriques suivant les axes X et Y Pour chaque position de la sonde, une mesure obtenue par interférométrie est enregistrée, comme décrit dans l'article de A. F. Fercher et al. « Optical Coherence Tomography - Principales and Applications », publié dans « Reports on progress in physics », 2003, n°66, pages 239-303. Cela consiste en une mesure de l'intensité rétrodiffusée en fonction du temps de vol, c'est-à-dire le temps que met la lumière à traverser les différentes couches de l'échantillon examiné. La distance de propagation à partir de la sonde peut être trouvée en multipliant le temps de vol par la vitesse de la lumière. Un profil de réflectivité de la lumière en profondeur est alors obtenu, appelé « A-scan » et représenté à lafigure 3(b) . - Un exemple de profil « A-scan » en intensité d'un doigt est représenté en
figure 4 . Le signal d'intérêt correspondant au signal provenant de la partie superficielle externe du doigt est compris entre le premier pic numéroté 1 et le troisième pic numéroté 3. Avant le premier pic numéroté 1, seul le bruit de fond est visible. Le pic numéroté 1 correspond à l'interface air/peau, c'est-à-dire à l'empreinte digitale externe. Il s'agit de l'interface où le saut d'indice optique est le plus grand, dû à l'inhomogénéité des deux milieux, induisant l'amplitude plus élevée du pic. En cas de tentative de fraude, le pic numéroté 1 correspond à l'interface air/surcouche. Après ce pic, l'intensité du signal décroit globalement. Cette décroissance est due aux phénomènes d'absorption et de diffusion au fur et à mesure de la pénétration de la lumière dans le tissu ou la surcouche, et donc au cours de sa pénétration dans les différentes couches de la peau ou la surcouche. - La détection de la position du pic d'intensité maximale permet de localiser l'interface air/peau ou air/surcouche. En récupérant la position du maximum de chaque profil « A-scan » du volume tomographique, correspondant au temps de vol de la lumière entre la sonde et la surface externe du doigt, on peut construire une surface en trois dimensions, dite surface 3D, associée à l'empreinte digitale externe.
- Pour former sélectivement l'image de l'empreinte interne et l'isoler du reste du volume, les méthodes connues reposent sur un filtrage spatial suivant l'axe Z. Ce filtrage permet d'obtenir un niveau moyen de l'intensité rétrodiffusée autour de la profondeur à laquelle se situe l'empreinte interne. La zone de filtrage correspond alors au voisinage spatial du deuxième pic principal de chaque profil « A-scan », directement lié à la surface 3D de l'empreinte interne.. L'image ainsi obtenue , dite image en intensité, est présentée à la
figure 2(a) . Ces méthodes sont décrites notamment dans l'article de A. Bossen et al. « Internal Fingerprint identification with optical coherence tomography », publié dans « IEEE Photonics technology letters », Vol. 22, No. 7, 2010 et l'article de M. Liu et al. « Biometric mapping of fingertip eccrine glands with optical coherence tomography » publié dans « IEEE photonics technology letters », Vol. 22, No. 22, 2010. Lafigure 2(b) représente l'image traitée par un système logiciel, appelé « matcher » en anglais, chargé de mettre l'image sous forme de données binaires et de repérer les minuties de l'empreinte, les points caractéristiques de l'empreinte servant à l'identification. Certaines zones où le contraste de l'empreinte est faible apparaissent en blanc. Pour un même doigt, la position de ces zones peut varier en fonction des conditions expérimentales, ou du positionnement du doigt par rapport au capteur. Les performances obtenues à partir de l'image en intensité peuvent présenter des zones difficiles à exploiter en raison de la qualité des images, comme visible à lafigure 2(b) . - Dans le cas de l'empreinte externe, cette information de contraste d'intensité est en outre très variable en fonction de l'état de la surface du doigt, s'il est tâché, par de l'encre par exemple, ou humide. Les performances en vérification d'empreintes sont notamment très dégradées dans le cas de doigts humides dans des acquisitions effectuées par des capteurs connus, tels que par exemple les capteurs capacitifs ou optiques avec contact, donnant des images en deux dimensions, ou les capteurs optiques sans contact dits « 2 dimensions ½ », comme mentionné dans les articles de R. Cappelli et al. "Performances evaluation of fingerprint verification systems", IEEE transactions on pattern analysis and maching intelligence, vol. 28, No. 1, 2006, et de L.C. Jain et al. "Intelligent biometric techniques in fingerprint and face recognition", chapitre 2, Vol. 10, CRC press, 1999. Cette dégradation des performances survient également pour les capteurs biométriques sans contact tel que l'OCT. La
figure 5 présente un exemple expérimental d'image OCT en coupe transversale extraite de façon traditionnelle, représentative d'un bout de doigt avec présence de microgouttelettes en sa surface, simulant le comportement d'un doigt en conditions de forte humidité ou de transpiration. L'image en intensité de cet exemple de doigt humide, présentée à lafigure 6 , contient des taches blanches, dues entre autre à la présence des gouttelettes qui modifient localement les propriétés optiques du doigt, créant un effet de lentille parasite par exemple. Les lecteurs d'empreintes digitales connus visant à authentifier des personnes s'avèrent ainsi non opérationnels dans des conditions d'humidité élevées, aucune image fiable de l'empreinte d'un doigt mouillé ne pouvant être fournie. Dans l'approche présentée dans l'article susmentionné de A. Bossen et al., l'acquisition est réalisée par contact du doigt sur une plaque de verre, conduisant à un aplatissement du doigt. - La
figure 7 représente une coupe transversale où le derme papillaire, c'est-à-dire l'empreinte interne, est bien visible. Sur cette même figure est représentée la zone de jonction, ou « junction zone » en anglais, située entre le derme et l'épiderme. La largeur et la position de cette zone a été fixée empiriquement entre 0.1mm et 0.9mm à l'intérieur du doigt, de telle manière à contenir l'interface de l'empreinte interne. La zone de jonction tridimensionnelle complète peut être obtenue à partir des signaux des différents A-scans Axy(z), pour une position de sonde positionnée en (x,y). Elle contiendra alors toute l'empreinte interne en 3D. L'image d'intensité I(x,y) de l'empreinte interne est alors obtenue en moyennant suivant la direction z le signal Axy(z) sur la zone de jonction :
- Dans le cas où le doigt n'est pas aplati lors de l'acquisition, l'image I(x, y) peut être projetée sur la surface 3D de l'empreinte interne, obtenue grâce aux mesures de phase. L'empreinte 3D interne obtenue avec cette méthode est visible à la
figure 8 . Les performances de cette approche dans le contexte de la biométrie ne sont pas non plus suffisantes en raison de la qualité dégradée des images obtenues.US 2014/0241596 etUS 2015/016127 divulguent des procédés visant à représenter les écoulements sanguins dans les réseaux vasculaires du doigt, afin de vérifier que c'est bien l'image d'un doigt vivant qui est acquise. L'information pertinente ici est une information de type Doppler, et il est proposé d'effectuer des différences de phase entre des A-scans (profils de réflectivité en profondeur) successifs. Ce traitement implique nécessairement que la phase en question soit une phase dans le domaine « spatial ». Il n'y a aucune mesure effectuée sur la phase dans le domaine spectral. - L'article Novelty Detection-Based Internal Fingerprint Segmentation in Optical Coherence Tomography Images 2014 Second International Symposium on Computing and Networking Rethabile Khutlang et al divulgue un procédé de segmentation de l'empreinte interne. Les traitements sont effectués B-scan par B-scan (coupes transversales) et non pas A-scan par A-scan (profil de l'intensité rétrodiffusée suivant la profondeur, ou de manière équivalente suivant le temps de vol). L'empreinte n'est ainsi pas segmentée à partir de mesures de distances sur des A-scans (traitement du signal), mais grâce à des méthodes de clustering (GMMs et k-means) appliquées aux B-scans (traitement d'images). Il n'y a aucune mention de mesures de distances via la phase dans le domaine spectral.
- L'article Internal fingerprint zone détection in optical coherence tomography fingertip scans Journal of electronic Imaging 24(2) Mar/apr 2015 a également pour finalité une segmentation de l'empreinte interne. Premièrement, l'interface de l'empreinte interne est grossièrement segmentée à partir d'une méthode de « clustering ». Des « features » permettant de décrire les A-scans sont choisis pour la mise en oeuvre du « clustering ». Deuxièmement, une fois l'empreinte interne grossièrement segmentée, une estimation plus précise de la position de la jonction papillaire (couche de la peau formant l'empreinte interne) est effectuée grâce à des opérations de traitements d'images appliquées B-scan par B-scan. Dans cet article, l'empreinte interne n'est donc pas segmentée à partir de mesures de distances via la phase dans le domaine spectral. Par ailleurs, aucune fusion d'images n'est réalisée.
- L'article Biometric Mapping of Fingertip Eccrine Glands With Optical Coherence Tomography IEEE Photonics Technology Letters Vol 22, No.22, November 15, 2010 divulgue un procédé visant à obtenir une cartographie des pores de sudation. Il n'y a aucune mention de mesures de distances, plus spécifiquement de mesures de distances via la phase dans le domaine spectral.
- L'article Impact of Quality-Based Fusion Techniques for Video-Based Iris Recognition at a Distance Nadia Othman and Bernadette Dorrizi IEEE TRANSACTIONS on INFORMATION FORENSICS AND SECURITY, VOL 10, No. 8, AUGUST 2015 décrit un procédé de fusion mise en oeuvre pour améliorer la qualité d'images biométriques d'iris provenant de flux video, et non d'empreintes digitales.
- Il existe un besoin pour améliorer la qualité des informations de la morphologie de surface externe ou interne des matériels biologiques provenant de dispositifs d'acquisition par tomographie optique cohérente, afin notamment d'extraire et d'identifier de façon efficace des empreintes digitales internes ainsi que des empreintes digitales externes en conditions difficiles.
- L'invention vise à satisfaire ce besoin, et elle y parvient grâce à un procédé d'extraction de caractéristiques morphologiques d'un échantillon de matériel biologique, en particulier des empreintes digitales, notamment internes ou externes, utilisant un système d'acquisition par tomographie optique cohérente délivrant un signal représentatif de l'échantillon,
procédé dans lequel une image contenant des informations d'intensité et une image contenant des informations de phase sont formées à partir au moins du signal délivré par le système d'acquisition et représentatif de l'échantillon, afin d'extraire des caractéristiques morphologiques de l'échantillon. - L'image contenant des informations d'intensité et l'image contenant des informations de phase ne sont pas équivalentes en termes de contenu d'information. Même si leurs qualités sont comparables, les informations qu'elles contiennent sont complémentaires, et permettent de faciliter et d'optimiser l'extraction des caractéristiques morphologiques de l'échantillon à utiliser.
- Le procédé selon l'invention peut ainsi être utilisé dans le domaine de la biométrie hautement sécurisée, visant la détection de fraude dans l'identification de personnes, en utilisant notamment l'empreinte digitale interne pour la comparer à l'empreinte externe, ou l'identification biométrique fiable en conditions difficiles, par exemple dans le cas de doigts humides ou sales, ou dans le cas d'une empreinte digitale externe plus ou moins effacée.
- Dans le cas d'un doigt humide, dans l'image contenant les informations de phase, les maxima d'intensité rétrodiffusée sont toujours localisés au niveau de l'empreinte externe, et pas au niveau de la couche d'eau ou des gouttelettes. La récupération de la position de ces maxima d'intensité, grâce à la connaissance du temps de vol de la lumière, permet de reconstruire convenablement la structure 3D de l'empreinte externe. La mesure précise du temps de vol est avantageusement effectuée à partir de la connaissance de la phase du signal dans le domaine spectral. L'image en phase obtenue est ainsi de bien meilleure qualité, , assurant des performances plus robustes en identification biométrique que celle obtenues à partir des seules images en intensité, telles qu'obtenues par les capteurs biométriques connus ou bien avec les méthodes d'imagerie OCT de l'état de l'art.
- Exploiter les informations de phase, correspondant au temps de vol de la lumière, permet de compenser la variabilité de l'intensité de diffusion de la lumière en jeu dans les propriétés de l'image, et notamment le fait qu'elles sont sensibles à l'angle d'incidence du faisceau lumineux avec la normale de la surface de l'échantillon à étudier.
- Le deuxième pic de l'intensité d'un profil « A-scan », numéroté 2 à la
figure 4 , est attribué à l'empreinte digitale interne, ou à l'interface surcouche/doigt dans le cas d'une fraude. Il reflète les fortes inhomogénéités de la peau au niveau du derme papillaire, une couche de la peau située entre le derme et l'épiderme, correspondant à un changement d'organisation cellulaire, visible à lafigure 7 . Ainsi, de la même manière que précédemment décrit, il est avantageux de reconstruire une représentation 3D de l'empreinte interne en récupérant la position du deuxième pic de plus grande réflectivité pour chaque profil « A-scan » du volume tomographique. - Un profil de réflectivité de la lumière en profondeur étant établi à partir du signal représentatif de l'échantillon délivré par le système d'acquisition, ce profil de réflectivité présentant plusieurs pics de réflectivité maximale, on peut déterminer, afin de former l'image contenant des informations de phase, la position d'un pic de réflectivité maximale dudit profil de réflectivité, choisi selon le type de données à extraire. Le pic d'intérêt pour l'empreinte externe correspond de préférence au premier pic de réflectivité maximale du profil de réflectivité, et le pic d'intérêt pour l'empreinte interne correspond de préférence au deuxième pic. On peut obtenir au final des surfaces 3D associées aux empreintes externe ou interne, suivant le pic considéré.
- Une fois la position du pic d'intérêt déterminée, un filtrage spatial du signal peut être effectué, notamment un filtrage passe-bande de l'interférogramme dans le domaine spatial, consistant au moins à retenir le signal interférométrique contenu dans une fenêtre centrée sur le pic d'intérêt et de largeur prédéfinie, notamment de l'ordre de grandeur de la résolution axiale du système d'acquisition OCT. Une transformation est alors avantageusement appliquée à ce signal afin d'obtenir des informations spectrales, notamment des informations spectrales en intensité et en phase concernant la diffusion enregistrée à l'interface air/doigt dans le cas d'une empreinte digitale externe ou à l'interface épiderme/derme dans le cas d'une empreinte digitale interne, la transformation étant notamment une transformée de Hilbert pour obtenir le signal interférométrique complexe. Afin d'obtenir les informations de phase recherchées, la pente de la phase est avantageusement calculée par une régression linéaire de la dépendance spectrale de la phase, obtenue à partir des informations spectrales obtenues par transformation du signal spatialement filtré.
- Dans le cas où l'échantillon est une empreinte digitale, la référence utilisée pour mesurer les informations de phase est de préférence l'enveloppe moyenne de la surface du doigt. Cette enveloppe moyenne correspond à la surface enveloppe du doigt sans les sillons, comme représenté à la
figure 9 . Une surface 3D peut être codée comme une image topographique S(x, y), où à chaque (x, y) est associé une valeur de profondeur, ou de préférence ici, une valeur de temps de vol ou de phase. L'enveloppe moyenne, appelée Em(x, y), est alors obtenue en appliquant un filtre moyenneur, notamment un filtre passe-bas 2D, sur l'image topographique S(x, y). Les sillons étant de fréquences spatiales plus élevées, ceux-ci sont avantageusement supprimés lors de l'opération de filtrage. - Pour l'empreinte interne, l'enveloppe moyenne correspond à une surface interne du doigt, localisée au niveau de l'empreinte interne, obtenue en filtrant l'image tomographique associée à la surface 3D de l'empreinte interne.
- Une image de textures 2D P(x, y), dite image en phase, peut être obtenue en faisant la soustraction entre S(x) et Em(x, y) : P(x,y) = S(x,y) - Em(x,y). De cette manière, la référence des mesures de temps de vol ou de phase n'est plus prise au niveau de la sonde du capteur mais au niveau de l'enveloppe moyenne. Par conséquent, l'image résultante représente avantageusement non pas les valeurs de phase Φ, mais plutôt leurs variations ΔΦ, ce qui permet d'avoir une image de texture plus contrastée.
- Le contraste de cette image de texture peut être encore amélioré en appliquant une égalisation d'histogramme adaptative puis un ajustement de contraste utilisant une fonction sigmoïde, dont le milieu est déterminé par la méthode d'Otsu, consistant à considérer que l'image à binariser ne contient que deux classes de pixels, le premier plan et l'arrière-plan, et à calculer le seuil optimal qui sépare ces deux classes afin que leur variance intra-classe soit minimale.
- De la même manière que pour l'image I(x, y), l'image de textures P(x, y) peut être projetée sur la surface 3D de l'empreinte interne représentée à la
figure 11(a) . - L'invention permet de détecter les fraudes par utilisation de surcouches, en comparant l'empreinte digitale associée au premier pic de réflectivité maximale à celle associée au deuxième pic. Si ces empreintes sont différentes, il y a fraude.
- L'invention a encore pour objet, selon un autre de ses aspects, un procédé pour générer une image comportant une information liée à la position d'une interface entre deux milieux, notamment l'air et la peau ou le derme et l'épiderme, à partir d'un interférogramme d'une empreinte, digitale ou palmaire, interne ou externe obtenu par SW-OCT dans le domaine spectral, comportant les étapes consistant à :
- Appliquer à l'interférogramme une transformation, notamment de Fourrier, pour générer un réflectogramme dans le domaine temporel,
- estimer à partir de ce réflectogramme une position spatiale de l'interface correspondant à l'image de l'empreinte interne ou externe que l'on cherche à imager.
- De préférence, la position est déterminée en appliquant un filtrage passe bande pour isoler le pic de réflectivité correspondant à l'interface recherchée et en appliquant au réflectogramme ainsi filtré une transformation inverse, notamment une transformation de Fourrier inverse, pour générer un interférogramme filtré, dans le domaine spectral.
Cet interférogramme peut être utilisé pour déterminer la pente de la droite de régression linéaire de la phase spectrale φ(υ) en fonction de la fréquence υ, puis le temps de vol τ0 et la position z0 de l'interface correspondant au pic de réflectivité par la formule
- Une surface 3D peut être générée à partir de la connaissance de la position z0 en chaque point x,y du pic de réflectivité considéré, et donc de l'interface concernée, Le premier pic peut donner la position de l'interface air/peau, correspondant à l'empreinte externe, et la deuxième celle de l'interface épiderme/derme correspondant à l'interface interne.
- Un filtrage passe-bas 2D peut être appliqué à une telle surface pour obtenir une enveloppe moyenne Em(x,y) de la position de l'interface.
- Cette enveloppe peut être prise comme référence pour générer par soustraction une image de texture en phase P(x,y).
- Cette image de texture en phase peut être fusionnée avec une image de texture en intensité I(x,y) pour obtenir une image de texture de fusion, laquelle peut être ensuite projetée une surface 3D afin d'obtenir une surface 3D d'empreinte texturée aplatie.
- On peut procéder ainsi pour obtenir des images d'empreintes digitales interne et externe.
- Dans un mode de réalisation préféré de l'invention, l'image contenant des informations d'intensité et l'image contenant des informations de phase sont fusionnées pour former une seule image.
- Pour ce faire, la structure de chaque image contenant respectivement des informations d'intensité et des informations de phase est analysée afin d'établir pour chaque image une carte de confiance contenant une valeur de qualité pour chaque pixel, en fonction des pixels voisins. Les cartes de confiance des images se fondent notamment sur la présence d'un bon contraste et sur la qualité locale des sillons présents sur les images, dans le cas d'une empreinte digitale.
- Chaque pixel de l'image de fusion F entre l'image I contenant des informations d'intensité et l'image P contenant des informations de phase est avantageusement issu d'une combinaison linéaire des valeurs des pixels correspondants des deux images, pondérées par les valeurs de qualité des cartes de confiance :



valeur de qualité du pixel (x, y) de l'image I, avec 0 < CI (x,y) < 1, CP (x,y) la valeur de qualité du pixel (x, y) de l'image P, avec 0 < Cp (x,y) < 1, et Norm = CI (x,y) + CP (x,y). Si Norm = 0, on fixe de préférence αI = αP = 0.5. Selon la formule de fusion utilisée, les valeurs αI et αP peuvent être exprimées différemment, l'invention n'est pas limitée à un calcul particulier pour les valeurs αI et αP. - Dans une variante, l'image de fusion entre l'image contenant des informations d'intensité et l'image contenant des informations de phase est avantageusement formée en retenant, pour chaque pixel, le pixel de l'image ayant la valeur de qualité la plus élevée :

- L'image de fusion entre l'image contenant des informations d'intensité et l'image contenant des informations de phase est ainsi avantageusement formée pixel par pixel, en fonction du voisinage de chaque pixel, grâce aux cartes de confiance.
- Dans le cas où l'image considérée est une empreinte digitale, la valeur de qualité d'un pixel, (CP (x,y) ou CI (x,y)), peut être obtenue à partir de cartes de fiabilité des champs d'orientation des sillons de l'empreinte, ou « orientation field reliability map » en anglais, comme décrit dans les articles de J. Zhou et J. Gu, "A Model-based for the computation of fingerprint's orientation field", IEEE Transactions on Image Processing, vol.13, no. 6, 2004, et de M. S. Khalil, "Deducting fingerprint singular points using orientation field reliability", First conference on robot, vision and signal processing, pp. 234-286, 2011. Les champs d'orientation des sillons représentent la direction des sillons pour chaque position dans l'empreinte. Ils sont calculés pour chaque pixel de l'image d'empreinte digitale, en fonction de leur voisinage. L'utilisation de tels champs d'orientation en biométrie des empreintes digitales est connue, par exemple dans des méthodes d'amélioration d'images d'empreintes digitales telles que celle décrite dans l'article de L. Hong et al. "Fingerprint image enhancement: algorithm and performance evaluation", IEEE Transaction on Pattern Analysis and Machine Intelligence, vol.20, no.8, 1998. Les cartes de fiabilité des champs d'orientation permettent d'évaluer la validité et la fiabilité de l'estimation de l'orientation des sillons.
- Une région d'image d'empreinte digitale de faible qualité peut être caractérisée par le fait que la texture des sillons n'est pas apparente, la structure périodique caractéristique des sillons n'y étant pas retrouvée. Dans de telles régions, l'estimation de l'orientation est mauvaise car il n'y a pas d'orientation prépondérante. Par conséquent, la valeur de la fiabilité est faible. Inversement, dans des régions d'empreintes très structurées, la présence d'une direction particulière peut être estimée de manière fiable. La valeur de la fiabilité pour ces régions est élevée.
- Comme expliqué dans les articles de C. Sousedik et al. "Volumetric Fingerprint Data Analysis using Optical Coherence Tomography", BIOSIG Conference, 2013, pp. 1-6, et de C. Sousedik et C. Bush, " Quality of fingerprint scans captured using Optical Coherence Tomography", IJCB Conference, 2014, pp. 1-8, la structure de l'empreinte interne peut être assez inhomogène, contrairement à celle de l'empreinte externe, qui est bien continue, conduisant à une ambigüité sur la position du deuxième pic de réflectivité maximale. La structure de l'empreinte interne peut également varier grandement d'un individu à l'autre. Détecter la position de l'empreinte interne par des mesures de temps de vol peut être délicat, dans la mesure où l'interface n'est pas obligatoirement bien définie.
- En outre, la rétrodiffusion de la lumière dans la peau fait intervenir des phénomènes physiques complexes et difficiles à prédire, liés aux interférences entre les ondes multiples rétrodiffusées par les structures biologiques. Il n'est pas évident que, dans une empreinte digitale, les sommets des sillons correspondent à des maxima de réflectivité et les creux à des minima, ou vice versa.
- La fusion des images en phase et en intensité permet de tirer le meilleur profit des informations disponibles sur l'ensemble des deux images, et ainsi d'améliorer de façon importante la qualité de l'image finale obtenue sur la surface recherchée. Par exemple dans le secteur de la biométrie, il en découle une amélioration importante des performances d'identification basée sur l'empreinte sous-cutanée, en utilisant les algorithmes d'identification biométriques connus.
- La précision de localisation des pics de réflectivité maximale conditionne en partie la qualité des images 3D et 2D en phase. La précision de localisation, différente de la résolution axiale, est une notion peu connue de l'art antérieur, et peu exploitée dans les applications biomédicales.
- La résolution axiale correspond à la distance minimale nécessaire entre deux centres de diffusion afin de pouvoir les distinguer correctement, et est seulement dépendante de la largeur spectrale de la source lumineuse. Elle peut être mesurée à partir de la largeur à mi-hauteur d'un pic associé à un unique centre de diffusion, par exemple le premier pic numéroté 1.
- La précision de localisation est avantageusement liée à l'erreur de localisation du maxima de l'enveloppe des différents profils « A-scan ». Afin d'évaluer la précision de localisation, une étude statistique est réalisée, consistant à simuler le pic associé à un unique centre de diffusion, dont la position est fixée lors de la simulation, en prenant en compte les différentes contributions de bruit du photo-détecteur du système d'acquisition, principalement le bruit thermique et le bruit de grenaille qui ont des distributions assimilables à un bruit blanc. Ce bruit peut avoir un impact plus ou moins important, selon sa puissance, sur la position mesurée du pic maximum. L'erreur faite sur la position peut être évaluée par la différence entre la position du maximum du profil « A-scan » bruité simulé et celle du profil « A-scan » de référence utilisé, connue au préalable. On définit alors la précision de localisation du système d'acquisition par l'écart type de cette erreur de localisation. L'écart type est avantageusement obtenu à partir d'un grand nombre de tirages aléatoires de profils « A-scan » bruités.
- Selon un autre de ses aspects, l'invention concerne un dispositif d'extraction de caractéristiques morphologiques d'un échantillon de matériel biologique, en particulier des empreintes digitales, notamment internes ou externes, comprenant un système d'acquisition par tomographie optique cohérente délivrant un signal représentatif de l'échantillon,
le dispositif étant configuré pour former, à partir au moins du signal délivré par le système d'acquisition et représentatif de l'échantillon, une image contenant des informations d'intensité et une image contenant des informations de phase, afin d'extraire des caractéristiques morphologiques de l'échantillon. - Dans un mode de réalisation préféré de l'invention, le dispositif est configuré en outre pour fusionner l'image contenant des informations d'intensité et l'image contenant des informations de phase afin de former une seule image.
- Les caractéristiques décrites précédemment pour le procédé selon l'invention s'appliquent au dispositif.
- Le champ de vue du dispositif, correspondant à l'étendue spatiale maximale dans le plan X-Y pouvant être enregistrée, peut être étendu, atteignant par exemple 2 mm par 2 mm, soit 4 mm2, mieux 2 cm par 2 cm, soit 4cm2. Cela permet d'obtenir un nombre important de minuties, dans le cas de l'extraction d'une empreinte digitale.
- L'invention pourra être mieux comprise à la lecture de la description détaillée qui va suivre, d'exemples non limitatifs de mise en oeuvre de celle-ci, et à l'examen du dessin annexé, sur lequel :
- la
figure 1 , précédemment décrite, représente une image volumique obtenue par un système d'acquisition par tomographie optique cohérente sur un doigt, - les
figures 2(a) et 2(b) , précédemment décrites, représentent, respectivement, l'image en intensité et l'image traitée obtenues, selon l'art antérieur, à partir du volume de lafigure 1 , - les
figures 3(a) et 3(b) , précédemment décrites, représentent, respectivement, l'acquisition d'une empreinte digitale par tomographie et le profil « A-scan » obtenu en fonction du temps de vol de la lumière, - la
figure 4 , précédemment décrite, représente l'intensité d'un profil « A-scan » en fonction de la profondeur, - la
figure 5 , précédemment décrite, illustre la présence de gouttes d'eau à la surface d'un doigt, - la
figure 6 , précédemment décrite, représente l'image en intensité du doigt humide de lafigure 5 , obtenue par OCT selon l'art antérieur, - la
figure 7 , précédemment décrite, représente la coupe transversale d'un volume tomographique obtenu selon l'art antérieur, - la
figure 8 , précédemment décrite, représente l'empreinte digitale interne 3D obtenue à partir du volume de lafigure 7 obtenu selon une méthode l'art antérieur, - la
figure 9 , précédemment décrite, illustre l'enveloppe moyenne de la surface d'un doigt, - la
figure 10 représente un dispositif OCT selon l'invention, - la
figure 11(a) représente l'image en phase et lafigure 11(b) représente l'image en intensité de l'empreinte interne, projetées sur la surface 3D correspondante, obtenues par la mise en oeuvre du procédé selon l'invention, à partir du volume tomographique de lafigure 1 , - les
figures 12(a) et 12(b) représentent, respectivement, l'image en phase et l'image traitée de l'empreinte interne, obtenues, selon l'invention, à partir du volume tomographique de lafigure 1 , - la
figure 13 illustre une comparaison entre deux images en phase obtenues selon l'invention, - les
figures 14(a) et 14(b) représentent, respectivement, l'image fusionnée des informations en phase et en intensité, et l'image traitée, obtenues selon l'invention, - la
figure 15 représente des empreintes digitales internes, les minuties associées, et la carte de fiabilité de l'orientation des sillons pour les images en phase, en intensité et pour la fusion des deux, obtenues selon l'invention, - la
figure 16 est un graphe présentant des courbes de performance obtenues par la mise en oeuvre du procédé selon l'invention, - la
figure 17 est un graphe représentant les densités de probabilité de scores client et de scores imposteur, utilisant une base de données d'images d'empreintes internes extraites selon l'invention, - la
figure 18 représente une image en intensité d'une empreinte digitale dans le cas d'un doigt humidifié, - les
figures 19(b) et 19(a) représentent, respectivement, une image après fusion d'une empreinte digitale dans le cas du doigt humidifié de lafigure 17 , obtenue selon l'invention, et l'image en phase correspondante, - la
figure 20 est un graphe représentant l'erreur de localisation selon l'invention en fonction du rapport signal à bruit et de la résolution axiale, - la
figure 21 est un graphe présentant des courbes de performance comparatives, - la
figure 22 illustre une comparaison d'images obtenues à partir d'un doigt humide, avec des capteurs selon l'art antérieur et selon l'invention, et - les
figures 23 à 26 illustrent différentes étapes d'un exemple de procédé selon l'invention. - Un dispositif OCT 10 permettant de mettre en oeuvre l'invention est représenté à la
figure 10 . Ce dispositif 10 comporte une source à balayage 11 configurée pour balayer l'échantillon à différentes profondeurs, un miroir 12, un miroir partiel 13, et un interféromètre de Michelson 14. Chaque balayage de longueur d'onde, ou « A-scan » en anglais, produit des franges d'interférence à partir des réflexions de l'échantillon à différentes profondeurs. - On va maintenant décrire en référence aux
figures 23 à 25 un exemple de procédé selon l'invention, pour chaque position x,y de la sonde. - Comme illustré à la
figure 23 , pour obtenir les images en phase P(x,y) on peut partir d'un interférogramme 102 dans le domaine spectral, à partir d'une mesure SW-OCT (étape 101). - Par transformée de Fourrier 103 on obtient un réflectogramme 104 dans le domaine temporel, qui permet (étape 105) une estimation de la position du pic d'intérêt (interface air/doigt, épiderme/derme, ....) par mesure directe du temps de vol, à l'aide de l'enveloppe de chaque A-scan.
- On peut faire subir à ce réflectogramme 104 un filtrage passe-bande dans le domaine spatial autour du pic d'intérêt (étape 106), ce qui isole ce pic, puis obtenir par une transformée de Fourrier inverse 107 un interférogramme filtré dans le domaine spectral.
- Une transformée de Hilbert 109 peut permettre de récupérer un signal complexe dans le domaine spectral, dont l'argument fournit la phase spectrale 110 et un traitement statistique 111 par régression linéaire le coefficient directeur dφ(υ)/dυ de la pente, et donc le temps de vol 102 du pic d'intérêt, c'est-à-dire sa position spatiale.
- L'image générée à partir de l'information de phase spectrale consiste dans cet exemple en la représentation en niveau de gris du temps de vol τ(x,y). Dans cette représentation, la résolution spatiale de la mesure n'est pas dégradée. La variation du temps de vol suivant les axes x et y permet d'accéder aux caractéristiques morphologiques de l'empreinte.
- Une telle image se distingue du mode d'imagerie en intensité proposé dans l'article de Bossen et al cité plus haut. En effet, plutôt que de représenter le temps de vol τ(x,y), Bossen propose de représenter I(x,y) où I(x,y) représente l'intensité moyenne de l'enveloppe du A-scan aux alentours du pic d'intérêt. La zone de moyennage spatial considérée, typiquement entre 100μm-900μm, est bien plus large que la résolution spatiale de l'instrument. Dans cette représentation, c'est la variation de l'intensité I suivant les axes x et y qui permet d'accéder aux caractéristiques morphologiques de l'empreinte.
- La
figure 24 illustre la possibilité pour chaque mesure 101 en x,y et réflectogramme A-scan associé 104 d'appliquer le procédé décrit en référence à lafigure 23 pour mesurer précisément la position 110 du pic d'intérêt via la connaissance de la phase spectrale φ(υ), afin d'obtenir des images de surface 3D de l'empreinte externe 115 et de l'empreinte interne 116. - On va maintenant décrire en référence à la
figure 25 un exemple de procédé de fusion des images en phase et en intensité, après extraction par un processus 140 tel que décrit par exemple en référence auxfigures 23 et 24 des surfaces 3D des empreintes. - Dans le cas où l'échantillon est une empreinte digitale, la référence utilisée pour mesurer les informations de phase est de préférence l'enveloppe moyenne de la surface du doigt. Cette enveloppe moyenne correspond à la surface enveloppe du doigt sans les sillons. Une surface 3D peut être codée comme une image topographique S(x, y) 150, où à chaque (x, y) est associée une valeur de temps de vol ou de phase. L'enveloppe moyenne 151, appelée Em(x, y), est alors obtenue en appliquant un filtre moyenneur 152 , notamment un filtre passe-bas 2D, sur l'image topographique S(x, y). Les sillons étant de fréquences spatiales plus élevées, ceux-ci sont supprimés lors de l'opération de filtrage.
- Une image de textures 2D P(x, y), dite image en phase, peut être obtenue en faisant la soustraction (étape 153) entre S(x) et Em(x, y) : P(x, y) = S(x, y) - Em(x, y). De cette manière, la référence des mesures de temps de vol ou de phase n'est plus prise au niveau de la sonde du capteur mais au niveau de l'enveloppe moyenne. Par conséquent, l'image résultante 155 représente avantageusement non pas les valeurs de phase spectrale Φm, mais plutôt leurs variations ΔΦ, ce qui permet d'avoir une image de texture plus contrastée.
- La
figure 26 illustre un exemple de résultat obtenu en effectuant ces opérations. - Le contraste de cette image de texture peut être encore amélioré en appliquant une égalisation d'histogramme adaptative (étape 154) puis un ajustement de contraste utilisant une fonction sigmoïde, dont le milieu est déterminé par la méthode d'Otsu, consistant à considérer que l'image à binariser ne contient que deux classes de pixels, le premier plan et l'arrière-plan, et à calculer le seuil optimal qui sépare ces deux classes afin que leur variance intra-classe soit minimale.
- La connaissance de l'enveloppe moyenne permet également de moyenner les niveaux d'intensité (étape 160) pour obtenir une image de texture en intensité 161, laquelle peut subir également un traitement d'ajustement du contraste (étape 154).
- Les images en phase P(x,y) et en intensité I(x,y) peuvent être fusionnées à l'étape 165 pour obtenir une image de texture de fusion 166. Ces images de texture peuvent être projetées (étape 167) sur les surfaces 3D correspondantes.
- Un aplatissement (étape 168) des surfaces 3D ainsi texturées peut être réalisé pour obtenir des images d'empreintes interne et externe aplaties 169.
- Une image 3D en phase de l'empreinte interne obtenue, selon l'invention, à partir du volume tomographique de la
figure 1 , est représentée à lafigure 11(a) . - L'image en intensité de la même empreinte interne, représentée à la
figure 11(b) , présente des zones inexploitables à très faible contraste. Ces zones sont aléatoires car elles dépendent entre autres des propriétés de diffusion locales du tissu biologique mais aussi de l'angle d'incidence de la sonde du système d'acquisition par tomographie optique cohérente, notamment dans le cas d'une mesure sans contact où la mesure est non reproductible. - La
figure 12(a) représente une image en phase brute, lafigure 12(b) représentant l'image correspondante délivrée à la sortie du « matcher ». Ces images sont à comparer aux images en intensité présentées à lafigure 2 , précédemment décrite. Les positions des zones inexploitables de l'image de lafigure 12(b) sont différentes de celle de lafigure 2(b) . Ainsi, utiliser à la fois les caractéristiques extraites de l'image en intensité et celles de l'image en phase permet d'améliorer l'identification de la personne correspondant à cette empreinte digitale. - La
figure 13(a) représente une image 3D de l'empreinte externe sur laquelle a été projetée l'information de la phase, obtenue à partir du volume tomographique de lafigure 1 , selon l'invention. Les fortes valeurs, représentées en blanc, correspondent à un temps de vol court entre la sonde du système d'acquisition OCT et la surface de l'empreinte, et les faibles valeurs d'intensité, représentées en noir, correspondent à un temps de vol plus long. Cet exemple ne permet pas d'obtenir directement des images d'empreintes de bonne qualité, dans la mesure où l'on ne peut discerner convenablement les sillons. Cela est dû au fait que la référence pour mesurer le temps de vol, c'est-à-dire la sonde du système d'acquisition OCT, n'est pas située à une distance égale pour tous les points de la surface du doigt. Afin d'obtenir un meilleur contraste, comme décrit précédemment, l'enveloppe moyenne de la surface du doigt est prise comme référence pour le temps de vol. Comme visible à lafigure 13(b) , représentant l'empreinte 3D sur laquelle a été projetée l'information en delta-phase, c'est-à-dire les variations de la phase, correspondant à l'information pertinente pour avoir des images d'empreintes bien contrastées, les sillons sont dans ce cas bien visibles. - Comme décrit précédemment, l'image contenant des informations d'intensité et l'image contenant des informations de phase sont fusionnées pour former une seule image, en utilisant les cartes de confiance de chaque image délivrant des valeurs de qualité pixel par pixel. Une image formée par la fusion de l'image en intensité de la
figure 2(a) et de l'image en phase de lafigure 12(a) est visible à lafigure 14(a) , l'image correspondant à la sortie du « matcher » étant représentée à lafigure 14(b) . Grâce à la fusion, l'image résultante est de bien meilleure qualité, les zones inexploitables ayant quasiment disparu. - La
figure 15 représente des empreintes digitales internes, les minuties associées, et la carte de fiabilité de l'orientation des sillons pour les images en phase, en intensité et pour la fusion des deux. Les images complémentaires ont été considérées afin d'utiliser la représentation connue des empreintes digitales. Les images sur la première ligne correspondent aux images d'empreinte interne aplatie, dans les trois représentations. Les images de la deuxième ligne représentent les mêmes images après des étapes de prétraitements et de binarisation, le logiciel Verifinger, développé par Neurotechnology, ayant été utilisé dans l'exemple décrit. Sur ces images, les minuties extraites à partir de l'image binarisée, représentées par les points noirs, exploitées par les « matchers », sont utilisées pour l'étape d'identification par la mise en correspondance des minuties de deux images d'empreinte digitale. Pour les deux représentations en phase et en intensité, la qualité d'image est médiocre pour certaines régions, comme représenté par des cercles noirs. Pour de telles régions, les sillons des empreintes digitales ne sont pas visibles. Par conséquent, la qualité de ces régions n'est pas suffisante pour assurer une détection de minuties correcte, comme illustré par les trous blancs dans les images binarisées. Dans les représentations des cartes de fiabilité des champs d'orientations des sillons, les pixels sombres correspondent aux valeurs faibles de fiabilité tandis que les pixels clairs correspondent aux valeurs élevées. Dans les représentations en intensité et en phase, de faibles valeurs de fiabilité sont associées aux zones de mauvaise qualité. Il est à noter que, de préférence et dans l'exemple décrit, les régions problématiques ne sont pas localisées au même endroit dans les deux représentations. - Comme visible sur la dernière colonne de la
figure 15 , l'image d'empreinte digitale interne après la fusion des images en intensité et en phase est de bien meilleure qualité, cette image ayant été reconstruite en choisissant les meilleures régions des deux représentations. La structure des sillons est mieux préservée sur l'ensemble de l'image. Les régions avec des trous dans l'image binarisée ont disparu, ce qui amène à une détection de minuties plus robuste. La carte de fiabilité pour l'image après fusion illustre bien l'amélioration de la qualité globale de l'image, les zones claires étant plus nombreuses et plus étendues. - La
figure 16 représente une comparaison des performances obtenues pour des résultats provenant des différentes représentations, sur une base comprenant une centaine de doigts, en termes de taux de fausse acceptation FAR en fonction du taux de faux rejets FRR. Ces courbes de compromis d'erreur de détection (DET pour « detection error tradeoff » en anglais), donnant le taux de fausse acceptation en fonction du taux de faux rejets, sont connues pour évaluer les performances des systèmes biométriques. Plus ces courbes sont situées vers le bas, meilleures sont les performances, un taux de faux rejets minimum étant recherché pour un taux de fausse acceptation donné. La courbe en petits pointillés correspond à la courbe de référence, obtenue avec une image en phase de l'empreinte externe, cette empreinte étant par nature aisément accessible aux différents capteurs. - La courbe en pointillés larges et la courbe en pointillés discontinus correspondent respectivement aux courbes des empreintes internes extraites par les images en intensité et en phase, et sont environ au même niveau. Pour un taux de fausse acceptation de 10-3 par exemple, le taux de faux rejets est dégradé d'un facteur 2-3 par rapport au taux de faux rejets associé à la courbe de référence. Ce résultat témoigne de la difficulté d'accéder à l'empreinte interne. La courbe en traits pleins est calculée à partir des images après fusion. Pour ce même taux de fausse acceptation, le taux de faux rejets est diminué d'un facteur d'environ 3-4 par rapport à celui associé aux courbes correspondant aux images d'empreinte interne en phase et en intensité. Dans un autre exemple, pour un taux de fausse acceptation de 0.01%, le taux de faux rejets est d'environ 7% pour les images après fusion, contre 26% pour les images en phase et 20% pour les images en intensité. Pour un taux de fausse acceptation de 0.1 %, le taux de faux rejets est d'environ 4% pour les images après fusion, contre 20% pour les images en phase et 14% pour les images en intensité. Il est à noter en outre que les performances sont meilleures avec les images d'empreinte interne après fusion qu'avec les images d'empreinte externe en phase, les empreintes internes étant mieux préservées que les empreintes externes.
- Des densités de probabilité de scores client et imposteur sont représentées à la
figure 17 , obtenues sur une base de données d'images d'empreintes internes extraites selon l'invention, comportant 102 doigts différents issus de 15 individus, chaque doigt ayant été acquis 4 fois. Les images d'empreintes internes dans les trois représentations, intensité, phase et après fusion, ont été extraites des volumes tomographiques. Pour les tests de vérification, chaque image d'empreinte interne a été comparée avec toutes les autres images de la base, conduisant à un total de 166056 comparaisons d'empreintes. La comparaison de deux images provenant d'un même doigt est appelée correspondance client, ou « genuine matching » en anglais, et la comparaison de deux images issues de doigts différents est appelé correspondance imposteur, ou « impostor matching ». Les scores de similarité sont calculés avec le logiciel NBIS (NIST Biometric Image Software). Dans cet exemple, l'algorithme MINDTCT permet d'extraire les minuties d'une image d'empreinte et le « matcher » BOZORTH3 retourne le score de similarité entre deux images. Deux densités de probabilité de scores, la densité client et la densité imposteur, sont obtenues, la capacité à discerner ces densités permettant de quantifier les performances d'un système biométrique. La décision finale est prise en comparant le score de similarité obtenu à un seuil, choisi en fonction des densités de score et des performances souhaitées. Comme les densités client et imposteur se recouvrent, des erreurs de faux rejets ou de fausses acceptations sont faites lors de la prise de décision. Les performances en vérification sont finalement évaluées à l'aide des courbes de performance obtenues en faisant varier le seuil de correspondance. - Les performances obtenues démontrent que l'empreinte interne permet une identification des personnes avec des performances comparables à celles obtenues par les lecteurs biométriques connus sur l'empreinte externe d'un doigt sec. L'identification des personnes présentant des doigts sales ou humides est également plus efficace que ce qui est possible en utilisant les systèmes biométriques connus. La
figure 21 présente une comparaison des performances obtenues par l'utilisation de l'empreinte interne extraite par fusion selon l'invention à celles obtenues par l'utilisation de l'empreinte externe extraite par les capteurs selon l'art antérieur, par exemple un capteur 2D capacitif. Des FRR similaires sont obtenus pour un FAR fixe. - Par extension, dans le cas de doigts humides, les performances obtenues par utilisation de l'empreinte interne extraite par fusion selon l'invention sont meilleures que celles obtenues par les capteurs selon l'art antérieur, par exemple un capteur 2D capacitif En effet, les performances du capteur 2D capacitif dans le cas humide sont forcément moins bonnes que celles présentées dans le cas normal, illustrées par la courbe en pointillés de la
figure 21 . - Les
figures 18 et19 montrent des empreintes digitales obtenues dans le cas de doigts humides. Comme visible à lafigure 18 , l'image en intensité présente des zones très peu contrastées au niveau des zones humides. Les images correspondantes en phase et après fusion, obtenues selon l'invention, sont représentées respectivement auxfigures 19(a) et 19(b) . L'image en phase est de meilleure qualité que l'image en intensité, ne présentant presque pas de défauts pouvant nuire à l'identification de l'empreinte et directement exploitable, et l'image après fusion est aussi de très bonne qualité,. - Les
figures 22(a) et 22(b) représentent les images d'empreintes digitales d'un doigt humide pour deux capteurs 2D connus, respectivement un capteur optique et un capteur capacitif. Des tâches noires dues à l'humidité excessive du doigt sont visibles dans les images. Ces tâches dégradent considérablement la qualité des images, et diminuent par conséquent les performances en authentification. Les images binarisées correspondantes montrent que les zones tâchées n'ont pas été reconnues dans l'empreinte digitale. En comparaison, l'image en phase obtenue selon l'invention, représentée à lafigure 22(c) , est de bien meilleure qualité. - La
figure 20 représente l'écart type de l'erreur de localisation en fonction du rapport signal à bruit SNR, défini comme le rapport entre le niveau d'intensité du pic et celui du bruit de fond, comme décrit précédemment en référence à lafigure 4 , pour différentes résolutions axiales, de 5 µm à 25 µm. Pour un rapport signal à bruit de 50 dB, correspondant à une valeur typique pour une rétrodiffusion à l'interface air/peau, l'erreur de localisation est estimée entre 60 nm et 350 nm. L'erreur de localisation est bien en dessous de la résolution axiale du système d'acquisition, évaluée à environ 10 µm dans l'exemple considéré. La précision de localisation est également bien en dessous de l'ordre de grandeur de la longueur d'onde de la source lumineuse utilisée, environ égale à 1300 nm. - En considérant, selon le principe d'ergodicité, que les statistiques d'ensemble des profils « A-scan » simulés sont équivalentes aux statistiques spatiales, il apparaît que la contribution du bruit lors de l'extraction de la surface 3D des empreintes est négligeable par rapport à la profondeur moyenne d'un sillon, environ égale à 50 µm. L'invention permet ainsi de distinguer correctement par mesures de phase les creux et les sommets des sillons des empreintes digitales. En outre, même dans le cas de performances instrumentales plus faibles, c'est-à-dire pour une résolution axiale faible, il est encore possible d'extraire les sillons de l'empreinte digitale avec une grande précision. L'invention peut permettre de proposer un capteur biométrique OCT performant en imagerie, à plus bas coût que les capteurs connus.
- L'invention n'est pas limitée aux exemples qui viennent d'être décrits. L'identification d'empreintes digitales en 3D requiert des outils plus complexes à mettre en oeuvre que les outils traditionnels de correspondance d'images 2D, comme décrit dans l'article de A. Kumar et C. Kwong, "Toward Contacless, Low-Cost and Acurrate 3D fingerprint Identification", CVPR IEEE Conference, 2013, pp. 3438-3443. Dans l'objectif de pouvoir réutiliser des outils déjà existants, les empreintes digitales 3D obtenues selon l'invention sont avantageusement transformées en des images 2D grâce à une méthode de correspondance de texture sur des surfaces 3D, proche de celle décrite dans l'article de G. Zigelman et al. "Texture mapping using surface flattening via multidimensional scaling", IEEE transaction on Visualization and Computer Graphics, vol. 8, no. 2, 2002. Cette méthode repose sur l'utilisation de l'algorithme de « Fast Marching » en anglais, décrit dans l'article de R. Kimmel et J. A. Sethian, "Computing geodesic paths on manifolds", applied mathemathics, Vol. 95, pp. 8431-8435, 1998, et de l'algorithme MDS pour « Multidimensiononal scaling » en anglais. En particulier, pour l'aplatissement d'une empreinte digitale 3D, l'algorithme de « Fast Marching » est utilisé pour calculer les distances géodésiques à partir d'un maillage triangulaire de son enveloppe moyenne, c'est-à-dire la surface 3D de l'empreinte sans les sillons. L'algorithme de « Multidimensionnal Scaling » est appliqué pour transformer la surface 3D maillée en une image 2D, sous la contrainte de la minimisation des distorsions des distances géodésiques. Cela permet de préserver au mieux les distances entre les minuties, ce qui est particulièrement intéressant dans le contexte de la biométrie. Différentes images de textures peuvent être projetées sur cette surface 2D aplatie, par exemple l'image de textures en intensité I(x, y), l'image de textures en phase P(x, y), ou l'image de textures en fusion F(x, y). L'invention n'est toutefois pas limitée à un type particulier de méthode pour transformer les images 3D en images 2D.
- Outre le secteur de la biométrie, l'invention peut être utilisée dans l'étude et l'analyse morphologiques de matériels biologiques, notamment dans le domaine médical, par exemple pour l'imagerie médicale requérant l'étude de la morphologie de surfaces de matériels biologiques situés en profondeur sous la peau.
- L'invention peut être utilisée afin de détecter une autre technique de fraude, consistant à effacer l'empreinte digitale externe, ce qui rend inopérante toute technique d'authentification par l'empreinte externe. Si l'on cherche à détecter la fraude, plutôt qu'authentifier la personne, le fait de ne voir aucune empreinte externe mais de voir une empreinte interne permet de déclencher un indicateur de fraude éventuelle.
Claims (14)
- Procédé d'extraction de caractéristiques morphologiques d'un échantillon de matériel biologique à savoir des empreintes digitales, notamment internes ou externes, utilisant un système d'acquisition par tomographie optique cohérente (OCT) délivrant un signal représentatif de l'échantillon, procédé dans lequel, afin d'extraire des caractéristiques morphologiques de l'échantillon une image contenant des informations d'intensité et une image contenant des informations de phase correspondant au temps de vol de la lumière sont formées à partir au moins du signal délivré par le système d'acquisition et représentatif de l'échantillon, procédé dans lequel afin de former l'image contenant des informations de phase correspondant au temps de vol de la lumière, on détermine la position d'un pic de réflectivité maximale choisi en fonction des données à extraire, notamment celles de l'empreinte interne ou de l'empreinte externe, d'un profil de réflectivité de la lumière en profondeur (z) établi à partir du signal représentatif délivré par le système d'acquisition, ce profil de réflectivité présentant plusieurs pics de réflectivité maximale, dans lequel le pic d'intérêt pour l'empreinte externe correspond au premier pic de réflectivité maximale du profil de réflectivité, et le pic d'intérêt pour l'empreinte interne correspond au deuxième pic.
- Procédé selon la revendication 1, dans lequel on forme une image en phase P(x,y) en utilisant comme référence une enveloppe moyenne Em(x,y) de la surface 3D de l'empreinte considérée, notamment selon P(x,y) = S(x,y) - Em(x,y), où S(x,y) est une image topographique de la surface 3D de l'empreinte considérée, obtenue à partir de la détermination de la position des pics de réflectivité maximale pour chaque A-scan(x,y) du volume tomographique.
- Procédé selon la revendication 1 ou 2, dans lequel une image contenant des informations d'intensité, notamment l'image en intensité I(x,y), et l'image contenant des informations de phase, notamment l'image en phase P(x,y), sont fusionnées pour former une seule image.
- Procédé selon l'une quelconque des revendications 1 à 3, dans lequel la position du pic d'intérêt est estimée puis un filtrage spatial du signal est effectué, notamment un filtrage passe-bande de l'interférogramme dans le domaine spatial, consistant au moins à retenir le signal interférométrique contenu dans une fenêtre centrée sur le pic d'intérêt et de largeur prédéfinie, notamment de l'ordre de grandeur de la résolution axiale du système d'acquisition.
- Procédé selon la revendication précédente, dans lequel une transformation est appliquée au signal spatialement filtré afin d'obtenir des informations spectrales, notamment des informations spectrales en intensité et en phase concernant la diffusion enregistrée à l'interface air/doigt dans le cas de l'empreinte digitale externe ou à l'interface épiderme/derme dans le cas de l'empreinte digitale interne
- Procédé selon la revendication précédente, dans lequel, afin d'obtenir les informations de phase nécessaires à la formation de l'image en phase, la pente de la phase est calculée par une régression linéaire de la dépendance spectrale de la phase, obtenue à partir des informations spectrales obtenues par transformation du signal spatialement filtré.
- Procédé selon l'une quelconque des revendications 1 à 6, dont la revendication 3, dans lequel, pour fusionner l'image contenant des informations d'intensité et l'image contenant des informations de phase, la structure de chaque image est analysée afin d'établir pour chaque image une carte de confiance contenant une valeur de qualité pour chaque pixel, en fonction des pixels voisins.
- Procédé selon la revendication précédente, dans lequel chaque pixel de l'image de fusion entre l'image contenant des informations d'intensité et l'image contenant des informations de phase est issu d'une combinaison linéaire des valeurs des pixels correspondants des deux images, pondérées par les valeurs de qualité des cartes de confiance.
- Procédé selon la revendication 7, dans lequel l'image de fusion entre l'image contenant des informations d'intensité et l'image contenant des informations de phase est formée en retenant, pour chaque pixel, le pixel de l'image ayant la valeur de qualité la plus élevée.
- Procédé selon l'une quelconque des revendications précédentes, dont la revendication 2, dans lequel l'image en phase P(x, y) est projetée sur la surface 3D de l'empreinte interne correspondante.
- Procédé selon l'une quelconque des revendications 8 à 10, dans lequel, dans le cas où l'échantillon est une empreinte digitale, la valeur de qualité d'un pixel est obtenue à partir de cartes de fiabilité des champs d'orientation des sillons de l'empreinte.
- Dispositif d'extraction de caractéristiques morphologiques d'un échantillon de matériel biologique, à savoir des empreintes digitales, notamment internes ou externes, comprenant un système d'acquisition par tomographie optique cohérente délivrant un signal représentatif de l'échantillon, le dispositif étant configuré pour former, à partir au moins du signal délivré par le système d'acquisition et représentatif de l'échantillon, une image contenant des informations d'intensité, et une image contenant des informations de phase correspondant au temps de vol de la lumière, le dispositif étant configuré pour, afin de former l'image contenant des informations de phase correspondant au temps de vol de la lumière, déterminer la position d'un pic de réflectivité maximale choisi en fonction des données à extraire, notamment celles de l'empreinte interne ou de l'empreinte externe, d'un profil de réflectivité de la lumière en profondeur (z) établi à partir du signal représentatif délivré par le système d'acquisition, ce profil de réflectivité présentant plusieurs pics de réflectivité maximale, dans lequel le pic d'intérêt pour l'empreinte externe correspond au premier pic de réflectivité maximale du profil de réflectivité, et le pic d'intérêt pour l'empreinte interne correspond au deuxième pic.
- Dispositif selon la revendication 12, étant configuré pour former une image en phase P(x,y) en utilisant comme référence une enveloppe moyenne Em(x,y) de la surface 3D de l'empreinte considérée, avec P(x,y) = S(x,y) - Em(x,y), où S(x,y) est l'image topographique de la surface 3D de l'empreinte considérée, obtenue à partir de la détermination de la position du pic de réflectivité maximaled'intérêt (pour chaque A-scan(x,y) du volume tomographique) et pour fusionner l'image en intensité I(x,y) et l'image en phase P(x,y) afin de former une image de fusion F(x,y), une fois la position du pic d'intérêt estimée, effectuer un filtrage spatial du signal, notamment un filtrage passe-bande de l'interférogramme dans le domaine spatial, consistant au moins à retenir le signal interférométrique contenu dans une fenêtre centrée sur le pic d'intérêt et de largeur prédéfinie, notamment de l'ordre de grandeur de la résolution axiale du système d'acquisition, appliquer une transformation au signal spatialement filtré afin d'obtenir des informations spectrales, notamment des informations spectrales en intensité et en phase concernant la diffusion enregistrée à l'interface air/doigt dans le cas d'une empreinte digitale externe ou à l'interface épiderme/derme dans le cas d'une empreinte digitale interne, et pour, afin d'obtenir les informations de phase nécessaires à la formation de l'image en phase, calculer la pente de la phase par une régression linéaire de la dépendance spectrale de la phase, obtenue à partir des informations spectrales obtenues par transformation du signal spatialement filtré.
- Procédé de détection de fraudes par utilisation de surcouches, dans lequel on met en met oeuvre le procédé tel que défini à l'une quelconque 1 à 11 et l'on compare l'empreinte digitale associée au premier pic de réflectivité maximale à celle associée au deuxième pic.
Applications Claiming Priority (1)
| Application Number | Priority Date | Filing Date | Title |
|---|---|---|---|
| FR1558929A FR3041423B1 (fr) | 2015-09-22 | 2015-09-22 | Procede d'extraction de caracteristiques morphologiques d'un echantillon de materiel biologique |
Publications (2)
| Publication Number | Publication Date |
|---|---|
| EP3147822A1 true EP3147822A1 (fr) | 2017-03-29 |
| EP3147822B1 EP3147822B1 (fr) | 2021-03-03 |
Family
ID=55299575
Family Applications (1)
| Application Number | Title | Priority Date | Filing Date |
|---|---|---|---|
| EP16189504.0A Active EP3147822B1 (fr) | 2015-09-22 | 2016-09-19 | Procede d'extraction de caracteristiques morphologiques d'une empreinte digitale |
Country Status (8)
| Country | Link |
|---|---|
| US (1) | US10275629B2 (fr) |
| EP (1) | EP3147822B1 (fr) |
| KR (1) | KR20170035343A (fr) |
| CN (1) | CN107016326A (fr) |
| BR (1) | BR102016021860A2 (fr) |
| FR (1) | FR3041423B1 (fr) |
| MX (1) | MX364812B (fr) |
| ZA (1) | ZA201606537B (fr) |
Families Citing this family (19)
| Publication number | Priority date | Publication date | Assignee | Title |
|---|---|---|---|---|
| US10915728B2 (en) * | 2015-03-31 | 2021-02-09 | Nec Corporation | Biological pattern information processing device, biological pattern information processing method and program |
| CN105335713A (zh) * | 2015-10-28 | 2016-02-17 | 小米科技有限责任公司 | 指纹识别方法及装置 |
| US11120104B2 (en) * | 2017-03-01 | 2021-09-14 | Stmicroelectronics (Research & Development) Limited | Method and apparatus for processing a histogram output from a detector sensor |
| US11531756B1 (en) * | 2017-03-20 | 2022-12-20 | Hid Global Corporation | Apparatus for directing presentation attack detection in biometric scanners |
| CN107563364B (zh) * | 2017-10-23 | 2021-11-12 | 清华大学深圳研究生院 | 基于汗腺的指纹真伪辨别方法以及指纹识别方法 |
| US11024062B2 (en) | 2018-06-11 | 2021-06-01 | Shanghai United Imaging Healthcare Co., Ltd. | Systems and methods for evaluating image quality |
| CN109377481B (zh) * | 2018-09-27 | 2022-05-24 | 上海联影医疗科技股份有限公司 | 图像质量评价方法、装置、计算机设备和存储介质 |
| CN109247911B (zh) * | 2018-07-25 | 2021-04-06 | 浙江工业大学 | 一种手指多模态特征同步采集系统 |
| KR102592077B1 (ko) * | 2018-08-01 | 2023-10-19 | 삼성전자주식회사 | 생체정보 측정 장치 및 방법 |
| CN109063681A (zh) * | 2018-08-28 | 2018-12-21 | 哈尔滨理工大学 | 基于指纹相位梯度的指纹方向信息获取方法 |
| WO2020100626A1 (fr) | 2018-11-12 | 2020-05-22 | 日本電気株式会社 | Dispositif de tomographie par cohérence optique, procédé d'imagerie et programme d'imagerie avec stockage sur un support non transitoire lisible par ordinateur |
| KR102734293B1 (ko) | 2018-12-10 | 2024-11-26 | 삼성전자주식회사 | 지문 영상 전처리 방법 및 장치 |
| JP7107425B2 (ja) | 2019-02-22 | 2022-07-27 | 日本電気株式会社 | 処理装置、指紋画像抽出処理装置、システム、処理方法、及びプログラム |
| CN110297219B (zh) * | 2019-07-11 | 2021-09-14 | 北京遥感设备研究所 | 一种基于以太网数据传输的fpga相参性测试方法 |
| JP7732573B2 (ja) * | 2022-03-02 | 2025-09-02 | 日本電気株式会社 | 画像処理装置、画像処理方法、及び、記録媒体 |
| US20250029419A1 (en) * | 2022-03-25 | 2025-01-23 | Nec Corporation | Optical coherence tomography image generation apparatus, optical coherence tomography image generation method, and non-transitory recording medium |
| EP4517702A4 (fr) * | 2022-05-27 | 2025-05-14 | Samsung Electronics Co., Ltd. | Procédé d'acquisition d'informations d'empreintes digitales basé sur une identification de forme tridimensionnelle et dispositif électronique associé |
| CN114690730B (zh) * | 2022-06-01 | 2022-08-12 | 南通科特森新材料科技有限公司 | 一种复合材料生产工艺中工艺参数的自动控制方法及系统 |
| CN119837506B (zh) * | 2025-01-23 | 2025-08-15 | 杭州荣脑科技有限公司 | 电生理及血液动力学多模态智能可穿戴系统及数据评估方法 |
Citations (3)
| Publication number | Priority date | Publication date | Assignee | Title |
|---|---|---|---|---|
| US20140241596A1 (en) | 2013-02-28 | 2014-08-28 | The Regents Of The University Of California | Apparatus and Method for Capturing a Vital Vascular Fingerprint |
| US20150016127A1 (en) | 2009-12-04 | 2015-01-15 | Production Resource Group Llc | Moving Light with Follow Spot |
| US20150168127A1 (en) * | 2013-12-13 | 2015-06-18 | Nidek Co., Ltd. | Optical coherence tomography device |
Family Cites Families (2)
| Publication number | Priority date | Publication date | Assignee | Title |
|---|---|---|---|---|
| RU2059979C1 (ru) * | 1993-06-23 | 1996-05-10 | Владимир Николаевич Бичигов | Способ распознавания отпечатков папиллярных узоров |
| DE19818229A1 (de) * | 1998-04-24 | 1999-10-28 | Hauke Rudolf | System zur berührungslosen Hand- und Fingerlinien-Erkennung |
-
2015
- 2015-09-22 FR FR1558929A patent/FR3041423B1/fr active Active
-
2016
- 2016-09-15 MX MX2016012043A patent/MX364812B/es active IP Right Grant
- 2016-09-19 EP EP16189504.0A patent/EP3147822B1/fr active Active
- 2016-09-21 ZA ZA2016/06537A patent/ZA201606537B/en unknown
- 2016-09-22 KR KR1020160121596A patent/KR20170035343A/ko not_active Withdrawn
- 2016-09-22 US US15/272,767 patent/US10275629B2/en active Active
- 2016-09-22 BR BR102016021860A patent/BR102016021860A2/pt not_active Application Discontinuation
- 2016-09-22 CN CN201610843050.5A patent/CN107016326A/zh active Pending
Patent Citations (3)
| Publication number | Priority date | Publication date | Assignee | Title |
|---|---|---|---|---|
| US20150016127A1 (en) | 2009-12-04 | 2015-01-15 | Production Resource Group Llc | Moving Light with Follow Spot |
| US20140241596A1 (en) | 2013-02-28 | 2014-08-28 | The Regents Of The University Of California | Apparatus and Method for Capturing a Vital Vascular Fingerprint |
| US20150168127A1 (en) * | 2013-12-13 | 2015-06-18 | Nidek Co., Ltd. | Optical coherence tomography device |
Non-Patent Citations (22)
| Title |
|---|
| "Biometric Mapping of Fingertip Eccrine Glands With Optical Coherence Tomography", IEEE PHOTONICS TECHNOLOGY LETTERS, vol. 22, no. 22, 15 November 2010 (2010-11-15) |
| "Internai fingerprint zone détection in optical coherence tomography fingertip scans", JOURNAL OF ELECTRONIC IMAGING, vol. 24, no. 2, March 2015 (2015-03-01) |
| A. BOSSEN ET AL.: "Internai Finge print identification with optical coherence tomography", IEEE PHOTONICS TECHNOLOGY LETTERS, vol. 22, no. 7, 2010 |
| A. F. FERCHER ET AL.: "Optical Coherence Tomography - Principles and Applications", REPORTS ON PROGRESS IN PHYSICS, 2003, pages 239 - 303, XP002346303, DOI: doi:10.1088/0034-4885/66/2/204 |
| A. KUMAR; C. KWONG: "Toward Contacless, Low-Cost and Acurrate 3D finge print Identification", CVPR IEEE CONFÉRENCE, 2013, pages 3438 - 3443 |
| BOSSEN A ET AL: "Internal Fingerprint Identification With Optical Coherence Tomography", IEEE PHOTONICS TECHNOLOGY LETTERS, IEEE SERVICE CENTER, PISCATAWAY, NJ, US, vol. 22, no. 7, 1 April 2010 (2010-04-01), pages 507 - 509, XP011301136, ISSN: 1041-1135 * |
| C. SOUSEDIK ET AL.: "Volumetric Finge print Data Analysis using Optical Coherence Tomography", BIOSIG CONFÉRENCE, 2013, pages 1 - 6 |
| C. SOUSEDIK; C. BUSH: "Quality of fingerprint scans captured using Optical Coherence Tomography", IJCB CONFÉRENCE, 2014, pages 1 - 8, XP032714756, DOI: doi:10.1109/BTAS.2014.6996294 |
| G. ZIGELMAN ET AL.: "Texture mapping using surface fiattening via multidimensional scaling", IEEE TRANSACTIONS ON VISUALIZATION AND COMPUTER GRAPHICS, vol. 8, no. 2, 2002, XP011094455, DOI: doi:10.1109/2945.998671 |
| J. ZHOU; J. GU: "A Model-based for the computation of finge print's orientation field", IEEE TRANSACTIONS ON IMAGE PROCESSING,, vol. 13, no. 6, 2004 |
| KHUTLANG RETHABILE ET AL: "Novelty Detection-Based Internal Fingerprint Segmentation in Optical Coherence Tomography Images", 2014 SECOND INTERNATIONAL SYMPOSIUM ON COMPUTING AND NETWORKING, IEEE, 10 December 2014 (2014-12-10), pages 556 - 559, XP032741753, DOI: 10.1109/CANDAR.2014.73 * |
| L. HONG ET AL.: "Fingerprint image enhancement: algorithm and performance évaluation", IEEE TRANSACTIONS ON PATTERN ANALYSIS AND MACHINE INTELLIGENCE, vol. 20, no. 8, 1998, XP000774452, DOI: doi:10.1109/34.709565 |
| L.C. JAIN ET AL.: "Intelligent biométrie techniques in finge print and face récognition", vol. 10, 1999, CRC PRESS |
| LUKE NICHOLAS DARLOW ET AL: "Internal fingerprint zone detection in optical coherence tomography fingertip scans", JOURNAL OF ELECTRONIC IMAGING., vol. 24, no. 2, 9 April 2015 (2015-04-09), 1000 20th St. Bellingham WA 98225-6705 USA, pages 023027, XP055273786, ISSN: 1017-9909, DOI: 10.1117/1.JEI.24.2.023027 * |
| M. LIU ET AL.: "Biométric mapping of fingertip eccrine glands with optical coherence tomography", IEEE PHOTONICS TECHNOLOGY LETTERS, vol. 22, no. 22, 2010, XP011319083 |
| M. S. KHALIL: "Deducting finge print singular points using orientation field reliability", FIRST CONFÉRENCE ON ROBOT, VISION AND SIGNAL PROCESSING, 2011, pages 234 - 286 |
| MENGYANG LIU ET AL: "Biometric Mapping of Fingertip Eccrine Glands With Optical Coherence Tomography", IEEE PHOTONICS TECHNOLOGY LETTERS, IEEE SERVICE CENTER, PISCATAWAY, NJ, US, vol. 22, no. 22, 15 November 2010 (2010-11-15), pages 1677 - 1679, XP011319083, ISSN: 1041-1135 * |
| NADIA OTHMAN; BERNADETTE DORRIZI: "Impact of Quality-Based Fusion Techniques for Video-Based Iris Récognition at a Distance", IEEE TRANSACTIONS ON INFORMATION FORENSICS AND SECURITY, vol. 10, no. 8, August 2015 (2015-08-01), XP011584579, DOI: doi:10.1109/TIFS.2015.2421314 |
| OTHMAN NADIA ET AL: "Impact of Quality-Based Fusion Techniques for Video-Based Iris Recognition at a Distance", IEEE TRANSACTIONS ON INFORMATION FORENSICS AND SECURITY, IEEE, PISCATAWAY, NJ, US, vol. 10, no. 8, 1 August 2015 (2015-08-01), pages 1590 - 1602, XP011584579, ISSN: 1556-6013, [retrieved on 20150617], DOI: 10.1109/TIFS.2015.2421314 * |
| R. CAPPELLI ET AL.: "Performances évaluation of finge print vérification systems", IEEE TRANSACTIONS ON PATTERN ANALYSIS AND MACHING INTELLIGENCE, vol. 28, no. 1, 2006 |
| R. KIMMEL; J. A. SETHIAN: "Computing géodésie paths on manifolds", APPLIED MATHEMATHICS, vol. 95, 1998, pages 8431 - 8435 |
| RETHABILE KHUTLANG: "Novelty Detection-Based Internai Fingerprint Segmentation in Optical Coherence Tomography Images", SECOND INTERNATIONAL SYMPOSIUM ON COMPUTING AND NETWORKING, 2014 |
Also Published As
| Publication number | Publication date |
|---|---|
| FR3041423B1 (fr) | 2019-10-04 |
| MX2016012043A (es) | 2017-03-30 |
| ZA201606537B (en) | 2019-09-25 |
| US10275629B2 (en) | 2019-04-30 |
| CN107016326A (zh) | 2017-08-04 |
| EP3147822B1 (fr) | 2021-03-03 |
| MX364812B (es) | 2019-05-08 |
| KR20170035343A (ko) | 2017-03-30 |
| FR3041423A1 (fr) | 2017-03-24 |
| US20170083742A1 (en) | 2017-03-23 |
| BR102016021860A2 (pt) | 2017-03-28 |
Similar Documents
| Publication | Publication Date | Title |
|---|---|---|
| EP3147822B1 (fr) | Procede d'extraction de caracteristiques morphologiques d'une empreinte digitale | |
| Liu et al. | A flexible touch-based fingerprint acquisition device and a benchmark database using optical coherence tomography | |
| US8687856B2 (en) | Methods, systems and computer program products for biometric identification by tissue imaging using optical coherence tomography (OCT) | |
| US9384404B2 (en) | Apparatus and method for capturing a vital vascular fingerprint | |
| EP2902943B1 (fr) | Procédé de validation de l'utilisation d'un vrai doigt comme support d'une empreinte digitale | |
| Liu et al. | Biometric mapping of fingertip eccrine glands with optical coherence tomography | |
| US9361518B2 (en) | Methods, systems and computer program products for diagnosing conditions using unique codes generated from a multidimensional image of a sample | |
| EP3608834A1 (fr) | Procede d'analyse d'une empreinte | |
| WO2011051382A1 (fr) | Procede et dispositif d'analyse d'images hyper-spectrales. | |
| Dubey et al. | Simultaneous topography and tomography of latent fingerprints using full-field swept-source optical coherence tomography | |
| Aum et al. | Live acquisition of internal fingerprint with automated detection of subsurface layers using OCT | |
| EP3044729B1 (fr) | Procédé de validation destiné à valider qu'un élément est recouvert d'une vraie peau | |
| WO2012001289A1 (fr) | Procede et dispositif de detection et de quantification de signes cutanes sur une zone de peau | |
| Yu et al. | Methods and applications of fingertip subcutaneous biometrics based on optical coherence tomography | |
| EP3735578A1 (fr) | Procede et systeme d'inspection optique d'un substrat | |
| EP4099200A1 (fr) | Procede et dispositif d'identification et/ou d'authentification biometrique | |
| EP3139307B1 (fr) | Procede de caracterisation d'un materiau par analyse de tavelures | |
| FR3030834A1 (fr) | Procede et systeme d'acquisition et d'analyse d'empreintes avec detection de fraude | |
| EP2754088B1 (fr) | Identification par reconnaissance d'iris | |
| EP3726423A1 (fr) | Dispositif et procédé d'acquisition et de traitement biométrique | |
| Chang et al. | Fingerprint spoof detection using near infrared optical analysis | |
| KR101780231B1 (ko) | 광 간섭 단층 촬영 장치 기반의 지문 인식 장치 및 방법 | |
| Khutlang et al. | Segmentation of forensic latent fingerprint images lifted contact-less from planar surfaces with optical coherence tomography | |
| FR3139228A1 (fr) | Procédé de vérification de l’authenticité d’une empreinte digitale | |
| da Costa et al. | Biometric identification with 3D fingerprints acquired through optical coherence tomography. |
Legal Events
| Date | Code | Title | Description |
|---|---|---|---|
| PUAI | Public reference made under article 153(3) epc to a published international application that has entered the european phase |
Free format text: ORIGINAL CODE: 0009012 |
|
| STAA | Information on the status of an ep patent application or granted ep patent |
Free format text: STATUS: THE APPLICATION HAS BEEN PUBLISHED |
|
| AK | Designated contracting states |
Kind code of ref document: A1 Designated state(s): AL AT BE BG CH CY CZ DE DK EE ES FI FR GB GR HR HU IE IS IT LI LT LU LV MC MK MT NL NO PL PT RO RS SE SI SK SM TR |
|
| AX | Request for extension of the european patent |
Extension state: BA ME |
|
| STAA | Information on the status of an ep patent application or granted ep patent |
Free format text: STATUS: REQUEST FOR EXAMINATION WAS MADE |
|
| 17P | Request for examination filed |
Effective date: 20170929 |
|
| RBV | Designated contracting states (corrected) |
Designated state(s): AL AT BE BG CH CY CZ DE DK EE ES FI FR GB GR HR HU IE IS IT LI LT LU LV MC MK MT NL NO PL PT RO RS SE SI SK SM TR |
|
| STAA | Information on the status of an ep patent application or granted ep patent |
Free format text: STATUS: EXAMINATION IS IN PROGRESS |
|
| 17Q | First examination report despatched |
Effective date: 20200327 |
|
| GRAP | Despatch of communication of intention to grant a patent |
Free format text: ORIGINAL CODE: EPIDOSNIGR1 |
|
| STAA | Information on the status of an ep patent application or granted ep patent |
Free format text: STATUS: GRANT OF PATENT IS INTENDED |
|
| INTG | Intention to grant announced |
Effective date: 20200929 |
|
| GRAS | Grant fee paid |
Free format text: ORIGINAL CODE: EPIDOSNIGR3 |
|
| GRAA | (expected) grant |
Free format text: ORIGINAL CODE: 0009210 |
|
| STAA | Information on the status of an ep patent application or granted ep patent |
Free format text: STATUS: THE PATENT HAS BEEN GRANTED |
|
| AK | Designated contracting states |
Kind code of ref document: B1 Designated state(s): AL AT BE BG CH CY CZ DE DK EE ES FI FR GB GR HR HU IE IS IT LI LT LU LV MC MK MT NL NO PL PT RO RS SE SI SK SM TR |
|
| REG | Reference to a national code |
Ref country code: GB Ref legal event code: FG4D Free format text: NOT ENGLISH |
|
| REG | Reference to a national code |
Ref country code: AT Ref legal event code: REF Ref document number: 1368008 Country of ref document: AT Kind code of ref document: T Effective date: 20210315 Ref country code: CH Ref legal event code: EP |
|
| REG | Reference to a national code |
Ref country code: DE Ref legal event code: R096 Ref document number: 602016053471 Country of ref document: DE |
|
| REG | Reference to a national code |
Ref country code: IE Ref legal event code: FG4D Free format text: LANGUAGE OF EP DOCUMENT: FRENCH |
|
| REG | Reference to a national code |
Ref country code: NL Ref legal event code: FP |
|
| REG | Reference to a national code |
Ref country code: DE Ref legal event code: R081 Ref document number: 602016053471 Country of ref document: DE Owner name: IDEMIA PUBLIC SECURITY FRANCE, FR Free format text: FORMER OWNER: SAFRAN IDENTITY & SECURITY, ISSY-LES-MOULINEAUX, FR Ref country code: DE Ref legal event code: R081 Ref document number: 602016053471 Country of ref document: DE Owner name: IDEMIA IDENTITY & SECURITY FRANCE, FR Free format text: FORMER OWNER: SAFRAN IDENTITY & SECURITY, ISSY-LES-MOULINEAUX, FR |
|
| RAP4 | Party data changed (patent owner data changed or rights of a patent transferred) |
Owner name: IDEMIA IDENTITY & SECURITY FRANCE |
|
| REG | Reference to a national code |
Ref country code: NL Ref legal event code: HC Owner name: IDEMIA IDENTITY & SECURITY FRANCE; FR Free format text: DETAILS ASSIGNMENT: CHANGE OF OWNER(S), CHANGE OF OWNER(S) NAME; FORMER OWNER NAME: SAFRAN IDENTITY & SECURITY Effective date: 20210622 |
|
| REG | Reference to a national code |
Ref country code: LT Ref legal event code: MG9D |
|
| REG | Reference to a national code |
Ref country code: GB Ref legal event code: 732E Free format text: REGISTERED BETWEEN 20210701 AND 20210707 |
|
| PG25 | Lapsed in a contracting state [announced via postgrant information from national office to epo] |
Ref country code: NO Free format text: LAPSE BECAUSE OF FAILURE TO SUBMIT A TRANSLATION OF THE DESCRIPTION OR TO PAY THE FEE WITHIN THE PRESCRIBED TIME-LIMIT Effective date: 20210603 Ref country code: BG Free format text: LAPSE BECAUSE OF FAILURE TO SUBMIT A TRANSLATION OF THE DESCRIPTION OR TO PAY THE FEE WITHIN THE PRESCRIBED TIME-LIMIT Effective date: 20210603 Ref country code: LT Free format text: LAPSE BECAUSE OF FAILURE TO SUBMIT A TRANSLATION OF THE DESCRIPTION OR TO PAY THE FEE WITHIN THE PRESCRIBED TIME-LIMIT Effective date: 20210303 Ref country code: HR Free format text: LAPSE BECAUSE OF FAILURE TO SUBMIT A TRANSLATION OF THE DESCRIPTION OR TO PAY THE FEE WITHIN THE PRESCRIBED TIME-LIMIT Effective date: 20210303 Ref country code: GR Free format text: LAPSE BECAUSE OF FAILURE TO SUBMIT A TRANSLATION OF THE DESCRIPTION OR TO PAY THE FEE WITHIN THE PRESCRIBED TIME-LIMIT Effective date: 20210604 Ref country code: FI Free format text: LAPSE BECAUSE OF FAILURE TO SUBMIT A TRANSLATION OF THE DESCRIPTION OR TO PAY THE FEE WITHIN THE PRESCRIBED TIME-LIMIT Effective date: 20210303 |
|
| REG | Reference to a national code |
Ref country code: AT Ref legal event code: MK05 Ref document number: 1368008 Country of ref document: AT Kind code of ref document: T Effective date: 20210303 |
|
| PG25 | Lapsed in a contracting state [announced via postgrant information from national office to epo] |
Ref country code: SE Free format text: LAPSE BECAUSE OF FAILURE TO SUBMIT A TRANSLATION OF THE DESCRIPTION OR TO PAY THE FEE WITHIN THE PRESCRIBED TIME-LIMIT Effective date: 20210303 Ref country code: RS Free format text: LAPSE BECAUSE OF FAILURE TO SUBMIT A TRANSLATION OF THE DESCRIPTION OR TO PAY THE FEE WITHIN THE PRESCRIBED TIME-LIMIT Effective date: 20210303 Ref country code: PL Free format text: LAPSE BECAUSE OF FAILURE TO SUBMIT A TRANSLATION OF THE DESCRIPTION OR TO PAY THE FEE WITHIN THE PRESCRIBED TIME-LIMIT Effective date: 20210303 Ref country code: LV Free format text: LAPSE BECAUSE OF FAILURE TO SUBMIT A TRANSLATION OF THE DESCRIPTION OR TO PAY THE FEE WITHIN THE PRESCRIBED TIME-LIMIT Effective date: 20210303 |
|
| PG25 | Lapsed in a contracting state [announced via postgrant information from national office to epo] |
Ref country code: EE Free format text: LAPSE BECAUSE OF FAILURE TO SUBMIT A TRANSLATION OF THE DESCRIPTION OR TO PAY THE FEE WITHIN THE PRESCRIBED TIME-LIMIT Effective date: 20210303 Ref country code: CZ Free format text: LAPSE BECAUSE OF FAILURE TO SUBMIT A TRANSLATION OF THE DESCRIPTION OR TO PAY THE FEE WITHIN THE PRESCRIBED TIME-LIMIT Effective date: 20210303 Ref country code: AT Free format text: LAPSE BECAUSE OF FAILURE TO SUBMIT A TRANSLATION OF THE DESCRIPTION OR TO PAY THE FEE WITHIN THE PRESCRIBED TIME-LIMIT Effective date: 20210303 Ref country code: SM Free format text: LAPSE BECAUSE OF FAILURE TO SUBMIT A TRANSLATION OF THE DESCRIPTION OR TO PAY THE FEE WITHIN THE PRESCRIBED TIME-LIMIT Effective date: 20210303 |
|
| REG | Reference to a national code |
Ref country code: DE Ref legal event code: R079 Ref document number: 602016053471 Country of ref document: DE Free format text: PREVIOUS MAIN CLASS: G06K0009000000 Ipc: G06V0010000000 |
|
| PG25 | Lapsed in a contracting state [announced via postgrant information from national office to epo] |
Ref country code: ES Free format text: LAPSE BECAUSE OF FAILURE TO SUBMIT A TRANSLATION OF THE DESCRIPTION OR TO PAY THE FEE WITHIN THE PRESCRIBED TIME-LIMIT Effective date: 20210303 Ref country code: PT Free format text: LAPSE BECAUSE OF FAILURE TO SUBMIT A TRANSLATION OF THE DESCRIPTION OR TO PAY THE FEE WITHIN THE PRESCRIBED TIME-LIMIT Effective date: 20210705 Ref country code: SK Free format text: LAPSE BECAUSE OF FAILURE TO SUBMIT A TRANSLATION OF THE DESCRIPTION OR TO PAY THE FEE WITHIN THE PRESCRIBED TIME-LIMIT Effective date: 20210303 Ref country code: RO Free format text: LAPSE BECAUSE OF FAILURE TO SUBMIT A TRANSLATION OF THE DESCRIPTION OR TO PAY THE FEE WITHIN THE PRESCRIBED TIME-LIMIT Effective date: 20210303 Ref country code: IS Free format text: LAPSE BECAUSE OF FAILURE TO SUBMIT A TRANSLATION OF THE DESCRIPTION OR TO PAY THE FEE WITHIN THE PRESCRIBED TIME-LIMIT Effective date: 20210703 |
|
| REG | Reference to a national code |
Ref country code: DE Ref legal event code: R097 Ref document number: 602016053471 Country of ref document: DE |
|
| PLBE | No opposition filed within time limit |
Free format text: ORIGINAL CODE: 0009261 |
|
| STAA | Information on the status of an ep patent application or granted ep patent |
Free format text: STATUS: NO OPPOSITION FILED WITHIN TIME LIMIT |
|
| PG25 | Lapsed in a contracting state [announced via postgrant information from national office to epo] |
Ref country code: AL Free format text: LAPSE BECAUSE OF FAILURE TO SUBMIT A TRANSLATION OF THE DESCRIPTION OR TO PAY THE FEE WITHIN THE PRESCRIBED TIME-LIMIT Effective date: 20210303 Ref country code: DK Free format text: LAPSE BECAUSE OF FAILURE TO SUBMIT A TRANSLATION OF THE DESCRIPTION OR TO PAY THE FEE WITHIN THE PRESCRIBED TIME-LIMIT Effective date: 20210303 |
|
| 26N | No opposition filed |
Effective date: 20211206 |
|
| PG25 | Lapsed in a contracting state [announced via postgrant information from national office to epo] |
Ref country code: SI Free format text: LAPSE BECAUSE OF FAILURE TO SUBMIT A TRANSLATION OF THE DESCRIPTION OR TO PAY THE FEE WITHIN THE PRESCRIBED TIME-LIMIT Effective date: 20210303 |
|
| PG25 | Lapsed in a contracting state [announced via postgrant information from national office to epo] |
Ref country code: IT Free format text: LAPSE BECAUSE OF FAILURE TO SUBMIT A TRANSLATION OF THE DESCRIPTION OR TO PAY THE FEE WITHIN THE PRESCRIBED TIME-LIMIT Effective date: 20210303 |
|
| REG | Reference to a national code |
Ref country code: CH Ref legal event code: PL |
|
| REG | Reference to a national code |
Ref country code: BE Ref legal event code: MM Effective date: 20210930 |
|
| PG25 | Lapsed in a contracting state [announced via postgrant information from national office to epo] |
Ref country code: IS Free format text: LAPSE BECAUSE OF FAILURE TO SUBMIT A TRANSLATION OF THE DESCRIPTION OR TO PAY THE FEE WITHIN THE PRESCRIBED TIME-LIMIT Effective date: 20210703 Ref country code: MC Free format text: LAPSE BECAUSE OF FAILURE TO SUBMIT A TRANSLATION OF THE DESCRIPTION OR TO PAY THE FEE WITHIN THE PRESCRIBED TIME-LIMIT Effective date: 20210303 |
|
| PG25 | Lapsed in a contracting state [announced via postgrant information from national office to epo] |
Ref country code: LU Free format text: LAPSE BECAUSE OF NON-PAYMENT OF DUE FEES Effective date: 20210919 Ref country code: IE Free format text: LAPSE BECAUSE OF NON-PAYMENT OF DUE FEES Effective date: 20210919 Ref country code: BE Free format text: LAPSE BECAUSE OF NON-PAYMENT OF DUE FEES Effective date: 20210930 |
|
| PG25 | Lapsed in a contracting state [announced via postgrant information from national office to epo] |
Ref country code: LI Free format text: LAPSE BECAUSE OF NON-PAYMENT OF DUE FEES Effective date: 20210930 Ref country code: CH Free format text: LAPSE BECAUSE OF NON-PAYMENT OF DUE FEES Effective date: 20210930 |
|
| PG25 | Lapsed in a contracting state [announced via postgrant information from national office to epo] |
Ref country code: HU Free format text: LAPSE BECAUSE OF FAILURE TO SUBMIT A TRANSLATION OF THE DESCRIPTION OR TO PAY THE FEE WITHIN THE PRESCRIBED TIME-LIMIT; INVALID AB INITIO Effective date: 20160919 |
|
| P01 | Opt-out of the competence of the unified patent court (upc) registered |
Effective date: 20230428 |
|
| PG25 | Lapsed in a contracting state [announced via postgrant information from national office to epo] |
Ref country code: CY Free format text: LAPSE BECAUSE OF FAILURE TO SUBMIT A TRANSLATION OF THE DESCRIPTION OR TO PAY THE FEE WITHIN THE PRESCRIBED TIME-LIMIT Effective date: 20210303 |
|
| PG25 | Lapsed in a contracting state [announced via postgrant information from national office to epo] |
Ref country code: MK Free format text: LAPSE BECAUSE OF FAILURE TO SUBMIT A TRANSLATION OF THE DESCRIPTION OR TO PAY THE FEE WITHIN THE PRESCRIBED TIME-LIMIT Effective date: 20210303 |
|
| PG25 | Lapsed in a contracting state [announced via postgrant information from national office to epo] |
Ref country code: MT Free format text: LAPSE BECAUSE OF FAILURE TO SUBMIT A TRANSLATION OF THE DESCRIPTION OR TO PAY THE FEE WITHIN THE PRESCRIBED TIME-LIMIT Effective date: 20210303 |
|
| REG | Reference to a national code |
Ref country code: DE Ref legal event code: R081 Ref document number: 602016053471 Country of ref document: DE Owner name: IDEMIA PUBLIC SECURITY FRANCE, FR Free format text: FORMER OWNER: IDEMIA IDENTITY & SECURITY FRANCE, COURBEVOIE, FR |
|
| PGFP | Annual fee paid to national office [announced via postgrant information from national office to epo] |
Ref country code: NL Payment date: 20250820 Year of fee payment: 10 |
|
| PGFP | Annual fee paid to national office [announced via postgrant information from national office to epo] |
Ref country code: DE Payment date: 20250820 Year of fee payment: 10 |
|
| REG | Reference to a national code |
Ref country code: NL Ref legal event code: PD Owner name: IDEMIA PUBLIC SECURITY FRANCE; FR Free format text: DETAILS ASSIGNMENT: CHANGE OF OWNER(S), ASSIGNMENT; FORMER OWNER NAME: IDEMIA IDENTITY & SECURITY FRANCE Effective date: 20251009 |
|
| PGFP | Annual fee paid to national office [announced via postgrant information from national office to epo] |
Ref country code: GB Payment date: 20250820 Year of fee payment: 10 |
|
| PGFP | Annual fee paid to national office [announced via postgrant information from national office to epo] |
Ref country code: FR Payment date: 20250821 Year of fee payment: 10 |
|
| PG25 | Lapsed in a contracting state [announced via postgrant information from national office to epo] |
Ref country code: TR Free format text: LAPSE BECAUSE OF FAILURE TO SUBMIT A TRANSLATION OF THE DESCRIPTION OR TO PAY THE FEE WITHIN THE PRESCRIBED TIME-LIMIT Effective date: 20210303 |