EP3101594A1 - Saliency information acquisition device and saliency information acquisition method - Google Patents
Saliency information acquisition device and saliency information acquisition method Download PDFInfo
- Publication number
- EP3101594A1 EP3101594A1 EP16160433.5A EP16160433A EP3101594A1 EP 3101594 A1 EP3101594 A1 EP 3101594A1 EP 16160433 A EP16160433 A EP 16160433A EP 3101594 A1 EP3101594 A1 EP 3101594A1
- Authority
- EP
- European Patent Office
- Prior art keywords
- saliency
- candidate
- region
- measure
- local
- Prior art date
- Legal status (The legal status is an assumption and is not a legal conclusion. Google has not performed a legal analysis and makes no representation as to the accuracy of the status listed.)
- Withdrawn
Links
Images



Classifications
-
- G—PHYSICS
- G06—COMPUTING OR CALCULATING; COUNTING
- G06N—COMPUTING ARRANGEMENTS BASED ON SPECIFIC COMPUTATIONAL MODELS
- G06N3/00—Computing arrangements based on biological models
- G06N3/02—Neural networks
- G06N3/08—Learning methods
-
- G—PHYSICS
- G06—COMPUTING OR CALCULATING; COUNTING
- G06V—IMAGE OR VIDEO RECOGNITION OR UNDERSTANDING
- G06V10/00—Arrangements for image or video recognition or understanding
- G06V10/40—Extraction of image or video features
- G06V10/44—Local feature extraction by analysis of parts of the pattern, e.g. by detecting edges, contours, loops, corners, strokes or intersections; Connectivity analysis, e.g. of connected components
- G06V10/443—Local feature extraction by analysis of parts of the pattern, e.g. by detecting edges, contours, loops, corners, strokes or intersections; Connectivity analysis, e.g. of connected components by matching or filtering
- G06V10/449—Biologically inspired filters, e.g. difference of Gaussians [DoG] or Gabor filters
- G06V10/451—Biologically inspired filters, e.g. difference of Gaussians [DoG] or Gabor filters with interaction between the filter responses, e.g. cortical complex cells
- G06V10/454—Integrating the filters into a hierarchical structure, e.g. convolutional neural networks [CNN]
-
- G—PHYSICS
- G06—COMPUTING OR CALCULATING; COUNTING
- G06F—ELECTRIC DIGITAL DATA PROCESSING
- G06F18/00—Pattern recognition
- G06F18/20—Analysing
- G06F18/24—Classification techniques
- G06F18/241—Classification techniques relating to the classification model, e.g. parametric or non-parametric approaches
- G06F18/2413—Classification techniques relating to the classification model, e.g. parametric or non-parametric approaches based on distances to training or reference patterns
-
- G—PHYSICS
- G06—COMPUTING OR CALCULATING; COUNTING
- G06F—ELECTRIC DIGITAL DATA PROCESSING
- G06F18/00—Pattern recognition
- G06F18/20—Analysing
- G06F18/24—Classification techniques
- G06F18/241—Classification techniques relating to the classification model, e.g. parametric or non-parametric approaches
- G06F18/2415—Classification techniques relating to the classification model, e.g. parametric or non-parametric approaches based on parametric or probabilistic models, e.g. based on likelihood ratio or false acceptance rate versus a false rejection rate
-
- G—PHYSICS
- G06—COMPUTING OR CALCULATING; COUNTING
- G06N—COMPUTING ARRANGEMENTS BASED ON SPECIFIC COMPUTATIONAL MODELS
- G06N3/00—Computing arrangements based on biological models
- G06N3/02—Neural networks
- G06N3/04—Architecture, e.g. interconnection topology
- G06N3/045—Combinations of networks
-
- G—PHYSICS
- G06—COMPUTING OR CALCULATING; COUNTING
- G06N—COMPUTING ARRANGEMENTS BASED ON SPECIFIC COMPUTATIONAL MODELS
- G06N3/00—Computing arrangements based on biological models
- G06N3/02—Neural networks
- G06N3/04—Architecture, e.g. interconnection topology
- G06N3/0464—Convolutional networks [CNN, ConvNet]
-
- G—PHYSICS
- G06—COMPUTING OR CALCULATING; COUNTING
- G06N—COMPUTING ARRANGEMENTS BASED ON SPECIFIC COMPUTATIONAL MODELS
- G06N3/00—Computing arrangements based on biological models
- G06N3/02—Neural networks
- G06N3/08—Learning methods
- G06N3/09—Supervised learning
-
- G—PHYSICS
- G06—COMPUTING OR CALCULATING; COUNTING
- G06T—IMAGE DATA PROCESSING OR GENERATION, IN GENERAL
- G06T2207/00—Indexing scheme for image analysis or image enhancement
- G06T2207/20—Special algorithmic details
- G06T2207/20076—Probabilistic image processing
Definitions
- the present invention relates to techniques for automatically detecting a salient region in an image.
- An algorithm for saliency detection can usually be classified roughly into a local technique and a global technique.
- a local technique calculates a saliency measure using the features (e.g. local contrast, edge orientation, and the like) extracted from a local region within the image as a clue (e.g., L. Itti, et.al., "A model of saliency-based visual attention for rapid scene analysis", PAMI, 20(11): 1254-1259, 1998 ; Non-Patent Document 1).
- a global technique calculates a saliency measure using the features (e.g., global contrast, histograms) or prior knowledge (e.g., the background, or an easy to focus location) as clues (e.g., M. M. Cheng, et.al., "Global contrast based salient region detection", In CVPR, pages 409-416, 2011 ; Non-Patent Document 2).
- the present invention proposes a novel saliency detection technique with superior versatility and reliability.
- the present invention adopts the following configurations.
- a saliency information acquisition device includes a local saliency acquisition unit configured to calculate a saliency measure for each pixel in an input image on the basis of information obtained from a local region surrounding each pixel; a candidate-region setting unit configured to set a plurality of candidate regions in the input image; a global saliency acquisition unit configured to calculate a saliency measure for each candidate region in the plurality of candidate regions on the basis of information including a local saliency feature representing an attribute of the saliency measure for each pixel within a candidate region, and a global feature representing an attribute of the candidate regions in relation to the entire input image; and an integration unit configured to combine the saliency measure for each candidate region in the plurality of candidate regions obtained by the global saliency acquisition unit to generate saliency information for the input image.
- a saliency measure is calculated per pixel using information obtained from a local region as a clue (i.e., a local saliency), where after a saliency measure is calculated for each candidate region with the local saliency feature and the global feature for each region as a clue (i.e., global saliency), where local saliency and global saliency are combined to finally generate saliency information.
- a clue i.e., a local saliency
- saliency measure is calculated for each candidate region with the local saliency feature and the global feature for each region as a clue
- global saliency i.e., global saliency
- the local saliency acquisition unit may use a first deep neural network to calculate a saliency measure for each pixel in the input image.
- Existing saliency detection algorithms require the user to plan the features or combination of features used in evaluating the saliency measure. Therefore, it tended to be extremely difficult to optimize the features used and the performance of the saliency detection algorithm depended disadvantageously on the quality of the features selected.
- embodiments of the invention use a first deep neural network, and are thereby capable of automatically building a classifier that calculates a saliency measure from the information in a local region through machine learning. Consequently, embodiments of the invention are able to easily build a classifier having stable performance.
- the first deep neural network may be a neural network configured to receive an image of a local region surrounding a given pixel as an input, and output a saliency measure for said pixel as an estimation result. While there are various features that may be extracted from a local region, it is not clear which of the features influences saliency. Therefore, inputting the image itself, which is raw data, into the first deep neural network and optimizing feature extraction, selection, and combination inside the first deep neural network during the machine learning stage improves the reliability of the estimation result, i.e., the saliency measure.
- the saliency information acquisition device may further include a local saliency refinement unit configured to refine the saliency measure for each pixel on the basis of the saliency measure for each pixel obtained by the local saliency acquisition unit and the plurality of candidate regions obtained by the candidate-region setting unit so that the saliency measure for a pixel included in the candidate region becomes relatively larger and the saliency measure for a pixel outside of the candidate region becomes relatively smaller; and the global saliency acquisition unit uses the saliency measure refined by the local saliency refinement unit to obtain the local saliency feature for each of the candidate regions.
- Using spatial information such as inside or outside the candidate region as a supplement when refining the saliency measure thereby reduces the noise in a saliency distribution, and increases the spatial uniformity of the saliency distribution.
- the global saliency acquisition unit may use a second deep neural network to calculate a saliency measure for each candidate region in the plurality of candidate regions.
- Existing saliency detection algorithms require the user to plan the features or combination of features used in evaluating the saliency measure. Therefore, it tended to be extremely difficult to optimize the features used and the performance of the saliency detection algorithm depended disadvantageously on the quality of the features selected.
- embodiments of the invention use a second deep neural network and thereby are capable of automatically building classifier that calculates a saliency measure for each candidate region from information including local saliency features and global features through machine learning. Consequently, embodiments of the invention are able to easily build a classifier having stable performance.
- the second deep neural network may be a neural network configured to receive as input a feature vector containing the local saliency feature and the global feature of a given candidate region as components, and output a saliency measure of said candidate region as an estimation result. While there may be various local saliency features and global features, it is not clear which of these features influences saliency. Therefore, inputting various kinds of local saliency features and global features into the second deep neural network and optimizing feature extraction, selection, and the combination inside the second deep neural network during the machine learning stage improves the reliability of the estimation result, i.e., the saliency measure.
- the local saliency feature may conceivably be, for example: a statistic of the saliency measure for each pixel within the candidate region; the ratio of the total of the saliency measure for each pixel in a candidate region to the total of the saliency measure for each pixel in the entire input image; a product of the aforementioned statistic and the aforementioned ratio; and an overlap ratio of the aforementioned candidate region to the regions in the input image where the saliency measure is nonzero. And, one or more of these may be used as a local saliency feature.
- the global feature may conceivably be, for example: a difference between a color histogram for the candidate region and the color histogram of an end region in the input image; a difference between a representative color value within the candidate region and a representative color value within the end region in the input image; a difference between a color histogram of the candidate region and a color histogram of the entire input image; and the dispersion of the colors within the candidate region. And, one or more of these may be used as a global feature.
- the following may also conceivably be used as a global feature: the aspect ratio of a square enclosing the candidate region; the height of said square; the width of said square; the center coordinate of the candidate region; the length along a long axis of the candidate region; the length along the short axis of a candidate region; and an Euler number for the candidate region.
- These properties represent the geometrical attributes of the candidate region. And, one or more of these may be used as a global feature.
- the integration unit may perform a weighted sum of the saliency measures for the plurality of candidate regions using a weight corresponding to the reliability of the estimation result from the second deep neural network for each candidate region to generate saliency information for the input image.
- more reliable saliency information may be obtained.
- the candidate-region setting unit may detect a plurality of objectness regions from within the input image, and set the plurality of detected regions as the plurality of candidate regions.
- a person's attention is often directed at the object captured in an image, more so than the background or an empty region in the image. Accordingly, it is appropriate to think of saliency as evaluating each object existing within an image. It is thus reasonable to expect that setting an objectness region as a candidate region will further improve the reliability of the saliency information obtained.
- a saliency information acquisition device, or saliency detection device, or the like having at least a portion of the above-mentioned features and functions lies within the scope of the invention.
- a saliency information acquisition method, or saliency detection method, or the like including at least a portion of the above-mentioned processes also lies within the scope of the invention.
- a program for executing these methods on a computer, or a computer readable medium storing such a program down temporarily are also within the scope of the invention.
- the above-mentioned processes and features may be freely combined with each other insofar as is technically possible to configure the invention.
- Embodiments of the present invention provide a novel saliency detection technique with superior versatility and reliability.
- the invention proposes an algorithm for saliency detection whereby a saliency region is automatically detected its ore extracted from a still image or a video using image analysis on a computer.
- Saliency information which is the result of saliency detection, may be output as a saliency map representing a distribution of the saliency measure for each pixel or each region, or as a binary image wherein a saliency map is converted to a binary representation using a predetermined threshold.
- This kind of saliency information is preferably employed in a variety of ways such as preprocessing in a computer vision application, e.g., partitioning image regions (segmentation), image classification, scene interpretation, image compression, facial recognition, and object recognition.
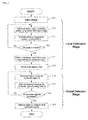
- the saliency detection algorithm is made up of two stages: local estimation, and global detection.
- the former local estimation stage estimates a saliency measure for each pixel using information obtained from a local region surrounding each pixel in the input image is a clue, and temporarily generates a saliency map (referred to as a local saliency map).
- the latter global detection stage estimates a saliency region using the local saliency map obtained during the local estimation stage and information obtained from the entire input image as clues, and generates a final saliency map.
- saliency can be evaluated in a way that takes into account both localized attributes in an image and attributes embodying the whole image, thereby improving the robustness of the algorithm and increasing the versatility thereof while improving the accuracy and reliability of the saliency detection.
- a deep neural network which is a deep learning based network is used in each of the stages of local estimation and global detection in the embodiments below.
- the first deep neural network used during the local estimation stage (hereafter, DNN-L) is trained on the relationship between local features (e.g., localized contrast, texture, and shape information) that can be extracted from a local region surrounding a pixel and saliency using multiple images serving as trainers.
- the second deep neural network used during the global detection stage (hereafter, DNN-G) is trained on the relationship between global features (e.g., global contrast, geometrical information including positional information within the image) that can be extracted from an input image and saliency using multiple images serving as trainers.
- FIG. 1 is a block diagram illustrating a functional configuration of a saliency information acquisition device according to an embodiment.
- the saliency information acquisition device 1 mainly includes an image acquisition unit 10; a local saliency acquisition unit 11; a candidate-region setting unit 12; a local saliency refinement unit 13; a feature extraction unit 14; a global saliency acquisition unit 15; and an integration unit 16.
- the local saliency acquisition unit 11, the candidate-region setting unit 12, the local saliency refinement unit 13 are function blocks related to local estimation, while the candidate-region setting unit 12, the feature extraction unit 14, the global saliency acquisition unit 15 and the integration unit 16 are function blocks related to global detection.
- the reference numerals D10 through D16 represents the data transferred between the function blocks.
- the image acquisition unit 10 acquires an image that is to be processed.
- the image acquisition unit 10 may be acquire image data from an imaging device (camera), or may read image data from a storage device or a server on a network. While no particular image format is required, the present embodiment is described based on an RGB color image.
- the image input may also be a still image or a video. When a video is input, the later-described saliency detection process is executed frame by frame.
- the input image D10 acquired may be stored in memory and the like, and used, for example, by the local saliency acquisition unit 11, the candidate-region setting unit 12, and the feature extraction unit 14.
- the local saliency acquisition unit 11 includes a feature of computing calculates (estimates) a saliency measure for each pixel in the input image D10 on the basis of information obtained from a local region surrounding the pixel.
- the local saliency acquisition unit 11 uses a deep neural network DNN-L is a classifier to estimate the saliency measure from the information in the local region.
- the data representing the distribution of the saliency measures estimated by the local saliency acquisition unit 11 for each pixel is referred to as a local saliency map D 11.
- the candidate-region setting unit 12 includes a feature of setting a plurality of candidate regions D12 from the input image D10.
- the local saliency refinement unit 13, the feature extraction unit 14, and the integration unit 16 may use this candidate region D12.
- the local saliency refinement unit 13 includes a feature of the saliency measure for each pixel on the basis of the local saliency map D11 obtained by the local saliency acquisition unit 11, and the plurality of candidate regions D12 obtained by the candidate-region setting unit 12.
- the refined local saliency map D 13 is used in the later global detection stage. Note that the refinement process may be omitted when the local saliency map D11 obtained by the local saliency acquisition unit 11 is sufficiently reliable; in that case, the local saliency map D11 is used in the global detection as is.
- the feature extraction unit 14 includes a feature of extracting various kinds of features that may serve as clues from the plurality of candidate regions D12 and generates a multidimensional feature vector D 14.
- a feature includes at least an element representing an attribute of the saliency measure for each pixel within a candidate region (referred to as a local saliency feature), and an element representing an attribute of the candidate region in relation to the entire input image D10 (referred to as a global feature).
- the global saliency acquisition unit 15 includes a feature of calculating (estimating) a saliency measure for each of the candidate regions on the basis of the feature vector D14 obtained from the feature extraction unit 14.
- the global saliency acquisition unit 15 uses a deep neural network DNN-G as a classifier to estimate the saliency measure from the feature vector D 14.
- the estimation result D15 from the global saliency acquisition unit 15 is input into the integration unit 16.
- the integration unit 16 includes a feature of integrating the saliency measure obtained for the plurality of candidate regions by the global saliency acquisition unit 15, and generates a final saliency map (saliency information) for the entire input image.
- the final saliency map D16 generated by the integration unit 16 may be storage in a storage unit, or output to an external device to be used by various computer vision applications such as object recognition or image classification.
- the saliency information acquisition device 1 may be composed of for instance a computer equipped with a CPU (processor), a memory, and auxiliary storage device, an input device, a display device, and a communication device.
- a program stored in the auxiliary storage device may be loaded into memory and run on the CPU to implement each of the functions illustrated in the saliency information acquisition device 1 in FIG. 1 .
- all or a portion of the functions of the saliency information acquisition device 1 may be implemented as circuits on an ASIC or an FPGA or the like.
- a portion of the functions of the saliency information acquisition device 1 may be implemented through cloud computing or distributed computing.
- FIG. 2 is a flowchart illustrating the flow of the saliency detection process.
- step S10 the image acquisition unit 10 acquires an input image for saliency detection processing.
- the image acquisition unit 10 may perform preprocessing such as format conversion, resolution conversion, or noise removal or the like if needed.
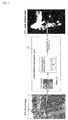
- FIG. 3 depicts an image of a woman riding a bicycle is one example of an input image D10. Conceivably, in many cases, a person viewing this image, will focus on taking a picture of the woman, who is the subject. Therefore, the output result expected from the saliency information acquisition device 1 is a saliency map where the region including the woman has a high saliency measure.
- FIG. 3 is a schematic of the processes in step S11 through S 13.
- the local saliency acquisition unit 11 clips a local region image of a predetermined size from the input image D10, with the pixel(x, y) in the image being processed as the center thereof (step S11).
- the size of the local region image may be established as desired, in the present embodiment the local region image is 51 x 51 pixels.
- the local saliency acquisition unit 11 uses DNN-L to calculate a saliency measure for the pixel(x, y) (step S12).
- the DNN-L is configured to receive an input of a 51 x 51 pixel local region image and to output the saliency measure for the center thereof, pixel(x, y), as an estimation result.
- An estimation result S (x, y) is a value from 0 to 1, or is given a value from 0 to 255, where zero represents no saliency and the value increases as the saliency increases.
- the configuration of DNN-L, and a technique for training the parameter ⁇ L are described later.
- the local saliency acquisition unit 11 repeats steps S11 and S12 until a saliency measure is obtained for all the pixels within the input image D10 (step S13).
- a local saliency map D11 as illustrated in FIG. 3 is obtained as a result thereof.
- the saliency measure for each pixel is represented in gray scale where a lighter (closer to white) the pixel, the higher the saliency.
- the candidate-region setting unit 12 sets a plurality of candidate regions D12 from the input image D10. While any desired method may be used for determining a candidate region D12, in this embodiment the candidate-region setting unit 12 detects the plurality of "objectness regions" (regions that have the possibility of being objects) from the input image D10 and sets the respective regions detected as candidate regions D12. A person's attention is often directed at the object captured in an image, more so than the background or an empty region in the image. Accordingly, it is appropriate to think of saliency as evaluating each object existing within an image. Therefore, an objectness region is sent as a candidate region D12 and the following processes executed based on a candidate region. Further improvements in the reliability of the saliency information can be expected since the above makes provides saliency detection that takes into account the likelihood that a region being an object (i.e., objectness).
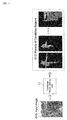
- FIG. 4 illustrates one example of a candidate region D12 obtained from a GOP. Note that there is no need to perform strict object detection at this point, rather it is preferable that the detection does not leave out any region that may be an object. As can be understood from the example presented in FIG. 4 the plurality of candidate regions D12 may include overlapping sections (redundant sections).
- the local saliency refinement unit 13 refines the local saliency map D11 on the basis of information in the plurality of candidate regions D12 obtained in step S14.
- the saliency measure for each pixel may be refined so that the saliency measure for the pixels contained in the candidate region D12 is relatively large while the saliency measure for pixels outside the candidate region D 12 is relatively small.
- the local saliency refinement unit 13 calculates a reliability score conf L for each candidate region (i) using Expression (1).
- the superscript "L" is a symbol indicating a relationship to local estimation.
- i is a candidate region number.
- S L represents the local saliency map D11, where S L (x, y) ⁇ [0, 1] represents the saliency measure of the pixel(x, y).
- the symbol A i is the mean of the saliency measure S L (x, y) for each pixel in a candidate region (i), and hereafter is referred to as an accuracy score.
- the larger (i.e., the closer to 1) the accuracy score A i the higher the possibility (probability) that the candidate region (i) is a saliency region.
- the mean of the saliency measures is used, however a statistic other than the mean (such as the mode, the maximum, the minimum, and the total) may be used for the accuracy score.
- the symbol C i is a ratio of the total of the saliency measures S L (x, y) within a candidate region in relation to the total of the saliency measures S L (x, y) in the entire input image, and hereafter is referred to as the coverage score.
- the larger (i.e., the closer to 1) the coverage score C i the higher the possibility (probability) that the candidate region (i) is a saliency region.
- the denominator of C i equals the total area of the regions (saliency regions) in the input image where the saliency value is nonzero
- the numerator of C i equals the area of the section of overlap between the candidate region (i) and the saliency region. Consequently C i also represents and overlap ratio of the candidate region (i) to the saliency region.
- the element ⁇ is a weight coefficient used in fine-tuning the balance between the accuracy score A i and the coverage score C i .
- ⁇ is 0.4.
- the local saliency refinement unit 13 sorts the masks O 1 to O m for each of the candidate regions in order of descending score.
- the top K candidate region masks (e.g., 20 in this embodiment) are then combined to generate a refined local saliency map D 13.
- the masks may be combined by, for instance, mere averaging, or by a weighted sum with a weight corresponding to the reliability score conf L .
- FIG. 5 depicts an example of a refined local saliency map D13. It can be understood that supplementing the process of refining the saliency measure with spatial information, such as, being inside or outside the candidate region reduces the noise in a saliency distribution, and increases the spatial uniformity of the saliency distribution.
- step S16 through S18 are carried out in order on all the candidate regions D12 set in step S14.
- FIG. 6 is a schematic of the processes in step S16 through S18.
- the feature extraction unit 14 generates a feature vector D14 for a candidate region (i) on the basis of the candidate region (i) being processed, the local saliency map D 13, and the input image D10.S
- a feature which may serve as a clue in determining the saliency of the candidate region (i) may be for instance the following.
- all the features provided here are included to create a 72-dimensional feature vector D 14; however, any desired type and number of features may be used.
- the global saliency acquisition unit 15 uses DNN-G to calculate a saliency measure for a candidate region (i) (step S17).
- the network DNN-G is configured to receive input of a feature vector D 14 for the candidate region, and output a saliency measure for the candidate region as an estimation result.
- the estimation result ⁇ is given as a prediction accuracy ⁇ 1 and an overlap ratio ⁇ 2 .
- the prediction accuracy ⁇ 1 represents the possibility (probability) that the candidate region (i) is a saliency region
- the overlap ratio ⁇ 2 represents a ratio of the area of the candidate region (i) to the total area of the saliency regions within the input image.
- a saliency measure ⁇ [ ⁇ 1 , ⁇ 2 ] is obtained for m candidate regions (step S18).
- the configuration of DNN-G, and technique for training the parameter ⁇ G are described later.
- the superscript "G” is a symbol a relationship to global detection.
- Formula 2 conf i G ⁇ i 1 ⁇ ⁇ i 2
- the integration unit 16 sorts the masks O 1 to O m for each of the candidate regions in order of descending score.
- the top K candidate region masks (e.g., 20 in this embodiment) are then combined to generate a final saliency map D16.
- the masks may be combined by, for instance, mere averaging, or by a weighted sum with a weight corresponding to the reliability score conf G .
- FIG. 8 illustrates one example of a final saliency map D16 obtained using a weighted sum. It can be understood from FIG. 8 that a highly accurate saliency map can be generated hereby where the saliency measure of the portion in the input image D10 including the subject (the woman) increases.
- DNN-L which is used in local estimation and the training method therefor is described.
- Various techniques have been proposed with regards to deep neural networks; although any of these methods may be used, the embodiment employs a deep convolutional neural network described in Non-Patent Document 4.
- Table 1 illustrates an example configuration of DNN-L.
- Table 1 Layer 1 2 3 4 5 6 (Output) Type C+R+L C+R C+R F+R+D F+R+D F+S Channels 96 256 384 2048 2048 2 Filter size 11 ⁇ 11 5 ⁇ 5 3 ⁇ 3 - - - Pooling size 3 ⁇ 3 2 ⁇ 2 3 ⁇ 3 " - - Pooling stride 2 ⁇ 2 2 ⁇ 2 3 ⁇ 3 - - W Input size 51 ⁇ 51 20 ⁇ 20 8 ⁇ 8 2 ⁇ 2 1x1 1x1
- Type represents the kind of layer.
- C is a convolution layer
- F represents a fully connected layer.
- R indicates the use of a rectified linear unit (ReLU) as an activation function
- L indicates the normalization of the filter result
- D indicates dropout (i.e., that a portion of the neurons will not be allowed to participate in the next calculation to prevent over-filtering)
- S indicates a softmax layer.
- the “Channels” are the number of feature maps (i.e., the dimensionality of the features) output to the next layer.
- the “Filter size” is the kernel size of the filter used in the convolution computation.
- the "Pooling size”, and the “Pooling stride” are parameters used for down-sampling the feature map.
- the "Input size” is the size of the feature map entering the layer.
- An image containing multiple trainers is used as the training data. Any kind of image may be used, however images where various kinds of subjects and scenes are combined are preferred.
- a plurality of patches size 51 x 51 pixels are clips from each of the images; for instance, a center position may be shifted by 10 pixels at a time while clipping tens or hundreds of patches from a single image.
- the samples are then classified; patches having a large overlap ratio with a ground truth mask (e.g., 0.7 or more) are classified as positive samples, while patches having a small overlap ratio (e.g., 0.3 or less) are classified as negative samples. Positive samples are given the label "1", while negative samples are given the label "0". Finally, hundreds to thousands of patches are prepared under positive samples and negative samples.
- Expression (5) represents a training cost function for the DNN-L.
- ⁇ L + ⁇ ⁇ k 1 6 ⁇ W k L ⁇ F 2
- ⁇ L is a training parameter in DNN-L, and contains a weight, a bias, and the like for each of the six layers.
- the expression 1 ⁇ • ⁇ is an indicator function.
- the expression P(1 i j
- the parameter ⁇ is the weight decay parameter.
- the parameter W L K is the weight of the k-th layer.
- F is a Frobenius norm.
- the parameter m is the overall number of training samples.
- the cost function in Expression (5) may be solved using stochastic gradient descent, allowing training of the parameter ⁇ L in the DNN-L.
- the momentum may be set at 0.9, and the weight decay parameter ⁇ may be set to 0.0005.
- Table 2 illustrates an example configuration of the DNN-G.
- the symbols used in the table are identical to the symbols used in Table 1.
- Table 2 Layer 1 2 3 4 5 6 (Output) Type F+R+D F+R+D F+R+D F+R+D F+R+D F+R+D F Channels 1024 2048 2048 1024 1024 2 Filter size - - - - - - Pooling size - - - - - - Pooling stride - - - - - - - - Input size 1x1 1x1 1x1 1x1 1x1 1x1 1x1 1x1 1x1 1x1 1x1 1x1 1x1 1x1 1x1 1x1 1x1
- an image containing multiple trainers is used as the training data.
- a plurality of candidate regions (objectness regions) is established in each image using the GOP method.
- a feature vector V is generated and a label vector y is computed for each of the candidate regions; the label vector y contains an accuracy p comparing the candidate region with a ground truth mask, and an overlap ratio O.
- the configuration of the feature vector V is identical to the feature vector described in step S16.
- the accuracy p and the overlap ratio O can be calculated using Expression (2) and Expression (3), respectively, where the saliency map S[sub]L serves as the ground truth mask.
- Expression (6) represents a training cost function for the DNN-G.
- ⁇ G ⁇ 2 2 + ⁇ ⁇ k 1 6 ⁇ W k G ⁇ F 2
- ⁇ G is a training parameter in DNN-G, and contains a weight, a bias, and the like for each of the six layers.
- the parameter y i [p i , O i ] is the label vector made up of the accuracy p i and the overlap ratio O i for the i-th candidate region.
- the parameter v i is the feature vector for the i-th candidate region.
- ⁇ G ) [ ⁇ 1 i, ⁇ 2 i ] is the estimation result from DNN-G.
- W G K is the weight of the k-th layer.
- F is a Frobenius norm.
- the parameter ⁇ is the weight decay parameter.
- the parameter m is the overall number of candidate regions used for training.
- the cost function in Expression (6) may be solved using stochastic gradient descent, allowing training of the parameter ⁇ G in the DNN-G.
- the momentum may be set at 0.9, and the weight decay parameter ⁇ may be set to 0.0005.
- a saliency measure (D11 or D13) is calculated per pixel using information obtained from a local region as a clue, whereafter a saliency measure (D15) is calculated for each candidate region with a feature vector (D14) containing the local saliency feature and the global feature for each region as a clue, where local saliency and global saliency are combined to generate final saliency information (D16). Accordingly, saliency can be evaluated in a way that takes into account both localized attributes and attributes embodying the whole image, thereby improving the versatility and the reliability of saliency detection.
- the DNN is supplied with as much information as possible, using machine learning to optimize feature extraction, selection, and combination inside the DNN; therefore, this improves the reliability of the estimation result, i.e., the saliency measure.
- a final saliency map (D16) is created from using a weight corresponding to the reliability of the estimation result from the DNN-G for each candidate region (i.e., conf G ) to provide a weighted combination of the saliency measures for a plurality of candidate regions, and thus allows even more reliable saliency information to be obtained.
Landscapes
- Engineering & Computer Science (AREA)
- Theoretical Computer Science (AREA)
- Physics & Mathematics (AREA)
- General Physics & Mathematics (AREA)
- Artificial Intelligence (AREA)
- Evolutionary Computation (AREA)
- Life Sciences & Earth Sciences (AREA)
- Data Mining & Analysis (AREA)
- General Engineering & Computer Science (AREA)
- Biomedical Technology (AREA)
- Molecular Biology (AREA)
- General Health & Medical Sciences (AREA)
- Health & Medical Sciences (AREA)
- Computational Linguistics (AREA)
- Biophysics (AREA)
- Computer Vision & Pattern Recognition (AREA)
- Computing Systems (AREA)
- Mathematical Physics (AREA)
- Software Systems (AREA)
- Biodiversity & Conservation Biology (AREA)
- Bioinformatics & Cheminformatics (AREA)
- Bioinformatics & Computational Biology (AREA)
- Evolutionary Biology (AREA)
- Multimedia (AREA)
- Probability & Statistics with Applications (AREA)
- Image Analysis (AREA)
Abstract
Description
- The present invention relates to techniques for automatically detecting a salient region in an image.
- Techniques are known for using image analysis to automatically detect an important region in an image, or a region likely to draw a person's focus (such regions are referred to as saliency regions below). These kinds of techniques are referred to as saliency detection or visual attention detection and have been increasingly gaining attention as an important technological feature in computer vision.
- An algorithm for saliency detection can usually be classified roughly into a local technique and a global technique. A local technique calculates a saliency measure using the features (e.g. local contrast, edge orientation, and the like) extracted from a local region within the image as a clue (e.g., L. Itti, et.al., "A model of saliency-based visual attention for rapid scene analysis", PAMI, 20(11): 1254-1259, 1998; Non-Patent Document 1). On the other hand a global technique calculates a saliency measure using the features (e.g., global contrast, histograms) or prior knowledge (e.g., the background, or an easy to focus location) as clues (e.g., M. M. Cheng, et.al., "Global contrast based salient region detection", In CVPR, pages 409-416, 2011; Non-Patent Document 2).
- Many of these kinds of saliency detection algorithms have been proposed thus far. However, it tends to be difficult to obtain highly accurate detection results from a variety of images, and further improvement in the versatility and reliability of saliency detection is desired.
-
- Non-Patent Document 1: L. Itti, C. Koch, and E. Niebur. A model of saliency-based visual attention for rapid scene analysis. PAMI, 20(11):1254-1259, 1998.
- Non-Patent Document 2: M. M. Cheng, G. X. Zhang, N. J. Mitra, X. Huang, and S. M. Hu. Global contrast based salient region detection. In CVPR, pages 409-416, 2011.
- Non-Patent Document 3: P. Krahenbuhl and V. Koltun. Geodesic object proposals. In ECCV, pages 725-739. 2014.
- Non-Patent Document 4: A. Krizhevsky, I. Sutskever, and G.E. Hinton. Imagenet classification with deep convolutional neural networks. In NIPS, pages 1097-1105, 2012. Technical Problem
- With consideration of these problems, the present invention proposes a novel saliency detection technique with superior versatility and reliability.
- With the above in mind, the present invention adopts the following configurations.
- Specifically, a saliency information acquisition device according to embodiments of the invention includes a local saliency acquisition unit configured to calculate a saliency measure for each pixel in an input image on the basis of information obtained from a local region surrounding each pixel; a candidate-region setting unit configured to set a plurality of candidate regions in the input image; a global saliency acquisition unit configured to calculate a saliency measure for each candidate region in the plurality of candidate regions on the basis of information including a local saliency feature representing an attribute of the saliency measure for each pixel within a candidate region, and a global feature representing an attribute of the candidate regions in relation to the entire input image; and an integration unit configured to combine the saliency measure for each candidate region in the plurality of candidate regions obtained by the global saliency acquisition unit to generate saliency information for the input image.
- With the above configuration, a saliency measure is calculated per pixel using information obtained from a local region as a clue (i.e., a local saliency), where after a saliency measure is calculated for each candidate region with the local saliency feature and the global feature for each region as a clue (i.e., global saliency), where local saliency and global saliency are combined to finally generate saliency information. Accordingly, saliency can be evaluated in a way that takes into account both localized attributes and attributes embodying the whole image, thereby improving the versatility and the reliability of saliency detection.
- The local saliency acquisition unit may use a first deep neural network to calculate a saliency measure for each pixel in the input image. Existing saliency detection algorithms require the user to plan the features or combination of features used in evaluating the saliency measure. Therefore, it tended to be extremely difficult to optimize the features used and the performance of the saliency detection algorithm depended disadvantageously on the quality of the features selected. In contrast, embodiments of the invention use a first deep neural network, and are thereby capable of automatically building a classifier that calculates a saliency measure from the information in a local region through machine learning. Consequently, embodiments of the invention are able to easily build a classifier having stable performance.
- The first deep neural network may be a neural network configured to receive an image of a local region surrounding a given pixel as an input, and output a saliency measure for said pixel as an estimation result. While there are various features that may be extracted from a local region, it is not clear which of the features influences saliency. Therefore, inputting the image itself, which is raw data, into the first deep neural network and optimizing feature extraction, selection, and combination inside the first deep neural network during the machine learning stage improves the reliability of the estimation result, i.e., the saliency measure.
- The saliency information acquisition device may further include a local saliency refinement unit configured to refine the saliency measure for each pixel on the basis of the saliency measure for each pixel obtained by the local saliency acquisition unit and the plurality of candidate regions obtained by the candidate-region setting unit so that the saliency measure for a pixel included in the candidate region becomes relatively larger and the saliency measure for a pixel outside of the candidate region becomes relatively smaller; and the global saliency acquisition unit uses the saliency measure refined by the local saliency refinement unit to obtain the local saliency feature for each of the candidate regions. Using spatial information such as inside or outside the candidate region as a supplement when refining the saliency measure thereby reduces the noise in a saliency distribution, and increases the spatial uniformity of the saliency distribution.
- The global saliency acquisition unit may use a second deep neural network to calculate a saliency measure for each candidate region in the plurality of candidate regions. Existing saliency detection algorithms require the user to plan the features or combination of features used in evaluating the saliency measure. Therefore, it tended to be extremely difficult to optimize the features used and the performance of the saliency detection algorithm depended disadvantageously on the quality of the features selected. In contrast, embodiments of the invention use a second deep neural network and thereby are capable of automatically building classifier that calculates a saliency measure for each candidate region from information including local saliency features and global features through machine learning. Consequently, embodiments of the invention are able to easily build a classifier having stable performance.
- The second deep neural network may be a neural network configured to receive as input a feature vector containing the local saliency feature and the global feature of a given candidate region as components, and output a saliency measure of said candidate region as an estimation result. While there may be various local saliency features and global features, it is not clear which of these features influences saliency. Therefore, inputting various kinds of local saliency features and global features into the second deep neural network and optimizing feature extraction, selection, and the combination inside the second deep neural network during the machine learning stage improves the reliability of the estimation result, i.e., the saliency measure.
- The local saliency feature may conceivably be, for example: a statistic of the saliency measure for each pixel within the candidate region; the ratio of the total of the saliency measure for each pixel in a candidate region to the total of the saliency measure for each pixel in the entire input image; a product of the aforementioned statistic and the aforementioned ratio; and an overlap ratio of the aforementioned candidate region to the regions in the input image where the saliency measure is nonzero. And, one or more of these may be used as a local saliency feature.
- The global feature may conceivably be, for example: a difference between a color histogram for the candidate region and the color histogram of an end region in the input image; a difference between a representative color value within the candidate region and a representative color value within the end region in the input image; a difference between a color histogram of the candidate region and a color histogram of the entire input image; and the dispersion of the colors within the candidate region. And, one or more of these may be used as a global feature.
- The following may also conceivably be used as a global feature: the aspect ratio of a square enclosing the candidate region; the height of said square; the width of said square; the center coordinate of the candidate region; the length along a long axis of the candidate region; the length along the short axis of a candidate region; and an Euler number for the candidate region. These properties represent the geometrical attributes of the candidate region. And, one or more of these may be used as a global feature.
- The integration unit may perform a weighted sum of the saliency measures for the plurality of candidate regions using a weight corresponding to the reliability of the estimation result from the second deep neural network for each candidate region to generate saliency information for the input image. Hereby, more reliable saliency information may be obtained.
- The candidate-region setting unit may detect a plurality of objectness regions from within the input image, and set the plurality of detected regions as the plurality of candidate regions. A person's attention is often directed at the object captured in an image, more so than the background or an empty region in the image. Accordingly, it is appropriate to think of saliency as evaluating each object existing within an image. It is thus reasonable to expect that setting an objectness region as a candidate region will further improve the reliability of the saliency information obtained.
- Note that a saliency information acquisition device, or saliency detection device, or the like having at least a portion of the above-mentioned features and functions lies within the scope of the invention. A saliency information acquisition method, or saliency detection method, or the like including at least a portion of the above-mentioned processes also lies within the scope of the invention. Moreover, a program for executing these methods on a computer, or a computer readable medium storing such a program down temporarily are also within the scope of the invention. The above-mentioned processes and features may be freely combined with each other insofar as is technically possible to configure the invention.
- Embodiments of the present invention provide a novel saliency detection technique with superior versatility and reliability.
-
-
FIG. 1 is a block diagram illustrating the functional configuration of a saliency information acquisition device; -
FIG. 2 is a flowchart illustrating the flow of a saliency detection process; -
FIG. 3 is a diagram for describing local saliency acquisition; -
FIG. 4 is a diagram for describing using the GOP method to set a candidate region; -
FIG. 5 is a diagram for describing the refining of a local saliency map; -
FIG. 6 is a diagram for describing global saliency acquisition; -
FIG. 7 is a diagram for describing an end region; and -
FIG. 8 is a diagram for describing integrating saliency maps. - The invention proposes an algorithm for saliency detection whereby a saliency region is automatically detected its ore extracted from a still image or a video using image analysis on a computer. Saliency information, which is the result of saliency detection, may be output as a saliency map representing a distribution of the saliency measure for each pixel or each region, or as a binary image wherein a saliency map is converted to a binary representation using a predetermined threshold. This kind of saliency information is preferably employed in a variety of ways such as preprocessing in a computer vision application, e.g., partitioning image regions (segmentation), image classification, scene interpretation, image compression, facial recognition, and object recognition.
- The saliency detection algorithm according to embodiments of the invention is made up of two stages: local estimation, and global detection. The former local estimation stage estimates a saliency measure for each pixel using information obtained from a local region surrounding each pixel in the input image is a clue, and temporarily generates a saliency map (referred to as a local saliency map). The latter global detection stage estimates a saliency region using the local saliency map obtained during the local estimation stage and information obtained from the entire input image as clues, and generates a final saliency map. Hereby, saliency can be evaluated in a way that takes into account both localized attributes in an image and attributes embodying the whole image, thereby improving the robustness of the algorithm and increasing the versatility thereof while improving the accuracy and reliability of the saliency detection.
- Moreover, a deep neural network (DNN) which is a deep learning based network is used in each of the stages of local estimation and global detection in the embodiments below. The first deep neural network used during the local estimation stage (hereafter, DNN-L) is trained on the relationship between local features (e.g., localized contrast, texture, and shape information) that can be extracted from a local region surrounding a pixel and saliency using multiple images serving as trainers. The second deep neural network used during the global detection stage (hereafter, DNN-G) is trained on the relationship between global features (e.g., global contrast, geometrical information including positional information within the image) that can be extracted from an input image and saliency using multiple images serving as trainers. These techniques allow the modeling of the complicated dependent relationships between the various clues (features) that can be extracted from an image, and the importance thereof (contributions in terms of saliency), as well as the construction of a saliency detection engine that can be flexibly applied to an arbitrary image.
- An example of a specific embodiment of a saliency detection algorithm according to the invention is described below with reference to the drawings. However, the embodiment described below is merely an example of a preferred configuration, and is in no way meant to limit the scope of the invention thereto.
-
FIG. 1 is a block diagram illustrating a functional configuration of a saliency information acquisition device according to an embodiment. The saliencyinformation acquisition device 1 mainly includes animage acquisition unit 10; a localsaliency acquisition unit 11; a candidate-region setting unit 12; a localsaliency refinement unit 13; afeature extraction unit 14; a globalsaliency acquisition unit 15; and anintegration unit 16. The localsaliency acquisition unit 11, the candidate-region setting unit 12, the localsaliency refinement unit 13 are function blocks related to local estimation, while the candidate-region setting unit 12, thefeature extraction unit 14, the globalsaliency acquisition unit 15 and theintegration unit 16 are function blocks related to global detection. The reference numerals D10 through D16 represents the data transferred between the function blocks. - The
image acquisition unit 10 acquires an image that is to be processed. Theimage acquisition unit 10 may be acquire image data from an imaging device (camera), or may read image data from a storage device or a server on a network. While no particular image format is required, the present embodiment is described based on an RGB color image. The image input may also be a still image or a video. When a video is input, the later-described saliency detection process is executed frame by frame. The input image D10 acquired may be stored in memory and the like, and used, for example, by the localsaliency acquisition unit 11, the candidate-region setting unit 12, and thefeature extraction unit 14. - The local
saliency acquisition unit 11 includes a feature of computing calculates (estimates) a saliency measure for each pixel in the input image D10 on the basis of information obtained from a local region surrounding the pixel. The localsaliency acquisition unit 11 uses a deep neural network DNN-L is a classifier to estimate the saliency measure from the information in the local region. The data representing the distribution of the saliency measures estimated by the localsaliency acquisition unit 11 for each pixel is referred to as a localsaliency map D 11. - The candidate-
region setting unit 12 includes a feature of setting a plurality of candidate regions D12 from the input image D10. The localsaliency refinement unit 13, thefeature extraction unit 14, and theintegration unit 16 may use this candidate region D12. - The local
saliency refinement unit 13 includes a feature of the saliency measure for each pixel on the basis of the local saliency map D11 obtained by the localsaliency acquisition unit 11, and the plurality of candidate regions D12 obtained by the candidate-region setting unit 12. The refined localsaliency map D 13 is used in the later global detection stage. Note that the refinement process may be omitted when the local saliency map D11 obtained by the localsaliency acquisition unit 11 is sufficiently reliable; in that case, the local saliency map D11 is used in the global detection as is. - The
feature extraction unit 14 includes a feature of extracting various kinds of features that may serve as clues from the plurality of candidate regions D12 and generates a multidimensionalfeature vector D 14. A feature includes at least an element representing an attribute of the saliency measure for each pixel within a candidate region (referred to as a local saliency feature), and an element representing an attribute of the candidate region in relation to the entire input image D10 (referred to as a global feature). - The global
saliency acquisition unit 15 includes a feature of calculating (estimating) a saliency measure for each of the candidate regions on the basis of the feature vector D14 obtained from thefeature extraction unit 14. The globalsaliency acquisition unit 15 uses a deep neural network DNN-G as a classifier to estimate the saliency measure from thefeature vector D 14. The estimation result D15 from the globalsaliency acquisition unit 15 is input into theintegration unit 16. - The
integration unit 16 includes a feature of integrating the saliency measure obtained for the plurality of candidate regions by the globalsaliency acquisition unit 15, and generates a final saliency map (saliency information) for the entire input image. The final saliency map D16 generated by theintegration unit 16 may be storage in a storage unit, or output to an external device to be used by various computer vision applications such as object recognition or image classification. - The saliency
information acquisition device 1 may be composed of for instance a computer equipped with a CPU (processor), a memory, and auxiliary storage device, an input device, a display device, and a communication device. A program stored in the auxiliary storage device may be loaded into memory and run on the CPU to implement each of the functions illustrated in the saliencyinformation acquisition device 1 inFIG. 1 . However, all or a portion of the functions of the saliencyinformation acquisition device 1 may be implemented as circuits on an ASIC or an FPGA or the like. Alternatively, a portion of the functions of the saliencyinformation acquisition device 1 may be implemented through cloud computing or distributed computing. - The saliency detection process carried out by the saliency
information acquisition device 1 is described in detail.FIG. 2 is a flowchart illustrating the flow of the saliency detection process. - In step S10, the
image acquisition unit 10 acquires an input image for saliency detection processing. Theimage acquisition unit 10 may perform preprocessing such as format conversion, resolution conversion, or noise removal or the like if needed.FIG. 3 depicts an image of a woman riding a bicycle is one example of an input image D10. Conceivably, in many cases, a person viewing this image, will focus on taking a picture of the woman, who is the subject. Therefore, the output result expected from the saliencyinformation acquisition device 1 is a saliency map where the region including the woman has a high saliency measure. - Moving on, the processes in steps S11 through S13 are executed in order for all the pixels within the input image D10. Hereafter, a pixel at a coordinate (x, y) in the input image D10 is represented as pixel(x, y).
FIG. 3 is a schematic of the processes in step S11 throughS 13. - The local
saliency acquisition unit 11 clips a local region image of a predetermined size from the input image D10, with the pixel(x, y) in the image being processed as the center thereof (step S11). Although the size of the local region image may be established as desired, in the present embodiment the local region image is 51 x 51 pixels. The localsaliency acquisition unit 11 uses DNN-L to calculate a saliency measure for the pixel(x, y) (step S12). The DNN-L is configured to receive an input of a 51 x 51 pixel local region image and to output the saliency measure for the center thereof, pixel(x, y), as an estimation result. An estimation result S (x, y) is a value from 0 to 1, or is given a value from 0 to 255, where zero represents no saliency and the value increases as the saliency increases. The configuration of DNN-L, and a technique for training the parameter θL are described later. - The local
saliency acquisition unit 11 repeats steps S11 and S12 until a saliency measure is obtained for all the pixels within the input image D10 (step S13). A local saliency map D11 as illustrated inFIG. 3 is obtained as a result thereof. The saliency measure for each pixel is represented in gray scale where a lighter (closer to white) the pixel, the higher the saliency. - The candidate-
region setting unit 12 sets a plurality of candidate regions D12 from the input image D10. While any desired method may be used for determining a candidate region D12, in this embodiment the candidate-region setting unit 12 detects the plurality of "objectness regions" (regions that have the possibility of being objects) from the input image D10 and sets the respective regions detected as candidate regions D12. A person's attention is often directed at the object captured in an image, more so than the background or an empty region in the image. Accordingly, it is appropriate to think of saliency as evaluating each object existing within an image. Therefore, an objectness region is sent as a candidate region D12 and the following processes executed based on a candidate region. Further improvements in the reliability of the saliency information can be expected since the above makes provides saliency detection that takes into account the likelihood that a region being an object (i.e., objectness). - Various techniques for detecting an objectness region from an image are proposed, and any of these methods may be used; this embodiment adopts the Geodesic Object Proposals (GOP) described in P. Krahenbuhl, et. al., 2014 (Non-Patent Document 3).
FIG. 4 illustrates one example of a candidate region D12 obtained from a GOP. Note that there is no need to perform strict object detection at this point, rather it is preferable that the detection does not leave out any region that may be an object. As can be understood from the example presented inFIG. 4 the plurality of candidate regions D12 may include overlapping sections (redundant sections). - Incidentally, because the local saliency map D11 is calculated from only local information, the local saliency map D11 tends to include noise due to the high-frequency components (e.g., outlines within the background, and changes in patterns or colors) contained in the input image D10. Therefore, in step S 15 the local
saliency refinement unit 13 refines the local saliency map D11 on the basis of information in the plurality of candidate regions D12 obtained in step S14. At this point, the saliency measure for each pixel may be refined so that the saliency measure for the pixels contained in the candidate region D12 is relatively large while the saliency measure for pixels outside thecandidate region D 12 is relatively small. - A specific example of the refinement process adopted in this embodiment is described with reference to
FIG. 5 . First, the localsaliency refinement unit 13 calculates a reliability score confL for each candidate region (i) using Expression (1). Note that the superscript "L" is a symbol indicating a relationship to local estimation.
Formula 1


- Here "i" is a candidate region number. When m candidate regions are set, "i" is a value from 1 to m. The parameter Oi is a mask for the candidate region (i); Oi (x, y) = 1 implies that the pixel(x, y) is contained in the i-th candidate region, while Oi (x, y) = 1 implies that the pixel(x, y) is outside the i-th candidate region. The symbol SL represents the local saliency map D11, where SL (x, y) ∈ [0, 1] represents the saliency measure of the pixel(x, y).
- The symbol Ai is the mean of the saliency measure SL (x, y) for each pixel in a candidate region (i), and hereafter is referred to as an accuracy score. The larger (i.e., the closer to 1) the accuracy score Ai , the higher the possibility (probability) that the candidate region (i) is a saliency region. In this embodiment the mean of the saliency measures is used, however a statistic other than the mean (such as the mode, the maximum, the minimum, and the total) may be used for the accuracy score.
- The symbol Ci is a ratio of the total of the saliency measures SL (x, y) within a candidate region in relation to the total of the saliency measures SL (x, y) in the entire input image, and hereafter is referred to as the coverage score. The larger (i.e., the closer to 1) the coverage score Ci , the higher the possibility (probability) that the candidate region (i) is a saliency region. Note that, since the saliency measure SL (x, y) may only be given a value of '1' or'0', the denominator of Ci equals the total area of the regions (saliency regions) in the input image where the saliency value is nonzero, and the numerator of Ci equals the area of the section of overlap between the candidate region (i) and the saliency region. Consequently Ci also represents and overlap ratio of the candidate region (i) to the saliency region.
- The element β is a weight coefficient used in fine-tuning the balance between the accuracy score Ai and the coverage score Ci. In this embodiment β is 0.4.
- After calculating the reliability score confL for all m candidate regions, the local
saliency refinement unit 13 sorts the masks O1 to Om for each of the candidate regions in order of descending score. The top K candidate region masks (e.g., 20 in this embodiment) are then combined to generate a refined localsaliency map D 13. The masks may be combined by, for instance, mere averaging, or by a weighted sum with a weight corresponding to the reliability score confL. -
FIG. 5 depicts an example of a refined local saliency map D13. It can be understood that supplementing the process of refining the saliency measure with spatial information, such as, being inside or outside the candidate region reduces the noise in a saliency distribution, and increases the spatial uniformity of the saliency distribution. - The processes in step S16 through S18 are carried out in order on all the candidate regions D12 set in step S14.
FIG. 6 is a schematic of the processes in step S16 through S18. - The
feature extraction unit 14 generates a feature vector D14 for a candidate region (i) on the basis of the candidate region (i) being processed, the localsaliency map D 13, and the input image D10.S A feature, which may serve as a clue in determining the saliency of the candidate region (i) may be for instance the following. -
- (a-1) An accuracy score Ai calculated from a mask Oi for the candidate region (i), and the refined local saliency map D13 using Expression (2). This feature represents a statistic of the saliency measure for each pixel in the candidate region (i).
- (a-2) A coverage score Ci calculated from a mask Oi for the candidate region (i), and the refined local
saliency map D 13 using Expression (3). This feature represents a ratio of the total of the saliency measure for each pixel within a candidate region in relation to the total of the saliency measure for each pixel in the entire input image. - (a-3) A product of the accuracy score and the coverage score: Ai × Ci.
- (a-4) A ratio of the area of the candidate region (i) to the total area of the saliency regions (regions where the saliency measure is nonzero) within the refined local saliency map D 13 (in other words, the overlap ratio).
-
- (b-1) A difference, e.g., a chi-squared distance, between a color histogram of the candidate region (i) and a color histogram of an end region in the input image D10. An end region is a small region located at the ends of the image; for instance, as illustrated in
FIG. 7 the end regions B1 through B4 are defined as regions of a predetermined width from the upper end, the left end, the lower end, and the right end respectively of the input image D10. The probability is usually high that the end portion of an image is a background, this feature is considered to represent the contrast of the candidate region (i) in relation to the background. Note that, preferably values other than values calculated in an RGB color space are used, for example, values calculated in other color spaces such as Lab or HSV. - (b-2) A difference, e.g., a Euclidean distance, between a representative color value in the candidate region (i) and a representative color value in an end region in the input image D10. This feature is also considered to represent the contrast of the candidate region (i) in relation to the background. A representative color value may be, for instance, the mean, the mode, the median, the maximum, or the minimum. The feature may be calculated for each color channel (e.g., in the case of RGB, a feature for a representative R-value, a feature for a representative G-value, and a feature for a representative B-value), or the feature may be calculated using a brightness value. Again, preferably values other than values calculated in an RGB color space are used, for example, values calculated in other color spaces such as Lab or HSV.
- (b-3) A difference, e.g., a chi-squared distance, between a color histogram of the candidate region (i) and a color histogram of the entire input image D10.
This feature represents the contrast of the candidate region (i) in relation to the entire image. This feature also uses values calculated in a plurality of color spaces such as RGB, Lab, and HSV. - (b-4) The color dispersion within the candidate region (i)
This feature, i.e., the color dispersion may be calculated for each color channel, or maybe calculated from brightness values. The values used here may also be calculated in a plurality of color spaces such as RGB, Lab, and HSV. -
- (c-1) The aspect ratio, height, or with weeds of a square (circumscribing square) encompassing the candidate region (i)
- (c-2) A center coordinate for the candidate region (i)
- (c-3) The length of the long axis or the length of the short axis for the candidate region (i)
- (c-4) An Euler number for the candidate region (i)
- In the embodiment, all the features provided here are included to create a 72-dimensional
feature vector D 14; however, any desired type and number of features may be used. - The global
saliency acquisition unit 15 uses DNN-G to calculate a saliency measure for a candidate region (i) (step S17). The network DNN-G is configured to receive input of afeature vector D 14 for the candidate region, and output a saliency measure for the candidate region as an estimation result. The estimation result ϕ is given as a prediction accuracy ϕ1 and an overlap ratio ϕ2. The prediction accuracy ϕ1 represents the possibility (probability) that the candidate region (i) is a saliency region, and the overlap ratio ϕ2 represents a ratio of the area of the candidate region (i) to the total area of the saliency regions within the input image. The globalsaliency acquisition unit 15 repeats the processes in steps S16 and theS 17 until a saliency measure ϕ = [ϕ1, ϕ2] is obtained for m candidate regions (step S18). The configuration of DNN-G, and technique for training the parameter θG are described later. - In
step S 19, theintegration unit 16 calculates a reliability score confG for each of candidate region (i) with Expression (4) using the saliency measure ϕ = [ϕ1, ϕ2] acquired in step S17. Note that the superscript "G" is a symbol a relationship to global detection.
Formula 2
- After calculating the reliability score confG for all m candidate regions, the
integration unit 16 sorts the masks O1 to Om for each of the candidate regions in order of descending score. The top K candidate region masks (e.g., 20 in this embodiment) are then combined to generate a final saliency map D16. The masks may be combined by, for instance, mere averaging, or by a weighted sum with a weight corresponding to the reliability score confG.FIG. 8 illustrates one example of a final saliency map D16 obtained using a weighted sum. It can be understood fromFIG. 8 that a highly accurate saliency map can be generated hereby where the saliency measure of the portion in the input image D10 including the subject (the woman) increases. - A configuration example of the DNN-L, which is used in local estimation and the training method therefor is described. Various techniques have been proposed with regards to deep neural networks; although any of these methods may be used, the embodiment employs a deep convolutional neural network described in Non-Patent Document 4.
- Table 1 illustrates an example configuration of DNN-L.
Table 1 Layer 1 2 3 4 5 6 (Output) Type C+R+L C+R C+R F+R+D F+R+D F+S Channels 96 256 384 2048 2048 2 Filter size 11×11 5×5 3×3 - - - Pooling size 3×3 2×2 3×3 " - - Pooling stride 2×2 2×2 3×3 - - W Input size 51×51 20×20 8×8 2×2 1x1 1x1 - The elements "Type" represents the kind of layer. Here, "C" is a convolution layer, And "F" represents a fully connected layer. Additionally, "R" indicates the use of a rectified linear unit (ReLU) as an activation function, "L" indicates the normalization of the filter result, "D" indicates dropout (i.e., that a portion of the neurons will not be allowed to participate in the next calculation to prevent over-filtering), and "S" indicates a softmax layer.
- The "Channels" are the number of feature maps (i.e., the dimensionality of the features) output to the next layer. The "Filter size" is the kernel size of the filter used in the convolution computation. The "Pooling size", and the "Pooling stride" are parameters used for down-sampling the feature map. The "Input size" is the size of the feature map entering the layer.
- An image containing multiple trainers is used as the training data. Any kind of image may be used, however images where various kinds of subjects and scenes are combined are preferred. A plurality of patches size 51 x 51 pixels are clips from each of the images; for instance, a center position may be shifted by 10 pixels at a time while clipping tens or hundreds of patches from a single image. The samples are then classified; patches having a large overlap ratio with a ground truth mask (e.g., 0.7 or more) are classified as positive samples, while patches having a small overlap ratio (e.g., 0.3 or less) are classified as negative samples. Positive samples are given the label "1", while negative samples are given the label "0". Finally, hundreds to thousands of patches are prepared under positive samples and negative samples.
- Expression (5) represents a training cost function for the DNN-L.
Formula 3
- Here, θL is a training parameter in DNN-L, and contains a weight, a bias, and the like for each of the six layers. The expression 1 { • } is an indicator function. The expression P(1i = j | θL) is an estimation result from DNN-L, indicating the probability that the i-th training sample is salient (1i = 1) or non-salient (1i = 0). The parameter λ is the weight decay parameter. The parameter WL K is the weight of the k-th layer. The expression || • ||F is a Frobenius norm. The parameter m is the overall number of training samples.
- For instance, the cost function in Expression (5) may be solved using stochastic gradient descent, allowing training of the parameter θL in the DNN-L. The momentum may be set at 0.9, and the weight decay parameter λ may be set to 0.0005.
- Next, a configuration example of the DNN-G, which is used in global detection, and the training method therefor is described. Table 2 illustrates an example configuration of the DNN-G. The symbols used in the table are identical to the symbols used in Table 1.
Table 2 Layer 1 2 3 4 5 6 (Output) Type F+R+D F+R+D F+R+D F+R+D F+R+D F Channels 1024 2048 2048 1024 1024 2 Filter size - - - - - - Pooling size - - - - - - Pooling stride - - - - - - Input size 1x1 1x1 1x1 1x1 1x1 1x1 - Similarly to the DNN-L, an image containing multiple trainers is used as the training data. A plurality of candidate regions (objectness regions) is established in each image using the GOP method. A feature vector V is generated and a label vector y is computed for each of the candidate regions; the label vector y contains an accuracy p comparing the candidate region with a ground truth mask, and an overlap ratio O. The configuration of the feature vector V is identical to the feature vector described in step S16. The accuracy p and the overlap ratio O can be calculated using Expression (2) and Expression (3), respectively, where the saliency map S[sub]L serves as the ground truth mask.
- Expression (6) represents a training cost function for the DNN-G.
Formula 4
- Here, θG is a training parameter in DNN-G, and contains a weight, a bias, and the like for each of the six layers. The parameter yi= [pi , Oi] is the label vector made up of the accuracy pi and the overlap ratio Oi for the i-th candidate region. The parameter vi is the feature vector for the i-th candidate region. The expression ϕ(vi|θG) = [ ϕ1i, ϕ2 i] is the estimation result from DNN-G. The variable WG K is the weight of the k-th layer. The expression || • ||F is a Frobenius norm. The parameter η is the weight decay parameter. The parameter m is the overall number of candidate regions used for training.
- For instance, the cost function in Expression (6) may be solved using stochastic gradient descent, allowing training of the parameter θG in the DNN-G. The momentum may be set at 0.9, and the weight decay parameter λ may be set to 0.0005.
- With the above described embodiment, a saliency measure (D11 or D13) is calculated per pixel using information obtained from a local region as a clue, whereafter a saliency measure (D15) is calculated for each candidate region with a feature vector (D14) containing the local saliency feature and the global feature for each region as a clue, where local saliency and global saliency are combined to generate final saliency information (D16). Accordingly, saliency can be evaluated in a way that takes into account both localized attributes and attributes embodying the whole image, thereby improving the versatility and the reliability of saliency detection.
- Existing saliency detection algorithms require the user to plan the features or combination of features used in evaluating the saliency measure. Therefore, it tended to be extremely difficult to optimize the features used and the performance of the saliency detection algorithm depended disadvantageously on the quality of the features selected. In contrast, using deep learning allows the classifiers DNN-L and DNN-G to be built automatically through machine learning; the classifier DNN-L calculates a saliency measure from information in a local region, and the classifier DNN-G calculates a saliency measure for each candidate region from global information. Consequently, embodiments of the invention are able to easily build a saliency detector having stable performance.
- In addition, the DNN is supplied with as much information as possible, using machine learning to optimize feature extraction, selection, and combination inside the DNN; therefore, this improves the reliability of the estimation result, i.e., the saliency measure.
- Finally, a final saliency map (D16) is created from using a weight corresponding to the reliability of the estimation result from the DNN-G for each candidate region (i.e., confG) to provide a weighted combination of the saliency measures for a plurality of candidate regions, and thus allows even more reliable saliency information to be obtained.
- The above-described embodiment is merely one specific example of the invention, and in no way is it meant that the scope of the invention is limited to said specific example.
-
- 1
- Saliency information acquisition device
- 10
- Image acquisition unit
- 11
- Local saliency acquisition unit
- 12
- Candidate-region setting unit
- 13
- Local saliency refinement unit
- 14
- Feature extraction unit
- 5
- Global saliency acquisition unit
- 16
- Integration unit
- D10
- Input image
- D11
- Local saliency map
- D12
- Candidate region
- D13
- Refined local saliency map
- D14
- Feature vector
- D15
- Estimation result (saliency measure) for candidate region
- D16
- Final saliency map
Claims (13)
- A saliency information acquisition device comprising:a local saliency acquisition unit configured to calculate a saliency measure for each pixel in an input image on the basis of information obtained from a local region surrounding each pixel;a candidate-region setting unit configured to set a plurality of candidate regions in the input image;a global saliency acquisition unit configured to calculate a saliency measure for each candidate region in the plurality of candidate regions on the basis of information including a local saliency feature representing an attribute of the saliency measure for each pixel within a candidate region, and a global feature representing an attribute of the candidate regions in relation to the entire input image; andan integration unit configured to combine the saliency measure for each candidate region in the plurality of candidate regions obtained by the global saliency acquisition unit to generate saliency information for the input image.
- The saliency information acquisition device according to claim 1, wherein the local saliency acquisition unit uses a first deep neural network to calculate a saliency measure for each pixel in the input image.
- The saliency information acquisition device according to claim 2, wherein the first deep neural network is a neural network configured to receive an image of a local region surrounding a given pixel as an input, and output a saliency measure for said pixel as an estimation result.
- The saliency information acquisition device according to any one of claims 1 through 3, further comprising:a local saliency refinement unit configured to refine the saliency measure for each pixel on the basis of the saliency measure for each pixel obtained by the local saliency acquisition unit and the plurality of candidate regions obtained by the candidate-region setting unit so that the saliency measure for a pixel included in the candidate region becomes relatively larger and the saliency measure for a pixel outside of the candidate region becomes relatively smaller; andthe global saliency acquisition unit uses the saliency measure refined by the local saliency refinement unit to obtain the local saliency feature for each of the candidate regions.
- The saliency information acquisition device according to any one of claims 1 through 4, wherein the global saliency acquisition unit uses a second deep neural network to calculate a saliency measure for each candidate region in the plurality of candidate regions.
- The saliency information acquisition device according to claim 5, wherein the second deep neural network is a neural network configured to receive as input a feature vector containing the local saliency feature and the global feature of a given candidate region as components, and output a saliency measure of said candidate region as an estimation result.
- The saliency information acquisition device according to any one of claims 1 through 6, wherein the local saliency feature includes any one of:a statistic of the saliency measure for each pixel within the candidate region;a ratio of the total of the saliency measure for each pixel in a candidate region to the total of the saliency measure for each pixel in the entire input image;a product of the statistic and the ratio; andan overlap ratio of the aforementioned candidate region to the regions in the input image where the saliency measure is nonzero.
- The saliency information acquisition device according to any one of claims 1 through 7, wherein the global feature includes any one of:a difference between a color histogram for the candidate region and the color histogram of an end region in the input image;a difference between a representative color value within the candidate region and a representative color value within the end region in the input image;a difference between a color histogram of the candidate region and a color histogram of the entire input image; andthe dispersion of the colors within the candidate region.
- The saliency information acquisition device according to any one of claims 1 through 8, wherein a global feature includes any of:the aspect ratio of a square enclosing the candidate region;the height of said square;the width of said square;the center coordinate of the candidate region;the length along the long axis of the candidate region;the length along the short axis of the candidate region; andan Euler number for the candidate region.
- The saliency information acquisition device according to claim 6, wherein the integration unit may perform a weighted sum of the saliency measures for the plurality of candidate regions using a weight corresponding to the reliability of the estimation result from the second deep neural network for each candidate region to generate saliency information for the input image.
- The saliency information acquisition device according to any one of claims 1 through 10, wherein the candidate-region setting unit detects a plurality of objectness regions from within the input image, and sets the plurality of detected regions as the plurality of candidate regions.
- The saliency information acquisition device according to claim 11, wherein the candidate-region setting unit uses the Geodesic Object Proposal technique to detect the objectness regions from within the input image.
- A saliency information acquisition method having steps comprising:calculating a saliency measure for each pixel in an input image on the basis of information obtained from a local region surrounding each pixel;setting a plurality of candidate regions in the input image;calculating a saliency measure for each candidate region in the plurality of candidate regions on the basis of information including a local saliency feature representing an attribute of the saliency measure for each pixel within a candidate region, and a global feature representing an attribute of the candidate regions in relation to the entire input image; andcombining the saliency measure for each candidate region in the plurality of candidate regions to generate saliency information for the input image.
Applications Claiming Priority (1)
| Application Number | Priority Date | Filing Date | Title |
|---|---|---|---|
| CN201510303277.6A CN106296638A (en) | 2015-06-04 | 2015-06-04 | Significance information acquisition device and significance information acquisition method |
Publications (1)
| Publication Number | Publication Date |
|---|---|
| EP3101594A1 true EP3101594A1 (en) | 2016-12-07 |
Family
ID=55701710
Family Applications (1)
| Application Number | Title | Priority Date | Filing Date |
|---|---|---|---|
| EP16160433.5A Withdrawn EP3101594A1 (en) | 2015-06-04 | 2016-03-15 | Saliency information acquisition device and saliency information acquisition method |
Country Status (5)
| Country | Link |
|---|---|
| US (1) | US9824294B2 (en) |
| EP (1) | EP3101594A1 (en) |
| JP (1) | JP2017004480A (en) |
| KR (1) | KR20160143494A (en) |
| CN (1) | CN106296638A (en) |
Cited By (3)
| Publication number | Priority date | Publication date | Assignee | Title |
|---|---|---|---|---|
| CN110765882A (en) * | 2019-09-25 | 2020-02-07 | 腾讯科技(深圳)有限公司 | A video tag determination method, device, server and storage medium |
| CN111047579A (en) * | 2019-12-13 | 2020-04-21 | 中南大学 | Characteristic quality evaluation method and image characteristic uniform extraction method |
| CN111429463A (en) * | 2020-03-04 | 2020-07-17 | 北京三快在线科技有限公司 | Instance splitting method, instance splitting device, electronic equipment and storage medium |
Families Citing this family (43)
| Publication number | Priority date | Publication date | Assignee | Title |
|---|---|---|---|---|
| US11568627B2 (en) * | 2015-11-18 | 2023-01-31 | Adobe Inc. | Utilizing interactive deep learning to select objects in digital visual media |
| US9779492B1 (en) * | 2016-03-15 | 2017-10-03 | International Business Machines Corporation | Retinal image quality assessment, error identification and automatic quality correction |
| JP6756406B2 (en) * | 2016-11-30 | 2020-09-16 | 日本電気株式会社 | Image processing equipment, image processing method and image processing program |
| JP6778625B2 (en) * | 2017-01-31 | 2020-11-04 | 株式会社デンソーアイティーラボラトリ | Image search system, image search method and image search program |
| JP6565967B2 (en) * | 2017-05-12 | 2019-08-28 | トヨタ自動車株式会社 | Road obstacle detection device, method, and program |
| CN109118459B (en) * | 2017-06-23 | 2022-07-19 | 南开大学 | Image salient object detection method and device |
| CN107301420A (en) * | 2017-06-30 | 2017-10-27 | 武汉大学 | A kind of thermal infrared imagery object detection method based on significance analysis |
| US10726307B2 (en) | 2017-06-30 | 2020-07-28 | Ai Systems Co., Ltd. | Real-time identification of moving objects in video images |
| CN107506792B (en) * | 2017-08-16 | 2020-09-29 | 广西荷福智能科技有限公司 | Semi-supervised salient object detection method |
| CN110809784B (en) * | 2017-09-27 | 2021-04-20 | 谷歌有限责任公司 | End-to-end network model for high-resolution image segmentation |
| US9984325B1 (en) * | 2017-10-04 | 2018-05-29 | StradVision, Inc. | Learning method and learning device for improving performance of CNN by using feature upsampling networks, and testing method and testing device using the same |
| CN108021920A (en) * | 2017-11-09 | 2018-05-11 | 华南理工大学 | A method for collaborative discovery of image objects |
| CN107784662B (en) * | 2017-11-14 | 2021-06-11 | 郑州布恩科技有限公司 | Image target significance measurement method |
| US10579908B2 (en) * | 2017-12-15 | 2020-03-03 | Google Llc | Machine-learning based technique for fast image enhancement |
| CN108154150B (en) * | 2017-12-18 | 2021-07-23 | 北京工业大学 | A saliency detection method based on background priors |
| JP7107544B2 (en) * | 2018-01-16 | 2022-07-27 | Necソリューションイノベータ株式会社 | Information processing device, control method, and program |
| JP2019160251A (en) * | 2018-03-16 | 2019-09-19 | 株式会社リコー | Image processing device, object recognition device, instrument control system, moving body, image processing method and program |
| CN108629286B (en) * | 2018-04-03 | 2021-09-28 | 北京航空航天大学 | Remote sensing airport target detection method based on subjective perception significance model |
| US11244195B2 (en) | 2018-05-01 | 2022-02-08 | Adobe Inc. | Iteratively applying neural networks to automatically identify pixels of salient objects portrayed in digital images |
| JP2021523461A (en) * | 2018-05-10 | 2021-09-02 | ザ ボード オブ トラスティーズ オブ ザ レランド スタンフォード ジュニア ユニバーシティー | Training of photon neural networks through in-situ backpropagation |
| KR102631031B1 (en) | 2018-07-27 | 2024-01-29 | 삼성전자주식회사 | Method for detecting defects in semiconductor device |
| JP7089179B2 (en) | 2018-08-30 | 2022-06-22 | 富士通株式会社 | Image recognition device, image recognition method and image recognition program |
| JP7222216B2 (en) | 2018-10-29 | 2023-02-15 | 株式会社アイシン | Driving support device |
| US10929708B2 (en) * | 2018-12-10 | 2021-02-23 | International Business Machines Corporation | Deep learning network for salient region identification in images |
| JP2020184146A (en) * | 2019-05-07 | 2020-11-12 | パイオニア株式会社 | Saliency estimation device, saliency estimation method and program |
| US12067763B2 (en) | 2019-05-23 | 2024-08-20 | Nippon Telegraph And Telephone Corporation | Three-dimensional point cloud label learning estimation device, three-dimensional point cloud label learning estimation method, and 3D point cloud label learning estimation program |
| CN110361625B (en) * | 2019-07-23 | 2022-01-28 | 中南大学 | Method for diagnosing open-circuit fault of inverter and electronic equipment |
| CN110598610B (en) * | 2019-09-02 | 2022-02-22 | 北京航空航天大学 | Target significance detection method based on neural selection attention |
| US11200539B2 (en) * | 2019-10-15 | 2021-12-14 | UiPath, Inc. | Automatic completion of robotic process automation workflows using machine learning |
| CN110737497B (en) * | 2019-10-15 | 2020-11-03 | 中国人民解放军海军大连舰艇学院 | Display control interface aided decision design optimization method |
| US11373407B2 (en) * | 2019-10-25 | 2022-06-28 | International Business Machines Corporation | Attention generation |
| CN111027544B (en) * | 2019-11-29 | 2023-09-29 | 武汉虹信技术服务有限责任公司 | MSER license plate positioning method and system based on visual saliency detection |
| CN111161177B (en) * | 2019-12-25 | 2023-09-26 | Tcl华星光电技术有限公司 | Image adaptive noise reduction method and device |
| WO2021187776A1 (en) * | 2020-03-17 | 2021-09-23 | Samsung Electronics Co., Ltd. | Methods and systems for grouping of media based on similarities between features of the media |
| US11854242B2 (en) * | 2020-09-23 | 2023-12-26 | Apple Inc. | Systems and methods for providing personalized saliency models |
| CN112348033B (en) * | 2020-10-15 | 2024-01-26 | 北京交通大学 | A collaborative salient target detection method |
| CN112581446B (en) * | 2020-12-15 | 2024-12-13 | 影石创新科技股份有限公司 | A method, device, equipment and storage medium for detecting significant objects in an image |
| EP4116871B1 (en) * | 2021-07-08 | 2025-08-27 | Argo AI GmbH | Method and processing unit for processing sensor data of several different sensors with an artificial neural network in a vehicle |
| CN114098781A (en) * | 2021-11-25 | 2022-03-01 | 东南大学 | Breast cancer auxiliary detection method fusing global and local information |
| CN113850828B (en) * | 2021-11-30 | 2022-02-22 | 腾讯科技(深圳)有限公司 | Image processing method, image processing apparatus, electronic device, storage medium, and program product |
| CN114140622B (en) * | 2021-12-06 | 2024-09-13 | 许昌三维测绘有限公司 | A real-time saliency detection image method based on dual-branch network |
| CN114338355B (en) * | 2021-12-30 | 2023-12-22 | 龙坤(无锡)智慧科技有限公司 | Method and device for synchronizing and replacing embedded data acquisition equipment |
| CN114863138B (en) * | 2022-07-08 | 2022-09-06 | 腾讯科技(深圳)有限公司 | Image processing method, device, storage medium and equipment |
Family Cites Families (17)
| Publication number | Priority date | Publication date | Assignee | Title |
|---|---|---|---|---|
| US6721446B1 (en) * | 1999-04-26 | 2004-04-13 | Adobe Systems Incorporated | Identifying intrinsic pixel colors in a region of uncertain pixels |
| IL172480A (en) * | 2005-12-08 | 2011-11-30 | Amir Zahavi | Method for automatic detection and classification of objects and patterns in low resolution environments |
| JP4712635B2 (en) * | 2006-07-27 | 2011-06-29 | 富士フイルム株式会社 | Data correction method, apparatus and program |
| JP5049899B2 (en) * | 2008-06-30 | 2012-10-17 | キヤノン株式会社 | Imaging apparatus and control method thereof |
| CN101329767B (en) * | 2008-07-11 | 2011-11-16 | 西安交通大学 | Method for automatically detecting obvious object sequence in video based on learning |
| JP5202148B2 (en) * | 2008-07-15 | 2013-06-05 | キヤノン株式会社 | Image processing apparatus, image processing method, and computer program |
| JP5057183B2 (en) * | 2010-03-31 | 2012-10-24 | アイシン・エィ・ダブリュ株式会社 | Reference data generation system and position positioning system for landscape matching |
| CN102236883A (en) * | 2010-04-27 | 2011-11-09 | 株式会社理光 | Image enhancing method and device as well as object detecting method and device |
| CN102779338B (en) | 2011-05-13 | 2017-05-17 | 欧姆龙株式会社 | Image processing method and image processing device |
| US8675966B2 (en) * | 2011-09-29 | 2014-03-18 | Hewlett-Packard Development Company, L.P. | System and method for saliency map generation |
| CN102693426B (en) * | 2012-05-21 | 2014-01-08 | 清华大学深圳研究生院 | Method for detecting image salient regions |
| JP5958534B2 (en) * | 2012-05-24 | 2016-08-02 | 日本電気株式会社 | Pathological diagnosis result determination system, pathological diagnosis result determination method, and pathological diagnosis result determination apparatus |
| WO2015025704A1 (en) * | 2013-08-23 | 2015-02-26 | 日本電気株式会社 | Video processing device, video processing method, and video processing program |
| CN103679173B (en) * | 2013-12-04 | 2017-04-26 | 清华大学深圳研究生院 | Method for detecting image salient region |
| US10650508B2 (en) * | 2014-12-03 | 2020-05-12 | Kla-Tencor Corporation | Automatic defect classification without sampling and feature selection |
| US9530082B2 (en) * | 2015-04-24 | 2016-12-27 | Facebook, Inc. | Objectionable content detector |
| US10019657B2 (en) * | 2015-05-28 | 2018-07-10 | Adobe Systems Incorporated | Joint depth estimation and semantic segmentation from a single image |
-
2015
- 2015-06-04 CN CN201510303277.6A patent/CN106296638A/en active Pending
- 2015-06-30 JP JP2015132103A patent/JP2017004480A/en active Pending
-
2016
- 2016-03-15 EP EP16160433.5A patent/EP3101594A1/en not_active Withdrawn
- 2016-03-21 KR KR1020160033218A patent/KR20160143494A/en not_active Abandoned
- 2016-03-28 US US15/083,018 patent/US9824294B2/en active Active
Non-Patent Citations (8)
| Title |
|---|
| A. KRIZHEVSKY; 1. SUTSKEVER; G.E. HINTON: "Imagenet classification with deep convolutional neural networks", NIPS, 2012, pages 1097 - 1105, XP055309176 |
| ANONYMOUS: "CVPR 2015 Open Access Repository", 24 May 2015 (2015-05-24), XP055308191, Retrieved from the Internet <URL:https://web.archive.org/web/20150515065546/http://www.cv-foundation.org/openaccess/CVPR2015.py> [retrieved on 20161006] * |
| L. ITTI: "A model of saliency-based visual attention for rapid scene analysis", PAMI, vol. 20, no. 11, 1998, pages 1254 - 1259, XP001203933, DOI: doi:10.1109/34.730558 |
| L. ITTI; C. KOCH; E. NIEBUR.: "A model of saliency-based visual attention for rapid scene analysis", PAMI, vol. 20, no. 11, 1998, pages 1254 - 1259, XP001203933, DOI: doi:10.1109/34.730558 |
| LIJUN WANG ET AL: "Deep networks for saliency detection via local estimation and global search", 2015 IEEE CONFERENCE ON COMPUTER VISION AND PATTERN RECOGNITION (CVPR), 24 May 2015 (2015-05-24), pages 3183 - 3192, XP055308201, ISBN: 978-1-4673-6964-0, Retrieved from the Internet <URL:https://web.archive.org/web/20150906072214/http://www.cv-foundation.org/openaccess/content_cvpr_2015/papers/Wang_Deep_Networks_for_2015_CVPR_paper.pdf> [retrieved on 20161006], DOI: 10.1109/CVPR.2015.7298938 * |
| M. M. CHENG: "Global contrast based salient region detection", CVPR, 2011, pages 409 - 416, XP032037846, DOI: doi:10.1109/CVPR.2011.5995344 |
| M. M. CHENG; G. X. ZHANG; N. J. MITRA; X. HUANG; S. M. HU: "Global contrast based salient region detection", CVPR, 2011, pages 409 - 416, XP032037846, DOI: doi:10.1109/CVPR.2011.5995344 |
| P. KRAHENBUHL; V. KOLTUN: "Geodesic object proposals", ECCV, 2014, pages 725 - 739, XP055176349, DOI: doi:10.1007/978-3-319-10602-1_47 |
Cited By (5)
| Publication number | Priority date | Publication date | Assignee | Title |
|---|---|---|---|---|
| CN110765882A (en) * | 2019-09-25 | 2020-02-07 | 腾讯科技(深圳)有限公司 | A video tag determination method, device, server and storage medium |
| CN110765882B (en) * | 2019-09-25 | 2023-04-07 | 腾讯科技(深圳)有限公司 | Video tag determination method, device, server and storage medium |
| CN111047579A (en) * | 2019-12-13 | 2020-04-21 | 中南大学 | Characteristic quality evaluation method and image characteristic uniform extraction method |
| CN111047579B (en) * | 2019-12-13 | 2023-09-05 | 中南大学 | Feature quality assessment method and image feature uniform extraction method |
| CN111429463A (en) * | 2020-03-04 | 2020-07-17 | 北京三快在线科技有限公司 | Instance splitting method, instance splitting device, electronic equipment and storage medium |
Also Published As
| Publication number | Publication date |
|---|---|
| KR20160143494A (en) | 2016-12-14 |
| CN106296638A (en) | 2017-01-04 |
| US20160358035A1 (en) | 2016-12-08 |
| US9824294B2 (en) | 2017-11-21 |
| JP2017004480A (en) | 2017-01-05 |
Similar Documents
| Publication | Publication Date | Title |
|---|---|---|
| US9824294B2 (en) | Saliency information acquisition device and saliency information acquisition method | |
| Li et al. | Robust saliency detection via regularized random walks ranking | |
| Li et al. | Saliency detection via dense and sparse reconstruction | |
| Wang et al. | Deep networks for saliency detection via local estimation and global search | |
| Jia et al. | Visual tracking via adaptive structural local sparse appearance model | |
| EP2879080B1 (en) | Image processing device and method, and computer readable medium | |
| JP6351240B2 (en) | Image processing apparatus, image processing method, and program | |
| US12159405B2 (en) | Method for detecting medical images, electronic device, and storage medium | |
| CN106023257B (en) | A kind of method for tracking target based on rotor wing unmanned aerial vehicle platform | |
| CN106156777B (en) | Text picture detection method and device | |
| Ishikura et al. | Saliency detection based on multiscale extrema of local perceptual color differences | |
| CN108629286B (en) | Remote sensing airport target detection method based on subjective perception significance model | |
| JP6527421B2 (en) | Person recognition apparatus and program thereof | |
| CN106203430A (en) | A kind of significance object detecting method based on foreground focused degree and background priori | |
| JP4098021B2 (en) | Scene identification method, apparatus, and program | |
| JP2015082245A (en) | Image processing apparatus, image processing method, and program | |
| CN111160169A (en) | Face detection method, device, equipment and computer readable storage medium | |
| US8094971B2 (en) | Method and system for automatically determining the orientation of a digital image | |
| WO2019102608A1 (en) | Image processing device, image processing method, and image processing program | |
| CN109426793A (en) | A kind of image behavior recognition methods, equipment and computer readable storage medium | |
| WO2020022329A1 (en) | Object detection/recognition device, method, and program | |
| CN110910497B (en) | Method and system for realizing augmented reality map | |
| CN110458004A (en) | A target object recognition method, device, equipment and storage medium | |
| CN104680189B (en) | Based on the bad image detecting method for improving bag of words | |
| Azaza et al. | Context proposals for saliency detection |
Legal Events
| Date | Code | Title | Description |
|---|---|---|---|
| PUAI | Public reference made under article 153(3) epc to a published international application that has entered the european phase |
Free format text: ORIGINAL CODE: 0009012 |
|
| STAA | Information on the status of an ep patent application or granted ep patent |
Free format text: STATUS: THE APPLICATION HAS BEEN PUBLISHED |
|
| AK | Designated contracting states |
Kind code of ref document: A1 Designated state(s): AL AT BE BG CH CY CZ DE DK EE ES FI FR GB GR HR HU IE IS IT LI LT LU LV MC MK MT NL NO PL PT RO RS SE SI SK SM TR |
|
| AX | Request for extension of the european patent |
Extension state: BA ME |
|
| STAA | Information on the status of an ep patent application or granted ep patent |
Free format text: STATUS: REQUEST FOR EXAMINATION WAS MADE |
|
| 17P | Request for examination filed |
Effective date: 20170607 |
|
| RBV | Designated contracting states (corrected) |
Designated state(s): AL AT BE BG CH CY CZ DE DK EE ES FI FR GB GR HR HU IE IS IT LI LT LU LV MC MK MT NL NO PL PT RO RS SE SI SK SM TR |
|
| STAA | Information on the status of an ep patent application or granted ep patent |
Free format text: STATUS: THE APPLICATION HAS BEEN WITHDRAWN |
|
| 18W | Application withdrawn |
Effective date: 20191218 |