EP3086355A1 - Verfahren zur weitgehenden stabilitätsmassenanalyse unter verwendung eines quadrupolmassenfilters - Google Patents
Verfahren zur weitgehenden stabilitätsmassenanalyse unter verwendung eines quadrupolmassenfilters Download PDFInfo
- Publication number
- EP3086355A1 EP3086355A1 EP16164649.2A EP16164649A EP3086355A1 EP 3086355 A1 EP3086355 A1 EP 3086355A1 EP 16164649 A EP16164649 A EP 16164649A EP 3086355 A1 EP3086355 A1 EP 3086355A1
- Authority
- EP
- European Patent Office
- Prior art keywords
- ions
- quadrupole
- varying
- mass
- ion
- Prior art date
- Legal status (The legal status is an assumption and is not a legal conclusion. Google has not performed a legal analysis and makes no representation as to the accuracy of the status listed.)
- Withdrawn
Links
- 238000000034 method Methods 0.000 title claims abstract description 44
- 238000004458 analytical method Methods 0.000 title abstract description 8
- 150000002500 ions Chemical class 0.000 claims abstract description 217
- 238000009826 distribution Methods 0.000 claims abstract description 16
- 238000001819 mass spectrum Methods 0.000 claims abstract description 11
- 230000003534 oscillatory effect Effects 0.000 claims abstract description 10
- 230000005405 multipole Effects 0.000 claims description 8
- 230000001133 acceleration Effects 0.000 claims description 6
- 238000004949 mass spectrometry Methods 0.000 claims description 3
- 241000894007 species Species 0.000 description 16
- 230000008859 change Effects 0.000 description 14
- 230000006870 function Effects 0.000 description 11
- 230000008569 process Effects 0.000 description 11
- 238000005070 sampling Methods 0.000 description 11
- 230000010355 oscillation Effects 0.000 description 8
- 230000005540 biological transmission Effects 0.000 description 6
- 230000033001 locomotion Effects 0.000 description 6
- 239000013598 vector Substances 0.000 description 6
- 238000003384 imaging method Methods 0.000 description 5
- 239000000203 mixture Substances 0.000 description 5
- 230000004044 response Effects 0.000 description 5
- 230000007423 decrease Effects 0.000 description 4
- 238000001514 detection method Methods 0.000 description 4
- 238000010586 diagram Methods 0.000 description 4
- 230000035945 sensitivity Effects 0.000 description 4
- 238000011282 treatment Methods 0.000 description 4
- 230000004304 visual acuity Effects 0.000 description 4
- 238000000354 decomposition reaction Methods 0.000 description 3
- 230000000670 limiting effect Effects 0.000 description 3
- 238000012986 modification Methods 0.000 description 3
- 230000004048 modification Effects 0.000 description 3
- 230000003595 spectral effect Effects 0.000 description 3
- 230000002123 temporal effect Effects 0.000 description 3
- 238000013459 approach Methods 0.000 description 2
- 238000007405 data analysis Methods 0.000 description 2
- 230000004069 differentiation Effects 0.000 description 2
- 230000000694 effects Effects 0.000 description 2
- 239000000463 material Substances 0.000 description 2
- 230000037361 pathway Effects 0.000 description 2
- 238000001454 recorded image Methods 0.000 description 2
- 238000004088 simulation Methods 0.000 description 2
- 238000001228 spectrum Methods 0.000 description 2
- 239000000126 substance Substances 0.000 description 2
- 241000238634 Libellulidae Species 0.000 description 1
- 230000003466 anti-cipated effect Effects 0.000 description 1
- 230000009286 beneficial effect Effects 0.000 description 1
- 230000008901 benefit Effects 0.000 description 1
- 230000015556 catabolic process Effects 0.000 description 1
- 239000002131 composite material Substances 0.000 description 1
- 238000007906 compression Methods 0.000 description 1
- 230000006835 compression Effects 0.000 description 1
- 238000007796 conventional method Methods 0.000 description 1
- 238000013480 data collection Methods 0.000 description 1
- 230000003247 decreasing effect Effects 0.000 description 1
- 238000006731 degradation reaction Methods 0.000 description 1
- 238000006073 displacement reaction Methods 0.000 description 1
- 230000004907 flux Effects 0.000 description 1
- 238000009472 formulation Methods 0.000 description 1
- 238000013467 fragmentation Methods 0.000 description 1
- 238000006062 fragmentation reaction Methods 0.000 description 1
- 230000003993 interaction Effects 0.000 description 1
- 230000002452 interceptive effect Effects 0.000 description 1
- 230000037427 ion transport Effects 0.000 description 1
- 238000010884 ion-beam technique Methods 0.000 description 1
- 239000007788 liquid Substances 0.000 description 1
- 230000003287 optical effect Effects 0.000 description 1
- 238000005457 optimization Methods 0.000 description 1
- 238000012545 processing Methods 0.000 description 1
- 230000002829 reductive effect Effects 0.000 description 1
- 230000002441 reversible effect Effects 0.000 description 1
- 238000000926 separation method Methods 0.000 description 1
- 238000012360 testing method Methods 0.000 description 1
- 230000009466 transformation Effects 0.000 description 1
Images
Classifications
-
- G—PHYSICS
- G01—MEASURING; TESTING
- G01N—INVESTIGATING OR ANALYSING MATERIALS BY DETERMINING THEIR CHEMICAL OR PHYSICAL PROPERTIES
- G01N27/00—Investigating or analysing materials by the use of electric, electrochemical, or magnetic means
- G01N27/62—Investigating or analysing materials by the use of electric, electrochemical, or magnetic means by investigating the ionisation of gases, e.g. aerosols; by investigating electric discharges, e.g. emission of cathode
-
- H—ELECTRICITY
- H01—ELECTRIC ELEMENTS
- H01J—ELECTRIC DISCHARGE TUBES OR DISCHARGE LAMPS
- H01J49/00—Particle spectrometers or separator tubes
- H01J49/0027—Methods for using particle spectrometers
- H01J49/0031—Step by step routines describing the use of the apparatus
-
- H—ELECTRICITY
- H01—ELECTRIC ELEMENTS
- H01J—ELECTRIC DISCHARGE TUBES OR DISCHARGE LAMPS
- H01J49/00—Particle spectrometers or separator tubes
- H01J49/02—Details
- H01J49/025—Detectors specially adapted to particle spectrometers
-
- H—ELECTRICITY
- H01—ELECTRIC ELEMENTS
- H01J—ELECTRIC DISCHARGE TUBES OR DISCHARGE LAMPS
- H01J49/00—Particle spectrometers or separator tubes
- H01J49/0027—Methods for using particle spectrometers
- H01J49/0036—Step by step routines describing the handling of the data generated during a measurement
-
- H—ELECTRICITY
- H01—ELECTRIC ELEMENTS
- H01J—ELECTRIC DISCHARGE TUBES OR DISCHARGE LAMPS
- H01J49/00—Particle spectrometers or separator tubes
- H01J49/26—Mass spectrometers or separator tubes
- H01J49/34—Dynamic spectrometers
- H01J49/42—Stability-of-path spectrometers, e.g. monopole, quadrupole, multipole, farvitrons
- H01J49/4205—Device types
- H01J49/421—Mass filters, i.e. deviating unwanted ions without trapping
- H01J49/4215—Quadrupole mass filters
-
- H—ELECTRICITY
- H01—ELECTRIC ELEMENTS
- H01J—ELECTRIC DISCHARGE TUBES OR DISCHARGE LAMPS
- H01J49/00—Particle spectrometers or separator tubes
- H01J49/26—Mass spectrometers or separator tubes
- H01J49/34—Dynamic spectrometers
- H01J49/42—Stability-of-path spectrometers, e.g. monopole, quadrupole, multipole, farvitrons
- H01J49/426—Methods for controlling ions
- H01J49/427—Ejection and selection methods
- H01J49/429—Scanning an electric parameter, e.g. voltage amplitude or frequency
-
- H—ELECTRICITY
- H01—ELECTRIC ELEMENTS
- H01J—ELECTRIC DISCHARGE TUBES OR DISCHARGE LAMPS
- H01J2237/00—Discharge tubes exposing object to beam, e.g. for analysis treatment, etching, imaging
- H01J2237/244—Detection characterized by the detecting means
- H01J2237/24435—Microchannel plates
-
- H—ELECTRICITY
- H01—ELECTRIC ELEMENTS
- H01J—ELECTRIC DISCHARGE TUBES OR DISCHARGE LAMPS
- H01J49/00—Particle spectrometers or separator tubes
- H01J49/26—Mass spectrometers or separator tubes
- H01J49/34—Dynamic spectrometers
- H01J49/42—Stability-of-path spectrometers, e.g. monopole, quadrupole, multipole, farvitrons
Definitions
- the present invention relates to the field of mass spectrometry. More particularly, the present invention relates to a mass spectrometer system that employs a quadrupole mass filter mass analyzer and wherein a spatial distribution of ions exiting the quadrupole mass filter is recorded.
- a multipole mass filter (e.g., a quadrupole mass filter, alternately referred to herein as a "QMF”) may be used for mass analysis of ions provided within a continuous ion beam.
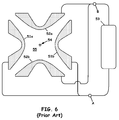
- FIG. 6 is a cross sectional view through the four parallel rods of a quadrupole mass filter.
- a quadrupole field is produced within the quadrupole apparatus by dynamically applying electrical potentials on configured parallel rods arranged with four-fold symmetry about a long axis, depicted as piercing point 54, which comprises an axis of symmetry that is conventionally referred to as the z-axis.
- the four rods are described as a pair of “x rods” 51a, 51b and a pair of “y rods” 52a, 52b.
- the two x rods have the same potential as each other, as do the two y rods.
- the potential on the y rods is inverted with respect to the x rods.
- the "x-direction” or " x -dimension” is taken along a line connecting the centers of the x-rods.
- the " y -direction” or " y -dimension” is taken along a line connecting the centers of the y-rods.
- the x rods 51a, 51b are diametrically opposed to one another with respect to an ion transmission volume 55.
- each pair of rods consisting of one of the x rods and one of the y rods is referred to herein as a pair of adjacent rods.
- each x rod is adjacent to both of the y rods and vice versa.
- the potential on each set of rods can be expressed as a constant non-oscillatory (DC) offset (between point A and point B of FIG. 6 ) plus an oscillatory RF component that oscillates rapidly (with a typical frequency of about 1 MHz).
- the DC offset on the x-rods is positive so that a positive ion feels a restoring force that tends to keep it near the z-axis; the potential in the x-direction is like a well.
- the DC offset on the y-rods is negative so that a positive ion feels an outward-directed force that drives it further away from the z-axis; consequently, the potential in the (x, y) plane that is normal to the z-axis is in the form of a saddle.
- an oscillatory RF component is applied to both pairs of rods.
- the RF phase on the x-rods 51a, 51b is the same and differs by 180 degrees from the phase on the y-rods 52a, 52b.
- Ions move inertially along the z-axis 54 from an entrance or inlet end of the quadrupole to a detector often placed at an opposite outlet of the quadrupole.
- ions have trajectories that are separable in the x and y directions.
- the applied RF field carries ions with the smallest mass-to-charge ( m / z ) ratios out of the potential well and into the rods. Ions with sufficiently high mass-to-charge ratios remain trapped in the well and have stable trajectories in the x- direction.
- the applied field in the x -direction thus acts as a high-pass mass filter.
- the applied RF field in the y -direction only the lightest ions are stabilized by the applied RF field, which overcomes the tendency of the applied DC to pull them into the rods.
- the applied field in the y -direction acts as a low-pass mass filter. Ions that have both stable component trajectories in both x- and y -directions pass through the quadrupole so as to reach an ion detector.
- the DC offset and RF amplitude applied to a quadrupole mass filter is chosen so as to transmit only ions within a restricted range of mass-to-charge ( m / z ) ratios through the entire length of the quadrupole.
- Such apparatuses can be operated either in the radio frequency (RF)-only mode or in an RF/DC mode. Depending upon the particular applied RF and DC potentials, only ions of selected m / z ratios are allowed to pass completely through the rod structures, whereas the remaining ions follow unstable trajectories leading to escape from the applied multipole field.
- RF voltage When only an RF voltage is applied between predetermined electrodes, the apparatus serves to transmit ions in a wide-open fashion above some threshold mass.
- a combination of RF and DC voltages When a combination of RF and DC voltages is applied between predetermined rod pairs there is both an upper cutoff mass as well as a lower cutoff mass, such that only a restricted range of m / z ratios (i.e., a pass band) passes completely through the apparatus.
- the transmission band of ion masses narrows so as to provide for mass filter operation, as known and as understood by those skilled in the art.
- the amplitudes of the DC and RF voltages may be simultaneously varied, but with the DC/RF ratio held nearly constant so as to maintain a uniform pass band, such that the pass band is caused to systematically "scan" a range of m / z ratios. Detection of the quantity of ions passed through the quadrupole mass filter over the course of such scanning enables generation of a mass spectrum.
- Bounded solutions correspond to trajectories that never leave a cylinder of finite radius, where the radius depends on the ion's initial conditions.
- bounded solutions are equated with trajectories that carry the ion through the quadrupole to the detector.
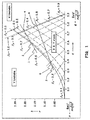
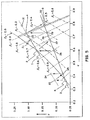
- the plane of ( q, a ) values can be partitioned into contiguous regions corresponding to bounded solutions and unbounded solutions, as shown in FIG. 1 . Such a depiction of the bounded and unbounded regions in the q - a plane is called a stability diagram.
- a stability region is formed by the intersection of two regions, corresponding to regions where the x- and y- components of the trajectory are stable respectively. There are multiple stability regions, but conventional instruments involve the principal stability region. By convention, only the positive quadrant of the q - a plane is considered. In this quadrant, the stability region resembles a triangle, as illustrated in FIG. 1 .
- Dashed and dashed-dotted lines in FIG. 1 represent lines of iso- ⁇ x and iso- ⁇ y , respectively, where the Mathieu parameters ⁇ x and ⁇ y are related to ion oscillation frequencies, ⁇ x and ⁇ y , in the x- and y -directions, respectively.
- the instrument may be "scanned" by increasing both U and V amplitude monotonically to bring different portions of the full range of m / z values into the stability region at successive time intervals, in a progression from low m / z to hich m / z .
- U and V are each ramped linearly in time.
- all ions progress along the same fixed "scan line" through the stability diagram, with ions moving along the line at a rate inversely proportional to m / z .
- Two such scan lines are illustrated in FIG. 1 .
- a first illustrated scan line 1 passes through the stability region boundary points 2 and 3.
- a second illustrated scan line 3 passes through the boundary points 6 and 8.
- the voltages U and V are ramped proportionally in accordance with a scan line that passes very close to the apex, thus permitting only a very narrow pass band that moves through the m / z range nearly linearly in time.
- the flux of ions hitting the detector as a function of time is very nearly proportional to the mass distribution of ions in a beam and the detected signal is a "mass spectrum".
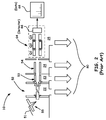
- FIG. 2 schematically illustrates a triple-quadrupole system, as generally designated by the reference numeral 10.
- the operation of mass spectrometer 10 can be controlled and data 68 can be acquired by a control and data system (not depicted) of various circuitry of one or more known types, which may be implemented as any one or a combination of general or special-purpose processors (digital signal processor (DSP)), firmware, software to provide instrument control and data analysis for mass spectrometers and/or related instruments.
- DSP digital signal processor
- a sample containing one or more analytes of interest can be ionized via an ion source 52 operating at or near atmospheric pressure.
- FIG. 2 illustrates an ion source in which ionization is effected through the use of an electrospray nozzle 55 that receives a liquid sample from a chromatograph capillary 51.
- the resultant ions are directed via predetermined ion optics that often can include tube lenses, skimmers, and multipoles, e.g., reference characters 53 and 54, so as to be urged through a series of chambers, e.g., chambers 22, 23 and 24, of progressively reduced pressure that operationally guide and focus such ions to provide good transmission efficiencies.
- the various chambers communicate with corresponding evacuation ports 80 (represented as arrows in FIG. 2 ) that are coupled to a set of vacuum pumps (not shown) to maintain the pressures at the desired values.
- the example mass spectrometer system 10 of FIG. 2 is shown illustrated to include a triple stage configuration 64 within a high vacuum chamber 25, the triple stage configuration having sections labeled Q1, Q2 and Q3 electrically coupled to respective power supplies (not shown).
- the Q1, Q2 and Q3 stages may be operated, respectively, as a first quadrupole mass filter, a fragmentation cell, and a second quadrupole mass filter. Ions that are either filtered, filtered and fragmented or fragmented and filtered within one or more of the stages are passed to a detector 66.
- a detector is beneficially placed at the channel outlet of the quadrupole (e.g., Q3 of FIG. 2 ) to provide data that can be processed into a rich mass spectrum (data) 68 showing the variation of ion abundance with respect to m / z ratio.
- a detector e.g., the detector 66 of FIG. 2
- the detector is used to measure the quantity of ions that pass completely through the mass filter as a function of time while the RF and DC voltage amplitudes are scanned as described above.
- the detector only receives those ions having m / z ratios within the mass filter pass band at that time - that is, only those ions having stable trajectories within the multipole under the particular RF and DC voltages that are applied at that time.
- instrument resolution or instrument speed
- High mass resolving can be achieved, but only if the DC/RF ratio is such that the filter pass band is very narrow, such that most ions develop unstable trajectories within the mass filter and few pass through to the detector. Under such conditions, scans must be performed relatively slowly so as to detect an adequate number of ions at each m / z data point. Conversely, high sensitivity or high speed can also be achieved during conventional operation, but only by widening the pass band, thus causing degradation of m / z resolution.
- the same patent also teaches methods for the prediction of an arbitrary ion image as a function of m / z and the applied field.
- the image pattern for each individual m / z species within an unknown sample can be extracted from a sequence of observed ion images by a mathematical deconvolution or decomposition processes, as further discussed in the patent.
- the mass-to-charge ratio and abundance of each species necessarily follow directly from the deconvolution or decomposition.
- U.S. Patent No. 8,389,929 recognized that ions of differing m / z ratios exiting a quadrupole mass filter may be discriminated, even when the ions of the differing m / z ratios are simultaneously stable (that is, have stable trajectories) within the mass filter, by recording where the ions strike a position-sensitive detector as a function of the applied RF and DC fields.
- the inventors of U.S. Patent No. 8,389,929 recognized that such operation is advantageous because when a quadrupole is operated in, for example, a mass filter mode, the scanning of the device (that is provided by ramped RF and DC voltages) naturally varies the spatial characteristics with time as observed at the exit aperture of the instrument.
- ions manipulated by a quadrupole are induced to perform a complex 2-dimensional oscillatory motion on the detector cross section as the scan passes through the stability region of the ions.
- the ion motion i.e., for a cloud of ions of the same m / z but with various initial displacements and velocities
- the ion motion may be characterized by the variation of a and q, this variation influencing the position and shape cloud of ions exiting the quadrupole.
- the sequence of their respective oscillatory motions is essentially the same and can be approximately related by a time shift.
- the aforementioned patent also provides for the prediction of an arbitrary ion image as a function of m / z and the applied field.
- each individual component can be extracted from a sequence of observed ion images by mathematical deconvolution or decomposition processes which generate the mass-to-charge ratio and abundance of each species. Accordingly, high mass resolving power may be achieved under a wide variety of operating conditions, a property not usually associated with quadrupole mass spectrometers.
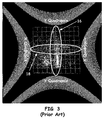
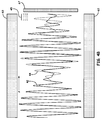
- FIG. 3 shows a simulated recorded image of a particular pattern at a particular instant in time.
- the example image can be collected by a fast detector, (i.e., a detector capable of time resolution of 10 or more RF cycles, more often down to an RF cycle or with sub RF cycles specificity, where said sub-RF specificity is possibly averaged for multiple RF cycles), positioned to acquire where and when ions exit and with substantial mass resolving power to distinguish fine detail.
- the aforementioned patent described the use of three independent dimensions of acquired data to decompose a composite mass spectrum into its individual components and, by so doing, produce a high quality mass spectrum of ions exiting a mass filter at each time point in a mass scan.
- the three dimensions described in the patent are the two spatial ( x and y ) dimensions at the exit plane of a quadrupole and a third dimension comprising sub-RF phase within an RF cycle, which is referred to as sub-RF sampling.
- Each three-dimensional data structure was called a "voxel set" and each data point in time along a mass axis that is sampled has a corresponding voxel set data structure associated with it.
- voxel set refers to a multidimensional data set and is a generalization of the common term "voxel” (i.e., a volumetric pixel) to any number of dimensions of data.
- voxel i.e., a volumetric pixel
- the inventors of the present invention have recognized and here teach that there is a simple way to collect more information per ion using the same detection systems that are described in the above-referenced patents and patent applications.
- the present application thus teaches the acquisition of additional orthogonal data to the time series of data described in the above-referenced patents and patent applications.
- the acquisition of data according to the additional orthogonal dimensions augments the information relating to each ion species and enables further differentiation of different ion species from one other, thereby yielding higher resolution and more accurate results than previous methods which employ an imaging detector with a quadrupole mass filter.
- a method of analyzing a sample by mass spectrometry comprising the steps of: (a) generating a stream of ions from the sample; (b) delivering the ions to an inlet end of a quadrupole apparatus, the quadrupole defining a central longitudinal axis and first and second transverse axes; (c) applying an oscillatory radio frequency (RF) voltage, V , to rods of the quadrupole such that the instantaneous electrical potential of each rod is 180-degrees out of phase with each adjacent rod and a non-oscillatory voltage, U , across each pair of adjacent rods such that a subset of the ions having a range of mass-to-charge ( m / z ) ratio values are selectively transmitted through the quadrupole to an outlet end of the quadrupole; (d) varying at least one of the applied voltage U and the applied voltage V such that the range of selectively transmitted m /
- RF radio frequency
- the varying of at least one additional operational parameter may comprise varying an acceleration voltage applied such that the ions' kinetic energy and a number of RF cycles for which the ions remain within the quadrupole is caused to vary.
- the varying of at least one additional operational parameter may comprise varying a ratio ( U / V ) between the applied U and the applied V .
- the varying of at least one additional operational parameter may comprise varying both a ratio ( U / V ) between the applied U and the applied V and an acceleration voltage such that the ions' kinetic energy and a number of RF cycles for which the ions remain within the quadrupole is caused to vary.
- the U / V ratio may be varied by alternately setting the ratio ( UlV ) to a first value and a second value.
- the QMF will transmit ions of a relatively wide range of masses (or mass-to-charge ratios) corresponding to the portion of scan line 3 between the scan line "entry" point 6 and its "exit” point 8 .
- the transmitted ions will generally comprise a subset of all possible masses (or mass-to-charge ratios).
- some heavier ions whose trajectories were previously unstable will enter the stability region (at point 6 ) and will begin to be transmitted through the quadrupole.
- FIG. 3 graphically illustrates such results.
- the vertical cloud of ions as enclosed graphically by the ellipse 16 shown in FIG. 3 , corresponds to the heavier ions entering the stability diagram, as described above, and accordingly oscillates with an amplitude that brings such heavy ions close to the denoted y -quadrupoles.
- the cluster of ions enclosed graphically by the ellipse 18 shown in FIG. 3 correspond to lighter ions exiting the stability region and thus cause such ions to oscillate with an amplitude that brings such lighter ions close to the denoted x-quadrupoles.
- Within the image lie the additional clusters of ions (shown in FIG. 3 but not specifically highlighted) that have been collected at the same time frame but which have a different exit pattern because of the differences of their a and q parameters.
- the data deconvolution treatment therefore employs a model that takes into consideration the variation of the ionic m / z distribution at the outlet end in terms of the two independent spatial variables, X and Y .
- the prior data deconvolution treatment also employs a third independent variable, termed "sub-RF" variation, which requires acquisition of a series of voxel plane snapshots at various phase points within a single RF cycle.
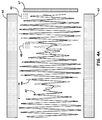
- the difference in mass between the two ions was set such that the difference between the q -values, ⁇ q , is 0.001.
- the horizontal arrow in FIG. 4A indicates both the direction of the device z-axis (i.e., the axial dimension) and the direction of overall ion transport through the QMF, from an inlet end to an outlet end of the QMF.
- Prior data acquisition schemes as discussed in U.S. Patent No. 8,389,929 , only consider the ion distribution at the outlet end of the quadrupole mass filter, at or near which imaging detector component 67 is located. Since a plurality of images are obtained at different RF phase values, the prior data acquisition scheme only covers a small portion of the path near the outlet end, such as region 43.
- the present inventors have recognized that it would be desirable to not only effectively sample the ion distributions near the end of the traces 42 and 44, ( FIG. 4A ) as has been previously described, but to additionally effectively sample the positional variation among different-mass ions within the internal volume of the QMF, such as at the region labeled 45, so as to more-sufficiently sample the rich variety of full variability of ion trajectories and positions.
- the inventors have further recognized that, in order to experimentally capture the full positional variation that is exhibited by the simulations, one only needs to vary the ions axial velocity (along the z-axis) so as to change the number of RF cycles that are spent by ions inside the quadrupole.
- this axial velocity variation may be accomplished by varying an axial acceleration voltage that guides ions into or through the quadrupole mass filter.
- Such axial acceleration voltages are often provided by ion lenses (not illustrated) positioned proximal to the inlet and outlet ends of the quadrupole mass filter and provided with respective DC electrical potentials.
- the sampling of a series of such regions may be performed while the applied DC and RF voltages ( U and V , respectively) are essentially constant and correspond to a single point on a scan line for any particular mass-to-charge ratio, such as, for example, any of the points 2, 21, 22 or 4 (or any intervening points) on scan line 1 or any of the points 6, 25, 26, 27, 28, 29 or 8 (or any intervening points) on scan line 3 ( FIG. 5 ).
- each data packet (a vector) corresponding to a sampled ion abundance, or voxel set, corresponds to a four-dimensional space of independent variables, these four variables being: (1) x -position; (2) y -position; (3) number of RF cycles applied during transit through the QMF; and (4) sub-RF phase.
- a second way to generate an additional dimension of data is to vary the U and V values applied to a quadrupole mass filter (and the ratio between the two applied values) such that effectively multiple scan lines are sampled as an analysis is proceeding.
- a first mass scan in accordance with scan line 1 may be performed, after which a second mass scan in accordance with scan line 3 may be performed.
- a series of images corresponding to sub-RF increments is acquired.
- the entire sequence of sampling events (corresponding to all of the sub-RF image acquisitions sampled at all of the mass scan points of the two mass scans) should be performed sufficiently rapidly that the chemical composition of material being analyzed (such as an eluate from a chromatograph) does not significantly change during the entire sequence of sampling events.
- the DC and RF voltages could be applied such that portions of the different scan lines are sampled in an interleaved fashion or such that sampled points alternate between the two scan lines.
- each data packet (a vector) corresponding to a sampled ion abundance, or voxel, corresponds to a five-dimensional space of independent variables, these five variables being: (1) x -position; (2) y -position; (3) applied RF voltage, V ; (4) voltage ratio ( U / V ) and (5) sub-RF phase.
- the lightest mass (or lowest mass-to-charge ratio) m s that might be detected is such that its q and a values correspond to point 8 on scan line 3 at the opposite edge of the stability region.
- a series of images of ion spatial distributions may be then obtained while the DC and RF voltages are at U 1 and V 1 , respectively.
- the images will include the images of exit positions of ions having mass-to-charge ratios, m, such that m h ⁇ m ⁇ m s or, possibly, such that m h ⁇ m ⁇ m s .
- the DC voltage is then changed, while maintaining the RF voltage at V 1 , to a value, U 2 , in accordance with scan line 1.
- the a values associated with each ion increase while the q values do not change.
- the a value associated with the ion having mass-to-charge ratio m h changes such that this ion plots at point 23, outside the stability region.
- the a value associated with the ion having mass-to-charge ratio m s changes such that this ion plots at point 31, also outside the stability region.
- ions previously associated with points 25, 26, 27, 28 and 29 change such that the ions are now associated with points 24, 2, 21, 22, and 4, respectively, along scan line 1.
- ions having mass-to-charge values such that the ions plot at one of the points 2, 21, 22, or 4 have stable or marginally stable trajectories.
- Any ions (e.g., lighter ions) whose mass-to-charge values are such that they plot to the right of point 29 under the prior application of voltages U 1 and V 1 are no longer stable under of the application of the voltages U 2 and V 1 .
- the RF voltage is then changed (incremented or ramped) to a new value.
- the ion having mass-to-charge ratio m h once again possesses a stable trajectory and plots at point 25 within the stability region.
- ions that are heavier than this ion enter the stability region for the first time. Ions whose mass-to-charge values are such that they previously plotted at point 2 on scan line 1 plot at point 27 on scan line 3.
- a series of images (i.e., a third series of images) of ion spatial distributions (e.g., at respective sub-RF phase values) may be then obtained while the DC and RF voltages are at U 3 and V 2 , respectively.
- the images will include the images of exit positions of ions having mass-to-charge ratios between those of the ions associated with point 6 and the ions associated with point 8.
- the sequence of steps comprising acquiring data with U and V set in accordance with a first scan line, changing only one of the voltages such that the new U / V ratio is in accordance with a second scan line, acquiring a second set of data at the new voltage settings and then changing both voltage settings such that the U / V ratio is once again in accordance with a first scan line may be repeated any number of times.
- some ions that previously had stable trajectories will no longer have stable trajectories, some ions whose trajectories were previously unstable will have stable trajectories and, possibly, some ions whose trajectories were stable may remain stable.
- the oscillation frequencies of any ion species that remain stable during the process of changing applied DC and RF voltages from those in accordance with the first to the second scan line (or vice versa) will significantly change from one data acquisition step to the subsequent data acquisition step. These frequency changes occur because the process of alternating between scan lines changes both the ⁇ x and ⁇ y values associated with the new applied voltage conditions. For example, an ion whose mass causes it to plot at point 26 under the described applied voltage conditions that correspond to scan line 3 will plot at point 2 under application of the described voltage conditions in accordance with scan line 1. The same ion will plot at point 27 upon returning the applied voltage conditions to those in accordance with scan line 3 in the fashion described.
- the first change causes ⁇ y to decrease from 0.27 to near zero and ⁇ x to increase from 0.59 to 0.66.
- the second change causes ⁇ y to increase back to 0.35 and ⁇ x to further increase from 0.66 to 0.69.
- each change from a first scan line to a different scan line causes those ions that remain stable both before and after the change to be mixed with an assemblage of ions that is different from the assemblage of ions with which they were mixed before the change.
- each change from scan line 3 to scan line 1 causes ions to be lost from the assemblage in both low and high mass-to-charge regions but each change from scan line 1 to scan line 3 causes low mass-to-charge ions to be lost from the assemblage while new high mass-to-charge ions are added to the assemblage.
- Mathieu stability diagram it is possible to accurately predict the range of masses to be expected at any point on either scan line as well the expected x and y oscillation frequencies. This information can be used to predict model curves which may be used in the deconvolution procedures (described elsewhere in this document) that are applied to the acquired data so as to determine abundances of ions at each mass-to-charge ratio.
- the two above-described novel data acquisition methods i.e., the method of varying the number of RF cycles during ion transit and the method of varying the scan line in a, q space by varying applied DC and RF voltages according to a prescribed pattern
- a single mass analysis could employ both varying total RF cycles (equivalent to varying ion velocity along the z-axis as described above) and varying scan lines.
- a first mass scan in accordance with scan line 1 may be performed, after which a second mass scan in accordance with scan line 3 may be performed.
- the ion z-axis velocity is caused to vary such that the total number of RF cycles experienced by ions during transit through the device assumes a certain number of values. Still further, for each assumed value of total number of RF cycles at each (U, V) pair, a series of images corresponding to respective sub-RF phase increments is acquired.
- each data packet (vector) corresponding to a sampled ion abundance, or voxel corresponds to a six-dimensional space of independent variables, these six variables being: (1) x -position; (2) y -position; (3) applied RF voltage, V ; (4) voltage ratio ( U / V ); (5) number of RF cycles applied during transit through the QMF; and (6) sub-RF phase.
- the deconvolution process is a numerical transformation of the image data acquired from a specific mass spectrometric analyzer (e.g., a quadrupole) and a detector.
- the deconvolution process is employed to essentially extract signal intensity corresponding to each ion in the proximity of interfering signals from other ions.
- the instrument response to a mono-isotopic species can be described as a stacked series of two dimensional images, and that these images appear in sets that may be grouped into a multi-dimensional data packet described herein as a voxel set.
- instrument response is not completely uniform across the entire mass range of the system, it is constant within any locality. Therefore, there are one or more model instrument response vectors that can describe the system's response across the entire mass range.
- Acquired data comprises convolved instrument responses.
- the mathematical process of the present invention thus deconvolves the acquired data (i.e., images) to produce an accurate list of observed mass positions and intensities.
- a set of reference signals comprises a set of reference basis functions for purposes of deconvolution. Each reference basis function corresponds to the data expected to be acquired for an ion having a given value for a parameter (such as m / z ).
- the deconvolution process is beneficially applied to data acquired from a mass analyzer that often comprises a quadrupole device, which as known to those of ordinary skill in the art, has a low ion density. Because of the low ion density, the resultant ion-ion interactions are negligibly small in the device, effectively enabling each ion trajectory to be essentially independent. Moreover, because the ion current in an operating quadrupole is linear, the signal that results from a mixture of ions passing through the quadrupole is essentially equal to (N) overlapping sum of the signals produced by each ion passing through the quadrupole as received onto, for example, a detector array, as described above.
- the result of the deconvolution process is the expression of an observed signal as a linear combination of a mixture of reference signals.
- the observed "signal" is the time series of acquired images of ions exiting the quadrupole.
- the reference signals are the contributions to the observed signal from ions with different m / z values.
- the coefficients in the linear combination correspond to a mass spectrum.
- the reference signal is a series of images that are generated either experimentally or synthetically, where each image represents the spatial distribution of exiting ions of a single species produced by a particular state of the fields applied to the quadrupole. Thereafter, spatial and temporal raw data of an abundance of one or more ion species from an exit channel of said quadrupole is acquired.
- the deconvolution solves for the abundances of one or more ion species and generally includes: the number of distinct ion species and, for each species, accurate estimates of its relative abundance and mass-to-charge ratio.
Landscapes
- Chemical & Material Sciences (AREA)
- Analytical Chemistry (AREA)
- Chemical Kinetics & Catalysis (AREA)
- Electrochemistry (AREA)
- Physics & Mathematics (AREA)
- Health & Medical Sciences (AREA)
- Life Sciences & Earth Sciences (AREA)
- Biochemistry (AREA)
- General Health & Medical Sciences (AREA)
- General Physics & Mathematics (AREA)
- Immunology (AREA)
- Pathology (AREA)
- Electron Tubes For Measurement (AREA)
- Other Investigation Or Analysis Of Materials By Electrical Means (AREA)
Applications Claiming Priority (1)
| Application Number | Priority Date | Filing Date | Title |
|---|---|---|---|
| US14/696,237 US9536719B2 (en) | 2014-04-28 | 2015-04-24 | Methods for broad-stability mass analysis using a quadrupole mass filter |
Publications (1)
| Publication Number | Publication Date |
|---|---|
| EP3086355A1 true EP3086355A1 (de) | 2016-10-26 |
Family
ID=55701887
Family Applications (1)
| Application Number | Title | Priority Date | Filing Date |
|---|---|---|---|
| EP16164649.2A Withdrawn EP3086355A1 (de) | 2015-04-24 | 2016-04-11 | Verfahren zur weitgehenden stabilitätsmassenanalyse unter verwendung eines quadrupolmassenfilters |
Country Status (3)
| Country | Link |
|---|---|
| US (1) | US9536719B2 (de) |
| EP (1) | EP3086355A1 (de) |
| CN (1) | CN106066359B (de) |
Cited By (2)
| Publication number | Priority date | Publication date | Assignee | Title |
|---|---|---|---|---|
| WO2020234621A1 (en) * | 2019-05-23 | 2020-11-26 | Universite De Strasbourg ( Etablissement Public National A Caractere Scientifique, Culturel Et Professionnel) | Method and system for filtering ions defined by a targeted charge to mass ratio |
| WO2024126994A1 (en) * | 2022-12-13 | 2024-06-20 | Micromass Uk Limited | Quadrupole mass filters and mass analysers |
Families Citing this family (4)
| Publication number | Priority date | Publication date | Assignee | Title |
|---|---|---|---|---|
| EP3939067B1 (de) * | 2019-03-11 | 2026-01-28 | Micromass UK Limited | Quadrupolvorrichtungen |
| GB2583092B (en) * | 2019-04-15 | 2021-09-22 | Thermo Fisher Scient Bremen Gmbh | Mass spectrometer having improved quadrupole robustness |
| GB201912494D0 (en) | 2019-08-30 | 2019-10-16 | Micromass Ltd | Mass spectometer calibration |
| CN115274401B (zh) * | 2022-08-03 | 2025-01-28 | 广州分子信息科技有限公司 | 一种提高多极杆分辨率的多级串联扫描方法 |
Citations (2)
| Publication number | Priority date | Publication date | Assignee | Title |
|---|---|---|---|---|
| US5726448A (en) * | 1996-08-09 | 1998-03-10 | California Institute Of Technology | Rotating field mass and velocity analyzer |
| WO2011109311A1 (en) * | 2010-03-02 | 2011-09-09 | Thermo Finnigan Llc | A quadrupole mass spectrometer with enhanced sensitivity and mass resolving power |
Family Cites Families (6)
| Publication number | Priority date | Publication date | Assignee | Title |
|---|---|---|---|---|
| GB0031342D0 (en) * | 2000-12-21 | 2001-02-07 | Shimadzu Res Lab Europe Ltd | Method and apparatus for ejecting ions from a quadrupole ion trap |
| GB0506288D0 (en) * | 2005-03-29 | 2005-05-04 | Thermo Finnigan Llc | Improvements relating to mass spectrometry |
| CN100454020C (zh) * | 2005-10-19 | 2009-01-21 | 广州禾信自动化系统有限公司 | 基于射频四极杆的气相分子离子反应器装置及其实现方法与应用 |
| US8921779B2 (en) * | 2012-11-30 | 2014-12-30 | Thermo Finnigan Llc | Exponential scan mode for quadrupole mass spectrometers to generate super-resolved mass spectra |
| JP6022383B2 (ja) * | 2013-03-11 | 2016-11-09 | 株式会社日立ハイテクノロジーズ | 質量分析システム、及び方法 |
| US20150311050A1 (en) | 2014-04-28 | 2015-10-29 | Thermo Finnigan Llc | Method for Determining a Spectrum from Time-Varying Data |
-
2015
- 2015-04-24 US US14/696,237 patent/US9536719B2/en active Active
-
2016
- 2016-04-08 CN CN201610216799.7A patent/CN106066359B/zh active Active
- 2016-04-11 EP EP16164649.2A patent/EP3086355A1/de not_active Withdrawn
Patent Citations (2)
| Publication number | Priority date | Publication date | Assignee | Title |
|---|---|---|---|---|
| US5726448A (en) * | 1996-08-09 | 1998-03-10 | California Institute Of Technology | Rotating field mass and velocity analyzer |
| WO2011109311A1 (en) * | 2010-03-02 | 2011-09-09 | Thermo Finnigan Llc | A quadrupole mass spectrometer with enhanced sensitivity and mass resolving power |
Cited By (3)
| Publication number | Priority date | Publication date | Assignee | Title |
|---|---|---|---|---|
| WO2020234621A1 (en) * | 2019-05-23 | 2020-11-26 | Universite De Strasbourg ( Etablissement Public National A Caractere Scientifique, Culturel Et Professionnel) | Method and system for filtering ions defined by a targeted charge to mass ratio |
| WO2024126994A1 (en) * | 2022-12-13 | 2024-06-20 | Micromass Uk Limited | Quadrupole mass filters and mass analysers |
| GB2626657A (en) * | 2022-12-13 | 2024-07-31 | Micromass Ltd | Quadrupole mass filters and mass analysers |
Also Published As
| Publication number | Publication date |
|---|---|
| CN106066359B (zh) | 2020-10-02 |
| US20160314950A1 (en) | 2016-10-27 |
| CN106066359A (zh) | 2016-11-02 |
| US9536719B2 (en) | 2017-01-03 |
Similar Documents
| Publication | Publication Date | Title |
|---|---|---|
| US9490115B2 (en) | Varying frequency during a quadrupole scan for improved resolution and mass range | |
| EP2543059B1 (de) | Quadrupolmassenspektrometer mit erhöhter empfindlichkeit und masseauflösungskraft | |
| EP3086355A1 (de) | Verfahren zur weitgehenden stabilitätsmassenanalyse unter verwendung eines quadrupolmassenfilters | |
| US9337009B2 (en) | Exponential scan mode for quadrupole mass spectrometers to generate super-resolved mass spectra | |
| CA2655358C (en) | High throughput quadrupolar ion trap | |
| US20200357626A1 (en) | Electrostatic linear ion trap design for charge detection mass spectrometry | |
| EP4391015A2 (de) | Ionenfallenanordnung für hochdurchsatz-ladungserkennungsmassenspektrometrie | |
| CA2654857C (en) | High throughput quadrupolar ion trap | |
| AU2020407182A1 (en) | Mass spectrometer with charge measurement arrangement | |
| CN111341641B (zh) | 多维倍增电极检测器 | |
| DE102024115265A1 (de) | Massenspektrometer und Verfahren | |
| US10784093B1 (en) | Chunking algorithm for processing long scan data from a sequence of mass spectrometry ion images | |
| CN120048721B (zh) | 新型等离子体检测分析装置 |
Legal Events
| Date | Code | Title | Description |
|---|---|---|---|
| PUAI | Public reference made under article 153(3) epc to a published international application that has entered the european phase |
Free format text: ORIGINAL CODE: 0009012 |
|
| AK | Designated contracting states |
Kind code of ref document: A1 Designated state(s): AL AT BE BG CH CY CZ DE DK EE ES FI FR GB GR HR HU IE IS IT LI LT LU LV MC MK MT NL NO PL PT RO RS SE SI SK SM TR |
|
| AX | Request for extension of the european patent |
Extension state: BA ME |
|
| STAA | Information on the status of an ep patent application or granted ep patent |
Free format text: STATUS: THE APPLICATION IS DEEMED TO BE WITHDRAWN |
|
| 18D | Application deemed to be withdrawn |
Effective date: 20170427 |