EP3086137A1 - Underwater detection apparatus - Google Patents
Underwater detection apparatus Download PDFInfo
- Publication number
- EP3086137A1 EP3086137A1 EP16160723.9A EP16160723A EP3086137A1 EP 3086137 A1 EP3086137 A1 EP 3086137A1 EP 16160723 A EP16160723 A EP 16160723A EP 3086137 A1 EP3086137 A1 EP 3086137A1
- Authority
- EP
- European Patent Office
- Prior art keywords
- index value
- fish
- underwater
- target object
- density
- Prior art date
- Legal status (The legal status is an assumption and is not a legal conclusion. Google has not performed a legal analysis and makes no representation as to the accuracy of the status listed.)
- Granted
Links
Images







Classifications
-
- G—PHYSICS
- G01—MEASURING; TESTING
- G01S—RADIO DIRECTION-FINDING; RADIO NAVIGATION; DETERMINING DISTANCE OR VELOCITY BY USE OF RADIO WAVES; LOCATING OR PRESENCE-DETECTING BY USE OF THE REFLECTION OR RERADIATION OF RADIO WAVES; ANALOGOUS ARRANGEMENTS USING OTHER WAVES
- G01S7/00—Details of systems according to groups G01S13/00, G01S15/00, G01S17/00
- G01S7/52—Details of systems according to groups G01S13/00, G01S15/00, G01S17/00 of systems according to group G01S15/00
- G01S7/539—Details of systems according to groups G01S13/00, G01S15/00, G01S17/00 of systems according to group G01S15/00 using analysis of echo signal for target characterisation; Target signature; Target cross-section
-
- G—PHYSICS
- G01—MEASURING; TESTING
- G01S—RADIO DIRECTION-FINDING; RADIO NAVIGATION; DETERMINING DISTANCE OR VELOCITY BY USE OF RADIO WAVES; LOCATING OR PRESENCE-DETECTING BY USE OF THE REFLECTION OR RERADIATION OF RADIO WAVES; ANALOGOUS ARRANGEMENTS USING OTHER WAVES
- G01S15/00—Systems using the reflection or reradiation of acoustic waves, e.g. sonar systems
- G01S15/88—Sonar systems specially adapted for specific applications
- G01S15/96—Sonar systems specially adapted for specific applications for locating fish
Definitions
- This disclosure generally relates to an underwater detection apparatus that detects an underwater target object, and especially an underwater detection apparatus that can estimate a size of the detected target object.
- a peak waveform (which may also be referred to as a peak) of a receive signal obtained from a reflection wave reflected on a fish satisfies given conditions
- the peak waveform is considered as being caused by a single fish and a single fish is detected.
- a single fish is detected based on various information obtained from a peak waveform such as peak intensity of the peak waveform, shape of the peak waveform, phase stability information etc.
- the peak intensity of the peak waveform of the detected single fish is transformed into a TS (Target Strength) value and a fish length is estimated based on said TS value.
- size of target objects can be more accurately estimated.
- Certain embodiments of this disclosure relates to more accurately estimating size of target objects.
- Fig. 1 shows a block diagram of an arrangement of a fish finder 1 as an underwater detection apparatus according to an embodiment of the present disclosure.
- fish finder 1 according to the embodiment of the present disclosure is described with reference to the drawings.
- Fish finder 1 shown in Fig. 1 is arranged to estimate fish length (size) and number of fish within a detection range in water.
- Fish finder 1 is for example installed on a ship such as a fishing vessel.
- fish finder 1 uses fish as an example of a target of interest but any underwater object or body including other aquatic species may also be used as a target of interest.
- fish finder 1 comprises a transducer 2, a transceiver 3, a signal processing module 10, and an operation/display unit 4.
- the transducer 2 can transform electrical signal into an ultrasonic wave (which may also be referred to as a transmission wave) and can transmit the ultrasonic wave into the water. In some cases, the transducer 2 may operate repeatedly or intermittently at given timings (for example, at a given cycle). As a receiver, transducer 2 may also transform received ultrasonic wave into an electrical signal (which may also be referred to as a receive signal). An ultrasonic wave of a given frequency is repeatedly transmitted at given timings and for a given duration from transducer 2 of the present embodiment.
- an ultrasonic wave of a given frequency is repeatedly transmitted at given timings and for a given duration from transducer 2 of the present embodiment.
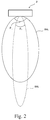
- Fig. 2 shows schematically a wide beam BM L and a narrow beam BM H formed by the transducer 2.
- the beam width of the wide beam BM L is typically wider than that of the narrow beam BM H .
- the beam width corresponds to an angle between positions with an intensity that is 3dB lower relative to the direction of maximum intensity of an ultrasonic wave.
- the beam width of wide beam BM L is represented as ⁇ L
- the beam width of narrow beam BM H is represented as ⁇ H .
- the transducer 2 can form two beams with each of the beams having different frequencies (e.g., low frequency and high frequency). Namely, transducer 2 forms in alternation the wide beam BM L when low frequency ultrasonic wave is transmitted (or received) and the narrow beam BM H when high frequency ultrasonic wave is transmitted (or received).
- frequencies e.g., low frequency and high frequency.
- the transceiver 3 is comprised of a transmission and reception switch 5, a transmission circuit 6, and a reception circuit 7.
- the transmission and reception switch 5 can connect the transmission circuit 6 and transducer 2 to supply a transmission signal from the transmission circuit 6 to transducer 2.
- the transmission and reception switch 5 can connect transducer 2 and reception circuit 7 so that reception wave transformed into electrical signal by transducer 2 is supplied to the reception circuit 7.
- the transmission circuit 6 can generate a transmission signal based on the conditions set via the operation/display unit 4 and can supply the transmission signal to transducer 2 via the transmission and reception switch 5.
- the transmission circuit 6 of the present embodiment supplies a signal to transducer 2 as the source of said ultrasonic wave.
- the reception circuit 7 can amplify the electrical signal supplied from transducer 2 and perform an analog to digital conversion of the amplified receive signal. The reception circuit 7 then supplies the converted digital receive signal to the signal processing module 10.
- the signal processing module 10 can process the receive signal outputted by the reception circuit 7 and generate a video signal of the target.
- the signal processing module 10 can also generate a histogram that shows a number of fish of a given fish length in a given range of water with reference to own ship on which fish finder 1 is installed. Without any limitation to a histogram, the signal processing module 10 can also more generally generate a frequency distribution of fish size. The arrangement of the signal processing module 10 will be explained in detail later.
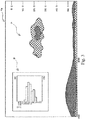
- Fig. 3 shows schematically an example of a display screen 4a of the operation/display unit 4 of the fish finder 1 shown in Fig. 1 .
- the operation/display unit 4 can display on the display screen 4a an image P that corresponds to the video signal outputted by the signal processing module 10.
- image P By looking at image P on display screen 4a, a user can estimate a situation of the sea below the ship (e.g., presence or absence of fish, position of fish relative to own ship etc.).
- the operation/display unit 4 may also comprise a variety of input means such as input buttons so that various settings or parameters related to transmission and reception of ultrasonic wave, signal processing or image display can be inputted.
- the vertical axis of the display screen 4a shown in Fig. 3 corresponds to depth.
- numerical values on the horizontal axis of display screen 4a shown in Fig. 3 represent ping numbers, one ping corresponding to one ultrasonic wave transmission.
- histogram D generated by the signal processing module 10 is also displayed on the display screen 4a of the operation/display unit 4.
- the number of fish detected as single fish is represented in percentage for every fish length on histogram D.
- the total number of fish detected is also displayed on the right-upper part of histogram D. Note that, in the explanation above, the number of fish detected as single fish is represented in percentage for every fish length but this should not be a limitation, the number of fish detected as single fish can be represented in number of occurrences for every fish length.
- Fig. 4 shows a block diagram of an arrangement of one example of the signal processing module 10 of fish finder 1 shown in Fig. 1 .
- the signal processing module 10 may comprise a fish detection module 11 (which may also be referred to as a target detecting module or a target detector), a density index value estimation module 12 (which may also be referred to as a density index value estimator), a fish length calculation module 13 (which may also be referred to as a size index value calculation module or a size index value calculator), and a histogram generation module 14 (which may also be referred to as a frequency distribution calculation module or a frequency distribution calculator).
- a fish detection module 11 which may also be referred to as a target detecting module or a target detector
- a density index value estimation module 12 which may also be referred to as a density index value estimator
- a fish length calculation module 13 which may also be referred to as a size index value calculation module or a size index value calculator
- a histogram generation module 14 which may also be
- the signal processing module 10 is, for example, implemented on a hardware processor (e.g., CPU, FPGA) and a non-volatile memory (not shown in the figures). For example, by having the hardware processor read a program from the non-volatile memory and execute the program, it is possible to implement the functions of the fish detection module 11, the density index value estimation module 12, the fish length calculation module 13, and the histogram generation module 14.
- a hardware processor e.g., CPU, FPGA
- non-volatile memory not shown in the figures.
- the fish detection module 11 may be arranged to detect, as a target object, fish based on the receive signal outputted by reception circuit 7.
- the fish detection module 11 may detect fish by determining based at least in part on a receive signal when plotted in a coordinate system in which a horizontal axis is time and a vertical axis is amplitude, whether a peak waveform (which may also be referred to as a peak) within the receive signal is caused by a fish or not, and may set the peak value (which may also be referred to as the target object signal intensity) of the peak waveform as the target strength value (TS value) of the fish.
- the intensity of a signal can be defined for example as the amplitude or the square of the amplitude of the signal.
- the fish detection module 11 may comprehensively evaluate for example a peak value of the peak waveform, a gradient of the rising edge of the peak waveform, a gradient of the falling edge of the peak waveform in order to determine whether the peak waveform is caused by a fish or not. In this way, by comprehensively evaluating a plurality of parameters, false detection of fish can be avoided. Note that the operation of the fish detection module 11 explained above is merely an example and other method can be used to detect fish.
- the density index value estimation module 12 may calculate a density index value (namely, a value indicative of density) of fish in a given area (which may also be referred to as a gate range or a time period) as a number of peaks thought to be caused by fish, and may categorize fish density into a plurality of categories depending on the count number.
- the density index value estimation module 12 may include a number of peak counting module 12a and a comparison module 12b.
- Fig. 5 shows an example of receive signal graph, a low frequency receive signal R L and a high frequency receive signal R H being shown in parallel.
- the number of peak counting module 12a can count the number of peak waveforms within a gate range G containing timing t at which peak waveform Pa is determined as being a fish.
- the gate range G represents a time period whose duration can be set for example depending on the duration of the transmission wave. Typically, the duration of the gate range G is set to 20 times the duration of the transmission wave but it can be adjusted typically up to about 50 times the duration of the transmission wave.
- the number of peak counting module 12a can count the number of peak waveforms N L contained in receive signal R L obtained during the wide beam transmission/reception and the number of peak waveforms N H contained in receive signal R H obtained during the narrow beam transmission/reception. In the example of Fig.
- the number of peak waveforms N L and N H each corresponds to the density index value.
- the peak waveforms counted by the number of peak counting module 12a not only include peak waveforms determined as being caused by fish by the fish detection module 11 (which detects peak waveforms under strict conditions based on gradient of rising edge etc), but it may include all peak waveforms having a maximum value above a given level.
- Fig. 6 shows a flow chart of operation of the comparison module 12b.
- the comparison module 12b may calculate for each fish detected by the fish detection module 11 a density category within the given area (e.g., the gate range G) centered on said detected fish based on a comparison of each of the peak numbers N L and N H with a first threshold Thr1 and a second threshold Thr2. Specifically, the comparison module 12b compares peak number N L with first threshold Thr1 (S1), and when N L is the same as or below Thr1 (S1: YES) the density category is set as LOW (S2).
- the comparison module 12b compares peak number N H with second threshold Thr2 (S3).
- N H is the same as or below Thr2 (S3: YES)
- the density category is set as MEDIUM (S4) and when N H is above Thr2 (S3: NO) the density category is set as HIGH (S5).
- the density category is LOW, the density in the vicinity of the fish whose density is to be estimated is estimated as relatively low compared to the MEDIUM and HIGH categories.
- the comparison module 12b can calculate density category for every fish detected by the fish detection module 11.
- the density category (LOW, MEDIUM, HIGH) calculated by the comparison module 12b for every detected fish is notified to the fish length calculation module 13.
- the fish length calculation module 13 can calculate fish length of each fish based on the target strength value (TS value) of fish detected by the fish detection module 11 and the density category (e.g., LOW, MEDIUM, HIGH) estimated by the density index value estimation module 12. More specifically, in some cases, for fish with a LOW density category, the fish length calculation module 13 calculates fish length based on the TS value (which may also be referred to as size index value) of the detected fish.
- TS value target strength value
- the density category e.g., LOW, MEDIUM, HIGH
- the fish length calculation module 13 calculates fish length based on the TS value (which may also be referred to as size index value) of the detected fish.
- the fish length calculation module 13 calculates fish length similarly as in LOW density but based on an adjusted TS value (namely, a TS value after adjustment, which may also be referred to as size index value) of the detected fish, the TS value being adjusted with an adjustment formula explained hereinafter.
- the fish length calculation module 13 is set as a size index value calculation module that calculates TS value or adjusted TS value.
- the fish length calculation module 13 may calculate the adjusted TS value by adjusting the TS value with the following formula (1).
- TS AC TS BC ⁇ 10 log 10 N H / N L ⁇ 20 log 10 ⁇ L / ⁇ H + ⁇
- the fish length calculation module 13 may calculate the adjusted TS value by adjusting the TS value with the following formula (2).
- TS AC TS BC ⁇ 10 log 10 N H / N L ⁇ 20 log 10 ⁇ L / ⁇ H + ⁇
- TS AC is the adjusted TS value
- TS BC is the TS value before adjustment
- ⁇ and ⁇ are tuning values with ⁇ typically bigger than ⁇ . ⁇ and ⁇ are determined for example depending on an operation environment of the apparatus such as the season, the fishing area, fish species etc.
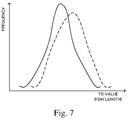
- Fig. 7 shows an example of a histogram (solid line) generated by the histogram generation module 14 and a histogram (dotted line) generated by a conventional fish finder.
- the histogram generation module 14 can generate a fish length histogram based on the fish length of each fish calculated by the fish length calculation module 13.
- the histogram generated by the histogram generation module 14 may be displayed on the operation/display unit 4.
- histograms displaying fish length frequency distribution when fish that form a school of fish are densely grouped together, peak waveforms obtained from each fish may mutually interfere with each other and the TS value (representative of fish length) may be estimated to be a value higher than it actually is.
- the histogram gets shifted on the right (which is the side where fish length is higher) of its actual position. Namely, a conventional fish finder generates a histogram indicating fish school properties that are actually different.
- the fish finder 1 of the present disclosure when fish school density is relatively high (specifically, when the density category is MEDIUM or HIGH), the TS value obtained from the peak value of the receive signal is adjusted to become smaller (i.e., the TS value is reduced) and the histogram is calculated based on fish length of each fish calculated based on the adjusted TS value.
- the TS value obtained from the peak value of the receive signal is adjusted to become smaller (i.e., the TS value is reduced) and the histogram is calculated based on fish length of each fish calculated based on the adjusted TS value.
- fish finder 1 of the present disclosure as fish length of each fish can be appropriately calculated regardless of fish school density, an appropriate fish school histogram can be generated.
- TS value of fish is not only calculated based on peak value of peak waveform caused by fish, but it is also calculated based on the density index value (for example, number of peak waveforms N L and N H ) of fish within a given area. Accordingly, by calculating (adjusting) TS value of fish taking into consideration the density index value that is closely linked to TS value of fish, a more accurate fish length can be calculated and in addition an appropriate fish school histogram can be generated.
- fish finder 1 can more accurately estimate size (e.g., length) of target objects (e.g., fish).
- density index value (e.g., number of peak waveforms N L and N H ) is estimated at each detected fish. Accordingly, based on the density index value estimated at each fish, a more accurate fish length can be estimated for each fish.
- each fish whose fish length is to be calculated is categorized into a plurality of density categories (LOW, MEDIUM, HIGH), and fish length calculation is changed depending on the category. Accordingly, by categorizing density into a plurality of categories, a fish length corresponding to each density category can be appropriately determined.
- the TS value is adjusted.
- fish TS value obtained from relatively dense fish school tends to be different from what it actually is, by performing such adjustment of fish TS value, fish length can be appropriately calculated.
- the TS value is adjusted so that it becomes smaller after adjustment.
- fish TS value obtained from relatively dense fish school tends to be higher than what it actually is, by performing such adjustment of fish TS value, fish length can be appropriately calculated.
- the density index value is calculated based on the number of peaks contained in the receive signal from the fish school. Accordingly, an index indicative of fish school density necessary to obtain a more accurate fish length can be relatively easily and appropriately calculated.
- the fish school histogram classified into fish length is generated based on TS value or adjusted TS value as a size index value calculated for each fish. Accordingly, a histogram close to the actual fish length frequency distribution of the school can be generated.
- the gate range G where density index value is calculated is set to a range that contains the fish where density is to be estimated. Accordingly, the density index value in the vicinity of the fish where density is to be estimated can be appropriately calculated.
- fish finder 1 can appropriately calculate fish length information which is essential information for people of the fishing industry such as fishermen.
- TS value is adjusted based on formulas (1) and (2), but this should not be a limitation.
- the TS value can be for example adjusted using a difference level between an average value of the high frequency receive signal within the gate range R and an average value of the low frequency receive signal within the gate range R.
- density index value can be calculated using a difference between the peak value of the detected fish and an average intensity value of the receive signal within the gate range G and TS value can be adjusted using peak number of fish within the gate range G.
Landscapes
- Engineering & Computer Science (AREA)
- Radar, Positioning & Navigation (AREA)
- Remote Sensing (AREA)
- Physics & Mathematics (AREA)
- Computer Networks & Wireless Communication (AREA)
- General Physics & Mathematics (AREA)
- Acoustics & Sound (AREA)
- Measurement Of Velocity Or Position Using Acoustic Or Ultrasonic Waves (AREA)
Abstract
Description
- This disclosure generally relates to an underwater detection apparatus that detects an underwater target object, and especially an underwater detection apparatus that can estimate a size of the detected target object.
- As a conventional fish finder (underwater detection apparatus), an apparatus having a function to estimate a length (size) of a fish (target) is known (see for example "Barange, M., Hampton, I., and Soule, M. 1996. Empirical determination of in situ target strengths of three loosely aggregated pelagic fish species. - ICES Journal of Marine Science, 53: 225-232", "Sawada, K., Furusawa, M., Williamson, N. 1993. Conditions for the precise measurement of fish target strength in situ. - Ocean Acoustic Journal, 1993, ", "Gauthier, S., Rose, G. 2001. Diagnostic tools for unbiased in situ target strength estimation. - Canadian Journal of Fisheries and Aquatic Sciences, 2001, 58, p2149-2155"). Typically, with a fish finder, when a peak waveform (which may also be referred to as a peak) of a receive signal obtained from a reflection wave reflected on a fish satisfies given conditions, the peak waveform is considered as being caused by a single fish and a single fish is detected. Specifically, with a fish finder, a single fish is detected based on various information obtained from a peak waveform such as peak intensity of the peak waveform, shape of the peak waveform, phase stability information etc. Then, with a fish finder, the peak intensity of the peak waveform of the detected single fish is transformed into a TS (Target Strength) value and a fish length is estimated based on said TS value.
-
- (1) In one aspect of the present disclosure, an underwater detection apparatus is provided. The underwater detection apparatus includes a transmitter, a receiver, a target detector, a density index value estimator and a size index value calculator. The transmitter transmits a transmission wave. The receiver obtains a receive signal based on a reflection of the transmission wave. The target detector detects an underwater target object based at least in part on the receive signal. The density index value estimator estimates a density index value of objects within a given area in a vicinity of the underwater target object. The size index value calculator calculates a size index value of the underwater target object based at least in part on the density index value and a target object signal intensity representing a maximum intensity of the receive signal corresponding to the underwater target object.
- (2) The density index value estimator may categorize the density index value into a category of a plurality of categories. The size index value calculator may calculate the size index value based on the target object signal intensity and the category.
- (3) When the category that represents a range of density index values is above a given value, the size index value calculator may adjust the size index value of the underwater target object.
- (4) When the category that represents a range of density index values is above a given value, the size index value calculator may reduce the size index value of the underwater target object.
- (5) The given area may represent an area that includes the underwater target object detected by the target detector.
- (6) The given area may represent a time period that lasts for up to about 50 times a duration of the transmission wave.
- (7) The density index value estimator may estimate the density index value based at least in part on a number of peaks included in the receive signal within the given area.
- (8) The density index value estimator may estimate the density index value based at least in part on an average intensity value of the receive signal within the given area.
- (9) The density index value estimator may estimate for each detected underwater target object the density index value of the objects in the vicinity of each underwater target object detected by the target detector. The size index value calculator may calculate the size index value of each said underwater target object based on the target object signal intensity corresponding to each said underwater target object and the density index value estimated at each said underwater target object.
- (10) The underwater detection apparatus may further include a frequency distribution calculator. The frequency distribution calculator may calculate a size frequency distribution of at least two underwater target objects from a plurality of underwater target objects based on the size index value of the at least two underwater target objects calculated by the size index value calculator.
- (11) The frequency distribution calculator may calculate the size frequency distribution based on the size index value of the underwater target objects whose density index value is below a given value.
- (12) The underwater detection apparatus may be a fish finder and the underwater target object may be a fish.
- According to this disclosure, size of target objects can be more accurately estimated.
- The present disclosure is illustrated by way of example and not by way of limitation in the figures of the accompanying drawings, in which the like reference numerals indicate like elements and in which:
-
Fig. 1 shows a block diagram of an arrangement of a fish finder according to an embodiment of the present disclosure; -
Fig. 2 shows schematically a wide beam and a narrow beam formed by the transducer shown inFig. 1 ; -
Fig. 3 shows schematically an example of a display screen of an operation/display unit of the fish finder shown inFig. 1 ; -
Fig. 4 shows a block diagram of an arrangement of a signal processing module of the fish finder shown inFig. 1 ; -
Fig. 5 shows an example of receive signal graph, a low frequency receive signal and a high frequency receive signal being shown in parallel; -
Fig. 6 shows a flow chart of operation of the comparison module shown inFig. 4 ; -
Fig. 7 shows an example of a histogram generated by the histogram generation module shown inFig. 4 and a histogram generated by a conventional fish finder; -
Fig. 8 shows a block diagram of an arrangement of a signal processing module of a fish finder according to a modification; -
Fig. 9 shows an example of a receive signal graph obtained from a reception wave received by a transducer of the fish finder of the modification; -
Fig. 10 shows a flow chart of operation of the comparison module shown inFig. 8 ; -
Fig. 11 shows a block diagram of an arrangement of a signal processing module of a fish finder according to a modification; -
Fig. 12 shows a view to explain a gate range set by a fish finder according to a modification, in comparison withFig. 5 ; and -
Fig. 13 shows a block diagram of an arrangement of a signal processing module of a fish finder according to a modification. - With a school of fish, when the fish density gets high or when fish depth gets deep, peak waveforms of the receive signals interfere with each other and TS values of peak waveforms determined as being caused by single fish tend to be high, which gives a fish length estimation longer than it actually is. However, none of the publications cited above solve this problem.
- Certain embodiments of this disclosure relates to more accurately estimating size of target objects.
-
Fig. 1 shows a block diagram of an arrangement of afish finder 1 as an underwater detection apparatus according to an embodiment of the present disclosure. Hereinafter,fish finder 1 according to the embodiment of the present disclosure is described with reference to the drawings.Fish finder 1 shown inFig. 1 is arranged to estimate fish length (size) and number of fish within a detection range in water.Fish finder 1 is for example installed on a ship such as a fishing vessel. Note that, hereinafter,fish finder 1 uses fish as an example of a target of interest but any underwater object or body including other aquatic species may also be used as a target of interest. - As shown in
Fig. 1 ,fish finder 1 comprises atransducer 2, atransceiver 3, asignal processing module 10, and an operation/display unit 4. - As a transmitter, the
transducer 2 can transform electrical signal into an ultrasonic wave (which may also be referred to as a transmission wave) and can transmit the ultrasonic wave into the water. In some cases, thetransducer 2 may operate repeatedly or intermittently at given timings (for example, at a given cycle). As a receiver,transducer 2 may also transform received ultrasonic wave into an electrical signal (which may also be referred to as a receive signal). An ultrasonic wave of a given frequency is repeatedly transmitted at given timings and for a given duration fromtransducer 2 of the present embodiment. -
Fig. 2 shows schematically a wide beam BML and a narrow beam BMH formed by thetransducer 2. The beam width of the wide beam BML is typically wider than that of the narrow beam BMH. Note that, the beam width corresponds to an angle between positions with an intensity that is 3dB lower relative to the direction of maximum intensity of an ultrasonic wave. With reference toFig. 2 , the beam width of wide beam BML is represented as θ L and the beam width of narrow beam BMH is represented as θ H. - In some instances, the
transducer 2 can form two beams with each of the beams having different frequencies (e.g., low frequency and high frequency). Namely,transducer 2 forms in alternation the wide beam BML when low frequency ultrasonic wave is transmitted (or received) and the narrow beam BMH when high frequency ultrasonic wave is transmitted (or received). - The
transceiver 3 is comprised of a transmission andreception switch 5, atransmission circuit 6, and areception circuit 7. During transmission, the transmission andreception switch 5 can connect thetransmission circuit 6 andtransducer 2 to supply a transmission signal from thetransmission circuit 6 totransducer 2. During reception, the transmission andreception switch 5 can connecttransducer 2 andreception circuit 7 so that reception wave transformed into electrical signal bytransducer 2 is supplied to thereception circuit 7. - The
transmission circuit 6 can generate a transmission signal based on the conditions set via the operation/display unit 4 and can supply the transmission signal totransducer 2 via the transmission andreception switch 5. In order to have an ultrasonic wave of a given frequency transmitted fromtransducer 2 as explained above, thetransmission circuit 6 of the present embodiment supplies a signal totransducer 2 as the source of said ultrasonic wave. - The
reception circuit 7 can amplify the electrical signal supplied fromtransducer 2 and perform an analog to digital conversion of the amplified receive signal. Thereception circuit 7 then supplies the converted digital receive signal to thesignal processing module 10. - The
signal processing module 10 can process the receive signal outputted by thereception circuit 7 and generate a video signal of the target. Thesignal processing module 10 can also generate a histogram that shows a number of fish of a given fish length in a given range of water with reference to own ship on whichfish finder 1 is installed. Without any limitation to a histogram, thesignal processing module 10 can also more generally generate a frequency distribution of fish size. The arrangement of thesignal processing module 10 will be explained in detail later. -
Fig. 3 shows schematically an example of adisplay screen 4a of the operation/display unit 4 of thefish finder 1 shown inFig. 1 . As shown inFig. 3 , the operation/display unit 4 can display on thedisplay screen 4a an image P that corresponds to the video signal outputted by thesignal processing module 10. By looking at image P ondisplay screen 4a, a user can estimate a situation of the sea below the ship (e.g., presence or absence of fish, position of fish relative to own ship etc.). The operation/display unit 4 may also comprise a variety of input means such as input buttons so that various settings or parameters related to transmission and reception of ultrasonic wave, signal processing or image display can be inputted. Note that the vertical axis of thedisplay screen 4a shown inFig. 3 corresponds to depth. Moreover, numerical values on the horizontal axis ofdisplay screen 4a shown inFig. 3 represent ping numbers, one ping corresponding to one ultrasonic wave transmission. - As shown in
Fig. 3 , histogram D generated by thesignal processing module 10 is also displayed on thedisplay screen 4a of the operation/display unit 4. The number of fish detected as single fish is represented in percentage for every fish length on histogram D. Moreover, on the example shown inFig. 3 , the total number of fish detected is also displayed on the right-upper part of histogram D. Note that, in the explanation above, the number of fish detected as single fish is represented in percentage for every fish length but this should not be a limitation, the number of fish detected as single fish can be represented in number of occurrences for every fish length. -
Fig. 4 shows a block diagram of an arrangement of one example of thesignal processing module 10 offish finder 1 shown inFig. 1 . As shown inFig. 4 , thesignal processing module 10 may comprise a fish detection module 11 (which may also be referred to as a target detecting module or a target detector), a density index value estimation module 12 (which may also be referred to as a density index value estimator), a fish length calculation module 13 (which may also be referred to as a size index value calculation module or a size index value calculator), and a histogram generation module 14 (which may also be referred to as a frequency distribution calculation module or a frequency distribution calculator). Thesignal processing module 10 is, for example, implemented on a hardware processor (e.g., CPU, FPGA) and a non-volatile memory (not shown in the figures). For example, by having the hardware processor read a program from the non-volatile memory and execute the program, it is possible to implement the functions of thefish detection module 11, the density indexvalue estimation module 12, the fishlength calculation module 13, and thehistogram generation module 14. - The
fish detection module 11 may be arranged to detect, as a target object, fish based on the receive signal outputted byreception circuit 7. In more detail, thefish detection module 11 may detect fish by determining based at least in part on a receive signal when plotted in a coordinate system in which a horizontal axis is time and a vertical axis is amplitude, whether a peak waveform (which may also be referred to as a peak) within the receive signal is caused by a fish or not, and may set the peak value (which may also be referred to as the target object signal intensity) of the peak waveform as the target strength value (TS value) of the fish. Note that the intensity of a signal can be defined for example as the amplitude or the square of the amplitude of the signal. As an example, as disclosed inUS2008/0080317A1 , thefish detection module 11 may comprehensively evaluate for example a peak value of the peak waveform, a gradient of the rising edge of the peak waveform, a gradient of the falling edge of the peak waveform in order to determine whether the peak waveform is caused by a fish or not. In this way, by comprehensively evaluating a plurality of parameters, false detection of fish can be avoided. Note that the operation of thefish detection module 11 explained above is merely an example and other method can be used to detect fish. - From the fish detected by the
fish detection module 11, the density indexvalue estimation module 12 may calculate a density index value (namely, a value indicative of density) of fish in a given area (which may also be referred to as a gate range or a time period) as a number of peaks thought to be caused by fish, and may categorize fish density into a plurality of categories depending on the count number. The density indexvalue estimation module 12 may include a number ofpeak counting module 12a and acomparison module 12b. -
Fig. 5 shows an example of receive signal graph, a low frequency receive signal RL and a high frequency receive signal RH being shown in parallel. - With reference to
Fig. 5 , the number ofpeak counting module 12a can count the number of peak waveforms within a gate range G containing timing t at which peak waveform Pa is determined as being a fish. The gate range G represents a time period whose duration can be set for example depending on the duration of the transmission wave. Typically, the duration of the gate range G is set to 20 times the duration of the transmission wave but it can be adjusted typically up to about 50 times the duration of the transmission wave. The number ofpeak counting module 12a can count the number of peak waveforms NL contained in receive signal RL obtained during the wide beam transmission/reception and the number of peak waveforms NH contained in receive signal RH obtained during the narrow beam transmission/reception. In the example ofFig. 5 , NH=5 and NL=12. Note that, in the explanation above, the number of peak waveforms NL and NH each corresponds to the density index value. Moreover, the peak waveforms counted by the number ofpeak counting module 12a not only include peak waveforms determined as being caused by fish by the fish detection module 11 (which detects peak waveforms under strict conditions based on gradient of rising edge etc), but it may include all peak waveforms having a maximum value above a given level. -
Fig. 6 shows a flow chart of operation of thecomparison module 12b. Thecomparison module 12b may calculate for each fish detected by the fish detection module 11 a density category within the given area (e.g., the gate range G) centered on said detected fish based on a comparison of each of the peak numbers NL and NH with a first threshold Thr1 and a second threshold Thr2. Specifically, thecomparison module 12b compares peak number NL with first threshold Thr1 (S1), and when NL is the same as or below Thr1 (S1: YES) the density category is set as LOW (S2). - On the other hand, when NL is above Thr1 (S1: NO), the
comparison module 12b then compares peak number NH with second threshold Thr2 (S3). When NH is the same as or below Thr2 (S3: YES) the density category is set as MEDIUM (S4) and when NH is above Thr2 (S3: NO) the density category is set as HIGH (S5). When the density category is LOW, the density in the vicinity of the fish whose density is to be estimated is estimated as relatively low compared to the MEDIUM and HIGH categories. When the density category is MEDIUM, the density in the vicinity of said fish is estimated as being higher than when the density category is LOW, and when the density category is HIGH, the density in the vicinity of said fish is estimated as being higher than when the density category is MEDIUM. Thecomparison module 12b can calculate density category for every fish detected by thefish detection module 11. The density category (LOW, MEDIUM, HIGH) calculated by thecomparison module 12b for every detected fish is notified to the fishlength calculation module 13. - The fish
length calculation module 13 can calculate fish length of each fish based on the target strength value (TS value) of fish detected by thefish detection module 11 and the density category (e.g., LOW, MEDIUM, HIGH) estimated by the density indexvalue estimation module 12. More specifically, in some cases, for fish with a LOW density category, the fishlength calculation module 13 calculates fish length based on the TS value (which may also be referred to as size index value) of the detected fish. For fish with MEDIUM or HIGH density category, the fishlength calculation module 13 calculates fish length similarly as in LOW density but based on an adjusted TS value (namely, a TS value after adjustment, which may also be referred to as size index value) of the detected fish, the TS value being adjusted with an adjustment formula explained hereinafter. The fishlength calculation module 13 is set as a size index value calculation module that calculates TS value or adjusted TS value. - When the density category of a fish is MEDIUM, the fish
length calculation module 13 may calculate the adjusted TS value by adjusting the TS value with the following formula (1).
- When the density category of a fish is HIGH, the fish
length calculation module 13 may calculate the adjusted TS value by adjusting the TS value with the following formula (2).
- In the aforementioned formulas (1) and (2), TSAC is the adjusted TS value, TSBC is the TS value before adjustment, and α and β are tuning values with α typically bigger than β. α and β are determined for example depending on an operation environment of the apparatus such as the season, the fishing area, fish species etc.
-
Fig. 7 shows an example of a histogram (solid line) generated by thehistogram generation module 14 and a histogram (dotted line) generated by a conventional fish finder. Thehistogram generation module 14 can generate a fish length histogram based on the fish length of each fish calculated by the fishlength calculation module 13. The histogram generated by thehistogram generation module 14 may be displayed on the operation/display unit 4. - In some histograms displaying fish length frequency distribution, when fish that form a school of fish are densely grouped together, peak waveforms obtained from each fish may mutually interfere with each other and the TS value (representative of fish length) may be estimated to be a value higher than it actually is. When generating a histogram based on fish length of fish calculated with such problem, the histogram gets shifted on the right (which is the side where fish length is higher) of its actual position. Namely, a conventional fish finder generates a histogram indicating fish school properties that are actually different.
- In contrast, using the
fish finder 1 of the present disclosure, when fish school density is relatively high (specifically, when the density category is MEDIUM or HIGH), the TS value obtained from the peak value of the receive signal is adjusted to become smaller (i.e., the TS value is reduced) and the histogram is calculated based on fish length of each fish calculated based on the adjusted TS value. As a result, compared with other fish finders that do not use features of the present disclosure, when a fish school is dense, as fish length of each fish becomes smaller than before adjustment of TS value, a histogram close to the actual distribution of the school can be generated. - Note that with the
fish finder 1 of the present disclosure, when fish school density is relatively low (specifically, when the density category is LOW), the same histogram as the histogram generated by a conventional fish finder is generated. Namely, when fish school density is relatively low, TS value is not adjusted. This is due to the fact that when fish school density is relatively low, peak waveforms of receive signals are sparse and tend not to interfere with each other and as a result adjustment of TS value is not necessary. - Consequently, with
fish finder 1 of the present disclosure, as fish length of each fish can be appropriately calculated regardless of fish school density, an appropriate fish school histogram can be generated. - As in the foregoing, in
fish finder 1 of the present disclosure, TS value of fish is not only calculated based on peak value of peak waveform caused by fish, but it is also calculated based on the density index value (for example, number of peak waveforms NL and NH) of fish within a given area. Accordingly, by calculating (adjusting) TS value of fish taking into consideration the density index value that is closely linked to TS value of fish, a more accurate fish length can be calculated and in addition an appropriate fish school histogram can be generated. - Accordingly,
fish finder 1 can more accurately estimate size (e.g., length) of target objects (e.g., fish). - Moreover, in
fish finder 1, density index value (e.g., number of peak waveforms NL and NH) is estimated at each detected fish. Accordingly, based on the density index value estimated at each fish, a more accurate fish length can be estimated for each fish. - Moreover, in
fish finder 1, each fish whose fish length is to be calculated is categorized into a plurality of density categories (LOW, MEDIUM, HIGH), and fish length calculation is changed depending on the category. Accordingly, by categorizing density into a plurality of categories, a fish length corresponding to each density category can be appropriately determined. - Moreover, in
fish finder 1, for fish whose density category is set as MEDIUM or HIGH, the TS value is adjusted. As fish TS value obtained from relatively dense fish school tends to be different from what it actually is, by performing such adjustment of fish TS value, fish length can be appropriately calculated. - Moreover, in
fish finder 1, for fish whose density category is set as MEDIUM or HIGH, the TS value is adjusted so that it becomes smaller after adjustment. As fish TS value obtained from relatively dense fish school tends to be higher than what it actually is, by performing such adjustment of fish TS value, fish length can be appropriately calculated. - Moreover, in
fish finder 1, the density index value is calculated based on the number of peaks contained in the receive signal from the fish school. Accordingly, an index indicative of fish school density necessary to obtain a more accurate fish length can be relatively easily and appropriately calculated. - Moreover, in
fish finder 1, the fish school histogram classified into fish length is generated based on TS value or adjusted TS value as a size index value calculated for each fish. Accordingly, a histogram close to the actual fish length frequency distribution of the school can be generated. - Moreover, in
fish finder 1, the gate range G where density index value is calculated is set to a range that contains the fish where density is to be estimated. Accordingly, the density index value in the vicinity of the fish where density is to be estimated can be appropriately calculated. - Moreover,
fish finder 1 can appropriately calculate fish length information which is essential information for people of the fishing industry such as fishermen. - Although several embodiments have been described above, this disclosure is not limited to the above-described embodiments, and various changes may be applied without deviating from the scope of this disclosure.
- (1) In the foregoing disclosure, as an example, transmission waves having different frequencies are transmitted in alternation from
transducer 2, but this should not be a limitation. Specifically, it is possible to provide two transducers transmitting simultaneously, each transducer transmitting a transmission wave at different frequencies. - (2) In the foregoing disclosure, as a way of forming two beams BML and BMH having different beam widths θ L and θ H, an example forming two beams BML and BMH having different frequencies is explained, but this should not be a limitation. Specifically, it is possible to provide two transducers, each having a transmitting surface of different sizes, and form beams in alternation with each transducer. In this case, a narrow beam is formed from the transducer having a larger transmitting surface, and a wide beam is formed from the transducer having a smaller transmitting surface.
- (3)
Fig. 8 shows a block diagram of an arrangement of asignal processing module 10a according to a modification. In the foregoing disclosure, an example forming two beams from transducer 2 (the so-called Dual Beam method) is explained, but this should not be a limitation, a fish finder arranged to use the so-called Single Beam method can be used. Compared to thesignal processing module 10 of the foregoing disclosure, the operation of the density index value estimation module 15 (which may also be referred to as density index value estimator) of thesignal processing module 10a of the present modification differs greatly. Hereinafter, operation of the density indexvalue estimation module 15 is mainly explained, other explanations are omitted.
Fig. 9 shows an example of a receive signal R obtained from a reception wave received by a transducer of the present modification. With reference toFig. 9 , the number ofpeak counting module 15a may count the number of peak waveforms within gate range G containing timing t at which peak waveform Pa is determined as being a fish, as in the foregoing disclosure. The number ofpeak counting module 15a may count the number of peak waveforms N (density index value) contained in receive signal R. In the example ofFig. 9 , N=12.
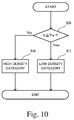
Fig. 10 shows a flow chart of operation of thecomparison module 15b shown inFig. 8 . Thecomparison module 15b may calculate for each fish detected by the fish detection module 11 a density category within the given area (gate range G) centered on said detected fish based on a comparison of peak number N with a threshold Thr. Specifically, thecomparison module 15b compares peak number N with threshold Thr (S6), and when N is the same or below Thr (S6: YES) the density category is set as LOW (S7). On the other hand, when N is above Thr (S6: NO), thecomparison module 15b sets the density category as HIGH (S8).
As in the foregoing disclosure, in the fish finder of the present modification, when the density category is LOW, fish length is calculated without TS value adjustment. On the other hand, when density category is HIGH, fish length is calculated based on adjusted TS value. Accordingly, fish length of each fish and histogram can be appropriately calculated, as in the foregoing disclosure.
Note that in the present modification, an example of the fish finder of the present disclosure adapted to the Single Beam method is explained but this should not be a limitation, other methods such as for example the Split Beam method can be adapted to the fish finder. - (4) In the foregoing disclosure, when the density category is MEDIUM and HIGH, fish length of each fish is calculated based on the adjusted TS value, but this should not be a limitation. Specifically, when the density category is MEDIUM and HIGH, it is also possible to exclude the peak waveform from the fish length calculation. Accordingly, as it is possible to exclude from the fish length calculation fish being in condition where it is difficult to obtain an accurate fish length calculation (dense fish school condition), reliability of fish length calculation value can be enhanced. Still, without the above limitation, it is also possible to calculate fish length based on the adjusted TS value when the density category is MEDIUM and to exclude the peak waveform from the fish length calculation when the density category is HIGH.
- (5) In the foregoing disclosure, TS value is adjusted with formulas (1) and (2) but this should not be a limitation. Moreover, TS value adjustment can be performed without the use of formulas (1) and (2) or any other formula. As an example, a look-up table establishing a correspondence between density category and adjustment value can be arranged and TS value can be adjusted based on the adjustment value corresponding to the determined density category of each fish.
- (6)
Fig. 11 shows a block diagram of an arrangement of asignal processing module 10b of a fish finder according to a modification. In the foregoing disclosure,histogram generation module 14 generates a histogram, but without limitation to this, an arrangement omittinghistogram generation module 14 is possible. In the present modification, as an example, fish length of detected fish can be for example displayed in the vicinity of the fish echo image. - (7) In the foregoing disclosure, a density index value is estimated at each fish, but this should not be a limitation. It is also possible to calculate fish length of each fish based on a density index value of a fish school as a whole. Accordingly, as it is possible to omit calculation of density index value in the vicinity of each fish, the calculation load of the signal processing module can be reduced.
- (8)
Fig. 12 shows a view to explain a gate range G set by a fish finder according to a modification, in comparison withFig. 5 . In the foregoing disclosure, the gate range G as the given area is set to a range that contains the fish where density is to be estimated, but this should not be a limitation. As shown inFig. 12 , it is possible to set gate range G to a range that does not contain said fish. - (9)
Fig. 13 shows a block diagram of an arrangement of asignal processing module 10c of a fish finder according to a modification. The density index value estimation module 16 (which may also be referred to as density index value estimator) of thesignal processing module 10c of the present modification comprises an averagelevel calculation module 16a and acomparison module 16b. In the density indexvalue calculation module 16 of the present modification, in a different way from the foregoing disclosure, the density index value is calculated as a difference between the peak value of the detected fish and an average intensity value of the receive signal within the gate range G calculated by the averagelevel calculation module 16a. Then, in the present modification, thecomparison module 16b compares said difference value with a given threshold and calculates the density category of the fish based on the comparison result. Even with such method, as with the foregoing disclosure, an index indicative of fish school density can be relatively easily and appropriately calculated. Note that, as an example, in this case the TS value can be for example adjusted based on a difference level between an average value of the high frequency receive signal within the gate range R and an average value of the low frequency receive signal within the gate range R. - In the foregoing disclosure, TS value is adjusted based on formulas (1) and (2), but this should not be a limitation. As an example, the TS value can be for example adjusted using a difference level between an average value of the high frequency receive signal within the gate range R and an average value of the low frequency receive signal within the gate range R. Or possibly, density index value can be calculated using a difference between the peak value of the detected fish and an average intensity value of the receive signal within the gate range G and TS value can be adjusted using peak number of fish within the gate range G.
Claims (13)
- An underwater detection apparatus, comprising:a transmitter (2) configured to transmit a transmission wave;a receiver (2) configured to obtain a receive signal based on a reflection of the transmission wave;a target detecting module (11) configured to detect an underwater target object based at least in part on the receive signal;a density index value estimation module (12, 15, 16) configured to estimate a density index value of objects within a given area in a vicinity of the underwater target object; anda size index value calculation module (13) configured to calculate a size index value of the underwater target object based at least in part on the density index value and a target object signal intensity representing a maximum intensity of the receive signal corresponding to the underwater target object.
- The underwater detection apparatus of claim 1, wherein
the density index value estimation module (12, 15, 16) categorizes the density index value into a category of a plurality of categories; and
the size index value calculation module (13) calculates the size index value based on the target object signal intensity and the category. - The underwater detection apparatus of claim 2, wherein
when the category that represents a range of density index values is above a given value, the size index value calculation module (13) adjusts the size index value of the underwater target object. - The underwater detection apparatus of claim 3, wherein
when the category that represents a range of density index values is above a given value, the size index value calculation module (13) reduces the size index value of the underwater target object. - The underwater detection apparatus of any of the preceding claims, wherein
the given area represents an area that includes the underwater target object detected by the target detecting module (11). - The underwater detection apparatus of any of the preceding claims, wherein
the given area represents a time period that lasts for up to about 50 times a duration of the transmission wave. - The underwater detection apparatus of any of the preceding claims, wherein
the density index value estimation module (12, 15, 16) estimates the density index value based at least in part on a number of peaks included in the receive signal within the given area. - The underwater detection apparatus of any one of claims 1 to 6, wherein
the density index value estimation module (12, 15, 16) estimates the density index value based at least in part on an average intensity value of the receive signal within the given area. - The underwater detection apparatus of any of the preceding claims, wherein
the density index value estimation module (12, 15, 16) estimates for each detected underwater target object the density index value of the objects in the vicinity of each underwater target object detected by the target detecting module (11); and
the size index value calculation module (13) calculates the size index value of each said underwater target object based on the target object signal intensity corresponding to each said underwater target object and the density index value estimated at each said underwater target object. - The underwater detection apparatus of any of the preceding claims further comprising:a frequency distribution calculation module (14) configured to calculate a size frequency distribution of at least two underwater target objects from a plurality of underwater target objects based on the size index value of the at least two underwater target objects calculated by the size index value calculation module (13).
- The underwater detection apparatus of claim 10, wherein
the frequency distribution calculation module (14) calculates the size frequency distribution based on the size index value of the underwater target objects whose density index value is below a given value. - The underwater detection apparatus of any of the preceding claims, wherein
the underwater detection apparatus is a fish finder and the underwater target object is a fish. - An underwater detection method, comprising:transmitting a transmission wave;receiving a signal based on a reflection of the transmission wave;detecting an underwater target object based at least in part on the received signal;estimating a density index value of objects within a given area in a vicinity of the underwater target object; andcalculating a size index value of the underwater target object based at least in part on the density index value and a target object signal intensity representing a maximum intensity of the receive signal corresponding to the underwater target object.
Applications Claiming Priority (1)
| Application Number | Priority Date | Filing Date | Title |
|---|---|---|---|
| JP2015086087A JP6441735B2 (en) | 2015-04-20 | 2015-04-20 | Underwater detector |
Publications (2)
| Publication Number | Publication Date |
|---|---|
| EP3086137A1 true EP3086137A1 (en) | 2016-10-26 |
| EP3086137B1 EP3086137B1 (en) | 2019-05-29 |
Family
ID=55542524
Family Applications (1)
| Application Number | Title | Priority Date | Filing Date |
|---|---|---|---|
| EP16160723.9A Active EP3086137B1 (en) | 2015-04-20 | 2016-03-16 | Underwater detection apparatus |
Country Status (3)
| Country | Link |
|---|---|
| US (1) | US9880274B2 (en) |
| EP (1) | EP3086137B1 (en) |
| JP (1) | JP6441735B2 (en) |
Cited By (2)
| Publication number | Priority date | Publication date | Assignee | Title |
|---|---|---|---|---|
| CN110879386A (en) * | 2019-12-02 | 2020-03-13 | 山东科技大学 | A Target Size Estimation Method Based on Broadband Shallow Profile Data |
| WO2020090287A1 (en) | 2018-10-29 | 2020-05-07 | 古野電気株式会社 | Target measurement apparatus and target measurement method |
Families Citing this family (4)
| Publication number | Priority date | Publication date | Assignee | Title |
|---|---|---|---|---|
| JP6492278B2 (en) * | 2015-03-19 | 2019-04-03 | 本多電子株式会社 | Fish finder |
| EP3647818B1 (en) * | 2017-06-30 | 2024-03-20 | Furuno Electric Co., Ltd. | Fish school finding device, fish length measuring device, fish school finding method, and fish school finding program |
| WO2019017132A1 (en) * | 2017-07-19 | 2019-01-24 | 古野電気株式会社 | Growth state measurement apparatus and growth state measurement method |
| JP7051625B2 (en) * | 2018-07-12 | 2022-04-11 | 古野電気株式会社 | Underwater detector and underwater detection method |
Citations (1)
| Publication number | Priority date | Publication date | Assignee | Title |
|---|---|---|---|---|
| US20080080317A1 (en) | 2006-10-02 | 2008-04-03 | Furuno Electric Company, Ltd. | Fishfinder |
Family Cites Families (12)
| Publication number | Priority date | Publication date | Assignee | Title |
|---|---|---|---|---|
| JPS51151584A (en) * | 1975-06-20 | 1976-12-27 | Zenkoku Gyogyo Kiyousaikumiai Rengokai | Measuring method for number of fish |
| US4081783A (en) * | 1975-09-26 | 1978-03-28 | Keisuke Honda | Fish finder capable of discriminating sizes of fish |
| US4597069A (en) * | 1983-10-17 | 1986-06-24 | Transdynamics Inc. | Depthsounder/fish finder |
| JP2828259B2 (en) * | 1989-04-03 | 1998-11-25 | 古野電気株式会社 | Fish finder |
| JPH0285787A (en) * | 1989-08-02 | 1990-03-27 | Marine Instr Co Ltd | Fish finder |
| JPH11344566A (en) * | 1998-03-31 | 1999-12-14 | Japan Radio Co Ltd | Fish finder |
| JP3930166B2 (en) * | 1998-11-10 | 2007-06-13 | 株式会社カイジョーソニック | Weighing fish finder |
| US6934218B1 (en) * | 2004-01-29 | 2005-08-23 | Hwang-Hsing Chen | Sounding device for showing its location on a fish detector |
| US20060018197A1 (en) * | 2004-07-20 | 2006-01-26 | Biosonics, Inc. | Acoustic biomass monitor |
| JP5257783B2 (en) * | 2009-05-11 | 2013-08-07 | 古野電気株式会社 | Underwater detection device and underwater detection image display method |
| US8934318B2 (en) * | 2012-07-18 | 2015-01-13 | Reelsonar, Inc. | System and method for fish finding using a sonar device and a remote computing device |
| US20160146936A1 (en) * | 2014-11-26 | 2016-05-26 | Navico Holding As | Sonar Data Collection |
-
2015
- 2015-04-20 JP JP2015086087A patent/JP6441735B2/en active Active
-
2016
- 2016-03-16 EP EP16160723.9A patent/EP3086137B1/en active Active
- 2016-04-06 US US15/092,307 patent/US9880274B2/en active Active
Patent Citations (1)
| Publication number | Priority date | Publication date | Assignee | Title |
|---|---|---|---|---|
| US20080080317A1 (en) | 2006-10-02 | 2008-04-03 | Furuno Electric Company, Ltd. | Fishfinder |
Non-Patent Citations (6)
| Title |
|---|
| BARANGE M ET AL: "Empirical determination of in situ target strengths of three loosely aggregated pelagic fish species", ICES JOURNAL OF MARINE SCIENCE, 1 January 1996 (1996-01-01), pages 225 - 232, XP055298176, Retrieved from the Internet <URL:http://icesjms.oxfordjournals.org/content/53/2/225.full.pdf> DOI: 10.1006/jmsc.1996.0026 * |
| BARANGE, M.; HAMPTON, I.; SOULE, M.: "Empirical determination of in situ target strengths of three loosely aggregated pelagic fish species", ICES JOURNAL OF MARINE SCIENCE, vol. 53, 1996, pages 225 - 232, XP055298176, DOI: doi:10.1006/jmsc.1996.0026 |
| GAUTHIER, S.; ROSE, G.: "Diagnostic tools for unbiased in situ target strength estimation", CANADIAN JOURNAL OF FISHERIES AND AQUATIC SCIENCES, vol. 58, 2001, pages 2149 - 2155 |
| GODLEWSKA M ET AL: "Hydroacoustic measurements at two frequencies: 70 and 120kHz - consequences for fish stock estimation", FISHERIES RESEARCH, ELSEVIER, AMSTERDAM, NL, vol. 96, no. 1, 1 February 2009 (2009-02-01), pages 11 - 16, XP025879176, ISSN: 0165-7836, [retrieved on 20080905], DOI: 10.1016/J.FISHRES.2008.09.015 * |
| KOUICHI SAWADA ET AL: "Conditions for the precise measurement of fish target strength in situ", THE JOURNAL OF THE MARINE ACOUSTICS SOCIETY OF JAPAN, vol. 20, no. 2, 7 October 1992 (1992-10-07), pages 73 - 79, XP055298558, DOI: 10.3135/jmasj.20.73 * |
| SAWADA, K.; FURUSAWA, M.; WILLIAMSON, N.: "Conditions for the precise measurement of fish target strength in situ", OCEAN ACOUSTIC JOURNAL, vol. 20, no. 2, 1993, pages 73 - 79, XP055298192, DOI: doi:10.3135/jmasj.20.73 |
Cited By (3)
| Publication number | Priority date | Publication date | Assignee | Title |
|---|---|---|---|---|
| WO2020090287A1 (en) | 2018-10-29 | 2020-05-07 | 古野電気株式会社 | Target measurement apparatus and target measurement method |
| CN110879386A (en) * | 2019-12-02 | 2020-03-13 | 山东科技大学 | A Target Size Estimation Method Based on Broadband Shallow Profile Data |
| CN110879386B (en) * | 2019-12-02 | 2022-08-30 | 山东科技大学 | Target size estimation method based on broadband shallow profile data |
Also Published As
| Publication number | Publication date |
|---|---|
| JP6441735B2 (en) | 2018-12-19 |
| JP2016205933A (en) | 2016-12-08 |
| US9880274B2 (en) | 2018-01-30 |
| US20160306033A1 (en) | 2016-10-20 |
| EP3086137B1 (en) | 2019-05-29 |
Similar Documents
| Publication | Publication Date | Title |
|---|---|---|
| EP3086137B1 (en) | Underwater detection apparatus | |
| EP3153884B1 (en) | Detection apparatus, fish finder, and radar | |
| CN102565800B (en) | Detection device and detecting method | |
| US8864671B2 (en) | Methods and systems for color flow imaging | |
| JP5252578B2 (en) | Underwater detection device and fish species discrimination method | |
| US20150359507A1 (en) | Ultrasound diagnosis apparatus and ultrasound image processing method | |
| JP6773906B2 (en) | Fish finder, fish length measuring device, fish finder method, and fish finder program | |
| GB2503351A (en) | Underwater detection device | |
| US9268021B2 (en) | Detection device and computer readable media storing detection program | |
| US9541645B2 (en) | Detecting device, fish finder and detecting method | |
| JP5775352B2 (en) | Target length measuring device, target length measuring method, and target length measuring program | |
| US7363177B2 (en) | Apparatus and method for performing the time delay estimation of signals propagating through an environment | |
| KR101055581B1 (en) | How to set filters for ultrasonic system and clutter rejection | |
| JP5507267B2 (en) | Method and apparatus for calculating thickness of damping material | |
| RU2602759C1 (en) | Method of object in aqueous medium automatic detection and classification | |
| JP2014077703A (en) | Fish species discrimination device, signal processing device, underwater detector, fish species discrimination method and program | |
| JP6347660B2 (en) | Fish finder, single fish detection method, and single fish detection program | |
| EP3153883B1 (en) | Detection apparatus, underwater detection apparatus, radar apparatus, and detection method | |
| CN113557447A (en) | Target object measuring device and target object measuring method | |
| RU2655019C1 (en) | Method for measuring vessel speed by the doppler log | |
| KR100987981B1 (en) | Apparatus and method for distinguishing between activity signal and transition noise | |
| RU2541733C1 (en) | Parametric profile recorder | |
| RU2559310C2 (en) | Method of estimating distance to noisy object at sea | |
| JP2011247624A (en) | Underwater detection device and underwater detection method | |
| RU156050U1 (en) | CONTROLLED SCALE RANGE BOTTOM SHOT |
Legal Events
| Date | Code | Title | Description |
|---|---|---|---|
| PUAI | Public reference made under article 153(3) epc to a published international application that has entered the european phase |
Free format text: ORIGINAL CODE: 0009012 |
|
| AK | Designated contracting states |
Kind code of ref document: A1 Designated state(s): AL AT BE BG CH CY CZ DE DK EE ES FI FR GB GR HR HU IE IS IT LI LT LU LV MC MK MT NL NO PL PT RO RS SE SI SK SM TR |
|
| AX | Request for extension of the european patent |
Extension state: BA ME |
|
| STAA | Information on the status of an ep patent application or granted ep patent |
Free format text: STATUS: REQUEST FOR EXAMINATION WAS MADE |
|
| 17P | Request for examination filed |
Effective date: 20170411 |
|
| RBV | Designated contracting states (corrected) |
Designated state(s): AL AT BE BG CH CY CZ DE DK EE ES FI FR GB GR HR HU IE IS IT LI LT LU LV MC MK MT NL NO PL PT RO RS SE SI SK SM TR |
|
| GRAP | Despatch of communication of intention to grant a patent |
Free format text: ORIGINAL CODE: EPIDOSNIGR1 |
|
| STAA | Information on the status of an ep patent application or granted ep patent |
Free format text: STATUS: GRANT OF PATENT IS INTENDED |
|
| INTG | Intention to grant announced |
Effective date: 20181218 |
|
| GRAS | Grant fee paid |
Free format text: ORIGINAL CODE: EPIDOSNIGR3 |
|
| GRAA | (expected) grant |
Free format text: ORIGINAL CODE: 0009210 |
|
| STAA | Information on the status of an ep patent application or granted ep patent |
Free format text: STATUS: THE PATENT HAS BEEN GRANTED |
|
| AK | Designated contracting states |
Kind code of ref document: B1 Designated state(s): AL AT BE BG CH CY CZ DE DK EE ES FI FR GB GR HR HU IE IS IT LI LT LU LV MC MK MT NL NO PL PT RO RS SE SI SK SM TR |
|
| REG | Reference to a national code |
Ref country code: GB Ref legal event code: FG4D |
|
| REG | Reference to a national code |
Ref country code: CH Ref legal event code: EP |
|
| REG | Reference to a national code |
Ref country code: DE Ref legal event code: R096 Ref document number: 602016014502 Country of ref document: DE |
|
| REG | Reference to a national code |
Ref country code: AT Ref legal event code: REF Ref document number: 1138607 Country of ref document: AT Kind code of ref document: T Effective date: 20190615 |
|
| REG | Reference to a national code |
Ref country code: IE Ref legal event code: FG4D |
|
| REG | Reference to a national code |
Ref country code: NL Ref legal event code: MP Effective date: 20190529 |
|
| REG | Reference to a national code |
Ref country code: LT Ref legal event code: MG4D |
|
| PG25 | Lapsed in a contracting state [announced via postgrant information from national office to epo] |
Ref country code: NO Free format text: LAPSE BECAUSE OF FAILURE TO SUBMIT A TRANSLATION OF THE DESCRIPTION OR TO PAY THE FEE WITHIN THE PRESCRIBED TIME-LIMIT Effective date: 20190829 Ref country code: FI Free format text: LAPSE BECAUSE OF FAILURE TO SUBMIT A TRANSLATION OF THE DESCRIPTION OR TO PAY THE FEE WITHIN THE PRESCRIBED TIME-LIMIT Effective date: 20190529 Ref country code: LT Free format text: LAPSE BECAUSE OF FAILURE TO SUBMIT A TRANSLATION OF THE DESCRIPTION OR TO PAY THE FEE WITHIN THE PRESCRIBED TIME-LIMIT Effective date: 20190529 Ref country code: PT Free format text: LAPSE BECAUSE OF FAILURE TO SUBMIT A TRANSLATION OF THE DESCRIPTION OR TO PAY THE FEE WITHIN THE PRESCRIBED TIME-LIMIT Effective date: 20190930 Ref country code: HR Free format text: LAPSE BECAUSE OF FAILURE TO SUBMIT A TRANSLATION OF THE DESCRIPTION OR TO PAY THE FEE WITHIN THE PRESCRIBED TIME-LIMIT Effective date: 20190529 Ref country code: ES Free format text: LAPSE BECAUSE OF FAILURE TO SUBMIT A TRANSLATION OF THE DESCRIPTION OR TO PAY THE FEE WITHIN THE PRESCRIBED TIME-LIMIT Effective date: 20190529 Ref country code: SE Free format text: LAPSE BECAUSE OF FAILURE TO SUBMIT A TRANSLATION OF THE DESCRIPTION OR TO PAY THE FEE WITHIN THE PRESCRIBED TIME-LIMIT Effective date: 20190529 Ref country code: AL Free format text: LAPSE BECAUSE OF FAILURE TO SUBMIT A TRANSLATION OF THE DESCRIPTION OR TO PAY THE FEE WITHIN THE PRESCRIBED TIME-LIMIT Effective date: 20190529 |
|
| PG25 | Lapsed in a contracting state [announced via postgrant information from national office to epo] |
Ref country code: GR Free format text: LAPSE BECAUSE OF FAILURE TO SUBMIT A TRANSLATION OF THE DESCRIPTION OR TO PAY THE FEE WITHIN THE PRESCRIBED TIME-LIMIT Effective date: 20190830 Ref country code: BG Free format text: LAPSE BECAUSE OF FAILURE TO SUBMIT A TRANSLATION OF THE DESCRIPTION OR TO PAY THE FEE WITHIN THE PRESCRIBED TIME-LIMIT Effective date: 20190829 Ref country code: LV Free format text: LAPSE BECAUSE OF FAILURE TO SUBMIT A TRANSLATION OF THE DESCRIPTION OR TO PAY THE FEE WITHIN THE PRESCRIBED TIME-LIMIT Effective date: 20190529 Ref country code: RS Free format text: LAPSE BECAUSE OF FAILURE TO SUBMIT A TRANSLATION OF THE DESCRIPTION OR TO PAY THE FEE WITHIN THE PRESCRIBED TIME-LIMIT Effective date: 20190529 |
|
| REG | Reference to a national code |
Ref country code: AT Ref legal event code: MK05 Ref document number: 1138607 Country of ref document: AT Kind code of ref document: T Effective date: 20190529 |
|
| PG25 | Lapsed in a contracting state [announced via postgrant information from national office to epo] |
Ref country code: SK Free format text: LAPSE BECAUSE OF FAILURE TO SUBMIT A TRANSLATION OF THE DESCRIPTION OR TO PAY THE FEE WITHIN THE PRESCRIBED TIME-LIMIT Effective date: 20190529 Ref country code: DK Free format text: LAPSE BECAUSE OF FAILURE TO SUBMIT A TRANSLATION OF THE DESCRIPTION OR TO PAY THE FEE WITHIN THE PRESCRIBED TIME-LIMIT Effective date: 20190529 Ref country code: EE Free format text: LAPSE BECAUSE OF FAILURE TO SUBMIT A TRANSLATION OF THE DESCRIPTION OR TO PAY THE FEE WITHIN THE PRESCRIBED TIME-LIMIT Effective date: 20190529 Ref country code: NL Free format text: LAPSE BECAUSE OF FAILURE TO SUBMIT A TRANSLATION OF THE DESCRIPTION OR TO PAY THE FEE WITHIN THE PRESCRIBED TIME-LIMIT Effective date: 20190529 Ref country code: AT Free format text: LAPSE BECAUSE OF FAILURE TO SUBMIT A TRANSLATION OF THE DESCRIPTION OR TO PAY THE FEE WITHIN THE PRESCRIBED TIME-LIMIT Effective date: 20190529 Ref country code: CZ Free format text: LAPSE BECAUSE OF FAILURE TO SUBMIT A TRANSLATION OF THE DESCRIPTION OR TO PAY THE FEE WITHIN THE PRESCRIBED TIME-LIMIT Effective date: 20190529 Ref country code: RO Free format text: LAPSE BECAUSE OF FAILURE TO SUBMIT A TRANSLATION OF THE DESCRIPTION OR TO PAY THE FEE WITHIN THE PRESCRIBED TIME-LIMIT Effective date: 20190529 |
|
| PG25 | Lapsed in a contracting state [announced via postgrant information from national office to epo] |
Ref country code: SM Free format text: LAPSE BECAUSE OF FAILURE TO SUBMIT A TRANSLATION OF THE DESCRIPTION OR TO PAY THE FEE WITHIN THE PRESCRIBED TIME-LIMIT Effective date: 20190529 Ref country code: IT Free format text: LAPSE BECAUSE OF FAILURE TO SUBMIT A TRANSLATION OF THE DESCRIPTION OR TO PAY THE FEE WITHIN THE PRESCRIBED TIME-LIMIT Effective date: 20190529 |
|
| REG | Reference to a national code |
Ref country code: DE Ref legal event code: R097 Ref document number: 602016014502 Country of ref document: DE |
|
| PG25 | Lapsed in a contracting state [announced via postgrant information from national office to epo] |
Ref country code: TR Free format text: LAPSE BECAUSE OF FAILURE TO SUBMIT A TRANSLATION OF THE DESCRIPTION OR TO PAY THE FEE WITHIN THE PRESCRIBED TIME-LIMIT Effective date: 20190529 |
|
| PLBE | No opposition filed within time limit |
Free format text: ORIGINAL CODE: 0009261 |
|
| STAA | Information on the status of an ep patent application or granted ep patent |
Free format text: STATUS: NO OPPOSITION FILED WITHIN TIME LIMIT |
|
| PG25 | Lapsed in a contracting state [announced via postgrant information from national office to epo] |
Ref country code: PL Free format text: LAPSE BECAUSE OF FAILURE TO SUBMIT A TRANSLATION OF THE DESCRIPTION OR TO PAY THE FEE WITHIN THE PRESCRIBED TIME-LIMIT Effective date: 20190529 |
|
| 26N | No opposition filed |
Effective date: 20200303 |
|
| PG25 | Lapsed in a contracting state [announced via postgrant information from national office to epo] |
Ref country code: SI Free format text: LAPSE BECAUSE OF FAILURE TO SUBMIT A TRANSLATION OF THE DESCRIPTION OR TO PAY THE FEE WITHIN THE PRESCRIBED TIME-LIMIT Effective date: 20190529 |
|
| PG25 | Lapsed in a contracting state [announced via postgrant information from national office to epo] |
Ref country code: MC Free format text: LAPSE BECAUSE OF FAILURE TO SUBMIT A TRANSLATION OF THE DESCRIPTION OR TO PAY THE FEE WITHIN THE PRESCRIBED TIME-LIMIT Effective date: 20190529 |
|
| REG | Reference to a national code |
Ref country code: CH Ref legal event code: PL |
|
| REG | Reference to a national code |
Ref country code: BE Ref legal event code: MM Effective date: 20200331 |
|
| PG25 | Lapsed in a contracting state [announced via postgrant information from national office to epo] |
Ref country code: LU Free format text: LAPSE BECAUSE OF NON-PAYMENT OF DUE FEES Effective date: 20200316 |
|
| PG25 | Lapsed in a contracting state [announced via postgrant information from national office to epo] |
Ref country code: IE Free format text: LAPSE BECAUSE OF NON-PAYMENT OF DUE FEES Effective date: 20200316 Ref country code: CH Free format text: LAPSE BECAUSE OF NON-PAYMENT OF DUE FEES Effective date: 20200331 Ref country code: LI Free format text: LAPSE BECAUSE OF NON-PAYMENT OF DUE FEES Effective date: 20200331 |
|
| PG25 | Lapsed in a contracting state [announced via postgrant information from national office to epo] |
Ref country code: BE Free format text: LAPSE BECAUSE OF NON-PAYMENT OF DUE FEES Effective date: 20200331 |
|
| PG25 | Lapsed in a contracting state [announced via postgrant information from national office to epo] |
Ref country code: MT Free format text: LAPSE BECAUSE OF FAILURE TO SUBMIT A TRANSLATION OF THE DESCRIPTION OR TO PAY THE FEE WITHIN THE PRESCRIBED TIME-LIMIT Effective date: 20190529 Ref country code: CY Free format text: LAPSE BECAUSE OF FAILURE TO SUBMIT A TRANSLATION OF THE DESCRIPTION OR TO PAY THE FEE WITHIN THE PRESCRIBED TIME-LIMIT Effective date: 20190529 |
|
| PG25 | Lapsed in a contracting state [announced via postgrant information from national office to epo] |
Ref country code: MK Free format text: LAPSE BECAUSE OF FAILURE TO SUBMIT A TRANSLATION OF THE DESCRIPTION OR TO PAY THE FEE WITHIN THE PRESCRIBED TIME-LIMIT Effective date: 20190529 Ref country code: IS Free format text: LAPSE BECAUSE OF FAILURE TO SUBMIT A TRANSLATION OF THE DESCRIPTION OR TO PAY THE FEE WITHIN THE PRESCRIBED TIME-LIMIT Effective date: 20190929 |
|
| P01 | Opt-out of the competence of the unified patent court (upc) registered |
Effective date: 20230523 |
|
| PGFP | Annual fee paid to national office [announced via postgrant information from national office to epo] |
Ref country code: GB Payment date: 20260202 Year of fee payment: 11 |
|
| PGFP | Annual fee paid to national office [announced via postgrant information from national office to epo] |
Ref country code: DE Payment date: 20260128 Year of fee payment: 11 |
|
| PGFP | Annual fee paid to national office [announced via postgrant information from national office to epo] |
Ref country code: FR Payment date: 20260209 Year of fee payment: 11 |