EP3084723B1 - Spectral image data processing - Google Patents
Spectral image data processing Download PDFInfo
- Publication number
- EP3084723B1 EP3084723B1 EP14828305.4A EP14828305A EP3084723B1 EP 3084723 B1 EP3084723 B1 EP 3084723B1 EP 14828305 A EP14828305 A EP 14828305A EP 3084723 B1 EP3084723 B1 EP 3084723B1
- Authority
- EP
- European Patent Office
- Prior art keywords
- spectral
- point
- contrast
- image data
- tubular structure
- Prior art date
- Legal status (The legal status is an assumption and is not a legal conclusion. Google has not performed a legal analysis and makes no representation as to the accuracy of the status listed.)
- Active
Links
- 230000003595 spectral effect Effects 0.000 title claims description 170
- 238000012545 processing Methods 0.000 title description 13
- 238000010183 spectrum analysis Methods 0.000 claims description 70
- 239000002872 contrast media Substances 0.000 claims description 26
- 238000000034 method Methods 0.000 claims description 26
- 230000004044 response Effects 0.000 claims description 20
- 239000000463 material Substances 0.000 claims description 17
- ZCYVEMRRCGMTRW-UHFFFAOYSA-N 7553-56-2 Chemical compound [I] ZCYVEMRRCGMTRW-UHFFFAOYSA-N 0.000 claims description 10
- OYPRJOBELJOOCE-UHFFFAOYSA-N Calcium Chemical compound [Ca] OYPRJOBELJOOCE-UHFFFAOYSA-N 0.000 claims description 10
- 229910052791 calcium Inorganic materials 0.000 claims description 10
- 239000011575 calcium Substances 0.000 claims description 10
- 229910052740 iodine Inorganic materials 0.000 claims description 10
- 239000011630 iodine Substances 0.000 claims description 10
- 238000000926 separation method Methods 0.000 claims description 4
- 239000000284 extract Substances 0.000 claims description 2
- 238000012935 Averaging Methods 0.000 claims 2
- 230000011218 segmentation Effects 0.000 description 28
- 238000002591 computed tomography Methods 0.000 description 26
- 238000013459 approach Methods 0.000 description 19
- 230000005855 radiation Effects 0.000 description 18
- 210000004351 coronary vessel Anatomy 0.000 description 16
- 238000003384 imaging method Methods 0.000 description 14
- 208000004476 Acute Coronary Syndrome Diseases 0.000 description 12
- XLYOFNOQVPJJNP-UHFFFAOYSA-N water Substances O XLYOFNOQVPJJNP-UHFFFAOYSA-N 0.000 description 11
- 230000000694 effects Effects 0.000 description 9
- 210000001367 artery Anatomy 0.000 description 7
- 210000001519 tissue Anatomy 0.000 description 7
- 208000031481 Pathologic Constriction Diseases 0.000 description 6
- 238000004458 analytical method Methods 0.000 description 6
- 230000000747 cardiac effect Effects 0.000 description 6
- 208000037804 stenosis Diseases 0.000 description 6
- 230000036262 stenosis Effects 0.000 description 6
- 239000008280 blood Substances 0.000 description 5
- 208000029078 coronary artery disease Diseases 0.000 description 5
- 230000000250 revascularization Effects 0.000 description 5
- 230000001419 dependent effect Effects 0.000 description 4
- 230000003993 interaction Effects 0.000 description 4
- 210000004072 lung Anatomy 0.000 description 4
- 238000011002 quantification Methods 0.000 description 4
- 238000012502 risk assessment Methods 0.000 description 4
- 230000017531 blood circulation Effects 0.000 description 3
- 238000000701 chemical imaging Methods 0.000 description 3
- 238000001514 detection method Methods 0.000 description 3
- 230000008569 process Effects 0.000 description 3
- 230000035945 sensitivity Effects 0.000 description 3
- 238000001228 spectrum Methods 0.000 description 3
- 230000002966 stenotic effect Effects 0.000 description 3
- 208000004434 Calcinosis Diseases 0.000 description 2
- 206010007687 Carotid artery stenosis Diseases 0.000 description 2
- 229910052688 Gadolinium Inorganic materials 0.000 description 2
- 230000004075 alteration Effects 0.000 description 2
- 238000002583 angiography Methods 0.000 description 2
- 239000012620 biological material Substances 0.000 description 2
- 210000004369 blood Anatomy 0.000 description 2
- 210000004556 brain Anatomy 0.000 description 2
- 230000002308 calcification Effects 0.000 description 2
- ZQNPDAVSHFGLIQ-UHFFFAOYSA-N calcium;hydrate Chemical compound O.[Ca] ZQNPDAVSHFGLIQ-UHFFFAOYSA-N 0.000 description 2
- 208000006170 carotid stenosis Diseases 0.000 description 2
- 238000012512 characterization method Methods 0.000 description 2
- 230000009977 dual effect Effects 0.000 description 2
- 238000011156 evaluation Methods 0.000 description 2
- UIWYJDYFSGRHKR-UHFFFAOYSA-N gadolinium atom Chemical compound [Gd] UIWYJDYFSGRHKR-UHFFFAOYSA-N 0.000 description 2
- 230000010354 integration Effects 0.000 description 2
- 230000003902 lesion Effects 0.000 description 2
- 210000004185 liver Anatomy 0.000 description 2
- 230000004807 localization Effects 0.000 description 2
- 238000013507 mapping Methods 0.000 description 2
- 238000005259 measurement Methods 0.000 description 2
- 239000000203 mixture Substances 0.000 description 2
- 238000012986 modification Methods 0.000 description 2
- 230000004048 modification Effects 0.000 description 2
- 208000037260 Atherosclerotic Plaque Diseases 0.000 description 1
- 229910004613 CdTe Inorganic materials 0.000 description 1
- 229910004611 CdZnTe Inorganic materials 0.000 description 1
- 206010008479 Chest Pain Diseases 0.000 description 1
- OOEWZEXEJQEFJO-UHFFFAOYSA-N O.[I] Chemical compound O.[I] OOEWZEXEJQEFJO-UHFFFAOYSA-N 0.000 description 1
- 206010042434 Sudden death Diseases 0.000 description 1
- 238000010521 absorption reaction Methods 0.000 description 1
- 206010000891 acute myocardial infarction Diseases 0.000 description 1
- 230000002411 adverse Effects 0.000 description 1
- 210000003484 anatomy Anatomy 0.000 description 1
- 238000003491 array Methods 0.000 description 1
- 230000003143 atherosclerotic effect Effects 0.000 description 1
- 238000011888 autopsy Methods 0.000 description 1
- 229910052797 bismuth Inorganic materials 0.000 description 1
- JCXGWMGPZLAOME-UHFFFAOYSA-N bismuth atom Chemical compound [Bi] JCXGWMGPZLAOME-UHFFFAOYSA-N 0.000 description 1
- 210000004204 blood vessel Anatomy 0.000 description 1
- 210000000988 bone and bone Anatomy 0.000 description 1
- 230000015556 catabolic process Effects 0.000 description 1
- 238000006243 chemical reaction Methods 0.000 description 1
- 238000004891 communication Methods 0.000 description 1
- 238000013170 computed tomography imaging Methods 0.000 description 1
- 238000012937 correction Methods 0.000 description 1
- 238000000354 decomposition reaction Methods 0.000 description 1
- 238000006731 degradation reaction Methods 0.000 description 1
- 238000010586 diagram Methods 0.000 description 1
- 238000000605 extraction Methods 0.000 description 1
- 230000003176 fibrotic effect Effects 0.000 description 1
- 239000012530 fluid Substances 0.000 description 1
- 230000006870 function Effects 0.000 description 1
- PCHJSUWPFVWCPO-UHFFFAOYSA-N gold Chemical compound [Au] PCHJSUWPFVWCPO-UHFFFAOYSA-N 0.000 description 1
- 229910052737 gold Inorganic materials 0.000 description 1
- 239000010931 gold Substances 0.000 description 1
- 230000000544 hyperemic effect Effects 0.000 description 1
- 238000010191 image analysis Methods 0.000 description 1
- 230000001939 inductive effect Effects 0.000 description 1
- PNDPGZBMCMUPRI-UHFFFAOYSA-N iodine Chemical compound II PNDPGZBMCMUPRI-UHFFFAOYSA-N 0.000 description 1
- 230000007654 ischemic lesion Effects 0.000 description 1
- 238000012804 iterative process Methods 0.000 description 1
- 150000002632 lipids Chemical class 0.000 description 1
- 230000002107 myocardial effect Effects 0.000 description 1
- 208000031225 myocardial ischemia Diseases 0.000 description 1
- 230000001338 necrotic effect Effects 0.000 description 1
- 230000003287 optical effect Effects 0.000 description 1
- 210000000056 organ Anatomy 0.000 description 1
- 230000002265 prevention Effects 0.000 description 1
- 239000000700 radioactive tracer Substances 0.000 description 1
- 238000007634 remodeling Methods 0.000 description 1
- 238000012552 review Methods 0.000 description 1
- 210000004872 soft tissue Anatomy 0.000 description 1
- 208000024891 symptom Diseases 0.000 description 1
- 230000002792 vascular Effects 0.000 description 1
- 239000013598 vector Substances 0.000 description 1
Images

Classifications
-
- G—PHYSICS
- G06—COMPUTING; CALCULATING OR COUNTING
- G06T—IMAGE DATA PROCESSING OR GENERATION, IN GENERAL
- G06T7/00—Image analysis
- G06T7/0002—Inspection of images, e.g. flaw detection
- G06T7/0012—Biomedical image inspection
-
- A—HUMAN NECESSITIES
- A61—MEDICAL OR VETERINARY SCIENCE; HYGIENE
- A61B—DIAGNOSIS; SURGERY; IDENTIFICATION
- A61B5/00—Measuring for diagnostic purposes; Identification of persons
- A61B5/72—Signal processing specially adapted for physiological signals or for diagnostic purposes
- A61B5/7271—Specific aspects of physiological measurement analysis
- A61B5/7275—Determining trends in physiological measurement data; Predicting development of a medical condition based on physiological measurements, e.g. determining a risk factor
-
- A—HUMAN NECESSITIES
- A61—MEDICAL OR VETERINARY SCIENCE; HYGIENE
- A61B—DIAGNOSIS; SURGERY; IDENTIFICATION
- A61B6/00—Apparatus for radiation diagnosis, e.g. combined with radiation therapy equipment
- A61B6/02—Devices for diagnosis sequentially in different planes; Stereoscopic radiation diagnosis
- A61B6/03—Computerised tomographs
- A61B6/032—Transmission computed tomography [CT]
-
- A—HUMAN NECESSITIES
- A61—MEDICAL OR VETERINARY SCIENCE; HYGIENE
- A61B—DIAGNOSIS; SURGERY; IDENTIFICATION
- A61B6/00—Apparatus for radiation diagnosis, e.g. combined with radiation therapy equipment
- A61B6/50—Clinical applications
- A61B6/504—Clinical applications involving diagnosis of blood vessels, e.g. by angiography
-
- A—HUMAN NECESSITIES
- A61—MEDICAL OR VETERINARY SCIENCE; HYGIENE
- A61B—DIAGNOSIS; SURGERY; IDENTIFICATION
- A61B6/00—Apparatus for radiation diagnosis, e.g. combined with radiation therapy equipment
- A61B6/50—Clinical applications
- A61B6/507—Clinical applications involving determination of haemodynamic parameters, e.g. perfusion CT
-
- A—HUMAN NECESSITIES
- A61—MEDICAL OR VETERINARY SCIENCE; HYGIENE
- A61B—DIAGNOSIS; SURGERY; IDENTIFICATION
- A61B6/00—Apparatus for radiation diagnosis, e.g. combined with radiation therapy equipment
- A61B6/52—Devices using data or image processing specially adapted for radiation diagnosis
- A61B6/5205—Devices using data or image processing specially adapted for radiation diagnosis involving processing of raw data to produce diagnostic data
-
- A—HUMAN NECESSITIES
- A61—MEDICAL OR VETERINARY SCIENCE; HYGIENE
- A61B—DIAGNOSIS; SURGERY; IDENTIFICATION
- A61B6/00—Apparatus for radiation diagnosis, e.g. combined with radiation therapy equipment
- A61B6/52—Devices using data or image processing specially adapted for radiation diagnosis
- A61B6/5211—Devices using data or image processing specially adapted for radiation diagnosis involving processing of medical diagnostic data
- A61B6/5217—Devices using data or image processing specially adapted for radiation diagnosis involving processing of medical diagnostic data extracting a diagnostic or physiological parameter from medical diagnostic data
-
- G—PHYSICS
- G06—COMPUTING; CALCULATING OR COUNTING
- G06T—IMAGE DATA PROCESSING OR GENERATION, IN GENERAL
- G06T2207/00—Indexing scheme for image analysis or image enhancement
- G06T2207/20—Special algorithmic details
- G06T2207/20112—Image segmentation details
- G06T2207/20116—Active contour; Active surface; Snakes
-
- G—PHYSICS
- G06—COMPUTING; CALCULATING OR COUNTING
- G06T—IMAGE DATA PROCESSING OR GENERATION, IN GENERAL
- G06T2207/00—Indexing scheme for image analysis or image enhancement
- G06T2207/30—Subject of image; Context of image processing
- G06T2207/30004—Biomedical image processing
- G06T2207/30101—Blood vessel; Artery; Vein; Vascular
-
- G—PHYSICS
- G06—COMPUTING; CALCULATING OR COUNTING
- G06T—IMAGE DATA PROCESSING OR GENERATION, IN GENERAL
- G06T2211/00—Image generation
- G06T2211/40—Computed tomography
- G06T2211/408—Dual energy
Definitions
- CT computed tomography
- Computed tomography is a non-invasive imaging procedure.
- a CT scanner generally includes an x-ray tube mounted on a rotatable gantry opposite a detector array across an examination region. The rotatable gantry and hence the x-ray tube rotate around the examination region.
- the x-ray tube is configured to emit radiation that traverses the examination region and is detected by the detector array.
- the detector array in response, generates and outputs projection data indicative of the detected radiation.
- the projection data is reconstructed to generate volumetric image data.
- the volumetric image data includes voxels represented as gray scale intensity values corresponding to relative radiodensity.
- the gray scale values generally reflect the attenuation characteristics of the scanned subject and show structure such as anatomical structures within the scanned subject. Since the absorption of a photon by a material is dependent on the energy of the photon traversing the material, the detected radiation also includes spectral information, which provides additional information indicative of the elemental or material composition (e.g., atomic number) of the scanned material of the subject and/or object. Unfortunately, with a not-spectral CT scanner, the projection data output by the detector array is proportional to the energy fluence integrated over the energy spectrum and thus does not reflect the spectral characteristics.
- a CT scanner configured for spectral (multi-energy) imaging captures the above-noted spectral characteristics.
- a CT scanner configured as such generates at least two attenuation values respectively corresponding to at least two different photon energy ranges.
- Such a scanner may include two or more x-ray tubes configured to emit radiation having different mean spectrums, a single x-ray tube configured to be controllably switched between at least two different emission voltages (e.g., 80kVp and 140 kVp) during scanning, and/or a single broad spectrum x-ray tube and an energy-resolving detector array with energy-resolving detectors (e.g., with photon counting detectors, at least two sets of scintillators with different spectral sensitivities or responses, etc.) and discrimination electronics.
- Coronary artery disease can result in response to plaque building up on the inner walls of the arteries of the heart.
- Complications from CAD may include luminal narrowing (stenosis) or occlusion of the coronary arteries, which reduces blood flow to the heart, rupturing of vulnerable plaque, etc.
- luminal narrowing stenosis
- occlusion of the coronary arteries
- the decision to perform coronary revascularization is best informed by delineating objective evidence of inducible myocardial ischemia.
- a current major determinant for revascularization in CAD patients suffering from chest pain is the percentage of luminal narrowing of the coronary vessel.
- the stenosis percentage measurement may not be enough to provide sufficiently clear information for determining whether to perform coronary revascularization.
- Fractional flow reserve is the ratio of maximal, hyperemic, myocardial blood flow through a diseased artery to the blood flow in the hypothetical case of a normal artery. FFR is measured by the ratio between the pressure after and the pressure before a stenosis in a cardiac catheterization laboratory procedure.
- the literature states that in the FAME (Fractional Flow Reserve Versus Angiography for Multivessel Evaluation) study of 1,005 patients with multivessel CAD, FFR-guided revascularization, specifically reserving revascularization for ischemic lesions with an FFR ⁇ 0.8, was associated with significantly lower rates of adverse events and placement of fewer coronary stents compared to patients undergoing an angiographically guided strategy.
- Acute coronary syndrome refers to a group of symptoms attributed to obstruction of the coronary arteries.
- a clinical challenge for cardiologists is the detection and prevention of ACS such as acute myocardial infarction.
- Histo-pathological studies have shown that the cause of sudden death from acute coronary syndromes is the presence of ruptured plaques. Therefore, an effort has been made for identifying profiles of atherosclerotic lesions that are prone to rupture. Based on autopsy studies, the majority of culprit lesions are typically non-stenotic, contain a large necrotic core with a thin overlying fibrous cap, and induce expansive remodeling of the vascular segment.
- Multi-slice computed tomography enables detection of atherosclerotic plaque and assessment of its composition and mechanical properties.
- cardiac CT may provide an effective means of detecting and preventing ACS's.
- accurate characterization of plaque using MSCT is still a challenge.
- One limitation is the blooming artifact resulting from hyper-dense objects such as calcified plaque. Calcium blooming results primarily from the limited spatial resolution of the CT system and from beam-hardening effect. This blurring effect results in an over-representation of the calcified regions and, correspondingly, under-estimation of other plaque components.
- US 2009/0161939 A1 concerns a technique for extracting one or more features of interest from one or more projection images.
- WO 2013/011418 A2 concerns the generation of virtual contrast enhanced images by incorporating a simulated partial volume effect into intermediate virtual contrast enhanced images.
- US 2012/0308106 A1 discusses a method and apparatus for measuring the activity of a tracer.
- CT-FFR CT fractional flow reserve analysis
- the invention may take form in various components and arrangements of components, and in various steps and arrangements of steps.
- the drawings are only for purposes of illustrating the preferred embodiments and are not to be construed as limiting the invention.
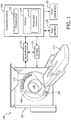
- an imaging system 100 such as a computed tomography (CT) scanner is illustrated.
- the illustrated imaging system 100 is configured for spectral imaging.
- Spectral imaging refers to the imaging system 100 generating at least two attenuation values respectively corresponding to at least two different predetermined energy ranges.
- the imaging system 100 includes a generally stationary gantry 102 and a rotating gantry 104, which is rotatably supported by the stationary gantry 102 and rotates around an examination region 106 about a z-axis.
- a radiation source 108 such as an x-ray tube, is rotatably supported by the rotating gantry 104 and rotates with the rotating gantry 104 and emits poly-energetic radiation that traverses the examination region 106.
- the radiation source 108 includes a single broad spectrum tube.
- the radiation source 108 is configured to be controllably switched between at least two different emission voltages (e.g., 80 kVp, 140 kVp, etc.) during scanning. The switching may be within an integration period, alternating between integration periods, between scans (e.g., a dual-spin scan in which a different kV is used for each successive scan), etc.
- the radiation source 108 includes at least two tubes configured to emit radiation with different mean energy spectrums. Another variation includes a combination of the above.
- a radiation sensitive detector array 110 subtends an angular arc opposite the radiation source 108 across the examination region 106.
- the radiation sensitive detector array 110 includes one or more rows of detectors, arranged parallel to each other along the z-axis.
- the radiation sensitive detector array 110 detects radiation traversing the examination region 106 and generates spectral projection data indicative thereof. Again, such projection data includes at least two attenuation values respectively corresponding to at least two different predetermined energy ranges and/or weights.
- the radiation sensitive detector array 110 includes an energy resolving detector array, such as a multi-energy integrating detector with at least two scintillators having different x-ray energy sensitivities and at least two corresponding photosensors having corresponding optical sensitivities, a photon counting detector with a direct conversion material (e.g., CdTe, CdZnTe, etc.), and/or other energy resolving detector.
- the radiation sensitive detector array 110 includes two different detection arrays corresponding to optional two different x-ray tubes at 108.
- a reconstructor 112 reconstructs the spectral projection data output by the radiation sensitive detector array 110. This includes, for example, reconstructing the energy dependent components and generating one or more spectral images, each corresponding to a different energy value or range. The reconstructor 112 may also combine the energy dependent components and generate non-spectral image data.
- a subject support 114 such as a couch supports a subject or an object in the examination region 106.
- An operator console 116 includes a human readable output device such as a monitor and an input device such as a keyboard, mouse, etc.
- Software resident on the console 118 allows the operator to interact with and/or operate the imaging system 100, via a graphical user interface (GUI) or otherwise, for spectral imaging.
- GUI graphical user interface
- a computing system 120 includes at least one microprocessor 122 and a computer readable storage medium ("memory") 124.
- the memory 124 excludes transitory medium and includes physical memory and/or other non-transitory storage medium.
- the microprocessor 122 executes at least an image data processor 126 instruction(s) stored in the memory 124.
- the microprocessor 122 may also execute a computer readable instruction carried by a carrier wave, a signal or other transitory medium.
- the computing system 120 can be part of the console 118 and/or separate therefrom, as illustrated in FIGURE 1 .
- the image data processor 126 instruction(s) includes an instruction(s) for processing at least contrast enhanced spectral image data.
- the image data processing instruction(s) includes instructions which process the contrast enhanced spectral image data in connection with segmenting tissue of interest represented in the contrast enhanced spectral image data.
- the image data processor 126 provides accurate segmentation of the geometry, including in constricted (e.g., stenotic) regions.
- the instructions may also include instructions for other processing, that utilizes the segmentation.
- the contrast enhanced spectral image data can be generated by and/or from the imaging system 100 and/or other imaging system.
- the spectral image data may alternatively be from a data repository 128 such as a picture archiving and communication system (PACS), an electronic medical record (EMR), a radiology information system (RIS), a hospital information system (HIS), and/or other data repository.
- PACS picture archiving and communication system
- EMR electronic medical record
- RIS radiology information system
- HIS hospital information system
- the segmentation and/or results of the other processing can be stored in the console 116, the data repository 128, and/or other storage device, be conveyed to another apparatus 130, etc.
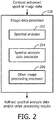
- FIGURE 2 schematically illustrates an example of the image data processor 126.
- the image data processor 126 receives, as input, contrast enhanced spectral image data.
- the received contrast enhanced spectral image data includes cardiac spectral contrast-enhanced CT image data.
- the image data processor 126 instruction(s) includes an instruction(s) for a spectral analyzer 202.
- the spectral analyzer 202 processes the received spectral contrast-enhanced CT scan image data, producing one or more sets of initial spectral analysis data. Such a spectral analysis can be performed on the entire scanned volume or a sub-volume thereof.
- the spectral analyzer 202 can use known and/or other spectral analysis techniques to process the received spectral contrast-enhanced CT scan image data.
- Such techniques include generating volumetric image data sets corresponding to a quantitative contrast agent (e.g., iodine, gadolinium, etc.) map, generating volumetric image data sets corresponding to virtual non-contrast (VNC) data, virtual un-enhanced data, iodine/calcium separation, and/or other material analyses and/or identification.
- a quantitative contrast agent e.g., iodine, gadolinium, etc.
- VNC virtual non-contrast
- the spectral analyzer 126 is omitted, and the image data processor 126 receives the spectral analysis data, which is generated by a different apparatus.
- the spectral analysis data may be susceptible to image quality degradation, including in constricted regions of a tubular structure, for example, due the limited resolution in cardiac CT images, the partial volume effect of the contrast agent with other biological materials such as calcifications and other plaque, blooming artifact resulting from hyper-dense objects such as calcified plaque, etc.
- the image data processor 126 instruction(s) includes an instruction(s) for a spectral analysis data processor 204.
- the spectral analysis data processor 204 updates and refines the spectral analysis data. This includes, in one instance, for each iteration, updating the spectral analysis data based at least on a contrast agent spectral response curve and a most likely tissue type for each pixel or voxel of the spectral analysis data, and calculating a relative contrast agent within each pixel, which provides an updated value for each pixel.
- the updated spectral analysis data of the last iteration provides the refined spectral analysis data.
- the image data processor 126 instruction(s) includes an instruction(s) for an other image processing processor 206.
- the other image data processing processor utilizes the refined spectral analysis data in connection with other image data processing.
- the refined spectral analysis data includes a segmentation of a coronary artery lumen
- examples of the other image data processing algorithm(s) may include a CT reserve analysis (CT-FFR) algorithm, an Acute Coronary Syndrome (ACS) risk assessment algorithm, and/or other algorithm.
- CT-FFR CT reserve analysis
- ACS Acute Coronary Syndrome
- the refined spectral analysis data can improve a CT fractional flow reserve analysis (CT-FFR) and/or an Acute Coronary Syndrome (ACS) risk assessment.
- CT-FFR CT fractional flow reserve analysis
- ACS Acute Coronary Syndrome
- the refined segmentation can improve the accuracy of the segmentation of the lumen, which can improve the accuracy of the CT-FFR.
- the refined segmentation can mitigate the blurring effect associated with conventional imaging, allowing for more accurate quantification and characterization of plaque components for ACS risk estimation.
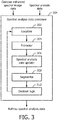
- FIGURE 3 schematically illustrates an example of the spectral analysis data processor 204.
- the spectral analysis data processor 204 receives, as input, the contrast enhanced spectral image data and the initial spectral analysis data generated by the spectral analyzer 202.
- the initial spectral analysis data includes at least a contrast agent map such as an iodine map where the contrast agent is iodine.
- the contrast agent map can be based on other contrast agents comprising high attenuation materials such as gadolinium, bismuth, gold and others.
- the spectral analysis data processor 204 includes a localizer 302.
- the localizer 302 receives, as input, the initial spectral analysis data (for the first iteration) and updated spectral analysis data (from each subsequent iteration).
- the localizer 302 localizes the coronary arteries and/or other structure in the (initial or updated) spectral analysis data.
- Known and/or other, automatic (with no user interaction) and/or manual (with user interaction), approaches can be used.
- the spectral analysis data processor 204 further includes an extractor 304.
- the extractor 304 receives, as input, the spectral analysis data with the localized the coronary arteries.
- the extractor 304 extracts a center-line for each coronary artery and/or other structure in the spectral analysis data.
- Known and/or other, automatic (with no user interaction) and/or manual (with user interaction), approaches can be used.
- the spectral analysis data processor 204 further includes a spectral analysis data updater 306.
- the spectral analysis data updater 306 receives, as input, the spectral analysis data, the localized the coronary arteries, and the extracted center line.
- the spectral analysis data updater 306 updates the spectral analysis data. As briefly discussed above and as discussed in greater detail below, this include updating the spectral analysis data based on a contrast agent spectral response along the center line and a most likely tissue type for each voxel, which are used to calculate a relative contrast agent within each voxel.
- the spectral analysis data processor 204 further includes a segmentor 308.
- the segmentor 308 receives, as input, the updated spectral analysis data.
- the segmentor 308 segments structure of interest from the updated spectral analysis data.
- Known and/or other segmentation approaches can be used. With one approach, a set of contours is applied over the spectral analysis data, which is initialized as a surface surrounding the estimated centerline. The contour can be based on a Chan-Vese minimal variance and geodesic surface models.
- the segmentor 308 can utilize the above and/or other approaches to segment the coronary artery lumen.
- the segmentor 308, for example, can also identify and segment plaque and/or other tissue shapes of the artery walls. This can be achieved using virtual non-contrasted (VNC) image data, where the contrast agent enhancement is removed from the contrast enhanced image data.
- VNC virtual non-contrasted
- the segmentor 308 can also improve lumen boundary estimation.
- the spectral analysis image data and segmentation provides the mapping of the relative amount of contrast agent in each voxel in the artery.
- the relative amount can be different than 100 % or 0 % in the vicinity of the artery walls due to the partial volume effect and the limited spatial resolution.
- Several models can be used to estimate sharper walls and even further improved lumen segmentation.
- the spectral analysis data processor 204 further includes decision logic 310.
- the decision logic 310 determines whether another iteration is to be performed based on stopping criteria. For example, the decision logic 310 invokes another iteration in response to the updated spectral analysis data not satisfying the stopping criteria. Otherwise, no more iterations are performed, and the updated spectral analysis data is output as the refined spectral analysis data.
- the stopping criteria can be determined by selecting an empirical number of iterations, checking changes between successive iterations until it is sufficiently small, comparing a global figure of merit against a pre-defined threshold, and/or other approach.
- the approach can be extended to improve narrow blood vessel segmentation in other organs such as brain, carotids, liver, lungs and others.
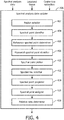
- FIGURE 4 schematically illustrates an example of the spectral analysis data updater 306.
- the spectral analysis data updater 306 receives, as input, the spectral analysis data, the localized coronary arteries, and the extracted center line.
- the spectral analysis data includes a contrast agent map such as an iodine map.
- the spectral analysis data updater 306 includes a region selector 402.
- the region selector 402 selects, using an automatic and/or manual approach, two or more regions along the coronary artery in the spectral analysis data.
- a selected region corresponds to a region of a tubular structure with a relatively wide cross-section. This can be determined based on a pre-determined minimal diameter threshold and/or otherwise.
- the regions provide artery sections where the lumen center has no or little partial volume or spatial resolution overlap with the walls.
- the contrast agent quantification can be determined accurately using the input spectral analysis image data.
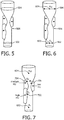
- FIGURE 5 shows selection of two regions, 502 and 504.
- the two regions 502 and 504 respectively correspond to a region before a stenosis 506 and a region after the stenosis 506. In another embodiment, more than two regions are selected.
- the regions can include and/or be different from regions 502 and 504.
- the spectral analysis data updater 306 further includes a spectral point identifier 404.
- the term spectral point refers to the set of values of the different spectral images corresponding to a single pixel or voxel in the imaged volume. For instance, a spectral point can be represented as a point in the diagrams in FIGURES 8-10 , which are discussed below.
- the spectral point identifier 404 identifies, for the selected regions 502 and 504, a spectral point for each of the selected regions 502 and 504.
- FIGURE 6 illustrates two points (A L ) 602 and (A U ) 604, respectively for the two regions 502 and 504 of FIGURE 5 .
- the spectral analysis data updater 306 further includes a reference spectral point determiner 406.
- the reference spectral point determiner 404 determines, from the spectral points 602 and 604 identified in spectral analysis data of FIGURE 5 , a reference spectral point.
- the reference spectral point determiner 404 generates an interpolated spectral response line (e.g., (A U + A L ) / 2) along the center-line. This includes narrow regions which may have partial volume and overlap with the walls, where contrast quantification may not be accurately determined only from the local data.
- the spectral analysis data updater 306 further includes a measured spectral point identifier 408.
- the measured spectral point identifier 408 identifies measured spectral points of interest within the spectral image data.
- FIGURE 7 shows a plurality of example measured spectral points of interests (B 1 ) 702, (B 2 ) 704 and (B 3 ) 706.
- the measured spectral points of interests (B 1 ) 702 is adjacent to a material with a high attenuation value (represented in terms of Hounsfield Unit in FIGURE 7 ).
- the measured spectral points of interests (B 2 ) 704 is adjacent to a material with a medium attenuation value.
- the measured spectral points of interests (B 3 ) 706 is adjacent to a material with a low attenuation value.
- the high attenuation value can be caused by calcium or by a plaque-targeted contrast agent which is different than the contrast agent in the vessel lumen
- the medium attenuation value can be caused by a soft tissue
- the low attenuation value can be caused by lipids.
- the spectral analysis data updater 306 further includes a spectral point plotter 410.
- the spectral point plotter 410 plots the reference and the measured spectral points on an energy spectral graph.
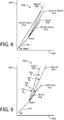
- An example of a dual energy low energy - high energy graph is shown in FIGURE 8 .
- a graph 800 includes a first axis 802, which represents the attenuation of a pixel in a first higher energy image of the spectral image data, and a second axis 804, which represents the attenuation of the same pixel in a second lower energy image of the spectral image data.
- the low energy and the high energy axes are in terms of Hounsfield units (HUs).
- the low energy and the high energy axes may be in terms of other units and can represent values such as photoelectric compton-scattering decomposition, virtual monochromatic images, or material basis representation.
- a first spectral curve 806 represents a blood-water curve
- a second spectral curve 808 represents a calcium-water curve
- a third spectral curve 810 represents a calcium/fibrotic-water curve
- a fourth spectral curve 812 represents a fibrotic tissue-water curve
- a fifth curve 814 represents a fat,lipids-water spectral curve
- a sixth curve 816 represents a calcium/lipids-water curve.
- the particular curves of such a graph can be different and represent the tissue of interest.
- the graph 800 is for two energies, it is to be understood that more than two energies can be considered.
- N energies (where N is a positive integer) can be considered.
- the graph 800 can include a N-dimensional (N-D) graph.
- FIGURE 9 shows a dual (low and high) energy graph 900 in connection with the spectral points of FIGURE 7 .
- a first axis 902 represents the attenuation of a pixel in a higher energy image and a second axis 904 represents the attenuation of the same pixel in a lower energy image.
- a first spectral curve 906 represents an iodine-water curve
- a second spectral curve 908 represents a calcium-water curve
- a third spectral curve 910 represents a blood-water curve
- a fourth spectral curve 912 represents a soft tissue-water curve
- a fifth curve 914 represents a fat-water spectral curve.
- An iodine-blood spectral point (A) 916 represents a reference spectral point.
- the spectral points B 1 , B 2 , and B 3 correspond to the measured spectral points of interests (B 1 ) 702, (B 2 ) 704 and (B 3 ) 706 of FIGURE 7 .
- the spectral analysis data updater 306 further includes a spectral line selector 412.
- the spectral line selector 412 selects, for each pixel, a spectral line corresponding to a most probable tissue type for the pixel. This, in one instance, can be done based on a virtual non-contrast image and a model.
- the virtual non-contrast image provides data in which it is easier to determine automatically if calcium is involved or not in a certain region.
- the spectral analysis data updater 306 further includes a spectral point projector 414.
- the spectral point projector 414 projects, for each pixel, the spectral points. In one instance, for this, the spectral point projector 414 projects a line from the reference spectral point (A) 916, through each of the measured points (B 1 ) 702, (B 2 ) 704 and (B 3 ) 706, to the corresponding selected spectral curve. This is shown in FIGURE 10 , which shows lines 1002, 1004, 1006 projected from the reference spectral point (A) 916, through the measured points (B 1 ) 702, (B 2 ) 704 and (B 3 ) 706 to the selected curves 908, 912, and 914.
- the spectral analysis data updater 306 further includes a spectral point assigner 416.
- the spectral point assigner 416 assigns, for each pixel, a point on the selected curve where the projected line intersects. This is also shown in FIGURE 10 , where the spectral line assigner 416 assigns points (C 1 ) 1008, (C 2 ) 1010 and (C 3 ) 1012 based on the projections 1002, 1004, 1006 from the reference spectral point (A) 916, through of the measured points (B 1 ) 702, (B 2 ) 704 and (B 3 ) 706 to the selected curves 908, 912, and 914.
- the spectral point (B 1 ) 702 projected onto the calcium (bone) - water line 908.
- the spectral point (B 1 ) 702 can be projected onto blood-water line 910, the soft tissue-water line 912, and/or other spectral response line.
- the spectral analysis data updater 306 further includes a relative ratio determiner 418.
- the spectral image data updater 306 outputs the relative contrast agent-in-blood values as the updated spectral analysis image data.
- the decision logic 310 determines whether another iteration is performed or the updated spectral analysis data is output as the refined spectral analysis data.
- the refined spectral analysis data can be utilized in connection with other processing such as CT-FFR, ACS risk assessment, etc.
- FIGURE 11 illustrates an example method in accordance with the embodiments described herein.
- contrast enhanced spectral image data which includes image data with voxels representing a tubular, is obtained.
- At 1104 at least a contrast map is generated from the contrast enhanced spectral image data. This may be achieved using a model. Other information such as iodine/calcium separation, a VNC image, etc. may also be generated.
- the tubular structure is localized and center-lines of the localized tubular structure is extracted. For the first iteration, this is based on the initial iodine map. In subsequent iterations, this is based on the most recent updated iodine map.
- the contrast map is updated based on the localized tubular structure, the extracted center-lines, and a multi-energy graph model.
- the updated contrast map can be used to identify partial iodine in partial volume regions, provide an analysis of material build up and tubular structure walls, and refine VNC images.
- the tubular structure is segmented based on the updated contrast map and a tubular structure segmentation model.
- This may include lumen segmentation using active-contour functional applied on the refined contrast map, improved lumen boundary estimation based on the refined contrast map and the material analysis, a correction model for partial volume and limited resolution effects, plaque region localization for segmentation, etc.
- stopping criteria include an empirical number of iterations, a difference between results of successive iterations, comparison with a global figure of merit against, and/or other approach.
- the stopping criteria has not been satisfied, then acts 1106 to 1110 are repeated. However, if the stopping criteria has been satisfied, then at 1114 the refined contrast map is output. As discussed herein, the refined contrast map can be used in connection with other processing of the image.
- the above may be implemented by way of computer readable instructions, encoded or embedded on computer readable storage medium, which, when executed by a computer processor(s), cause the processor(s) to carry out the described acts. Additionally or alternatively, at least one of the computer readable instructions is carried by a signal, carrier wave or other transitory medium.
Description
- The following generally relates to spectral image data processing and is described with particular application to computed tomography (CT). However, the following is also amenable to other imaging modalities.
- Computed tomography (CT) is a non-invasive imaging procedure. A CT scanner generally includes an x-ray tube mounted on a rotatable gantry opposite a detector array across an examination region. The rotatable gantry and hence the x-ray tube rotate around the examination region. The x-ray tube is configured to emit radiation that traverses the examination region and is detected by the detector array. The detector array, in response, generates and outputs projection data indicative of the detected radiation. The projection data is reconstructed to generate volumetric image data. The volumetric image data includes voxels represented as gray scale intensity values corresponding to relative radiodensity.
- The gray scale values generally reflect the attenuation characteristics of the scanned subject and show structure such as anatomical structures within the scanned subject. Since the absorption of a photon by a material is dependent on the energy of the photon traversing the material, the detected radiation also includes spectral information, which provides additional information indicative of the elemental or material composition (e.g., atomic number) of the scanned material of the subject and/or object. Unfortunately, with a not-spectral CT scanner, the projection data output by the detector array is proportional to the energy fluence integrated over the energy spectrum and thus does not reflect the spectral characteristics.
- A CT scanner configured for spectral (multi-energy) imaging captures the above-noted spectral characteristics. Generally, a CT scanner configured as such generates at least two attenuation values respectively corresponding to at least two different photon energy ranges. Such a scanner may include two or more x-ray tubes configured to emit radiation having different mean spectrums, a single x-ray tube configured to be controllably switched between at least two different emission voltages (e.g., 80kVp and 140 kVp) during scanning, and/or a single broad spectrum x-ray tube and an energy-resolving detector array with energy-resolving detectors (e.g., with photon counting detectors, at least two sets of scintillators with different spectral sensitivities or responses, etc.) and discrimination electronics.
- Coronary artery disease (CAD) can result in response to plaque building up on the inner walls of the arteries of the heart. Complications from CAD may include luminal narrowing (stenosis) or occlusion of the coronary arteries, which reduces blood flow to the heart, rupturing of vulnerable plaque, etc. The decision to perform coronary revascularization is best informed by delineating objective evidence of inducible myocardial ischemia. A current major determinant for revascularization in CAD patients suffering from chest pain is the percentage of luminal narrowing of the coronary vessel. Unfortunately, the stenosis percentage measurement may not be enough to provide sufficiently clear information for determining whether to perform coronary revascularization.
- Fractional flow reserve (FFR) is the ratio of maximal, hyperemic, myocardial blood flow through a diseased artery to the blood flow in the hypothetical case of a normal artery. FFR is measured by the ratio between the pressure after and the pressure before a stenosis in a cardiac catheterization laboratory procedure. The literature states that in the FAME (Fractional Flow Reserve Versus Angiography for Multivessel Evaluation) study of 1,005 patients with multivessel CAD, FFR-guided revascularization, specifically reserving revascularization for ischemic lesions with an FFR < 0.8, was associated with significantly lower rates of adverse events and placement of fewer coronary stents compared to patients undergoing an angiographically guided strategy.
- Recently, a method to estimate the FFR using computational fluid dynamics from multi-slice CT image data was proposed. An estimation of the FFR based on the CT studies enables to derive valuable functional diagnostic information for the physicians noninvasively. A necessary condition for estimating FFR from cardiac CT data is accurate segmentation of the lumen geometry, especially in stenotic regions. Unfortunately, the limited resolution in cardiac CT images and the partial volume effect of the contrast agent with other biological materials such as calcifications and other plaque components degrade the lumen segmentation quality.
- Acute coronary syndrome (ACS) refers to a group of symptoms attributed to obstruction of the coronary arteries. A clinical challenge for cardiologists is the detection and prevention of ACS such as acute myocardial infarction. Histo-pathological studies have shown that the cause of sudden death from acute coronary syndromes is the presence of ruptured plaques. Therefore, an effort has been made for identifying profiles of atherosclerotic lesions that are prone to rupture. Based on autopsy studies, the majority of culprit lesions are typically non-stenotic, contain a large necrotic core with a thin overlying fibrous cap, and induce expansive remodeling of the vascular segment.
- Multi-slice computed tomography (MSCT) enables detection of atherosclerotic plaque and assessment of its composition and mechanical properties. Thus, cardiac CT may provide an effective means of detecting and preventing ACS's. However, accurate characterization of plaque using MSCT is still a challenge. One limitation is the blooming artifact resulting from hyper-dense objects such as calcified plaque. Calcium blooming results primarily from the limited spatial resolution of the CT system and from beam-hardening effect. This blurring effect results in an over-representation of the calcified regions and, correspondingly, under-estimation of other plaque components.
-
US 2009/0161939 A1 concerns a technique for extracting one or more features of interest from one or more projection images. -
WO 2013/011418 A2 concerns the generation of virtual contrast enhanced images by incorporating a simulated partial volume effect into intermediate virtual contrast enhanced images. - The article "Evaluation of Computer-Assisted Quantification of Carotid Artery Stenosis" by Biermann et. al (J Digit Imaging (2012) 25:250-257, DOI 10.1007/s10278-011-9413-7 discusses a study intended to evaluate the influence of advanced software assistance on the assessment of carotid artery stenosis.
-
US 2012/0308106 A1 discusses a method and apparatus for measuring the activity of a tracer. - Aspects described herein address the above-referenced problems and others.
- The following describes an approach that improves tubular structure (e.g., the coronary artery lumen) segmentation using contrast enhanced spectral CT image data. This approach leverages a mutual relation between structure localization and segmentation and quantitative contrast-agent mapping by spectral analysis. Each of these can provide improved results by using the results of the other as prior information, and the approach alternates through one or more iterations, which can optimize the segmentation. The resulting segmentation can be used to improve at least CT fractional flow reserve analysis (CT-FFR) and Acute Coronary Syndrome risk assessment.
- According to the invention, a method, computing system, and computer readable medium are defined in the independent claims, to which the reader should now refer. Specific embodiments are defined in the dependent claims.
- The invention may take form in various components and arrangements of components, and in various steps and arrangements of steps. The drawings are only for purposes of illustrating the preferred embodiments and are not to be construed as limiting the invention.
-
FIGURE 1 schematically illustrates an example imaging system in connection with an image data processor. -
FIGURE 2 schematically illustrates an example of the image data processor, which includes a spectral analysis data processor. -
FIGURE 3 schematically illustrates an example of the spectral analysis data processor, which includes a spectral analysis data updater. -
FIGURE 4 schematically illustrates an example of the spectral analysis data updater. -
FIGURE 5 shows a sub-portion of a vessel with a stenosis in which regions are identified to determine reference spectral points to determine a reference contrast agent in blood spectral response curve. -
FIGURE 6 shows the sub-portion of the vessel ofFIGURE 5 in which the reference spectral points are identified for determining the reference contrast agent in blood spectral response curve. -
FIGURE 7 shows the sub-portion of the vessel ofFIGURE 5 in which measured spectral points are identified. -
FIGURE 8 shows an example spectral response graph with an example set of spectral response curves. -
FIGURE 9 shows an example spectral response graph that includes the reference and measured spectral response point ofFIGURE 7 and a set of spectral response curves. -
FIGURE 10 shows the example ofFIGURE 9 with lines projected from the spectral response point through the measured spectral response points to the spectral response curves. -
FIGURE 11 illustrates an example method in accordance with the embodiments described herein. - Initially referring to
FIGURE 1 , animaging system 100 such as a computed tomography (CT) scanner is illustrated. The illustratedimaging system 100 is configured for spectral imaging. Spectral imaging, as utilized herein, refers to theimaging system 100 generating at least two attenuation values respectively corresponding to at least two different predetermined energy ranges. Theimaging system 100 includes a generallystationary gantry 102 and arotating gantry 104, which is rotatably supported by thestationary gantry 102 and rotates around anexamination region 106 about a z-axis. - A
radiation source 108, such as an x-ray tube, is rotatably supported by therotating gantry 104 and rotates with therotating gantry 104 and emits poly-energetic radiation that traverses theexamination region 106. In one instance, theradiation source 108 includes a single broad spectrum tube. In a variation, theradiation source 108 is configured to be controllably switched between at least two different emission voltages (e.g., 80 kVp, 140 kVp, etc.) during scanning. The switching may be within an integration period, alternating between integration periods, between scans (e.g., a dual-spin scan in which a different kV is used for each successive scan), etc. In yet another variation, theradiation source 108 includes at least two tubes configured to emit radiation with different mean energy spectrums. Another variation includes a combination of the above. - A radiation
sensitive detector array 110 subtends an angular arc opposite theradiation source 108 across theexamination region 106. The radiationsensitive detector array 110 includes one or more rows of detectors, arranged parallel to each other along the z-axis. The radiationsensitive detector array 110 detects radiation traversing theexamination region 106 and generates spectral projection data indicative thereof. Again, such projection data includes at least two attenuation values respectively corresponding to at least two different predetermined energy ranges and/or weights. In one instance, the radiationsensitive detector array 110 includes an energy resolving detector array, such as a multi-energy integrating detector with at least two scintillators having different x-ray energy sensitivities and at least two corresponding photosensors having corresponding optical sensitivities, a photon counting detector with a direct conversion material (e.g., CdTe, CdZnTe, etc.), and/or other energy resolving detector. In a variation, the radiationsensitive detector array 110 includes two different detection arrays corresponding to optional two different x-ray tubes at 108. - A
reconstructor 112 reconstructs the spectral projection data output by the radiationsensitive detector array 110. This includes, for example, reconstructing the energy dependent components and generating one or more spectral images, each corresponding to a different energy value or range. Thereconstructor 112 may also combine the energy dependent components and generate non-spectral image data. Asubject support 114 such as a couch supports a subject or an object in theexamination region 106. Anoperator console 116 includes a human readable output device such as a monitor and an input device such as a keyboard, mouse, etc. Software resident on the console 118 allows the operator to interact with and/or operate theimaging system 100, via a graphical user interface (GUI) or otherwise, for spectral imaging. - A
computing system 120 includes at least onemicroprocessor 122 and a computer readable storage medium ("memory") 124. Thememory 124 excludes transitory medium and includes physical memory and/or other non-transitory storage medium. Themicroprocessor 122 executes at least animage data processor 126 instruction(s) stored in thememory 124. Themicroprocessor 122 may also execute a computer readable instruction carried by a carrier wave, a signal or other transitory medium. Thecomputing system 120 can be part of the console 118 and/or separate therefrom, as illustrated inFIGURE 1 . - The
image data processor 126 instruction(s) includes an instruction(s) for processing at least contrast enhanced spectral image data. As described in greater detail below, in one instance, the image data processing instruction(s) includes instructions which process the contrast enhanced spectral image data in connection with segmenting tissue of interest represented in the contrast enhanced spectral image data. With respect to tubular structure segmentation (e.g., the lumen of a vessel such as a coronary artery and/or other vessel, such as a vessel of the brain, carotids, liver, lungs, and/or other vessel.), theimage data processor 126 provides accurate segmentation of the geometry, including in constricted (e.g., stenotic) regions. As further described below, the instructions may also include instructions for other processing, that utilizes the segmentation. - The contrast enhanced spectral image data can be generated by and/or from the
imaging system 100 and/or other imaging system. The spectral image data may alternatively be from adata repository 128 such as a picture archiving and communication system (PACS), an electronic medical record (EMR), a radiology information system (RIS), a hospital information system (HIS), and/or other data repository. The segmentation and/or results of the other processing can be stored in theconsole 116, thedata repository 128, and/or other storage device, be conveyed to anotherapparatus 130, etc. -
FIGURE 2 schematically illustrates an example of theimage data processor 126. - The
image data processor 126 receives, as input, contrast enhanced spectral image data. In this example, the received contrast enhanced spectral image data includes cardiac spectral contrast-enhanced CT image data. - The
image data processor 126 instruction(s) includes an instruction(s) for aspectral analyzer 202. Thespectral analyzer 202 processes the received spectral contrast-enhanced CT scan image data, producing one or more sets of initial spectral analysis data. Such a spectral analysis can be performed on the entire scanned volume or a sub-volume thereof. Thespectral analyzer 202 can use known and/or other spectral analysis techniques to process the received spectral contrast-enhanced CT scan image data. - Such techniques include generating volumetric image data sets corresponding to a quantitative contrast agent (e.g., iodine, gadolinium, etc.) map, generating volumetric image data sets corresponding to virtual non-contrast (VNC) data, virtual un-enhanced data, iodine/calcium separation, and/or other material analyses and/or identification. An example technique is discussed in Thomas et al., "Automatic lumen segmentation in calcified plaques: dual-energy CT versus standard reconstructions in comparison with digital subtraction angiography," AJR (2010).
- In a variation, the
spectral analyzer 126 is omitted, and theimage data processor 126 receives the spectral analysis data, which is generated by a different apparatus. The spectral analysis data, as discussed herein, may be susceptible to image quality degradation, including in constricted regions of a tubular structure, for example, due the limited resolution in cardiac CT images, the partial volume effect of the contrast agent with other biological materials such as calcifications and other plaque, blooming artifact resulting from hyper-dense objects such as calcified plaque, etc. - The
image data processor 126 instruction(s) includes an instruction(s) for a spectralanalysis data processor 204. As described in greater detail below, the spectralanalysis data processor 204, through an iterative process, updates and refines the spectral analysis data. This includes, in one instance, for each iteration, updating the spectral analysis data based at least on a contrast agent spectral response curve and a most likely tissue type for each pixel or voxel of the spectral analysis data, and calculating a relative contrast agent within each pixel, which provides an updated value for each pixel. The updated spectral analysis data of the last iteration provides the refined spectral analysis data. - The
image data processor 126 instruction(s) includes an instruction(s) for an otherimage processing processor 206. The other image data processing processor utilizes the refined spectral analysis data in connection with other image data processing. For example, where the refined spectral analysis data includes a segmentation of a coronary artery lumen, examples of the other image data processing algorithm(s) may include a CT reserve analysis (CT-FFR) algorithm, an Acute Coronary Syndrome (ACS) risk assessment algorithm, and/or other algorithm. - The refined spectral analysis data can improve a CT fractional flow reserve analysis (CT-FFR) and/or an Acute Coronary Syndrome (ACS) risk assessment. For example, the refined segmentation can improve the accuracy of the segmentation of the lumen, which can improve the accuracy of the CT-FFR. In another example, the refined segmentation can mitigate the blurring effect associated with conventional imaging, allowing for more accurate quantification and characterization of plaque components for ACS risk estimation.
-
FIGURE 3 schematically illustrates an example of the spectralanalysis data processor 204. - For explanatory purposes, the following is described in connection with coronary artery segmentation. However, it is to be understood that this example is not limiting and that other structure is also contemplated herein. For example, the following can be utilized with any tubular structure, anatomical (e.g., such as vessels) and/or non-anatomical.
- The spectral
analysis data processor 204 receives, as input, the contrast enhanced spectral image data and the initial spectral analysis data generated by thespectral analyzer 202. In this example, the initial spectral analysis data includes at least a contrast agent map such as an iodine map where the contrast agent is iodine. In a variation, the contrast agent map can be based on other contrast agents comprising high attenuation materials such as gadolinium, bismuth, gold and others. - The spectral
analysis data processor 204 includes alocalizer 302. Thelocalizer 302 receives, as input, the initial spectral analysis data (for the first iteration) and updated spectral analysis data (from each subsequent iteration). Thelocalizer 302 localizes the coronary arteries and/or other structure in the (initial or updated) spectral analysis data. Known and/or other, automatic (with no user interaction) and/or manual (with user interaction), approaches can be used. - The spectral
analysis data processor 204 further includes anextractor 304. Theextractor 304 receives, as input, the spectral analysis data with the localized the coronary arteries. Theextractor 304 extracts a center-line for each coronary artery and/or other structure in the spectral analysis data. Known and/or other, automatic (with no user interaction) and/or manual (with user interaction), approaches can be used. - The spectral
analysis data processor 204 further includes a spectralanalysis data updater 306. The spectralanalysis data updater 306 receives, as input, the spectral analysis data, the localized the coronary arteries, and the extracted center line. The spectral analysis data updater 306 updates the spectral analysis data. As briefly discussed above and as discussed in greater detail below, this include updating the spectral analysis data based on a contrast agent spectral response along the center line and a most likely tissue type for each voxel, which are used to calculate a relative contrast agent within each voxel. - The spectral
analysis data processor 204 further includes asegmentor 308. Thesegmentor 308 receives, as input, the updated spectral analysis data. The segmentor 308 segments structure of interest from the updated spectral analysis data. Known and/or other segmentation approaches can be used. With one approach, a set of contours is applied over the spectral analysis data, which is initialized as a surface surrounding the estimated centerline. The contour can be based on a Chan-Vese minimal variance and geodesic surface models. - The above discussed approach is discussed in greater detail in Holtzman-Gazit et al., "Segmentation of thin structures in volumetric medical images," Image Processing, IEEE Transactions on 15.2 (2006): 354-363. Another approach is described in Lesage et al., "A review of 3D vessel lumen segmentation techniques: Models, features and extraction schemes," Medical image analysis 13.6 (2009): 819-845. Other approaches are also contemplated herein. From these approaches, an accurate segmentation of the coronary lumen can be achieved.
- For coronary artery segmentation, the
segmentor 308 can utilize the above and/or other approaches to segment the coronary artery lumen. Thesegmentor 308, for example, can also identify and segment plaque and/or other tissue shapes of the artery walls. This can be achieved using virtual non-contrasted (VNC) image data, where the contrast agent enhancement is removed from the contrast enhanced image data. - In one embodiment, the
segmentor 308 can also improve lumen boundary estimation. For example, the spectral analysis image data and segmentation provides the mapping of the relative amount of contrast agent in each voxel in the artery. The relative amount can be different than 100 % or 0 % in the vicinity of the artery walls due to the partial volume effect and the limited spatial resolution. Several models can be used to estimate sharper walls and even further improved lumen segmentation. - One approach uses prior knowledge (usually by calibration) of smeared shapes of known tubes. This approach has been used for lung airway lumen and wall measurements. An example of this approach is discussed in Saba et al., "Maximizing quantitative accuracy of lung airway lumen and wall measure obtained from X-ray CT imaging," J. Appl. Physiol. (2003). Another technique applies a 3D de-convolution using a known 3D point-spread function corresponding to the imaging protocol and parameters.
- The spectral
analysis data processor 204 further includesdecision logic 310. Thedecision logic 310 determines whether another iteration is to be performed based on stopping criteria. For example, thedecision logic 310 invokes another iteration in response to the updated spectral analysis data not satisfying the stopping criteria. Otherwise, no more iterations are performed, and the updated spectral analysis data is output as the refined spectral analysis data. - The stopping criteria can be determined by selecting an empirical number of iterations, checking changes between successive iterations until it is sufficiently small, comparing a global figure of merit against a pre-defined threshold, and/or other approach. For other clinical applications, the approach can be extended to improve narrow blood vessel segmentation in other organs such as brain, carotids, liver, lungs and others.
-
FIGURE 4 schematically illustrates an example of the spectralanalysis data updater 306. - For explanatory purposes, the following is described in connection with the coronary artery segmentation discussed in
FIGURE 3 . Similarly, it is to be understood that this example is not limiting and that other tissue is also contemplated herein. - The spectral
analysis data updater 306 receives, as input, the spectral analysis data, the localized coronary arteries, and the extracted center line. In this example, similar toFIGURE 2 , the spectral analysis data includes a contrast agent map such as an iodine map. - The spectral
analysis data updater 306 includes aregion selector 402. Theregion selector 402 selects, using an automatic and/or manual approach, two or more regions along the coronary artery in the spectral analysis data. Generally, a selected region corresponds to a region of a tubular structure with a relatively wide cross-section. This can be determined based on a pre-determined minimal diameter threshold and/or otherwise. - In this example, the regions provide artery sections where the lumen center has no or little partial volume or spatial resolution overlap with the walls. In these regions, the contrast agent quantification can be determined accurately using the input spectral analysis image data.
FIGURE 5 shows selection of two regions, 502 and 504. The tworegions stenosis 506 and a region after thestenosis 506. In another embodiment, more than two regions are selected. Furthermore, the regions can include and/or be different fromregions - Returning to
FIGURE 4 , the spectral analysis data updater 306 further includes aspectral point identifier 404. The term spectral point refers to the set of values of the different spectral images corresponding to a single pixel or voxel in the imaged volume. For instance, a spectral point can be represented as a point in the diagrams inFIGURES 8-10 , which are discussed below. Thespectral point identifier 404 identifies, for the selectedregions regions FIGURE 6 illustrates two points (AL) 602 and (AU) 604, respectively for the tworegions FIGURE 5 . - Returning to
FIGURE 4 , the spectral analysis data updater 306 further includes a referencespectral point determiner 406. The referencespectral point determiner 404 determines, from thespectral points FIGURE 5 , a reference spectral point. In one instance, the referencespectral point determiner 404 generates an interpolated spectral response line (e.g., (AU+ AL) / 2) along the center-line. This includes narrow regions which may have partial volume and overlap with the walls, where contrast quantification may not be accurately determined only from the local data. - The spectral analysis data updater 306 further includes a measured
spectral point identifier 408. The measuredspectral point identifier 408 identifies measured spectral points of interest within the spectral image data.FIGURE 7 shows a plurality of example measured spectral points of interests (B1) 702, (B2) 704 and (B3) 706. InFIGURE 7 , the measured spectral points of interests (B1) 702 is adjacent to a material with a high attenuation value (represented in terms of Hounsfield Unit inFIGURE 7 ). The measured spectral points of interests (B2) 704 is adjacent to a material with a medium attenuation value. The measured spectral points of interests (B3) 706 is adjacent to a material with a low attenuation value. For example, the high attenuation value can be caused by calcium or by a plaque-targeted contrast agent which is different than the contrast agent in the vessel lumen, the medium attenuation value can be caused by a soft tissue, and the low attenuation value can be caused by lipids. - The spectral analysis data updater 306 further includes a
spectral point plotter 410. Thespectral point plotter 410 plots the reference and the measured spectral points on an energy spectral graph. An example of a dual energy low energy - high energy graph is shown inFIGURE 8 . InFIGURE 8 , agraph 800 includes afirst axis 802, which represents the attenuation of a pixel in a first higher energy image of the spectral image data, and asecond axis 804, which represents the attenuation of the same pixel in a second lower energy image of the spectral image data. In this example, the low energy and the high energy axes are in terms of Hounsfield units (HUs). In another example, the low energy and the high energy axes may be in terms of other units and can represent values such as photoelectric compton-scattering decomposition, virtual monochromatic images, or material basis representation. - In
FIGURE 8 , a firstspectral curve 806 represents a blood-water curve, a secondspectral curve 808 represents a calcium-water curve, a thirdspectral curve 810 represents a calcium/fibrotic-water curve, a fourthspectral curve 812 represents a fibrotic tissue-water curve, afifth curve 814 represents a fat,lipids-water spectral curve, and asixth curve 816 represents a calcium/lipids-water curve. The particular curves of such a graph can be different and represent the tissue of interest. Although thegraph 800 is for two energies, it is to be understood that more than two energies can be considered. For example, N energies (where N is a positive integer) can be considered. In such an example, thegraph 800 can include a N-dimensional (N-D) graph. -
FIGURE 9 shows a dual (low and high)energy graph 900 in connection with the spectral points ofFIGURE 7 . InFIGURE 9 , afirst axis 902 represents the attenuation of a pixel in a higher energy image and asecond axis 904 represents the attenuation of the same pixel in a lower energy image. InFIGURE 9 , a firstspectral curve 906 represents an iodine-water curve, a secondspectral curve 908 represents a calcium-water curve, a thirdspectral curve 910 represents a blood-water curve, a fourthspectral curve 912 represents a soft tissue-water curve, and afifth curve 914 represents a fat-water spectral curve. An iodine-blood spectral point (A) 916 represents a reference spectral point. The spectral points B1, B2, and B3 correspond to the measured spectral points of interests (B1) 702, (B2) 704 and (B3) 706 ofFIGURE 7 . - Returning to
FIGURE 4 , the spectral analysis data updater 306 further includes aspectral line selector 412. Thespectral line selector 412 selects, for each pixel, a spectral line corresponding to a most probable tissue type for the pixel. This, in one instance, can be done based on a virtual non-contrast image and a model. The virtual non-contrast image provides data in which it is easier to determine automatically if calcium is involved or not in a certain region. - The spectral analysis data updater 306 further includes a
spectral point projector 414. Thespectral point projector 414 projects, for each pixel, the spectral points. In one instance, for this, thespectral point projector 414 projects a line from the reference spectral point (A) 916, through each of the measured points (B1) 702, (B2) 704 and (B3) 706, to the corresponding selected spectral curve. This is shown inFIGURE 10 , which showslines curves - Returning to
FIGURE 4 , the spectral analysis data updater 306 further includes aspectral point assigner 416. Thespectral point assigner 416 assigns, for each pixel, a point on the selected curve where the projected line intersects. This is also shown inFIGURE 10 , where thespectral line assigner 416 assigns points (C1) 1008, (C2) 1010 and (C3) 1012 based on theprojections curves water line 908. In another example, the spectral point (B1) 702 can be projected onto blood-water line 910, the soft tissue-water line 912, and/or other spectral response line. - Returning to
FIGURE 4 , the spectral analysis data updater 306 further includes arelative ratio determiner 418. Therelative ratio determiner 418 calculates a relative ratio R of contrast agent within a voxel (e.g., relative to the assumed contrast agent-in-blood value). In one instance the ratio is determined by: R=| B-C |/| A-C |, which is the ratio of the absolute distances, where A, B and C are vectors; each one comprises N elements, where N is the number of different spectral images in the analyzed data. The spectralimage data updater 306 outputs the relative contrast agent-in-blood values as the updated spectral analysis image data. - As discussed in connection with
FIGURE 3 , thedecision logic 310 determines whether another iteration is performed or the updated spectral analysis data is output as the refined spectral analysis data. As discussed in connection withFIGURE 2 , the refined spectral analysis data can be utilized in connection with other processing such as CT-FFR, ACS risk assessment, etc. -
FIGURE 11 illustrates an example method in accordance with the embodiments described herein. - It is to be appreciated that the ordering of the acts in the methods described herein is not limiting. As such, other orderings are contemplated herein. In addition, one or more acts may be omitted and/or one or more additional acts may be included.
- At 1102, contrast enhanced spectral image data, which includes image data with voxels representing a tubular, is obtained.
- At 1104, at least a contrast map is generated from the contrast enhanced spectral image data. This may be achieved using a model. Other information such as iodine/calcium separation, a VNC image, etc. may also be generated.
- At 1106, the tubular structure is localized and center-lines of the localized tubular structure is extracted. For the first iteration, this is based on the initial iodine map. In subsequent iterations, this is based on the most recent updated iodine map.
- At 1108, the contrast map is updated based on the localized tubular structure, the extracted center-lines, and a multi-energy graph model. The updated contrast map can be used to identify partial iodine in partial volume regions, provide an analysis of material build up and tubular structure walls, and refine VNC images.
- At 1110, the tubular structure is segmented based on the updated contrast map and a tubular structure segmentation model. This may include lumen segmentation using active-contour functional applied on the refined contrast map, improved lumen boundary estimation based on the refined contrast map and the material analysis, a correction model for partial volume and limited resolution effects, plaque region localization for segmentation, etc.
- At 1112, it is determined if stopping criteria has been satisfied. Examples of the stopping criteria include an empirical number of iterations, a difference between results of successive iterations, comparison with a global figure of merit against, and/or other approach.
- If the stopping criteria has not been satisfied, then acts 1106 to 1110 are repeated. However, if the stopping criteria has been satisfied, then at 1114 the refined contrast map is output. As discussed herein, the refined contrast map can be used in connection with other processing of the image.
- The above may be implemented by way of computer readable instructions, encoded or embedded on computer readable storage medium, which, when executed by a computer processor(s), cause the processor(s) to carry out the described acts. Additionally or alternatively, at least one of the computer readable instructions is carried by a signal, carrier wave or other transitory medium.
- The invention has been described with reference to the preferred embodiments. Modifications and alterations may occur to others upon reading and understanding the preceding detailed description. It is intended that the invention be constructed as including all such modifications and alterations insofar as they come within the scope of the appended claims.
Claims (8)
- A method for segmenting contrast-enhanced spectral CT image data of a tubular vessel structure, comprising:obtaining (202) contrast agent enhanced spectral image data that includes voxels representing a tubular structure, wherein the tubular structure is a vessel;generating (204) a contrast map based on the obtained contrast agent enhanced spectral image data;localizing (302) the tubular structure in the contrast map;extracting (304) a center-line of the localized tubular structure;selecting (402) two regions (502, 504) along the tubular structure corresponding to regions with a diameter greater than a pre-determined minimal diameter threshold; the method further comprises:identifying (404), for each of the selected regions along the center-line, a spectral point AL (602) and AU (604) respectively, wherein a spectral point refers to a set of values of different spectral images corresponding to a single voxel in an imaged volume;determining (406) a reference spectral point (916) based on the identified spectral points by means of averaging the set of values of different spectral images amongst the spectral points ((AU+ AL) / 2);identifying (408) measured spectral points of interest (702, 704, 706) within the spectral image data, the measured spectral points being adjacent to a material with a low, medium, or high attenuation value;plotting (410) the reference and the measured spectral points in a spectral model, wherein the spectral model is an energy spectral graph with spectral curves for a plurality of predetermined different types of material;selecting (412), for each identified measured spectral point of interest (702, 704, 706), a spectral curve corresponding to a most probable tissue type for the identified measured spectral point of interest;projecting (414), for each identified measured spectral point of interest (702, 704, 706), a line from the determined reference spectral point (916), through the identified measured spectral point of interest (702, 704, or 706), to the corresponding selected spectral curve (908, 912, or 914, respectively);assigning (416), for each identified measured spectral point of interest, a point on the selected curve corresponding to the identified measured spectral point of interest where the corresponding projected line intersects;determining (418) a relative ratio of contrast agent for each of the identified measured spectral points (702, 704, 706) based on- the distance from the identified measured point (702, 704, or 706) to the corresponding intersection point (1008, 1010, or 1012, respectively), divided by- the distance from the reference spectral point (916) to the intersection point (1008, 1010, or 1012, respectively) corresponding to the identified measured spectral point (702, 704, or 706, respectively),generating (306) an updated contrast map including the relative ratios; andsegmenting (308) the tubular structure based on the updated contrast map.
- The method of claim 1, further comprising:generating iodine/calcium separation information based on the obtained contrast enhanced spectral image data; andgenerating updated iodine/calcium separation information based on the updated contrast map.
- The method of claim 2, further comprising:generating virtual non-contrast image based on the obtained contrast enhanced spectral image data; andgenerating an updated virtual non-contrast image based on the updated contrast map.
- The method of one of claims 1 to 3, further comprising:determining (310) if stopping criteria have been met; and, in response to the determining the stopping criteria have not been met:localizing the tubular structure in the updated contrast map;extracting a second center-line from the tubular structure localized in the updated contrast map;generating a second updated contrast map based on the tubular structure localized in the updated contrast map, the second extracted center-line, and the spectral model.
- The method of claim 4, further comprising:
outputting the updated contrast map as a refined contrast map in response to the determining the stopping criteria have been met. - The method of one of claims 1 to 5, further comprising:
applying an active-contour function to segment a lumen of the tubular structure. - A computing system (120) for implementing a method of segmenting contrast enhanced spectral CT image data of a tubular vessel structure, comprising:a spectral analyzer (202); anda spectral analysis data processor (204);wherein the spectral analyzer (202) is configured to obtain contrast-enhanced spectral image data that includes voxels representing a tubular structure, wherein the tubular structure is a vessel; and wherein the spectral analysis data processor (204) is configured to:generate (204) a contrast map based on the obtained contrast agent enhanced spectral image data;localize (302) the tubular structure in the contrast map;extract (304) a center-line of the localized tubular structure;select (402) two regions (502, 504) along the tubular structure corresponding to regions with a diameter greater than a pre-determined minimal diameter threshold;the spectral analysis data processor (204) further is configured to:identify (404), for each of the selected regions along the center-line, a spectral point AL (602) and Au (604) respectively, wherein a spectral point refers to a set of values of different spectral images corresponding to a single voxel in an imaged volume;determine (406) a reference spectral point (916) based on the identified spectral points by means of averaging the set of values of different spectral images amongst the spectral points ((AU+ AL) / 2);identify (408) measured spectral points of interest (702, 704, 706) within the spectral image data, the measured spectral points being adjacent to a material with a low, medium, or high attenuation value;plot (410) the reference and the measured spectral points in a spectral model, wherein the spectral model is an energy spectral graph with spectral curves for a plurality of predetermined different types of material;select (412), for each identified measured spectral point of interest (702, 704, 706), a spectral curve corresponding to a most probable tissue type for the identified measured spectral point of interest;project (414), for each identified measured spectral point of interest (702, 704, 706), a line from the determined reference spectral point (916), through the identified measured spectral point of interest (702, 704, or 706), to the corresponding selected spectral curve (908, 912, or 914, respectively);assign (416), for each identified measured spectral point of interest, a point on the selected curve corresponding to the identified measured spectral point of interest where the corresponding projected line intersects;determining (418) a relative ratio of contrast agent for each of the identified measured spectral points (702, 704, 706) based on- the distance from the identified measured point (702, 704, or 706) to the corresponding intersection point (1008, 1010, or 1012, respectively), divided by- the distance from the reference spectral point (916) to the intersection point (1008, 1010, or 1012, respectively) corresponding to the identified measured spectral point (702, 704, or 706, respectively),generate (306) an updated contrast map including the relative ratios; andsegment (308) the tubular structure based on the updated contrast map.
- A computer readable storage medium encoded with computer readable instructions, which, when executed by a processor, causes the processor to:
perform the steps of one of method claims 1 to 6.
Applications Claiming Priority (2)
| Application Number | Priority Date | Filing Date | Title |
|---|---|---|---|
| US201361916850P | 2013-12-17 | 2013-12-17 | |
| PCT/IB2014/066540 WO2015092588A2 (en) | 2013-12-17 | 2014-12-03 | Spectral image data processing |
Publications (2)
| Publication Number | Publication Date |
|---|---|
| EP3084723A2 EP3084723A2 (en) | 2016-10-26 |
| EP3084723B1 true EP3084723B1 (en) | 2021-04-28 |
Family
ID=52392162
Family Applications (1)
| Application Number | Title | Priority Date | Filing Date |
|---|---|---|---|
| EP14828305.4A Active EP3084723B1 (en) | 2013-12-17 | 2014-12-03 | Spectral image data processing |
Country Status (5)
| Country | Link |
|---|---|
| US (1) | US10970836B2 (en) |
| EP (1) | EP3084723B1 (en) |
| JP (1) | JP6559678B2 (en) |
| CN (1) | CN105830123B (en) |
| WO (1) | WO2015092588A2 (en) |
Families Citing this family (15)
| Publication number | Priority date | Publication date | Assignee | Title |
|---|---|---|---|---|
| RU2612575C2 (en) * | 2011-07-15 | 2017-03-09 | Конинклейке Филипс Н.В. | Image processing for spectral computer tomography |
| US9058692B1 (en) * | 2014-04-16 | 2015-06-16 | Heartflow, Inc. | Systems and methods for image-based object modeling using multiple image acquisitions or reconstructions |
| US11151760B2 (en) | 2015-08-17 | 2021-10-19 | Shimadzu Corporation | Image reconstruction processing method, image reconstruction processing program, and tomography device equipped with same |
| WO2017216248A1 (en) | 2016-06-15 | 2017-12-21 | Koninklijke Philips N.V. | Determining calcium content from spectral ct data |
| WO2018098118A1 (en) | 2016-11-23 | 2018-05-31 | Mayo Foundation For Medical Education And Research | System and method for quantifying luminal stenosis using multi-energy computed tomography imaging |
| EP3332710B1 (en) * | 2016-12-12 | 2020-09-16 | Siemens Healthcare GmbH | Characterisation of plaque |
| US11049295B2 (en) * | 2016-12-19 | 2021-06-29 | Koninklijke Philips N.V. | Detection and/or correction of residual iodine artifacts in spectral computed tomography (CT) imaging |
| US10702234B2 (en) * | 2017-02-22 | 2020-07-07 | Canon Medical Systems Corporation | Image combining using images with different focal-spot sizes |
| EP3378398A1 (en) | 2017-03-24 | 2018-09-26 | Koninklijke Philips N.V. | Myocardial ct perfusion image synthesis |
| CN110506293B (en) * | 2017-03-31 | 2023-11-07 | 皇家飞利浦有限公司 | Spectral imaging FFR |
| US10580132B2 (en) * | 2017-04-13 | 2020-03-03 | Canon Kabushiki Kaisha | Medical image processing apparatus, control method therefor, and non-transitory storage medium storing program |
| US10349911B2 (en) | 2017-05-18 | 2019-07-16 | Dassault Systemes Simulia Corp. | System and method to produce corrected contrast levels in a CT scan of vasculature |
| JP7325331B2 (en) * | 2017-06-30 | 2023-08-14 | コーニンクレッカ フィリップス エヌ ヴェ | Machine learning spectrum FFR-CT |
| EP3467771A1 (en) * | 2017-10-05 | 2019-04-10 | Koninklijke Philips N.V. | Image feature annotation in diagnostic imaging |
| CN111079863B (en) * | 2019-12-31 | 2023-05-19 | 重庆青信科技有限公司 | System for identifying focus tissue by utilizing spectral curve statistical fingerprint |
Family Cites Families (17)
| Publication number | Priority date | Publication date | Assignee | Title |
|---|---|---|---|---|
| US7711165B2 (en) | 2005-07-28 | 2010-05-04 | Siemens Medical Solutions Usa, Inc. | System and method for coronary artery segmentation of cardiac CT volumes |
| DE102005049602B3 (en) * | 2005-10-17 | 2007-04-19 | Siemens Ag | Segmenting at least one substance in an x-ray image involves determining number of image points in classification range as assessment value and deriving segmented image with threshold comparison based on assessment value |
| EP2054838A4 (en) * | 2006-08-15 | 2012-08-15 | Univ Texas | Methods, compositions and systems for analyzing imaging data |
| US7990379B2 (en) | 2006-10-25 | 2011-08-02 | Siemens Aktiengesellschaft | System and method for coronary segmentation and visualization |
| US8355550B2 (en) | 2007-05-01 | 2013-01-15 | Siemens Aktiengesellschaft | Methods and apparatus for virtual coronary mapping |
| US9070181B2 (en) * | 2007-12-21 | 2015-06-30 | General Electric Company | System and method for extracting features of interest from an image |
| DE102009051384A1 (en) * | 2009-10-30 | 2011-05-12 | Friedrich-Alexander-Universität Erlangen-Nürnberg | Beam hardening correction for CT perfusion measurements |
| US8483432B2 (en) | 2009-12-23 | 2013-07-09 | General Electric Company | Methods for automatic segmentation and temporal tracking |
| EP2357609B1 (en) | 2009-12-23 | 2012-06-27 | Intrasense | Adaptative hit-or-miss region growing for vessel segmentation in medical imaging |
| JP5755031B2 (en) * | 2011-05-30 | 2015-07-29 | ジーイー・メディカル・システムズ・グローバル・テクノロジー・カンパニー・エルエルシー | Image generating apparatus, X-ray CT apparatus, and program |
| GB201109344D0 (en) * | 2011-06-03 | 2011-07-20 | Siemens Medical Solutions | BIF from WB dynamic |
| DE102011078278A1 (en) * | 2011-06-29 | 2013-01-03 | Siemens Aktiengesellschaft | Method for image generation and image analysis |
| RU2612575C2 (en) * | 2011-07-15 | 2017-03-09 | Конинклейке Филипс Н.В. | Image processing for spectral computer tomography |
| JP6462361B2 (en) * | 2011-11-17 | 2019-01-30 | バイエル・ヘルスケア・エルエルシーBayer HealthCare LLC | Methods and techniques for collecting, reporting and managing information about medical diagnostic procedures |
| CN102737376A (en) | 2012-03-31 | 2012-10-17 | 常熟市支塘镇新盛技术咨询服务有限公司 | Improved region growing method applied to coronary artery angiography image segmentation |
| RU2015128005A (en) * | 2012-12-11 | 2017-01-19 | Конинклейке Филипс Н.В. | METHOD FOR DETERMINING BLEED THROUGH CORONARY ARTERIES |
| US9092849B2 (en) * | 2013-06-28 | 2015-07-28 | International Business Machines Corporation | Bidirectional blood vessel segmentation |
-
2014
- 2014-12-03 EP EP14828305.4A patent/EP3084723B1/en active Active
- 2014-12-03 WO PCT/IB2014/066540 patent/WO2015092588A2/en active Application Filing
- 2014-12-03 JP JP2016539282A patent/JP6559678B2/en active Active
- 2014-12-03 US US15/103,985 patent/US10970836B2/en active Active
- 2014-12-03 CN CN201480069427.5A patent/CN105830123B/en active Active
Non-Patent Citations (1)
| Title |
|---|
| None * |
Also Published As
| Publication number | Publication date |
|---|---|
| WO2015092588A3 (en) | 2015-10-29 |
| US10970836B2 (en) | 2021-04-06 |
| CN105830123B (en) | 2019-08-16 |
| US20160321803A1 (en) | 2016-11-03 |
| JP2017503551A (en) | 2017-02-02 |
| JP6559678B2 (en) | 2019-08-14 |
| WO2015092588A2 (en) | 2015-06-25 |
| CN105830123A (en) | 2016-08-03 |
| EP3084723A2 (en) | 2016-10-26 |
Similar Documents
| Publication | Publication Date | Title |
|---|---|---|
| EP3084723B1 (en) | Spectral image data processing | |
| US11557069B2 (en) | System and method for estimating vascular flow using CT imaging | |
| US7702141B2 (en) | Method for quantifying an object in a larger structure using a reconstructed image | |
| JP5188154B2 (en) | Method and apparatus for creating risk metrics for soft plaque inside blood vessels | |
| US8055050B2 (en) | Motion compensation in energy-sensitive computed tomography | |
| JP5081390B2 (en) | Method and system for monitoring tumor burden | |
| CN110944586B (en) | Inflammation Estimation from X-ray Image Data | |
| JP6526669B2 (en) | Segmentation of bones from image data | |
| JP2020513978A (en) | Myocardial CT perfusion image synthesis | |
| Mannelli et al. | Dual energy computed tomography quantification of carotid plaques calcification: comparison between monochromatic and polychromatic energies with pathology correlation | |
| Do et al. | A decomposition-based CT reconstruction formulation for reducing blooming artifacts | |
| JP6828061B2 (en) | Identification of calcium content from spectral CT data | |
| Faby et al. | Multidetector-row CT basics, technological evolution, and current technology | |
| JP7191038B2 (en) | Spectral Imaging FFR | |
| JP5337416B2 (en) | Image processing apparatus and diagnostic imaging apparatus | |
| Liu et al. | Improved C-arm cardiac cone beam CT based on alternate reconstruction and segmentation | |
| CN111971710A (en) | Generating spectral inflammation maps from spectral imaging data | |
| Giordano et al. | Spatially regularized region-based perfusion estimation in peripherals using angiographic C-arm systems | |
| Kim et al. | Automated identification of myocardial perfusion defects in dynamic cardiac computed tomography using deep learning | |
| WO2018098118A1 (en) | System and method for quantifying luminal stenosis using multi-energy computed tomography imaging | |
| Rajiah et al. | Dual energy imaging in cardiovascular CT: Current status and impact on radiation, contrast and accuracy | |
| WO2023165876A1 (en) | Measurement of blood flow parameters | |
| Pociask et al. | Coronary Plaque Quantification by Multi-slice Computed Tomography | |
| Ohnesorge et al. | Image visualization and post-processing techniques |
Legal Events
| Date | Code | Title | Description |
|---|---|---|---|
| PUAI | Public reference made under article 153(3) epc to a published international application that has entered the european phase |
Free format text: ORIGINAL CODE: 0009012 |
|
| 17P | Request for examination filed |
Effective date: 20160718 |
|
| AK | Designated contracting states |
Kind code of ref document: A2 Designated state(s): AL AT BE BG CH CY CZ DE DK EE ES FI FR GB GR HR HU IE IS IT LI LT LU LV MC MK MT NL NO PL PT RO RS SE SI SK SM TR |
|
| AX | Request for extension of the european patent |
Extension state: BA ME |
|
| STAA | Information on the status of an ep patent application or granted ep patent |
Free format text: STATUS: EXAMINATION IS IN PROGRESS |
|
| 17Q | First examination report despatched |
Effective date: 20170117 |
|
| DAX | Request for extension of the european patent (deleted) | ||
| RAP1 | Party data changed (applicant data changed or rights of an application transferred) |
Owner name: KONINKLIJKE PHILIPS N.V. |
|
| GRAP | Despatch of communication of intention to grant a patent |
Free format text: ORIGINAL CODE: EPIDOSNIGR1 |
|
| STAA | Information on the status of an ep patent application or granted ep patent |
Free format text: STATUS: GRANT OF PATENT IS INTENDED |
|
| INTG | Intention to grant announced |
Effective date: 20201117 |
|
| GRAS | Grant fee paid |
Free format text: ORIGINAL CODE: EPIDOSNIGR3 |
|
| GRAA | (expected) grant |
Free format text: ORIGINAL CODE: 0009210 |
|
| STAA | Information on the status of an ep patent application or granted ep patent |
Free format text: STATUS: THE PATENT HAS BEEN GRANTED |
|
| AK | Designated contracting states |
Kind code of ref document: B1 Designated state(s): AL AT BE BG CH CY CZ DE DK EE ES FI FR GB GR HR HU IE IS IT LI LT LU LV MC MK MT NL NO PL PT RO RS SE SI SK SM TR |
|
| REG | Reference to a national code |
Ref country code: GB Ref legal event code: FG4D |
|
| REG | Reference to a national code |
Ref country code: CH Ref legal event code: EP |
|
| REG | Reference to a national code |
Ref country code: AT Ref legal event code: REF Ref document number: 1387940 Country of ref document: AT Kind code of ref document: T Effective date: 20210515 |
|
| REG | Reference to a national code |
Ref country code: DE Ref legal event code: R096 Ref document number: 602014077045 Country of ref document: DE |
|
| REG | Reference to a national code |
Ref country code: IE Ref legal event code: FG4D |
|
| REG | Reference to a national code |
Ref country code: GB Ref legal event code: 746 Effective date: 20210602 |
|
| REG | Reference to a national code |
Ref country code: DE Ref legal event code: R084 Ref document number: 602014077045 Country of ref document: DE |
|
| REG | Reference to a national code |
Ref country code: LT Ref legal event code: MG9D |
|
| REG | Reference to a national code |
Ref country code: AT Ref legal event code: MK05 Ref document number: 1387940 Country of ref document: AT Kind code of ref document: T Effective date: 20210428 |
|
| PG25 | Lapsed in a contracting state [announced via postgrant information from national office to epo] |
Ref country code: BG Free format text: LAPSE BECAUSE OF FAILURE TO SUBMIT A TRANSLATION OF THE DESCRIPTION OR TO PAY THE FEE WITHIN THE PRESCRIBED TIME-LIMIT Effective date: 20210728 Ref country code: AT Free format text: LAPSE BECAUSE OF FAILURE TO SUBMIT A TRANSLATION OF THE DESCRIPTION OR TO PAY THE FEE WITHIN THE PRESCRIBED TIME-LIMIT Effective date: 20210428 Ref country code: FI Free format text: LAPSE BECAUSE OF FAILURE TO SUBMIT A TRANSLATION OF THE DESCRIPTION OR TO PAY THE FEE WITHIN THE PRESCRIBED TIME-LIMIT Effective date: 20210428 Ref country code: NL Free format text: LAPSE BECAUSE OF FAILURE TO SUBMIT A TRANSLATION OF THE DESCRIPTION OR TO PAY THE FEE WITHIN THE PRESCRIBED TIME-LIMIT Effective date: 20210428 Ref country code: LT Free format text: LAPSE BECAUSE OF FAILURE TO SUBMIT A TRANSLATION OF THE DESCRIPTION OR TO PAY THE FEE WITHIN THE PRESCRIBED TIME-LIMIT Effective date: 20210428 Ref country code: HR Free format text: LAPSE BECAUSE OF FAILURE TO SUBMIT A TRANSLATION OF THE DESCRIPTION OR TO PAY THE FEE WITHIN THE PRESCRIBED TIME-LIMIT Effective date: 20210428 |
|
| PG25 | Lapsed in a contracting state [announced via postgrant information from national office to epo] |
Ref country code: RS Free format text: LAPSE BECAUSE OF FAILURE TO SUBMIT A TRANSLATION OF THE DESCRIPTION OR TO PAY THE FEE WITHIN THE PRESCRIBED TIME-LIMIT Effective date: 20210428 Ref country code: SE Free format text: LAPSE BECAUSE OF FAILURE TO SUBMIT A TRANSLATION OF THE DESCRIPTION OR TO PAY THE FEE WITHIN THE PRESCRIBED TIME-LIMIT Effective date: 20210428 Ref country code: PT Free format text: LAPSE BECAUSE OF FAILURE TO SUBMIT A TRANSLATION OF THE DESCRIPTION OR TO PAY THE FEE WITHIN THE PRESCRIBED TIME-LIMIT Effective date: 20210830 Ref country code: PL Free format text: LAPSE BECAUSE OF FAILURE TO SUBMIT A TRANSLATION OF THE DESCRIPTION OR TO PAY THE FEE WITHIN THE PRESCRIBED TIME-LIMIT Effective date: 20210428 Ref country code: NO Free format text: LAPSE BECAUSE OF FAILURE TO SUBMIT A TRANSLATION OF THE DESCRIPTION OR TO PAY THE FEE WITHIN THE PRESCRIBED TIME-LIMIT Effective date: 20210728 Ref country code: ES Free format text: LAPSE BECAUSE OF FAILURE TO SUBMIT A TRANSLATION OF THE DESCRIPTION OR TO PAY THE FEE WITHIN THE PRESCRIBED TIME-LIMIT Effective date: 20210428 Ref country code: GR Free format text: LAPSE BECAUSE OF FAILURE TO SUBMIT A TRANSLATION OF THE DESCRIPTION OR TO PAY THE FEE WITHIN THE PRESCRIBED TIME-LIMIT Effective date: 20210729 Ref country code: LV Free format text: LAPSE BECAUSE OF FAILURE TO SUBMIT A TRANSLATION OF THE DESCRIPTION OR TO PAY THE FEE WITHIN THE PRESCRIBED TIME-LIMIT Effective date: 20210428 Ref country code: IS Free format text: LAPSE BECAUSE OF FAILURE TO SUBMIT A TRANSLATION OF THE DESCRIPTION OR TO PAY THE FEE WITHIN THE PRESCRIBED TIME-LIMIT Effective date: 20210828 |
|
| REG | Reference to a national code |
Ref country code: NL Ref legal event code: MP Effective date: 20210428 |
|
| PG25 | Lapsed in a contracting state [announced via postgrant information from national office to epo] |
Ref country code: SK Free format text: LAPSE BECAUSE OF FAILURE TO SUBMIT A TRANSLATION OF THE DESCRIPTION OR TO PAY THE FEE WITHIN THE PRESCRIBED TIME-LIMIT Effective date: 20210428 Ref country code: SM Free format text: LAPSE BECAUSE OF FAILURE TO SUBMIT A TRANSLATION OF THE DESCRIPTION OR TO PAY THE FEE WITHIN THE PRESCRIBED TIME-LIMIT Effective date: 20210428 Ref country code: EE Free format text: LAPSE BECAUSE OF FAILURE TO SUBMIT A TRANSLATION OF THE DESCRIPTION OR TO PAY THE FEE WITHIN THE PRESCRIBED TIME-LIMIT Effective date: 20210428 Ref country code: DK Free format text: LAPSE BECAUSE OF FAILURE TO SUBMIT A TRANSLATION OF THE DESCRIPTION OR TO PAY THE FEE WITHIN THE PRESCRIBED TIME-LIMIT Effective date: 20210428 Ref country code: CZ Free format text: LAPSE BECAUSE OF FAILURE TO SUBMIT A TRANSLATION OF THE DESCRIPTION OR TO PAY THE FEE WITHIN THE PRESCRIBED TIME-LIMIT Effective date: 20210428 Ref country code: RO Free format text: LAPSE BECAUSE OF FAILURE TO SUBMIT A TRANSLATION OF THE DESCRIPTION OR TO PAY THE FEE WITHIN THE PRESCRIBED TIME-LIMIT Effective date: 20210428 |
|
| REG | Reference to a national code |
Ref country code: DE Ref legal event code: R097 Ref document number: 602014077045 Country of ref document: DE |
|
| PLBE | No opposition filed within time limit |
Free format text: ORIGINAL CODE: 0009261 |
|
| STAA | Information on the status of an ep patent application or granted ep patent |
Free format text: STATUS: NO OPPOSITION FILED WITHIN TIME LIMIT |
|
| 26N | No opposition filed |
Effective date: 20220131 |
|
| PG25 | Lapsed in a contracting state [announced via postgrant information from national office to epo] |
Ref country code: IS Free format text: LAPSE BECAUSE OF FAILURE TO SUBMIT A TRANSLATION OF THE DESCRIPTION OR TO PAY THE FEE WITHIN THE PRESCRIBED TIME-LIMIT Effective date: 20210828 Ref country code: AL Free format text: LAPSE BECAUSE OF FAILURE TO SUBMIT A TRANSLATION OF THE DESCRIPTION OR TO PAY THE FEE WITHIN THE PRESCRIBED TIME-LIMIT Effective date: 20210428 |
|
| PG25 | Lapsed in a contracting state [announced via postgrant information from national office to epo] |
Ref country code: MC Free format text: LAPSE BECAUSE OF FAILURE TO SUBMIT A TRANSLATION OF THE DESCRIPTION OR TO PAY THE FEE WITHIN THE PRESCRIBED TIME-LIMIT Effective date: 20210428 Ref country code: IT Free format text: LAPSE BECAUSE OF FAILURE TO SUBMIT A TRANSLATION OF THE DESCRIPTION OR TO PAY THE FEE WITHIN THE PRESCRIBED TIME-LIMIT Effective date: 20210428 |
|
| REG | Reference to a national code |
Ref country code: CH Ref legal event code: PL |
|
| REG | Reference to a national code |
Ref country code: BE Ref legal event code: MM Effective date: 20211231 |
|
| PG25 | Lapsed in a contracting state [announced via postgrant information from national office to epo] |
Ref country code: LU Free format text: LAPSE BECAUSE OF NON-PAYMENT OF DUE FEES Effective date: 20211203 Ref country code: IE Free format text: LAPSE BECAUSE OF NON-PAYMENT OF DUE FEES Effective date: 20211203 |
|
| PG25 | Lapsed in a contracting state [announced via postgrant information from national office to epo] |
Ref country code: FR Free format text: LAPSE BECAUSE OF NON-PAYMENT OF DUE FEES Effective date: 20211231 Ref country code: BE Free format text: LAPSE BECAUSE OF NON-PAYMENT OF DUE FEES Effective date: 20211231 |
|
| PG25 | Lapsed in a contracting state [announced via postgrant information from national office to epo] |
Ref country code: LI Free format text: LAPSE BECAUSE OF NON-PAYMENT OF DUE FEES Effective date: 20211231 Ref country code: CH Free format text: LAPSE BECAUSE OF NON-PAYMENT OF DUE FEES Effective date: 20211231 |
|
| PGFP | Annual fee paid to national office [announced via postgrant information from national office to epo] |
Ref country code: DE Payment date: 20220628 Year of fee payment: 9 |
|
| PG25 | Lapsed in a contracting state [announced via postgrant information from national office to epo] |
Ref country code: HU Free format text: LAPSE BECAUSE OF FAILURE TO SUBMIT A TRANSLATION OF THE DESCRIPTION OR TO PAY THE FEE WITHIN THE PRESCRIBED TIME-LIMIT; INVALID AB INITIO Effective date: 20141203 |
|
| PG25 | Lapsed in a contracting state [announced via postgrant information from national office to epo] |
Ref country code: CY Free format text: LAPSE BECAUSE OF FAILURE TO SUBMIT A TRANSLATION OF THE DESCRIPTION OR TO PAY THE FEE WITHIN THE PRESCRIBED TIME-LIMIT Effective date: 20210428 |
|
| PGFP | Annual fee paid to national office [announced via postgrant information from national office to epo] |
Ref country code: GB Payment date: 20231219 Year of fee payment: 10 |