EP3082589B1 - Verfahren zur ekg-signalverarbeitung und vorrichtung zur durchführung des verfahrens - Google Patents
Verfahren zur ekg-signalverarbeitung und vorrichtung zur durchführung des verfahrens Download PDFInfo
- Publication number
- EP3082589B1 EP3082589B1 EP14872643.3A EP14872643A EP3082589B1 EP 3082589 B1 EP3082589 B1 EP 3082589B1 EP 14872643 A EP14872643 A EP 14872643A EP 3082589 B1 EP3082589 B1 EP 3082589B1
- Authority
- EP
- European Patent Office
- Prior art keywords
- signal
- ekg
- amplitude
- envelopes
- channels
- Prior art date
- Legal status (The legal status is an assumption and is not a legal conclusion. Google has not performed a legal analysis and makes no representation as to the accuracy of the status listed.)
- Active
Links
Images








Classifications
-
- A—HUMAN NECESSITIES
- A61—MEDICAL OR VETERINARY SCIENCE; HYGIENE
- A61B—DIAGNOSIS; SURGERY; IDENTIFICATION
- A61B5/00—Measuring for diagnostic purposes; Identification of persons
- A61B5/72—Signal processing specially adapted for physiological signals or for diagnostic purposes
- A61B5/7235—Details of waveform analysis
- A61B5/7253—Details of waveform analysis characterised by using transforms
-
- A—HUMAN NECESSITIES
- A61—MEDICAL OR VETERINARY SCIENCE; HYGIENE
- A61B—DIAGNOSIS; SURGERY; IDENTIFICATION
- A61B5/00—Measuring for diagnostic purposes; Identification of persons
- A61B5/24—Detecting, measuring or recording bioelectric or biomagnetic signals of the body or parts thereof
- A61B5/316—Modalities, i.e. specific diagnostic methods
- A61B5/318—Heart-related electrical modalities, e.g. electrocardiography [ECG]
- A61B5/346—Analysis of electrocardiograms
- A61B5/349—Detecting specific parameters of the electrocardiograph cycle
-
- A—HUMAN NECESSITIES
- A61—MEDICAL OR VETERINARY SCIENCE; HYGIENE
- A61B—DIAGNOSIS; SURGERY; IDENTIFICATION
- A61B5/00—Measuring for diagnostic purposes; Identification of persons
- A61B5/02—Detecting, measuring or recording for evaluating the cardiovascular system, e.g. pulse, heart rate, blood pressure or blood flow
- A61B5/02028—Determining haemodynamic parameters not otherwise provided for, e.g. cardiac contractility or left ventricular ejection fraction
-
- A—HUMAN NECESSITIES
- A61—MEDICAL OR VETERINARY SCIENCE; HYGIENE
- A61B—DIAGNOSIS; SURGERY; IDENTIFICATION
- A61B5/00—Measuring for diagnostic purposes; Identification of persons
- A61B5/24—Detecting, measuring or recording bioelectric or biomagnetic signals of the body or parts thereof
- A61B5/30—Input circuits therefor
- A61B5/307—Input circuits therefor specially adapted for particular uses
- A61B5/308—Input circuits therefor specially adapted for particular uses for electrocardiography [ECG]
-
- A—HUMAN NECESSITIES
- A61—MEDICAL OR VETERINARY SCIENCE; HYGIENE
- A61B—DIAGNOSIS; SURGERY; IDENTIFICATION
- A61B5/00—Measuring for diagnostic purposes; Identification of persons
- A61B5/24—Detecting, measuring or recording bioelectric or biomagnetic signals of the body or parts thereof
- A61B5/316—Modalities, i.e. specific diagnostic methods
- A61B5/318—Heart-related electrical modalities, e.g. electrocardiography [ECG]
- A61B5/339—Displays specially adapted therefor
-
- A—HUMAN NECESSITIES
- A61—MEDICAL OR VETERINARY SCIENCE; HYGIENE
- A61B—DIAGNOSIS; SURGERY; IDENTIFICATION
- A61B5/00—Measuring for diagnostic purposes; Identification of persons
- A61B5/24—Detecting, measuring or recording bioelectric or biomagnetic signals of the body or parts thereof
- A61B5/316—Modalities, i.e. specific diagnostic methods
- A61B5/318—Heart-related electrical modalities, e.g. electrocardiography [ECG]
- A61B5/346—Analysis of electrocardiograms
- A61B5/349—Detecting specific parameters of the electrocardiograph cycle
- A61B5/352—Detecting R peaks, e.g. for synchronising diagnostic apparatus; Estimating R-R interval
-
- A—HUMAN NECESSITIES
- A61—MEDICAL OR VETERINARY SCIENCE; HYGIENE
- A61B—DIAGNOSIS; SURGERY; IDENTIFICATION
- A61B5/00—Measuring for diagnostic purposes; Identification of persons
- A61B5/24—Detecting, measuring or recording bioelectric or biomagnetic signals of the body or parts thereof
- A61B5/316—Modalities, i.e. specific diagnostic methods
- A61B5/318—Heart-related electrical modalities, e.g. electrocardiography [ECG]
- A61B5/346—Analysis of electrocardiograms
- A61B5/349—Detecting specific parameters of the electrocardiograph cycle
- A61B5/366—Detecting abnormal QRS complex, e.g. widening
-
- A—HUMAN NECESSITIES
- A61—MEDICAL OR VETERINARY SCIENCE; HYGIENE
- A61B—DIAGNOSIS; SURGERY; IDENTIFICATION
- A61B5/00—Measuring for diagnostic purposes; Identification of persons
- A61B5/48—Other medical applications
- A61B5/4884—Other medical applications inducing physiological or psychological stress, e.g. applications for stress testing
-
- A—HUMAN NECESSITIES
- A61—MEDICAL OR VETERINARY SCIENCE; HYGIENE
- A61B—DIAGNOSIS; SURGERY; IDENTIFICATION
- A61B5/00—Measuring for diagnostic purposes; Identification of persons
- A61B5/72—Signal processing specially adapted for physiological signals or for diagnostic purposes
- A61B5/7203—Signal processing specially adapted for physiological signals or for diagnostic purposes for noise prevention, reduction or removal
-
- A—HUMAN NECESSITIES
- A61—MEDICAL OR VETERINARY SCIENCE; HYGIENE
- A61B—DIAGNOSIS; SURGERY; IDENTIFICATION
- A61B5/00—Measuring for diagnostic purposes; Identification of persons
- A61B5/72—Signal processing specially adapted for physiological signals or for diagnostic purposes
- A61B5/7225—Details of analogue processing, e.g. isolation amplifier, gain or sensitivity adjustment, filtering, baseline or drift compensation
-
- A—HUMAN NECESSITIES
- A61—MEDICAL OR VETERINARY SCIENCE; HYGIENE
- A61B—DIAGNOSIS; SURGERY; IDENTIFICATION
- A61B5/00—Measuring for diagnostic purposes; Identification of persons
- A61B5/72—Signal processing specially adapted for physiological signals or for diagnostic purposes
- A61B5/7235—Details of waveform analysis
- A61B5/7246—Details of waveform analysis using correlation, e.g. template matching or determination of similarity
-
- A—HUMAN NECESSITIES
- A61—MEDICAL OR VETERINARY SCIENCE; HYGIENE
- A61B—DIAGNOSIS; SURGERY; IDENTIFICATION
- A61B5/00—Measuring for diagnostic purposes; Identification of persons
- A61B5/74—Details of notification to user or communication with user or patient; User input means
- A61B5/7405—Details of notification to user or communication with user or patient; User input means using sound
- A61B5/7415—Sound rendering of measured values, e.g. by pitch or volume variation
-
- A—HUMAN NECESSITIES
- A61—MEDICAL OR VETERINARY SCIENCE; HYGIENE
- A61B—DIAGNOSIS; SURGERY; IDENTIFICATION
- A61B5/00—Measuring for diagnostic purposes; Identification of persons
- A61B5/24—Detecting, measuring or recording bioelectric or biomagnetic signals of the body or parts thereof
- A61B5/25—Bioelectric electrodes therefor
- A61B5/279—Bioelectric electrodes therefor specially adapted for particular uses
- A61B5/28—Bioelectric electrodes therefor specially adapted for particular uses for electrocardiography [ECG]
- A61B5/282—Holders for multiple electrodes
-
- A—HUMAN NECESSITIES
- A61—MEDICAL OR VETERINARY SCIENCE; HYGIENE
- A61B—DIAGNOSIS; SURGERY; IDENTIFICATION
- A61B5/00—Measuring for diagnostic purposes; Identification of persons
- A61B5/72—Signal processing specially adapted for physiological signals or for diagnostic purposes
- A61B5/7271—Specific aspects of physiological measurement analysis
- A61B5/7282—Event detection, e.g. detecting unique waveforms indicative of a medical condition
Definitions
- the present invention relates to a method of EKG signal processing and an apparatus for performing the method
- Apparatuses for recording electric activity of heart, electrocardiogram or EKG are commonly used in cardiology for heart diseases diagnostic.
- Standard EKG monitors provide signal in a frequency range up to about 100 Hz.
- Sensitive high resolution EKG monitors referred to as HD EKG or HF EKG monitors with higher sampling rate up to 4 kHz occur on the market in a limited extent.
- Frequency range up to 250 Hz is used on these devices.
- Many publications have indicated that in this frequency range, exclusively in QRS complex area, higher amplitudes of high frequency signal appear - Goldberg AL et al 1981, Petterson J et al 2000, Schlegel TT et al 2004.
- Limited frequency range and limited dynamics of the measured EKG signal that do not enable subsequent analysis and interpretation of the high frequency electrical activities in the frequency range above 250 Hz, are the limitation of the current HF EKG monitors.
- the current limitation consists not only in an EKG measuring technique but also in a method of ultra high frequency EKG signals processing and interpretation.
- WO2005104937 discloses a method of evaluating ECG signal based on calculating ratios of RMS levels for differing heart beat rates in a signal.
- the article " Ultra-high-frequency ECG measurement" by Jurak Pavel et al. in Computing Cardiology 2013 discloses measuring of peak to peak widths of power envelopes.
- UHF EKG apparatus and the method of processing the measured UHF EKG signal it is possible to diagnose various heart abnormalities, pathologies, and determine risks of a sudden cardiac death in a simple and non-invasive way.
- the present invention also enables so far unknown interpretation of the measured electrical activity of the myocardium.
- the ultra high frequency oscillations, measurable by means of the present invention provide information on time and location of an activation of a depolarization phase of action potential of contractile cells predominantly of the left and the right myocardium ventricle.
- the object mentioned above is achieved with the method of the EKG signal processing, the substance of which consists in selecting a frequency range above the frequency of 250 Hz on the EKG signal in measuring channels; from this EKG signal component in the selected frequency range, amplitude or power envelopes of the EKG signal are calculated, which envelopes are averaged with respect to R m of R wave position to increase a signal-to-noise ratio in a corresponding channel, after which the averaged amplitude or power envelopes of the EKG signal from individual channels are compared on the time axis.
- a median or a mean value is deducted within the range of at least 100 ms after the R m position to 300 ms after the R m position, whereupon the negative values of the envelopes, after the median or mean value having been subtracted, are set to zero.
- the amplitude or power envelopes of the EKG signal are calculated using Hilbert or the amplitude envelopes of the EKG signal are calculated by the EKG signal filtration, conversion of the signal obtained this way into absolute value and smoothing or the power envelopes of the EKG signal are calculated by the EKG signal filtration, raising the EKG signal to the power of two and smoothing it.
- the averaged amplitude or power envelopes of the EKG signal are smoothed within the range from 0 to 5 Hz up to 0 to 200 Hz using low pass filter.
- the amplitude or power envelopes of the EKG signal are displayed on a display unit for the averaged amplitude or power envelopes of the EKG signal from individual channels to be compared on the time axis, whereas a colour or a degree of grey is assigned to a displayed signal from each individual channel.
- the averaged amplitude or power envelopes of the EKG signal within the interval of 300 ms before and 600 ms after the R m of R wave position of QRS complex from the individual channels are converted to a series of numerical parameters, where these numerical parameters include amplitude numerical parameters ANPs from a group containing the signal amplitude maximum, the signal power maximum, an integral of the signal amplitude envelope and an integral of the signal power envelope in the individual channels or in sums of the individual channels and in the frequency ranges, and time numerical parameters TNPs from a group containing time positions of the amplitude envelopes maximums, time positions of the amplitude envelopes centres, time positions of the amplitude envelopes beginnings and time positions of the amplitude envelopes ends in the individual channels or in sums of the individual channels and in the frequency ranges.
- these numerical parameters include amplitude numerical parameters ANPs from a group containing the signal amplitude maximum, the signal power maximum, an integral of the signal amplitude envelope and an integral of the signal power envelope in the individual channels or
- the time position of the amplitude or power beginning in one channel is determined as the first value overrunning a predetermined limit value
- the time position of the amplitude or power end in one channel is determined as the last value overrunning the predetermined limit value
- the predetermined limit value is determined as a percentage of the amplitude or power maximum, namely within the range of 1 up to 25 percent.
- an electric dyssynchrony of ventricles in units of time defined as a difference between values of the TNPs of the selected EKG channels, and this difference parameter is further used for a selection of patients suitable for multi-chamber stimulator implementation, or with patients with already implemented stimulator for an optimization of the stimulator function setting by shifting the stimulation moments in the heart chambers in relation to each other to reach the minimum absolute value of this parameter.
- the EKG signal is split into individual frequency ranges within the frequency limits from 0 to 2000 Hz for determining the averaged amplitude or power envelopes of the EKG signal in each individual frequency range.
- the calculated data are arranged into time-frequency matrices, each row of the matrix is on the time axis at interval from Rm - I to Rm + J, where I and J are time intervals, each in possible range from 50 up to 1500 ms. That way each row of the matrix represents a course of the averaged amplitude or power envelope at interval from Rm - I to Rm + J in the selected frequency range. Frequency ranges of the individual rows of the matrix are shifted in relation to each other.
- Time-frequency map after the normalization is advantageously displayed so that degrees of gray scale or colour shades according to the set colour chart are assigned to the individual matrix values.
- the amplitude or power envelopes of the EKG signal from the individual channels or a sum of selected channels are converted to a hearable audible signal such that the carrier frequency in the audible frequency range within the limits of 300 to 15000 Hz is modulated by the amplitude or power envelope of the individual channels or the sum of the selected channels, whereas these envelopes are prolonged in time once up to ten times.
- the ANPs and TNPs are established for the individual EKG channels to determine the position of pathologic areas of the myocardium, whereas a decrease of the ANPs and an increase of the differences between TNPs indicate an occurrence of the pathologic area of the myocardium in the given EKG channels. In doing so it can be especially advantageous, if the ANPs and TNPs from the EKG channels measured in the course of days, weeks, months and/or years are compared to discover the pathologic progress.
- EKG maps are used, which EKG maps are simultaneously measured system of the EKG channels arranged in orthogonal coordinates or arranged in another way numbering up to 300 EKG channels, the amplitude or power envelopes and the ANPs and TNPs are determined in all these EKG channels, whereas these parameters are displayed in a three-dimensional matrix, where each matrix element is in accordance with one value of a parameter of one EKG contact, or with one value of the amplitude or power envelope in the same instant of time.
- the apparatus comprises a block of analogue amplifiers, to the output of which an input of a block of analogue signal to digital signal converters is connected.
- the individual analogue amplifiers of the block of the analogue amplifiers are connected with their inputs to the outputs of the individual channels of the EKG signal and their outputs are connected to the inputs of the individual converters of the analogue signal to digital signal of the block of the analogue signal to digital signal converters.
- the whole of a transmission band of the chain of the analogue amplifier block and the block of the analogue signal to digital signal converters has a dynamic range above 100 dB in each recorded channel.
- a storage unit is connected to the outputs of the individual analogue signal to digital signal converters of the block of the analogue signal to digital signal converters.
- a detector R m of the R wave of the QRS complex is connected, to the output of which through a band pass filter a unit for calculating the envelopes and averaging is connected.
- At least one indicating unit is connected to the output of the unit for calculating the envelopes and averaging.
- the indicating unit is a display unit for displaying the envelopes and/or calculated numerical parameters.
- the indicating unit is an audible signal generator.
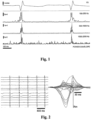
- FIG. 1 the channel V3 and the power envelopes of the measured EKG signal in various frequency ranges in two consecutive heart beats are depicted; in figure 2 the position of R m of R wave in twelve-lead EKG signal is illustrated;
- Figure 3A is an illustration of the averaged amplitude envelopes in micro volts of the twelve-lead EKG signal within the range of 500 up to 1000 Hz;
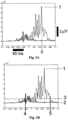
- Figure 3B is an illustration of smoothing the averaged amplitude envelope of the EKG signal of the channels V1 and V6 by means of a low pass filter within the range of 0 to 40 Hz; in figure 3C there is the EKG signal from figure 3B , from above QRS complex of the EKG signal, the envelopes in the range of 500 up to 1000 Hz and the envelopes in the range of 1000 up to 2000 Hz; in figure 4A a detection of maximums and their time positions of the averaged amplitude envelopes of two different EKG channels is illustrated, 0
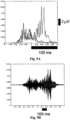
- figure 14A is a time-frequency map within the range of 0 up to 400 Hz of a healthy subject for the channels V1 and V6, the subject is the same as in figure 12A
- figure 14B is a time-frequency map of a subject with late activation of the left ventricle, the subject is the same as in figure 12B .
- the invention relates to the method of measuring and processing of the high frequency activity of the electrocardiogram in selected frequency ranges above the value of 250 Hz and the method of analysing the high frequency oscillation of the electrocardiogram, the most important component of which is that the high frequency oscillation generated by a heart muscle is measured.
- the EKG signal is scanned by several sensors on a surface of a chest and a back and from these sensors it comes through various channels to the analysis. A frequency range above 250 Hz is selected on the EKG signal in the measuring channels and the amplitude or power envelopes of the EKG signal in the selected frequency range are calculated.
- the power envelopes of the measured EKG signal lead V3 in ranges of 150 up to 250 Hz, which is a common range for HF EKG, 500 up to 1000 Hz and 1500 up to 2000 Hz, beat by beat.
- the range of 500 up to 1000 Hz shows a considerably better in detail depicted morphology and time delimitation of the power envelopes in the QRS complex area then the lower range of 150 up to 250 Hz.
- the EKG signal that is not averaged and is displayed beat by beat.
- the R m of R wave position in the twelve-lead EKG signal is depicted.
- the R m of R wave position it is important for it to be in the same position in all consecutive R waves of the EKG signal, which ensures a synchrony for averaging.
- the amplitude or power envelopes of the EKG signal are calculated by means of Hilbert transformation or by filtration, raising the EKG signal to the power of two and smoothing.
- Figure 3 is a demonstration of the amplitude envelopes in micro volts of the twelve-lead EKG signal. In this case it is an average of 846 heart beats and the individual envelopes from the twelve-lead EKG are depicted one over the other.
- FIG. 3B and 3C A demonstration of smoothing the averaged amplitude envelope of the EKG signal of the channel V1 (marked with dark grey colour) and the channel V6 (marked with light grey colour) by means of a low pass filter in the range of 0 to 40 Hz is shown in figures 3B and 3C .
- the smoothing and the number of depicted leads reduction enable better arranged identification of the envelopes from the selected leads.
- the mode of representation in figures 3B and 3C where dark grey colour corresponds to the lead V1 and light grey colour corresponds to lead V6, enables an advantageous identification of a dyssynchrony of the right ventricle, the septum and the lateral wall of the left ventricle of the myocardium.
- the amplitude envelope of the lead V1 precedes the amplitude envelope of the lead V6, this situation being interpreted as an earlier occurrence of an electric depolarization in the septum and the right ventricle before the electric depolarization occurrence in the lateral wall of the left ventricle.
- the averaged amplitude or power envelopes of the EKG signal from the individual channels can be converted to a series of numerical parameters defining amplitudes, powers and their time distribution in the individual channels or in sums of the EKG signals from the individual channels.
- the numerical parameters including amplitudes or powers in the individual channels or in the sum of the selected channels and in the individual frequency ranges are calculated as maximums or integral sums in a selected period of time at interval of 300 ms before and 600 ms after the R m of R wave position of QRS complex.
- figure 4A a detection of the maximums and their time positions of the averaged amplitude envelopes within the range of 500 up to 1000 Hz of two different EKG channels is illustrated, 0 - maximum position, 1 - maximum value.
- FIG 4B a detection of the time positions of the amplitude beginning and end of the EKG channel marked with light grey colour is depicted, 1 - maximum, 2 - zero line, 3 - horizontal line at the level of 10 percent of the maximum, 4 - beginning of the amplitude marked with light grey colour, 5 - end of the amplitude marked with light grey colour.
- FIG 5 a detection of centres positions and values of the integral sums of the amplitude envelopes within the range of 500 up to 1000 Hz of two different EKG channels from figure 4 is illustrated, 1 - the centre of the EKG channel marked with light grey colour determined in a half of the value of the integral sum marked with 2.
- the numerical parameters can be normalized.
- the normalization enables comparison of numerical parameters from various leads, from various frequencies or even from various measurements of one or more subjects.
- the process proceeds in such a way, that the numerical parameters defining amplitudes, powers and their time distribution are used, where the parameter P1 for the selected frequency range, the channel or the sum of the EKG signals from several channels is normalized by the second parameter P2 for another frequency range or another channel or another sum of the EKG signals.
- the numerical parameters can be depicted in a diagram, where the individual channels, i. e. V1, V2, V3, V4, V5 and V6 are on the x-axis and amplitudes or powers or time distribution of the amplitudes or powers are on the y-axis.
- Exemplary measurements of the EKG signal provided the following results: In figure 6 the time positions of the amplitude envelopes maximums within the range of 500 - 1000 Hz in milliseconds for the individual channels of a healthy volunteer H148 and of a patient with diagnosed blockade of the left bundle D64 are depicted. In figure 7 the values of the amplitude envelopes maximums in milivolts for the individual channels of the same healthy volunteer H148 and the same patient with diagnosed blockade of the left bundle D64 are depicted side by side.
- FIG. 10 The apparatus for performing the method described above is illustrated in figure 10 .
- a block 1 of analogue amplifiers to the output of which the input of a block 3 of analogue signal to digital signal converters is connected.
- the block 1 of the analogue amplifiers is connected with its input to outputs of individual sensors 5 of the EKG signal.
- the chain of the sensors 5 of the block 1 of the analogue amplifiers and the block 3 of the analogue signal to digital signal converters has a dynamic range above 100 dB in the whole transmission band.
- a unit 9 for computing envelopes and averaging is connected, to the outputs of which indicating units are connected.
- These indicating units are a display unit 10 for displaying the envelopes and/or the calculated numerical parameters and a generator 11 of audio signal.
- FIG 11 a path of the EKG signal from one sensor 5 to the display unit 10 for displaying the envelopes and/or the calculated numerical parameters and to the generator 11 of the audio signal is depicted. From each used sensor 5 the EKG signal goes through a separate channel as far as the unit 9 for computing envelopes and averaging, where a superposing of the signals from the individual sensors 5 can occur according to requirements of a device operator.
- the sensor 5 of the EKG signal is connected to the analogue amplifier 2 , to the output of which the input of the analogue signal to digital signal converter 4 is connected.
- To the output of the analogue signal to digital signal converter 4 the storage unit 6 is connected, to the output of which the detector 7 of the R m of R wave of the QRS complex is connected.
- the unit 9 for the envelopes computing and averaging is connected, to the outputs of which the display unit 10 for displaying the envelopes and/or the calculated numerical parameters and the generator 11 of the audio signal are connected.
- the distance between two adjacent R m positions is approximately 0,8 s.
- One R m position is then enlarged on the right side of figure 2 , whereas the signals from the individual sensors 5 are superimposed one on top of the other.
- the time interval here is about ⁇ 80 ms.
- the EKG signal is further processed in such a way that the signals from the individual sensors 5 are converted to the amplitude or power envelopes.
- the amplitude or power envelopes frequency range is selected anywhere within the range from 0,2 Hz to the transmission bandwidth of the UHF EKG apparatus, it means for instance within the ranges of 0,2 - 80 Hz, 250 - 500 Hz, 500 - 1000 Hz, 500 - 1500 Hz, 1500 - 2000 Hz and others.
- a procedure using Hilbert transformation or a procedure using a filtration can be used with subsequent raising the EKG signal to the power of two and smoothing.
- a demonstration of the UHF EKG signal for the channel V3 and of the power envelope within the ranges of 150 - 250 Hz, 500 - 1000 Hz and 1500 - 2000 Hz is shown in figure 1 .
- amplitude or power envelopes in appropriate frequency range and appropriate channel are averaged according to the detected R m of R wave position.
- the averaging can be performed alternatively with an exclusion of irregular, pathological and artificial heart beats or on the contrary with a selection of them. With this procedure it is possible to monitor the ultra high frequency oscillation better.
- the amplitude or power envelopes for different EKG signals from the individual sensors 5 are distinguished with different colour shades or degrees of gray for a graphical representation.
- the graphical representation is made up by particular courses of the amplitude or power envelopes from the EKG channels or their sums.
- Figure 3A shows the averaged amplitude envelopes of the EKG signal within the range of 500 up to 1000 Hz, the particular EKG channels are distinguished by shades of grey.
- Figures 3B and 3C show the amplitude envelopes of the EKG signal of the channel V1 (marked with darker gray) and the channel V6 (marked with lighter gray) smoothed by means of a low pass filter within the range of 0 to 40 Hz.
- the EKG signal is divided into consecutive frequency ranges within the frequency limits of 0 to 2000 Hz. In those ranges the averaged amplitude or power envelopes of the EKG signal are determined according to this invention.
- the calculated data are arranged into time-frequency matrixes, each row of the matrix being on the time axis at interval from Rm - I to Rm + J, where I and J are time intervals, each within the range of 50 up to 1500 ms. And so each matrix row represents a course of the averaged amplitude or power envelope at interval Rm - I to Rm + J in the selected frequency range.
- K 1 / ⁇ a i / n where n is a number of values of one matrix row and a i is ith element of the same matrix row, and therethrough enhancement of low powers of the signal on higher frequencies is reached.
- the time - frequency map after the normalization advantageously is displayed in such a way that degrees of gray or colour shades according to a set colour chart are assigned to the individual matrix values.
- a demonstration of the time - frequency map is in figure 14 .
- the numerical parameters are further determined, which parameters describe the amplitudes, the powers and their time distribution in the individual EKG signals or in sums of them.
- the numerical parameters including the amplitudes and the powers in the individual signals or in the sum of the selected signals in the individual frequency ranges are calculated as maximums or integral sums in the selected period of time within the interval of 300 ms before and 600 ms after the R m of R wave position of the QRS complex.
- Figure 4A shows an example of detection of the maximum from two signals in the delimited interval of 100 ms before the R m position and 100 ms after the R m position.
- Figure 5 shows an example of the centre and the integral sum of the amplitude envelope of the same two signals in the delimited interval of 100 ms before the R m position and 100 ms after the R m position.
- P n the normalized parameter
- P 1 the parameter in the first frequency range
- P 2 the parameter in the second frequency range.
- the parameter DPij in milliseconds or in another unit of time is determined from differences of the TNPs for the amplitude or power envelopes position in the individual channels of the EKG signal.
- the parameter DPij is determined as a difference of the TNPs for the channel i and the channel j.
- Higher absolute values of the parameters DPij mean a longer time interval between the parameters and thus also the higher electric dyssynchrony of the myocardium.
- the parameters DPij are further used for a selection of patients suitable for the implementation of the biventricular or multi-chamber stimulator.
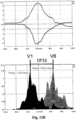
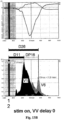
- An example of the patient suitable for the biventricular stimulator implementation is in figure 12B .
- the amplitude envelope maximum from the channel V6 is delayed in relation to the channel V1 maximum by 80 ms.
- the parameter DP16 is 80 ms.
- the channel V1 includes first of all electric activation of the right ventricle and the septum
- the channel V6 includes electric activation of the lateral wall of the left ventricle.
- the parameter DP 16 can be interpreted as the delay of the electric activation of the left ventricle lateral wall by 80 ms.
- a patient with this value of the parameter DP 16 is suitable for the biventricular stimulator implementation on the ground of proved electric dyssynchrony of the myocardium.
- An example of a patient with the delayed activation of the right ventricle and a part of the septum is shown in figure 12C .
- the amplitude envelope maximum of the channel V1 marked with dark gray colour is delayed in relation to the amplitude envelope maximum of the channel V6.
- the channel V1 envelope has two local maximums, the first of which coincides with the maximum of the envelope of the channel V6. It means, that the electric depolarization of the myocardium proceeds at the beginning synchronously with subsequent separate activation of the electric depolarization in the area of the septum and the right ventricle.
- the parameters DPij are used to optimise the stimulator setting. The optimization proceeds in such a way that the stimulations in different heart ventricles are time-shifted in relation to each other so that the parameters DPij may be as low as possible.
- the switched off biventricular stimulator is shown in figure 13A .
- FIG. 13B A demonstration of a change of the parameter DP16 after switching on the biventricular stimulator and of a dual setting of the stimulator parameters is depicted in figures 13B and 13C .
- the synchronous stimulation of the left and the right ventricles is shown in figure 13B .
- the stimulation of the left ventricle precedes the stimulation of the right ventricle by 20 ms.
- the parameter DP16 is lower than in the synchronous stimulation and the setting of the stimulator is more advantageous.
- the stimulating pulses positions on the time axis and their distance from the values of the TNPs for positions of the amplitude or power envelopes in the individual channels of the EKG signal are determined - parameter Dsi in milliseconds or in another unit of time, where sth stimulating pulse and ith EKG channel are defined.
- Example of various settings of the biventricular stimulator is shown in figures 13B , 13C , 13D and 13E .
- Number 1 defines the instant of stimulation in the right ventricle
- number 2 defines the instant of stimulation in the left ventricle.
- FIG 13B the stimulations in the right and the left ventricles 1 and 2 arise at the same instant of time
- the stimulation 2 in the left ventricle precedes the stimulation 1 in the right ventricle by 20 ms
- the stimulation 2 in the left ventricle precedes the stimulation 1 in the right ventricle by 40 ms
- in figure 13E the stimulation 2 in the left ventricle precedes the stimulation 1 in the right ventricle by 60 ms.
- the parameters D11 and D26 are depicted in figures 13B , 13C , 13D and 13E .
- Parameters Dsi indicate a speed of transmission of the stimulating signal into the heart area determinate by the EKG channel.
- the amplitude or power envelopes of the individual channels or the sum of selected channels can be converted to a hearable audio signal in such a way, that the carrier frequency in an audible band within the range of 300 up to 15000 Hz is modulated by the amplitude or power envelope of the individual channels or the sum of the selected channels, whereas these envelopes are spread out in time once up to ten times.
- the signal is brought to the audio signal generator 11 , which enables the EKG analysis by ears.
- the sum of the amplitude or power envelopes of the channels V1, V2 and V3 and the sum of the amplitude or power envelopes of the channels V4, V5 and V6 of the EKG signal are used. These sums are converted to two hearable audio signals with different carrier frequencies for stereophonic reproduction of the ultra high frequency heart activity in the audio signal generator 11 .
- a creation of the signal for the stereophonic reproduction is illustrated in figures 8 and 9 .
- the measuring and processing of the ultra high frequency EKG oscillation according to this invention provide quite new information on an electric activity of a heart muscle. This information is closely connected with a short depolarizing phase at the beginning of an action potential. The action potential propagates gradually in contractile cells. This process of the propagation is recorded by the apparatus according to this invention. The depolarization initiates a mechanical contraction of the cells. Thus the measuring of the depolarizing phase of the action potentials is closely connected with timing and spatial characteristics of a mechanical activity of the heart.
- the apparatus for measuring the ultra high frequency signal of the electrocardiograph and the method of its processing according to this invention enable the early, non-invasive and financially modest diagnostics of serious heart diseases.
- the analysis of the ultra high frequency components of the EKG signal also enables early identification of different types of pathologies of the ventricle depolarization, e. g. in case of cardiac ischemia, in disorders of heart tissue conductivity, in identification of after-heart attack states and in a stratification of risks of sudden cardiac death or a necessity of ICD implementation.
- a quantification of the ventricles dyssynchrony is the particularly important sphere of the invention utilization.
- the current method of this pathological dysfunction description is largely based on a shape and a width of the QRS complex of the EKG signal. This method is commonly considered to be insufficient.
- the distribution of the high frequency oscillation of the EKG signal in the individual leads according to this invention is able to quantify with a great precision the timing of the electric depolarization of the ventricles.
- the distribution of the amplitude envelopes of a healthy synchronous heart is shown in figure 12A , of a heart with a delayed electric activation of the left ventricle in figure 12B , and of a heart with a delayed electric activation of the right ventricle caused by a blockade of the right Tawara bundle branch in figure 12C .
- the dark gray colour represents the lead V1
- light gray colour represents the lead V6
- the gray colour represents overlapping of the envelopes.
- the delay of the electric activation of one of the ventricles in milliseconds can also be determined.
- the delay time is defined by vertical black lines with a time length of 80 ms. This datum is not achievable by any other technology.
- the dyssynchrony of the ventricles can be reduced by the biventricular stimulator implantation. At present there are no fully unified and sufficient criteria for the selection of patients suitable for this technology. It is very difficult to determine success rate of the biventricular stimulation as well. Examples of the invention applications in determining patients suitable for the biventricular stimulation and verification of the stimulation effect are shown in figure 13 .
- the figure shows the averaged amplitude envelopes within the range of 500 - 1000 Hz, dark gray colour represents the lead V1, light gray colour represents the lead V6.
- a candidate with a considerable dyssynchrony of the ventricles 100 ms suitable for the stimulation is in figure 13A .
- the envelopes, when the stimulation has been switched on, are depicted in figure 13B .
- Another advantageous application of the invention is the possibility to optimize the setting of the biventricular stimulator parameters according to the degree of the overlapping the envelopes or powers from the individual EKG channels.
- Applicability in a clinical medicine is exceptionally high first of all because of an easiness of the ultra high frequency EKG signal measuring that differs in no way from the standard measuring of the EKG signal, and because of a high added information value on a time distribution of a depolarization phase of contractile cells of ventricles, which is not available in common EKG record.
- the parameters obtained by means of this invention provide important information for the determination of the electric inhomogeneity and dyssynchrony of myocardium, selection of patients for the stimulators implementation and optimization of the stimulators setting.
Landscapes
- Health & Medical Sciences (AREA)
- Life Sciences & Earth Sciences (AREA)
- Engineering & Computer Science (AREA)
- Cardiology (AREA)
- Public Health (AREA)
- Veterinary Medicine (AREA)
- Biophysics (AREA)
- Biomedical Technology (AREA)
- Heart & Thoracic Surgery (AREA)
- Medical Informatics (AREA)
- Molecular Biology (AREA)
- Surgery (AREA)
- Animal Behavior & Ethology (AREA)
- General Health & Medical Sciences (AREA)
- Physics & Mathematics (AREA)
- Pathology (AREA)
- Physiology (AREA)
- Signal Processing (AREA)
- Psychiatry (AREA)
- Artificial Intelligence (AREA)
- Computer Vision & Pattern Recognition (AREA)
- Child & Adolescent Psychology (AREA)
- Developmental Disabilities (AREA)
- Hospice & Palliative Care (AREA)
- Psychology (AREA)
- Social Psychology (AREA)
- Power Engineering (AREA)
- Measurement And Recording Of Electrical Phenomena And Electrical Characteristics Of The Living Body (AREA)
Claims (11)
- Verfahren zu einer EKG-Signalverarbeitung, die mittels einer Vorrichtung durchgeführt wird, die einen Block (1) von analogen Verstärkern (2) enthält, mit deren Ausgabeelement ein Eingabeelement eines Blocks (3) von Analog-Digital-Signalumsetzern (4) verbunden ist, wobei die einzelnen analogen Verstärker (2) des Blocks (1) der analogen Verstärker (2) mittels ihren Eingabeelementen mit den Ausgabeelementen der einzelnen Kanäle (5) des EKG-Signals verbunden sind und mittels ihren Ausgabeelementen mit den Eingabeelementen der einzelnen Analog-Digital-Signalumsetzer (4) des Blocks (3) der Analog-Digital-Signalumsetzern (4), wobei die Kette von Sensoren (5), des Blocks (1) der analogen Verstärker und des Blocks (3) der Analog-Digital-Signalumsetzer einen Dynamikbereich über 100 dB innerhalb des gesamten Übertragungsbandes aufweist, mit den Ausgabeelementen der einzelnen Analog-Digital-Signalumsetzer (4) des Blocks (3) der Analog-Digital-Signalumsetzer (4) mit einer Speichereinheit (6) verbunden sind, an deren Ausgabeelement ein Detektor (7) von Rm der R-Zacke des QRS-Komplexes angeschlossen ist, wobei an den Ausgabeelement des Detektors (7) von Rm der R-Zacke des QRS-Komplexes eine Einheit (9) zum Berechnen der Hüllkurven und Mittelwertbildung über ein Bandpassfilter (8) angeschlossen ist, wobei mindestens eine Anzeigeeinheit mit dem Ausgabeelement der Einheit (9) zum Berechnen der Hüllkurven und Mittelwertbildung verbunden ist, wobei mittels der Vorrichtung Folgendes erfolgt:- auf dem EKG-Signal in den Messkanälen wird ein Frequenzbereich oberhalb der Frequenz von 250 Hz ausgewählt,- aus dieser Komponente des EKG-Signals im ausgewählten Frequenzbereich werden Amplituden- oder Leistungshüllkurven des EKG-Signals berechnet, wobei die Amplituden- oder Leistungshüllkurven des EKG-Signals mittels Hilbert-Transformation berechnet werden, oder die Amplituden-Hüllkurven des EKG-Signals durch Filterung des EKG-Signals, Umwandlung des so erhaltenen Signals in einen Absolutwert und Glättung desselben berechnet werden, oder die Leistungshüllkurven des EKG-Signals durch Filterung des EKG-Signals, Potenzierung des EKG-Signals mit zwei und Glättung berechnet werden,- diese Amplituden- oder Leistungshüllkurven des EKG-Signals werden für individuelle Kanäle in Bezug auf Rm der R-Zacke gemittelt, um das Signal-Rausch-Verhältnis zu erhöhen, wobei Rm das Maximum der R-Zacke ist, dadurch gekennzeichnet, dass- danach die so gewonnenen Hüllkurven des EKG-Signals der einzelnen Kanäle auf der Zeitachse miteinander verglichen werden.
- Verfahren zur EKG-Signalverarbeitung nach Anspruch 1, dadurch gekennzeichnet, dass die gemittelten Amplituden- oder Leistungshüllkurven des EKG-Signals im Bereich von 0 bis 5 Hz bis 0 bis 200 Hz mittels eines Tiefpassfilters geglättet werden.
- Verfahren zur EKG-Signalverarbeitung nach Anspruch 1, dadurch gekennzeichnet, dass zum Zwecke eines Vergleichs der gemittelten Amplituden- oder Leistungshüllkurven des EKG-Signals der einzelnen Kanäle auf der Zeitachse die Amplituden- oder Leistungshüllkurven des EKG-Signals auf einer Anzeigeeinheit angezeigt werden, wobei dem angezeigten Signal von jedem einzelnen Kanal eine Farbe oder eine Schattierung zugeordnet wird.
- Verfahren zur EKG-Signalverarbeitung nach Anspruch 1, dadurch gekennzeichnet, dass die gemittelten Amplituden- oder Leistungshüllkurven des EKG-Signals im Bereich von 300 ms vor und 600 ms nach der Position Rm der R-Zacke eines QRS-Komplexes aus den einzelnen Kanälen in eine Reihe von numerischen Parametern umgewandelt werden, wobei die numerischen Parameter amplitude-numerische Parameter ANP aus einer Gruppe, die ein Maximum der Signalamplitude, ein Maximum der Signalleistung, ein Integral der Amplitudenhüllkurve des Signals und ein Integral der Leistungseinhüllkurve des Signals in den einzelnen Kanälen oder in Summen der einzelnen Kanäle und in Frequenzbereichen enthält, und zeitlich-numerische Parameter TNP aus einer Gruppe, die Zeitpositionen der Amplitudenhüllkurvenmaxima, Zeitpositionen der Amplitudenhüllkurvenmitten, Zeitpositionen der Amplitudenhüllkurvenanfänge und Zeitpositionen der Amplitudenhüllkurvenenden in den einzelnen Kanälen oder in Summen der einzelnen Kanäle und in den Frequenzbereichen enthalten, umfassen, wobei die Zeitposition des Amplitudenbeginns oder der Leistung in einem Kanal als erster Wert, der die vorgegebene Grenze überschreitet, ermittelt wird, die Zeitposition des Endes der Amplitude oder der Leistung in einem Kanal als letzter Wert, der die vorgegebene Grenze überschrittet, ermittelt wird, und die vorgegebene Grenze als Prozentsatz der Amplitudemaximums oder des Leistungsmaximums bestimmt wird, nämlich im Bereich von 1 bis 25 Prozent.
- Verfahren zur EKG-Signalverarbeitung nach Anspruch 4, dadurch gekennzeichnet, dass die numerischen Parameter normiert werden, wobei der numerische Parameter P1 für einen ausgewählten Frequenzbereich, einen Kanal oder eine Summe der EKG-Signale von mehrerer Kanäle durch den zweiten numerischen Parameter P2 für einen anderen Frequenzbereich oder einen anderen Kanal oder eine andere Summe der EKG-Signale normalisiert wird, und wobei der normalisierte numerische Parameter Pn = Pi/P2.
- Verfahren zur EKG-Signalverarbeitung nach einem der vorhergehenden Ansprüche, dadurch gekennzeichnet, dass die Amplituden- oder Leistungshüllkurven der einzelnen Kanäle oder der Summe der ausgewählten Kanäle derart in ein hörbares Audiosignal umgewandelt werden, dass die Trägerfrequenz im hörbaren Frequenzbereich in den Grenzen von 300 bis 15000 Hz durch die Amplituden- oder Leistungshüllkurve der einzelnen Kanäle oder der Summe der ausgewählten Kanäle moduliert wird, wobei diese Hüllkurven einmal bis zehnmal zeitlich verlängert werden.
- Verfahren zur EKG-Signalverarbeitung nach Anspruch 6, dadurch gekennzeichnet, dass die Summe der Amplituden- oder Leistungshüllkurven der Kanäle V1, V2 und V3 oder eine Kombination davon und die Summe der Amplituden- oder Leistungshüllkurven der Kanäle V4, V5 und V6 des EKG-Signals oder eine Kombination davon werden in zwei hörbare Audiosignale mit unterschiedlichen Trägerfrequenzen für eine stereophone Wiedergabe der ultrahochfrequenten Herzaktivität umgewandelt.
- Verfahren zur EKG-Signalverarbeitung nach einem der vorhergehenden Ansprüche, dadurch gekennzeichnet, dass EKG-Karten verwendet werden, wobei die EKG-Karte ein gleichzeitig gemessenes System der in orthogonalen Koordinaten angeordneten EKG-Kanäle in der Anzahl von bis zu 300 EKG-Kanälen, wobei die Amplituden- oder Leistungshüllkurven und die ANPs und TNPs in all diesen EKG-Kanälen bestimmt werden, wobei diese Parameter in einer dreidimensionalen Matrix angezeigt werden, wobei jedes Matrixelement einem Wert eines Parameters eines EKG-Kontakts oder einem Wert der Amplituden- oder Leistungshüllkurve zum gleichen Zeitpunkt entspricht.
- Vorrichtung zur Durchführung des Verfahrens nach den Ansprüchen 1 bis 8, dadurch gekennzeichnet, dass sie einen Block (1) von analogen Verstärkern (2) enthält, mit deren Ausgabeelement ein Eingabeelement eines Blocks (3) von Analog-Digital-Signalumsetzern (4) verbunden ist, wobei die einzelnen analogen Verstärker (2) des Blocks (1) der analogen Verstärker (2) mittels ihren Eingabeelementen mit den Ausgabeelementen der einzelnen Kanäle (5) des EKG-Signals verbunden sind und mittels ihren Ausgabeelementen mit den Eingabeelementen der einzelnen Analog-Digital-Signalumsetzer (4) des Blocks (3) der Analog-Digital-Signalumsetzern (4), wobei die Kette von Sensoren (5), des Blocks (1) der analogen Verstärker und des Blocks (3) der Analog-Digital-Signalumsetzer einen Dynamikbereich über 100 dB innerhalb des gesamten Übertragungsbandes aufweist, mit den Ausgabeelementen der einzelnen Analog-Digital-Signalumsetzer (4) des Blocks (3) der Analog-Digital-Signalumsetzer (4) mit einer Speichereinheit (6) verbunden sind, an deren Ausgabeelement ein Detektor (7) von Rm der R-Zacke des QRS-Komplexes angeschlossen ist, wobei an den Ausgabeelement des Detektors (7) von Rm der R-Zacke des QRS-Komplexes eine Einheit (9) zum Berechnen der Hüllkurven und Mittelwertbildung über ein Bandpassfilter (8) angeschlossen ist, wobei mindestens eine Anzeigeeinheit mit dem Ausgabeelement der Einheit (9) zum Berechnen der Hüllkurven und Mittelwertbildung verbunden ist.
- Vorrichtung nach Anspruch 9, dadurch gekennzeichnet, dass die Anzeigeeinheit ein Display (10) zur Anzeige der Hüllkurven und/oder der berechneten numerischen Parameter ist.
- Vorrichtung nach Anspruch 9, dadurch gekennzeichnet, dass die Anzeigeeinheit ein Tonsignalgenerator (11) ist.
Applications Claiming Priority (3)
| Application Number | Priority Date | Filing Date | Title |
|---|---|---|---|
| CZ2013-1052A CZ20131052A3 (cs) | 2013-12-20 | 2013-12-20 | Způsob analýzy elektrické homogenity srdečního svalu |
| CZ2014-351A CZ2014351A3 (cs) | 2014-05-22 | 2014-05-22 | Způsob vyhodnocení signálu EKG a zařízení pro provádění tohoto způsobu |
| PCT/CZ2014/000163 WO2015090260A2 (en) | 2013-12-20 | 2014-12-19 | Method of ekg signal processing and apparatus for performing the method |
Publications (2)
| Publication Number | Publication Date |
|---|---|
| EP3082589A2 EP3082589A2 (de) | 2016-10-26 |
| EP3082589B1 true EP3082589B1 (de) | 2023-06-07 |
Family
ID=53403830
Family Applications (1)
| Application Number | Title | Priority Date | Filing Date |
|---|---|---|---|
| EP14872643.3A Active EP3082589B1 (de) | 2013-12-20 | 2014-12-19 | Verfahren zur ekg-signalverarbeitung und vorrichtung zur durchführung des verfahrens |
Country Status (3)
| Country | Link |
|---|---|
| US (1) | US9949655B2 (de) |
| EP (1) | EP3082589B1 (de) |
| WO (1) | WO2015090260A2 (de) |
Families Citing this family (3)
| Publication number | Priority date | Publication date | Assignee | Title |
|---|---|---|---|---|
| EP3318185A1 (de) | 2016-11-04 | 2018-05-09 | Aalborg Universitet | Verfahren und vorrichtung zur analyse des zustands eines herzen |
| ES3012846T3 (en) * | 2019-11-29 | 2025-04-10 | Institute Of Scient Instruments Of The Czech Academy Of Sciences V V I | Method of electrocardiographic signal processing and apparatus for performing the method |
| EP4627997A1 (de) | 2024-04-04 | 2025-10-08 | Institute of Scientific Instruments of the Czech Academy of Sciences, v. v. i. | Verfahren zur verarbeitung eines elektrokardiogramms |
Family Cites Families (8)
| Publication number | Priority date | Publication date | Assignee | Title |
|---|---|---|---|---|
| US4792145A (en) | 1985-11-05 | 1988-12-20 | Sound Enhancement Systems, Inc. | Electronic stethoscope system and method |
| US5655540A (en) | 1995-04-06 | 1997-08-12 | Seegobin; Ronald D. | Noninvasive method for identifying coronary artery disease utilizing electrocardiography derived data |
| EP1377913A4 (de) * | 2001-03-19 | 2008-02-20 | B S P Biolog Signal Proc Ltd | Verfahren und vorrichtung zur effizienten darstellung periodischer und nahezu periodischer signale zur analyse |
| US7113820B2 (en) * | 2001-07-12 | 2006-09-26 | The United States Of America As Represented By The Administration Of The National Aeronautics And Space Administration | Real-time, high frequency QRS electrocardiograph |
| WO2003082077A2 (en) * | 2002-03-26 | 2003-10-09 | National Aeronautics And Space Administration | System for the diagnosis and monitoring of coronary artery disease, acute coronary syndromes, cardiomyopathy and other cardiac conditions |
| US8706201B2 (en) * | 2004-05-01 | 2014-04-22 | Bsp Biological Signal Processing Ltd. | Apparatus and method for analysis of high frequency QRS complexes |
| EP2051622A4 (de) * | 2006-08-03 | 2011-11-02 | B S P Biolog Signal Proc Ltd | Gerät und verfahren zur identifizierung von myokardischämie mittels analyse von hochfrequenz-qrs-potentialen |
| CN101902959B (zh) * | 2007-12-18 | 2013-11-20 | 皇家飞利浦电子股份有限公司 | 利用在解剖意义上取向的ecg数据显示自动识别发病冠状动脉 |
-
2014
- 2014-12-19 WO PCT/CZ2014/000163 patent/WO2015090260A2/en not_active Ceased
- 2014-12-19 US US15/105,926 patent/US9949655B2/en active Active
- 2014-12-19 EP EP14872643.3A patent/EP3082589B1/de active Active
Also Published As
| Publication number | Publication date |
|---|---|
| WO2015090260A2 (en) | 2015-06-25 |
| EP3082589A2 (de) | 2016-10-26 |
| US9949655B2 (en) | 2018-04-24 |
| WO2015090260A3 (en) | 2016-05-19 |
| US20170007140A1 (en) | 2017-01-12 |
Similar Documents
| Publication | Publication Date | Title |
|---|---|---|
| JP6219942B2 (ja) | 心電図におけるリアルタイムqrs期間測定 | |
| US11109794B2 (en) | Method and apparatus for processing ECG signals, and ECG machine | |
| US8321005B2 (en) | System for continuous cardiac pathology detection and characterization | |
| US10973465B2 (en) | Pacing signal processing method, system and electrocardiogram monitor | |
| EP2170163B1 (de) | Verfahren zur messung von arznei-induzierten veränderungen der kardialen ionenkanal-funktion und relevantes gerät | |
| Curtin et al. | QRS complex detection and measurement algorithms for multichannel ECGs in cardiac resynchronization therapy patients | |
| WO2019051473A1 (en) | TIME-FREQUENCY ANALYSIS OF ELECTROCARDIOGRAMS | |
| CN109431487B (zh) | 心电图动态实时分析数据中室性心搏典型数据的识别方法 | |
| US9949655B2 (en) | Method of EKG signal processing and apparatus for performing the method | |
| US11517243B2 (en) | Method of electrocardiographic signal processing and apparatus for performing the method | |
| Fereniec et al. | An Analysis of the U‐Wave and Its Relation to the T‐Wave in Body Surface Potential Maps for Healthy Subjects and MI Patients | |
| US8731647B2 (en) | Method and system for analyzing the cardiac activity of a patient and uses thereof | |
| RU2481060C1 (ru) | Способ обработки электрокардиосигнала | |
| Holobar et al. | A signal-based approach for assessing the accuracy of high-density surface EMG decomposition | |
| KR20150081763A (ko) | 심전도 신호의 저전력 고효율 r파 검출 방법 및 시스템 | |
| CN112401904A (zh) | 判断心电图的r波波峰点的方法 | |
| EP4627997A1 (de) | Verfahren zur verarbeitung eines elektrokardiogramms | |
| EP4241691B1 (de) | Signalanalysevorrichtung, signalanalyseverfahren und programm | |
| Leinveber et al. | The relationship between mechanical and electrical dyssynchrony | |
| CZ2014351A3 (cs) | Způsob vyhodnocení signálu EKG a zařízení pro provádění tohoto způsobu | |
| Ahmad et al. | An improved QRS complex detection for online medical diagnosis | |
| Jurak et al. | Can we hear ventricle dyssynchrony? Yes, we can | |
| Shams et al. | Home ECG system: Signal processing and remote transmission | |
| EP2954841A1 (de) | Detektion und überwachung mithilfe hochfrequenter elektrogrammanalyse | |
| CN117898741A (zh) | 心脏起搏器植入检测方法、系统及计算机可读介质 |
Legal Events
| Date | Code | Title | Description |
|---|---|---|---|
| PUAI | Public reference made under article 153(3) epc to a published international application that has entered the european phase |
Free format text: ORIGINAL CODE: 0009012 |
|
| 17P | Request for examination filed |
Effective date: 20160714 |
|
| AK | Designated contracting states |
Kind code of ref document: A2 Designated state(s): AL AT BE BG CH CY CZ DE DK EE ES FI FR GB GR HR HU IE IS IT LI LT LU LV MC MK MT NL NO PL PT RO RS SE SI SK SM TR |
|
| AX | Request for extension of the european patent |
Extension state: BA ME |
|
| RIN1 | Information on inventor provided before grant (corrected) |
Inventor name: PLESINGER, FILIP Inventor name: LIPOLDOVA, JOLANA Inventor name: KLIMES, PETR Inventor name: ZEMAN, KAREL Inventor name: KUNA, MICHAL Inventor name: REICHLOVA, TEREZA Inventor name: NOVAK, MIROSLAV Inventor name: VISCOR, IVO Inventor name: MELUZIN, JAROSLAV Inventor name: LEINVEBER, PAVEL Inventor name: JURAK, PAVEL Inventor name: SUMBERA, JOSEF Inventor name: HALAMEK, JOSEF Inventor name: VESELY, PETR Inventor name: VONDRA, VLASTIMIL |
|
| DAX | Request for extension of the european patent (deleted) | ||
| STAA | Information on the status of an ep patent application or granted ep patent |
Free format text: STATUS: EXAMINATION IS IN PROGRESS |
|
| 17Q | First examination report despatched |
Effective date: 20200227 |
|
| REG | Reference to a national code |
Ref country code: DE Ref legal event code: R079 Ipc: A61B0005300000 Ref country code: DE Ref legal event code: R079 Ref document number: 602014087277 Country of ref document: DE Free format text: PREVIOUS MAIN CLASS: A61B0005047200 Ipc: A61B0005300000 |
|
| GRAP | Despatch of communication of intention to grant a patent |
Free format text: ORIGINAL CODE: EPIDOSNIGR1 |
|
| STAA | Information on the status of an ep patent application or granted ep patent |
Free format text: STATUS: GRANT OF PATENT IS INTENDED |
|
| RIC1 | Information provided on ipc code assigned before grant |
Ipc: A61B 5/02 19680901ALI20230106BHEP Ipc: A61B 5/00 19680901ALI20230106BHEP Ipc: A61B 5/366 20210101ALI20230106BHEP Ipc: A61B 5/352 20210101ALI20230106BHEP Ipc: A61B 5/30 20210101AFI20230106BHEP |
|
| INTG | Intention to grant announced |
Effective date: 20230210 |
|
| GRAS | Grant fee paid |
Free format text: ORIGINAL CODE: EPIDOSNIGR3 |
|
| GRAA | (expected) grant |
Free format text: ORIGINAL CODE: 0009210 |
|
| STAA | Information on the status of an ep patent application or granted ep patent |
Free format text: STATUS: THE PATENT HAS BEEN GRANTED |
|
| AK | Designated contracting states |
Kind code of ref document: B1 Designated state(s): AL AT BE BG CH CY CZ DE DK EE ES FI FR GB GR HR HU IE IS IT LI LT LU LV MC MK MT NL NO PL PT RO RS SE SI SK SM TR |
|
| REG | Reference to a national code |
Ref country code: GB Ref legal event code: FG4D |
|
| REG | Reference to a national code |
Ref country code: CH Ref legal event code: EP Ref country code: AT Ref legal event code: REF Ref document number: 1572370 Country of ref document: AT Kind code of ref document: T Effective date: 20230615 |
|
| REG | Reference to a national code |
Ref country code: DE Ref legal event code: R096 Ref document number: 602014087277 Country of ref document: DE |
|
| P01 | Opt-out of the competence of the unified patent court (upc) registered |
Effective date: 20230608 |
|
| REG | Reference to a national code |
Ref country code: LT Ref legal event code: MG9D |
|
| REG | Reference to a national code |
Ref country code: NL Ref legal event code: MP Effective date: 20230607 |
|
| PG25 | Lapsed in a contracting state [announced via postgrant information from national office to epo] |
Ref country code: SE Free format text: LAPSE BECAUSE OF FAILURE TO SUBMIT A TRANSLATION OF THE DESCRIPTION OR TO PAY THE FEE WITHIN THE PRESCRIBED TIME-LIMIT Effective date: 20230607 Ref country code: NO Free format text: LAPSE BECAUSE OF FAILURE TO SUBMIT A TRANSLATION OF THE DESCRIPTION OR TO PAY THE FEE WITHIN THE PRESCRIBED TIME-LIMIT Effective date: 20230907 Ref country code: ES Free format text: LAPSE BECAUSE OF FAILURE TO SUBMIT A TRANSLATION OF THE DESCRIPTION OR TO PAY THE FEE WITHIN THE PRESCRIBED TIME-LIMIT Effective date: 20230607 |
|
| REG | Reference to a national code |
Ref country code: AT Ref legal event code: MK05 Ref document number: 1572370 Country of ref document: AT Kind code of ref document: T Effective date: 20230607 |
|
| PG25 | Lapsed in a contracting state [announced via postgrant information from national office to epo] |
Ref country code: RS Free format text: LAPSE BECAUSE OF FAILURE TO SUBMIT A TRANSLATION OF THE DESCRIPTION OR TO PAY THE FEE WITHIN THE PRESCRIBED TIME-LIMIT Effective date: 20230607 Ref country code: NL Free format text: LAPSE BECAUSE OF FAILURE TO SUBMIT A TRANSLATION OF THE DESCRIPTION OR TO PAY THE FEE WITHIN THE PRESCRIBED TIME-LIMIT Effective date: 20230607 Ref country code: LV Free format text: LAPSE BECAUSE OF FAILURE TO SUBMIT A TRANSLATION OF THE DESCRIPTION OR TO PAY THE FEE WITHIN THE PRESCRIBED TIME-LIMIT Effective date: 20230607 Ref country code: LT Free format text: LAPSE BECAUSE OF FAILURE TO SUBMIT A TRANSLATION OF THE DESCRIPTION OR TO PAY THE FEE WITHIN THE PRESCRIBED TIME-LIMIT Effective date: 20230607 Ref country code: HR Free format text: LAPSE BECAUSE OF FAILURE TO SUBMIT A TRANSLATION OF THE DESCRIPTION OR TO PAY THE FEE WITHIN THE PRESCRIBED TIME-LIMIT Effective date: 20230607 Ref country code: GR Free format text: LAPSE BECAUSE OF FAILURE TO SUBMIT A TRANSLATION OF THE DESCRIPTION OR TO PAY THE FEE WITHIN THE PRESCRIBED TIME-LIMIT Effective date: 20230908 |
|
| PG25 | Lapsed in a contracting state [announced via postgrant information from national office to epo] |
Ref country code: FI Free format text: LAPSE BECAUSE OF FAILURE TO SUBMIT A TRANSLATION OF THE DESCRIPTION OR TO PAY THE FEE WITHIN THE PRESCRIBED TIME-LIMIT Effective date: 20230607 |
|
| PG25 | Lapsed in a contracting state [announced via postgrant information from national office to epo] |
Ref country code: SK Free format text: LAPSE BECAUSE OF FAILURE TO SUBMIT A TRANSLATION OF THE DESCRIPTION OR TO PAY THE FEE WITHIN THE PRESCRIBED TIME-LIMIT Effective date: 20230607 |
|
| PG25 | Lapsed in a contracting state [announced via postgrant information from national office to epo] |
Ref country code: IS Free format text: LAPSE BECAUSE OF FAILURE TO SUBMIT A TRANSLATION OF THE DESCRIPTION OR TO PAY THE FEE WITHIN THE PRESCRIBED TIME-LIMIT Effective date: 20231007 |
|
| PG25 | Lapsed in a contracting state [announced via postgrant information from national office to epo] |
Ref country code: SM Free format text: LAPSE BECAUSE OF FAILURE TO SUBMIT A TRANSLATION OF THE DESCRIPTION OR TO PAY THE FEE WITHIN THE PRESCRIBED TIME-LIMIT Effective date: 20230607 Ref country code: SK Free format text: LAPSE BECAUSE OF FAILURE TO SUBMIT A TRANSLATION OF THE DESCRIPTION OR TO PAY THE FEE WITHIN THE PRESCRIBED TIME-LIMIT Effective date: 20230607 Ref country code: RO Free format text: LAPSE BECAUSE OF FAILURE TO SUBMIT A TRANSLATION OF THE DESCRIPTION OR TO PAY THE FEE WITHIN THE PRESCRIBED TIME-LIMIT Effective date: 20230607 Ref country code: PT Free format text: LAPSE BECAUSE OF FAILURE TO SUBMIT A TRANSLATION OF THE DESCRIPTION OR TO PAY THE FEE WITHIN THE PRESCRIBED TIME-LIMIT Effective date: 20231009 Ref country code: IS Free format text: LAPSE BECAUSE OF FAILURE TO SUBMIT A TRANSLATION OF THE DESCRIPTION OR TO PAY THE FEE WITHIN THE PRESCRIBED TIME-LIMIT Effective date: 20231007 Ref country code: EE Free format text: LAPSE BECAUSE OF FAILURE TO SUBMIT A TRANSLATION OF THE DESCRIPTION OR TO PAY THE FEE WITHIN THE PRESCRIBED TIME-LIMIT Effective date: 20230607 Ref country code: AT Free format text: LAPSE BECAUSE OF FAILURE TO SUBMIT A TRANSLATION OF THE DESCRIPTION OR TO PAY THE FEE WITHIN THE PRESCRIBED TIME-LIMIT Effective date: 20230607 |
|
| PG25 | Lapsed in a contracting state [announced via postgrant information from national office to epo] |
Ref country code: PL Free format text: LAPSE BECAUSE OF FAILURE TO SUBMIT A TRANSLATION OF THE DESCRIPTION OR TO PAY THE FEE WITHIN THE PRESCRIBED TIME-LIMIT Effective date: 20230607 |
|
| REG | Reference to a national code |
Ref country code: DE Ref legal event code: R097 Ref document number: 602014087277 Country of ref document: DE |
|
| PLBE | No opposition filed within time limit |
Free format text: ORIGINAL CODE: 0009261 |
|
| STAA | Information on the status of an ep patent application or granted ep patent |
Free format text: STATUS: NO OPPOSITION FILED WITHIN TIME LIMIT |
|
| PG25 | Lapsed in a contracting state [announced via postgrant information from national office to epo] |
Ref country code: DK Free format text: LAPSE BECAUSE OF FAILURE TO SUBMIT A TRANSLATION OF THE DESCRIPTION OR TO PAY THE FEE WITHIN THE PRESCRIBED TIME-LIMIT Effective date: 20230607 |
|
| PG25 | Lapsed in a contracting state [announced via postgrant information from national office to epo] |
Ref country code: SI Free format text: LAPSE BECAUSE OF FAILURE TO SUBMIT A TRANSLATION OF THE DESCRIPTION OR TO PAY THE FEE WITHIN THE PRESCRIBED TIME-LIMIT Effective date: 20230607 |
|
| 26N | No opposition filed |
Effective date: 20240308 |
|
| PG25 | Lapsed in a contracting state [announced via postgrant information from national office to epo] |
Ref country code: SI Free format text: LAPSE BECAUSE OF FAILURE TO SUBMIT A TRANSLATION OF THE DESCRIPTION OR TO PAY THE FEE WITHIN THE PRESCRIBED TIME-LIMIT Effective date: 20230607 Ref country code: IT Free format text: LAPSE BECAUSE OF FAILURE TO SUBMIT A TRANSLATION OF THE DESCRIPTION OR TO PAY THE FEE WITHIN THE PRESCRIBED TIME-LIMIT Effective date: 20230607 |
|
| PG25 | Lapsed in a contracting state [announced via postgrant information from national office to epo] |
Ref country code: LU Free format text: LAPSE BECAUSE OF NON-PAYMENT OF DUE FEES Effective date: 20231219 |
|
| PG25 | Lapsed in a contracting state [announced via postgrant information from national office to epo] |
Ref country code: MC Free format text: LAPSE BECAUSE OF FAILURE TO SUBMIT A TRANSLATION OF THE DESCRIPTION OR TO PAY THE FEE WITHIN THE PRESCRIBED TIME-LIMIT Effective date: 20230607 |
|
| REG | Reference to a national code |
Ref country code: BE Ref legal event code: MM Effective date: 20231231 |
|
| PG25 | Lapsed in a contracting state [announced via postgrant information from national office to epo] |
Ref country code: MC Free format text: LAPSE BECAUSE OF FAILURE TO SUBMIT A TRANSLATION OF THE DESCRIPTION OR TO PAY THE FEE WITHIN THE PRESCRIBED TIME-LIMIT Effective date: 20230607 Ref country code: LU Free format text: LAPSE BECAUSE OF NON-PAYMENT OF DUE FEES Effective date: 20231219 |
|
| REG | Reference to a national code |
Ref country code: IE Ref legal event code: MM4A |
|
| PG25 | Lapsed in a contracting state [announced via postgrant information from national office to epo] |
Ref country code: IE Free format text: LAPSE BECAUSE OF NON-PAYMENT OF DUE FEES Effective date: 20231219 |
|
| PG25 | Lapsed in a contracting state [announced via postgrant information from national office to epo] |
Ref country code: BE Free format text: LAPSE BECAUSE OF NON-PAYMENT OF DUE FEES Effective date: 20231231 |
|
| PG25 | Lapsed in a contracting state [announced via postgrant information from national office to epo] |
Ref country code: IE Free format text: LAPSE BECAUSE OF NON-PAYMENT OF DUE FEES Effective date: 20231219 Ref country code: BE Free format text: LAPSE BECAUSE OF NON-PAYMENT OF DUE FEES Effective date: 20231231 |
|
| PG25 | Lapsed in a contracting state [announced via postgrant information from national office to epo] |
Ref country code: BG Free format text: LAPSE BECAUSE OF FAILURE TO SUBMIT A TRANSLATION OF THE DESCRIPTION OR TO PAY THE FEE WITHIN THE PRESCRIBED TIME-LIMIT Effective date: 20230607 |
|
| PG25 | Lapsed in a contracting state [announced via postgrant information from national office to epo] |
Ref country code: BG Free format text: LAPSE BECAUSE OF FAILURE TO SUBMIT A TRANSLATION OF THE DESCRIPTION OR TO PAY THE FEE WITHIN THE PRESCRIBED TIME-LIMIT Effective date: 20230607 |
|
| PG25 | Lapsed in a contracting state [announced via postgrant information from national office to epo] |
Ref country code: CY Free format text: LAPSE BECAUSE OF FAILURE TO SUBMIT A TRANSLATION OF THE DESCRIPTION OR TO PAY THE FEE WITHIN THE PRESCRIBED TIME-LIMIT; INVALID AB INITIO Effective date: 20141219 |
|
| PG25 | Lapsed in a contracting state [announced via postgrant information from national office to epo] |
Ref country code: HU Free format text: LAPSE BECAUSE OF FAILURE TO SUBMIT A TRANSLATION OF THE DESCRIPTION OR TO PAY THE FEE WITHIN THE PRESCRIBED TIME-LIMIT; INVALID AB INITIO Effective date: 20141219 |
|
| PG25 | Lapsed in a contracting state [announced via postgrant information from national office to epo] |
Ref country code: TR Free format text: LAPSE BECAUSE OF FAILURE TO SUBMIT A TRANSLATION OF THE DESCRIPTION OR TO PAY THE FEE WITHIN THE PRESCRIBED TIME-LIMIT Effective date: 20230607 |
|
| REG | Reference to a national code |
Ref country code: CH Ref legal event code: U11 Free format text: ST27 STATUS EVENT CODE: U-0-0-U10-U11 (AS PROVIDED BY THE NATIONAL OFFICE) Effective date: 20260101 |
|
| PGFP | Annual fee paid to national office [announced via postgrant information from national office to epo] |
Ref country code: DE Payment date: 20251211 Year of fee payment: 12 |
|
| PGFP | Annual fee paid to national office [announced via postgrant information from national office to epo] |
Ref country code: GB Payment date: 20251219 Year of fee payment: 12 |
|
| PGFP | Annual fee paid to national office [announced via postgrant information from national office to epo] |
Ref country code: FR Payment date: 20251223 Year of fee payment: 12 |
|
| PGFP | Annual fee paid to national office [announced via postgrant information from national office to epo] |
Ref country code: CZ Payment date: 20251021 Year of fee payment: 12 |
|
| PGFP | Annual fee paid to national office [announced via postgrant information from national office to epo] |
Ref country code: CH Payment date: 20260101 Year of fee payment: 12 |