EP3073327A1 - Image forming apparatus that generates conversion condition of a measuring means, and control method of the image forming apparatus - Google Patents
Image forming apparatus that generates conversion condition of a measuring means, and control method of the image forming apparatus Download PDFInfo
- Publication number
- EP3073327A1 EP3073327A1 EP16161450.8A EP16161450A EP3073327A1 EP 3073327 A1 EP3073327 A1 EP 3073327A1 EP 16161450 A EP16161450 A EP 16161450A EP 3073327 A1 EP3073327 A1 EP 3073327A1
- Authority
- EP
- European Patent Office
- Prior art keywords
- image
- measuring
- image forming
- test
- sheet
- Prior art date
- Legal status (The legal status is an assumption and is not a legal conclusion. Google has not performed a legal analysis and makes no representation as to the accuracy of the status listed.)
- Granted
Links
- 238000006243 chemical reaction Methods 0.000 title claims abstract description 90
- 238000000034 method Methods 0.000 title claims description 8
- 238000012360 testing method Methods 0.000 claims abstract description 103
- 238000012546 transfer Methods 0.000 claims abstract description 94
- 238000012937 correction Methods 0.000 claims abstract description 79
- 238000005259 measurement Methods 0.000 claims abstract description 48
- 230000001678 irradiating effect Effects 0.000 claims 1
- 108091008695 photoreceptors Proteins 0.000 claims 1
- 238000001514 detection method Methods 0.000 description 49
- 238000010586 diagram Methods 0.000 description 20
- 230000000007 visual effect Effects 0.000 description 17
- 238000012545 processing Methods 0.000 description 14
- 230000006870 function Effects 0.000 description 12
- 230000007423 decrease Effects 0.000 description 7
- 238000012216 screening Methods 0.000 description 4
- 239000003795 chemical substances by application Substances 0.000 description 3
- 239000000428 dust Substances 0.000 description 3
- 238000009499 grossing Methods 0.000 description 3
- 239000003086 colorant Substances 0.000 description 2
- 238000005516 engineering process Methods 0.000 description 2
- 238000010438 heat treatment Methods 0.000 description 2
- 230000001788 irregular Effects 0.000 description 2
- 239000004973 liquid crystal related substance Substances 0.000 description 2
- 230000003595 spectral effect Effects 0.000 description 2
- 238000011179 visual inspection Methods 0.000 description 2
- 230000009286 beneficial effect Effects 0.000 description 1
- 230000002542 deteriorative effect Effects 0.000 description 1
- 238000009792 diffusion process Methods 0.000 description 1
- 230000007613 environmental effect Effects 0.000 description 1
- 239000000284 extract Substances 0.000 description 1
- 238000013507 mapping Methods 0.000 description 1
- 239000011159 matrix material Substances 0.000 description 1
- 238000012986 modification Methods 0.000 description 1
- 230000004048 modification Effects 0.000 description 1
- 230000007704 transition Effects 0.000 description 1
Images


Classifications
-
- G—PHYSICS
- G03—PHOTOGRAPHY; CINEMATOGRAPHY; ANALOGOUS TECHNIQUES USING WAVES OTHER THAN OPTICAL WAVES; ELECTROGRAPHY; HOLOGRAPHY
- G03G—ELECTROGRAPHY; ELECTROPHOTOGRAPHY; MAGNETOGRAPHY
- G03G15/00—Apparatus for electrographic processes using a charge pattern
- G03G15/50—Machine control of apparatus for electrographic processes using a charge pattern, e.g. regulating differents parts of the machine, multimode copiers, microprocessor control
- G03G15/5033—Machine control of apparatus for electrographic processes using a charge pattern, e.g. regulating differents parts of the machine, multimode copiers, microprocessor control by measuring the photoconductor characteristics, e.g. temperature, or the characteristics of an image on the photoconductor
- G03G15/5041—Detecting a toner image, e.g. density, toner coverage, using a test patch
-
- G—PHYSICS
- G03—PHOTOGRAPHY; CINEMATOGRAPHY; ANALOGOUS TECHNIQUES USING WAVES OTHER THAN OPTICAL WAVES; ELECTROGRAPHY; HOLOGRAPHY
- G03G—ELECTROGRAPHY; ELECTROPHOTOGRAPHY; MAGNETOGRAPHY
- G03G15/00—Apparatus for electrographic processes using a charge pattern
- G03G15/50—Machine control of apparatus for electrographic processes using a charge pattern, e.g. regulating differents parts of the machine, multimode copiers, microprocessor control
- G03G15/5054—Machine control of apparatus for electrographic processes using a charge pattern, e.g. regulating differents parts of the machine, multimode copiers, microprocessor control by measuring the characteristics of an intermediate image carrying member or the characteristics of an image on an intermediate image carrying member, e.g. intermediate transfer belt or drum, conveyor belt
- G03G15/5058—Machine control of apparatus for electrographic processes using a charge pattern, e.g. regulating differents parts of the machine, multimode copiers, microprocessor control by measuring the characteristics of an intermediate image carrying member or the characteristics of an image on an intermediate image carrying member, e.g. intermediate transfer belt or drum, conveyor belt using a test patch
-
- G—PHYSICS
- G03—PHOTOGRAPHY; CINEMATOGRAPHY; ANALOGOUS TECHNIQUES USING WAVES OTHER THAN OPTICAL WAVES; ELECTROGRAPHY; HOLOGRAPHY
- G03G—ELECTROGRAPHY; ELECTROPHOTOGRAPHY; MAGNETOGRAPHY
- G03G15/00—Apparatus for electrographic processes using a charge pattern
-
- G—PHYSICS
- G03—PHOTOGRAPHY; CINEMATOGRAPHY; ANALOGOUS TECHNIQUES USING WAVES OTHER THAN OPTICAL WAVES; ELECTROGRAPHY; HOLOGRAPHY
- G03G—ELECTROGRAPHY; ELECTROPHOTOGRAPHY; MAGNETOGRAPHY
- G03G15/00—Apparatus for electrographic processes using a charge pattern
- G03G15/50—Machine control of apparatus for electrographic processes using a charge pattern, e.g. regulating differents parts of the machine, multimode copiers, microprocessor control
- G03G15/5062—Machine control of apparatus for electrographic processes using a charge pattern, e.g. regulating differents parts of the machine, multimode copiers, microprocessor control by measuring the characteristics of an image on the copy material
-
- H—ELECTRICITY
- H04—ELECTRIC COMMUNICATION TECHNIQUE
- H04N—PICTORIAL COMMUNICATION, e.g. TELEVISION
- H04N1/00—Scanning, transmission or reproduction of documents or the like, e.g. facsimile transmission; Details thereof
- H04N1/024—Details of scanning heads ; Means for illuminating the original
-
- H—ELECTRICITY
- H04—ELECTRIC COMMUNICATION TECHNIQUE
- H04N—PICTORIAL COMMUNICATION, e.g. TELEVISION
- H04N1/00—Scanning, transmission or reproduction of documents or the like, e.g. facsimile transmission; Details thereof
- H04N1/40—Picture signal circuits
- H04N1/407—Control or modification of tonal gradation or of extreme levels, e.g. background level
- H04N1/4076—Control or modification of tonal gradation or of extreme levels, e.g. background level dependent on references outside the picture
- H04N1/4078—Control or modification of tonal gradation or of extreme levels, e.g. background level dependent on references outside the picture using gradational references, e.g. grey-scale test pattern analysis
-
- H—ELECTRICITY
- H04—ELECTRIC COMMUNICATION TECHNIQUE
- H04N—PICTORIAL COMMUNICATION, e.g. TELEVISION
- H04N1/00—Scanning, transmission or reproduction of documents or the like, e.g. facsimile transmission; Details thereof
- H04N1/46—Colour picture communication systems
- H04N1/50—Picture reproducers
- H04N1/506—Reproducing the colour component signals picture-sequentially, e.g. with reproducing heads spaced apart from one another in the subscanning direction
Definitions
- the present invention relates to correction control for correction of characteristics of images formed by an image forming apparatus.
- Electrophotography type image forming apparatuses form images by forming an electrostatic latent image on a photosensitive member based on image data, and developing the electrostatic latent image using a developing agent (toner) within a developer unit.
- a developing agent toner
- a measuring image formed by the image forming apparatus is measured, and correction condition is corrected based on the results of the measurement.
- An image forming apparatus in U.S. Patent No. 8,229,307 forms a measuring image on a photosensitive member, measures the measuring image formed on the photosensitive member by a sensor, and corrects the density of the image formed by the image forming apparatus based on the results of measurement by the sensor.
- the present invention in its first aspect provides an image forming apparatus as specified in claims 1 to 12.
- the present invention in its second aspect provides a control method of an image forming apparatus as specified in claims 13 to 18.
- FIG. 1 is a schematic cross-sectional diagram of an image forming apparatus that forms full-color images.
- the image forming apparatus has four image forming stations 10Y, 10M, 10C, and 10K, and forms images on sheets P.
- the image forming station 10Y forms yellow images
- the image forming station 10M forms magenta images
- the image forming station 10C forms cyan images
- the image forming station 10K forms black images.
- Images for each color component formed by the image forming stations 10Y, 10M, 10C, and 10K, are transferred overlaid onto an intermediate transfer belt 6, thereby forming a full-color image on the intermediate transfer belt 6.
- the full-color image on the intermediate transfer belt 6 is transferred onto a sheet.
- a fixing unit 100 fixes to the sheet the image on the sheet, and thereafter the sheet is discharged from the image forming apparatus.
- the image forming stations 10Y, 10M, 10C, and 10K are each of the same configuration, other than developer units 4Y, 4M, 4C, and 4K accommodating toner of different color components.
- the configuration of the yellow image forming station 10Y will be described, and description of the configuration of the other image forming stations 10M, 10C, and 10K will be omitted.
- the image forming station 10Y has a photosensitive drum 1Y which has a photosensitive member formed on the surface thereof, a charger 2Y that has a charging roller connected to a high-voltage power source, an exposing device 3Y that exposes the photosensitive drum 1Y to form an electrostatic latent image, and the developer unit 4Y that develops the electrostatic latent image using toner.
- the image forming station 10Y further has a primary transfer roller 7Y facing the photosensitive drum 1Y across the later-described intermediate transfer belt 6, and a drum cleaner 8Y that recovers toner adhered to the photosensitive drum 1Y.
- the intermediate transfer belt 6 is supported by multiple rollers, and is rotationally driven by a driving roller connected to a motor omitted from illustration.
- a secondary transfer roller pair 9 forms a secondary transfer nip T2 across the intermediate transfer belt 6.
- the sheet P is conveyed toward the secondary transfer nip T2.
- the secondary transfer roller pair 9 is connected to a power source unit (omitted from illustration).
- the power source unit applies secondary transfer voltage to the secondary transfer roller pair 9 while the sheet P is passing through the secondary transfer nip T2, whereby the image on the intermediate transfer belt 6 is transferred onto the sheet P at the secondary transfer nip T2.
- a belt cleaner 11 presses a plate-shaped elastic member against the intermediate transfer belt 6 and recovers toner on the intermediate transfer belt 6.
- a density detection sensor 5 measures a measuring image formed on the intermediate transfer belt 6. The density detection sensor 5 will be described later with reference to Fig. 4 .
- the fixing unit 100 has a pair of rollers to press the sheet and a heater for heating the sheet, and fixes an unfixed image on the sheet P onto the sheet P by heating while pressing the sheet P.
- the sheet P onto which the image has been fixed is output from the image forming apparatus.
- the photosensitive drum 1Y in the image forming station 10Y is rotated in the direction indicated by an arrow by a motor omitted from illustration.
- the charger 2Y uniformly charges the photosensitive drum 1Y, and the exposing device 3Y exposes the photosensitive drum 1Y by exposure light. Accordingly, an electrostatic latent image corresponding to the yellow color component is formed on the photosensitive drum 1Y.
- the electrostatic latent image on the photosensitive drum 1Y is developed by the developer unit 4Y using yellow toner. A yellow image is formed on the photosensitive drum 1Y.
- the yellow image on the photosensitive drum 1Y is conveyed to the primary transfer nip where the primary transfer roller 7Y presses the photosensitive drum 1Y across the intermediate transfer belt 6 in accordance with rotation of the photosensitive drum 1Y in the direction of the arrow.
- Primary transfer voltage is applied to the primary transfer roller 7Y from a power source unit (omitted from illustration). Accordingly, the yellow image on the photosensitive drum 1Y is transferred onto the intermediate transfer belt 6 at the primary transfer nip.
- the residual toner on the photosensitive drum 1Y is removed by the drum cleaner 8Y.
- the images formed by the image forming station 10Y, 10M, 10C, and 10K, are transferred onto the intermediate transfer belt 6. Transferring the images overlaid into the intermediate transfer belt 6 forms a full-color image on the intermediate transfer belt 6.
- the image borne by the intermediate transfer belt 6 is conveyed to the secondary transfer nip T2.
- the sheet P is conveyed so that the image on the intermediate transfer belt 6 and the sheet P come into contact at the secondary transfer nip T2.
- the image on the intermediate transfer belt 6 is transferred into the sheet P by the secondary transfer roller pair 9 to which secondary transfer voltage is applied. Toner remaining on the intermediate transfer belt 6 without having been transferred onto the sheet P at the secondary transfer nip T2 is removed by the belt cleaner 11.
- the sheet P bearing the image is conveyed to the fixing unit 100.
- the fixing unit 100 applies heat and pressure to the sheet P bearing the unfixed image, thereby fixing the unfixed image onto the sheet P by fusing.
- a control unit 30 is a control circuit that controls each unit.
- Memory 40 stores a gamma look-up table (LUT), a conversion table Table_1 for converting sensor output values into density, and a conversion table Table_2 for correcting on-sheet density measured by the density detection sensor 5.
- the image forming station 10 corresponds to the image forming stations 10Y, 10M, 10C, and 10K in Fig. 1 .
- the image forming station 10 has already been described, so description will be omitted here.
- a network interface card (NIC) unit 21 transmits image data input via a network to a raster image processing (RIP) unit 22, and externally transmits apparatus information via a network.
- the RIP unit 22 analyzes image data described using a page description language (PDL), and renders image data.
- PDL page description language
- An image processing unit 60 corrects image data by performing various types of image processing on image data.
- the image processing unit 60 may be realized by an integrated circuit such as an application-specific integrated circuit (ASIC), or may be realized by a central processing unit (CPU) of the control unit 30 correcting the image data based on a program stored beforehand.
- ASIC application-specific integrated circuit
- CPU central processing unit
- An operating unit 80 has a power switch for the image forming apparatus, a mode selection button for selecting the mode of the image forming apparatus, a numeric keypad, an OK button, a liquid crystal screen, and so forth.
- the liquid crystal screen displays information relating to the remaining amount of toner accommodated in the developer units 4Y, 4M, 4C, and 4K, and displays images relating to image data.
- the density detection sensor 5 includes a light-emitting diode (LED) 51 and photodiodes 52 and 53.
- the LED 51 irradiates light on the measuring image, and the density detection sensor 5 receives reflected light from the measuring image by the photodiodes 52 and 53.
- the photodiodes 52 and 53 of the density detection sensor 5 output sensor output values (voltage values) in accordance with intensity of the reflected light from the measuring image.
- the LED 51 functions as an irradiation unit to irradiate light into the measuring image.
- the photodiodes 52 and 53 function as photodetectors that receive the reflected light from the measuring image.
- a pattern generator 70 generates image data for forming the measuring image.
- the pattern generator 70 outputs pattern image data in a case where a gradation correction mode to correct the gradation characteristics of the image forming station 10 is to be executed, and outputs test image data in a case where a visual adjustment mode to adjust a conversion table Table_2 is to be executed.
- the gradation correction mode will be described in detail with reference to Fig. 9
- the visual adjustment mode will be described in detail with reference to Fig. 8 .
- Image data input to the image processing unit 60 includes RGB data where the three color components of R (red), G (green), and B (blue) are expressed as numerical values, and CMYK data where the four color components are C (cyan), M (magenta), Y (yellow), and K (black).
- An output direct mapping unit 61 converts RGB data into CMYK data in a case where RGB data and image region data are transferred from the control unit 30 to the image processing unit 60.
- a gamma correction unit 62 corrects gradation characteristics of the image data.
- the density of images formed by the image forming apparatus are not the desired density. Accordingly, the gamma correction unit 62 corrects input signal values of the image data so that the density of the image formed by the image forming apparatus is the desired density.
- the gamma correction unit 62 corrects the gradation characteristics of image data (CMYK data) based on a gamma LUT_A and a gamma LUT_B sorted in the memory 40. Note that a gamma LUT_A and a gamma LUT_B are stored in the memory 40 for each color component.
- the gamma LUT_A and a gamma LUT_B correspond to gradation correction tables for correcting input signal values of image data into output signal values.
- the gamma LUT_A is a first correction condition for correcting the density of the image formed by the image forming apparatus.
- the gamma LUT_A is determined by experimentation.
- the density of images formed by the image forming apparatus changes depending on the ambient temperature and humidity around the image forming apparatus, the number of images formed, the developing agent charge amount, and so forth. Accordingly, the image forming apparatus has the gamma LUT_B for correcting the correction results by the gamma LUT_A in accordance with the state of the image forming apparatus.
- the gamma LUT_B is a second correction condition for correcting the image data converted based on the gamma LUT_A into image data suitable for the current state of the image forming apparatus.
- the gamma LUT_B is corrected as appropriate in accordance with the current state of the image forming apparatus. Accordingly, the image forming apparatus has the gradation correction mode to update the gamma LUT_B.
- a halftone processing unit 63 subjects the image data (CMYK data) corrected by the gamma correction unit 62 to screening suitable for image region data. Accordingly, the multi-value data of the image data (CMYK data) at each pixel is converted into binary data at each pixel. For example, screening is performed using a dithering matrix, so that text regions are printed clearly. Photograph image regions are subjected to screening using error diffusion so that moire occurs less readily, for example. Screening is a known technology, so detailed description will be omitted.
- a smoothing processing unit 64 corrects image data so that unevenness at the edge portion of the image is smoothed.
- the smoothing processing unit 64 extracts the edge portion of the image by pattern matching, and selectively converts the data at the edge portion of the image that has been extracted.
- the image data corrected by the smoothing processing unit 64 is transferred to the exposing device 3 of the image forming station 10.
- the exposing device 3 is controlled based on the image data converted by the image processing unit 60.
- the light of the exposing device 3 exposes the photosensitive drum 1, and an electrostatic latent image based on the image data is formed on the photosensitive drum 1.
- the density detection sensor 5 includes the LED 51, photodiodes 52 and 53, a casing that accommodates an electric circuit board (omitted from illustration) and the aforementioned parts of the density detection sensor 5, and a window 54 provided in the casing.
- the LED 51 irradiates light on the measuring image on the intermediate transfer belt 6.
- the wavelength of the light irradiated from the LED 51 is 800 to 850 nm for example, taking into consideration the spectral reflectance of the toner.
- the photodiode 52 receives light of regular reflectance from the measuring image on the intermediate transfer belt 6.
- the photodiode 53 receives irregular reflection light from the measuring image on the intermediate transfer belt 6.
- the photodiodes 52 and 53 output sensor output values (voltage values) corresponding to the intensity of the reflected light from the measuring image.
- the sensor output value of the photodiode 52 is used in a case of detecting the density of a black measuring image formed on the sheet P.
- the sensor output value of the photodiode 53 is used in a case of detecting the density of yellow, magenta, and cyan measuring images formed on the sheet P.
- the density detection sensor 5 measures the spectral reflection light from the measuring image in a case of measuring the density of the black measuring image, and measures the irregular reflection light from the measuring image in a case of measuring the density of the yellow measuring image, the density of the magenta measuring image, and the density of the cyan measuring image. Description will be made here regarding a case of the density detection sensor 5 measuring the black measuring image formed on the intermediate transfer belt 6 by the image forming station 10K.
- the LED 51 of the density detection sensor 5 irradiates light on the intermediate transfer belt 6.
- the region irradiated by light from the LED 51 corresponds to the measurement position.
- the photodiode 52 receives reflected light from the measuring image (black) while the measuring image (black) on the intermediate transfer belt 6 passes the measurement position of the density detection sensor 5.
- the sensor output values (voltage values) output from the photodiode 52 while the photodiode 52 is receiving reflected light from the measuring image (black) corresponds to the amount of toner adhered (adherence amount) in the measuring image (black). That is to say, the sensor output value output from the photodiode 52 is a value that corresponds to the density of the measuring image.
- the control unit 30 converts the sensor output values of the photodiode 52 into density value Dblack of the black measuring image, based on conversion table Table_1.
- the control unit 30 corrects the density value Dblack based on conversion table Table_2. That is to say, the conversion tables Table_ 1 and Table_2 are a conversion condition for conversion of sensor output values output from the photodiode 52 into density values of the measuring image. Further, the density value corresponds to density data.
- the conversion table Table_2 is data representing the correlation between the density values before correction and the density values after correction. In a case where the conversion table Table_2 is not changed, the density values before correction and the density values after correction are the same.
- the control unit 30 converts the sensor output values into density values, based on both conversion tables Table_ 1 and Table_2. Accordingly, in a case where the conversion table Table_2 is changed, the density values converted from the sensor output values also change. Accordingly, in a case where the density of the measuring image cannot be detected from the sensor output values with high accuracy, the control unit 30 alters the conversion table Table_2. That is to say, the control unit 30 alters the conversion table Table_2 and changes the conversion condition. Accordingly, the control unit 30 can detect density from the sensor output values with high accuracy, based on the conversion table Table_1 and the altered conversion table Table_2.
- the control unit 30 converts the sensor output values of the photodiode 53 into density values of the yellow measuring image, based on the conversion tables Table_ 1 and Table_2 corresponding to the yellow measuring image. In the same way, in a case where a magenta measuring image is measured, the control unit 30 converts the sensor output values of the photodiode 53 into density values of the magenta measuring image, based on the conversion tables Table_ 1 and Table_2 corresponding to the magenta measuring image.
- the control unit 30 converts the sensor output values of the photodiode 53 into density values of the cyan measuring image, based on the conversion tables Table_ 1 and Table_2 corresponding to the cyan measuring image.
- the memory 40 stores conversion tables Table_1 for four colors and conversion tables Table_2 for four colors beforehand.
- Fig. 5A is a diagram illustrating the relationship between the amount of toner on the belt for the black measuring image formed on the intermediate transfer belt 6, and the sensor output value of the photodiode 52.
- the sensor output value of the photodiode 52 decreases as the amount of toner on the belt for the measuring image increases, as illustrated in Fig. 5A . This is because the light irradiated from the LED 51 is absorbed by the black measuring image, so the more the amount of toner adhered for the black measuring image increases, the lower the intensity of regular reflection light received at the photodiode 52 is.
- Fig. 5B is a diagram illustrating the relationship between the amount of toner on the belt for the measuring image, and the density of the measuring image when the measuring image is formed on a sheet (on-sheet density). The more the amount of toner on the belt for the measuring image formed on the intermediate transfer belt 6 increases, the darker the density of the measuring image formed on the sheet is.
- Fig. 5C is a diagram illustrating the relationship between the sensor output value of the photodiode 52 corresponding to the reflection light from the measuring image on the intermediate transfer belt 6, and the density of the measuring image when the measuring image is formed on a sheet (on-sheet density).
- the data illustrated in Fig. 5C corresponds to the conversion table Table_1 for converting the sensor output values corresponding to the black measuring image into the density values Dblack.
- the correlation between the sensor output values and the on-sheet density in Fig. 5C is determined beforehand by experimentation.
- the conversion table Table_1 is set according to the correlation in Fig. 5C , and stored in the memory 40 beforehand.
- one or other of the sensor output value of the photodiodes 52 and 53 was used for detecting on-sheet density of the measuring image.
- a configuration may be made where intermediate data is determined based on both of the sensor output value of the photodiode 52 and the sensor output value of the photodiode 53, and this intermediate data is converted into on-sheet density.
- the intermediate data is the difference between the sensor output value of the photodiode 52, and the sensor output value of the photodiode 53 multiplied by a coefficient.
- the coefficient is determined beforehand for each color.
- the control unit 30 can detect the on-sheet density of the measuring image by referencing conversion data for converting the intermediate data into on-sheet density of the measuring image.
- the correlation between the sensor output value of the measuring image on the intermediate transfer belt 6 and the on-sheet density of the measuring image changes.
- the reflection light from the surface of the intermediate transfer belt 6 changes. Accordingly, error occurs in the sensor output value particularly in cases of measuring a low-density measuring image where the toner coverage is low.
- the surface of the intermediate transfer belt 6 is rough, error occurs in the sensor output values of the photodiodes 52 and 53, so the on-sheet density of the measuring image cannot be detected with high accuracy.
- the proportion of toner transferred from the intermediate transfer belt 6 onto the sheet P at the secondary transfer nip T2 changes depending on the temperature and humidity around the image forming apparatus. Accordingly, in a case where the temperature and humidity around the image forming apparatus changes, there has been a possibility of the relationship between the amount of toner of the measuring image formed on the intermediate transfer belt 6 and the density of the measuring image formed on the sheet P (on-sheet density) changing. Further, the proportion of toner transferred from the intermediate transfer belt 6 onto the sheet P at the secondary transfer nip T2 (transfer efficiency) changes depending in a case where the secondary transfer roller pair 9 has deteriorated over time. This is because the resistance value of the secondary transfer roller pair 9 changes by deteriorating over time.
- the control unit 30 alters the conversion table Table_2 based on the density information of the measuring image formed on the sheet P and the sensor output value of the measuring image, in order to detect the on-sheet density of the measuring image with high accuracy based on the measurement results of the measuring image formed on the intermediate transfer belt 6.
- the altered conversion table Table_2 reduces the measurement error of the density detection sensor 5 even if the window 54 of the density detection sensor 5 is soiled, so measurement results of the measuring image can be compensated with high accuracy.
- the altered conversion table Table_2 reduces the measurement error of the density detection sensor 5, so measurement results of the measuring image can be compensated with high accuracy.
- the altered conversion table Table_2 converts the sensor output values into on-sheet density of the measuring image with high accuracy, so the on-sheet density of the measuring image can be detected with high accuracy.
- Fig. 6A is a diagram illustrating characteristics of the photodiode 52 in a state where the window 54 of the density detection sensor 5 is not soiled, and the characteristics of the photodiode 52 in a state where the window 54 of the density detection sensor 5 is soiled.
- the dotted line in Fig. 6A represents the characteristics regarding the sensor output value of the photodiode 52 and the on-sheet density in a state where the window 54 of the density detection sensor 5 is not soiled.
- the solid line in Fig. 6A represents the characteristics regarding the sensor output value of the photodiode 52 and the on-sheet density in a state where the window 54 of the density detection sensor 5 is soiled.
- the window 54 of the density detection sensor 5 In a case where the window 54 of the density detection sensor 5 is soiled, the amount of light of the LED 51 decreases, and the amount of light received by the photodiodes 52 and 53 decreases. Accordingly, the density as to the sensor output value of the photodiode 52 decreases as illustrated in Fig. 6A .
- the on-sheet density of this measuring image was 1.1.
- the on-sheet density of this measuring image was 1.0.
- Fig. 6B is a diagram illustrating a graph for the conversion table Table_2 in a state where the window 54 of the density detection sensor 5 is not soiled, and a graph for the conversion table Table_2 altered after the window 54 of the density detection sensor 5 was soiled.
- the dotted line in Fig. 6B represents a graph of the conversion table Table_2 in a state where the window 54 of the density detection sensor 5 is not soiled.
- the solid line in Fig. 6B represents a graph of the altered conversion table Table_2.
- the conversion table Table_2 becomes a correction function where the density 0 before correction is density 0 and also the density 1.0 is density 1.1 after correction. That is to say, a correction function that multiples the on-sheet density by 1.1 times is obtained.
- the data obtained by tabulating this correction function is the conversion table Table_2.
- Fig. 7A is a schematic diagram of a test image serving as a measuring image that is formed on the sheet P by the image forming station 10, in a case where the visual adjustment mode is executed.
- Fig. 7B is a sample chart prepared beforehand. The sample chart has images of 18 gradients from density 0.1 through 1.8 in increments of 0.1, and numbers 1 through 18 to the side of the images. The user visually determines which image in the sample chart is closest in density to the test image of which an image is output, and inputs the number given to the sample chart image to the operating unit 80.
- the control unit 30 acquires the density of the image. That is to say, the control unit 30 receives user instructions based on the result of the user having made comparison between the sample image and test image.
- the number input from the operating unit 80 corresponds to density information of the test image.
- the identification information received from the control unit 30 corresponds to user instructions based on comparison results.
- the operations of the units of the image forming apparatus in a case where the visual adjustment mode is executed will be described with reference to the flowchart in Fig. 8 .
- the visual adjustment mode is executed by the control unit 30, by the user pressing the mode selection button on the operating unit 80.
- the control unit 30 executes the visual adjustment mode in Fig. 8 based on a program stored in read-only memory (ROM).
- ROM read-only memory
- the control unit 30 first controls the gamma correction unit 62 to correct test image data based on the gamma LUT, and controls the image forming station 10 to form a test image based on the corrected test image data on a sheet P (S131).
- the control unit 30 controls the image forming station 10 to form the test image on the intermediate transfer belt 6 (S132).
- the image forming station 10 serves as an image forming unit that forms test images.
- the intermediate transfer belt 6 corresponds to an image bearing member where the test image is borne.
- the control unit 30 measures the test image on the intermediate transfer belt 6 using the density detection sensor 5 (S133).
- step S133 the control unit 30 converts the sensor output value of the density detection sensor 5 into density based on the conversion table Table_1, and stores the density in the memory 40.
- the density detection sensor 5 may measure the test image on the intermediate transfer belt 6 before transferring the test image onto the sheet P.
- the control unit 30 stands by until density information is input from the operating unit 80 (S134). Upon the user inputting density information using the operating unit 80, the control unit 30 analyzes the density information and determines the on-sheet density of the test image, and alters the conversion table Table_2 (S136). The control unit 30 stores the altered conversion table Table_2 in memory 40 and updates the conversion table Table_2, and thereafter transitions to the gradation correction mode (S137) and the visual adjustment mode ends. Thus, the conversion condition for converting the measurement results of the density detection sensor 5 is generated.
- the control unit 30 executes the gradation correction mode based on a program stored in ROM.
- the image forming station 10 forms a pattern image on the intermediate transfer belt 6 (S100).
- the control unit 30 controls the pattern generator 70 to output pattern image data, and controls the gamma correction unit 62 to correct the pattern image data based on the gamma LUT_A stored in the memory 40 beforehand.
- the image forming station 10 forms a nine-gradient pattern image on the intermediate transfer belt 6, based on the pattern image data corrected by the gamma correction unit 62.
- the image forming station 10 functions as an image forming unit that forms the pattern image in step S100.
- Fig. 10 is a schematic diagram of the pattern image formed on the intermediate transfer belt 6.
- the pattern image includes pattern images of nine gradients of differ density.
- One pattern image is formed having a size 25 mm in the conveyance direction of the intermediate transfer belt 6, and 15 mm in the direction orthogonal to the conveyance direction.
- the intermediate transfer belt 6 corresponds to the image bearing member bearing the pattern image.
- the control unit 30 measures the pattern image using the density detection sensor 5 (S101).
- the density detection sensor 5 outputs sensor output values every 2 msec while the pattern image is passing the measurement position, and measures one pattern image 25 times.
- the control unit 30 excludes the largest value of the sensor output values and the smallest value of the sensor output values out of the 25 times worth of sensor output values, and averages the 23 times worth of sensor output values.
- the control unit 30 then references both the conversion table Table_ 1 and the conversion table Table_2 stored in the memory 40, to convert the average value of the sensor output values into the on-sheet density.
- the control unit 30 corrects the gamma LUT_B based on the on-sheet density measured in step S101 and a target on-sheet density stored in the memory 40 (S102).
- the on-sheet density is the target value of on-sheet density of the pattern image.
- Nine gradients of pattern images are formed, so nine target on-sheet densities are set.
- the method for correcting the gamma LUT_B in step S102 so that the on-sheet density of the pattern image is the target on-sheet density is known technology, so description will be omitted here.
- the image forming apparatus executes gradation correction mode in Fig. 9 .
- the conversion table Table_2 is altered based on the density information of the test image input by visual inspection by the user, and the sensor output value of the density detection sensor 5.
- the image forming apparatus can reduce the measurement error of the density detection sensor 5, and measurement results can be compensated with high accuracy.
- the image forming apparatus corrects the gamma LUT based on the measurement results of a pattern image by the density detection sensor 5, that has been converted based on the altered conversion table Table_2. Accordingly, the image forming apparatus can correct the density characteristics of the image formed on the sheet by the image forming apparatus with high accuracy.
- the above-described control unit 30 generates a conversion condition (conversion table Table_1 and conversion table Table_2) based on density data of one test image formed on a sheet P.
- a configuration may be made where the control unit 30 generates a conversion condition (conversion table Table_ 1 and conversion table Table_2) based on density data of three test images formed on a sheet P.
- the image forming apparatus described below can generate a highly-accurate conversion condition as compared to a case of generating a conversion condition using one test image. Accordingly, the control unit 30 can correct the density of images formed on sheets with high accuracy, from low density to high density.
- Fig. 11 is a schematic diagram of a test image serving as a measuring image, formed on the sheet P by the image forming station 10 in a case where the visual recognition mode is executed.
- the sample chart has been described in Fig. 7B , so description will be omitted here.
- the user determines visually which number image on the sample chart is the closest in density to the test image that has been output, and inputs the number given to the image by the operating unit 80.
- the test image illustrated in Fig. 11 has test image A, test image B, and test image C.
- the target density of the test image A (e.g., 0.4), the target density of the test image B (e.g., 0.8), and the target density of the test image C (e.g., 1.2) differ from each other. That is to say, the test image A, test image B, and test image C are each formed based on test image data of different signal values.
- the user inputs from the operating unit 80 the number of the image closest to the density of the test image A, the number of the image closest to the density of the test image B, and the number of the image closest to the density of the test image C.
- the operations of the units of the image forming apparatus in a case where the visual adjustment mode is executed will be described with reference to the flowchart in Fig. 12 .
- the visual adjustment mode is executed by the control unit 30, by the user pressing the mode selection button on the operating unit 80.
- the control unit 30 executes the visual adjustment mode in Fig. 12 based on a program stored in ROM.
- control unit 30 executes the gradation correction mode (S170). Note that the control unit 30 stores sensor output values of pattern images in the memory 40 in step S170. Next, the control unit 30 controls the gamma correction unit 62 to correct test image data based on the gamma LUT, and controls the image forming station 10 to form test images A, B, and C, based on the corrected test image data, on a sheet P (S171). The control unit 30 controls the image forming station 10 to form the test images A, B, and C, on the intermediate transfer belt 6 (S172). In step S171 and step S172, the image forming station 10 serves as an image forming unit that forms the test images A, B, and C.
- the control unit 30 measures the test images A, B, and C, on the intermediate transfer belt 6 using the density detection sensor 5 (S173).
- the control unit 30 converts the sensor output value of the density detection sensor 5 into density based on the conversion table Table_1, and stores this in the memory 40.
- the test images A, B, and C were formed twice at the image forming station 10 in steps S171 through step S173, a configuration may be made where the test images A, B, and C, are formed only once.
- the density detection sensor 5 may measure the test images A, B, and C, on the intermediate transfer belt 6 before transferring the test images A, B, and C, onto the sheet P.
- the control unit 30 stands by until density information is input from the operating unit 80 (S174). Upon the user inputting density information using the operating unit 80, the control unit 30 alters the conversion table Table_2 (S176). The control unit 30 analyzes the density information input at the operating unit 80 in step S174, and determines the on-sheet density of the test images A, B, and C. The control unit 30 then updates the conversion table Table_2, based on the determined on-sheet density and the on-sheet density stored in the memory 40 in step S173.
- control unit 30 After having executed the gradient correction mode (S177), the control unit 30 ends the visual adjustment mode.
- the control unit 30 converts the measurement results of the pattern image based on the altered conversion table Table_2, and updates the gamma LUT based on the converted measurement results. Accordingly, the density characteristics of the image formed on the sheet P by the image forming apparatus is corrected with high accuracy.
- the gamma LUT_B may be corrected based on the measurement results of the pattern image stored in the memory 40 in step S170. That is to say, the control unit 30 converts the measurement results of the pattern image stored in the memory 40 in step S170 into on-sheet density, based on the conversion table Table_2 altered in step S176. The gamma LUT_B is then corrected so that the measurement results of the pattern image (on-sheet density) are the target density.
- the image forming station 10 does not form a measuring image for correcting the gamma LUT_B (pattern image) on the intermediate transfer belt 6 again in step S177. Accordingly, consumption of toner can be suppressed in the image forming apparatus as compared to forming a measuring image and correcting the gamma LUT_B, and further downtime can be reduced as well.
- step S171 After the updating of the gamma LUT_B in step S170, in step S171 both the gamma LUT_A and gamma LUT_B are used to correct test image data, and the test images A, B, and C are formed based on the corrected test image data.
- the gamma LUT_B is corrected before forming the test image on the sheet P, so the difference between the measurement results of the test image where the test images A, B, and C are formed on the sheet P in step S171 and the target density is reduced. Accordingly, the conversion table Table_2 can be corrected with high accuracy.
- the on-sheet density of the test image A is darker than a target density (e.g., 0.4)
- the low-concentration region of the conversion table Table_2 cannot be corrected with high accuracy.
- the on-sheet density of the test image C is lighter than a target density (e.g., 1.2)
- the high-concentration region of the conversion table Table_2 cannot be corrected with high accuracy. This is due to the nature of human eyes, that precision of distinguishing in the high-concentration region is low. Also, difference is not recognizable at higher concentration than the test image C, so the lighter the on-sheet density of the test image C is as to the target density, the more markedly the measurement precision of the measuring image in the high-concentration region deteriorates.
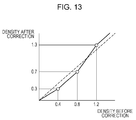
- Fig. 13 illustrates a graph of the conversion table Table_2 before correction, and a graph of the conversion table Table_2 after correction.
- the dotted line in Fig. 13 represents a graph of the conversion table Table_2 before correction.
- the solid line in Fig. 13 represents a graph of the conversion table Table_2 after correction. Note that in the following description, the density information measured visually by the user was 0.3 for the density of the test image A, 0.7 for the density of the test image B, and 1.3 for the density of the test image C.
- the control unit 30 determines a correction function 1 to multiply the on-sheet density before correction by 3/4. Further, in the region where the density before correction is 0.4 or larger but below 0.8, the control unit 30 determines a correction function 2 to correct the on-sheet density before correction to a value smaller by 0.1. Further, in the region where the density before correction is 0.8 or larger but below 1.2, the control unit 30 determines a correction function 3 to multiply the on-sheet density before correction by 1.5, and further correct to a value smaller by 0.5. Further, in the region where the density before correction is 1.2 or larger, the control unit 30 determines a correction function 4 to correct the on-sheet density before correction to a value larger by 0.1. The control unit 30 stores data where the correction functions 1, 2, 3, and 4 have been tabulated, in the memory 40 as the conversion table Table_2.
- the conversion table Table_2 is corrected by density information of test images input by visual inspection of the user, and the sensor output values of the density detection sensor 5. Accordingly, the measurement error of the density detection sensor 5 can be reduced, and highly accurate compensation of measurement results can be performed. Further, the gamma LUT is corrected based on the measurement results by the density detection sensor 5 of the pattern image that has been converted based on the altered conversion table Table_2. Accordingly, the density characteristics of the image formed on the sheet by the image forming apparatus can be corrected with high accuracy.
- the conversion table Table_2 is corrected based on the measurement results of multiple test images, so the conversion table Table_2 can be determined with higher accuracy than correcting based on measurement results of one test image. That is to say, this image forming apparatus can generate a conversion table for conversion into density data of the test image formed on the sheet P, from the measurement results of the density detection sensor 5. Accordingly, the density characteristics of the image formed on the sheet P by the image forming apparatus can be corrected with high accuracy, based on measurement results of the pattern image by the density detection sensor 5.
- the control unit 30 controls the image forming station 10K to form a black test image, and creates a conversion table Table_2 for black, based on the measurement results of the black test image by the density detection sensor 5 and user instructions.
- a configuration may be made where the control unit 30 generates a conversion tables Table_2 that converts the measurement results of yellow, magenta, cyan, and black measuring images in a case where the visual adjustment mode is executed.
- the image forming stations 10Y, 10M, 10C, and 10K each form test images, and the control unit 30 creates conversion tables Table_2 for each color.
- the density detection sensor 5 measures measuring images formed on the intermediate transfer belt 6.
- the density detection sensor 5 may be configured to be provided to each of the photosensitive drums 1Y, 1M, 1C, and 1K.
- the photosensitive drums 1Y, 1M, 1C, and 1K correspond to an image bearing member that bears pattern images and test images.
Abstract
Description
- The present invention relates to correction control for correction of characteristics of images formed by an image forming apparatus.
- Electrophotography type image forming apparatuses form images by forming an electrostatic latent image on a photosensitive member based on image data, and developing the electrostatic latent image using a developing agent (toner) within a developer unit. In order to control the density of an image formed by the image forming apparatus to a desired density, a measuring image formed by the image forming apparatus is measured, and correction condition is corrected based on the results of the measurement.
- An image forming apparatus in
U.S. Patent No. 8,229,307 forms a measuring image on a photosensitive member, measures the measuring image formed on the photosensitive member by a sensor, and corrects the density of the image formed by the image forming apparatus based on the results of measurement by the sensor. - However, there has been the possibility that the density of the image formed on a sheet will not be the desired density even if the correction condition is corrected. This is due to measurement error of the sensor. In a case where there is error in the measurement results of the sensor, density of the image formed by the image forming apparatus cannot be corrected with high accuracy.
- The present invention in its first aspect provides an image forming apparatus as specified in
claims 1 to 12. - The present invention in its second aspect provides a control method of an image forming apparatus as specified in claims 13 to 18.
- Further features of the present invention will become apparent from the following description of embodiments with reference to the attached drawings.
-
-
Fig. 1 is a schematic cross-sectional view of an image forming apparatus. -
Fig. 2 is a control block diagram of an image forming apparatus. -
Fig. 3 is a functional block diagram of an image processing unit. -
Fig. 4 is a schematic diagram of principal portions of a density detecting sensor. -
Figs. 5A through 5C are diagrams describing sensor characteristics. -
Figs. 6A and 6B are diagrams illustrating how sensor characteristics are corrected. -
Fig. 7A is a schematic diagram of a test image formed on a sheet, andFig. 7B is a schematic diagram of a sample chart. -
Fig. 8 is a flowchart of a visual adjustment mode. -
Fig. 9 is a flowchart of a gradation adjustment mode. -
Fig. 10 is a schematic diagram of a pattern image on an intermediate transfer belt. -
Fig. 11 is a schematic diagram of a test image formed on a sheet. -
Fig. 12 is a flowchart of a visual adjustment mode. -
Fig. 13 is an example of conversion table Table_2. - Each of the embodiments of the present invention described below can be implemented solely or as a combination of a plurality of the embodiments or features thereof where necessary or where the combination of elements or features from individual embodiments in a single embodiment is beneficial.
Fig. 1 is a schematic cross-sectional diagram of an image forming apparatus that forms full-color images. The image forming apparatus has fourimage forming stations image forming station 10Y forms yellow images, theimage forming station 10M forms magenta images, theimage forming station 10C forms cyan images, and theimage forming station 10K forms black images. Images for each color component formed by theimage forming stations intermediate transfer belt 6, thereby forming a full-color image on theintermediate transfer belt 6. The full-color image on theintermediate transfer belt 6 is transferred onto a sheet. Afixing unit 100 fixes to the sheet the image on the sheet, and thereafter the sheet is discharged from the image forming apparatus. - The
image forming stations developer units image forming station 10Y will be described, and description of the configuration of the otherimage forming stations - The
image forming station 10Y has aphotosensitive drum 1Y which has a photosensitive member formed on the surface thereof, acharger 2Y that has a charging roller connected to a high-voltage power source, anexposing device 3Y that exposes thephotosensitive drum 1Y to form an electrostatic latent image, and thedeveloper unit 4Y that develops the electrostatic latent image using toner. Theimage forming station 10Y further has aprimary transfer roller 7Y facing thephotosensitive drum 1Y across the later-describedintermediate transfer belt 6, and adrum cleaner 8Y that recovers toner adhered to thephotosensitive drum 1Y. - The
intermediate transfer belt 6 is supported by multiple rollers, and is rotationally driven by a driving roller connected to a motor omitted from illustration. A secondary transfer roller pair 9 forms a secondary transfer nip T2 across theintermediate transfer belt 6. The sheet P is conveyed toward the secondary transfer nip T2. The secondary transfer roller pair 9 is connected to a power source unit (omitted from illustration). The power source unit applies secondary transfer voltage to the secondary transfer roller pair 9 while the sheet P is passing through the secondary transfer nip T2, whereby the image on theintermediate transfer belt 6 is transferred onto the sheet P at the secondary transfer nip T2. Abelt cleaner 11 presses a plate-shaped elastic member against theintermediate transfer belt 6 and recovers toner on theintermediate transfer belt 6. Adensity detection sensor 5 measures a measuring image formed on theintermediate transfer belt 6. Thedensity detection sensor 5 will be described later with reference toFig. 4 . - The
fixing unit 100 has a pair of rollers to press the sheet and a heater for heating the sheet, and fixes an unfixed image on the sheet P onto the sheet P by heating while pressing the sheet P. The sheet P onto which the image has been fixed is output from the image forming apparatus. - Next, image forming operations of the image forming apparatus forming an image based on image data input from a PC or scanner or the like, omitted from illustration, will be described. The
photosensitive drum 1Y in theimage forming station 10Y is rotated in the direction indicated by an arrow by a motor omitted from illustration. Thecharger 2Y uniformly charges thephotosensitive drum 1Y, and theexposing device 3Y exposes thephotosensitive drum 1Y by exposure light. Accordingly, an electrostatic latent image corresponding to the yellow color component is formed on thephotosensitive drum 1Y. The electrostatic latent image on thephotosensitive drum 1Y is developed by thedeveloper unit 4Y using yellow toner. A yellow image is formed on thephotosensitive drum 1Y. - The yellow image on the
photosensitive drum 1Y is conveyed to the primary transfer nip where theprimary transfer roller 7Y presses thephotosensitive drum 1Y across theintermediate transfer belt 6 in accordance with rotation of thephotosensitive drum 1Y in the direction of the arrow. Primary transfer voltage is applied to theprimary transfer roller 7Y from a power source unit (omitted from illustration). Accordingly, the yellow image on thephotosensitive drum 1Y is transferred onto theintermediate transfer belt 6 at the primary transfer nip. The residual toner on thephotosensitive drum 1Y is removed by thedrum cleaner 8Y. - The images formed by the
image forming station intermediate transfer belt 6. Transferring the images overlaid into theintermediate transfer belt 6 forms a full-color image on theintermediate transfer belt 6. The image borne by theintermediate transfer belt 6 is conveyed to the secondary transfer nip T2. The sheet P is conveyed so that the image on theintermediate transfer belt 6 and the sheet P come into contact at the secondary transfer nip T2. The image on theintermediate transfer belt 6 is transferred into the sheet P by the secondary transfer roller pair 9 to which secondary transfer voltage is applied. Toner remaining on theintermediate transfer belt 6 without having been transferred onto the sheet P at the secondary transfer nip T2 is removed by thebelt cleaner 11. - The sheet P bearing the image is conveyed to the fixing
unit 100. The fixingunit 100 applies heat and pressure to the sheet P bearing the unfixed image, thereby fixing the unfixed image onto the sheet P by fusing. - Next, a control block diagram of the image forming apparatus will be described with reference to
Fig. 2 . Acontrol unit 30 is a control circuit that controls each unit.Memory 40 stores a gamma look-up table (LUT), a conversion table Table_1 for converting sensor output values into density, and a conversion table Table_2 for correcting on-sheet density measured by thedensity detection sensor 5. Theimage forming station 10 corresponds to theimage forming stations Fig. 1 . Theimage forming station 10 has already been described, so description will be omitted here. - A network interface card (NIC)
unit 21 transmits image data input via a network to a raster image processing (RIP)unit 22, and externally transmits apparatus information via a network. TheRIP unit 22 analyzes image data described using a page description language (PDL), and renders image data. - An
image processing unit 60 corrects image data by performing various types of image processing on image data. Theimage processing unit 60 may be realized by an integrated circuit such as an application-specific integrated circuit (ASIC), or may be realized by a central processing unit (CPU) of thecontrol unit 30 correcting the image data based on a program stored beforehand. - An operating
unit 80 has a power switch for the image forming apparatus, a mode selection button for selecting the mode of the image forming apparatus, a numeric keypad, an OK button, a liquid crystal screen, and so forth. The liquid crystal screen displays information relating to the remaining amount of toner accommodated in thedeveloper units - The
density detection sensor 5 includes a light-emitting diode (LED) 51 andphotodiodes LED 51 irradiates light on the measuring image, and thedensity detection sensor 5 receives reflected light from the measuring image by thephotodiodes photodiodes density detection sensor 5 output sensor output values (voltage values) in accordance with intensity of the reflected light from the measuring image. TheLED 51 functions as an irradiation unit to irradiate light into the measuring image. Thephotodiodes - A
pattern generator 70 generates image data for forming the measuring image. Thepattern generator 70 outputs pattern image data in a case where a gradation correction mode to correct the gradation characteristics of theimage forming station 10 is to be executed, and outputs test image data in a case where a visual adjustment mode to adjust a conversion table Table_2 is to be executed. The gradation correction mode will be described in detail with reference toFig. 9 , and the visual adjustment mode will be described in detail with reference toFig. 8 . - The function of the
image processing unit 60 will be described with reference to the functional block diagram inFig. 3 . Image data input to theimage processing unit 60 includes RGB data where the three color components of R (red), G (green), and B (blue) are expressed as numerical values, and CMYK data where the four color components are C (cyan), M (magenta), Y (yellow), and K (black). An outputdirect mapping unit 61 converts RGB data into CMYK data in a case where RGB data and image region data are transferred from thecontrol unit 30 to theimage processing unit 60. - A
gamma correction unit 62 corrects gradation characteristics of the image data. The density of images formed by the image forming apparatus are not the desired density. Accordingly, thegamma correction unit 62 corrects input signal values of the image data so that the density of the image formed by the image forming apparatus is the desired density. Thegamma correction unit 62 corrects the gradation characteristics of image data (CMYK data) based on a gamma LUT_A and a gamma LUT_B sorted in thememory 40. Note that a gamma LUT_A and a gamma LUT_B are stored in thememory 40 for each color component. The gamma LUT_A and a gamma LUT_B correspond to gradation correction tables for correcting input signal values of image data into output signal values. - In a case where the image forming apparatus operates under a predetermined environmental condition, and also a standard state which is a predetermined developing agent charge amount, the gamma LUT_A is a first correction condition for correcting the density of the image formed by the image forming apparatus. The gamma LUT_A is determined by experimentation. The density of images formed by the image forming apparatus changes depending on the ambient temperature and humidity around the image forming apparatus, the number of images formed, the developing agent charge amount, and so forth. Accordingly, the image forming apparatus has the gamma LUT_B for correcting the correction results by the gamma LUT_A in accordance with the state of the image forming apparatus. The gamma LUT_B is a second correction condition for correcting the image data converted based on the gamma LUT_A into image data suitable for the current state of the image forming apparatus. The gamma LUT_B is corrected as appropriate in accordance with the current state of the image forming apparatus. Accordingly, the image forming apparatus has the gradation correction mode to update the gamma LUT_B.
- A
halftone processing unit 63 subjects the image data (CMYK data) corrected by thegamma correction unit 62 to screening suitable for image region data. Accordingly, the multi-value data of the image data (CMYK data) at each pixel is converted into binary data at each pixel. For example, screening is performed using a dithering matrix, so that text regions are printed clearly. Photograph image regions are subjected to screening using error diffusion so that moire occurs less readily, for example. Screening is a known technology, so detailed description will be omitted. - A smoothing
processing unit 64 corrects image data so that unevenness at the edge portion of the image is smoothed. The smoothingprocessing unit 64 extracts the edge portion of the image by pattern matching, and selectively converts the data at the edge portion of the image that has been extracted. The image data corrected by the smoothingprocessing unit 64 is transferred to the exposing device 3 of theimage forming station 10. The exposing device 3 is controlled based on the image data converted by theimage processing unit 60. The light of the exposing device 3 exposes thephotosensitive drum 1, and an electrostatic latent image based on the image data is formed on thephotosensitive drum 1. - Next, the configuration of the
density detection sensor 5 provided to the image forming apparatus will be described with reference toFig. 4 . Thedensity detection sensor 5 includes theLED 51,photodiodes density detection sensor 5, and awindow 54 provided in the casing. TheLED 51 irradiates light on the measuring image on theintermediate transfer belt 6. The wavelength of the light irradiated from theLED 51 is 800 to 850 nm for example, taking into consideration the spectral reflectance of the toner. Thephotodiode 52 receives light of regular reflectance from the measuring image on theintermediate transfer belt 6. Thephotodiode 53 receives irregular reflection light from the measuring image on theintermediate transfer belt 6. Thephotodiodes - A method of detecting the density of the measuring image in a case where the measuring image has been formed on the sheet P, based on the sensor output values of the
density detection sensor 5, will be described. The sensor output value of thephotodiode 52 is used in a case of detecting the density of a black measuring image formed on the sheet P. On the other hand, the sensor output value of thephotodiode 53 is used in a case of detecting the density of yellow, magenta, and cyan measuring images formed on the sheet P. Thedensity detection sensor 5 measures the spectral reflection light from the measuring image in a case of measuring the density of the black measuring image, and measures the irregular reflection light from the measuring image in a case of measuring the density of the yellow measuring image, the density of the magenta measuring image, and the density of the cyan measuring image. Description will be made here regarding a case of thedensity detection sensor 5 measuring the black measuring image formed on theintermediate transfer belt 6 by theimage forming station 10K. - The
LED 51 of thedensity detection sensor 5 irradiates light on theintermediate transfer belt 6. The region irradiated by light from theLED 51 corresponds to the measurement position. Thephotodiode 52 receives reflected light from the measuring image (black) while the measuring image (black) on theintermediate transfer belt 6 passes the measurement position of thedensity detection sensor 5. The sensor output values (voltage values) output from thephotodiode 52 while thephotodiode 52 is receiving reflected light from the measuring image (black) corresponds to the amount of toner adhered (adherence amount) in the measuring image (black). That is to say, the sensor output value output from thephotodiode 52 is a value that corresponds to the density of the measuring image. - The
control unit 30 converts the sensor output values of thephotodiode 52 into density value Dblack of the black measuring image, based on conversion table Table_1. Thecontrol unit 30 corrects the density value Dblack based on conversion table Table_2. That is to say, the conversion tables Table_ 1 and Table_2 are a conversion condition for conversion of sensor output values output from thephotodiode 52 into density values of the measuring image. Further, the density value corresponds to density data. Note that the conversion table Table_2 is data representing the correlation between the density values before correction and the density values after correction. In a case where the conversion table Table_2 is not changed, the density values before correction and the density values after correction are the same. - The
control unit 30 converts the sensor output values into density values, based on both conversion tables Table_ 1 and Table_2. Accordingly, in a case where the conversion table Table_2 is changed, the density values converted from the sensor output values also change. Accordingly, in a case where the density of the measuring image cannot be detected from the sensor output values with high accuracy, thecontrol unit 30 alters the conversion table Table_2. That is to say, thecontrol unit 30 alters the conversion table Table_2 and changes the conversion condition. Accordingly, thecontrol unit 30 can detect density from the sensor output values with high accuracy, based on the conversion table Table_1 and the altered conversion table Table_2. - In a case where a yellow measuring image is measured, the
control unit 30 converts the sensor output values of thephotodiode 53 into density values of the yellow measuring image, based on the conversion tables Table_ 1 and Table_2 corresponding to the yellow measuring image. In the same way, in a case where a magenta measuring image is measured, thecontrol unit 30 converts the sensor output values of thephotodiode 53 into density values of the magenta measuring image, based on the conversion tables Table_ 1 and Table_2 corresponding to the magenta measuring image. In a case where a cyan measuring image is measured, thecontrol unit 30 converts the sensor output values of thephotodiode 53 into density values of the cyan measuring image, based on the conversion tables Table_ 1 and Table_2 corresponding to the cyan measuring image. Thememory 40 stores conversion tables Table_1 for four colors and conversion tables Table_2 for four colors beforehand. -
Fig. 5A is a diagram illustrating the relationship between the amount of toner on the belt for the black measuring image formed on theintermediate transfer belt 6, and the sensor output value of thephotodiode 52. The sensor output value of thephotodiode 52 decreases as the amount of toner on the belt for the measuring image increases, as illustrated inFig. 5A . This is because the light irradiated from theLED 51 is absorbed by the black measuring image, so the more the amount of toner adhered for the black measuring image increases, the lower the intensity of regular reflection light received at thephotodiode 52 is. -
Fig. 5B is a diagram illustrating the relationship between the amount of toner on the belt for the measuring image, and the density of the measuring image when the measuring image is formed on a sheet (on-sheet density). The more the amount of toner on the belt for the measuring image formed on theintermediate transfer belt 6 increases, the darker the density of the measuring image formed on the sheet is.Fig. 5C is a diagram illustrating the relationship between the sensor output value of thephotodiode 52 corresponding to the reflection light from the measuring image on theintermediate transfer belt 6, and the density of the measuring image when the measuring image is formed on a sheet (on-sheet density). The data illustrated inFig. 5C corresponds to the conversion table Table_1 for converting the sensor output values corresponding to the black measuring image into the density values Dblack. The correlation between the sensor output values and the on-sheet density inFig. 5C is determined beforehand by experimentation. The conversion table Table_1 is set according to the correlation inFig. 5C , and stored in thememory 40 beforehand. - In the description above, one or other of the sensor output value of the
photodiodes photodiode 52 and the sensor output value of thephotodiode 53, and this intermediate data is converted into on-sheet density. In a case of this configuration, the intermediate data is the difference between the sensor output value of thephotodiode 52, and the sensor output value of thephotodiode 53 multiplied by a coefficient. The coefficient is determined beforehand for each color. Thecontrol unit 30 can detect the on-sheet density of the measuring image by referencing conversion data for converting the intermediate data into on-sheet density of the measuring image. - Now, in a case where toner or paper dust adheres to the
window 54 of thedensity detection sensor 5, error occurs in the sensor output value. This is because, in a case where toner or paper dust adheres to thewindow 54, the amount of light irradiated from theLED 51 to the measuring image decreases, and the intensity of reflected light that thephotodiodes window 54, error occurs in the sensor output values of thephotodiodes - In a case where the surface of the
intermediate transfer belt 6 is rough due to having formed a great number of images, the correlation between the sensor output value of the measuring image on theintermediate transfer belt 6 and the on-sheet density of the measuring image changes. In a case where the surface of theintermediate transfer belt 6 is rough, the reflection light from the surface of theintermediate transfer belt 6 changes. Accordingly, error occurs in the sensor output value particularly in cases of measuring a low-density measuring image where the toner coverage is low. In a case where the surface of theintermediate transfer belt 6 is rough, error occurs in the sensor output values of thephotodiodes - The proportion of toner transferred from the
intermediate transfer belt 6 onto the sheet P at the secondary transfer nip T2 (transfer efficiency) changes depending on the temperature and humidity around the image forming apparatus. Accordingly, in a case where the temperature and humidity around the image forming apparatus changes, there has been a possibility of the relationship between the amount of toner of the measuring image formed on theintermediate transfer belt 6 and the density of the measuring image formed on the sheet P (on-sheet density) changing. Further, the proportion of toner transferred from theintermediate transfer belt 6 onto the sheet P at the secondary transfer nip T2 (transfer efficiency) changes depending in a case where the secondary transfer roller pair 9 has deteriorated over time. This is because the resistance value of the secondary transfer roller pair 9 changes by deteriorating over time. That is to say, there has been a possibility of the relationship between the amount of toner of the measuring image formed on theintermediate transfer belt 6 and the density of the measuring image formed on the sheet P (on-sheet density) changing in a case where the secondary transfer roller pair 9 has deteriorated over time, as well. Accordingly, in a case where the transfer efficiency has changed, the correlation between the sensor output values and the on-sheet density differs from the correlation set beforehand, so the on-sheet density of the measuring image cannot be detected with high accuracy. - Accordingly, the
control unit 30 alters the conversion table Table_2 based on the density information of the measuring image formed on the sheet P and the sensor output value of the measuring image, in order to detect the on-sheet density of the measuring image with high accuracy based on the measurement results of the measuring image formed on theintermediate transfer belt 6. Thus, the altered conversion table Table_2 reduces the measurement error of thedensity detection sensor 5 even if thewindow 54 of thedensity detection sensor 5 is soiled, so measurement results of the measuring image can be compensated with high accuracy. Further, even in a case where the surface of theintermediate transfer belt 6 is rough, the altered conversion table Table_2 reduces the measurement error of thedensity detection sensor 5, so measurement results of the measuring image can be compensated with high accuracy. Further, even in a case where the transfer efficiency changes, the altered conversion table Table_2 converts the sensor output values into on-sheet density of the measuring image with high accuracy, so the on-sheet density of the measuring image can be detected with high accuracy. -
Fig. 6A is a diagram illustrating characteristics of thephotodiode 52 in a state where thewindow 54 of thedensity detection sensor 5 is not soiled, and the characteristics of thephotodiode 52 in a state where thewindow 54 of thedensity detection sensor 5 is soiled. The dotted line inFig. 6A represents the characteristics regarding the sensor output value of thephotodiode 52 and the on-sheet density in a state where thewindow 54 of thedensity detection sensor 5 is not soiled. The solid line inFig. 6A represents the characteristics regarding the sensor output value of thephotodiode 52 and the on-sheet density in a state where thewindow 54 of thedensity detection sensor 5 is soiled. - In a case where the
window 54 of thedensity detection sensor 5 is soiled, the amount of light of theLED 51 decreases, and the amount of light received by thephotodiodes photodiode 52 decreases as illustrated inFig. 6A . For example, in a case where a measuring image of sensor output value Vx was formed on the sheet P in a state where thewindow 54 of thedensity detection sensor 5 was not soiled, the on-sheet density of this measuring image was 1.1. In a case where a measuring image of sensor output value Vx was formed on the sheet P in a state where thewindow 54 of thedensity detection sensor 5 was soiled, the on-sheet density of this measuring image was 1.0. The reason is that the characteristics of the sensor output value of thephotodiode 52 and the on-sheet density changed. Note that the smaller the amount of toner adhering in the measuring image is, the less the amount of light received by thephotodiode 52 is, so error in the sensor output value decreases. -
Fig. 6B is a diagram illustrating a graph for the conversion table Table_2 in a state where thewindow 54 of thedensity detection sensor 5 is not soiled, and a graph for the conversion table Table_2 altered after thewindow 54 of thedensity detection sensor 5 was soiled. The dotted line inFig. 6B represents a graph of the conversion table Table_2 in a state where thewindow 54 of thedensity detection sensor 5 is not soiled. The solid line inFig. 6B represents a graph of the altered conversion table Table_2. In a case where the characteristics of the sensor output value of thedensity detection sensor 5 and the on-sheet density change as illustrated inFig. 6A , the conversion table Table_2 becomes a correction function where the density 0 before correction is density 0 and also the density 1.0 is density 1.1 after correction. That is to say, a correction function that multiples the on-sheet density by 1.1 times is obtained. The data obtained by tabulating this correction function is the conversion table Table_2. - Next, the visual adjustment mode where the conversion table Table_2 is updated will be described based on
Figs. 7A through 8 .Fig. 7A is a schematic diagram of a test image serving as a measuring image that is formed on the sheet P by theimage forming station 10, in a case where the visual adjustment mode is executed.Fig. 7B is a sample chart prepared beforehand. The sample chart has images of 18 gradients from density 0.1 through 1.8 in increments of 0.1, andnumbers 1 through 18 to the side of the images. The user visually determines which image in the sample chart is closest in density to the test image of which an image is output, and inputs the number given to the sample chart image to the operatingunit 80. For example, in a case where the density of theimage # 10 in the sample chart is the closest to the density of the test image, the user inputs "10" from the numeric keypad of the operatingunit 80. Accordingly, thecontrol unit 30 acquires the density of the image. That is to say, thecontrol unit 30 receives user instructions based on the result of the user having made comparison between the sample image and test image. The number input from the operatingunit 80 corresponds to density information of the test image. The identification information received from thecontrol unit 30 corresponds to user instructions based on comparison results. - The operations of the units of the image forming apparatus in a case where the visual adjustment mode is executed will be described with reference to the flowchart in
Fig. 8 . The visual adjustment mode is executed by thecontrol unit 30, by the user pressing the mode selection button on the operatingunit 80. Thecontrol unit 30 executes the visual adjustment mode inFig. 8 based on a program stored in read-only memory (ROM). - The
control unit 30 first controls thegamma correction unit 62 to correct test image data based on the gamma LUT, and controls theimage forming station 10 to form a test image based on the corrected test image data on a sheet P (S131). Thecontrol unit 30 controls theimage forming station 10 to form the test image on the intermediate transfer belt 6 (S132). In step S131 and step S132, theimage forming station 10 serves as an image forming unit that forms test images. Theintermediate transfer belt 6 corresponds to an image bearing member where the test image is borne. - The
control unit 30 measures the test image on theintermediate transfer belt 6 using the density detection sensor 5 (S133). In step S133, thecontrol unit 30 converts the sensor output value of thedensity detection sensor 5 into density based on the conversion table Table_1, and stores the density in thememory 40. Although two test images were formed at theimage forming station 10 in steps S131 through step S133, a configuration may be made where only one test image is formed. In a case of this configuration, thedensity detection sensor 5 may measure the test image on theintermediate transfer belt 6 before transferring the test image onto the sheet P. - The
control unit 30 stands by until density information is input from the operating unit 80 (S134). Upon the user inputting density information using theoperating unit 80, thecontrol unit 30 analyzes the density information and determines the on-sheet density of the test image, and alters the conversion table Table_2 (S136). Thecontrol unit 30 stores the altered conversion table Table_2 inmemory 40 and updates the conversion table Table_2, and thereafter transitions to the gradation correction mode (S137) and the visual adjustment mode ends. Thus, the conversion condition for converting the measurement results of thedensity detection sensor 5 is generated. - Next, the gradation correction mode executed in step S137 in
Fig. 8 will be described with reference toFig. 9 . Thecontrol unit 30 executes the gradation correction mode based on a program stored in ROM. - When the gradation correction mode is executed, the
image forming station 10 forms a pattern image on the intermediate transfer belt 6 (S100). In step S100 thecontrol unit 30 controls thepattern generator 70 to output pattern image data, and controls thegamma correction unit 62 to correct the pattern image data based on the gamma LUT_A stored in thememory 40 beforehand. Theimage forming station 10 forms a nine-gradient pattern image on theintermediate transfer belt 6, based on the pattern image data corrected by thegamma correction unit 62. Theimage forming station 10 functions as an image forming unit that forms the pattern image in step S100. -
Fig. 10 is a schematic diagram of the pattern image formed on theintermediate transfer belt 6. The pattern image includes pattern images of nine gradients of differ density. One pattern image is formed having asize 25 mm in the conveyance direction of theintermediate transfer belt intermediate transfer belt 6 corresponds to the image bearing member bearing the pattern image. - The
control unit 30 measures the pattern image using the density detection sensor 5 (S101). In step S101, thedensity detection sensor 5 outputs sensor output values every 2 msec while the pattern image is passing the measurement position, and measures onepattern image 25 times. Thecontrol unit 30 excludes the largest value of the sensor output values and the smallest value of the sensor output values out of the 25 times worth of sensor output values, and averages the 23 times worth of sensor output values. Thecontrol unit 30 then references both theconversion table Table_ 1 and the conversion table Table_2 stored in thememory 40, to convert the average value of the sensor output values into the on-sheet density. - The
control unit 30 corrects the gamma LUT_B based on the on-sheet density measured in step S101 and a target on-sheet density stored in the memory 40 (S102). The on-sheet density is the target value of on-sheet density of the pattern image. Nine gradients of pattern images are formed, so nine target on-sheet densities are set. The method for correcting the gamma LUT_B in step S102 so that the on-sheet density of the pattern image is the target on-sheet density is known technology, so description will be omitted here. - In a case where the number of images printed after the gradation correction mode was performed the last time has exceeded a threshold value, for example, or the user has used the mode selection button to instruct execution of the gradation correction mode, the image forming apparatus executes gradation correction mode in
Fig. 9 . This updates the gamma LUT_B, so an image with proper density can be formed. - The conversion table Table_2 is altered based on the density information of the test image input by visual inspection by the user, and the sensor output value of the
density detection sensor 5. Thus, the image forming apparatus can reduce the measurement error of thedensity detection sensor 5, and measurement results can be compensated with high accuracy. Further, the image forming apparatus corrects the gamma LUT based on the measurement results of a pattern image by thedensity detection sensor 5, that has been converted based on the altered conversion table Table_2. Accordingly, the image forming apparatus can correct the density characteristics of the image formed on the sheet by the image forming apparatus with high accuracy. - The above-described
control unit 30 generates a conversion condition (conversion table Table_1 and conversion table Table_2) based on density data of one test image formed on a sheet P. However, a configuration may be made where thecontrol unit 30 generates a conversion condition (conversion table Table_ 1 and conversion table Table_2) based on density data of three test images formed on a sheet P. The image forming apparatus described below can generate a highly-accurate conversion condition as compared to a case of generating a conversion condition using one test image. Accordingly, thecontrol unit 30 can correct the density of images formed on sheets with high accuracy, from low density to high density. - The following description will be made in detail regarding points that differ from the above-described image forming apparatus. Description of points that are the same as the above-described image forming apparatus will be omitted in the following description.
- Next, the visual recognition mode will be described with reference to
Figs. 11 and12 .Fig. 11 is a schematic diagram of a test image serving as a measuring image, formed on the sheet P by theimage forming station 10 in a case where the visual recognition mode is executed. The sample chart has been described inFig. 7B , so description will be omitted here. The user determines visually which number image on the sample chart is the closest in density to the test image that has been output, and inputs the number given to the image by the operatingunit 80. The test image illustrated inFig. 11 has test image A, test image B, and test image C. The target density of the test image A (e.g., 0.4), the target density of the test image B (e.g., 0.8), and the target density of the test image C (e.g., 1.2) differ from each other. That is to say, the test image A, test image B, and test image C are each formed based on test image data of different signal values. The user inputs from the operatingunit 80 the number of the image closest to the density of the test image A, the number of the image closest to the density of the test image B, and the number of the image closest to the density of the test image C. - The operations of the units of the image forming apparatus in a case where the visual adjustment mode is executed will be described with reference to the flowchart in
Fig. 12 . The visual adjustment mode is executed by thecontrol unit 30, by the user pressing the mode selection button on the operatingunit 80. Thecontrol unit 30 executes the visual adjustment mode inFig. 12 based on a program stored in ROM. - First, the
control unit 30 executes the gradation correction mode (S170). Note that thecontrol unit 30 stores sensor output values of pattern images in thememory 40 in step S170. Next, thecontrol unit 30 controls thegamma correction unit 62 to correct test image data based on the gamma LUT, and controls theimage forming station 10 to form test images A, B, and C, based on the corrected test image data, on a sheet P (S171). Thecontrol unit 30 controls theimage forming station 10 to form the test images A, B, and C, on the intermediate transfer belt 6 (S172). In step S171 and step S172, theimage forming station 10 serves as an image forming unit that forms the test images A, B, and C. - The
control unit 30 measures the test images A, B, and C, on theintermediate transfer belt 6 using the density detection sensor 5 (S173). In step S173, thecontrol unit 30 converts the sensor output value of thedensity detection sensor 5 into density based on the conversion table Table_1, and stores this in thememory 40. Although the test images A, B, and C, were formed twice at theimage forming station 10 in steps S171 through step S173, a configuration may be made where the test images A, B, and C, are formed only once. In a case of this configuration, thedensity detection sensor 5 may measure the test images A, B, and C, on theintermediate transfer belt 6 before transferring the test images A, B, and C, onto the sheet P. - The
control unit 30 stands by until density information is input from the operating unit 80 (S174). Upon the user inputting density information using theoperating unit 80, thecontrol unit 30 alters the conversion table Table_2 (S176). Thecontrol unit 30 analyzes the density information input at the operatingunit 80 in step S174, and determines the on-sheet density of the test images A, B, and C. Thecontrol unit 30 then updates the conversion table Table_2, based on the determined on-sheet density and the on-sheet density stored in thememory 40 in step S173. - After having executed the gradient correction mode (S177), the
control unit 30 ends the visual adjustment mode. Thecontrol unit 30 converts the measurement results of the pattern image based on the altered conversion table Table_2, and updates the gamma LUT based on the converted measurement results. Accordingly, the density characteristics of the image formed on the sheet P by the image forming apparatus is corrected with high accuracy. - Note that instead of executing the gradient correction mode in step S177, the gamma LUT_B may be corrected based on the measurement results of the pattern image stored in the
memory 40 in step S170. That is to say, thecontrol unit 30 converts the measurement results of the pattern image stored in thememory 40 in step S170 into on-sheet density, based on the conversion table Table_2 altered in step S176. The gamma LUT_B is then corrected so that the measurement results of the pattern image (on-sheet density) are the target density. - According to this configuration, the
image forming station 10 does not form a measuring image for correcting the gamma LUT_B (pattern image) on theintermediate transfer belt 6 again in step S177. Accordingly, consumption of toner can be suppressed in the image forming apparatus as compared to forming a measuring image and correcting the gamma LUT_B, and further downtime can be reduced as well. - After the updating of the gamma LUT_B in step S170, in step S171 both the gamma LUT_A and gamma LUT_B are used to correct test image data, and the test images A, B, and C are formed based on the corrected test image data. The gamma LUT_B is corrected before forming the test image on the sheet P, so the difference between the measurement results of the test image where the test images A, B, and C are formed on the sheet P in step S171 and the target density is reduced. Accordingly, the conversion table Table_2 can be corrected with high accuracy.
- That is to say, in a case where the on-sheet density of the test image A is darker than a target density (e.g., 0.4), the low-concentration region of the conversion table Table_2 cannot be corrected with high accuracy. In the same way, in a case where the on-sheet density of the test image C is lighter than a target density (e.g., 1.2), the high-concentration region of the conversion table Table_2 cannot be corrected with high accuracy. This is due to the nature of human eyes, that precision of distinguishing in the high-concentration region is low. Also, difference is not recognizable at higher concentration than the test image C, so the lighter the on-sheet density of the test image C is as to the target density, the more markedly the measurement precision of the measuring image in the high-concentration region deteriorates.
-
Fig. 13 illustrates a graph of the conversion table Table_2 before correction, and a graph of the conversion table Table_2 after correction. The dotted line inFig. 13 represents a graph of the conversion table Table_2 before correction. The solid line inFig. 13 represents a graph of the conversion table Table_2 after correction. Note that in the following description, the density information measured visually by the user was 0.3 for the density of the test image A, 0.7 for the density of the test image B, and 1.3 for the density of the test image C. - In the region where the density before correction is 0 or larger but below 0.4, the
control unit 30 determines acorrection function 1 to multiply the on-sheet density before correction by 3/4. Further, in the region where the density before correction is 0.4 or larger but below 0.8, thecontrol unit 30 determines acorrection function 2 to correct the on-sheet density before correction to a value smaller by 0.1. Further, in the region where the density before correction is 0.8 or larger but below 1.2, thecontrol unit 30 determines a correction function 3 to multiply the on-sheet density before correction by 1.5, and further correct to a value smaller by 0.5. Further, in the region where the density before correction is 1.2 or larger, thecontrol unit 30 determines acorrection function 4 to correct the on-sheet density before correction to a value larger by 0.1. Thecontrol unit 30 stores data where the correction functions 1, 2, 3, and 4 have been tabulated, in thememory 40 as the conversion table Table_2. - The conversion table Table_2 is corrected by density information of test images input by visual inspection of the user, and the sensor output values of the
density detection sensor 5. Accordingly, the measurement error of thedensity detection sensor 5 can be reduced, and highly accurate compensation of measurement results can be performed. Further, the gamma LUT is corrected based on the measurement results by thedensity detection sensor 5 of the pattern image that has been converted based on the altered conversion table Table_2. Accordingly, the density characteristics of the image formed on the sheet by the image forming apparatus can be corrected with high accuracy. - The conversion table Table_2 is corrected based on the measurement results of multiple test images, so the conversion table Table_2 can be determined with higher accuracy than correcting based on measurement results of one test image. That is to say, this image forming apparatus can generate a conversion table for conversion into density data of the test image formed on the sheet P, from the measurement results of the
density detection sensor 5. Accordingly, the density characteristics of the image formed on the sheet P by the image forming apparatus can be corrected with high accuracy, based on measurement results of the pattern image by thedensity detection sensor 5. - The
control unit 30 controls theimage forming station 10K to form a black test image, and creates a conversion table Table_2 for black, based on the measurement results of the black test image by thedensity detection sensor 5 and user instructions. However, a configuration may be made where thecontrol unit 30 generates a conversion tables Table_2 that converts the measurement results of yellow, magenta, cyan, and black measuring images in a case where the visual adjustment mode is executed. In this case, theimage forming stations control unit 30 creates conversion tables Table_2 for each color. - A configuration has been described where the
density detection sensor 5 measures measuring images formed on theintermediate transfer belt 6. However, thedensity detection sensor 5 may be configured to be provided to each of thephotosensitive drums photosensitive drums - While the present invention has been described with reference to embodiments, it is to be understood that the invention is not limited to the disclosed embodiments. It will of course be understood that this invention has been described above by way of example only, and that modifications of detail can be made within the scope of this invention.
Claims (15)
- An image forming apparatus comprising:correction means (60) arranged to correct image data based on a correction condition;image forming means (10) arranged to form an image based on the corrected image data;an image bearing member (6) arranged to bear the image formed by the image forming means (10);transfer means (9) arranged to transfer the image on the image bearing member (6) onto a sheet (P);measuring means (5) arranged to measure a measuring image on the image bearing member (6);converting means (30) arranged to convert a measurement result of the measuring image measured by the measuring means (5), based on a conversion condition;first generating means (30) arranged to generate the correction condition based on the measurement result converted by the converting means (30);acquisition means (30) arranged to control the image forming means (10) to form a test image based on test image data, control the measuring means (5) to measure the test image on the image bearing member (6), and acquire measurement result of the test image by the measuring means (5);a controller (30) arranged to control the image forming means (10) to form a test image based on test image data, and control the transfer means (9) to transfer the test image on the image bearing member (6) onto the sheet (P) ;receiving means (80) arranged to receive a user instruction based on a result of a user having compared a sample image and the test image transferred onto the sheet; andsecond generating means (30) arranged to generate the conversion condition, based on the user instruction received by the receiving means (80), and the measurement result acquired by the acquisition means (30).
- The image forming apparatus according to Claim 1,
wherein the sample image includes a plurality of sample images with different densities, and identifying information corresponding to the plurality of sample images,
and wherein the user instruction corresponds to the identifying information input by the user. - The image forming apparatus according to Claim 1, further comprising:fixing means (100) arranged to fix the image on the sheet (P) onto the sheet (P),wherein the controller (30) is configured to control the fixing means (100) to fix the test image on the sheet (P).
- The image forming apparatus according to Claim 1,
wherein the acquisition means (30) is configured to control the correction means (60) to correct the test image data based on the correction condition, and control the image forming means (10) to form the test image based on the corrected test image data. - The image forming apparatus according to Claim 1,
wherein the controller (30) is configured to control the correction means (60) to correct the test image data based on the correction condition, control the image forming means (10) to form the test image based on the corrected test image data, and control the transfer means (9) to transfer the test image on the image bearing member (6) onto the sheet (P). - The image forming apparatus according to Claim 1,
wherein the first generating means (30) is configured to control the correction means (60) to correct pattern image data based on the correction condition, control the image forming means (10) to form the measuring image based on the corrected pattern image data, control the measuring means (5) to measure the measuring image, control the converting means (30) to convert the measurement result of the measuring image based on the conversion condition, and generate the correction condition based on the measurement result converted by the converting means (30). - The image forming apparatus according to Claim 1,
wherein the test image includes a plurality of test images of different densities. - The image forming apparatus according to Claim 1,
wherein the correction condition is a gradation correction table for correcting gradation characteristics of the image data. - The image forming apparatus according to Claim 1,
wherein the measuring means (5) includeirradiating means (51) configured to irradiate light on the measuring image, andphotoreceptor means (52, 53) configured to receive light reflected from the measuring image. - The image forming apparatus according to Claim 1,
wherein the image forming means (10) includefirst image forming means (10) that form an image of a first color, andsecond image forming means (10) that form an image of a second color that is different from the first color,wherein the test image includesa first test image formed by the first image forming means (10), anda second test image formed by the second image forming means (10),wherein the correction condition includesa first correction condition corresponding to an image of the first color, anda second correction condition corresponding to an image of the second color,wherein the conversion condition includesa first conversion condition corresponding to a measuring image of the first color, anda second conversion condition corresponding to a measuring image of the second color,and wherein the second generating means (30) is configured to generate the conversion condition of the first color and the conversion condition of the second color. - The image forming apparatus according to Claim 1,
wherein the test image formed by the controller (30) is the same as the test image formed by the acquisition means (30). - The image forming apparatus according to Claim 1,
wherein the converting means (30) is configured to convert measurement result corresponding to the measuring image measured by the measuring means (5) into density data based on the conversion condition. - A control method of an image forming apparatus includingan image bearing member (6),correction means (60) arranged to correct image data based on correction condition,image forming means (10) arranged to form an image on the image bearing member (6) based on the image data corrected by the correction means (60),transfer means (9) arranged to transfer the image on the image bearing member (6) onto a sheet (P),measuring means (5) arranged to measure a measuring image on the image bearing member (6), andreceiving means (80) arranged to receive a user instruction,the method comprising:a first measuring step to measure the measuring image formed on the image bearing member (6) by the image forming means (10) using the measuring means (5);a converting step to convert a measurement result of the measuring image by the measuring means (5) based on a conversion condition;a first generating step to generate the correction condition based on the converted measurement result;a second measuring step to measure a test image formed on the image bearing member (6) by the image forming means (10), using the measuring means (5);a transfer step to transfer the test image on the image bearing member (6) onto the sheet (P) using the transfer means (9);a receiving step to receive, using the receiving means (80), the user instruction based on comparison result of the user having compared a sample image and the test image transferred onto the sheet; anda second generating step to generate the conversion condition, based on the received user instruction and measurement result of the test image by the measuring means (5).
- The control method according to Claim 13,
wherein the sample image includes a plurality of sample images with different densities, and identifying information corresponding to the plurality of sample images,
and wherein the user instruction corresponds to the identifying information input by the user. - The control method according to Claim 13,
wherein the correction condition is a gradation correction table for correcting gradation characteristics of the image data.
Applications Claiming Priority (1)
| Application Number | Priority Date | Filing Date | Title |
|---|---|---|---|
| JP2015060145A JP6890917B2 (en) | 2015-03-23 | 2015-03-23 | Image forming device |
Publications (2)
| Publication Number | Publication Date |
|---|---|
| EP3073327A1 true EP3073327A1 (en) | 2016-09-28 |
| EP3073327B1 EP3073327B1 (en) | 2018-08-22 |
Family
ID=55587204
Family Applications (1)
| Application Number | Title | Priority Date | Filing Date |
|---|---|---|---|
| EP16161450.8A Active EP3073327B1 (en) | 2015-03-23 | 2016-03-21 | Image forming apparatus that generates conversion condition of a measuring means, and control method of the image forming apparatus |
Country Status (7)
| Country | Link |
|---|---|
| US (1) | US9910394B2 (en) |
| EP (1) | EP3073327B1 (en) |
| JP (1) | JP6890917B2 (en) |
| KR (1) | KR101961345B1 (en) |
| CN (1) | CN105988318B (en) |
| BR (1) | BR102016006173A2 (en) |
| RU (1) | RU2654002C2 (en) |
Families Citing this family (7)
| Publication number | Priority date | Publication date | Assignee | Title |
|---|---|---|---|---|
| JP7108371B2 (en) | 2015-08-26 | 2022-07-28 | シャープ株式会社 | image forming device |
| JP2017194574A (en) * | 2016-04-20 | 2017-10-26 | キヤノン株式会社 | Image forming apparatus |
| JP6887818B2 (en) * | 2016-04-26 | 2021-06-16 | キヤノン株式会社 | Image forming device |
| DE102018202453A1 (en) * | 2017-03-22 | 2018-09-27 | Heidelberger Druckmaschinen Ag | Method for carrying out a printing process in an inkjet printing machine |
| EP3438756B1 (en) * | 2017-08-04 | 2021-09-08 | Canon Kabushiki Kaisha | Image forming apparatus |
| JP7070151B2 (en) * | 2018-06-27 | 2022-05-18 | 株式会社リコー | Image forming device |
| CN112462641B (en) * | 2020-10-29 | 2022-12-30 | 河北汉光重工有限责任公司 | OLED (organic light emitting diode) adjusting key special for user |
Citations (4)
| Publication number | Priority date | Publication date | Assignee | Title |
|---|---|---|---|---|
| US20020134130A1 (en) * | 2001-01-22 | 2002-09-26 | Johnson David A. | Calibration of printing devices |
| US20070172245A1 (en) * | 2004-11-09 | 2007-07-26 | Fuji Xerox Co., Ltd. | Image forming device |
| US8229307B2 (en) | 2006-12-01 | 2012-07-24 | Canon Kabushiki Kaisha | Image forming apparatus and image forming apparatus control method |
| US20150063843A1 (en) * | 2013-09-05 | 2015-03-05 | Canon Kabushiki Kaisha | Tone correction process that corrects tone of image formed by image forming apparatus |
Family Cites Families (8)
| Publication number | Priority date | Publication date | Assignee | Title |
|---|---|---|---|---|
| US5933682A (en) * | 1998-04-14 | 1999-08-03 | Eastman Kodak Company | Copier/printer with manual adjustment for cross-track uniformity |
| JP4906530B2 (en) * | 2007-02-05 | 2012-03-28 | キヤノン株式会社 | Image processing method and image forming apparatus |
| JP5006103B2 (en) * | 2007-05-22 | 2012-08-22 | 株式会社リコー | Image forming apparatus |
| JP5152223B2 (en) * | 2010-02-26 | 2013-02-27 | ブラザー工業株式会社 | Image forming apparatus and program thereof |
| CN102213927A (en) * | 2010-04-05 | 2011-10-12 | 株式会社东芝 | Image processing apparatus and density correction method |
| JP5569183B2 (en) * | 2010-06-28 | 2014-08-13 | ブラザー工業株式会社 | Image forming apparatus |
| JP5499941B2 (en) * | 2010-06-28 | 2014-05-21 | ブラザー工業株式会社 | Image forming apparatus |
| US8526835B2 (en) * | 2011-04-19 | 2013-09-03 | Xerox Corporation | Closed loop controls for transfer control in first transfer for optimized image content |
-
2015
- 2015-03-23 JP JP2015060145A patent/JP6890917B2/en active Active
-
2016
- 2016-03-16 CN CN201610152594.7A patent/CN105988318B/en active Active
- 2016-03-16 RU RU2016109432A patent/RU2654002C2/en active
- 2016-03-17 US US15/072,963 patent/US9910394B2/en active Active
- 2016-03-18 KR KR1020160032456A patent/KR101961345B1/en active IP Right Grant
- 2016-03-21 BR BR102016006173A patent/BR102016006173A2/en not_active Application Discontinuation
- 2016-03-21 EP EP16161450.8A patent/EP3073327B1/en active Active
Patent Citations (4)
| Publication number | Priority date | Publication date | Assignee | Title |
|---|---|---|---|---|
| US20020134130A1 (en) * | 2001-01-22 | 2002-09-26 | Johnson David A. | Calibration of printing devices |
| US20070172245A1 (en) * | 2004-11-09 | 2007-07-26 | Fuji Xerox Co., Ltd. | Image forming device |
| US8229307B2 (en) | 2006-12-01 | 2012-07-24 | Canon Kabushiki Kaisha | Image forming apparatus and image forming apparatus control method |
| US20150063843A1 (en) * | 2013-09-05 | 2015-03-05 | Canon Kabushiki Kaisha | Tone correction process that corrects tone of image formed by image forming apparatus |
Also Published As
| Publication number | Publication date |
|---|---|
| US20160282780A1 (en) | 2016-09-29 |
| JP6890917B2 (en) | 2021-06-18 |
| KR101961345B1 (en) | 2019-03-25 |
| RU2016109432A (en) | 2017-09-20 |
| CN105988318B (en) | 2018-12-04 |
| JP2016180811A (en) | 2016-10-13 |
| KR20160113974A (en) | 2016-10-04 |
| BR102016006173A2 (en) | 2016-09-27 |
| EP3073327B1 (en) | 2018-08-22 |
| RU2654002C2 (en) | 2018-05-15 |
| CN105988318A (en) | 2016-10-05 |
| US9910394B2 (en) | 2018-03-06 |
Similar Documents
| Publication | Publication Date | Title |
|---|---|---|
| EP3073327B1 (en) | Image forming apparatus that generates conversion condition of a measuring means, and control method of the image forming apparatus | |
| US9729760B2 (en) | Image forming apparatus generating conversion condition of measurement unit | |
| EP1311110B1 (en) | Method of making correction for color sensor output values in color image forming apparatus | |
| US9946207B2 (en) | Image forming apparatus | |
| JP6131964B2 (en) | Image processing device | |
| US10401771B2 (en) | Image forming apparatus and control method which generates color processing condition | |
| EP3073328B1 (en) | Image forming apparatus generating conversion condition of measurement unit and method for controlling the same | |
| US9819826B2 (en) | Image forming apparatus that controls image forming conditions for adjusting image density | |
| US20240022678A1 (en) | Information processing device and method of controlling image forming apparatus | |
| US20130051827A1 (en) | Apparatus for performing image formation by electrophotographic method | |
| JP6635666B2 (en) | Image forming device | |
| JP2016180813A (en) | Image forming apparatus | |
| JP6668759B2 (en) | Image forming apparatus, gradation correction method, and gradation correction program | |
| US20230384989A1 (en) | Image processing method and image processing apparatus | |
| JP2023031450A (en) | Information processing apparatus | |
| JP2019003133A (en) | Image forming apparatus and image forming program | |
| JP2015089029A (en) | Image evaluation device, image formation device, and picture quality evaluation method |
Legal Events
| Date | Code | Title | Description |
|---|---|---|---|
| PUAI | Public reference made under article 153(3) epc to a published international application that has entered the european phase |
Free format text: ORIGINAL CODE: 0009012 |
|
| AK | Designated contracting states |
Kind code of ref document: A1 Designated state(s): AL AT BE BG CH CY CZ DE DK EE ES FI FR GB GR HR HU IE IS IT LI LT LU LV MC MK MT NL NO PL PT RO RS SE SI SK SM TR |
|
| AX | Request for extension of the european patent |
Extension state: BA ME |
|
| STAA | Information on the status of an ep patent application or granted ep patent |
Free format text: STATUS: REQUEST FOR EXAMINATION WAS MADE |
|
| 17P | Request for examination filed |
Effective date: 20170328 |
|
| RBV | Designated contracting states (corrected) |
Designated state(s): AL AT BE BG CH CY CZ DE DK EE ES FI FR GB GR HR HU IE IS IT LI LT LU LV MC MK MT NL NO PL PT RO RS SE SI SK SM TR |
|
| REG | Reference to a national code |
Ref country code: DE Ref legal event code: R079 Ref document number: 602016004884 Country of ref document: DE Free format text: PREVIOUS MAIN CLASS: G03G0015000000 Ipc: H04N0001024000 |
|
| GRAP | Despatch of communication of intention to grant a patent |
Free format text: ORIGINAL CODE: EPIDOSNIGR1 |
|
| STAA | Information on the status of an ep patent application or granted ep patent |
Free format text: STATUS: GRANT OF PATENT IS INTENDED |
|
| RIC1 | Information provided on ipc code assigned before grant |
Ipc: G03G 15/00 20060101ALI20180205BHEP Ipc: H04N 1/407 20060101ALI20180205BHEP Ipc: H04N 1/024 20060101AFI20180205BHEP Ipc: H04N 1/50 20060101ALI20180205BHEP |
|
| INTG | Intention to grant announced |
Effective date: 20180313 |
|
| GRAS | Grant fee paid |
Free format text: ORIGINAL CODE: EPIDOSNIGR3 |
|
| GRAA | (expected) grant |
Free format text: ORIGINAL CODE: 0009210 |
|
| STAA | Information on the status of an ep patent application or granted ep patent |
Free format text: STATUS: THE PATENT HAS BEEN GRANTED |
|
| AK | Designated contracting states |
Kind code of ref document: B1 Designated state(s): AL AT BE BG CH CY CZ DE DK EE ES FI FR GB GR HR HU IE IS IT LI LT LU LV MC MK MT NL NO PL PT RO RS SE SI SK SM TR |
|
| REG | Reference to a national code |
Ref country code: GB Ref legal event code: FG4D |
|
| REG | Reference to a national code |
Ref country code: CH Ref legal event code: EP |
|
| REG | Reference to a national code |
Ref country code: AT Ref legal event code: REF Ref document number: 1033840 Country of ref document: AT Kind code of ref document: T Effective date: 20180915 |
|
| REG | Reference to a national code |
Ref country code: IE Ref legal event code: FG4D |
|
| REG | Reference to a national code |
Ref country code: DE Ref legal event code: R096 Ref document number: 602016004884 Country of ref document: DE |
|
| REG | Reference to a national code |
Ref country code: NL Ref legal event code: MP Effective date: 20180822 |
|
| REG | Reference to a national code |
Ref country code: LT Ref legal event code: MG4D |
|
| PG25 | Lapsed in a contracting state [announced via postgrant information from national office to epo] |
Ref country code: LT Free format text: LAPSE BECAUSE OF FAILURE TO SUBMIT A TRANSLATION OF THE DESCRIPTION OR TO PAY THE FEE WITHIN THE PRESCRIBED TIME-LIMIT Effective date: 20180822 Ref country code: NL Free format text: LAPSE BECAUSE OF FAILURE TO SUBMIT A TRANSLATION OF THE DESCRIPTION OR TO PAY THE FEE WITHIN THE PRESCRIBED TIME-LIMIT Effective date: 20180822 Ref country code: GR Free format text: LAPSE BECAUSE OF FAILURE TO SUBMIT A TRANSLATION OF THE DESCRIPTION OR TO PAY THE FEE WITHIN THE PRESCRIBED TIME-LIMIT Effective date: 20181123 Ref country code: NO Free format text: LAPSE BECAUSE OF FAILURE TO SUBMIT A TRANSLATION OF THE DESCRIPTION OR TO PAY THE FEE WITHIN THE PRESCRIBED TIME-LIMIT Effective date: 20181122 Ref country code: BG Free format text: LAPSE BECAUSE OF FAILURE TO SUBMIT A TRANSLATION OF THE DESCRIPTION OR TO PAY THE FEE WITHIN THE PRESCRIBED TIME-LIMIT Effective date: 20181122 Ref country code: SE Free format text: LAPSE BECAUSE OF FAILURE TO SUBMIT A TRANSLATION OF THE DESCRIPTION OR TO PAY THE FEE WITHIN THE PRESCRIBED TIME-LIMIT Effective date: 20180822 Ref country code: IS Free format text: LAPSE BECAUSE OF FAILURE TO SUBMIT A TRANSLATION OF THE DESCRIPTION OR TO PAY THE FEE WITHIN THE PRESCRIBED TIME-LIMIT Effective date: 20181222 Ref country code: RS Free format text: LAPSE BECAUSE OF FAILURE TO SUBMIT A TRANSLATION OF THE DESCRIPTION OR TO PAY THE FEE WITHIN THE PRESCRIBED TIME-LIMIT Effective date: 20180822 Ref country code: FI Free format text: LAPSE BECAUSE OF FAILURE TO SUBMIT A TRANSLATION OF THE DESCRIPTION OR TO PAY THE FEE WITHIN THE PRESCRIBED TIME-LIMIT Effective date: 20180822 |
|
| REG | Reference to a national code |
Ref country code: AT Ref legal event code: MK05 Ref document number: 1033840 Country of ref document: AT Kind code of ref document: T Effective date: 20180822 |
|
| PG25 | Lapsed in a contracting state [announced via postgrant information from national office to epo] |
Ref country code: HR Free format text: LAPSE BECAUSE OF FAILURE TO SUBMIT A TRANSLATION OF THE DESCRIPTION OR TO PAY THE FEE WITHIN THE PRESCRIBED TIME-LIMIT Effective date: 20180822 Ref country code: LV Free format text: LAPSE BECAUSE OF FAILURE TO SUBMIT A TRANSLATION OF THE DESCRIPTION OR TO PAY THE FEE WITHIN THE PRESCRIBED TIME-LIMIT Effective date: 20180822 Ref country code: AL Free format text: LAPSE BECAUSE OF FAILURE TO SUBMIT A TRANSLATION OF THE DESCRIPTION OR TO PAY THE FEE WITHIN THE PRESCRIBED TIME-LIMIT Effective date: 20180822 |
|
| PG25 | Lapsed in a contracting state [announced via postgrant information from national office to epo] |
Ref country code: AT Free format text: LAPSE BECAUSE OF FAILURE TO SUBMIT A TRANSLATION OF THE DESCRIPTION OR TO PAY THE FEE WITHIN THE PRESCRIBED TIME-LIMIT Effective date: 20180822 Ref country code: IT Free format text: LAPSE BECAUSE OF FAILURE TO SUBMIT A TRANSLATION OF THE DESCRIPTION OR TO PAY THE FEE WITHIN THE PRESCRIBED TIME-LIMIT Effective date: 20180822 Ref country code: EE Free format text: LAPSE BECAUSE OF FAILURE TO SUBMIT A TRANSLATION OF THE DESCRIPTION OR TO PAY THE FEE WITHIN THE PRESCRIBED TIME-LIMIT Effective date: 20180822 Ref country code: RO Free format text: LAPSE BECAUSE OF FAILURE TO SUBMIT A TRANSLATION OF THE DESCRIPTION OR TO PAY THE FEE WITHIN THE PRESCRIBED TIME-LIMIT Effective date: 20180822 Ref country code: CZ Free format text: LAPSE BECAUSE OF FAILURE TO SUBMIT A TRANSLATION OF THE DESCRIPTION OR TO PAY THE FEE WITHIN THE PRESCRIBED TIME-LIMIT Effective date: 20180822 Ref country code: PL Free format text: LAPSE BECAUSE OF FAILURE TO SUBMIT A TRANSLATION OF THE DESCRIPTION OR TO PAY THE FEE WITHIN THE PRESCRIBED TIME-LIMIT Effective date: 20180822 Ref country code: ES Free format text: LAPSE BECAUSE OF FAILURE TO SUBMIT A TRANSLATION OF THE DESCRIPTION OR TO PAY THE FEE WITHIN THE PRESCRIBED TIME-LIMIT Effective date: 20180822 |
|
| REG | Reference to a national code |
Ref country code: DE Ref legal event code: R097 Ref document number: 602016004884 Country of ref document: DE |
|
| PG25 | Lapsed in a contracting state [announced via postgrant information from national office to epo] |
Ref country code: DK Free format text: LAPSE BECAUSE OF FAILURE TO SUBMIT A TRANSLATION OF THE DESCRIPTION OR TO PAY THE FEE WITHIN THE PRESCRIBED TIME-LIMIT Effective date: 20180822 Ref country code: SK Free format text: LAPSE BECAUSE OF FAILURE TO SUBMIT A TRANSLATION OF THE DESCRIPTION OR TO PAY THE FEE WITHIN THE PRESCRIBED TIME-LIMIT Effective date: 20180822 Ref country code: SM Free format text: LAPSE BECAUSE OF FAILURE TO SUBMIT A TRANSLATION OF THE DESCRIPTION OR TO PAY THE FEE WITHIN THE PRESCRIBED TIME-LIMIT Effective date: 20180822 |
|
| PLBE | No opposition filed within time limit |
Free format text: ORIGINAL CODE: 0009261 |
|
| STAA | Information on the status of an ep patent application or granted ep patent |
Free format text: STATUS: NO OPPOSITION FILED WITHIN TIME LIMIT |
|
| 26N | No opposition filed |
Effective date: 20190523 |
|
| PG25 | Lapsed in a contracting state [announced via postgrant information from national office to epo] |
Ref country code: SI Free format text: LAPSE BECAUSE OF FAILURE TO SUBMIT A TRANSLATION OF THE DESCRIPTION OR TO PAY THE FEE WITHIN THE PRESCRIBED TIME-LIMIT Effective date: 20180822 |
|
| PG25 | Lapsed in a contracting state [announced via postgrant information from national office to epo] |
Ref country code: MC Free format text: LAPSE BECAUSE OF FAILURE TO SUBMIT A TRANSLATION OF THE DESCRIPTION OR TO PAY THE FEE WITHIN THE PRESCRIBED TIME-LIMIT Effective date: 20180822 |
|
| REG | Reference to a national code |
Ref country code: CH Ref legal event code: PL |
|
| PG25 | Lapsed in a contracting state [announced via postgrant information from national office to epo] |
Ref country code: LU Free format text: LAPSE BECAUSE OF NON-PAYMENT OF DUE FEES Effective date: 20190321 |
|
| REG | Reference to a national code |
Ref country code: BE Ref legal event code: MM Effective date: 20190331 |
|
| PG25 | Lapsed in a contracting state [announced via postgrant information from national office to epo] |
Ref country code: CH Free format text: LAPSE BECAUSE OF NON-PAYMENT OF DUE FEES Effective date: 20190331 Ref country code: LI Free format text: LAPSE BECAUSE OF NON-PAYMENT OF DUE FEES Effective date: 20190331 Ref country code: IE Free format text: LAPSE BECAUSE OF NON-PAYMENT OF DUE FEES Effective date: 20190321 |
|
| PG25 | Lapsed in a contracting state [announced via postgrant information from national office to epo] |
Ref country code: FR Free format text: LAPSE BECAUSE OF NON-PAYMENT OF DUE FEES Effective date: 20190331 Ref country code: BE Free format text: LAPSE BECAUSE OF NON-PAYMENT OF DUE FEES Effective date: 20190331 |
|
| PG25 | Lapsed in a contracting state [announced via postgrant information from national office to epo] |
Ref country code: TR Free format text: LAPSE BECAUSE OF FAILURE TO SUBMIT A TRANSLATION OF THE DESCRIPTION OR TO PAY THE FEE WITHIN THE PRESCRIBED TIME-LIMIT Effective date: 20180822 |
|
| PG25 | Lapsed in a contracting state [announced via postgrant information from national office to epo] |
Ref country code: MT Free format text: LAPSE BECAUSE OF NON-PAYMENT OF DUE FEES Effective date: 20190321 Ref country code: PT Free format text: LAPSE BECAUSE OF FAILURE TO SUBMIT A TRANSLATION OF THE DESCRIPTION OR TO PAY THE FEE WITHIN THE PRESCRIBED TIME-LIMIT Effective date: 20181222 |
|
| PG25 | Lapsed in a contracting state [announced via postgrant information from national office to epo] |
Ref country code: CY Free format text: LAPSE BECAUSE OF FAILURE TO SUBMIT A TRANSLATION OF THE DESCRIPTION OR TO PAY THE FEE WITHIN THE PRESCRIBED TIME-LIMIT Effective date: 20180822 |
|
| PG25 | Lapsed in a contracting state [announced via postgrant information from national office to epo] |
Ref country code: HU Free format text: LAPSE BECAUSE OF FAILURE TO SUBMIT A TRANSLATION OF THE DESCRIPTION OR TO PAY THE FEE WITHIN THE PRESCRIBED TIME-LIMIT; INVALID AB INITIO Effective date: 20160321 |
|
| PG25 | Lapsed in a contracting state [announced via postgrant information from national office to epo] |
Ref country code: MK Free format text: LAPSE BECAUSE OF FAILURE TO SUBMIT A TRANSLATION OF THE DESCRIPTION OR TO PAY THE FEE WITHIN THE PRESCRIBED TIME-LIMIT Effective date: 20180822 |
|
| PGFP | Annual fee paid to national office [announced via postgrant information from national office to epo] |
Ref country code: GB Payment date: 20230222 Year of fee payment: 8 Ref country code: DE Payment date: 20230221 Year of fee payment: 8 |
|
| PGFP | Annual fee paid to national office [announced via postgrant information from national office to epo] |
Ref country code: DE Payment date: 20240220 Year of fee payment: 9 Ref country code: GB Payment date: 20240220 Year of fee payment: 9 |