EP3069370B1 - Method of measuring isotope ratio - Google Patents
Method of measuring isotope ratio Download PDFInfo
- Publication number
- EP3069370B1 EP3069370B1 EP14796101.5A EP14796101A EP3069370B1 EP 3069370 B1 EP3069370 B1 EP 3069370B1 EP 14796101 A EP14796101 A EP 14796101A EP 3069370 B1 EP3069370 B1 EP 3069370B1
- Authority
- EP
- European Patent Office
- Prior art keywords
- sample
- time period
- concentration
- isotope ratio
- reference gas
- Prior art date
- Legal status (The legal status is an assumption and is not a legal conclusion. Google has not performed a legal analysis and makes no representation as to the accuracy of the status listed.)
- Active
Links
Images




Classifications
-
- G—PHYSICS
- G01—MEASURING; TESTING
- G01N—INVESTIGATING OR ANALYSING MATERIALS BY DETERMINING THEIR CHEMICAL OR PHYSICAL PROPERTIES
- G01N33/00—Investigating or analysing materials by specific methods not covered by groups G01N1/00 - G01N31/00
- G01N33/0004—Gaseous mixtures, e.g. polluted air
- G01N33/0006—Calibrating gas analysers
-
- G—PHYSICS
- G01—MEASURING; TESTING
- G01N—INVESTIGATING OR ANALYSING MATERIALS BY DETERMINING THEIR CHEMICAL OR PHYSICAL PROPERTIES
- G01N21/00—Investigating or analysing materials by the use of optical means, i.e. using sub-millimetre waves, infrared, visible or ultraviolet light
- G01N21/17—Systems in which incident light is modified in accordance with the properties of the material investigated
- G01N21/25—Colour; Spectral properties, i.e. comparison of effect of material on the light at two or more different wavelengths or wavelength bands
- G01N21/27—Colour; Spectral properties, i.e. comparison of effect of material on the light at two or more different wavelengths or wavelength bands using photo-electric detection ; circuits for computing concentration
- G01N21/274—Calibration, base line adjustment, drift correction
- G01N21/276—Calibration, base line adjustment, drift correction with alternation of sample and standard in optical path
-
- G—PHYSICS
- G01—MEASURING; TESTING
- G01N—INVESTIGATING OR ANALYSING MATERIALS BY DETERMINING THEIR CHEMICAL OR PHYSICAL PROPERTIES
- G01N21/00—Investigating or analysing materials by the use of optical means, i.e. using sub-millimetre waves, infrared, visible or ultraviolet light
- G01N21/17—Systems in which incident light is modified in accordance with the properties of the material investigated
- G01N21/25—Colour; Spectral properties, i.e. comparison of effect of material on the light at two or more different wavelengths or wavelength bands
- G01N21/31—Investigating relative effect of material at wavelengths characteristic of specific elements or molecules, e.g. atomic absorption spectrometry
-
- G—PHYSICS
- G01—MEASURING; TESTING
- G01N—INVESTIGATING OR ANALYSING MATERIALS BY DETERMINING THEIR CHEMICAL OR PHYSICAL PROPERTIES
- G01N33/00—Investigating or analysing materials by specific methods not covered by groups G01N1/00 - G01N31/00
- G01N33/0004—Gaseous mixtures, e.g. polluted air
- G01N33/0009—General constructional details of gas analysers, e.g. portable test equipment
- G01N33/0027—General constructional details of gas analysers, e.g. portable test equipment concerning the detector
- G01N33/0036—General constructional details of gas analysers, e.g. portable test equipment concerning the detector specially adapted to detect a particular component
- G01N33/004—CO or CO2
-
- H—ELECTRICITY
- H01—ELECTRIC ELEMENTS
- H01J—ELECTRIC DISCHARGE TUBES OR DISCHARGE LAMPS
- H01J49/00—Particle spectrometers or separator tubes
- H01J49/0009—Calibration of the apparatus
-
- G—PHYSICS
- G01—MEASURING; TESTING
- G01N—INVESTIGATING OR ANALYSING MATERIALS BY DETERMINING THEIR CHEMICAL OR PHYSICAL PROPERTIES
- G01N21/00—Investigating or analysing materials by the use of optical means, i.e. using sub-millimetre waves, infrared, visible or ultraviolet light
- G01N21/17—Systems in which incident light is modified in accordance with the properties of the material investigated
- G01N21/25—Colour; Spectral properties, i.e. comparison of effect of material on the light at two or more different wavelengths or wavelength bands
- G01N21/31—Investigating relative effect of material at wavelengths characteristic of specific elements or molecules, e.g. atomic absorption spectrometry
- G01N21/35—Investigating relative effect of material at wavelengths characteristic of specific elements or molecules, e.g. atomic absorption spectrometry using infrared light
- G01N21/3504—Investigating relative effect of material at wavelengths characteristic of specific elements or molecules, e.g. atomic absorption spectrometry using infrared light for analysing gases, e.g. multi-gas analysis
Definitions
- This invention relates to a method for measuring an isotope ratio in an isotope ratio optical analyser.
- Isotope-ratio analysis is used to measure the relative abundance of isotopes (isotope ratio) in a sample, which may be solid, liquid or gaseous and for a wide variety of elements. For instance, it is used for determining the isotope ratios 13 C/ 12 C and/or 18 O/ 16 O from CO 2 , such as in air. Isotope-ratio analysis is most commonly performed by mass spectrometry (MS) but may also be performed by optical spectrometry.
- MS mass spectrometry
- an isotope ratio is generally determined in a measurement cell of the spectrometer by measuring two separate spectral absorption lines, typically in the infrared region, one line for each different isotopic species (isotopologue), e.g. an absorption line for 12 C 16 O 2 and another line for 13 C 16 O 2 .
- a convenient absorption line for CO 2 is the line at or about 4.3218 ⁇ m. If more lines are available per isotope (e.g. a doublet or triplet) it is possible to measure and use the information from more than one line, e.g. for other gases than CO 2 or in other spectral ranges that might be interesting.
- the ratio of the intensities of the spectral absorption lines is a measure of the ratio of the abundance of each of the isotopic species (and hence the isotope ratio, e.g. 13 C/ 12 C).
- the result is referenced against international standards using the established delta notation for isotope ratio reporting (e.g. ⁇ 13C [ ⁇ ]).
- a sample In isotope ratio spectroscopy, a sample should be measured against a working standard, that is, one or more reference gases of known isotopic ratio. Typically the concentration of the sample and the working standard differ by between 10 parts per million (ppm), per minute, in ambient measurements, and up to 40 pp/min for plant chamber experiments.
- concentration of the sample and the working standard typically differ by between 10 parts per million (ppm), per minute, in ambient measurements, and up to 40 pp/min for plant chamber experiments.
- a calibration factor also termed a linearity calibration or concentration dependence
- CO 2 concentration is used for each isotope ratio.
- concentration of each reference gas is selected on the basis of a known concentration range of the sample, and usually provided in the form of reference gas mixtures in gas tanks.
- the spectrometer measures the gas (for instance CO 2 ) with the same isotopic ratio at different concentrations, or at least numerous reference gases with known isotope ratio and concentration are provided.
- Tuzson et al Another system for calibrating the isotope ratio measurements to account for concentration dependence and a delta scale contraction is described in B. Tuzson et al, "High precision and continuous field measurements of ⁇ 13C and ⁇ 18O in carbon dioxide with a cryogen-free QCLAS", Appl. Phys. B (2008), Volume 92, pp 451-458 .
- Tuzson et al a drawback with the system described in Tuzson et al is that it utilises a significant number of separate diluted supplies of reference gases of known isotope ratio. Such reference gas/air mixtures are not commonly available when working in the field for example.
- the system described Tuzson et al does not employ a sample dilution.
- US-7,810,376 describes an aperture to keep the partial pressure of an analyte diluted in a carrier constant by feeding back the concentration information of the sensor in a flow controller to adjust the gas flow constant. Any changes in the sample concentration are removed by diluting the sample, such that the sample concentration of the measured sample is kept constant. The concentration information is therefore lost.
- the working standard concentration is also kept constant by a flow controller.
- WO-2007/112876 and US-2009/159795 describe a unit which keeps the sample gas concentrations constant by means of flow control devices and open splits by using the sensor signal to adjust valves.
- samples are measured discretely, with the sample being burnt in a reactor and analysed by gas chromatography before isotope ratio analysis is performed.
- the carrier gas such as Helium
- the carrier gas such as Helium
- the present invention seeks to provide an improved method for measuring an isotope ratio of a continuous sample in an isotope ratio optical spectrometer, especially a calibrated isotope ratio.
- a method of measuring an isotope ratio of a continuous sample in line with claim 1, a corresponding controller as defined by claim 15 and an isotope ratio optical spectrometer in line with claim 16 are provided.
- the present invention seeks to address a drift in system parameters by monitoring a change in the continuous sample concentration over time and adjusting the reference gas concentration at repeated intervals so that the sample and reference gas concentrations more closely follow each other over the course of a sample analysis. Multiple sample ⁇ values and concentration values may thereby be obtained.
- the process is preferably iterative.
- the concentration of an unknown sample gas should match with the concentration of the known reference (working standard).
- the sample concentration varies in the range of 10 ppm/min for ambient measurements and up to 40 ppm/min for plant chamber experiments therefore it is desirable that the working standard follows the sample concentration.
- a linear approximation between two references is used to compensate instrument drifts and concentration changes between two references as long as these effects are expected to be linear or nearly linear.
- the concentration information is desirably maintained; therefore a dilution of the sample may not be an option.
- a method of measuring an isotope ratio of a continuous sample in an isotope ratio optical spectrometer comprising: a) measuring at least one sample isotope ratio over a measurement time period t s n (n ⁇ 1) in the spectrometer; b) measuring a sample concentration C s n over at least a part of the measurement time period t s n ; c) selecting a reference gas concentration C ref n for the spectrometer for reference to the sample measured during the measurement time period t s n , on the basis of the measured sample concentration C s n during measurement time period t s n ; d) measuring an isotope ratio of the reference gas at the selected reference gas concentration C ref n in the spectrometer; and e) calibrating the at least one isotope ratio of the sample measured during the measurement time period t s n , having a sample concentration C s n , using the measured isotope ratio
- discrete samples are measured. These may be volumes of gasses acquired from remote sites and/or they may be gas samples created from reactors or eluted from gas chromatographic columns. Gas samples collected may be stored in volumes and released to the analyser over periods of time, presenting substantially the same sample concentration to the analyser during the entire analysis time. Gases released from reaction events, or from gas chromatographic columns present varying concentrations over time to the analyser. However in all these cases, a single isotope ratio is characteristic of the samples. In contrast to this, the present invention concerns continuous samples in which both the isotope ratio of gases present in the sample varies over time and the gas concentration varies over time. This variation is the subject of the analysis. Samples may, in this case, be measured over hours, days or even weeks, and multiple isotope ratio and concentration measurements are taken. Isotope ratio measurements may be taken every few minutes for time periods of weeks, and hence many thousands of measurements may be made.
- the method further comprises: f) determining a plurality of calibrated isotope ratios and a plurality of sample gas concentration measurements, each of the plurality of calibrated isotope ratios and the plurality of sample gas concentration measurements being for a different, respective time.
- determining a plurality of calibrated isotope ratios and a plurality of sample gas concentration measurements each of the plurality of calibrated isotope ratios and the plurality of sample gas concentration measurements being for a different, respective time.
- multiple calibrated sample isotope ratio measurements together with multiple sample concentration measurements are obtained over time.
- this allows both the variation of sample isotope ratio and concentration measurements to be measured against time, which can be especially useful for many different applications, as will be discussed below, but particularly those where a large-scale long-term variation in sample concentration may be possible.
- the sample concentration information is retained and can be measured, which can be particularly desirable where that variation is of interest.
- continuous sample monitoring allows a time-based analysis to be used.
- This allows the reference gas concentration to be matched to a sample gas concentration, which varies dynamically over the measurement time period t s n .
- Step d) of measuring the isotope ratio of the reference gas at the reference gas concentration C ref n in the spectrometer is therefore carried out with the reference gas concentration C ref n matched to the measured sample concentration C s n .
- the step e) of calibrating the at least one isotope ratio of the sample using the measured isotope ratio of the reference gas results in a more accurate calibration and a wider range of sample concentration variation can be accommodated.
- the sample concentration changes dynamically. This may be an important consideration with a continuous sample that has previously been deemed not relevant to the calibration of the isotope ratio measured for the sample.
- the sample concentration varies over the course of the measurement time period t s n significantly. Additionally, the sample concentration during a first measurement time period t s n may be different from the sample concentration during a second, subsequent measurement time period t s n + 1 (n>1). For these reasons (and others noted below), the process is repeated iteratively.
- the selected concentration of the reference gas during that certain measurement time period t s n is based upon the measured sample concentration during that certain measurement time period t s n .
- the selected concentration of the reference gas during that certain measurement time period may also be based upon the measured sample concentration during a preceding measurement time period t s n ⁇ 1 and this will be discussed further below.
- the step f) of determining the plurality of calibrated isotope ratios and the plurality of sample gas concentration measurements comprises associating the at least one calibrated isotope ratio and the measured sample concentration for each measurement time period t s n (n ⁇ 1), with a time from the respective measurement time period t s n .
- each measurement time period t s n results in one or more calibrated sample isotope ratio measurements and one or more sample concentration measurements, such that the variation of sample isotope ratio and concentration can be analysed over time.
- the step d) of measuring at least one sample isotope ratio over the measurement time period t s n in the spectrometer comprises measuring a plurality of sample isotope ratios over the measurement time period t s n in the spectrometer.
- the step f) of determining the plurality of calibrated isotope ratios and the plurality of sample gas concentration measurements may comprise associating each of the plurality of sample isotope ratios measured over the measurement time period t s n with a respective time from the measurement time period t s n .
- the step b) of measuring a sample concentration C s n over at least a part of the measurement time period t s n may comprise measuring a plurality of sample concentrations, each sample concentration measurement being over a respective (different) part of the measurement time period t s n .
- each measurement time period t s n for n ⁇ 1 may be the same. Alternatively the duration may vary between different measurement time periods t s n with n.
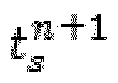
- the duration of a measurement time period t s n + 1 that is subsequent to the certain measurement time period t s n may be set on the basis of a rate of change of sample concentration C s n (or a statistic of the sample concentration C s n ) during the certain measurement time period t s n .
- the duration of the subsequent measurement time period t s n + 1 may have an inverse relationship to the rate of change of (statistic of the) sample concentration C s n during the certain measurement time period t s n .
- the duration of the subsequent measurement time period t s n + 1 may be short (or shortened) if the (statistic of the) sample concentration is changing rapidly, but longer (or lengthened) if the (statistic of the) sample concentration is changing at a slow rate.
- the duration of a measurement time period t s n may be around one minute.
- the step d) of measuring the isotope ratio of the reference gas at the reference gas concentration C ref n in the spectrometer does not take place during the measurement time period t s n .
- this takes place during a reference time period t ref n that is subsequent to the measurement time period t s n .
- the duration of reference time period t ref n is typically shorter than the duration of the measurement time period t s n and usually much shorter (no more than 10%, 20%, 30%, 40% or 50%).
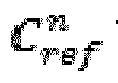
- the selected reference gas concentration C ref n is not necessarily the same as the measured reference gas concentration. Indeed, the difference may be significant.
- the selected reference gas concentration C ref n is normally a nominal value.
- the method further comprises adjusting the reference gas concentration C ref n (which may be termed a first reference gas concentration) for reference to the sample measured during the measurement time period t s n (which may be termed a first measurement time period), on the basis of the measured sample concentration C s n during measurement time period t s n , so as to provide a second reference gas concentration C ref n + 1 , different from the first reference gas concentration, to the spectrometer for use with reference to a second, subsequent measurement time period t s n + 1 .
- C ref n which may be termed a first reference gas concentration
- the method advantageously further comprises: selecting a preceding reference gas concentration C ref n ⁇ 1 for use in connection to a time period that is before the measurement time period t s n .
- the step c) of selecting a reference gas concentration C ref n for the spectrometer for reference to the sample measured during the measurement time period t s n may be on the basis of the measured sample concentration C s n during measurement time period t s n and on the basis of the selected preceding reference gas concentration C ref n ⁇ 1 .
- the method may further comprise measuring the concentration of the reference gas at the selected preceding reference gas concentration C ref n ⁇ 1 .
- the step of measuring the concentration of the reference gas at the selected preceding reference gas concentration C ref n ⁇ 1 may take place during a preceding reference time period t ref n ⁇ 1 that is prior to the measurement time period t s n .
- the method may further comprise calculating a correction factor based upon a ratio of the selected preceding reference gas concentration C ref n ⁇ 1 to the measurement of the preceding reference gas concentration.
- the step c) of selecting the reference gas concentration C ref n may comprise applying the calculated correction factor to the sample concentration C s n measured over the at least part of the measurement time period t s n .
- the step of selecting a preceding reference gas concentration C ref n ⁇ 1 is on the basis of an anticipated sample concentration for the said measurement time period.
- a preceding reference time period t ref 0 during which the step of measuring the concentration of the reference gas at the selected preceding reference gas concentration C ref 0 is carried out.
- This preceding reference time period t ref 0 may not be subsequent to any measurement time period t s n , but it may precede a first measurement time period t s 1 .
- the preceding reference gas concentration C ref 0 is selected by estimation, approximation or use of a nominal value for the sample concentration C s 1 during the first measurement time period t s 1 .
- the step b) of measuring the sample concentration C s n over at least a part of the measurement time period t s n can be achieved in different ways.
- the step b) comprises determining a (time-based) statistical characteristic of the sample concentration over the at least part of the measurement time period t s n , in particular an average of the sample concentration over the at least part of the measurement time period t s n .
- the average may be a mean, median or mode, but other statistical characteristics of the measurement data may be used.
- the step e) of calibrating the isotope ratio of the sample uses the measured isotope ratio of the reference gas at the determined statistical characteristic of the sample concentration or average sample concentration.
- the step b) of measuring the sample concentration C s n over at least a part of the measurement time period t s n can take place at different times.
- the at least part of the measurement time period t s n may be the whole of the measurement time period t s n . This may especially be used when the measured sample concentration C s n is an average of the sample concentration over the measurement time period t s n .
- the at least part of the measurement time period t s n is only a last part of the measurement time period t s n . For example, this may be only a portion of the measurement time period t s n .
- the step e) of calibrating the at least one isotope ratio of the sample measured during the measurement time period t s n uses the measured isotope ratio of the reference gas at the measurement reference gas concentration C ref n , but this calibration may also use other parameters.
- the calibration may use a measured isotope ratio of the reference gas at the preceding reference gas concentration C ref n ⁇ 1 , measured during a preceding reference time period t ref n ⁇ 1 .
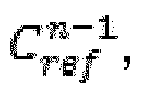
- the method further comprises measuring the isotope ratio of the reference gas at a preceding reference gas concentration C ref n ⁇ 1 in the spectrometer during a preceding reference time period t ref n ⁇ 1 that is before the measurement time period t s n (n>1). Then, the step e) of calibrating the at least one isotope ratio of the sample measured during the measurement time period t s n preferably uses the measured isotope ratio of the reference gas at the preceding reference gas concentration C ref n ⁇ 1 and the measured isotope ratio of the reference gas at the measurement reference gas concentration C ref n .
- the step d) of measuring at least one sample isotope ratio over the measurement time period t s n in the spectrometer may comprise measuring a plurality of sample isotope ratios over the measurement time period t s n in the spectrometer. This is advantageously used in conjunction with the use of the measured isotope ratio of the reference gas at the preceding reference gas concentration C ref n ⁇ 1 in the calibration, as discussed above, but that is not necessarily always the case.
- the step e) of calibrating the at least one isotope ratio of the sample measured during the measurement time period t s n may comprise, for each of the plurality of sample isotope ratios: identifying a respective sample characteristic for the respective sample isotope ratio; determining a respective isotope ratio of the reference gas for the identified respective sample characteristic; and calibrating the respective sample isotope ratio using the determined respective isotope ratio of the reference gas.
- the respective sample characteristic for the respective sample isotope ratio may comprise one or both of: a respective sample concentration for the respective sample isotope ratio; and a respective sample measurement time for the respective sample isotope ratio. An interpolation between two isotope ratio measurements of the reference gas is used, for instance to increase the range of variation in sample concentration that may be analysed at a specific minimum level of accuracy.
- the step of identifying a respective sample characteristic for the respective sample isotope ratio may comprise measuring the respective sample concentration for the respective sample isotope ratio.
- the step of determining a respective isotope ratio of the reference gas for the identified respective sample concentration beneficially comprises interpolating between the measured isotope ratio of the reference gas at the preceding reference gas concentration C ref n ⁇ 1 and the measured isotope ratio of the reference gas at the measurement reference gas concentration C ref n . This may be a linear or non-linear interpolation.
- the step of identifying a respective sample characteristic for the respective sample isotope ratio may comprise measuring the respective sample measurement time for the respective sample isotope ratio.
- the step of determining a respective isotope ratio of the reference gas for the identified respective sample concentration beneficially comprises interpolating between the measured isotope ratio of the reference gas at the preceding reference time period t ref n ⁇ 1 and the measured isotope ratio of the reference gas at the measurement reference time period t ref n .
- the continuous sample is derived from one or more of: ambient air; an open air source; a plant chamber; and a gas monitoring input.
- a large-scale long-term variation in sample concentration may be possible.
- the sample measurement time period may be around one minute, but samples may be received continuously for one week or multiple weeks.
- the sample preferably comprises CO 2 .
- the reference gas advantageously comprises at least one identical species to the sample gas.
- a computer program configured when operated by a processor to carry out the method as described herein.
- a controller for a continuous sample isotope ratio optical spectrometer configured to control the isotope ratio spectrometer to operate in accordance with the method as described herein.
- an isotope ratio optical spectrometer configured to receive a continuous sample and comprising such a controller.
- FIG. 1 there is shown schematically an isotope ratio optical spectrometer 100 interfaced to a multi-port inlet system 120 which represents one particularly preferred arrangement for implementation of the method embodying the present invention.
- the arrangement shown in Figure 1 is shown and explained in more detail in our UK patent publication numbers GB2513118 , GB2513119 and GB2513120 .
- the optical spectrometer is a laser spectrometer.
- a sample (or reference) gas to be measured is transported from the multi-port inlet system 120 through a multi-pass measurement cell 112 in the laser spectrometer by a vacuum pump 114, such as a membrane pump, in the outlet 115 from the spectrometer that pumps the cell.
- the measurement cell has a total optical path length of approximately 5.4m.
- the incoming gas is directly and completely transferred into the measurement cell 112.
- a filter (not shown) upstream of the cell prevents transfer of particles into the cell.
- the inlet flow into the measurement cell in this embodiment is limited by a fixed flow restriction 111 and is set to allow a gas flow rate of 80 ml/min into the cell for atmospheric pressure at the inlet ports 101, 104 and 0.5 bar(g) at inlet ports 102, 103.
- the actual flow through the measurement cell however depends on the pressure of the delivered gas.
- the pressure in the measurement cell 112 is kept constant by controlling the pump speed, for example in this embodiment by feedback to the pump 114 of signals generated from a pressure gauge 113 connected to the cell 112. It is also possible in other embodiments to have an adjustable valve between cell 112 and pump 114 and to control the valve instead of the pump 114, e.g. using the feedback from the pressure gauge 113.
- the pressure in the cell is desirably maintained generally in the range 20-200 mbar(a) or preferably 40-200 mbar(a) or more preferably 40-150 mbar(a).
- the pressure in the measurement cell is typically kept constant at approximately 100 mbar(a) (or in the range 20 to 150 mbar(a), or even to 200 mbar(a)).
- the operating measurement range of the cell is 200-4,000, preferably 200-3,500, ppm of CO 2 in air or in N 2 with highest performance of detection between 200-1,500 ppm, especially 300-1,500 ppm of CO 2 .
- a multiport valve (shown schematically as distinct valves 107-110 for illustration purposes) allows switching between four different gas inlet ports 101-104.
- One of these ports 101 is connected to a gas inlet and referencing system as described in more detail below (see Figure 2 ).
- the remaining ports 102-104 can optionally be used, for example, for additional sample gas (e.g. ambient air at port 104) and/or calibration gases for additional concentration calibration 102, 103.
- the latter requires one or two references with known concentration.
- the inlet and referencing system connected to port 101 is typically used for calibration of the concentration dependence of the isotope ratio measurement and for the isotope ratio dependence of the isotope ratio measurement, which forms the method that embodies the present invention and which is described below.
- the gas inlet system of Figure 2 provides a better stability of the gas flow and avoids possible isotope fractionation by a flow controller.
- the flow of CO 2 -free air (zero air) is controlled by a flow control means (e.g. flow controller or a proportional valve) and instead the CO 2 flow is kept constant.
- a flow control means e.g. flow controller or a proportional valve
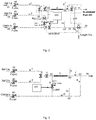
- FIG. 2 there is shown a gas inlet and referencing system suitable for implementing the method embodying the present invention.
- the exit line 16 of the system shown in Figure 2 connects with port 101of the gas inlet system shown in Figure 1 .
- gases exiting from the system shown in Figure 2 enter the spectrometer shown in Figure 1 for isotope ratio measurement.
- the system is configured to be able to deliver sample gas and reference gas to the optical laser spectrometer.
- Supplies of two pure CO 2 reference gases are provided 41, 42.
- the isotope ratio ( 13 C/ 12 C and/or 18 O/ 16 O) of each CO 2 supply is known.
- the flow of each supply of CO 2 is controlled by a respective valve 44, 45, which are constant pressure valves, and a respective flow restriction 1, 2 on the supply lines.
- the two valves V1 and V2 3, 4 on the reference gas line allow switching between the two reference gases as well as shutting them both off from the rest of the system to save reference gas.
- a supply of a carrier gas, which is CO 2 -free air, is also provided 40, the flow of which is controlled by a respective valve 43, which is a constant pressure valve.
- Figure 3 shows the flow scheme of the referencing section of the inlet system alone.
- a constant flow of CO 2 of 400 ⁇ l/s (24 ml/min) from a selected one of the CO 2 reference supplies is mixed into a variable flow of CO 2 -free air (or other carrier gas) (flow rate 3 to 100 ml/min) using a mass flow controller or a proportional valve 9 on the carrier gas line.
- the mass flow controller or a proportional valve 9 is in this embodiment computer controlled (preferably, most or all valves shown in the system of the invention are computer controlled). That is, the CO 2 is not subject to variable mass flow control, thus avoiding fractionation, but rather it is the CO 2 -free air that is dynamically flow controlled.
- the gases first mix at T-junction 50, which is a first mixing junction.
- the gases further mix downstream inside a mixing zone 5, which is a tube that provides an homogeneous mixture of the two gases.
- the flow restrictions 1, 2 and constant input pressure valves 44, 45 of the CO 2 references define the constant CO 2 flow into the mixing zone 5.
- the CO 2 concentration of this resultant pre-mixture is designed to be in the range from 4,000 ppm to 13,000 ppm.
- the mixing zone 5 is necessary to ensure that the CO 2 and the zero air are thoroughly mixed. As the flow rate here can be larger than 100 ml/min, the residence time of the gas in the mixing zone 5 may be very short.
- GB2513118 , GB2513119 and GB2513120 set out some preferred parameters and diameters for the components and flow rates in the arrangements of Figures 2 and 3 .
- the CO 2 pre-mixture is further mixed with more CO 2 -free air (carrier gas) at a second T-junction or flow splitter 52.
- a second dilution of the reference flows is set to an appropriate fixed ratio (for example 1:30).
- the flow to the second mixing T-junction is defined by two flow restrictions 7, 8, which in this embodiment ensure a ratio between the pre-mixture and CO 2 -free air of 1:30. That is, flow restriction 7 restricts flow of pre-mixture and flow restriction 8 restricts flow of carrier gas.
- the flow of the pre-mixture is defined by the flow controller 9 and is always higher than 1/30 of the gas flow into the laser spectrometer. This two stage dilution is preferable due to limitations of the dynamic range of down-mixing in practice.
- the progressive linearity calibration of the concentration dependence is then performed by use of flow controller 9.
- the input pressure of both restrictions 7 and 8 is kept equal at approximately atmospheric pressure by two openings in the form of open tubes or capillaries 6, 14 on the pre-mixture exit line and the carrier gas line respectively.
- the flow of the CO 2 -free air towards the second mixing split is defined by a flow restriction 13 and the constant pressure in the supply 43 of the CO 2 -free air.
- the gas flow at the restriction 13 is always higher than the gas flow to the laser spectrometer.
- the differential amount of CO 2 -free air carrier gas is blown out of an opening 14 on the carrier gas line.
- the openings 6, 14 are situated on T (or Y) piece connections 60, 62.
- the openings 6, 14 are dimensioned such that the gas velocity is always higher than the diffusion velocity of CO 2 in air to avoid contaminations of the reference gases. From the above it can be seen that the reference gas flows are very low and should not be dynamically regulated or actively controlled (i.e. valves 1 and 2 (at locations 3, 4) are typically on/off valves). Thus, the reference gas flows from the reference gas supplies, via valves 1 and 2, are not changed when changing the CO 2 concentration in the spectrometer. Instead, a first dilution of the reference gas flow is dynamically regulated by controlling flow of the zero air (using computer controlled valve 9).
- the referencing system is designed to allow dilution of the supplied gases by mixing different gases with each other to change concentrations of the desired gas species (e.g. CO 2 in zero air). It can be seen that by varying the flow of the carrier gas using mass flow controller (9), the concentration of CO 2 reference gas in the CO 2 -free carrier gas can be varied.
- the referencing system allows any concentration of the CO 2 for linearity calibration in the measurement range of the spectrometer from 100-4,000 ppm, more preferably 200-3,500 ppm. In this way, isotope ratio measurements can be taken in the spectrometer at a plurality of different CO 2 concentrations to enable a concentration dependence of the isotope ratio measurement to be determined in accordance with the method of the present invention.
- An exit line 16 takes the flow from the mixing zone into the optical laser spectrometer after the second stage of dilution.
- the output flow into the optical laser spectrometer is defined by the spectrometer itself and is ideally 80 ml/min.
- the pressure at the outlet 16 that interfaces to the spectrometer is designed to be around atmospheric pressure.
- the gas inlet system shown in Figure 2 further comprises a sample inlet system for introducing a sample gas (i.e. of unknown isotope ratio and/or concentration) into the spectrometer.
- a sample gas i.e. of unknown isotope ratio and/or concentration
- the details of this are not critical to the present invention and in any event may be found in GB2513118 , GB2513119 and GB2513120 .
- a flow of CO 2 -free air is mixed with a CO 2 sample flow coming from a sample inlet port 12 ( Figure 2 ) to which is connected a supply of sample gas (CO 2 ).
- the supply of CO 2 -free air for the sample flow is the same supply 40 as used for dilution of the reference gases in the referencing system.
- sample inlet system must ensure that little or no sample is lost.
- the preferred sample inlet system ensures 100% sample transfer from the sample input port to the laser spectrometer 16.
- a constant flow to the laser spectrometer is ensured by filling the differential volume between the sample flow and the flow to the laser spectrometer with a carrier or dilution gas, which in this case is CO 2 -free air (zero air). No sample is wasted and the concentration of CO 2 in the gas flow to the laser spectrometer is kept constant and in the optimal range.
- a first reference gas measurement step 301 is optional.
- a reference gas concentration is selected arbitrarily. For example, it may be selected on the basis of an anticipated sample concentration for the sample to be measured in a subsequent step.
- the concentration of the reference gas at the selected initial concentration is measured, preferably by taking a spectroscopy measurement of the reference gas nominally supplied at the selected concentration.
- This initial reference gas measurement step 201 can be considered a 0 th time period, because it precedes a first measurement of the sample.
- a first sample measurement step 210 at least one sample isotope ratio is measured over a measurement time period using the spectrometer. Typically, multiple isotope ratios are measured for the sample. As explained above, the sample concentration can vary over this time period.
- a concentration of the sample is measured.
- first sample measurement step 210 and second sample measurement step 220 are shown as concurrent steps, they normally take place in parallel and the duration of these two steps can be represented as an n th measurement time period.
- the sample concentration measurement can take place simultaneously with the isotope ratio measurement.
- the sample concentration measurement may take place during a part of the time period during which the sample isotope ratio is being measured, particularly a latter part of that time period.
- a reference gas concentration selection step 330 is performed.
- a new reference gas concentration is selected based on the measured sample concentration.
- the reference gas concentration that is selected can be based on the calibration factor that was determined in initial reference gas measurement step 201. An example of this will be shown below.
- calibration step 250 the at least one isotope ratio of the sample is calibrated using the measured isotope ratio of the reference gas at the corresponding selected reference gas concentration.
- the correction factor used in the selection of the reference gas concentration may be taken from the measurement of the reference gas in reference gas measurement step 250 (that is, during the (n-1) th reference time period.
- the concentration of the reference gas is also measured during this step and a new correction factor is determined.
- the process proceeds along route 262 terminating step 370, where the process ends.
- FIG. 4b there is shown a flowchart of an optional part of the process shown in Figure 4a , for calibrating sample gas isotope ratios. This is an optional technique for carrying out the calibration step 250, in cases where multiple isotope ratio measurements are taken in first sample measurement step 210.
- sample concentration identification step 251 a sample concentration is identified for the first isotope ratio measurement of the sample taken in first sample measurement step 210.
- an isotope ratio of the reference gas is determined for the identified sample concentration in step 251. This takes place in isotope ratio determination step 252.
- the sample isotope ratio measurement is calibrated using the determined reference gas isotope ratio from determination step 252. This takes place in calibration step 253.
- measurement decision step 254 the decision is made as to whether this is the final isotope ratio measurement for the sample that was taken in first measurement step 210. If not, route 255 is taken and the process returns to sample concentration identification step 251. Steps 251, 252, 253 and 254 are then repeated for the next sample isotope ratio measurement that was taken in first sample measurement step 210. If all of the sample isotope ratio measurements have been processed, decision step 254 proceeds to terminating step 256 and the process returns to decision step 260 shown on Figure 4a .
- FIG. 5 there is shown a plot of an example gas concentration for each of a reference gas and a sample gas against time, showing when respective isotope ratios are measured.
- the variation of the sample concentration over time 301 is shown as the main plot (illustrating a typical concentration trend during a measurement). This time period is divided into a series of time durations, during which the spectrometer is used for a different measurements, as will be discussed below.
- the sample for example, ambient air
- reference (or working standard) gases are measured alternately.
- the reference gas is measured at a default concentration 340 (which can be set by the user).
- a first measurement time period 321 follows (typically a few minutes).
- the sample is measured to determine at least one isotope ratio.
- the sample concentration changes (here, increases) during the first measurement time period 321.
- the sample is measured to determine the concentration of the sample. This is typically an average concentration over the portion 331 and the length (or start and finish times) of the portion 331 is adjustable. Normally, the portion 331 is at the end of the first measurement time period 321.
- the reference gas is now measured during a first reference time period 311 at the concentration measured during the portion 331 of the first measurement time period 321. This reference gas concentration 341 is shown and an isotope ratio measurement for the reference gas is taken.
- second measurement time period 322 the sample is measured again, with at least one isotope ratio measurement being made during this period and a concentration measurement being made during a portion 332 of the second measurement time period 322.
- a second reference time period 312 takes place and an isotope ratio for the reference gas is measured at the concentration determined during the portion 332 of the second measurement time period 322. Again, the reference gas concentration 342 is shown.
- At least one isotope ratio measurement (and preferably multiple measurements) were made during the second measurement time period 322, these are desirably calibrated against the reference gas isotope ratio measurements. This can be achieved by taking a linear interpolation 352 of the two neighbouring reference gas isotope ratio measurements 341 and 342. Each individual data point (isotope ratio) of the sample measurement (on basis of the integration time) during the second measurement time period 322 is referenced against the isotope ratio determined from the linear interpolation 352. At each data point, a quasi-reference is available at a matched concentration without any dilution of the sample. Thus, the sample concentration is not lost using this referencing technique and a more accurate calibration of the at least one sample isotope ratio measurement can be made.
- a third measurement time period 323 This is repeated during a third measurement time period 323, with at least one isotope ratio measurement being made during this period and a concentration measurement being made during a portion 333 of the third measurement time period 323. Then, a third reference time period 313 takes place and an isotope ratio for the reference gas is measured at the concentration determined during the portion 333 of the third measurement time period 323 (reference gas concentration 343 is shown once more). Again, a linear interpolation 353 between the second reference gas concentration 342 and third reference gas concentration 343 is shown, which can be used for calibration of the data points measured during the third measurement time period 323.
- a fourth measurement time period 324 is shown, with at least one isotope ratio measurement being made during this period and a concentration measurement being made during a portion 334 of the fourth measurement time period 324.
- an isotope ratio for the reference gas is measured at the concentration determined during the portion 334 of the fourth measurement time period 324 (as shown by reference gas concentration 344).
- Another linear interpolation 354 between the third reference gas concentration 343 and fourth reference gas concentration 344 is used for calibration of the data points measured during the fourth measurement time period 324.
- the linear interpolation technique may not be used.
- the concentration of the reference measured during each reference time period 311, 312, 313, 314 matches the average of the sample concentration over the whole sample measurement time.
- the portion 331, 332, 333, 334 becomes essentially 100% of the respective measurement time period 321, 322, 323, 324.
- the isotope ratio of the sample is calibrated using only the isotope ratio measurement of the reference as measured at the determined concentration (known as post-referencing or non-bracketing technique). Nonetheless, the reference concentration is matched to the sample concentration as measured.
- the flow controller is calibrated once after connecting a working standard. To avoid multiple calibrations over a wide range the system self-calibrates during measurements.
- the uncalibrated raw values for the concentration from the instrument are matched. Therefore a desirable requirement for the self-calibration is that the measured raw concentration of a working standard matches the set value for the same working standard.
- a correction factor is updated on basis of the uncalibrated raw values of the sensor. For the next reference the factor with the latest update is applied. For instance (using the example illustrated above with reference to Figure 5 ), the concentration of the reference gas is also measured during the initial reference time period 310 and this is compared with the concentration that was initially selected. A correction factor is determined based on the ratio of the selected (nominal) reference concentration to the measured reference concentration. Then, this correction factor is used subsequently in the selection of the first reference concentration to be used the first reference time period 311. This will be illustrated with an example below. Matching intensities for the reference intensity to that measured for the sample may alternatively be effective.
- This example shows a workflow with fictive sample concentration and the behavior of the reference concentration, when using the approach outline above.
- the example shows a bad match of set value for the working standard concentration with the measured concentration of the working standard.
- the reference concentration value is cause to approach the final sample concentration value.
- the correction factor is iteratively improved by each sample and reference concentration measurement.
- the first reference is measured at default concentration or a user estimate.
- the set value of the reference gas concentration is 380ppm and the measured value of this example is 392ppm. Therefore, a correction factor of 0.969 is calculated.
- Index 2 shows the first sample measurement with a measured concentration of 480ppm.
- the correction factor is updated on each reference measurement. To calculate the reference concentration the concentration from the last sample measurement is used together with the last correction factor.
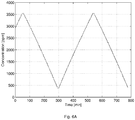
- FIG. 6A there is shown a plot of an example gas concentration for a sample gas against time. It can be seen that the sample gas concentration varies significantly.
- FIG. 6B there is shown a plot of example isotope ratio deltas ( ⁇ 13C ) for a sample gas, showing: raw instrument values 610; first calibrated values 620, using the isotope ratio measurements taken for the reference gas with a concentration matched to that of the sample gas shown in Figure 6A ; and second calibrated values 630, using the isotope ratio measurements taken for the reference gas with a concentration matched to that of the sample gas shown in Figure 6A and linear interpolation, as discussed above.
- Isotope ratio values plotted at 620 and 630 are shown at the same scale as values 610, but they have been offset along the y axis so that they can be clearly distinguished from one another.
- the raw instrument values 610 vary in accordance with the sample gas concentration variation. Indeed, the standard deviation for these measurements is 0.48 per mil. However, both the first ⁇ 13C values calibrated without linear interpolation 620 and the second ⁇ 13C values 630 calibrated with linear interpolation show significantly less variation than the raw instrument values. Moreover, the second ⁇ 13C values 630 calibrated with linear interpolation have a standard deviation of 0.07 per mil, which is significantly less variation than the first ⁇ 13C values 620 calibrated without linear interpolation, which have a standard deviation of 0.13 per mil and which show a small variation in time, matching that of the sample gas concentration.
- the portion 331, 332, 333, 334 need not be a final portion of the respective measurement time period 321, 322, 323, 324 and it can be 10%, 20%, 25%, 30%, 50%, 70%, 75%, 80%, 85%, 90%, 95% or 100% of the total.
- the portion can be adjusted and can vary between measurement time periods, for example dependent upon the rate of change of concentration or based on user preferences. Also, the length of the measurement time period can be changed (possibly dynamically), based on the rate of change of concentration or user preferences, if warranted. Where interpolation is used, a linear or non-linear interpolation may be possible. Various interpolation or curve matching techniques can be employed.
- the carrier gas may be selected from: air, nitrogen, helium or argon, or mixtures of any two or more of the foregoing.
Landscapes
- Chemical & Material Sciences (AREA)
- Physics & Mathematics (AREA)
- Health & Medical Sciences (AREA)
- Life Sciences & Earth Sciences (AREA)
- Engineering & Computer Science (AREA)
- Analytical Chemistry (AREA)
- General Physics & Mathematics (AREA)
- Pathology (AREA)
- Immunology (AREA)
- Biochemistry (AREA)
- General Health & Medical Sciences (AREA)
- Medicinal Chemistry (AREA)
- Combustion & Propulsion (AREA)
- Food Science & Technology (AREA)
- Spectroscopy & Molecular Physics (AREA)
- Mathematical Physics (AREA)
- Theoretical Computer Science (AREA)
- Other Investigation Or Analysis Of Materials By Electrical Means (AREA)
- Investigating Or Analysing Materials By Optical Means (AREA)
Description
- This invention relates to a method for measuring an isotope ratio in an isotope ratio optical analyser.
- Isotope-ratio analysis is used to measure the relative abundance of isotopes (isotope ratio) in a sample, which may be solid, liquid or gaseous and for a wide variety of elements. For instance, it is used for determining the isotope ratios 13C/12C and/or 18O/16O from CO2, such as in air. Isotope-ratio analysis is most commonly performed by mass spectrometry (MS) but may also be performed by optical spectrometry.
- For optical spectrometry, an isotope ratio is generally determined in a measurement cell of the spectrometer by measuring two separate spectral absorption lines, typically in the infrared region, one line for each different isotopic species (isotopologue), e.g. an absorption line for 12C16O2 and another line for 13C16O2. A convenient absorption line for CO2 is the line at or about 4.3218µm. If more lines are available per isotope (e.g. a doublet or triplet) it is possible to measure and use the information from more than one line, e.g. for other gases than CO2 or in other spectral ranges that might be interesting. The ratio of the intensities of the spectral absorption lines is a measure of the ratio of the abundance of each of the isotopic species (and hence the isotope ratio, e.g. 13C/12C).The outputs of the spectrometer are thus ratios of different isotopic lines (e.g. R13C= c13c/c12c). The result is referenced against international standards using the established delta notation for isotope ratio reporting (e.g. δ13C [‰]).
- A general review of isotope ratio mass spectrometry and gas inlet systems can be found in Brenna et al, Mass Spectrometry Reviews, 1997, 16, 227-258.
- In isotope ratio spectroscopy, a sample should be measured against a working standard, that is, one or more reference gases of known isotopic ratio. Typically the concentration of the sample and the working standard differ by between 10 parts per million (ppm), per minute, in ambient measurements, and up to 40 pp/min for plant chamber experiments.
- It is observed that the measured isotope ratio depends upon the concentration of the analyte. Therefore a calibration factor (also termed a linearity calibration or concentration dependence), which depends upon the, for example, CO2 concentration is used for each isotope ratio. It is known to employ one or more reference gases (that is, either one reference gas or a plurality of reference gases) each at a constant (known) concentration. The concentration of each reference gas is selected on the basis of a known concentration range of the sample, and usually provided in the form of reference gas mixtures in gas tanks. To calculate the linearity calibration factors, the spectrometer measures the gas (for instance CO2) with the same isotopic ratio at different concentrations, or at least numerous reference gases with known isotope ratio and concentration are provided.
- To provide the sample and reference at the same intensity (concentration) in gas isotope mass spectrometry, a classical solution has been the use of adjustable bellows and a changeover valve. (for example, see: Halsted R. E. & Nier A. O., 1950, Gas flow through the mass spectrometer viscous leak., Rev. Sci. Instrum., 21: 1019-1021; Or Habfast K. (1997) Advanced isotope ratio mass spectrometry I: Magnetic isotope ratio mass spectrometers; and In: Modern isotope ratio mass spectrometry, I. T. Platzner (ed.), John Wiley & Sons, Chichester, UK: 11-82). In this way, discrete samples are measured, after filling them into a reservoir. At the beginning of a measurement, the intensities from both reservoirs are matched by changing the volume of (and thereby the pressure within) one or both adjustable reservoirs.
- Another system for calibrating the isotope ratio measurements to account for concentration dependence and a delta scale contraction is described in B. Tuzson et al, "High precision and continuous field measurements of δ13C and δ18O in carbon dioxide with a cryogen-free QCLAS", Appl. Phys. B (2008), Volume 92, pp 451-458. However, a drawback with the system described in Tuzson et al is that it utilises a significant number of separate diluted supplies of reference gases of known isotope ratio. Such reference gas/air mixtures are not commonly available when working in the field for example. Furthermore, the system described Tuzson et al does not employ a sample dilution.
-
US-7,810,376 describes an aperture to keep the partial pressure of an analyte diluted in a carrier constant by feeding back the concentration information of the sensor in a flow controller to adjust the gas flow constant. Any changes in the sample concentration are removed by diluting the sample, such that the sample concentration of the measured sample is kept constant. The concentration information is therefore lost. The working standard concentration is also kept constant by a flow controller. -
WO-2007/112876 andUS-2009/159795 describe a unit which keeps the sample gas concentrations constant by means of flow control devices and open splits by using the sensor signal to adjust valves. In general, samples are measured discretely, with the sample being burnt in a reactor and analysed by gas chromatography before isotope ratio analysis is performed. In this case, the carrier gas (such as Helium) flow is controlled to keep the concentration of sample and/or reference gases constant. This allows a single isotope ratio for each gas chromatograph peak to be determined. - An improved arrangement for performing calibrations, which are required to calculate a δ-value from a ratio of spectral intensities, is described in our patent publications
GB2513118 GB2513119 GB2513120 WO2014/170179 . - Although calibration improves the concentration dependency of isotopic ratio analysis by a factor of between 5 and 10, further improvements in the accuracy of calibration would be desirable.
- The present invention seeks to provide an improved method for measuring an isotope ratio of a continuous sample in an isotope ratio optical spectrometer, especially a calibrated isotope ratio. A method of measuring an isotope ratio of a continuous sample in line with
claim 1, a corresponding controller as defined byclaim 15 and an isotope ratio optical spectrometer in line withclaim 16 are provided. - It has been observed that the correlation between isotope ratio and concentration is not stable (that is, it varies over time and with changes in temperature). The present invention seeks to address a drift in system parameters by monitoring a change in the continuous sample concentration over time and adjusting the reference gas concentration at repeated intervals so that the sample and reference gas concentrations more closely follow each other over the course of a sample analysis. Multiple sample δ values and concentration values may thereby be obtained. The process is preferably iterative.
- To comply with the principle of identical treatment, the concentration of an unknown sample gas should match with the concentration of the known reference (working standard). In experiments the sample concentration varies in the range of 10 ppm/min for ambient measurements and up to 40 ppm/min for plant chamber experiments therefore it is desirable that the working standard follows the sample concentration. A linear approximation between two references is used to compensate instrument drifts and concentration changes between two references as long as these effects are expected to be linear or nearly linear. The concentration information is desirably maintained; therefore a dilution of the sample may not be an option.
- There is provided, in a first aspect, a method of measuring an isotope ratio of a continuous sample in an isotope ratio optical spectrometer comprising: a) measuring at least one sample isotope ratio over a measurement time period


- Typically in the known arrangements referred to above, discrete samples are measured. These may be volumes of gasses acquired from remote sites and/or they may be gas samples created from reactors or eluted from gas chromatographic columns. Gas samples collected may be stored in volumes and released to the analyser over periods of time, presenting substantially the same sample concentration to the analyser during the entire analysis time. Gases released from reaction events, or from gas chromatographic columns present varying concentrations over time to the analyser. However in all these cases, a single isotope ratio is characteristic of the samples. In contrast to this, the present invention concerns continuous samples in which both the isotope ratio of gases present in the sample varies over time and the gas concentration varies over time. This variation is the subject of the analysis. Samples may, in this case, be measured over hours, days or even weeks, and multiple isotope ratio and concentration measurements are taken. Isotope ratio measurements may be taken every few minutes for time periods of weeks, and hence many thousands of measurements may be made.
- Preferably, the method further comprises: f) determining a plurality of calibrated isotope ratios and a plurality of sample gas concentration measurements, each of the plurality of calibrated isotope ratios and the plurality of sample gas concentration measurements being for a different, respective time. This means that multiple calibrated sample isotope ratio measurements together with multiple sample concentration measurements are obtained over time. Advantageously, this allows both the variation of sample isotope ratio and concentration measurements to be measured against time, which can be especially useful for many different applications, as will be discussed below, but particularly those where a large-scale long-term variation in sample concentration may be possible. By matching the reference concentration to the sample (and not diluting the sample), the sample concentration information is retained and can be measured, which can be particularly desirable where that variation is of interest. Moreover, continuous sample monitoring allows a time-based analysis to be used.
- This may be achieved by carrying out the step c) of selecting a reference gas concentration





- As noted above, the sample concentration changes dynamically. This may be an important consideration with a continuous sample that has previously been deemed not relevant to the calibration of the isotope ratio measured for the sample. The sample concentration varies over the course of the measurement time period


- Advantageously, the step f) of determining the plurality of calibrated isotope ratios and the plurality of sample gas concentration measurements comprises associating the at least one calibrated isotope ratio and the measured sample concentration for each measurement time period


- The duration of each measurement time period



- In the preferred embodiment, the step d) of measuring the isotope ratio of the reference gas at the reference gas concentration


- The selected reference gas concentration




- The correction may be achieved as follows. Before step a) is carried out, the method advantageously further comprises: selecting a preceding reference gas concentration


period 


period 
- The step b) of measuring the sample concentration


- Additionally or alternatively, the step b) of measuring the sample concentration


- The step e) of calibrating the at least one isotope ratio of the sample measured during the measurement time period





- Although some embodiments may only measure a single sample isotope ratio over the measurement time period


- The step of identifying a respective sample characteristic for the respective sample isotope ratio may comprise measuring the respective sample concentration for the respective sample isotope ratio. Where the measured isotope ratio of the reference gas at the preceding reference gas concentration


- Additionally or alternatively, the step of identifying a respective sample characteristic for the respective sample isotope ratio may comprise measuring the respective sample measurement time for the respective sample isotope ratio. Where the measured isotope ratio of the reference gas at the preceding reference time period


- In the preferred embodiment, the continuous sample is derived from one or more of: ambient air; an open air source; a plant chamber; and a gas monitoring input. In many of these cases, a large-scale long-term variation in sample concentration may be possible. For instance, the sample measurement time period may be around one minute, but samples may be received continuously for one week or multiple weeks. The sample preferably comprises CO2. The reference gas advantageously comprises at least one identical species to the sample gas.
- In another aspect, there may be provided a computer program configured when operated by a processor to carry out the method as described herein.
- In a further aspect, there is provided a controller for a continuous sample isotope ratio optical spectrometer, configured to control the isotope ratio spectrometer to operate in accordance with the method as described herein. There is also provided an isotope ratio optical spectrometer configured to receive a continuous sample and comprising such a controller.
- Various preferred features of the present invention will be apparent from the appended claims and from the following specific description of some preferred embodiments.
- The invention may be put into practice in a number of ways and some embodiments will now be described by way of example only and with reference to the accompanying figures in which:
-
Figure 1 shows a schematic layout of an isotope ratio optical spectrometer interfaced to a gas inlet system in accordance with an existing design; -
Figure 2 shows a schematic layout of a gas inlet and referencing system in accordance with an existing design; -
Figure 3 shows a schematic layout of the referencing section of the system shown inFigure 2 ; -
Figure 4A shows a flowchart of a process for measuring reference gas and sample gas isotope ratios and concentrations, that embodies the present invention; -
Figure 4B shows a flowchart of an optional part of the process shown inFigure 4A , for calibrating sample gas isotope ratios; -
Figure 5 shows a plot of an example gas concentration for each of a reference gas and a sample gas against time, showing when respective isotope ratios are measured; -
Figure 6A shows a plot of an example gas concentration for a sample gas against time; and -
Figure 6B shows a plot of example isotope ratio deltas for a sample gas, showing raw instrument values, calibrated values using a first embodiment of the invention and calibrated values using a second embodiment of the invention, for the reference gas concentration ofFigure 6A . - Referring to
Figure 1 , there is shown schematically an isotope ratiooptical spectrometer 100 interfaced to amulti-port inlet system 120 which represents one particularly preferred arrangement for implementation of the method embodying the present invention. The arrangement shown inFigure 1 is shown and explained in more detail in ourUK patent publication numbers GB2513118 GB2513119 GB2513120 - The optical spectrometer is a laser spectrometer. A sample (or reference) gas to be measured is transported from the
multi-port inlet system 120 through amulti-pass measurement cell 112 in the laser spectrometer by avacuum pump 114, such as a membrane pump, in theoutlet 115 from the spectrometer that pumps the cell. The measurement cell has a total optical path length of approximately 5.4m. The incoming gas is directly and completely transferred into themeasurement cell 112. A filter (not shown) upstream of the cell prevents transfer of particles into the cell. The inlet flow into the measurement cell in this embodiment is limited by a fixedflow restriction 111 and is set to allow a gas flow rate of 80 ml/min into the cell for atmospheric pressure at theinlet ports inlet ports measurement cell 112 is kept constant by controlling the pump speed, for example in this embodiment by feedback to thepump 114 of signals generated from apressure gauge 113 connected to thecell 112. It is also possible in other embodiments to have an adjustable valve betweencell 112 and pump 114 and to control the valve instead of thepump 114, e.g. using the feedback from thepressure gauge 113. In this way, the pressure in the cell is desirably maintained generally in the range 20-200 mbar(a) or preferably 40-200 mbar(a) or more preferably 40-150 mbar(a). The pressure in the measurement cell is typically kept constant at approximately 100 mbar(a) (or in therange 20 to 150 mbar(a), or even to 200 mbar(a)). The operating measurement range of the cell is 200-4,000, preferably 200-3,500, ppm of CO2 in air or in N2 with highest performance of detection between 200-1,500 ppm, especially 300-1,500 ppm of CO2. - On the gas inlet line into the measurement cell, a multiport valve (shown schematically as distinct valves 107-110 for illustration purposes) allows switching between four different gas inlet ports 101-104. One of these
ports 101 is connected to a gas inlet and referencing system as described in more detail below (seeFigure 2 ). The remaining ports 102-104 can optionally be used, for example, for additional sample gas (e.g. ambient air at port 104) and/or calibration gases foradditional concentration calibration port 101 is typically used for calibration of the concentration dependence of the isotope ratio measurement and for the isotope ratio dependence of the isotope ratio measurement, which forms the method that embodies the present invention and which is described below. - For linearity calibration and delta scale contraction, mixtures of reference CO2 with carrier gas, using CO2 from two different sources (with different known isotope ratios), are required. The arrangement of
Figure 2 shows a gas inlet that provides a convenient way to supply these different concentration gases to the spectrometer by mixing pure CO2 with CO2-free air (also termed zero air), or other CO2-free gas. The dilution is performed to give the required 200-4,000 (preferably 200-3,500) ppm CO2 in air (or in N2). Further advantageously, CO2-free air can either be produced in the field using a CO2 absorber or delivered in gas tanks. - The gas inlet system of
Figure 2 provides a better stability of the gas flow and avoids possible isotope fractionation by a flow controller. The flow of CO2-free air (zero air) is controlled by a flow control means (e.g. flow controller or a proportional valve) and instead the CO2 flow is kept constant. For higher dynamic range and flow matching the dilution may be carried out in two steps. - Referring to
Figure 2 , there is shown a gas inlet and referencing system suitable for implementing the method embodying the present invention. Firstly, it is noted how the system connects with the spectrometer shown inFigure 1 . Theexit line 16 of the system shown inFigure 2 connects with port 101of the gas inlet system shown inFigure 1 . Thus, gases exiting from the system shown inFigure 2 enter the spectrometer shown inFigure 1 for isotope ratio measurement. The system is configured to be able to deliver sample gas and reference gas to the optical laser spectrometer. - Supplies of two pure CO2 reference gases (
ref 1 and ref 2) are provided 41, 42. The isotope ratio (13C/12C and/or 18O/16O) of each CO2 supply is known. The flow of each supply of CO2 is controlled by arespective valve respective flow restriction V2 3, 4 on the reference gas line allow switching between the two reference gases as well as shutting them both off from the rest of the system to save reference gas. A supply of a carrier gas, which is CO2-free air, is also provided 40, the flow of which is controlled by arespective valve 43, which is a constant pressure valve. For simplicity,Figure 3 shows the flow scheme of the referencing section of the inlet system alone. - To avoid fractionation of the CO2, a constant flow of CO2 of 400 µl/s (24 ml/min) from a selected one of the CO2 reference supplies is mixed into a variable flow of CO2-free air (or other carrier gas) (flow rate 3 to 100 ml/min) using a mass flow controller or a
proportional valve 9 on the carrier gas line. The mass flow controller or aproportional valve 9 is in this embodiment computer controlled (preferably, most or all valves shown in the system of the invention are computer controlled). That is, the CO2 is not subject to variable mass flow control, thus avoiding fractionation, but rather it is the CO2-free air that is dynamically flow controlled. The gases first mix at T-junction 50, which is a first mixing junction. The gases further mix downstream inside a mixingzone 5, which is a tube that provides an homogeneous mixture of the two gases. Theflow restrictions input pressure valves zone 5. The CO2 concentration of this resultant pre-mixture is designed to be in the range from 4,000 ppm to 13,000 ppm. The mixingzone 5 is necessary to ensure that the CO2 and the zero air are thoroughly mixed. As the flow rate here can be larger than 100 ml/min, the residence time of the gas in themixing zone 5 may be very short. -
GB2513118 GB2513119 GB2513120 Figures 2 and 3 . - Still referring to
Figures 2 and 3 , the CO2 pre-mixture is further mixed with more CO2-free air (carrier gas) at a second T-junction or flowsplitter 52. This is thus a second mixing junction. A second dilution of the reference flows is set to an appropriate fixed ratio (for example 1:30). The flow to the second mixing T-junction is defined by twoflow restrictions flow restriction 7 restricts flow of pre-mixture and flowrestriction 8 restricts flow of carrier gas. The flow of the pre-mixture is defined by theflow controller 9 and is always higher than 1/30 of the gas flow into the laser spectrometer. This two stage dilution is preferable due to limitations of the dynamic range of down-mixing in practice. The progressive linearity calibration of the concentration dependence is then performed by use offlow controller 9. - The input pressure of both
restrictions capillaries opening 6 positioned after (downstream of) the mixing zone, between the mixingzone 5 and theflow restriction 7. The flow of the CO2-free air towards the second mixing split is defined by aflow restriction 13 and the constant pressure in thesupply 43 of the CO2-free air. The gas flow at therestriction 13 is always higher than the gas flow to the laser spectrometer. The differential amount of CO2-free air carrier gas is blown out of anopening 14 on the carrier gas line. - The
openings piece connections openings valves 1 and 2 (at locations 3, 4) are typically on/off valves). Thus, the reference gas flows from the reference gas supplies, viavalves - The referencing system is designed to allow dilution of the supplied gases by mixing different gases with each other to change concentrations of the desired gas species (e.g. CO2 in zero air). It can be seen that by varying the flow of the carrier gas using mass flow controller (9), the concentration of CO2 reference gas in the CO2-free carrier gas can be varied. The referencing system allows any concentration of the CO2 for linearity calibration in the measurement range of the spectrometer from 100-4,000 ppm, more preferably 200-3,500 ppm. In this way, isotope ratio measurements can be taken in the spectrometer at a plurality of different CO2 concentrations to enable a concentration dependence of the isotope ratio measurement to be determined in accordance with the method of the present invention.
- An
exit line 16 takes the flow from the mixing zone into the optical laser spectrometer after the second stage of dilution. The output flow into the optical laser spectrometer is defined by the spectrometer itself and is ideally 80 ml/min. The pressure at theoutlet 16 that interfaces to the spectrometer is designed to be around atmospheric pressure. - Reference gas switching is also possible with the arrangement of
Figures 2 and 3 , and further details may again be found inGB2513118 GB2513119 GB2513120 - In addition to the referencing system described above, the gas inlet system shown in
Figure 2 further comprises a sample inlet system for introducing a sample gas (i.e. of unknown isotope ratio and/or concentration) into the spectrometer. The details of this are not critical to the present invention and in any event may be found inGB2513118 GB2513119 GB2513120 Figure 2 ) to which is connected a supply of sample gas (CO2). In this embodiment, the supply of CO2-free air for the sample flow is thesame supply 40 as used for dilution of the reference gases in the referencing system. - Samples are frequently only available in minute quantities. Thus, the sample inlet system must ensure that little or no sample is lost. The preferred sample inlet system ensures 100% sample transfer from the sample input port to the
laser spectrometer 16. A constant flow to the laser spectrometer is ensured by filling the differential volume between the sample flow and the flow to the laser spectrometer with a carrier or dilution gas, which in this case is CO2-free air (zero air). No sample is wasted and the concentration of CO2 in the gas flow to the laser spectrometer is kept constant and in the optimal range. - Having described a preferred arrangement for the supply of sample gas and reference gas or gases to the spectrometer at a controllable concentration, the method embodying the present invention will now be described with reference to the flow chart of
Figure 4 and to the plot of gas concentration against time inFigure 5 . - Referring to
Figure 4a , there is shown a flowchart of a process for measuring reference gas and sample gas isotope ratios and concentrations. A first referencegas measurement step 301 is optional. In this step, a reference gas concentration is selected arbitrarily. For example, it may be selected on the basis of an anticipated sample concentration for the sample to be measured in a subsequent step. The concentration of the reference gas at the selected initial concentration is measured, preferably by taking a spectroscopy measurement of the reference gas nominally supplied at the selected concentration. - Then, a correction factor is calculated based upon a ratio of the selected (nominal) reference gas concentration to the concentration of the reference gas that has just been measured. This correction factor can be used subsequently. This initial reference
gas measurement step 201 can be considered a 0th time period, because it precedes a first measurement of the sample. - In a first
sample measurement step 210, at least one sample isotope ratio is measured over a measurement time period using the spectrometer. Typically, multiple isotope ratios are measured for the sample. As explained above, the sample concentration can vary over this time period. The firstsample measurement step 210 marks the start of an nth cycle, with n = 1, 2, ..., N. - In a second
sample measurement step 220, a concentration of the sample is measured. Although the firstsample measurement step 210 and secondsample measurement step 220 are shown as concurrent steps, they normally take place in parallel and the duration of these two steps can be represented as an nth measurement time period. As will be discussed below, the sample concentration measurement can take place simultaneously with the isotope ratio measurement. Alternatively, the sample concentration measurement may take place during a part of the time period during which the sample isotope ratio is being measured, particularly a latter part of that time period. - Subsequently, a reference gas concentration selection step 330 is performed. A new reference gas concentration is selected based on the measured sample concentration. Moreover, the reference gas concentration that is selected can be based on the calibration factor that was determined in initial reference
gas measurement step 201. An example of this will be shown below. - In reference gas isotope
ratio measurement step 240, the spectrometer is used to measure the isotope ratio of the reference gas at the selected concentration. This take place during a nth reference time period, n = 1, 2, ..., N. This isotope ratio measurement can be used to identify a calibration factor for the sample isotope ratio measurement at that concentration. Incalibration step 250, the at least one isotope ratio of the sample is calibrated using the measured isotope ratio of the reference gas at the corresponding selected reference gas concentration. - Preferably,
decision step 260 takes place next. If there is a further sample to be analysed,route 261 is taken and the process returns to the first sample isotope ratio measurement and continues on from there, with n = n + 1. However, during the repeated process, the correction factor used in the selection of the reference gas concentration (in reference gas concentration selection step 230) may be taken from the measurement of the reference gas in reference gas measurement step 250 (that is, during the (n-1)th reference time period. Optionally, the concentration of the reference gas is also measured during this step and a new correction factor is determined. - However, if
decision step 260 determines that no further samples are to be analysed (that is n = N), the process proceeds alongroute 262 terminating step 370, where the process ends. - Referring next to
Figure 4b , there is shown a flowchart of an optional part of the process shown inFigure 4a , for calibrating sample gas isotope ratios. This is an optional technique for carrying out thecalibration step 250, in cases where multiple isotope ratio measurements are taken in firstsample measurement step 210. - In sample
concentration identification step 251, a sample concentration is identified for the first isotope ratio measurement of the sample taken in firstsample measurement step 210. Next, an isotope ratio of the reference gas is determined for the identified sample concentration instep 251. This takes place in isotoperatio determination step 252. Then, the sample isotope ratio measurement is calibrated using the determined reference gas isotope ratio fromdetermination step 252. This takes place incalibration step 253. - In
measurement decision step 254, the decision is made as to whether this is the final isotope ratio measurement for the sample that was taken infirst measurement step 210. If not,route 255 is taken and the process returns to sampleconcentration identification step 251.Steps sample measurement step 210. If all of the sample isotope ratio measurements have been processed,decision step 254 proceeds to terminatingstep 256 and the process returns todecision step 260 shown onFigure 4a . - The process shown in
Figure 4b may be especially useful where an interpolation can be carried out in order to determine the reference gas isotope ratio for a concentration of the reference gas that was not measured. This will be explained below, with reference to a "bracketing" approach. - Referring next to
Figure 5 , there is shown a plot of an example gas concentration for each of a reference gas and a sample gas against time, showing when respective isotope ratios are measured. The variation of the sample concentration overtime 301 is shown as the main plot (illustrating a typical concentration trend during a measurement). This time period is divided into a series of time durations, during which the spectrometer is used for a different measurements, as will be discussed below. - In this mode, the sample (for example, ambient air). and reference (or working standard) gases are measured alternately. In an initial reference time period 310, the reference gas is measured at a default concentration 340 (which can be set by the user). A first
measurement time period 321 follows (typically a few minutes). During this firstmeasurement time period 321, the sample is measured to determine at least one isotope ratio. As can be seen, the sample concentration changes (here, increases) during the firstmeasurement time period 321. During aportion 331 of the firstmeasurement time period 321, the sample is measured to determine the concentration of the sample. This is typically an average concentration over theportion 331 and the length (or start and finish times) of theportion 331 is adjustable. Normally, theportion 331 is at the end of the firstmeasurement time period 321. - The reference gas is now measured during a first
reference time period 311 at the concentration measured during theportion 331 of the firstmeasurement time period 321. Thisreference gas concentration 341 is shown and an isotope ratio measurement for the reference gas is taken. - In the next step, second
measurement time period 322, the sample is measured again, with at least one isotope ratio measurement being made during this period and a concentration measurement being made during aportion 332 of the secondmeasurement time period 322. Subsequently, a second reference time period 312 takes place and an isotope ratio for the reference gas is measured at the concentration determined during theportion 332 of the secondmeasurement time period 322. Again, thereference gas concentration 342 is shown. - Although at least one isotope ratio measurement (and preferably multiple measurements) were made during the second
measurement time period 322, these are desirably calibrated against the reference gas isotope ratio measurements. This can be achieved by taking alinear interpolation 352 of the two neighbouring reference gasisotope ratio measurements measurement time period 322 is referenced against the isotope ratio determined from thelinear interpolation 352. At each data point, a quasi-reference is available at a matched concentration without any dilution of the sample. Thus, the sample concentration is not lost using this referencing technique and a more accurate calibration of the at least one sample isotope ratio measurement can be made. - This is repeated during a third measurement time period 323, with at least one isotope ratio measurement being made during this period and a concentration measurement being made during a
portion 333 of the third measurement time period 323. Then, a third reference time period 313 takes place and an isotope ratio for the reference gas is measured at the concentration determined during theportion 333 of the third measurement time period 323 (reference gas concentration 343 is shown once more). Again, alinear interpolation 353 between the secondreference gas concentration 342 and thirdreference gas concentration 343 is shown, which can be used for calibration of the data points measured during the third measurement time period 323. - Finally, a fourth
measurement time period 324 is shown, with at least one isotope ratio measurement being made during this period and a concentration measurement being made during aportion 334 of the fourthmeasurement time period 324. During a fourth reference time period 314, an isotope ratio for the reference gas is measured at the concentration determined during theportion 334 of the fourth measurement time period 324 (as shown by reference gas concentration 344). Anotherlinear interpolation 354 between the thirdreference gas concentration 343 and fourthreference gas concentration 344 is used for calibration of the data points measured during the fourthmeasurement time period 324. - For some applications (such as multiple input ports at different concentration levels), the linear interpolation technique may not be used. In this case, the concentration of the reference measured during each
reference time period 311, 312, 313, 314 matches the average of the sample concentration over the whole sample measurement time. In other words, theportion measurement time period - Calibration of the concentration measurements and internal calibrations are also carried out. The flow controller is calibrated once after connecting a working standard. To avoid multiple calibrations over a wide range the system self-calibrates during measurements.
- As discussed above, to match sample and working standard concentrations, the uncalibrated raw values for the concentration from the instrument are matched. Therefore a desirable requirement for the self-calibration is that the measured raw concentration of a working standard matches the set value for the same working standard. Each time a working standard is measured, a correction factor is updated on basis of the uncalibrated raw values of the sensor. For the next reference the factor with the latest update is applied. For instance (using the example illustrated above with reference to
Figure 5 ), the concentration of the reference gas is also measured during the initial reference time period 310 and this is compared with the concentration that was initially selected. A correction factor is determined based on the ratio of the selected (nominal) reference concentration to the measured reference concentration. Then, this correction factor is used subsequently in the selection of the first reference concentration to be used the firstreference time period 311. This will be illustrated with an example below. Matching intensities for the reference intensity to that measured for the sample may alternatively be effective. - This example shows a workflow with fictive sample concentration and the behavior of the reference concentration, when using the approach outline above. In the beginning, the example shows a bad match of set value for the working standard concentration with the measured concentration of the working standard. By the use of the self-learning calibration technique proposed above, the reference concentration value is cause to approach the final sample concentration value. As can be seen, the correction factor is iteratively improved by each sample and reference concentration measurement.
Index Label Port Concentration Measured Concentration C_corr 1 1 Reference Ref Port 1 380.0 392.0 0.969 2 Sample Sample B 480.0 3 Reference Ref Port 1 465.3 477.3 0.975 4 Sample Sample B 480.0 5 Reference Ref Port 1 467.9 479.9 0.975 6 Sample Sample B 485.0 7 Reference Ref Port 1 472.9 484.9 0.975 8 Sample Sample B 490.0 9 Reference Ref Port 1 477.9 489.9 0.976 10 Sample Sample B 495.0 11 Reference Ref Port 1 482.9 494.9 0.976 12 Sample Sample B 470.0 13 Reference Ref Port 1 458.6 470.6 0.975 14 Sample Sample B 471.0 15 Reference Ref Port 1 459.0 471.0 0.975 16 Sample Sample B 474.0 17 Reference Ref Port 1 461.9 473.9 0.975 - In
index 1, the first reference is measured at default concentration or a user estimate. The set value of the reference gas concentration is 380ppm and the measured value of this example is 392ppm. Therefore, a correction factor of 0.969 is calculated.Index 2 shows the first sample measurement with a measured concentration of 480ppm. In index 3, the set point of the concentration is set to the concentration of the last sample, by applying the correction factor 480ppm * 0.969 = 465.3ppm. The correction factor is updated on each reference measurement. To calculate the reference concentration the concentration from the last sample measurement is used together with the last correction factor. - A second example is now shown, in which more than one sample is measured. The reference gas concentration is reference to sample B. Again, the correction factor is iteratively adjusted based on the measurements taken.
Index Label Port Concentration Measured Concentration C_corr 1 1 Reference Ref Port 1 380.0 392.0 0.969 2 Sample In Sample A 512.0 3 Sample Out Sample B 480.0 4 Reference Ref Port 1 465.3 477.3 0.975 5 Sample In Sample A 512.0 6 Sample Out Sample B 480.0 7 Reference Ref Port 1 467.9 479.9 0.975 8 Sample In Sample A 512.0 9 Sample Out Sample B 485.0 10 Reference Ref Port 1 472.9 484.9 0.975 11 Sample In Sample A 512.0 12 Sample Out Sample B 490.0 13 Reference Ref Port 1 477.9 489.9 0.976 14 Sample In Sample A 512.0 15 Sample Out Sample B 495.0 16 Reference Ref Port 1 482.9 494.9 0.976 17 Sample In Sample A 512.0 18 Sample Out Sample B 470.0 19 Reference Ref Port 1 458.6 470.6 0.975 20 Sample In Sample A 512.0 21 Sample Out Sample B 471.0 22 Reference Ref Port 1 459.0 471.0 0.975 23 Sample In Sample A 512.0 24 Sample Out Sample B 474.0 25 Reference Ref Port 1 461.9 473.9 0.975 - Referring now to
Figure 6A , there is shown a plot of an example gas concentration for a sample gas against time. It can be seen that the sample gas concentration varies significantly. - Referring next to
Figure 6B , there is shown a plot of example isotope ratio deltas (δ13C) for a sample gas, showing: raw instrument values 610; first calibratedvalues 620, using the isotope ratio measurements taken for the reference gas with a concentration matched to that of the sample gas shown inFigure 6A ; and second calibratedvalues 630, using the isotope ratio measurements taken for the reference gas with a concentration matched to that of the sample gas shown inFigure 6A and linear interpolation, as discussed above. Isotope ratio values plotted at 620 and 630 are shown at the same scale asvalues 610, but they have been offset along the y axis so that they can be clearly distinguished from one another. It can be seen that the raw instrument values 610 vary in accordance with the sample gas concentration variation. Indeed, the standard deviation for these measurements is 0.48 per mil. However, both the first δ13C values calibrated withoutlinear interpolation 620 and the second δ13C values 630 calibrated with linear interpolation show significantly less variation than the raw instrument values. Moreover, the second δ13C values 630 calibrated with linear interpolation have a standard deviation of 0.07 per mil, which is significantly less variation than the first δ13C values 620 calibrated without linear interpolation, which have a standard deviation of 0.13 per mil and which show a small variation in time, matching that of the sample gas concentration. - Many variations on these techniques can be employed. In any embodiment, the
portion measurement time period - Whilst the invention has been described with the example of a CO2 analysis system (i.e. with CO2 as both sample and reference gas), it should be appreciated that any other gas that is susceptible to isotope ratio analysis by optical spectrometry could be employed. In those cases, the reference gas will not be CO2 but will the same gas as the particular sample gas being analysed.
- A list of some examples of analyte gases and some of their measurable isotope ratios is given below.
Gas Isotope ratio CO2, CO: 13C/12C 18O/16O 17O/16O CH4, other alkanes: 13C/12C 2H/1H N2O: α-15N/14N β-15N/14N 18O/16O 17O/16O NxOy: 15N/14N 18O/16O 17O/16O - The carrier gas may be selected from: air, nitrogen, helium or argon, or mixtures of any two or more of the foregoing.
Claims (16)
- A method of measuring an isotope ratio of a continuous sample in an isotope ratio optical spectrometer comprising:a) measuring (210) at least one sample isotope ratio over a measurement time period
 b) measuring (220) a sample concentration


 c) matching (330) a reference gas concentration
 d) measuring (240) an isotope ratio of the reference gas at the matched reference gas concentration
 e) calibrating (250) the at least one isotope ratio of the sample measured during the measurement time period


iteratively repeating steps (a) to (e) for n=n+1, n+2... so that, during a certain measurement time period

 f) determining a plurality of calibrated isotope ratios and a plurality of sample gas concentration measurements, each of the plurality of calibrated isotope ratios and the plurality of sample gas concentration measurements being for a different, respective time, wherein the step e) of calibrating comprises interpolation between two isotope ratio measurements of the reference gas.
 - The method of claim 1, wherein the step f) of determining the plurality of calibrated isotope ratios and the plurality of sample gas concentration measurements comprises associating the at least one calibrated isotope ratio and the measured sample concentration for each measurement time period


- The method of claim 2, wherein the duration of a measurement time period


- The method of any preceding claim, wherein the step d) of measuring (240) at least one sample isotope ratio over the measurement time period


wherein the step d) of measuring (240) the isotope ratio of the reference gas at the reference gas concentration


- The method of any preceding claim, further comprising, before step a):selecting (301) a preceding reference gas concentration

 wherein the step c) of matching (330) a reference gas concentration


- The method of claim 5, further comprising:measuring the concentration of the reference gas at the selected preceding reference gas concentration
 calculating a correction factor based upon a ratio of the selected preceding reference gas concentration
 wherein the step c) of matching (330) the reference gas concentration


- The method of claim 5 or claim 6, wherein the step of selecting (301) a preceding reference gas concentration

- The method of any preceding claim, wherein the step b) of measuring (220) the sample concentration


- The method of claim 8, wherein the at least part of the measurement time period


wherein the at least part of the measurement time period

- The method of any preceding claim, further comprising:measuring the isotope ratio of the reference gas at a preceding reference gas concentration


 wherein the step e) of calibrating (250) the at least one isotope ratio of the sample measured during the measurement time period


- The method of claim 10:wherein the step d) of measuring (240) at least one sample isotope ratio over the measurement time period

 wherein the step e) of calibrating (250) the at least one isotope ratio of the sample measured during the measurement time period
 identifying (251) a respective sample characteristic for the respective sample isotope ratio;determining (252) a respective isotope ratio of the reference gas for the identified respective sample characteristic; andcalibrating (253) the respective sample isotope ratio using the determined respective isotope ratio of the reference gas.
 - The method of claim 11, wherein the respective sample characteristic for the respective sample isotope ratio comprises a respective sample concentration for the respective sample isotope ratio; and
wherein the step of determining (252) a respective isotope ratio of the reference gas for the identified respective sample characteristic comprises interpolating between the measured isotope ratio of the reference gas at the preceding reference gas concentration

- The method of claim 11 or claim 12, wherein the respective sample characteristic for the respective sample isotope ratio comprises a respective sample measurement time for the respective sample isotope ratio; and
wherein the step of determining (252) a respective isotope ratio of the reference gas for the identified respective sample characteristic comprises interpolating between the measured isotope ratio of the reference gas at the preceding reference time period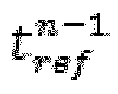

- The method of any preceding claim, wherein the continuous sample is derived from one or more of: ambient air; an open air source; a plant chamber; and a gas monitoring input.
- A controller for a continuous sample isotope ratio optical spectrometer, configured to control the isotope ratio optical spectrometer to operate in accordance with the method of preceding claims.
- An isotope ratio optical spectrometer configured to receive a continuous sample and comprising the controller of claim 15.
Applications Claiming Priority (2)
| Application Number | Priority Date | Filing Date | Title |
|---|---|---|---|
| GB1319875.9A GB2520086B (en) | 2013-11-11 | 2013-11-11 | Method of measuring isotope ratio |
| PCT/EP2014/074188 WO2015067806A1 (en) | 2013-11-11 | 2014-11-10 | Method of measuring isotope ratio |
Publications (2)
| Publication Number | Publication Date |
|---|---|
| EP3069370A1 EP3069370A1 (en) | 2016-09-21 |
| EP3069370B1 true EP3069370B1 (en) | 2021-06-23 |
Family
ID=49818438
Family Applications (1)
| Application Number | Title | Priority Date | Filing Date |
|---|---|---|---|
| EP14796101.5A Active EP3069370B1 (en) | 2013-11-11 | 2014-11-10 | Method of measuring isotope ratio |
Country Status (6)
| Country | Link |
|---|---|
| US (1) | US9874513B2 (en) |
| EP (1) | EP3069370B1 (en) |
| JP (1) | JP6297161B2 (en) |
| CN (1) | CN105659354B (en) |
| GB (1) | GB2520086B (en) |
| WO (1) | WO2015067806A1 (en) |
Families Citing this family (7)
| Publication number | Priority date | Publication date | Assignee | Title |
|---|---|---|---|---|
| WO2016154958A1 (en) * | 2015-04-01 | 2016-10-06 | 中国原子能科学研究院 | Accelerator mass spectrometry device for simultaneously measuring isotopes |
| US10330592B2 (en) * | 2017-07-21 | 2019-06-25 | Serguei Koulikov | Laser absorption spectroscopy isotopic gas analyzer |
| EP3608941B1 (en) * | 2018-08-07 | 2023-11-22 | Thermo Fisher Scientific (Bremen) GmbH | Isotope ratio measurement |
| FI130881B1 (en) * | 2020-03-03 | 2024-05-07 | Teknologian Tutkimuskeskus Vtt Oy | A method for preparing a gaseous isotope working standard, a method for determining an isotope ratio in a sample, and use of graphite for preparing a gaseous carbon and/or oxygen isotope working standard |
| CN112198263A (en) * | 2020-11-09 | 2021-01-08 | 北京普瑞亿科科技有限公司 | Quick monomer isotope analytic system |
| CN113339703B (en) * | 2021-07-07 | 2022-03-08 | 中国科学院地质与地球物理研究所 | Gas supply adjusting device, He gas isotope analysis system and analysis method |
| CN118130598B (en) * | 2024-04-30 | 2024-07-30 | 云南商测质量检验技术服务有限公司 | Method and system for measuring sulfur dioxide in food |
Citations (2)
| Publication number | Priority date | Publication date | Assignee | Title |
|---|---|---|---|---|
| US20090159795A1 (en) * | 2006-03-31 | 2009-06-25 | Hatscher Deike | Device for the analysis of isotope ratios |
| WO2014170179A1 (en) * | 2013-04-15 | 2014-10-23 | Thermo Fisher Scientific (Bremen) Gmbh | Gas inlet system for isotope ratio analyser and method of determining an isotope ratio |
Family Cites Families (11)
| Publication number | Priority date | Publication date | Assignee | Title |
|---|---|---|---|---|
| US4866270A (en) * | 1987-09-02 | 1989-09-12 | Vg Instruments Group Limited | Method and apparatus for the determination of isotopic composition |
| DE3932838C2 (en) * | 1989-09-30 | 1996-03-07 | Hartmann & Braun Ag | Non-dispersive infrared gas analyzer |
| JP2947737B2 (en) * | 1995-10-09 | 1999-09-13 | 大塚製薬株式会社 | Isotope gas spectrometry method and measurement device |
| CA2401553C (en) * | 1995-10-09 | 2006-07-11 | Otsuka Pharmaceutical Co., Ltd. | Method for spectrometrically measuring isotopic gas and apparatus thereof |
| DE19714903A1 (en) * | 1997-04-10 | 1998-10-29 | Hartmann & Braun Gmbh & Co Kg | Calibration process for non-dispersive infra-red spectrometers |
| US6656127B1 (en) * | 1999-06-08 | 2003-12-02 | Oridion Breathid Ltd. | Breath test apparatus and methods |
| EP1781464A1 (en) * | 2004-07-02 | 2007-05-09 | Dennis Coleman | Hydrocarbon preparation system |
| MX2011008148A (en) * | 2009-02-02 | 2012-01-25 | Planetary Emissions Man | SYSTEM SYSTEMS FOR MONITORING GREENHOUSE GAS FLOWS. |
| CN101936964B (en) * | 2010-07-29 | 2012-10-03 | 中国科学院兰州地质研究所 | GC-IRMS direct measurement method for hydrogen sulfide sulfur isotope in mixed gas |
| CN102175641B (en) * | 2010-12-10 | 2013-03-20 | 中国科学院安徽光学精密机械研究所 | Trace gas detection device and method based on intermediate infrared quantum cascade laser direct absorption spectrum method |
| GB2513120B (en) * | 2013-04-15 | 2015-09-09 | Thermo Fisher Scient Bremen | Method of determining an isotope ratio |
-
2013
- 2013-11-11 GB GB1319875.9A patent/GB2520086B/en active Active
-
2014
- 2014-11-10 JP JP2016552694A patent/JP6297161B2/en active Active
- 2014-11-10 EP EP14796101.5A patent/EP3069370B1/en active Active
- 2014-11-10 WO PCT/EP2014/074188 patent/WO2015067806A1/en not_active Ceased
- 2014-11-10 US US15/035,736 patent/US9874513B2/en active Active
- 2014-11-10 CN CN201480056911.4A patent/CN105659354B/en active Active
Patent Citations (2)
| Publication number | Priority date | Publication date | Assignee | Title |
|---|---|---|---|---|
| US20090159795A1 (en) * | 2006-03-31 | 2009-06-25 | Hatscher Deike | Device for the analysis of isotope ratios |
| WO2014170179A1 (en) * | 2013-04-15 | 2014-10-23 | Thermo Fisher Scientific (Bremen) Gmbh | Gas inlet system for isotope ratio analyser and method of determining an isotope ratio |
Also Published As
| Publication number | Publication date |
|---|---|
| US9874513B2 (en) | 2018-01-23 |
| GB2520086B (en) | 2020-02-19 |
| GB2520086A (en) | 2015-05-13 |
| CN105659354B (en) | 2017-10-10 |
| CN105659354A (en) | 2016-06-08 |
| US20160266031A1 (en) | 2016-09-15 |
| JP6297161B2 (en) | 2018-03-20 |
| WO2015067806A1 (en) | 2015-05-14 |
| GB201319875D0 (en) | 2013-12-25 |
| JP2016535859A (en) | 2016-11-17 |
| EP3069370A1 (en) | 2016-09-21 |
Similar Documents
| Publication | Publication Date | Title |
|---|---|---|
| US9874513B2 (en) | Method of measuring isotope ratio | |
| US10309941B2 (en) | Gas inlet system for isotope ratio analyzer and method of determining an isotope ratio | |
| áHňkan Wallmark | Novel calibration with correction for drift and non-linear response for continuous flow isotope ratio mass spectrometry applied to the determination of δ 15 N, total nitrogen, δ 13 C and total carbon in biological material | |
| US4259573A (en) | Method of determining small concentrations of chemical compounds by plasma chromatography | |
| US20240011956A1 (en) | System and Method for Background Removal in Spectrometry System | |
| US7390346B2 (en) | System and apparatus for producing primary standard gas mixtures | |
| Pascale et al. | Two generators to produce SI-traceable reference gas mixtures for reactive compounds at atmospheric levels | |
| US20130041611A1 (en) | Method of and system for calibrating gas flow dilutors | |
| Queipo-Abad et al. | Measurement of compound-specific Hg isotopic composition in narrow transient signals by gas chromatography coupled to multicollector ICP-MS | |
| US20230108163A1 (en) | Isotope Ratio Measurement | |
| GB2513120A (en) | Method of determining an isotope ratio | |
| GB2513119A (en) | Gas inlet system for isotope ratio analyser | |
| CN210293526U (en) | On-line measuring device for gas partial pressure | |
| JP2014095573A (en) | Gas component concentration calculation method and device | |
| Brewer et al. | High-accuracy stable gas flow dilution using an internally calibrated network of critical flow orifices | |
| JP2006266774A (en) | Method and apparatus for analyzing mixed gas | |
| GB2513118A (en) | Gas inlet system for isotope ratio analyser | |
| WO2024247392A1 (en) | Sampling system and sampling method | |
| CN121805380A (en) | Method for improving stability of mass spectrum detector | |
| JP2015232470A (en) | Glow discharge optical emission spectrometry |
Legal Events
| Date | Code | Title | Description |
|---|---|---|---|
| PUAI | Public reference made under article 153(3) epc to a published international application that has entered the european phase |
Free format text: ORIGINAL CODE: 0009012 |
|
| 17P | Request for examination filed |
Effective date: 20160411 |
|
| AK | Designated contracting states |
Kind code of ref document: A1 Designated state(s): AL AT BE BG CH CY CZ DE DK EE ES FI FR GB GR HR HU IE IS IT LI LT LU LV MC MK MT NL NO PL PT RO RS SE SI SK SM TR |
|
| AX | Request for extension of the european patent |
Extension state: BA ME |
|
| DAX | Request for extension of the european patent (deleted) | ||
| STAA | Information on the status of an ep patent application or granted ep patent |
Free format text: STATUS: EXAMINATION IS IN PROGRESS |
|
| 17Q | First examination report despatched |
Effective date: 20191125 |
|
| GRAP | Despatch of communication of intention to grant a patent |
Free format text: ORIGINAL CODE: EPIDOSNIGR1 |
|
| STAA | Information on the status of an ep patent application or granted ep patent |
Free format text: STATUS: GRANT OF PATENT IS INTENDED |
|
| RIC1 | Information provided on ipc code assigned before grant |
Ipc: G01N 33/00 20060101ALI20201211BHEP Ipc: G01N 21/3504 20140101ALN20201211BHEP Ipc: H01J 49/00 20060101AFI20201211BHEP Ipc: G01N 21/27 20060101ALI20201211BHEP |
|
| INTG | Intention to grant announced |
Effective date: 20210120 |
|
| GRAS | Grant fee paid |
Free format text: ORIGINAL CODE: EPIDOSNIGR3 |
|
| GRAA | (expected) grant |
Free format text: ORIGINAL CODE: 0009210 |
|
| STAA | Information on the status of an ep patent application or granted ep patent |
Free format text: STATUS: THE PATENT HAS BEEN GRANTED |
|
| RBV | Designated contracting states (corrected) |
Designated state(s): AL AT BE BG CH CY CZ DE DK EE ES FI FR GR HR HU IE IS IT LI LT LU LV MC MK MT NL NO PL PT RO RS SE SI SK SM TR |
|
| AK | Designated contracting states |
Kind code of ref document: B1 Designated state(s): AL AT BE BG CH CY CZ DE DK EE ES FI FR GR HR HU IE IS IT LI LT LU LV MC MK MT NL NO PL PT RO RS SE SI SK SM TR |
|
| REG | Reference to a national code |
Ref country code: CH Ref legal event code: EP |
|
| REG | Reference to a national code |
Ref country code: DE Ref legal event code: R096 Ref document number: 602014078313 Country of ref document: DE Ref country code: AT Ref legal event code: REF Ref document number: 1405030 Country of ref document: AT Kind code of ref document: T Effective date: 20210715 |
|
| REG | Reference to a national code |
Ref country code: IE Ref legal event code: FG4D |
|
| REG | Reference to a national code |
Ref country code: LT Ref legal event code: MG9D |
|
| PG25 | Lapsed in a contracting state [announced via postgrant information from national office to epo] |
Ref country code: LT Free format text: LAPSE BECAUSE OF FAILURE TO SUBMIT A TRANSLATION OF THE DESCRIPTION OR TO PAY THE FEE WITHIN THE PRESCRIBED TIME-LIMIT Effective date: 20210623 Ref country code: FI Free format text: LAPSE BECAUSE OF FAILURE TO SUBMIT A TRANSLATION OF THE DESCRIPTION OR TO PAY THE FEE WITHIN THE PRESCRIBED TIME-LIMIT Effective date: 20210623 Ref country code: BG Free format text: LAPSE BECAUSE OF FAILURE TO SUBMIT A TRANSLATION OF THE DESCRIPTION OR TO PAY THE FEE WITHIN THE PRESCRIBED TIME-LIMIT Effective date: 20210923 Ref country code: HR Free format text: LAPSE BECAUSE OF FAILURE TO SUBMIT A TRANSLATION OF THE DESCRIPTION OR TO PAY THE FEE WITHIN THE PRESCRIBED TIME-LIMIT Effective date: 20210623 |
|
| REG | Reference to a national code |
Ref country code: AT Ref legal event code: MK05 Ref document number: 1405030 Country of ref document: AT Kind code of ref document: T Effective date: 20210623 |
|
| PG25 | Lapsed in a contracting state [announced via postgrant information from national office to epo] |
Ref country code: SE Free format text: LAPSE BECAUSE OF FAILURE TO SUBMIT A TRANSLATION OF THE DESCRIPTION OR TO PAY THE FEE WITHIN THE PRESCRIBED TIME-LIMIT Effective date: 20210623 Ref country code: RS Free format text: LAPSE BECAUSE OF FAILURE TO SUBMIT A TRANSLATION OF THE DESCRIPTION OR TO PAY THE FEE WITHIN THE PRESCRIBED TIME-LIMIT Effective date: 20210623 Ref country code: NO Free format text: LAPSE BECAUSE OF FAILURE TO SUBMIT A TRANSLATION OF THE DESCRIPTION OR TO PAY THE FEE WITHIN THE PRESCRIBED TIME-LIMIT Effective date: 20210923 Ref country code: GR Free format text: LAPSE BECAUSE OF FAILURE TO SUBMIT A TRANSLATION OF THE DESCRIPTION OR TO PAY THE FEE WITHIN THE PRESCRIBED TIME-LIMIT Effective date: 20210924 Ref country code: LV Free format text: LAPSE BECAUSE OF FAILURE TO SUBMIT A TRANSLATION OF THE DESCRIPTION OR TO PAY THE FEE WITHIN THE PRESCRIBED TIME-LIMIT Effective date: 20210623 |
|
| REG | Reference to a national code |
Ref country code: NL Ref legal event code: MP Effective date: 20210623 |
|
| PG25 | Lapsed in a contracting state [announced via postgrant information from national office to epo] |
Ref country code: ES Free format text: LAPSE BECAUSE OF FAILURE TO SUBMIT A TRANSLATION OF THE DESCRIPTION OR TO PAY THE FEE WITHIN THE PRESCRIBED TIME-LIMIT Effective date: 20210623 Ref country code: RO Free format text: LAPSE BECAUSE OF FAILURE TO SUBMIT A TRANSLATION OF THE DESCRIPTION OR TO PAY THE FEE WITHIN THE PRESCRIBED TIME-LIMIT Effective date: 20210623 Ref country code: PT Free format text: LAPSE BECAUSE OF FAILURE TO SUBMIT A TRANSLATION OF THE DESCRIPTION OR TO PAY THE FEE WITHIN THE PRESCRIBED TIME-LIMIT Effective date: 20211025 Ref country code: NL Free format text: LAPSE BECAUSE OF FAILURE TO SUBMIT A TRANSLATION OF THE DESCRIPTION OR TO PAY THE FEE WITHIN THE PRESCRIBED TIME-LIMIT Effective date: 20210623 Ref country code: AT Free format text: LAPSE BECAUSE OF FAILURE TO SUBMIT A TRANSLATION OF THE DESCRIPTION OR TO PAY THE FEE WITHIN THE PRESCRIBED TIME-LIMIT Effective date: 20210623 Ref country code: SK Free format text: LAPSE BECAUSE OF FAILURE TO SUBMIT A TRANSLATION OF THE DESCRIPTION OR TO PAY THE FEE WITHIN THE PRESCRIBED TIME-LIMIT Effective date: 20210623 Ref country code: SM Free format text: LAPSE BECAUSE OF FAILURE TO SUBMIT A TRANSLATION OF THE DESCRIPTION OR TO PAY THE FEE WITHIN THE PRESCRIBED TIME-LIMIT Effective date: 20210623 Ref country code: EE Free format text: LAPSE BECAUSE OF FAILURE TO SUBMIT A TRANSLATION OF THE DESCRIPTION OR TO PAY THE FEE WITHIN THE PRESCRIBED TIME-LIMIT Effective date: 20210623 Ref country code: CZ Free format text: LAPSE BECAUSE OF FAILURE TO SUBMIT A TRANSLATION OF THE DESCRIPTION OR TO PAY THE FEE WITHIN THE PRESCRIBED TIME-LIMIT Effective date: 20210623 |
|
| PG25 | Lapsed in a contracting state [announced via postgrant information from national office to epo] |
Ref country code: PL Free format text: LAPSE BECAUSE OF FAILURE TO SUBMIT A TRANSLATION OF THE DESCRIPTION OR TO PAY THE FEE WITHIN THE PRESCRIBED TIME-LIMIT Effective date: 20210623 |
|
| REG | Reference to a national code |
Ref country code: DE Ref legal event code: R097 Ref document number: 602014078313 Country of ref document: DE |
|
| PG25 | Lapsed in a contracting state [announced via postgrant information from national office to epo] |
Ref country code: DK Free format text: LAPSE BECAUSE OF FAILURE TO SUBMIT A TRANSLATION OF THE DESCRIPTION OR TO PAY THE FEE WITHIN THE PRESCRIBED TIME-LIMIT Effective date: 20210623 |
|
| PLBE | No opposition filed within time limit |
Free format text: ORIGINAL CODE: 0009261 |
|
| STAA | Information on the status of an ep patent application or granted ep patent |
Free format text: STATUS: NO OPPOSITION FILED WITHIN TIME LIMIT |
|
| 26N | No opposition filed |
Effective date: 20220324 |
|
| PG25 | Lapsed in a contracting state [announced via postgrant information from national office to epo] |
Ref country code: AL Free format text: LAPSE BECAUSE OF FAILURE TO SUBMIT A TRANSLATION OF THE DESCRIPTION OR TO PAY THE FEE WITHIN THE PRESCRIBED TIME-LIMIT Effective date: 20210623 |
|
| PG25 | Lapsed in a contracting state [announced via postgrant information from national office to epo] |
Ref country code: MC Free format text: LAPSE BECAUSE OF FAILURE TO SUBMIT A TRANSLATION OF THE DESCRIPTION OR TO PAY THE FEE WITHIN THE PRESCRIBED TIME-LIMIT Effective date: 20210623 |
|
| REG | Reference to a national code |
Ref country code: CH Ref legal event code: PL |
|
| PG25 | Lapsed in a contracting state [announced via postgrant information from national office to epo] |
Ref country code: LU Free format text: LAPSE BECAUSE OF NON-PAYMENT OF DUE FEES Effective date: 20211110 Ref country code: IT Free format text: LAPSE BECAUSE OF FAILURE TO SUBMIT A TRANSLATION OF THE DESCRIPTION OR TO PAY THE FEE WITHIN THE PRESCRIBED TIME-LIMIT Effective date: 20210623 Ref country code: BE Free format text: LAPSE BECAUSE OF NON-PAYMENT OF DUE FEES Effective date: 20211130 |
|
| REG | Reference to a national code |
Ref country code: BE Ref legal event code: MM Effective date: 20211130 |
|
| PG25 | Lapsed in a contracting state [announced via postgrant information from national office to epo] |
Ref country code: LI Free format text: LAPSE BECAUSE OF NON-PAYMENT OF DUE FEES Effective date: 20211130 Ref country code: CH Free format text: LAPSE BECAUSE OF NON-PAYMENT OF DUE FEES Effective date: 20211130 |
|
| PG25 | Lapsed in a contracting state [announced via postgrant information from national office to epo] |
Ref country code: IE Free format text: LAPSE BECAUSE OF NON-PAYMENT OF DUE FEES Effective date: 20211110 |
|
| PG25 | Lapsed in a contracting state [announced via postgrant information from national office to epo] |
Ref country code: FR Free format text: LAPSE BECAUSE OF NON-PAYMENT OF DUE FEES Effective date: 20211130 |
|
| PG25 | Lapsed in a contracting state [announced via postgrant information from national office to epo] |
Ref country code: HU Free format text: LAPSE BECAUSE OF FAILURE TO SUBMIT A TRANSLATION OF THE DESCRIPTION OR TO PAY THE FEE WITHIN THE PRESCRIBED TIME-LIMIT; INVALID AB INITIO Effective date: 20141110 |
|
| PG25 | Lapsed in a contracting state [announced via postgrant information from national office to epo] |
Ref country code: CY Free format text: LAPSE BECAUSE OF FAILURE TO SUBMIT A TRANSLATION OF THE DESCRIPTION OR TO PAY THE FEE WITHIN THE PRESCRIBED TIME-LIMIT Effective date: 20210623 |
|
| PG25 | Lapsed in a contracting state [announced via postgrant information from national office to epo] |
Ref country code: MK Free format text: LAPSE BECAUSE OF FAILURE TO SUBMIT A TRANSLATION OF THE DESCRIPTION OR TO PAY THE FEE WITHIN THE PRESCRIBED TIME-LIMIT Effective date: 20210623 |
|
| PG25 | Lapsed in a contracting state [announced via postgrant information from national office to epo] |
Ref country code: MT Free format text: LAPSE BECAUSE OF FAILURE TO SUBMIT A TRANSLATION OF THE DESCRIPTION OR TO PAY THE FEE WITHIN THE PRESCRIBED TIME-LIMIT Effective date: 20210623 |
|
| PG25 | Lapsed in a contracting state [announced via postgrant information from national office to epo] |
Ref country code: TR Free format text: LAPSE BECAUSE OF FAILURE TO SUBMIT A TRANSLATION OF THE DESCRIPTION OR TO PAY THE FEE WITHIN THE PRESCRIBED TIME-LIMIT Effective date: 20210623 |
|
| PGFP | Annual fee paid to national office [announced via postgrant information from national office to epo] |
Ref country code: DE Payment date: 20251010 Year of fee payment: 12 |