EP3027637B1 - The glycine conjugate of beta-muricholic acid as an inhibitor of the farnesoid x receptor for the treatment of obesity, insulin resistance or non-alcoholic fatty liver disease - Google Patents
The glycine conjugate of beta-muricholic acid as an inhibitor of the farnesoid x receptor for the treatment of obesity, insulin resistance or non-alcoholic fatty liver disease Download PDFInfo
- Publication number
- EP3027637B1 EP3027637B1 EP14752716.2A EP14752716A EP3027637B1 EP 3027637 B1 EP3027637 B1 EP 3027637B1 EP 14752716 A EP14752716 A EP 14752716A EP 3027637 B1 EP3027637 B1 EP 3027637B1
- Authority
- EP
- European Patent Office
- Prior art keywords
- mice
- fxr
- mca
- gly
- weeks
- Prior art date
- Legal status (The legal status is an assumption and is not a legal conclusion. Google has not performed a legal analysis and makes no representation as to the accuracy of the status listed.)
- Active
Links
- 208000008338 non-alcoholic fatty liver disease Diseases 0.000 title claims description 54
- 208000008589 Obesity Diseases 0.000 title claims description 50
- 235000020824 obesity Nutrition 0.000 title claims description 50
- 208000001072 type 2 diabetes mellitus Diseases 0.000 title claims description 28
- 206010022489 Insulin Resistance Diseases 0.000 title claims description 25
- 102100038495 Bile acid receptor Human genes 0.000 title description 94
- 101000603876 Homo sapiens Bile acid receptor Proteins 0.000 title description 94
- 238000011282 treatment Methods 0.000 title description 93
- DKPMWHFRUGMUKF-CRKPLTDNSA-N beta-muricholic acid Chemical compound C([C@H]1[C@H](O)[C@@H]2O)[C@H](O)CC[C@]1(C)[C@@H]1[C@@H]2[C@@H]2CC[C@H]([C@@H](CCC(O)=O)C)[C@@]2(C)CC1 DKPMWHFRUGMUKF-CRKPLTDNSA-N 0.000 title description 21
- DHMQDGOQFOQNFH-UHFFFAOYSA-N Glycine Chemical compound NCC(O)=O DHMQDGOQFOQNFH-UHFFFAOYSA-N 0.000 title description 16
- DKPMWHFRUGMUKF-UHFFFAOYSA-N (3alpha,5alpha,6alpha,7alpha)-3,6,7-Trihydroxycholan-24-oic acid Natural products OC1C(O)C2CC(O)CCC2(C)C2C1C1CCC(C(CCC(O)=O)C)C1(C)CC2 DKPMWHFRUGMUKF-UHFFFAOYSA-N 0.000 title description 12
- 239000004471 Glycine Substances 0.000 title description 8
- 239000003112 inhibitor Substances 0.000 title description 2
- 150000001875 compounds Chemical class 0.000 claims description 49
- 241000124008 Mammalia Species 0.000 claims description 32
- 208000037265 diseases, disorders, signs and symptoms Diseases 0.000 claims description 23
- 150000003839 salts Chemical class 0.000 claims description 22
- 201000010099 disease Diseases 0.000 claims description 12
- 208000035475 disorder Diseases 0.000 claims description 11
- 208000022309 Alcoholic Liver disease Diseases 0.000 claims 1
- 241000699670 Mus sp. Species 0.000 description 322
- 235000009200 high fat diet Nutrition 0.000 description 177
- 101150027485 NR1H4 gene Proteins 0.000 description 144
- 210000004185 liver Anatomy 0.000 description 110
- RZVAJINKPMORJF-UHFFFAOYSA-N Acetaminophen Chemical compound CC(=O)NC1=CC=C(O)C=C1 RZVAJINKPMORJF-UHFFFAOYSA-N 0.000 description 84
- 239000003981 vehicle Substances 0.000 description 67
- 210000003405 ileum Anatomy 0.000 description 62
- 230000003115 biocidal effect Effects 0.000 description 60
- 108020004999 messenger RNA Proteins 0.000 description 60
- 108090000623 proteins and genes Proteins 0.000 description 44
- 239000003613 bile acid Substances 0.000 description 41
- 210000004027 cell Anatomy 0.000 description 39
- 229940106189 ceramide Drugs 0.000 description 39
- 239000000203 mixture Substances 0.000 description 37
- 238000004458 analytical method Methods 0.000 description 35
- UFTFJSFQGQCHQW-UHFFFAOYSA-N triformin Chemical compound O=COCC(OC=O)COC=O UFTFJSFQGQCHQW-UHFFFAOYSA-N 0.000 description 35
- 230000000694 effects Effects 0.000 description 32
- 150000002500 ions Chemical class 0.000 description 30
- 210000002966 serum Anatomy 0.000 description 30
- 230000003247 decreasing effect Effects 0.000 description 29
- WEVYAHXRMPXWCK-UHFFFAOYSA-N Acetonitrile Chemical compound CC#N WEVYAHXRMPXWCK-UHFFFAOYSA-N 0.000 description 28
- WBWWGRHZICKQGZ-UHFFFAOYSA-N Taurocholic acid Natural products OC1CC2CC(O)CCC2(C)C2C1C1CCC(C(CCC(=O)NCCS(O)(=O)=O)C)C1(C)C(O)C2 WBWWGRHZICKQGZ-UHFFFAOYSA-N 0.000 description 27
- WBWWGRHZICKQGZ-GIHLXUJPSA-N taurocholic acid Chemical compound C([C@@H]1C[C@H]2O)[C@@H](O)CC[C@]1(C)[C@@H]1[C@@H]2[C@@H]2CC[C@@H]([C@@H](CCC(=O)NCCS(O)(=O)=O)C)[C@@]2(C)[C@H](O)C1 WBWWGRHZICKQGZ-GIHLXUJPSA-N 0.000 description 27
- XOAAWQZATWQOTB-UHFFFAOYSA-N taurine Chemical compound NCCS(O)(=O)=O XOAAWQZATWQOTB-UHFFFAOYSA-N 0.000 description 26
- YDNKGFDKKRUKPY-JHOUSYSJSA-N C16 ceramide Natural products CCCCCCCCCCCCCCCC(=O)N[C@@H](CO)[C@H](O)C=CCCCCCCCCCCCCC YDNKGFDKKRUKPY-JHOUSYSJSA-N 0.000 description 25
- OKKJLVBELUTLKV-UHFFFAOYSA-N Methanol Chemical class OC OKKJLVBELUTLKV-UHFFFAOYSA-N 0.000 description 25
- CRJGESKKUOMBCT-VQTJNVASSA-N N-acetylsphinganine Chemical compound CCCCCCCCCCCCCCC[C@@H](O)[C@H](CO)NC(C)=O CRJGESKKUOMBCT-VQTJNVASSA-N 0.000 description 25
- ZVEQCJWYRWKARO-UHFFFAOYSA-N ceramide Natural products CCCCCCCCCCCCCCC(O)C(=O)NC(CO)C(O)C=CCCC=C(C)CCCCCCCCC ZVEQCJWYRWKARO-UHFFFAOYSA-N 0.000 description 25
- 150000002632 lipids Chemical class 0.000 description 25
- VVGIYYKRAMHVLU-UHFFFAOYSA-N newbouldiamide Natural products CCCCCCCCCCCCCCCCCCCC(O)C(O)C(O)C(CO)NC(=O)CCCCCCCCCCCCCCCCC VVGIYYKRAMHVLU-UHFFFAOYSA-N 0.000 description 25
- 101150004229 NR0B2 gene Proteins 0.000 description 24
- 101150096065 shp gene Proteins 0.000 description 24
- 210000003608 fece Anatomy 0.000 description 23
- HSINOMROUCMIEA-FGVHQWLLSA-N (2s,4r)-4-[(3r,5s,6r,7r,8s,9s,10s,13r,14s,17r)-6-ethyl-3,7-dihydroxy-10,13-dimethyl-2,3,4,5,6,7,8,9,11,12,14,15,16,17-tetradecahydro-1h-cyclopenta[a]phenanthren-17-yl]-2-methylpentanoic acid Chemical compound C([C@@]12C)C[C@@H](O)C[C@H]1[C@@H](CC)[C@@H](O)[C@@H]1[C@@H]2CC[C@]2(C)[C@@H]([C@H](C)C[C@H](C)C(O)=O)CC[C@H]21 HSINOMROUCMIEA-FGVHQWLLSA-N 0.000 description 22
- 238000000034 method Methods 0.000 description 22
- 230000037396 body weight Effects 0.000 description 20
- 230000000968 intestinal effect Effects 0.000 description 20
- 210000000936 intestine Anatomy 0.000 description 20
- XSOLDPYUICCHJX-UZUDEGBHSA-N tauro-beta-muricholic acid Chemical compound C([C@H]1[C@H](O)[C@@H]2O)[C@H](O)CC[C@]1(C)[C@@H]1[C@@H]2[C@@H]2CC[C@H]([C@@H](CCC(=O)NCCS(O)(=O)=O)C)[C@@]2(C)CC1 XSOLDPYUICCHJX-UZUDEGBHSA-N 0.000 description 19
- NOESYZHRGYRDHS-UHFFFAOYSA-N insulin Chemical compound N1C(=O)C(NC(=O)C(CCC(N)=O)NC(=O)C(CCC(O)=O)NC(=O)C(C(C)C)NC(=O)C(NC(=O)CN)C(C)CC)CSSCC(C(NC(CO)C(=O)NC(CC(C)C)C(=O)NC(CC=2C=CC(O)=CC=2)C(=O)NC(CCC(N)=O)C(=O)NC(CC(C)C)C(=O)NC(CCC(O)=O)C(=O)NC(CC(N)=O)C(=O)NC(CC=2C=CC(O)=CC=2)C(=O)NC(CSSCC(NC(=O)C(C(C)C)NC(=O)C(CC(C)C)NC(=O)C(CC=2C=CC(O)=CC=2)NC(=O)C(CC(C)C)NC(=O)C(C)NC(=O)C(CCC(O)=O)NC(=O)C(C(C)C)NC(=O)C(CC(C)C)NC(=O)C(CC=2NC=NC=2)NC(=O)C(CO)NC(=O)CNC2=O)C(=O)NCC(=O)NC(CCC(O)=O)C(=O)NC(CCCNC(N)=N)C(=O)NCC(=O)NC(CC=3C=CC=CC=3)C(=O)NC(CC=3C=CC=CC=3)C(=O)NC(CC=3C=CC(O)=CC=3)C(=O)NC(C(C)O)C(=O)N3C(CCC3)C(=O)NC(CCCCN)C(=O)NC(C)C(O)=O)C(=O)NC(CC(N)=O)C(O)=O)=O)NC(=O)C(C(C)CC)NC(=O)C(CO)NC(=O)C(C(C)O)NC(=O)C1CSSCC2NC(=O)C(CC(C)C)NC(=O)C(NC(=O)C(CCC(N)=O)NC(=O)C(CC(N)=O)NC(=O)C(NC(=O)C(N)CC=1C=CC=CC=1)C(C)C)CC1=CN=CN1 NOESYZHRGYRDHS-UHFFFAOYSA-N 0.000 description 18
- 244000005709 gut microbiome Species 0.000 description 17
- 210000003494 hepatocyte Anatomy 0.000 description 17
- 241000699666 Mus <mouse, genus> Species 0.000 description 16
- 229960001091 chenodeoxycholic acid Drugs 0.000 description 16
- 230000002440 hepatic effect Effects 0.000 description 16
- 230000005764 inhibitory process Effects 0.000 description 16
- 230000002829 reductive effect Effects 0.000 description 16
- XLYOFNOQVPJJNP-UHFFFAOYSA-N water Substances O XLYOFNOQVPJJNP-UHFFFAOYSA-N 0.000 description 16
- RUDATBOHQWOJDD-UHFFFAOYSA-N (3beta,5beta,7alpha)-3,7-Dihydroxycholan-24-oic acid Natural products OC1CC2CC(O)CCC2(C)C2C1C1CCC(C(CCC(O)=O)C)C1(C)CC2 RUDATBOHQWOJDD-UHFFFAOYSA-N 0.000 description 15
- 108010000231 Choloylglycine hydrolase Proteins 0.000 description 15
- RUDATBOHQWOJDD-BSWAIDMHSA-N chenodeoxycholic acid Chemical compound C([C@H]1C[C@H]2O)[C@H](O)CC[C@]1(C)[C@@H]1[C@@H]2[C@@H]2CC[C@H]([C@@H](CCC(O)=O)C)[C@@]2(C)CC1 RUDATBOHQWOJDD-BSWAIDMHSA-N 0.000 description 15
- 238000011068 loading method Methods 0.000 description 15
- LFQSCWFLJHTTHZ-UHFFFAOYSA-N Ethanol Chemical compound CCO LFQSCWFLJHTTHZ-UHFFFAOYSA-N 0.000 description 14
- 229910001868 water Inorganic materials 0.000 description 14
- 238000005481 NMR spectroscopy Methods 0.000 description 13
- 150000001783 ceramides Chemical class 0.000 description 13
- 230000002550 fecal effect Effects 0.000 description 13
- 239000002502 liposome Substances 0.000 description 13
- 229960003080 taurine Drugs 0.000 description 13
- WQZGKKKJIJFFOK-GASJEMHNSA-N Glucose Natural products OC[C@H]1OC(O)[C@H](O)[C@@H](O)[C@@H]1O WQZGKKKJIJFFOK-GASJEMHNSA-N 0.000 description 12
- 239000008103 glucose Substances 0.000 description 12
- 210000004877 mucosa Anatomy 0.000 description 12
- 239000006187 pill Substances 0.000 description 12
- 102000004169 proteins and genes Human genes 0.000 description 12
- 235000019786 weight gain Nutrition 0.000 description 12
- 101100390675 Mus musculus Fgf15 gene Proteins 0.000 description 11
- 230000015572 biosynthetic process Effects 0.000 description 11
- 239000000284 extract Substances 0.000 description 11
- 235000018102 proteins Nutrition 0.000 description 11
- 230000011664 signaling Effects 0.000 description 11
- 210000002700 urine Anatomy 0.000 description 11
- 102100036475 Alanine aminotransferase 1 Human genes 0.000 description 10
- 108010082126 Alanine transaminase Proteins 0.000 description 10
- 108010003415 Aspartate Aminotransferases Proteins 0.000 description 10
- 102000004625 Aspartate Aminotransferases Human genes 0.000 description 10
- 238000011814 C57BL/6N mouse Methods 0.000 description 10
- HEDRZPFGACZZDS-UHFFFAOYSA-N Chloroform Chemical compound ClC(Cl)Cl HEDRZPFGACZZDS-UHFFFAOYSA-N 0.000 description 10
- 239000002253 acid Substances 0.000 description 10
- 235000014113 dietary fatty acids Nutrition 0.000 description 10
- 229930195729 fatty acid Natural products 0.000 description 10
- 239000000194 fatty acid Substances 0.000 description 10
- 150000004665 fatty acids Chemical class 0.000 description 10
- 238000007490 hematoxylin and eosin (H&E) staining Methods 0.000 description 10
- 230000004060 metabolic process Effects 0.000 description 10
- 238000002705 metabolomic analysis Methods 0.000 description 10
- 230000001431 metabolomic effect Effects 0.000 description 10
- WGNAKZGUSRVWRH-UHFFFAOYSA-N p-cresol sulfate Chemical compound CC1=CC=C(OS(O)(=O)=O)C=C1 WGNAKZGUSRVWRH-UHFFFAOYSA-N 0.000 description 10
- 238000003786 synthesis reaction Methods 0.000 description 10
- 210000001519 tissue Anatomy 0.000 description 10
- 238000001262 western blot Methods 0.000 description 10
- 102000004877 Insulin Human genes 0.000 description 9
- 108090001061 Insulin Proteins 0.000 description 9
- 239000005089 Luciferase Substances 0.000 description 9
- 241001465754 Metazoa Species 0.000 description 9
- BHTRKEVKTKCXOH-UHFFFAOYSA-N Taurochenodesoxycholsaeure Natural products OC1CC2CC(O)CCC2(C)C2C1C1CCC(C(CCC(=O)NCCS(O)(=O)=O)C)C1(C)CC2 BHTRKEVKTKCXOH-UHFFFAOYSA-N 0.000 description 9
- -1 TβMCA Chemical compound 0.000 description 9
- 239000003858 bile acid conjugate Substances 0.000 description 9
- 210000004369 blood Anatomy 0.000 description 9
- 239000008280 blood Substances 0.000 description 9
- 235000005911 diet Nutrition 0.000 description 9
- 229940121360 farnesoid X receptor (fxr) agonists Drugs 0.000 description 9
- 238000009472 formulation Methods 0.000 description 9
- 238000011534 incubation Methods 0.000 description 9
- 229940125396 insulin Drugs 0.000 description 9
- 239000002207 metabolite Substances 0.000 description 9
- 230000009467 reduction Effects 0.000 description 9
- 230000004584 weight gain Effects 0.000 description 9
- 239000005557 antagonist Substances 0.000 description 8
- 230000037213 diet Effects 0.000 description 8
- 230000006698 induction Effects 0.000 description 8
- 239000000243 solution Substances 0.000 description 8
- UCSJYZPVAKXKNQ-HZYVHMACSA-N streptomycin Chemical compound CN[C@H]1[C@H](O)[C@@H](O)[C@H](CO)O[C@H]1O[C@@H]1[C@](C=O)(O)[C@H](C)O[C@H]1O[C@@H]1[C@@H](NC(N)=N)[C@H](O)[C@@H](NC(N)=N)[C@H](O)[C@H]1O UCSJYZPVAKXKNQ-HZYVHMACSA-N 0.000 description 8
- 239000006228 supernatant Substances 0.000 description 8
- 102100032141 Cell death activator CIDE-A Human genes 0.000 description 7
- 102000004190 Enzymes Human genes 0.000 description 7
- 108090000790 Enzymes Proteins 0.000 description 7
- 101000775570 Homo sapiens Cell death activator CIDE-A Proteins 0.000 description 7
- 108060001084 Luciferase Proteins 0.000 description 7
- 230000004913 activation Effects 0.000 description 7
- 239000002585 base Substances 0.000 description 7
- 238000011161 development Methods 0.000 description 7
- 229940088598 enzyme Drugs 0.000 description 7
- 238000007446 glucose tolerance test Methods 0.000 description 7
- IPCSVZSSVZVIGE-UHFFFAOYSA-N hexadecanoic acid Chemical compound CCCCCCCCCCCCCCCC(O)=O IPCSVZSSVZVIGE-UHFFFAOYSA-N 0.000 description 7
- 238000012163 sequencing technique Methods 0.000 description 7
- 108091032973 (ribonucleotides)n+m Proteins 0.000 description 6
- 108090000331 Firefly luciferases Proteins 0.000 description 6
- KFZMGEQAYNKOFK-UHFFFAOYSA-N Isopropanol Chemical compound CC(C)O KFZMGEQAYNKOFK-UHFFFAOYSA-N 0.000 description 6
- NPGIHFRTRXVWOY-UHFFFAOYSA-N Oil red O Chemical compound Cc1ccc(C)c(c1)N=Nc1cc(C)c(cc1C)N=Nc1c(O)ccc2ccccc12 NPGIHFRTRXVWOY-UHFFFAOYSA-N 0.000 description 6
- 235000013361 beverage Nutrition 0.000 description 6
- 239000003795 chemical substances by application Substances 0.000 description 6
- HVYWMOMLDIMFJA-DPAQBDIFSA-N cholesterol Chemical compound C1C=C2C[C@@H](O)CC[C@]2(C)[C@@H]2[C@@H]1[C@@H]1CC[C@H]([C@H](C)CCCC(C)C)[C@@]1(C)CC2 HVYWMOMLDIMFJA-DPAQBDIFSA-N 0.000 description 6
- 230000007423 decrease Effects 0.000 description 6
- 239000003814 drug Substances 0.000 description 6
- 230000004136 fatty acid synthesis Effects 0.000 description 6
- VKOBVWXKNCXXDE-UHFFFAOYSA-N icosanoic acid Chemical compound CCCCCCCCCCCCCCCCCCCC(O)=O VKOBVWXKNCXXDE-UHFFFAOYSA-N 0.000 description 6
- 230000014759 maintenance of location Effects 0.000 description 6
- BDAGIHXWWSANSR-UHFFFAOYSA-N methanoic acid Natural products OC=O BDAGIHXWWSANSR-UHFFFAOYSA-N 0.000 description 6
- 238000007254 oxidation reaction Methods 0.000 description 6
- 238000011160 research Methods 0.000 description 6
- 230000029058 respiratory gaseous exchange Effects 0.000 description 6
- 239000000523 sample Substances 0.000 description 6
- 238000010186 staining Methods 0.000 description 6
- 238000012360 testing method Methods 0.000 description 6
- 239000003643 water by type Substances 0.000 description 6
- 108020004465 16S ribosomal RNA Proteins 0.000 description 5
- 102100038637 Cytochrome P450 7A1 Human genes 0.000 description 5
- 101710176143 Cytochrome P450 7A1 Proteins 0.000 description 5
- 241000192125 Firmicutes Species 0.000 description 5
- 206010019708 Hepatic steatosis Diseases 0.000 description 5
- 241000282412 Homo Species 0.000 description 5
- 101001062849 Homo sapiens Gastrotropin Proteins 0.000 description 5
- 241000186660 Lactobacillus Species 0.000 description 5
- 238000011529 RT qPCR Methods 0.000 description 5
- 229930006000 Sucrose Natural products 0.000 description 5
- CZMRCDWAGMRECN-UGDNZRGBSA-N Sucrose Chemical compound O[C@H]1[C@H](O)[C@@H](CO)O[C@@]1(CO)O[C@@H]1[C@H](O)[C@@H](O)[C@H](O)[C@@H](CO)O1 CZMRCDWAGMRECN-UGDNZRGBSA-N 0.000 description 5
- 230000015556 catabolic process Effects 0.000 description 5
- 230000008859 change Effects 0.000 description 5
- UKMSUNONTOPOIO-UHFFFAOYSA-N docosanoic acid Chemical compound CCCCCCCCCCCCCCCCCCCCCC(O)=O UKMSUNONTOPOIO-UHFFFAOYSA-N 0.000 description 5
- 231100000673 dose–response relationship Toxicity 0.000 description 5
- 235000012631 food intake Nutrition 0.000 description 5
- 230000037406 food intake Effects 0.000 description 5
- 238000013224 high-fat diet-induced obese mouse Methods 0.000 description 5
- 229940039696 lactobacillus Drugs 0.000 description 5
- 239000003446 ligand Substances 0.000 description 5
- 125000003729 nucleotide group Chemical group 0.000 description 5
- QIQXTHQIDYTFRH-UHFFFAOYSA-N octadecanoic acid Chemical compound CCCCCCCCCCCCCCCCCC(O)=O QIQXTHQIDYTFRH-UHFFFAOYSA-N 0.000 description 5
- 230000003647 oxidation Effects 0.000 description 5
- JPAUCQAJHLSMQW-XPORZQOISA-N p-tolyl beta-D-glucuronide Chemical compound C1=CC(C)=CC=C1O[C@H]1[C@H](O)[C@@H](O)[C@H](O)[C@@H](C(O)=O)O1 JPAUCQAJHLSMQW-XPORZQOISA-N 0.000 description 5
- 239000013612 plasmid Substances 0.000 description 5
- 230000004044 response Effects 0.000 description 5
- 150000004666 short chain fatty acids Chemical class 0.000 description 5
- 235000021391 short chain fatty acids Nutrition 0.000 description 5
- 210000000813 small intestine Anatomy 0.000 description 5
- 230000003595 spectral effect Effects 0.000 description 5
- 239000000126 substance Substances 0.000 description 5
- 239000005720 sucrose Substances 0.000 description 5
- BHTRKEVKTKCXOH-LBSADWJPSA-N tauroursodeoxycholic acid Chemical compound C([C@H]1C[C@@H]2O)[C@H](O)CC[C@]1(C)[C@@H]1[C@@H]2[C@@H]2CC[C@H]([C@@H](CCC(=O)NCCS(O)(=O)=O)C)[C@@]2(C)CC1 BHTRKEVKTKCXOH-LBSADWJPSA-N 0.000 description 5
- 238000004704 ultra performance liquid chromatography Methods 0.000 description 5
- 108010001478 Bacitracin Proteins 0.000 description 4
- 241000894006 Bacteria Species 0.000 description 4
- 241000605059 Bacteroidetes Species 0.000 description 4
- 101150075266 CYP7A1 gene Proteins 0.000 description 4
- 108020004414 DNA Proteins 0.000 description 4
- 102100039556 Galectin-4 Human genes 0.000 description 4
- 102100030426 Gastrotropin Human genes 0.000 description 4
- 101000608765 Homo sapiens Galectin-4 Proteins 0.000 description 4
- 206010061218 Inflammation Diseases 0.000 description 4
- 229930193140 Neomycin Natural products 0.000 description 4
- 108091027981 Response element Proteins 0.000 description 4
- FAPWRFPIFSIZLT-UHFFFAOYSA-M Sodium chloride Chemical compound [Na+].[Cl-] FAPWRFPIFSIZLT-UHFFFAOYSA-M 0.000 description 4
- 102000003929 Transaminases Human genes 0.000 description 4
- 108090000340 Transaminases Proteins 0.000 description 4
- DRTQHJPVMGBUCF-XVFCMESISA-N Uridine Chemical compound O[C@@H]1[C@H](O)[C@@H](CO)O[C@H]1N1C(=O)NC(=O)C=C1 DRTQHJPVMGBUCF-XVFCMESISA-N 0.000 description 4
- 239000004480 active ingredient Substances 0.000 description 4
- 229940024606 amino acid Drugs 0.000 description 4
- 235000001014 amino acid Nutrition 0.000 description 4
- 150000001413 amino acids Chemical class 0.000 description 4
- 229960003071 bacitracin Drugs 0.000 description 4
- 229930184125 bacitracin Natural products 0.000 description 4
- CLKOFPXJLQSYAH-ABRJDSQDSA-N bacitracin A Chemical compound C1SC([C@@H](N)[C@@H](C)CC)=N[C@@H]1C(=O)N[C@@H](CC(C)C)C(=O)N[C@H](CCC(O)=O)C(=O)N[C@@H]([C@@H](C)CC)C(=O)N[C@@H]1C(=O)N[C@H](CCCN)C(=O)N[C@@H]([C@@H](C)CC)C(=O)N[C@H](CC=2C=CC=CC=2)C(=O)N[C@@H](CC=2N=CNC=2)C(=O)N[C@H](CC(O)=O)C(=O)N[C@@H](CC(N)=O)C(=O)NCCCC1 CLKOFPXJLQSYAH-ABRJDSQDSA-N 0.000 description 4
- 230000001580 bacterial effect Effects 0.000 description 4
- 239000000090 biomarker Substances 0.000 description 4
- 238000005119 centrifugation Methods 0.000 description 4
- 230000001186 cumulative effect Effects 0.000 description 4
- 238000001514 detection method Methods 0.000 description 4
- 150000002009 diols Chemical class 0.000 description 4
- 229940079593 drug Drugs 0.000 description 4
- 230000006870 function Effects 0.000 description 4
- 231100000304 hepatotoxicity Toxicity 0.000 description 4
- FDGQSTZJBFJUBT-UHFFFAOYSA-N hypoxanthine Chemical compound O=C1NC=NC2=C1NC=N2 FDGQSTZJBFJUBT-UHFFFAOYSA-N 0.000 description 4
- 230000004054 inflammatory process Effects 0.000 description 4
- 230000007056 liver toxicity Effects 0.000 description 4
- 230000001404 mediated effect Effects 0.000 description 4
- 230000002503 metabolic effect Effects 0.000 description 4
- 210000003470 mitochondria Anatomy 0.000 description 4
- 230000002438 mitochondrial effect Effects 0.000 description 4
- 229960004927 neomycin Drugs 0.000 description 4
- 102000006255 nuclear receptors Human genes 0.000 description 4
- 108020004017 nuclear receptors Proteins 0.000 description 4
- 239000002773 nucleotide Substances 0.000 description 4
- 238000013116 obese mouse model Methods 0.000 description 4
- 229920001542 oligosaccharide Polymers 0.000 description 4
- 150000002482 oligosaccharides Chemical class 0.000 description 4
- 238000010239 partial least squares discriminant analysis Methods 0.000 description 4
- 239000008194 pharmaceutical composition Substances 0.000 description 4
- 239000000546 pharmaceutical excipient Substances 0.000 description 4
- 239000002953 phosphate buffered saline Substances 0.000 description 4
- BWHMMNNQKKPAPP-UHFFFAOYSA-L potassium carbonate Chemical compound [K+].[K+].[O-]C([O-])=O BWHMMNNQKKPAPP-UHFFFAOYSA-L 0.000 description 4
- 230000002265 prevention Effects 0.000 description 4
- 239000000047 product Substances 0.000 description 4
- 238000000425 proton nuclear magnetic resonance spectrum Methods 0.000 description 4
- 230000001105 regulatory effect Effects 0.000 description 4
- 239000011780 sodium chloride Substances 0.000 description 4
- 239000012453 solvate Substances 0.000 description 4
- 239000002904 solvent Substances 0.000 description 4
- 241000894007 species Species 0.000 description 4
- 229960005322 streptomycin Drugs 0.000 description 4
- 239000000725 suspension Substances 0.000 description 4
- 238000004885 tandem mass spectrometry Methods 0.000 description 4
- BHTRKEVKTKCXOH-AYSJQVDDSA-N taurochenodeoxycholic acid Chemical compound C([C@H]1C[C@@H]2O)[C@H](O)CC[C@]1(C)C1C2C2CC[C@H]([C@@H](CCC(=O)NCCS(O)(=O)=O)C)[C@@]2(C)CC1 BHTRKEVKTKCXOH-AYSJQVDDSA-N 0.000 description 4
- QZZGJDVWLFXDLK-UHFFFAOYSA-N tetracosanoic acid Chemical compound CCCCCCCCCCCCCCCCCCCCCCCC(O)=O QZZGJDVWLFXDLK-UHFFFAOYSA-N 0.000 description 4
- 208000016261 weight loss Diseases 0.000 description 4
- 230000004580 weight loss Effects 0.000 description 4
- 238000005160 1H NMR spectroscopy Methods 0.000 description 3
- OSWFIVFLDKOXQC-UHFFFAOYSA-N 4-(3-methoxyphenyl)aniline Chemical compound COC1=CC=CC(C=2C=CC(N)=CC=2)=C1 OSWFIVFLDKOXQC-UHFFFAOYSA-N 0.000 description 3
- QTBSBXVTEAMEQO-UHFFFAOYSA-N Acetic acid Chemical compound CC(O)=O QTBSBXVTEAMEQO-UHFFFAOYSA-N 0.000 description 3
- 108091003079 Bovine Serum Albumin Proteins 0.000 description 3
- 239000006144 Dulbecco’s modified Eagle's medium Substances 0.000 description 3
- 101150088871 ELOVL6 gene Proteins 0.000 description 3
- XEKOWRVHYACXOJ-UHFFFAOYSA-N Ethyl acetate Chemical compound CCOC(C)=O XEKOWRVHYACXOJ-UHFFFAOYSA-N 0.000 description 3
- 206010016654 Fibrosis Diseases 0.000 description 3
- 108010010803 Gelatin Proteins 0.000 description 3
- 229920002527 Glycogen Polymers 0.000 description 3
- DGAQECJNVWCQMB-PUAWFVPOSA-M Ilexoside XXIX Chemical compound C[C@@H]1CC[C@@]2(CC[C@@]3(C(=CC[C@H]4[C@]3(CC[C@@H]5[C@@]4(CC[C@@H](C5(C)C)OS(=O)(=O)[O-])C)C)[C@@H]2[C@]1(C)O)C)C(=O)O[C@H]6[C@@H]([C@H]([C@@H]([C@H](O6)CO)O)O)O.[Na+] DGAQECJNVWCQMB-PUAWFVPOSA-M 0.000 description 3
- 240000007472 Leucaena leucocephala Species 0.000 description 3
- 235000010643 Leucaena leucocephala Nutrition 0.000 description 3
- 101100220687 Mus musculus Cidea gene Proteins 0.000 description 3
- VJSBNBBOSZJDKB-KPEYJIHVSA-N N-(15Z)-tetracosenoylsphingosine Chemical compound CCCCCCCCCCCCC\C=C\[C@@H](O)[C@H](CO)NC(=O)CCCCCCCCCCCCC\C=C/CCCCCCCC VJSBNBBOSZJDKB-KPEYJIHVSA-N 0.000 description 3
- 108020005497 Nuclear hormone receptor Proteins 0.000 description 3
- MUBZPKHOEPUJKR-UHFFFAOYSA-N Oxalic acid Chemical compound OC(=O)C(O)=O MUBZPKHOEPUJKR-UHFFFAOYSA-N 0.000 description 3
- KWYUFKZDYYNOTN-UHFFFAOYSA-M Potassium hydroxide Chemical compound [OH-].[K+] KWYUFKZDYYNOTN-UHFFFAOYSA-M 0.000 description 3
- 108010026552 Proteome Proteins 0.000 description 3
- HEMHJVSKTPXQMS-UHFFFAOYSA-M Sodium hydroxide Chemical compound [OH-].[Na+] HEMHJVSKTPXQMS-UHFFFAOYSA-M 0.000 description 3
- 230000035508 accumulation Effects 0.000 description 3
- 238000009825 accumulation Methods 0.000 description 3
- 230000002378 acidificating effect Effects 0.000 description 3
- 210000000577 adipose tissue Anatomy 0.000 description 3
- 239000000556 agonist Substances 0.000 description 3
- 239000003242 anti bacterial agent Substances 0.000 description 3
- 229940088710 antibiotic agent Drugs 0.000 description 3
- 238000013459 approach Methods 0.000 description 3
- 238000003556 assay Methods 0.000 description 3
- 230000008901 benefit Effects 0.000 description 3
- WQZGKKKJIJFFOK-VFUOTHLCSA-N beta-D-glucose Chemical compound OC[C@H]1O[C@@H](O)[C@H](O)[C@@H](O)[C@@H]1O WQZGKKKJIJFFOK-VFUOTHLCSA-N 0.000 description 3
- 230000000903 blocking effect Effects 0.000 description 3
- 235000019577 caloric intake Nutrition 0.000 description 3
- 210000004534 cecum Anatomy 0.000 description 3
- 238000006243 chemical reaction Methods 0.000 description 3
- 239000003153 chemical reaction reagent Substances 0.000 description 3
- 108700010039 chimeric receptor Proteins 0.000 description 3
- 235000012000 cholesterol Nutrition 0.000 description 3
- KRKNYBCHXYNGOX-UHFFFAOYSA-N citric acid Chemical compound OC(=O)CC(O)(C(O)=O)CC(O)=O KRKNYBCHXYNGOX-UHFFFAOYSA-N 0.000 description 3
- 230000000052 comparative effect Effects 0.000 description 3
- 239000002299 complementary DNA Substances 0.000 description 3
- 230000002950 deficient Effects 0.000 description 3
- 230000001419 dependent effect Effects 0.000 description 3
- 206010012601 diabetes mellitus Diseases 0.000 description 3
- 235000021045 dietary change Nutrition 0.000 description 3
- 239000003085 diluting agent Substances 0.000 description 3
- 239000002552 dosage form Substances 0.000 description 3
- 239000000839 emulsion Substances 0.000 description 3
- 238000005516 engineering process Methods 0.000 description 3
- 230000002255 enzymatic effect Effects 0.000 description 3
- 150000002148 esters Chemical class 0.000 description 3
- 239000013613 expression plasmid Substances 0.000 description 3
- 239000012091 fetal bovine serum Substances 0.000 description 3
- 238000001914 filtration Methods 0.000 description 3
- 235000019253 formic acid Nutrition 0.000 description 3
- 239000012634 fragment Substances 0.000 description 3
- 235000021588 free fatty acids Nutrition 0.000 description 3
- 210000001035 gastrointestinal tract Anatomy 0.000 description 3
- 239000008273 gelatin Substances 0.000 description 3
- 229920000159 gelatin Polymers 0.000 description 3
- 235000019322 gelatine Nutrition 0.000 description 3
- 235000011852 gelatine desserts Nutrition 0.000 description 3
- 229940096919 glycogen Drugs 0.000 description 3
- 230000007062 hydrolysis Effects 0.000 description 3
- 238000006460 hydrolysis reaction Methods 0.000 description 3
- 238000001727 in vivo Methods 0.000 description 3
- 239000007924 injection Substances 0.000 description 3
- 238000002347 injection Methods 0.000 description 3
- 150000002576 ketones Chemical class 0.000 description 3
- 230000037356 lipid metabolism Effects 0.000 description 3
- 239000007788 liquid Substances 0.000 description 3
- 235000004213 low-fat Nutrition 0.000 description 3
- 238000003670 luciferase enzyme activity assay Methods 0.000 description 3
- 239000011159 matrix material Substances 0.000 description 3
- 230000007246 mechanism Effects 0.000 description 3
- 108010003814 member 2 group B nuclear receptor subfamily 0 Proteins 0.000 description 3
- 238000000491 multivariate analysis Methods 0.000 description 3
- 206010053219 non-alcoholic steatohepatitis Diseases 0.000 description 3
- 230000037361 pathway Effects 0.000 description 3
- 239000008363 phosphate buffer Substances 0.000 description 3
- 230000001766 physiological effect Effects 0.000 description 3
- 238000000746 purification Methods 0.000 description 3
- 238000011002 quantification Methods 0.000 description 3
- 231100000272 reduced body weight Toxicity 0.000 description 3
- 239000011734 sodium Substances 0.000 description 3
- 229910052708 sodium Inorganic materials 0.000 description 3
- AJPJDKMHJJGVTQ-UHFFFAOYSA-M sodium dihydrogen phosphate Chemical compound [Na+].OP(O)([O-])=O AJPJDKMHJJGVTQ-UHFFFAOYSA-M 0.000 description 3
- 229910000162 sodium phosphate Inorganic materials 0.000 description 3
- 150000004670 unsaturated fatty acids Chemical class 0.000 description 3
- 235000021122 unsaturated fatty acids Nutrition 0.000 description 3
- QQVDJLLNRSOCEL-UHFFFAOYSA-N (2-aminoethyl)phosphonic acid Chemical compound [NH3+]CCP(O)([O-])=O QQVDJLLNRSOCEL-UHFFFAOYSA-N 0.000 description 2
- QLOKJRIVRGCVIM-UHFFFAOYSA-N 1-[(4-methylsulfanylphenyl)methyl]piperazine Chemical compound C1=CC(SC)=CC=C1CN1CCNCC1 QLOKJRIVRGCVIM-UHFFFAOYSA-N 0.000 description 2
- RQFCJASXJCIDSX-UHFFFAOYSA-N 14C-Guanosin-5'-monophosphat Natural products C1=2NC(N)=NC(=O)C=2N=CN1C1OC(COP(O)(O)=O)C(O)C1O RQFCJASXJCIDSX-UHFFFAOYSA-N 0.000 description 2
- YPMOAQISONSSNL-UHFFFAOYSA-N 8-hydroxyoctyl 2-methylprop-2-enoate Chemical compound CC(=C)C(=O)OCCCCCCCCO YPMOAQISONSSNL-UHFFFAOYSA-N 0.000 description 2
- 101150043282 Acaa1a gene Proteins 0.000 description 2
- 102100022900 Actin, cytoplasmic 1 Human genes 0.000 description 2
- 108010085238 Actins Proteins 0.000 description 2
- GUBGYTABKSRVRQ-XLOQQCSPSA-N Alpha-Lactose Chemical compound O[C@@H]1[C@@H](O)[C@@H](O)[C@@H](CO)O[C@H]1O[C@@H]1[C@@H](CO)O[C@H](O)[C@H](O)[C@H]1O GUBGYTABKSRVRQ-XLOQQCSPSA-N 0.000 description 2
- IJGRMHOSHXDMSA-UHFFFAOYSA-N Atomic nitrogen Chemical compound N#N IJGRMHOSHXDMSA-UHFFFAOYSA-N 0.000 description 2
- 102100028282 Bile salt export pump Human genes 0.000 description 2
- 241000283690 Bos taurus Species 0.000 description 2
- WKBOTKDWSSQWDR-UHFFFAOYSA-N Bromine atom Chemical compound [Br] WKBOTKDWSSQWDR-UHFFFAOYSA-N 0.000 description 2
- 241000282472 Canis lupus familiaris Species 0.000 description 2
- CURLTUGMZLYLDI-UHFFFAOYSA-N Carbon dioxide Chemical compound O=C=O CURLTUGMZLYLDI-UHFFFAOYSA-N 0.000 description 2
- BVKZGUZCCUSVTD-UHFFFAOYSA-L Carbonate Chemical compound [O-]C([O-])=O BVKZGUZCCUSVTD-UHFFFAOYSA-L 0.000 description 2
- 208000024172 Cardiovascular disease Diseases 0.000 description 2
- 229920002261 Corn starch Polymers 0.000 description 2
- FBPFZTCFMRRESA-KVTDHHQDSA-N D-Mannitol Chemical compound OC[C@@H](O)[C@@H](O)[C@H](O)[C@H](O)CO FBPFZTCFMRRESA-KVTDHHQDSA-N 0.000 description 2
- 101150027068 DEGS1 gene Proteins 0.000 description 2
- 230000004568 DNA-binding Effects 0.000 description 2
- RTZKZFJDLAIYFH-UHFFFAOYSA-N Diethyl ether Chemical compound CCOCC RTZKZFJDLAIYFH-UHFFFAOYSA-N 0.000 description 2
- 101150003888 FASN gene Proteins 0.000 description 2
- WSFSSNUMVMOOMR-UHFFFAOYSA-N Formaldehyde Chemical compound O=C WSFSSNUMVMOOMR-UHFFFAOYSA-N 0.000 description 2
- PEDCQBHIVMGVHV-UHFFFAOYSA-N Glycerine Chemical compound OCC(O)CO PEDCQBHIVMGVHV-UHFFFAOYSA-N 0.000 description 2
- 101001093899 Homo sapiens Retinoic acid receptor RXR-alpha Proteins 0.000 description 2
- VEXZGXHMUGYJMC-UHFFFAOYSA-N Hydrochloric acid Chemical compound Cl VEXZGXHMUGYJMC-UHFFFAOYSA-N 0.000 description 2
- CPELXLSAUQHCOX-UHFFFAOYSA-N Hydrogen bromide Chemical compound Br CPELXLSAUQHCOX-UHFFFAOYSA-N 0.000 description 2
- 206010020772 Hypertension Diseases 0.000 description 2
- UGQMRVRMYYASKQ-UHFFFAOYSA-N Hypoxanthine nucleoside Natural products OC1C(O)C(CO)OC1N1C(NC=NC2=O)=C2N=C1 UGQMRVRMYYASKQ-UHFFFAOYSA-N 0.000 description 2
- GRSZFWQUAKGDAV-KQYNXXCUSA-N IMP Chemical compound O[C@@H]1[C@H](O)[C@@H](COP(O)(O)=O)O[C@H]1N1C(NC=NC2=O)=C2N=C1 GRSZFWQUAKGDAV-KQYNXXCUSA-N 0.000 description 2
- GRSZFWQUAKGDAV-UHFFFAOYSA-N Inosinic acid Natural products OC1C(O)C(COP(O)(O)=O)OC1N1C(NC=NC2=O)=C2N=C1 GRSZFWQUAKGDAV-UHFFFAOYSA-N 0.000 description 2
- 102100034343 Integrase Human genes 0.000 description 2
- GUBGYTABKSRVRQ-QKKXKWKRSA-N Lactose Natural products OC[C@H]1O[C@@H](O[C@H]2[C@H](O)[C@@H](O)C(O)O[C@@H]2CO)[C@H](O)[C@@H](O)[C@H]1O GUBGYTABKSRVRQ-QKKXKWKRSA-N 0.000 description 2
- SMEROWZSTRWXGI-UHFFFAOYSA-N Lithocholsaeure Natural products C1CC2CC(O)CCC2(C)C2C1C1CCC(C(CCC(O)=O)C)C1(C)CC2 SMEROWZSTRWXGI-UHFFFAOYSA-N 0.000 description 2
- 239000007993 MOPS buffer Substances 0.000 description 2
- 229930195725 Mannitol Natural products 0.000 description 2
- 108010093662 Member 11 Subfamily B ATP Binding Cassette Transporter Proteins 0.000 description 2
- AFVFQIVMOAPDHO-UHFFFAOYSA-N Methanesulfonic acid Chemical compound CS(O)(=O)=O AFVFQIVMOAPDHO-UHFFFAOYSA-N 0.000 description 2
- 206010028980 Neoplasm Diseases 0.000 description 2
- 102100023172 Nuclear receptor subfamily 0 group B member 2 Human genes 0.000 description 2
- NBIIXXVUZAFLBC-UHFFFAOYSA-N Phosphoric acid Chemical compound OP(O)(O)=O NBIIXXVUZAFLBC-UHFFFAOYSA-N 0.000 description 2
- XBDQKXXYIPTUBI-UHFFFAOYSA-M Propionate Chemical compound CCC([O-])=O XBDQKXXYIPTUBI-UHFFFAOYSA-M 0.000 description 2
- 241000192142 Proteobacteria Species 0.000 description 2
- 108010092799 RNA-directed DNA polymerase Proteins 0.000 description 2
- 241000242739 Renilla Species 0.000 description 2
- 108010052090 Renilla Luciferases Proteins 0.000 description 2
- 108700008625 Reporter Genes Proteins 0.000 description 2
- 102100035178 Retinoic acid receptor RXR-alpha Human genes 0.000 description 2
- 101150094441 Smpd3 gene Proteins 0.000 description 2
- CDBYLPFSWZWCQE-UHFFFAOYSA-L Sodium Carbonate Chemical compound [Na+].[Na+].[O-]C([O-])=O CDBYLPFSWZWCQE-UHFFFAOYSA-L 0.000 description 2
- 108010074436 Sterol Regulatory Element Binding Protein 1 Proteins 0.000 description 2
- 102100026839 Sterol regulatory element-binding protein 1 Human genes 0.000 description 2
- QAOWNCQODCNURD-UHFFFAOYSA-N Sulfuric acid Chemical compound OS(O)(=O)=O QAOWNCQODCNURD-UHFFFAOYSA-N 0.000 description 2
- 108091023040 Transcription factor Proteins 0.000 description 2
- 102000040945 Transcription factor Human genes 0.000 description 2
- HEDRZPFGACZZDS-MICDWDOJSA-N Trichloro(2H)methane Chemical compound [2H]C(Cl)(Cl)Cl HEDRZPFGACZZDS-MICDWDOJSA-N 0.000 description 2
- HCHKCACWOHOZIP-UHFFFAOYSA-N Zinc Chemical compound [Zn] HCHKCACWOHOZIP-UHFFFAOYSA-N 0.000 description 2
- 238000010521 absorption reaction Methods 0.000 description 2
- 238000007171 acid catalysis Methods 0.000 description 2
- 230000002411 adverse Effects 0.000 description 2
- 150000001298 alcohols Chemical class 0.000 description 2
- 229910052784 alkaline earth metal Inorganic materials 0.000 description 2
- 150000001336 alkenes Chemical class 0.000 description 2
- 238000000540 analysis of variance Methods 0.000 description 2
- 239000003963 antioxidant agent Substances 0.000 description 2
- 230000003078 antioxidant effect Effects 0.000 description 2
- 235000006708 antioxidants Nutrition 0.000 description 2
- WPYMKLBDIGXBTP-UHFFFAOYSA-N benzoic acid Chemical compound OC(=O)C1=CC=CC=C1 WPYMKLBDIGXBTP-UHFFFAOYSA-N 0.000 description 2
- DRTQHJPVMGBUCF-PSQAKQOGSA-N beta-L-uridine Natural products O[C@H]1[C@@H](O)[C@H](CO)O[C@@H]1N1C(=O)NC(=O)C=C1 DRTQHJPVMGBUCF-PSQAKQOGSA-N 0.000 description 2
- 230000031709 bromination Effects 0.000 description 2
- 238000005893 bromination reaction Methods 0.000 description 2
- GDTBXPJZTBHREO-UHFFFAOYSA-N bromine Substances BrBr GDTBXPJZTBHREO-UHFFFAOYSA-N 0.000 description 2
- 229910052794 bromium Inorganic materials 0.000 description 2
- 239000000872 buffer Substances 0.000 description 2
- 201000011510 cancer Diseases 0.000 description 2
- 239000002775 capsule Substances 0.000 description 2
- 235000011089 carbon dioxide Nutrition 0.000 description 2
- MOIPGXQKZSZOQX-UHFFFAOYSA-N carbonyl bromide Chemical compound BrC(Br)=O MOIPGXQKZSZOQX-UHFFFAOYSA-N 0.000 description 2
- 125000003178 carboxy group Chemical group [H]OC(*)=O 0.000 description 2
- OEYIOHPDSNJKLS-UHFFFAOYSA-N choline Chemical compound C[N+](C)(C)CCO OEYIOHPDSNJKLS-UHFFFAOYSA-N 0.000 description 2
- 229960001231 choline Drugs 0.000 description 2
- 230000007882 cirrhosis Effects 0.000 description 2
- 208000019425 cirrhosis of liver Diseases 0.000 description 2
- 238000005833 cis-dihydroxylation reaction Methods 0.000 description 2
- 239000008120 corn starch Substances 0.000 description 2
- 208000029078 coronary artery disease Diseases 0.000 description 2
- 230000002596 correlated effect Effects 0.000 description 2
- 238000007405 data analysis Methods 0.000 description 2
- 239000008367 deionised water Substances 0.000 description 2
- 229910021641 deionized water Inorganic materials 0.000 description 2
- KXGVEGMKQFWNSR-LLQZFEROSA-N deoxycholic acid Chemical compound C([C@H]1CC2)[C@H](O)CC[C@]1(C)[C@@H]1[C@@H]2[C@@H]2CC[C@H]([C@@H](CCC(O)=O)C)[C@@]2(C)[C@@H](O)C1 KXGVEGMKQFWNSR-LLQZFEROSA-N 0.000 description 2
- 229960003964 deoxycholic acid Drugs 0.000 description 2
- KXGVEGMKQFWNSR-UHFFFAOYSA-N deoxycholic acid Natural products C1CC2CC(O)CCC2(C)C2C1C1CCC(C(CCC(O)=O)C)C1(C)C(O)C2 KXGVEGMKQFWNSR-UHFFFAOYSA-N 0.000 description 2
- ZPWVASYFFYYZEW-UHFFFAOYSA-L dipotassium hydrogen phosphate Chemical compound [K+].[K+].OP([O-])([O-])=O ZPWVASYFFYYZEW-UHFFFAOYSA-L 0.000 description 2
- 229910000396 dipotassium phosphate Inorganic materials 0.000 description 2
- 239000003651 drinking water Substances 0.000 description 2
- 235000020188 drinking water Nutrition 0.000 description 2
- 239000003937 drug carrier Substances 0.000 description 2
- 238000010864 dual luciferase reporter gene assay Methods 0.000 description 2
- 230000032050 esterification Effects 0.000 description 2
- 238000005886 esterification reaction Methods 0.000 description 2
- RIFGWPKJUGCATF-UHFFFAOYSA-N ethyl chloroformate Chemical compound CCOC(Cl)=O RIFGWPKJUGCATF-UHFFFAOYSA-N 0.000 description 2
- DEFVIWRASFVYLL-UHFFFAOYSA-N ethylene glycol bis(2-aminoethyl)tetraacetic acid Chemical compound OC(=O)CN(CC(O)=O)CCOCCOCCN(CC(O)=O)CC(O)=O DEFVIWRASFVYLL-UHFFFAOYSA-N 0.000 description 2
- 210000002950 fibroblast Anatomy 0.000 description 2
- 239000000796 flavoring agent Substances 0.000 description 2
- 235000013373 food additive Nutrition 0.000 description 2
- 239000002778 food additive Substances 0.000 description 2
- 238000013467 fragmentation Methods 0.000 description 2
- 238000006062 fragmentation reaction Methods 0.000 description 2
- 238000003304 gavage Methods 0.000 description 2
- 230000004153 glucose metabolism Effects 0.000 description 2
- 230000012010 growth Effects 0.000 description 2
- 230000036541 health Effects 0.000 description 2
- 210000002216 heart Anatomy 0.000 description 2
- 239000000833 heterodimer Substances 0.000 description 2
- 230000013632 homeostatic process Effects 0.000 description 2
- 235000003642 hunger Nutrition 0.000 description 2
- 125000002887 hydroxy group Chemical group [H]O* 0.000 description 2
- 230000002401 inhibitory effect Effects 0.000 description 2
- 238000002955 isolation Methods 0.000 description 2
- 210000003734 kidney Anatomy 0.000 description 2
- 239000008101 lactose Substances 0.000 description 2
- 102000005861 leptin receptors Human genes 0.000 description 2
- 108010019813 leptin receptors Proteins 0.000 description 2
- 108020001756 ligand binding domains Proteins 0.000 description 2
- 230000000670 limiting effect Effects 0.000 description 2
- 230000006372 lipid accumulation Effects 0.000 description 2
- 230000004132 lipogenesis Effects 0.000 description 2
- SMEROWZSTRWXGI-HVATVPOCSA-N lithocholic acid Chemical compound C([C@H]1CC2)[C@H](O)CC[C@]1(C)[C@@H]1[C@@H]2[C@@H]2CC[C@H]([C@@H](CCC(O)=O)C)[C@@]2(C)CC1 SMEROWZSTRWXGI-HVATVPOCSA-N 0.000 description 2
- 208000019423 liver disease Diseases 0.000 description 2
- 239000007937 lozenge Substances 0.000 description 2
- HQKMJHAJHXVSDF-UHFFFAOYSA-L magnesium stearate Chemical compound [Mg+2].CCCCCCCCCCCCCCCCCC([O-])=O.CCCCCCCCCCCCCCCCCC([O-])=O HQKMJHAJHXVSDF-UHFFFAOYSA-L 0.000 description 2
- 239000000594 mannitol Substances 0.000 description 2
- 235000010355 mannitol Nutrition 0.000 description 2
- 238000004949 mass spectrometry Methods 0.000 description 2
- 229910052751 metal Inorganic materials 0.000 description 2
- 239000002184 metal Substances 0.000 description 2
- 244000005700 microbiome Species 0.000 description 2
- 230000006705 mitochondrial oxidative phosphorylation Effects 0.000 description 2
- 238000002156 mixing Methods 0.000 description 2
- 238000010172 mouse model Methods 0.000 description 2
- JRZJOMJEPLMPRA-UHFFFAOYSA-N olefin Natural products CCCCCCCC=C JRZJOMJEPLMPRA-UHFFFAOYSA-N 0.000 description 2
- 238000003305 oral gavage Methods 0.000 description 2
- 239000012074 organic phase Substances 0.000 description 2
- 229910000489 osmium tetroxide Inorganic materials 0.000 description 2
- 239000012285 osmium tetroxide Substances 0.000 description 2
- 230000010627 oxidative phosphorylation Effects 0.000 description 2
- 238000007911 parenteral administration Methods 0.000 description 2
- 239000012071 phase Substances 0.000 description 2
- 150000003904 phospholipids Chemical class 0.000 description 2
- 239000013641 positive control Substances 0.000 description 2
- 230000023603 positive regulation of transcription initiation, DNA-dependent Effects 0.000 description 2
- 229910000027 potassium carbonate Inorganic materials 0.000 description 2
- 230000003389 potentiating effect Effects 0.000 description 2
- 239000000843 powder Substances 0.000 description 2
- 238000002360 preparation method Methods 0.000 description 2
- 125000002924 primary amino group Chemical group [H]N([H])* 0.000 description 2
- 238000012545 processing Methods 0.000 description 2
- 230000002035 prolonged effect Effects 0.000 description 2
- 239000002096 quantum dot Substances 0.000 description 2
- 239000011541 reaction mixture Substances 0.000 description 2
- 230000000717 retained effect Effects 0.000 description 2
- 230000037390 scarring Effects 0.000 description 2
- 239000007974 sodium acetate buffer Substances 0.000 description 2
- 238000000527 sonication Methods 0.000 description 2
- 238000001228 spectrum Methods 0.000 description 2
- 238000003860 storage Methods 0.000 description 2
- 208000024891 symptom Diseases 0.000 description 2
- 239000003826 tablet Substances 0.000 description 2
- XSOLDPYUICCHJX-QQXJNSDFSA-N tauro-alpha-muricholic acid Chemical compound C[C@H](CCC(=O)NCCS(O)(=O)=O)[C@H]1CC[C@H]2[C@@H]3[C@H](O)[C@@H](O)[C@@H]4C[C@H](O)CC[C@]4(C)[C@H]3CC[C@]12C XSOLDPYUICCHJX-QQXJNSDFSA-N 0.000 description 2
- AWDRATDZQPNJFN-VAYUFCLWSA-N taurodeoxycholic acid Chemical compound C([C@H]1CC2)[C@H](O)CC[C@]1(C)[C@@H]1[C@@H]2[C@@H]2CC[C@H]([C@@H](CCC(=O)NCCS(O)(=O)=O)C)[C@@]2(C)[C@@H](O)C1 AWDRATDZQPNJFN-VAYUFCLWSA-N 0.000 description 2
- 229940124597 therapeutic agent Drugs 0.000 description 2
- 230000001225 therapeutic effect Effects 0.000 description 2
- 238000001269 time-of-flight mass spectrometry Methods 0.000 description 2
- 238000001551 total correlation spectroscopy Methods 0.000 description 2
- 231100000331 toxic Toxicity 0.000 description 2
- 230000002588 toxic effect Effects 0.000 description 2
- 231100000419 toxicity Toxicity 0.000 description 2
- 230000001988 toxicity Effects 0.000 description 2
- VZCYOOQTPOCHFL-UHFFFAOYSA-N trans-butenedioic acid Natural products OC(=O)C=CC(O)=O VZCYOOQTPOCHFL-UHFFFAOYSA-N 0.000 description 2
- 238000001890 transfection Methods 0.000 description 2
- 230000032258 transport Effects 0.000 description 2
- 150000003626 triacylglycerols Chemical class 0.000 description 2
- UYPYRKYUKCHHIB-UHFFFAOYSA-N trimethylamine N-oxide Chemical compound C[N+](C)(C)[O-] UYPYRKYUKCHHIB-UHFFFAOYSA-N 0.000 description 2
- DRTQHJPVMGBUCF-UHFFFAOYSA-N uracil arabinoside Natural products OC1C(O)C(CO)OC1N1C(=O)NC(=O)C=C1 DRTQHJPVMGBUCF-UHFFFAOYSA-N 0.000 description 2
- 229940045145 uridine Drugs 0.000 description 2
- 230000035899 viability Effects 0.000 description 2
- 239000011701 zinc Substances 0.000 description 2
- 229910052725 zinc Inorganic materials 0.000 description 2
- MNULEGDCPYONBU-WMBHJXFZSA-N (1r,4s,5e,5'r,6'r,7e,10s,11r,12s,14r,15s,16s,18r,19s,20r,21e,25s,26r,27s,29s)-4-ethyl-11,12,15,19-tetrahydroxy-6'-[(2s)-2-hydroxypropyl]-5',10,12,14,16,18,20,26,29-nonamethylspiro[24,28-dioxabicyclo[23.3.1]nonacosa-5,7,21-triene-27,2'-oxane]-13,17,23-trio Polymers O([C@@H]1CC[C@@H](/C=C/C=C/C[C@H](C)[C@@H](O)[C@](C)(O)C(=O)[C@H](C)[C@@H](O)[C@H](C)C(=O)[C@H](C)[C@@H](O)[C@H](C)/C=C/C(=O)O[C@H]([C@H]2C)[C@H]1C)CC)[C@]12CC[C@@H](C)[C@@H](C[C@H](C)O)O1 MNULEGDCPYONBU-WMBHJXFZSA-N 0.000 description 1
- MNULEGDCPYONBU-DJRUDOHVSA-N (1s,4r,5z,5'r,6'r,7e,10s,11r,12s,14r,15s,18r,19r,20s,21e,26r,27s)-4-ethyl-11,12,15,19-tetrahydroxy-6'-(2-hydroxypropyl)-5',10,12,14,16,18,20,26,29-nonamethylspiro[24,28-dioxabicyclo[23.3.1]nonacosa-5,7,21-triene-27,2'-oxane]-13,17,23-trione Polymers O([C@H]1CC[C@H](\C=C/C=C/C[C@H](C)[C@@H](O)[C@](C)(O)C(=O)[C@H](C)[C@@H](O)C(C)C(=O)[C@H](C)[C@H](O)[C@@H](C)/C=C/C(=O)OC([C@H]2C)C1C)CC)[C@]12CC[C@@H](C)[C@@H](CC(C)O)O1 MNULEGDCPYONBU-DJRUDOHVSA-N 0.000 description 1
- CRDAMVZIKSXKFV-FBXUGWQNSA-N (2-cis,6-cis)-farnesol Chemical compound CC(C)=CCC\C(C)=C/CC\C(C)=C/CO CRDAMVZIKSXKFV-FBXUGWQNSA-N 0.000 description 1
- 239000000260 (2E,6E)-3,7,11-trimethyldodeca-2,6,10-trien-1-ol Substances 0.000 description 1
- OCUSNPIJIZCRSZ-ZTZWCFDHSA-N (2s)-2-amino-3-methylbutanoic acid;(2s)-2-amino-4-methylpentanoic acid;(2s,3s)-2-amino-3-methylpentanoic acid Chemical compound CC(C)[C@H](N)C(O)=O.CC[C@H](C)[C@H](N)C(O)=O.CC(C)C[C@H](N)C(O)=O OCUSNPIJIZCRSZ-ZTZWCFDHSA-N 0.000 description 1
- MNULEGDCPYONBU-YNZHUHFTSA-N (4Z,18Z,20Z)-22-ethyl-7,11,14,15-tetrahydroxy-6'-(2-hydroxypropyl)-5',6,8,10,12,14,16,28,29-nonamethylspiro[2,26-dioxabicyclo[23.3.1]nonacosa-4,18,20-triene-27,2'-oxane]-3,9,13-trione Polymers CC1C(C2C)OC(=O)\C=C/C(C)C(O)C(C)C(=O)C(C)C(O)C(C)C(=O)C(C)(O)C(O)C(C)C\C=C/C=C\C(CC)CCC2OC21CCC(C)C(CC(C)O)O2 MNULEGDCPYONBU-YNZHUHFTSA-N 0.000 description 1
- MNULEGDCPYONBU-VVXVDZGXSA-N (5e,5'r,7e,10s,11r,12s,14s,15r,16r,18r,19s,20r,21e,26r,29s)-4-ethyl-11,12,15,19-tetrahydroxy-6'-[(2s)-2-hydroxypropyl]-5',10,12,14,16,18,20,26,29-nonamethylspiro[24,28-dioxabicyclo[23.3.1]nonacosa-5,7,21-triene-27,2'-oxane]-13,17,23-trione Polymers C([C@H](C)[C@@H](O)[C@](C)(O)C(=O)[C@@H](C)[C@H](O)[C@@H](C)C(=O)[C@H](C)[C@@H](O)[C@H](C)/C=C/C(=O)OC([C@H]1C)[C@H]2C)\C=C\C=C\C(CC)CCC2OC21CC[C@@H](C)C(C[C@H](C)O)O2 MNULEGDCPYONBU-VVXVDZGXSA-N 0.000 description 1
- GUAHPAJOXVYFON-ZETCQYMHSA-N (8S)-8-amino-7-oxononanoic acid zwitterion Chemical compound C[C@H](N)C(=O)CCCCCC(O)=O GUAHPAJOXVYFON-ZETCQYMHSA-N 0.000 description 1
- 108020004463 18S ribosomal RNA Proteins 0.000 description 1
- 238000001026 1H--1H correlation spectroscopy Methods 0.000 description 1
- BMYNFMYTOJXKLE-UHFFFAOYSA-N 3-azaniumyl-2-hydroxypropanoate Chemical compound NCC(O)C(O)=O BMYNFMYTOJXKLE-UHFFFAOYSA-N 0.000 description 1
- 102100021834 3-hydroxyacyl-CoA dehydrogenase Human genes 0.000 description 1
- PXACTUVBBMDKRW-UHFFFAOYSA-N 4-bromobenzenesulfonic acid Chemical compound OS(=O)(=O)C1=CC=C(Br)C=C1 PXACTUVBBMDKRW-UHFFFAOYSA-N 0.000 description 1
- MNULEGDCPYONBU-UHFFFAOYSA-N 4-ethyl-11,12,15,19-tetrahydroxy-6'-(2-hydroxypropyl)-5',10,12,14,16,18,20,26,29-nonamethylspiro[24,28-dioxabicyclo[23.3.1]nonacosa-5,7,21-triene-27,2'-oxane]-13,17,23-trione Polymers CC1C(C2C)OC(=O)C=CC(C)C(O)C(C)C(=O)C(C)C(O)C(C)C(=O)C(C)(O)C(O)C(C)CC=CC=CC(CC)CCC2OC21CCC(C)C(CC(C)O)O2 MNULEGDCPYONBU-UHFFFAOYSA-N 0.000 description 1
- HOSGXJWQVBHGLT-UHFFFAOYSA-N 6-hydroxy-3,4-dihydro-1h-quinolin-2-one Chemical group N1C(=O)CCC2=CC(O)=CC=C21 HOSGXJWQVBHGLT-UHFFFAOYSA-N 0.000 description 1
- SHGAZHPCJJPHSC-ZVCIMWCZSA-N 9-cis-retinoic acid Chemical compound OC(=O)/C=C(\C)/C=C/C=C(/C)\C=C\C1=C(C)CCCC1(C)C SHGAZHPCJJPHSC-ZVCIMWCZSA-N 0.000 description 1
- 101150077457 ACOX1 gene Proteins 0.000 description 1
- 231100000582 ATP assay Toxicity 0.000 description 1
- 102100023568 ATP synthase F(0) complex subunit C1, mitochondrial Human genes 0.000 description 1
- 102100027757 ATP synthase subunit d, mitochondrial Human genes 0.000 description 1
- 101150115549 ATP5PD gene Proteins 0.000 description 1
- 206010000060 Abdominal distension Diseases 0.000 description 1
- QTBSBXVTEAMEQO-UHFFFAOYSA-M Acetate Chemical compound CC([O-])=O QTBSBXVTEAMEQO-UHFFFAOYSA-M 0.000 description 1
- 102000004672 Acetyl-CoA C-acyltransferase Human genes 0.000 description 1
- 108010003902 Acetyl-CoA C-acyltransferase Proteins 0.000 description 1
- 102100022089 Acyl-[acyl-carrier-protein] hydrolase Human genes 0.000 description 1
- 101710103514 Acyl-coenzyme A oxidase 1 Proteins 0.000 description 1
- 102100034083 Alkaline ceramidase 1 Human genes 0.000 description 1
- 101710200052 Alkaline ceramidase 1 Proteins 0.000 description 1
- 102100034082 Alkaline ceramidase 3 Human genes 0.000 description 1
- 101710200049 Alkaline ceramidase 3 Proteins 0.000 description 1
- USFZMSVCRYTOJT-UHFFFAOYSA-N Ammonium acetate Chemical compound N.CC(O)=O USFZMSVCRYTOJT-UHFFFAOYSA-N 0.000 description 1
- 239000005695 Ammonium acetate Substances 0.000 description 1
- 206010003211 Arteriosclerosis coronary artery Diseases 0.000 description 1
- 241000416162 Astragalus gummifer Species 0.000 description 1
- 241000606125 Bacteroides Species 0.000 description 1
- 239000005711 Benzoic acid Substances 0.000 description 1
- 206010006187 Breast cancer Diseases 0.000 description 1
- 208000026310 Breast neoplasm Diseases 0.000 description 1
- FERIUCNNQQJTOY-UHFFFAOYSA-M Butyrate Chemical compound CCCC([O-])=O FERIUCNNQQJTOY-UHFFFAOYSA-M 0.000 description 1
- FERIUCNNQQJTOY-UHFFFAOYSA-N Butyric acid Natural products CCCC(O)=O FERIUCNNQQJTOY-UHFFFAOYSA-N 0.000 description 1
- 101150104471 COX5A gene Proteins 0.000 description 1
- OYPRJOBELJOOCE-UHFFFAOYSA-N Calcium Chemical compound [Ca] OYPRJOBELJOOCE-UHFFFAOYSA-N 0.000 description 1
- 241000282465 Canis Species 0.000 description 1
- 102000002666 Carnitine O-palmitoyltransferase Human genes 0.000 description 1
- 108010018424 Carnitine O-palmitoyltransferase Proteins 0.000 description 1
- 241001466804 Carnivora Species 0.000 description 1
- 102100035401 Ceramide synthase 2 Human genes 0.000 description 1
- 101710146191 Ceramide synthase 2 Proteins 0.000 description 1
- 102100035418 Ceramide synthase 4 Human genes 0.000 description 1
- 101710146190 Ceramide synthase 4 Proteins 0.000 description 1
- 241000282693 Cercopithecidae Species 0.000 description 1
- RKWGIWYCVPQPMF-UHFFFAOYSA-N Chloropropamide Chemical compound CCCNC(=O)NS(=O)(=O)C1=CC=C(Cl)C=C1 RKWGIWYCVPQPMF-UHFFFAOYSA-N 0.000 description 1
- 108090000943 Cholesterol 7-alpha-monooxygenases Proteins 0.000 description 1
- 102000004410 Cholesterol 7-alpha-monooxygenases Human genes 0.000 description 1
- 101150011389 Chpt1 gene Proteins 0.000 description 1
- 208000017667 Chronic Disease Diseases 0.000 description 1
- 241000193403 Clostridium Species 0.000 description 1
- 206010009944 Colon cancer Diseases 0.000 description 1
- 101150098502 Cox4i1 gene Proteins 0.000 description 1
- 101150073133 Cpt1a gene Proteins 0.000 description 1
- 229920002785 Croscarmellose sodium Polymers 0.000 description 1
- 229920000858 Cyclodextrin Polymers 0.000 description 1
- 102100027456 Cytochrome c oxidase subunit 2 Human genes 0.000 description 1
- 101710114487 Cytochrome c oxidase subunit 4 isoform 1, mitochondrial Proteins 0.000 description 1
- 102100022206 Cytochrome c oxidase subunit 4 isoform 1, mitochondrial Human genes 0.000 description 1
- 102100027563 Cytochrome c oxidase subunit 5A, mitochondrial Human genes 0.000 description 1
- 102000019265 Cytochrome c1 Human genes 0.000 description 1
- 108010007528 Cytochromes c1 Proteins 0.000 description 1
- 102000004127 Cytokines Human genes 0.000 description 1
- 108090000695 Cytokines Proteins 0.000 description 1
- 238000007399 DNA isolation Methods 0.000 description 1
- 101100170485 Danio rerio sdhdb gene Proteins 0.000 description 1
- 241000605716 Desulfovibrio Species 0.000 description 1
- FEWJPZIEWOKRBE-JCYAYHJZSA-N Dextrotartaric acid Chemical compound OC(=O)[C@H](O)[C@@H](O)C(O)=O FEWJPZIEWOKRBE-JCYAYHJZSA-N 0.000 description 1
- 101150102653 Dgat2 gene Proteins 0.000 description 1
- 102100035762 Diacylglycerol O-acyltransferase 2 Human genes 0.000 description 1
- 101710167503 Diacylglycerol O-acyltransferase 2 Proteins 0.000 description 1
- 208000032928 Dyslipidaemia Diseases 0.000 description 1
- GKQLYSROISKDLL-UHFFFAOYSA-N EEDQ Chemical compound C1=CC=C2N(C(=O)OCC)C(OCC)C=CC2=C1 GKQLYSROISKDLL-UHFFFAOYSA-N 0.000 description 1
- 102000015782 Electron Transport Complex III Human genes 0.000 description 1
- 108010024882 Electron Transport Complex III Proteins 0.000 description 1
- 102000018642 Elongation of very long chain fatty acids protein 6 Human genes 0.000 description 1
- 108050007786 Elongation of very long chain fatty acids protein 6 Proteins 0.000 description 1
- 206010014733 Endometrial cancer Diseases 0.000 description 1
- 206010014759 Endometrial neoplasm Diseases 0.000 description 1
- 241000283086 Equidae Species 0.000 description 1
- 241000283073 Equus caballus Species 0.000 description 1
- 108010039731 Fatty Acid Synthases Proteins 0.000 description 1
- 208000004930 Fatty Liver Diseases 0.000 description 1
- 241000282324 Felis Species 0.000 description 1
- 241000282326 Felis catus Species 0.000 description 1
- 101710153363 Fibroblast growth factor 15 Proteins 0.000 description 1
- BDAGIHXWWSANSR-UHFFFAOYSA-M Formate Chemical compound [O-]C=O BDAGIHXWWSANSR-UHFFFAOYSA-M 0.000 description 1
- 208000002705 Glucose Intolerance Diseases 0.000 description 1
- 206010018429 Glucose tolerance impaired Diseases 0.000 description 1
- 229920002907 Guar gum Polymers 0.000 description 1
- 206010019663 Hepatic failure Diseases 0.000 description 1
- 241000238631 Hexapoda Species 0.000 description 1
- 241001272567 Hominoidea Species 0.000 description 1
- 101000896020 Homo sapiens 3-hydroxyacyl-CoA dehydrogenase Proteins 0.000 description 1
- 101000905799 Homo sapiens ATP synthase F(0) complex subunit C1, mitochondrial Proteins 0.000 description 1
- 101000936976 Homo sapiens ATP synthase subunit d, mitochondrial Proteins 0.000 description 1
- 101000725401 Homo sapiens Cytochrome c oxidase subunit 2 Proteins 0.000 description 1
- 101000725076 Homo sapiens Cytochrome c oxidase subunit 5A, mitochondrial Proteins 0.000 description 1
- 101000951145 Homo sapiens Succinate dehydrogenase [ubiquinone] cytochrome b small subunit, mitochondrial Proteins 0.000 description 1
- 239000007836 KH2PO4 Substances 0.000 description 1
- QNAYBMKLOCPYGJ-REOHCLBHSA-N L-alanine Chemical compound C[C@H](N)C(O)=O QNAYBMKLOCPYGJ-REOHCLBHSA-N 0.000 description 1
- WHUUTDBJXJRKMK-VKHMYHEASA-N L-glutamic acid Chemical compound OC(=O)[C@@H](N)CCC(O)=O WHUUTDBJXJRKMK-VKHMYHEASA-N 0.000 description 1
- COLNVLDHVKWLRT-QMMMGPOBSA-N L-phenylalanine Chemical compound OC(=O)[C@@H](N)CC1=CC=CC=C1 COLNVLDHVKWLRT-QMMMGPOBSA-N 0.000 description 1
- OUYCCCASQSFEME-QMMMGPOBSA-N L-tyrosine Chemical compound OC(=O)[C@@H](N)CC1=CC=C(O)C=C1 OUYCCCASQSFEME-QMMMGPOBSA-N 0.000 description 1
- 241001468155 Lactobacillaceae Species 0.000 description 1
- 102000006835 Lamins Human genes 0.000 description 1
- 108010047294 Lamins Proteins 0.000 description 1
- 102000016267 Leptin Human genes 0.000 description 1
- 108010092277 Leptin Proteins 0.000 description 1
- 208000017170 Lipid metabolism disease Diseases 0.000 description 1
- 101150014058 MMP1 gene Proteins 0.000 description 1
- FYYHWMGAXLPEAU-UHFFFAOYSA-N Magnesium Chemical compound [Mg] FYYHWMGAXLPEAU-UHFFFAOYSA-N 0.000 description 1
- 208000001145 Metabolic Syndrome Diseases 0.000 description 1
- 241000736262 Microbiota Species 0.000 description 1
- 229920000168 Microcrystalline cellulose Polymers 0.000 description 1
- 101150090495 Mtco2 gene Proteins 0.000 description 1
- ZBSGKPYXQINNGF-UHFFFAOYSA-N N-nicotinoylglycine Chemical compound OC(=O)CNC(=O)C1=CC=CN=C1 ZBSGKPYXQINNGF-UHFFFAOYSA-N 0.000 description 1
- 238000013232 NAFLD rodent model Methods 0.000 description 1
- 238000000636 Northern blotting Methods 0.000 description 1
- 102100022669 Nuclear receptor subfamily 5 group A member 2 Human genes 0.000 description 1
- 101710105538 Nuclear receptor subfamily 5 group A member 2 Proteins 0.000 description 1
- 241000283973 Oryctolagus cuniculus Species 0.000 description 1
- 206010033307 Overweight Diseases 0.000 description 1
- 102100030919 Phosphatidylcholine:ceramide cholinephosphotransferase 1 Human genes 0.000 description 1
- 101710145828 Phosphatidylcholine:ceramide cholinephosphotransferase 1 Proteins 0.000 description 1
- 102100022771 Phosphatidylcholine:ceramide cholinephosphotransferase 2 Human genes 0.000 description 1
- 101710145833 Phosphatidylcholine:ceramide cholinephosphotransferase 2 Proteins 0.000 description 1
- 239000004698 Polyethylene Substances 0.000 description 1
- ZLMJMSJWJFRBEC-UHFFFAOYSA-N Potassium Chemical compound [K] ZLMJMSJWJFRBEC-UHFFFAOYSA-N 0.000 description 1
- 241000288906 Primates Species 0.000 description 1
- OFOBLEOULBTSOW-UHFFFAOYSA-N Propanedioic acid Natural products OC(=O)CC(O)=O OFOBLEOULBTSOW-UHFFFAOYSA-N 0.000 description 1
- 206010060862 Prostate cancer Diseases 0.000 description 1
- 208000000236 Prostatic Neoplasms Diseases 0.000 description 1
- 101100187476 Rattus norvegicus Nr1h4 gene Proteins 0.000 description 1
- 102100023606 Retinoic acid receptor alpha Human genes 0.000 description 1
- 241000283984 Rodentia Species 0.000 description 1
- 241000605947 Roseburia Species 0.000 description 1
- 101150086058 SGMS1 gene Proteins 0.000 description 1
- MTCFGRXMJLQNBG-UHFFFAOYSA-N Serine Natural products OCC(N)C(O)=O MTCFGRXMJLQNBG-UHFFFAOYSA-N 0.000 description 1
- 102000015785 Serine C-Palmitoyltransferase Human genes 0.000 description 1
- 108010024814 Serine C-palmitoyltransferase Proteins 0.000 description 1
- 101150024721 Sgms2 gene Proteins 0.000 description 1
- VYPSYNLAJGMNEJ-UHFFFAOYSA-N Silicium dioxide Chemical compound O=[Si]=O VYPSYNLAJGMNEJ-UHFFFAOYSA-N 0.000 description 1
- 208000032140 Sleepiness Diseases 0.000 description 1
- 206010041349 Somnolence Diseases 0.000 description 1
- 102100037416 Sphingolipid delta(4)-desaturase DES1 Human genes 0.000 description 1
- 108700001179 Sphingolipid delta(4)-desaturase DES1 Proteins 0.000 description 1
- 102100021461 Sphingomyelin phosphodiesterase 3 Human genes 0.000 description 1
- 101710201918 Sphingomyelin phosphodiesterase 3 Proteins 0.000 description 1
- 235000021355 Stearic acid Nutrition 0.000 description 1
- 229930182558 Sterol Natural products 0.000 description 1
- 241000194017 Streptococcus Species 0.000 description 1
- 208000006011 Stroke Diseases 0.000 description 1
- 238000000692 Student's t-test Methods 0.000 description 1
- 102100038014 Succinate dehydrogenase [ubiquinone] cytochrome b small subunit, mitochondrial Human genes 0.000 description 1
- KDYFGRWQOYBRFD-UHFFFAOYSA-N Succinic acid Natural products OC(=O)CCC(O)=O KDYFGRWQOYBRFD-UHFFFAOYSA-N 0.000 description 1
- 241000282887 Suidae Species 0.000 description 1
- 241001493546 Suina Species 0.000 description 1
- 241000282898 Sus scrofa Species 0.000 description 1
- FEWJPZIEWOKRBE-UHFFFAOYSA-N Tartaric acid Natural products [H+].[H+].[O-]C(=O)C(O)C(O)C([O-])=O FEWJPZIEWOKRBE-UHFFFAOYSA-N 0.000 description 1
- 101150082427 Tlr4 gene Proteins 0.000 description 1
- 108010060804 Toll-Like Receptor 4 Proteins 0.000 description 1
- 102000008235 Toll-Like Receptor 9 Human genes 0.000 description 1
- 108010060818 Toll-Like Receptor 9 Proteins 0.000 description 1
- 102000008228 Toll-like receptor 2 Human genes 0.000 description 1
- 108010060888 Toll-like receptor 2 Proteins 0.000 description 1
- 102100039360 Toll-like receptor 4 Human genes 0.000 description 1
- 229920001615 Tragacanth Polymers 0.000 description 1
- 108060008682 Tumor Necrosis Factor Proteins 0.000 description 1
- 102000000852 Tumor Necrosis Factor-alpha Human genes 0.000 description 1
- 208000021017 Weight Gain Diseases 0.000 description 1
- 210000001015 abdomen Anatomy 0.000 description 1
- 201000000690 abdominal obesity-metabolic syndrome Diseases 0.000 description 1
- 201000010272 acanthosis nigricans Diseases 0.000 description 1
- DPXJVFZANSGRMM-UHFFFAOYSA-N acetic acid;2,3,4,5,6-pentahydroxyhexanal;sodium Chemical compound [Na].CC(O)=O.OCC(O)C(O)C(O)C(O)C=O DPXJVFZANSGRMM-UHFFFAOYSA-N 0.000 description 1
- 150000007513 acids Chemical class 0.000 description 1
- 239000013543 active substance Substances 0.000 description 1
- 230000001154 acute effect Effects 0.000 description 1
- 230000001919 adrenal effect Effects 0.000 description 1
- 239000011543 agarose gel Substances 0.000 description 1
- 235000004279 alanine Nutrition 0.000 description 1
- 239000000783 alginic acid Substances 0.000 description 1
- 235000010443 alginic acid Nutrition 0.000 description 1
- 229920000615 alginic acid Polymers 0.000 description 1
- 229960001126 alginic acid Drugs 0.000 description 1
- 150000004781 alginic acids Chemical class 0.000 description 1
- 229960001445 alitretinoin Drugs 0.000 description 1
- 239000003513 alkali Substances 0.000 description 1
- 150000001342 alkaline earth metals Chemical class 0.000 description 1
- 150000004347 all-trans-retinol derivatives Chemical class 0.000 description 1
- 230000004075 alteration Effects 0.000 description 1
- 229910000147 aluminium phosphate Inorganic materials 0.000 description 1
- 235000019257 ammonium acetate Nutrition 0.000 description 1
- 229940043376 ammonium acetate Drugs 0.000 description 1
- 230000003321 amplification Effects 0.000 description 1
- 230000001093 anti-cancer Effects 0.000 description 1
- 239000002246 antineoplastic agent Substances 0.000 description 1
- 230000036528 appetite Effects 0.000 description 1
- 235000019789 appetite Nutrition 0.000 description 1
- 239000006286 aqueous extract Substances 0.000 description 1
- 239000007864 aqueous solution Substances 0.000 description 1
- 238000003149 assay kit Methods 0.000 description 1
- SRSXLGNVWSONIS-UHFFFAOYSA-N benzenesulfonic acid Chemical compound OS(=O)(=O)C1=CC=CC=C1 SRSXLGNVWSONIS-UHFFFAOYSA-N 0.000 description 1
- 229940092714 benzenesulfonic acid Drugs 0.000 description 1
- 235000010233 benzoic acid Nutrition 0.000 description 1
- 210000000941 bile Anatomy 0.000 description 1
- 238000004166 bioassay Methods 0.000 description 1
- 239000012472 biological sample Substances 0.000 description 1
- 208000024330 bloating Diseases 0.000 description 1
- 238000009835 boiling Methods 0.000 description 1
- 210000004556 brain Anatomy 0.000 description 1
- 150000005693 branched-chain amino acids Chemical class 0.000 description 1
- 210000000481 breast Anatomy 0.000 description 1
- 239000006172 buffering agent Substances 0.000 description 1
- KDYFGRWQOYBRFD-NUQCWPJISA-N butanedioic acid Chemical compound O[14C](=O)CC[14C](O)=O KDYFGRWQOYBRFD-NUQCWPJISA-N 0.000 description 1
- 229910052791 calcium Inorganic materials 0.000 description 1
- 239000011575 calcium Substances 0.000 description 1
- 239000001506 calcium phosphate Substances 0.000 description 1
- 229910000389 calcium phosphate Inorganic materials 0.000 description 1
- 235000011010 calcium phosphates Nutrition 0.000 description 1
- CJZGTCYPCWQAJB-UHFFFAOYSA-L calcium stearate Chemical compound [Ca+2].CCCCCCCCCCCCCCCCCC([O-])=O.CCCCCCCCCCCCCCCCCC([O-])=O CJZGTCYPCWQAJB-UHFFFAOYSA-L 0.000 description 1
- 235000013539 calcium stearate Nutrition 0.000 description 1
- 239000008116 calcium stearate Substances 0.000 description 1
- 150000001720 carbohydrates Chemical class 0.000 description 1
- 235000014633 carbohydrates Nutrition 0.000 description 1
- BVKZGUZCCUSVTD-UHFFFAOYSA-N carbonic acid Chemical compound OC(O)=O BVKZGUZCCUSVTD-UHFFFAOYSA-N 0.000 description 1
- 230000001364 causal effect Effects 0.000 description 1
- 238000004113 cell culture Methods 0.000 description 1
- 230000004700 cellular uptake Effects 0.000 description 1
- WORJEOGGNQDSOE-UHFFFAOYSA-N chloroform;methanol Chemical compound OC.ClC(Cl)Cl WORJEOGGNQDSOE-UHFFFAOYSA-N 0.000 description 1
- 229960001761 chlorpropamide Drugs 0.000 description 1
- 230000031154 cholesterol homeostasis Effects 0.000 description 1
- 150000001841 cholesterols Chemical class 0.000 description 1
- 108700004333 collagenase 1 Proteins 0.000 description 1
- 229940075614 colloidal silicon dioxide Drugs 0.000 description 1
- 208000029742 colonic neoplasm Diseases 0.000 description 1
- 239000003086 colorant Substances 0.000 description 1
- 238000007398 colorimetric assay Methods 0.000 description 1
- 238000002591 computed tomography Methods 0.000 description 1
- 230000021615 conjugation Effects 0.000 description 1
- 238000011109 contamination Methods 0.000 description 1
- 235000005687 corn oil Nutrition 0.000 description 1
- 239000002285 corn oil Substances 0.000 description 1
- 208000026758 coronary atherosclerosis Diseases 0.000 description 1
- 238000005100 correlation spectroscopy Methods 0.000 description 1
- 230000000875 corresponding effect Effects 0.000 description 1
- 239000007822 coupling agent Substances 0.000 description 1
- 229960001681 croscarmellose sodium Drugs 0.000 description 1
- 238000002790 cross-validation Methods 0.000 description 1
- 235000010947 crosslinked sodium carboxy methyl cellulose Nutrition 0.000 description 1
- 239000013078 crystal Substances 0.000 description 1
- 238000012258 culturing Methods 0.000 description 1
- 230000001086 cytosolic effect Effects 0.000 description 1
- 229940127089 cytotoxic agent Drugs 0.000 description 1
- 238000007269 dehydrobromination reaction Methods 0.000 description 1
- 238000004807 desolvation Methods 0.000 description 1
- 230000001627 detrimental effect Effects 0.000 description 1
- 238000010586 diagram Methods 0.000 description 1
- 230000000378 dietary effect Effects 0.000 description 1
- 235000013367 dietary fats Nutrition 0.000 description 1
- 238000007865 diluting Methods 0.000 description 1
- LOKCTEFSRHRXRJ-UHFFFAOYSA-I dipotassium trisodium dihydrogen phosphate hydrogen phosphate dichloride Chemical compound P(=O)(O)(O)[O-].[K+].P(=O)(O)([O-])[O-].[Na+].[Na+].[Cl-].[K+].[Cl-].[Na+] LOKCTEFSRHRXRJ-UHFFFAOYSA-I 0.000 description 1
- 239000006185 dispersion Substances 0.000 description 1
- 238000002224 dissection Methods 0.000 description 1
- 230000003828 downregulation Effects 0.000 description 1
- 239000003596 drug target Substances 0.000 description 1
- 210000001198 duodenum Anatomy 0.000 description 1
- 108010057988 ecdysone receptor Proteins 0.000 description 1
- 230000001729 effect on metabolism Effects 0.000 description 1
- 239000012636 effector Substances 0.000 description 1
- 101150100705 ehhadh gene Proteins 0.000 description 1
- 230000027721 electron transport chain Effects 0.000 description 1
- 238000000132 electrospray ionisation Methods 0.000 description 1
- 238000001437 electrospray ionisation time-of-flight quadrupole detection Methods 0.000 description 1
- 239000003995 emulsifying agent Substances 0.000 description 1
- 230000002357 endometrial effect Effects 0.000 description 1
- GKIPXFAANLTWBM-UHFFFAOYSA-N epibromohydrin Chemical compound BrCC1CO1 GKIPXFAANLTWBM-UHFFFAOYSA-N 0.000 description 1
- 210000000981 epithelium Anatomy 0.000 description 1
- 238000011067 equilibration Methods 0.000 description 1
- NTNZTEQNFHNYBC-UHFFFAOYSA-N ethyl 2-aminoacetate Chemical compound CCOC(=O)CN NTNZTEQNFHNYBC-UHFFFAOYSA-N 0.000 description 1
- 238000011156 evaluation Methods 0.000 description 1
- 238000002474 experimental method Methods 0.000 description 1
- 238000013265 extended release Methods 0.000 description 1
- 238000000605 extraction Methods 0.000 description 1
- 229930002886 farnesol Natural products 0.000 description 1
- 229940043259 farnesol Drugs 0.000 description 1
- 230000004129 fatty acid metabolism Effects 0.000 description 1
- 230000009123 feedback regulation Effects 0.000 description 1
- 231100000502 fertility decrease Toxicity 0.000 description 1
- 230000004761 fibrosis Effects 0.000 description 1
- 239000000945 filler Substances 0.000 description 1
- 235000019634 flavors Nutrition 0.000 description 1
- 239000006260 foam Substances 0.000 description 1
- 235000013305 food Nutrition 0.000 description 1
- 235000013355 food flavoring agent Nutrition 0.000 description 1
- 229940044170 formate Drugs 0.000 description 1
- 229940050411 fumarate Drugs 0.000 description 1
- VZCYOOQTPOCHFL-OWOJBTEDSA-L fumarate(2-) Chemical compound [O-]C(=O)\C=C\C([O-])=O VZCYOOQTPOCHFL-OWOJBTEDSA-L 0.000 description 1
- 208000020694 gallbladder disease Diseases 0.000 description 1
- 239000007789 gas Substances 0.000 description 1
- 239000000499 gel Substances 0.000 description 1
- 230000002068 genetic effect Effects 0.000 description 1
- 229960001031 glucose Drugs 0.000 description 1
- 230000014101 glucose homeostasis Effects 0.000 description 1
- 229930195712 glutamate Natural products 0.000 description 1
- 235000011187 glycerol Nutrition 0.000 description 1
- 239000008187 granular material Substances 0.000 description 1
- 239000000665 guar gum Substances 0.000 description 1
- 235000010417 guar gum Nutrition 0.000 description 1
- 229960002154 guar gum Drugs 0.000 description 1
- 235000004280 healthy diet Nutrition 0.000 description 1
- 208000019622 heart disease Diseases 0.000 description 1
- 230000004730 hepatocarcinogenesis Effects 0.000 description 1
- 231100000844 hepatocellular carcinoma Toxicity 0.000 description 1
- 206010073071 hepatocellular carcinoma Diseases 0.000 description 1
- 238000000265 homogenisation Methods 0.000 description 1
- 239000011539 homogenization buffer Substances 0.000 description 1
- 150000004677 hydrates Chemical class 0.000 description 1
- XMBWDFGMSWQBCA-UHFFFAOYSA-N hydrogen iodide Chemical compound I XMBWDFGMSWQBCA-UHFFFAOYSA-N 0.000 description 1
- 229940071870 hydroiodic acid Drugs 0.000 description 1
- 230000033444 hydroxylation Effects 0.000 description 1
- 238000005805 hydroxylation reaction Methods 0.000 description 1
- 201000001421 hyperglycemia Diseases 0.000 description 1
- CUILPNURFADTPE-UHFFFAOYSA-N hypobromous acid Chemical compound BrO CUILPNURFADTPE-UHFFFAOYSA-N 0.000 description 1
- 230000006872 improvement Effects 0.000 description 1
- 238000007901 in situ hybridization Methods 0.000 description 1
- 150000007529 inorganic bases Chemical class 0.000 description 1
- 239000013546 insoluble monolayer Substances 0.000 description 1
- 230000010354 integration Effects 0.000 description 1
- 238000011835 investigation Methods 0.000 description 1
- 229930014550 juvenile hormone Natural products 0.000 description 1
- 239000002949 juvenile hormone Substances 0.000 description 1
- 150000003633 juvenile hormone derivatives Chemical class 0.000 description 1
- 238000011813 knockout mouse model Methods 0.000 description 1
- 210000005053 lamin Anatomy 0.000 description 1
- 239000010410 layer Substances 0.000 description 1
- NRYBAZVQPHGZNS-ZSOCWYAHSA-N leptin Chemical compound O=C([C@H](CO)NC(=O)[C@H](CC(C)C)NC(=O)[C@H](CC(O)=O)NC(=O)[C@H](CC(C)C)NC(=O)[C@H](CCC(N)=O)NC(=O)[C@H](CC=1C2=CC=CC=C2NC=1)NC(=O)[C@H](CC(C)C)NC(=O)[C@@H](NC(=O)[C@H](CC(O)=O)NC(=O)[C@H](CCC(N)=O)NC(=O)[C@H](CC(C)C)NC(=O)[C@H](CO)NC(=O)CNC(=O)[C@H](CCC(N)=O)NC(=O)[C@@H](N)CC(C)C)CCSC)N1CCC[C@H]1C(=O)NCC(=O)N[C@@H](CS)C(O)=O NRYBAZVQPHGZNS-ZSOCWYAHSA-N 0.000 description 1
- 229940039781 leptin Drugs 0.000 description 1
- 238000004895 liquid chromatography mass spectrometry Methods 0.000 description 1
- 238000001294 liquid chromatography-tandem mass spectrometry Methods 0.000 description 1
- 239000004973 liquid crystal related substance Substances 0.000 description 1
- 239000012669 liquid formulation Substances 0.000 description 1
- 239000006193 liquid solution Substances 0.000 description 1
- 238000012317 liver biopsy Methods 0.000 description 1
- 231100000835 liver failure Toxicity 0.000 description 1
- 208000007903 liver failure Diseases 0.000 description 1
- 230000003908 liver function Effects 0.000 description 1
- 150000004668 long chain fatty acids Chemical class 0.000 description 1
- 239000000314 lubricant Substances 0.000 description 1
- 210000003563 lymphoid tissue Anatomy 0.000 description 1
- 229910052749 magnesium Inorganic materials 0.000 description 1
- 239000011777 magnesium Substances 0.000 description 1
- 235000019359 magnesium stearate Nutrition 0.000 description 1
- 229940049920 malate Drugs 0.000 description 1
- BJEPYKJPYRNKOW-UHFFFAOYSA-L malate(2-) Chemical compound [O-]C(=O)C(O)CC([O-])=O BJEPYKJPYRNKOW-UHFFFAOYSA-L 0.000 description 1
- VZCYOOQTPOCHFL-UPHRSURJSA-N maleic acid Chemical compound OC(=O)\C=C/C(O)=O VZCYOOQTPOCHFL-UPHRSURJSA-N 0.000 description 1
- 239000011976 maleic acid Substances 0.000 description 1
- 239000002609 medium Substances 0.000 description 1
- 239000012528 membrane Substances 0.000 description 1
- 208000030159 metabolic disease Diseases 0.000 description 1
- 150000001457 metallic cations Chemical class 0.000 description 1
- 229940098779 methanesulfonic acid Drugs 0.000 description 1
- GBMDVOWEEQVZKZ-UHFFFAOYSA-N methanol;hydrate Chemical compound O.OC GBMDVOWEEQVZKZ-UHFFFAOYSA-N 0.000 description 1
- 239000000693 micelle Substances 0.000 description 1
- 230000000813 microbial effect Effects 0.000 description 1
- 235000019813 microcrystalline cellulose Nutrition 0.000 description 1
- 239000008108 microcrystalline cellulose Substances 0.000 description 1
- 229940016286 microcrystalline cellulose Drugs 0.000 description 1
- 150000007522 mineralic acids Chemical class 0.000 description 1
- 230000005787 mitochondrial ATP synthesis coupled electron transport Effects 0.000 description 1
- 230000009456 molecular mechanism Effects 0.000 description 1
- 229910000402 monopotassium phosphate Inorganic materials 0.000 description 1
- 238000002552 multiple reaction monitoring Methods 0.000 description 1
- 239000013642 negative control Substances 0.000 description 1
- 230000007935 neutral effect Effects 0.000 description 1
- 229940127285 new chemical entity Drugs 0.000 description 1
- 229910052757 nitrogen Inorganic materials 0.000 description 1
- 239000012457 nonaqueous media Substances 0.000 description 1
- 231100000252 nontoxic Toxicity 0.000 description 1
- 230000003000 nontoxic effect Effects 0.000 description 1
- 235000021590 normal diet Nutrition 0.000 description 1
- 238000001208 nuclear magnetic resonance pulse sequence Methods 0.000 description 1
- 238000000655 nuclear magnetic resonance spectrum Methods 0.000 description 1
- 238000003199 nucleic acid amplification method Methods 0.000 description 1
- 108020004707 nucleic acids Proteins 0.000 description 1
- 102000039446 nucleic acids Human genes 0.000 description 1
- 150000007523 nucleic acids Chemical class 0.000 description 1
- OQCDKBAXFALNLD-UHFFFAOYSA-N octadecanoic acid Natural products CCCCCCCC(C)CCCCCCCCC(O)=O OQCDKBAXFALNLD-UHFFFAOYSA-N 0.000 description 1
- 229930191479 oligomycin Natural products 0.000 description 1
- MNULEGDCPYONBU-AWJDAWNUSA-N oligomycin A Polymers O([C@H]1CC[C@H](/C=C/C=C/C[C@@H](C)[C@H](O)[C@@](C)(O)C(=O)[C@@H](C)[C@H](O)[C@@H](C)C(=O)[C@@H](C)[C@H](O)[C@@H](C)/C=C/C(=O)O[C@@H]([C@@H]2C)[C@@H]1C)CC)[C@@]12CC[C@H](C)[C@H](C[C@@H](C)O)O1 MNULEGDCPYONBU-AWJDAWNUSA-N 0.000 description 1
- 235000015205 orange juice Nutrition 0.000 description 1
- 150000007524 organic acids Chemical class 0.000 description 1
- 235000005985 organic acids Nutrition 0.000 description 1
- 239000003960 organic solvent Substances 0.000 description 1
- 108090000629 orphan nuclear receptors Proteins 0.000 description 1
- 102000004164 orphan nuclear receptors Human genes 0.000 description 1
- 201000008482 osteoarthritis Diseases 0.000 description 1
- 235000006408 oxalic acid Nutrition 0.000 description 1
- 229940116315 oxalic acid Drugs 0.000 description 1
- 230000036284 oxygen consumption Effects 0.000 description 1
- 239000012188 paraffin wax Substances 0.000 description 1
- 235000010603 pastilles Nutrition 0.000 description 1
- 239000008188 pellet Substances 0.000 description 1
- 230000010412 perfusion Effects 0.000 description 1
- 238000001558 permutation test Methods 0.000 description 1
- 239000008180 pharmaceutical surfactant Substances 0.000 description 1
- 150000002989 phenols Chemical class 0.000 description 1
- WVDDGKGOMKODPV-ZQBYOMGUSA-N phenyl(114C)methanol Chemical compound O[14CH2]C1=CC=CC=C1 WVDDGKGOMKODPV-ZQBYOMGUSA-N 0.000 description 1
- COLNVLDHVKWLRT-UHFFFAOYSA-N phenylalanine Natural products OC(=O)C(N)CC1=CC=CC=C1 COLNVLDHVKWLRT-UHFFFAOYSA-N 0.000 description 1
- 150000003009 phosphonic acids Chemical class 0.000 description 1
- 229920000573 polyethylene Polymers 0.000 description 1
- 239000011591 potassium Substances 0.000 description 1
- 229910052700 potassium Inorganic materials 0.000 description 1
- GNSKLFRGEWLPPA-UHFFFAOYSA-M potassium dihydrogen phosphate Chemical compound [K+].OP(O)([O-])=O GNSKLFRGEWLPPA-UHFFFAOYSA-M 0.000 description 1
- 159000000001 potassium salts Chemical class 0.000 description 1
- 229920001592 potato starch Polymers 0.000 description 1
- 238000007781 pre-processing Methods 0.000 description 1
- 239000002244 precipitate Substances 0.000 description 1
- 239000003755 preservative agent Substances 0.000 description 1
- 238000000513 principal component analysis Methods 0.000 description 1
- 230000008569 process Effects 0.000 description 1
- 230000000770 proinflammatory effect Effects 0.000 description 1
- 210000002307 prostate Anatomy 0.000 description 1
- 230000001012 protector Effects 0.000 description 1
- 230000005855 radiation Effects 0.000 description 1
- 238000009790 rate-determining step (RDS) Methods 0.000 description 1
- 102000005962 receptors Human genes 0.000 description 1
- 108020003175 receptors Proteins 0.000 description 1
- 238000006894 reductive elimination reaction Methods 0.000 description 1
- 238000010992 reflux Methods 0.000 description 1
- 230000000241 respiratory effect Effects 0.000 description 1
- 108091008726 retinoic acid receptors α Proteins 0.000 description 1
- 150000004492 retinoid derivatives Chemical class 0.000 description 1
- 229940080817 rotenone Drugs 0.000 description 1
- JUVIOZPCNVVQFO-UHFFFAOYSA-N rotenone Natural products O1C2=C3CC(C(C)=C)OC3=CC=C2C(=O)C2C1COC1=C2C=C(OC)C(OC)=C1 JUVIOZPCNVVQFO-UHFFFAOYSA-N 0.000 description 1
- 238000005070 sampling Methods 0.000 description 1
- HFHDHCJBZVLPGP-UHFFFAOYSA-N schardinger α-dextrin Chemical compound O1C(C(C2O)O)C(CO)OC2OC(C(C2O)O)C(CO)OC2OC(C(C2O)O)C(CO)OC2OC(C(O)C2O)C(CO)OC2OC(C(C2O)O)C(CO)OC2OC2C(O)C(O)C1OC2CO HFHDHCJBZVLPGP-UHFFFAOYSA-N 0.000 description 1
- 101150114996 sdhd gene Proteins 0.000 description 1
- 238000000926 separation method Methods 0.000 description 1
- 230000019491 signal transduction Effects 0.000 description 1
- 201000002859 sleep apnea Diseases 0.000 description 1
- 230000037321 sleepiness Effects 0.000 description 1
- 239000012279 sodium borohydride Substances 0.000 description 1
- 229910000033 sodium borohydride Inorganic materials 0.000 description 1
- 229910000029 sodium carbonate Inorganic materials 0.000 description 1
- 159000000000 sodium salts Chemical class 0.000 description 1
- 108010003524 sodium-bile acid cotransporter Proteins 0.000 description 1
- 239000007787 solid Substances 0.000 description 1
- 238000005063 solubilization Methods 0.000 description 1
- 230000007928 solubilization Effects 0.000 description 1
- 238000011272 standard treatment Methods 0.000 description 1
- 230000037351 starvation Effects 0.000 description 1
- 238000013179 statistical model Methods 0.000 description 1
- 239000008117 stearic acid Substances 0.000 description 1
- 150000003431 steroids Chemical class 0.000 description 1
- 102000028561 sterol response element binding proteins Human genes 0.000 description 1
- 108091009326 sterol response element binding proteins Proteins 0.000 description 1
- 150000003432 sterols Chemical class 0.000 description 1
- 235000003702 sterols Nutrition 0.000 description 1
- 230000000638 stimulation Effects 0.000 description 1
- 210000002784 stomach Anatomy 0.000 description 1
- 239000000758 substrate Substances 0.000 description 1
- KDYFGRWQOYBRFD-UHFFFAOYSA-L succinate(2-) Chemical compound [O-]C(=O)CCC([O-])=O KDYFGRWQOYBRFD-UHFFFAOYSA-L 0.000 description 1
- 235000000346 sugar Nutrition 0.000 description 1
- 239000013595 supernatant sample Substances 0.000 description 1
- 239000004094 surface-active agent Substances 0.000 description 1
- 239000000375 suspending agent Substances 0.000 description 1
- 230000009885 systemic effect Effects 0.000 description 1
- 239000000454 talc Substances 0.000 description 1
- 229910052623 talc Inorganic materials 0.000 description 1
- 235000012222 talc Nutrition 0.000 description 1
- 230000008685 targeting Effects 0.000 description 1
- 235000002906 tartaric acid Nutrition 0.000 description 1
- 239000011975 tartaric acid Substances 0.000 description 1
- 238000002560 therapeutic procedure Methods 0.000 description 1
- 239000005495 thyroid hormone Substances 0.000 description 1
- 229940036555 thyroid hormone Drugs 0.000 description 1
- 230000002110 toxicologic effect Effects 0.000 description 1
- 231100000759 toxicological effect Toxicity 0.000 description 1
- 239000000196 tragacanth Substances 0.000 description 1
- 235000010487 tragacanth Nutrition 0.000 description 1
- 229940116362 tragacanth Drugs 0.000 description 1
- CRDAMVZIKSXKFV-UHFFFAOYSA-N trans-Farnesol Natural products CC(C)=CCCC(C)=CCCC(C)=CCO CRDAMVZIKSXKFV-UHFFFAOYSA-N 0.000 description 1
- 238000013518 transcription Methods 0.000 description 1
- 230000035897 transcription Effects 0.000 description 1
- 239000012096 transfection reagent Substances 0.000 description 1
- 230000009466 transformation Effects 0.000 description 1
- QORWJWZARLRLPR-UHFFFAOYSA-H tricalcium bis(phosphate) Chemical compound [Ca+2].[Ca+2].[Ca+2].[O-]P([O-])([O-])=O.[O-]P([O-])([O-])=O QORWJWZARLRLPR-UHFFFAOYSA-H 0.000 description 1
- 238000003211 trypan blue cell staining Methods 0.000 description 1
- 238000002495 two-dimensional nuclear magnetic resonance spectrum Methods 0.000 description 1
- OUYCCCASQSFEME-UHFFFAOYSA-N tyrosine Natural products OC(=O)C(N)CC1=CC=C(O)C=C1 OUYCCCASQSFEME-UHFFFAOYSA-N 0.000 description 1
- 238000001946 ultra-performance liquid chromatography-mass spectrometry Methods 0.000 description 1
- 238000002604 ultrasonography Methods 0.000 description 1
- 230000002485 urinary effect Effects 0.000 description 1
- 239000011782 vitamin Substances 0.000 description 1
- 229930003231 vitamin Natural products 0.000 description 1
- 229940088594 vitamin Drugs 0.000 description 1
- 235000013343 vitamin Nutrition 0.000 description 1
- 238000010626 work up procedure Methods 0.000 description 1
- XOOUIPVCVHRTMJ-UHFFFAOYSA-L zinc stearate Chemical compound [Zn+2].CCCCCCCCCCCCCCCCCC([O-])=O.CCCCCCCCCCCCCCCCCC([O-])=O XOOUIPVCVHRTMJ-UHFFFAOYSA-L 0.000 description 1
Images
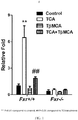


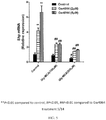
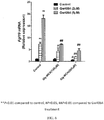
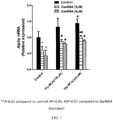
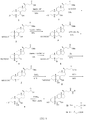
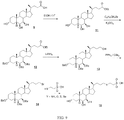
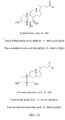
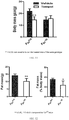

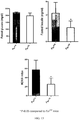
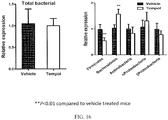


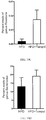
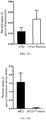


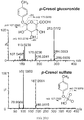


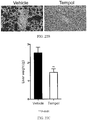

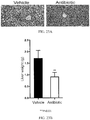
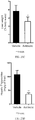


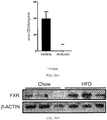
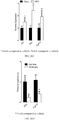

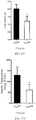

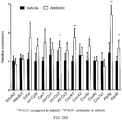
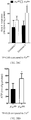
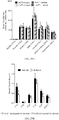
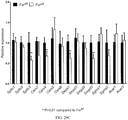

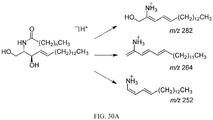
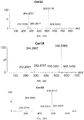

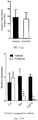


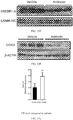
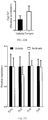


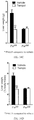
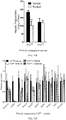


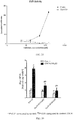


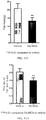


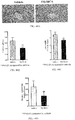
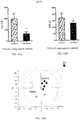
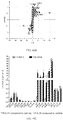


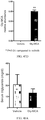


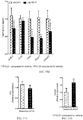
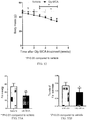
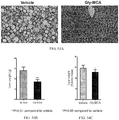

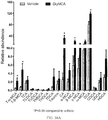
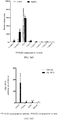
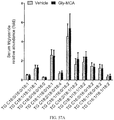

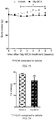


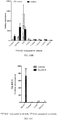
Classifications
-
- C—CHEMISTRY; METALLURGY
- C07—ORGANIC CHEMISTRY
- C07J—STEROIDS
- C07J41/00—Normal steroids containing one or more nitrogen atoms not belonging to a hetero ring
- C07J41/0033—Normal steroids containing one or more nitrogen atoms not belonging to a hetero ring not covered by C07J41/0005
- C07J41/0055—Normal steroids containing one or more nitrogen atoms not belonging to a hetero ring not covered by C07J41/0005 the 17-beta position being substituted by an uninterrupted chain of at least three carbon atoms which may or may not be branched, e.g. cholane or cholestane derivatives, optionally cyclised, e.g. 17-beta-phenyl or 17-beta-furyl derivatives
- C07J41/0061—Normal steroids containing one or more nitrogen atoms not belonging to a hetero ring not covered by C07J41/0005 the 17-beta position being substituted by an uninterrupted chain of at least three carbon atoms which may or may not be branched, e.g. cholane or cholestane derivatives, optionally cyclised, e.g. 17-beta-phenyl or 17-beta-furyl derivatives one of the carbon atoms being part of an amide group
-
- A—HUMAN NECESSITIES
- A61—MEDICAL OR VETERINARY SCIENCE; HYGIENE
- A61P—SPECIFIC THERAPEUTIC ACTIVITY OF CHEMICAL COMPOUNDS OR MEDICINAL PREPARATIONS
- A61P1/00—Drugs for disorders of the alimentary tract or the digestive system
- A61P1/16—Drugs for disorders of the alimentary tract or the digestive system for liver or gallbladder disorders, e.g. hepatoprotective agents, cholagogues, litholytics
-
- A—HUMAN NECESSITIES
- A61—MEDICAL OR VETERINARY SCIENCE; HYGIENE
- A61P—SPECIFIC THERAPEUTIC ACTIVITY OF CHEMICAL COMPOUNDS OR MEDICINAL PREPARATIONS
- A61P3/00—Drugs for disorders of the metabolism
- A61P3/04—Anorexiants; Antiobesity agents
-
- A—HUMAN NECESSITIES
- A61—MEDICAL OR VETERINARY SCIENCE; HYGIENE
- A61P—SPECIFIC THERAPEUTIC ACTIVITY OF CHEMICAL COMPOUNDS OR MEDICINAL PREPARATIONS
- A61P3/00—Drugs for disorders of the metabolism
- A61P3/06—Antihyperlipidemics
-
- A—HUMAN NECESSITIES
- A61—MEDICAL OR VETERINARY SCIENCE; HYGIENE
- A61P—SPECIFIC THERAPEUTIC ACTIVITY OF CHEMICAL COMPOUNDS OR MEDICINAL PREPARATIONS
- A61P3/00—Drugs for disorders of the metabolism
- A61P3/08—Drugs for disorders of the metabolism for glucose homeostasis
- A61P3/10—Drugs for disorders of the metabolism for glucose homeostasis for hyperglycaemia, e.g. antidiabetics
-
- A—HUMAN NECESSITIES
- A61—MEDICAL OR VETERINARY SCIENCE; HYGIENE
- A61P—SPECIFIC THERAPEUTIC ACTIVITY OF CHEMICAL COMPOUNDS OR MEDICINAL PREPARATIONS
- A61P43/00—Drugs for specific purposes, not provided for in groups A61P1/00-A61P41/00
-
- A—HUMAN NECESSITIES
- A61—MEDICAL OR VETERINARY SCIENCE; HYGIENE
- A61P—SPECIFIC THERAPEUTIC ACTIVITY OF CHEMICAL COMPOUNDS OR MEDICINAL PREPARATIONS
- A61P5/00—Drugs for disorders of the endocrine system
- A61P5/48—Drugs for disorders of the endocrine system of the pancreatic hormones
- A61P5/50—Drugs for disorders of the endocrine system of the pancreatic hormones for increasing or potentiating the activity of insulin
-
- C—CHEMISTRY; METALLURGY
- C07—ORGANIC CHEMISTRY
- C07J—STEROIDS
- C07J31/00—Normal steroids containing one or more sulfur atoms not belonging to a hetero ring
- C07J31/006—Normal steroids containing one or more sulfur atoms not belonging to a hetero ring not covered by C07J31/003
-
- C—CHEMISTRY; METALLURGY
- C07—ORGANIC CHEMISTRY
- C07J—STEROIDS
- C07J41/00—Normal steroids containing one or more nitrogen atoms not belonging to a hetero ring
- C07J41/0033—Normal steroids containing one or more nitrogen atoms not belonging to a hetero ring not covered by C07J41/0005
- C07J41/0055—Normal steroids containing one or more nitrogen atoms not belonging to a hetero ring not covered by C07J41/0005 the 17-beta position being substituted by an uninterrupted chain of at least three carbon atoms which may or may not be branched, e.g. cholane or cholestane derivatives, optionally cyclised, e.g. 17-beta-phenyl or 17-beta-furyl derivatives
-
- C—CHEMISTRY; METALLURGY
- C07—ORGANIC CHEMISTRY
- C07J—STEROIDS
- C07J41/00—Normal steroids containing one or more nitrogen atoms not belonging to a hetero ring
- C07J41/0033—Normal steroids containing one or more nitrogen atoms not belonging to a hetero ring not covered by C07J41/0005
- C07J41/0066—Normal steroids containing one or more nitrogen atoms not belonging to a hetero ring not covered by C07J41/0005 the 17-beta position being substituted by a carbon atom forming part of an amide group
-
- C—CHEMISTRY; METALLURGY
- C07—ORGANIC CHEMISTRY
- C07J—STEROIDS
- C07J9/00—Normal steroids containing carbon, hydrogen, halogen or oxygen substituted in position 17 beta by a chain of more than two carbon atoms, e.g. cholane, cholestane, coprostane
- C07J9/005—Normal steroids containing carbon, hydrogen, halogen or oxygen substituted in position 17 beta by a chain of more than two carbon atoms, e.g. cholane, cholestane, coprostane containing a carboxylic function directly attached or attached by a chain containing only carbon atoms to the cyclopenta[a]hydrophenanthrene skeleton
Definitions
- Obesity has reached epidemic proportions worldwide and is associated with chronic diseases such as type 2 diabetes mellitus, cardiovascular diseases, hepatosteatosis, and cancer. Obesity develops as a result of energy intake that exceeds energy expenditure, leading to a net storage of excess calories in the form of fat in adipose tissue. Obesity is metabolically linked with type 2 diabetes (insulin resistance) and hepatosteatosis, the latter of which can lead to steatohepatitis, hepatocarcinogenesis and liver failure. Thus, a pharmaceutical approach that suppresses appetite, blocks dietary fat absorption, induces fat mobilization, or increases metabolism would be ideal in the treatment of obesity and related metabolic disorders.
- Farnesoid X Receptor is an orphan nuclear receptor initially identified from a rat liver cDNA library ( Forman, et al., Cell 81:687-693,1995 ) that is most closely related to the insect ecdysone receptor.
- FXR is a member of the nuclear receptor superfamily of transcription factors that includes receptors for the steroid, retinoid, and thyroid hormones ( Mangelsdorf, et al., Cell 83:841-850,1995 ).
- Northern blotting and in situ hybridization analysis showed that FXR is most abundantly expressed in the liver, intestine, kidney, and adrenal ( B.M.
- FXR is a ligand-activated nuclear receptor that binds to DNA as a heterodimer with the retinoic acid receptor ⁇ (RXR ⁇ ) that is activated by the vitamin A derivative 9-cis retinoic acid.
- the FXR/RXR ⁇ heterodimer preferentially binds to response elements composed of two nuclear receptor half sites of the consensus AG(G/T)TCA organized as an inverted repeat and separated by a single nucleotide (IR-1 motif) ( Forman, et al., Cell 81:687-693,1995 ).
- IR-1 motif single nucleotide
- An early report showed that rat FXR is activated by micromolar concentrations of farnesoids such as farnesol and juvenile hormone thus accounting for the original name ( Forman, et al., Cell 81:687-693, 1995 ).
- these compounds were weak ligands and also failed to activate the corresponding mouse and human FXR, leaving the nature of the endogenous FXR ligand in doubt.
- bile acids that serve as FXR ligands include chenodeoxycholic acid (CDCA), deoxycholic acid (DCA), lithocholic acid (LCA), and the taurine and glycine conjugates of these bile acids.
- Bile acids are cholesterol metabolites that are formed in the liver and secreted into the duodenum of the intestine, where they have important roles in the solubilization and absorption of dietary lipids and vitamins. About 95% of bile acids are subsequently reabsorbed in the ileum and returned to the liver via the enterohepatic circulatory system. The conversion of cholesterol to bile acids in the liver is under feedback regulation, and bile acids down-regulate transcription of cytochrome P450 7A1 (CYP7A1), which encodes the enzyme that catalyzes the rate-limiting step in bile acid biosynthesis.
- CYP7A1 cytochrome P450 7A1
- FXR is involved in the repression of CYP7A1 expression by bile acids through an indirect mechanism involving the FXR target gene small heterodimer partner (SHP) and liver receptor homolog 1 ( Goodwin et al., Mol. Cell 6:517-528, 2000 ; reviewed in Matsubara et al., Mol. Cell. Endocrinol. 368:17-29, 2013 ).
- SHP small heterodimer partner
- liver receptor homolog 1 liver receptor homolog 1
- bile acids induce the expression of the intestinal bile acid binding protein (IBABP), a cytoplasmic protein which binds bile acids with high affinity and may be involved in their cellular uptake and trafficking.
- IBABP intestinal bile acid binding protein
- FXR bile acid receptor binds to an IR-1 type response element that is conserved in the human, rat, and mouse IBABP gene promoters.
- FXR is involved in both the stimulation (IBABP) and the repression (CYP7A1) of target genes involved in bile acid and cholesterol homeostasis.
- FXR also induces expression of the bile salt export pump (BSEP, ABC11) that transports unconjugated and conjugated bile acids/salts from hepatocyte into the bile (reviewed in Matsubara et al., Mol. Cell. Endocrinol. 368:17-29, 2013 ).
- Tempol (4-hydroxy-2,2,6,6,-tetramethylpiperidine-1-oxyl), an antioxidant and a radiation protector, was reported to prevent obesity in mice ( Mitchell et al., Free Radic. Biol Med. 34: 93-102, 2003 ).
- Previous studies demonstrated that the alteration of the gut microbiome can affect the level of bile acids in liver, heart, and kidney ( Swann et al., Proc. Natl. Acad. Sci.
- Trisubstituted-pyrazol carboxamide analogs have been synthesized that are FXR antagonist, but their effect on metabolism and physiology were not investigated ( Yu et al., Bioorg. Med. Chem. 2919-2938, 2014 ).
- Non-alcoholic fatty liver disease is characterized by massive ectopic triglyceride (TG) accumulation in the liver in the absence of other liver disease or significant alcohol consumption (see et al., Dtsch. Arteb.l Int. 2014; 111:447-452, 2014 ).
- TG massive ectopic triglyceride
- NAFLD is the most common liver disorder affecting 20-30% of the adult population and more than 80% of obese people in the world. NAFLD can develop into nonalcoholic steatohepatitis (NASH), fibrosis, cirrhosis and even hepatocellular carcinoma ( Browning et al., J. Clin Invest. 114:147-152, 2004 ).
- NAFLD is tightly associated with obesity, insulin resistance/type 2 diabetes, and coronary heart disease and atherosclerosis ( Bhatia et al., Eur. Heart J. 33:1190-1200, 2012 ).
- the underlying molecular mechanism of NAFLD development remains largely unknown and the identification of novel targets for NAFLD therapy is of high priority.
- the present invention provides a compound represented by the structure illustrated in claim 1, or a pharmaceutically acceptable salt thereof, for use in treating or preventing a disease or disorder selected from obesity, insulin resistance, and non alcoholic fatty liver disease in a mammal in need thereof.
- the present invention provides a compound represented by the structure illustrated in claim 1, or a pharmaceutically acceptable salt thereof, for use in treating or preventing a disease or disorder selected from obesity, insulin resistance, and non alcoholic fatty liver disease in a mammal in need thereof.
- the compound for use in the treatment or prevention of obesity, insulin resistance or non-alcoholic fatty liver disease is
- phrases "pharmaceutically acceptable salt” is intended to include nontoxic salts synthesized from the parent compound which contains a basic or acidic moiety by conventional chemical methods. Generally, such salts can be prepared by reacting the free acid or base forms of these compounds with a stoichiometric amount of the appropriate base or acid in water or in an organic solvent, or in a mixture of the two. Generally, nonaqueous media such as ether, ethyl acetate, ethanol, isopropanol, or acetonitrile are preferred. Lists of suitable salts are found in Remington's Pharmaceutical Sciences, 18th ed., Mack Publishing Company, Easton, PA, 1990, p. 1445 , and Journal of Pharmaceutical Science, 66, 2-19 (1977 ).
- Suitable bases include inorganic bases such as alkali and alkaline earth metal bases, e.g., those containing metallic cations such as sodium, potassium, magnesium, calcium and the like.
- suitable bases include sodium hydroxide, potassium hydroxide, sodium carbonate, and potassium carbonate.
- Suitable acids include inorganic acids such as hydrochloric acid, hydrobromic acid, hydroiodic acid, sulfuric acid, phosphoric acid, and the like, and organic acids such as p-toluenesulfonic, methanesulfonic acid, benzenesulfonic acid, oxalic acid, p-bromophenylsulfonic acid, carbonic acid, succinic acid, citric acid, benzoic acid, acetic acid, maleic acid, tartaric acid, fatty acids, long chain fatty acids, and the like.
- Preferred pharmaceutically acceptable salts of the compound for use according to claim 1 having an acidic moiety include sodium and potassium salts.
- the compound for use according to the present invention containing an acidic moiety is useful in the form of the free acid or in the form of a pharmaceutically acceptable salt thereof.
- any salt of this invention is usually not of a critical nature, so long as the salt as a whole is pharmacologically acceptable and as long as the counterion does not contribute undesired qualities to the salt as a whole.
- solvates refers to a molecular complex wherein the solvent molecule, such as the crystallizing solvent, is incorporated into the crystal lattice.
- the solvent incorporated in the solvate is water, the molecular complex is called a hydrate.
- Pharmaceutically acceptable solvates include hydrates, alcoholates such as methanolates and ethanolates, acetonitrilates and the like. These compounds can also exist in polymorphic forms.
- the present disclosure is further directed to a pharmaceutical composition
- a pharmaceutical composition comprising a pharmaceutically acceptable carrier and at least one compound or salt described herein.
- the pharmaceutically acceptable carrier be one that is chemically inert to the active compounds and one that has no detrimental side effects or toxicity under the conditions of use.
- the choice of carrier will be determined in part by the particular compound of the present disclosure chosen, as well as by the particular method used to administer the composition. Accordingly, there is a wide variety of suitable formulations of the pharmaceutical composition of the present disclosure. In certain embodiments, the formulation is suitable for administration to the alimentary tract, and in particular, to the small intestine.
- Formulations suitable for oral administration can consist of (a) liquid solutions, such as a therapeutically effective amount of the inventive compound dissolved in diluents, such as water, saline, or orange juice, (b) capsules, sachets, tablets, lozenges, and troches, each containing a predetermined amount of the active ingredient, as solids or granules, (c) powders, (d) suspensions in an appropriate liquid, and (e) suitable emulsions.
- Liquid formulations may include diluents, such as water and alcohols, for example, ethanol, benzyl alcohol, and the polyethylene alcohols, either with or without the addition of a pharmaceutically acceptable surfactant, suspending agent, or emulsifying agent.
- Capsule forms can be of the ordinary hard- or soft-shelled gelatin type containing, for example, surfactants, lubricants, and inert fillers, such as lactose, sucrose, calcium phosphate, and corn starch.
- Tablet forms can include one or more of lactose, sucrose, mannitol, corn starch, potato starch, alginic acid, microcrystalline cellulose, acacia, gelatin, guar gum, colloidal silicon dioxide, croscarmellose sodium, talc, magnesium stearate, calcium stearate, zinc stearate, stearic acid, and other excipients, colorants, diluents, buffering agents, disintegrating agents, moistening agents, preservatives, flavoring agents, and pharmacologically compatible excipients.
- Lozenge forms can comprise the active ingredient in a flavor, usually sucrose and acacia or tragacanth, as well as pastilles comprising the active ingredient in an inert base, such as gelatin and glycerin, or sucrose and acacia, emulsions, gels, and the like containing, in addition to the active ingredient, such excipients as are known in the art.
- a flavor usually sucrose and acacia or tragacanth
- pastilles comprising the active ingredient in an inert base, such as gelatin and glycerin, or sucrose and acacia, emulsions, gels, and the like containing, in addition to the active ingredient, such excipients as are known in the art.
- the formulation can be suitable to prolonging the amount of time that the compound of the present disclosure is contacted with the alimentary tract of the mammal, and in particular with the small intestine of the mammal.
- various formulations such as extended release formulation and formulations designed to prolong the amount of time that the compound is retained in the stomach before release into the small intestine can be utilized.
- a number of suitable formulations are presented in Remington: The Science and Practice of Pharmacy, Gennaro, A.R., ed., pp. 858-929, Lippincott Williams and Wilkins (2000 ).
- the compound or salt for use according to the present invention can be administered in the form of a food additive, that is, in admixture with foodstuffs or beverages.
- a food additive the compound or salt can be mixed with a foodstuff or beverage per se , or can be formulated as a composition comprising one or more suitable excipients prior to mixing with a foodstuff or beverage.
- the foodstuff or beverage can be any suitable foodstuff or beverage.
- the foodstuff or beverage has a relatively high fat content.
- the compound or salt for use according to the present invention may be formulated as inclusion complexes, such as cyclodextrin inclusion complexes, or liposomes.
- inclusion complexes such as cyclodextrin inclusion complexes, or liposomes.
- Liposomes serve to target the compounds to a particular tissue, such as lymphoid tissue or cancerous hepatic cells. Liposomes can also be used to increase the half-life of the inventive compound.
- Liposomes useful in the present invention include emulsions, foams, micelles, insoluble monolayers, liquid crystals, phospholipid dispersions, lamellar layers and the like.
- the active agent to be delivered is incorporated as part of a liposome, alone or in conjunction with a suitable chemotherapeutic agent.
- liposomes filled with the compound for use according to the invention or salt thereof can be directed to the site of a specific tissue type, hepatic cells, for example, where the liposomes then deliver the selected compositions.
- Liposomes for use in the invention are formed from standard vesicle-forming lipids, which generally include neutral and negatively charged phospholipids and a sterol, such as cholesterol. The selection of lipids is generally guided by consideration of, for example, liposome size and stability of the liposomes in the blood stream.
- a ligand to be incorporated into the liposome can include, for example, antibodies or fragments thereof specific for cell surface determinants of the targeted tissue type.
- a liposome suspension containing a compound or salt of the present invention may be administered intravenously, locally, topically, etc. in a dose that varies according to the mode of administration, the agent being delivered, and the stage of disease being treated.
- the pharmaceutical composition can be administered parenterally, e.g., intravenously, subcutaneously, intradermally, or intramuscularly.
- parenteral administration e.g., intravenously, subcutaneously, intradermally, or intramuscularly.
- compositions for parenteral administration that comprise a solution or suspension of the compound or salt for use according to the invention dissolved or suspended in an acceptable carrier suitable for parenteral administration, including aqueous and non-aqueous isotonic sterile injection solutions. Many such compositions are known in the art.
- the disclosure provides a method of inhibiting a farnesoid X receptor in a mammal in need thereof, which method comprises administering to the mammal an effective amount of a compound for use according to the invention.
- the animal is a mammal. More preferably, the mammal is a human.
- the term "mammal” includes, but is not limited to, the order Rodentia, such as mice, and the order Logomorpha, such as rabbits. It is preferred that the mammals are from the order Carnivora, including Felines (cats) and Canines (dogs). It is more preferred that the mammals are from the order Artiodactyla, including Bovines (cows) and Swines (pigs) or of the order Perssodactyla, including Equines (horses). It is most preferred that the mammals are of the order Primates, Ceboids, or Simioids (monkeys) or of the order Anthropoids (humans and apes). An especially preferred mammal is the human.
- the FXR mediated disease to be treated is chosen from obesity, insulin resistance and non-alcoholic fatty liver disease.
- the invention provides a compound for use in treating or preventing obesity in a mammal in need thereof, comprising administering to the mammal an effective amount of a compound or salt of the invention.
- obesity can be considered as a condition in which excess body fat may put a person at health risk (see Barlow and Dietz, Pediatrics 102: E29, 1998 ; National Institutes of Health, Obes. Res. 6 (suppl. 2):51S-209S, 1998 ). Excess body fat is a result of an imbalance of energy intake and energy expenditure.
- the Body Mass Index (BMI) is used to assess obesity.
- BMI Body Mass Index
- a BMI of 25.0 kg/m to 29.9 kg/m 2 is overweight (also called grade I obesity), while a BMI of 30 kg/m 2 is truly obese (also called grade II obesity).
- waist circumference is used to assess obesity.
- a waist circumference of 102 cm or more is considered obese, while in women a waist circumference of 89 cm or more is considered obese.
- Strong evidence shows that obesity affects both the morbidity and mortality of individuals.
- an obese individual is at increased risk for heart disease, non-insulin dependent (type 2) diabetes, hypertension, stroke, cancer ( e.g . endometrial, breast, prostate, and colon cancer), dyslipidemia, gall bladder disease, sleep apnea, reduced fertility, and osteoarthritis, amongst others (see Lyznicki et al., Am. Fam. Phys. 63:2185, 2001 ).
- the dose administered to a mammal, particularly, a human, in accordance with the present disclosure should be sufficient to effect the desired response.
- Such responses include reversal or prevention of the undesirable effects of the disease or disorder mediated by the farnesoid X receptor expressed in the intestine for which treatment is desired or to elicit the desired benefit.
- the disorder is non-alcoholic fatty liver disease, obesity and type 2 diabetes (insulin resistance).
- insulin resistance insulin resistance
- the size of the dose will also be determined by the route, timing and frequency of administration as well as the existence, nature, and extent of any adverse side-effects that might accompany the administration of a particular compound and the desired physiological effect. It will be appreciated by one of skill in the art that successful treatment of non-alcoholic fatty liver disease, obesity or type 2 diabetes (insulin resistance) may require prolonged treatment involving multiple administrations.
- treatment of NAFLD via inhibition of the intestinal farnesoid X receptor can be regarded as a reduction in the clinical manifestations of hepatic steatosis in a mammal. While in many cases NAFLD does not cause signs or symptoms, NAFLD may cause fatigue, pain, particularly in the upper right abdomen, and weight loss. In some instances, NAFLD may progress to nonalcoholic steatohepatitis, an inflammation in the liver. NAFLD may progress to nonalcoholic fatty liver disease-associated cirrhosis which is a scarring of the liver accompanied by markedly decreased liver function. Over time, scarring can become so severe that the liver no longer functions adequately.
- NAFLD can be assessed, for example, by ultrasound, computed tomography, magnetic resonance studies, or by liver biopsy.
- the mammal is consuming a high fat diet.
- a high fat diet can be considered as one that provides more than 30% of energy as fat (see, for example, Churchill Livingstone's Dictionary of Sport and Exercise Science and Medicine, S. Jennett, Elsevier Limited, 2008 ).
- the disclosure provides a method of preventing non-alcoholic fatty liver disease in a mammal. Preventing non-alcoholic fatty liver disease can be regarded as reducing an expected manifestation of hepatic steatosis in a mammal that is subjected to a dietary change from a low fat or intermediate fat diet to a high fat diet.
- treatment of obesity via inhibition of the farnesoid X receptor can be regarded as a reduction in the rate of weight gain in a mammal.
- the mammal is consuming a high fat diet.
- a high fat diet can be consider as one which provides more than 30% of energy as fat (see, for example, Churchill Livingstone's Dictionary of Sport and Exercise Science and Medicine, S. Jennett, Elsevier Limited, 2008 ).
- the disclosure provides a method of preventing obesity in a mammal. Preventing obesity can be regarded as reducing an expected weight gain in a normal weight mammal that is subjected to a dietary change from a low fat or intermediate fat diet to a high fat diet.
- treatment of diabetes via inhibition of the farnesoid X receptor can be regarded as a reduction of insulin resistance in a patient afflicted therewith.
- Insulin resistance can result in hyperglycemia, and a reduction in insulin resistance can result in a lowering of blood glucose levels.
- Non-limiting examples of symptoms that be treated via inhibition of the farnesoid X receptor include brain fogginess and inability to focus, high blood sugar, intestinal bloating, sleepiness, weight gain, fat storage, difficulty losing weight, increased blood triglyceride levels, increased blood pressure, increased pro-inflammatory cytokines associated with cardiovascular disease, depression, acanthosis nigricans, and increased hunger.
- the dose administered to a mammal, particularly, a human, in accordance with the present disclosure should be sufficient to effect the desired response.
- Such responses include reversal or prevention of the bad effects of the disease or disorder mediated by the farnesoid X receptor for which treatment is desired or to elicit the desired benefit.
- the disorder is obesity.
- dosage will depend upon a variety of factors, including the age, condition, and body weight of the human, as well as the extent of the obesity in the human.
- the size of the dose will also be determined by the route, timing and frequency of administration as well as the existence, nature, and extent of any adverse side-effects that might accompany the administration of a particular compound and the desired physiological effect. It will be appreciated by one of skill in the art that successful treatment of obesity or other disease or disorder may require prolonged treatment involving multiple administrations.
- treatment of obesity via inhibition of the farnesoid X receptor can be regarded as a reduction in the rate of weight gain in a mammal.
- the mammal is consuming a high fat diet.
- a high fat diet can be consider as one which provides more than 30% of energy as fat (see, for example, Churchill Livingstone's Dictionary of Sport and Exercise Science and Medicine, S. Jennett, Elsevier Limited (2008 )).
- the disclosure provides a method of preventing obesity in a mammal. Preventing obesity can be regarded as reducing an expected weight gain in a normal weight mammal that is subjected to a dietary change from a low fat or intermediate fat diet to a high fat diet.
- Suitable doses and dosage regimens can be determined by conventional range-finding techniques known to those of ordinary skill in the art. Generally, treatment is initiated with smaller dosages that are less than the optimum dose of the compound. Thereafter, the dosage is increased by small increments until the optimum effect under the circumstances is reached.
- the present method typically will involve the administration of about 0.1 to about 300 mg (e.g., about 0.1 to about 150 mg, about 0.1 to about 100 mg, or about 0.1 to about 50 mg) of one or more of the compounds described above per kg body weight of the mammal.
- the therapeutically effective amount of the compound or compounds administered can vary depending upon the desired effects and the factors noted above. Typically, dosages will be between 0.01 mg/kg and 250 mg/kg of the subject's body weight, and more typically between about 0.05 mg/kg and 100 mg/kg, such as from about 0.2 to about 80 mg/kg, from about 5 to about 40 mg/kg or from about 10 to about 30 mg/kg of the subject's body weight.
- unit dosage forms can be formulated based upon the suitable ranges recited above and the subject's body weight.
- the term "unit dosage form" as used herein refers to a physically discrete unit of therapeutic agent appropriate for the subject to be treated.
- dosages are calculated based on body surface area and from about 1 mg/m 2 to about 200 mg/m 2 , such as from about 5 mg/m 2 to about 100 mg/m 2 will be administered to the subject per day.
- administration of the therapeutically effective amount of the compound or compounds involves administering to the subject from about 5 mg/m 2 to about 50 mg/m 2 , such as from about 10 mg/m 2 to about 40 mg/m 2 per day. It is currently believed that a single dosage of the compound or compounds is suitable, however a therapeutically effective dosage can be supplied over an extended period of time or in multiple doses per day.
- unit dosage forms also can be calculated using a subject's body surface area based on the suitable ranges recited above and the desired dosing schedule.
- farnesoid X receptor is implicated in the development of obesity.
- administration of inhibitors of farnesoid X receptor is expected to treat or prevent the development of obesity, particularly in a mammal consuming a high fat diet.
- intestinal farnesoid X receptor plays an essential role in the progression of NAFLD.
- Inhibition of intestinal farnesoid X receptor in embodiments of the disclosure has been shown to ameliorate NAFLD induced by a high fat diet.
- Gly-MCA glycine ⁇ -muricholic acid
- ⁇ -Muricholic acid 9 and conjugates thereof such as the representative embodiments of tauro- ⁇ -Muricholic acid 10 and glycine-P-Muricholic acid 16 can be prepared as illustrated in the scheme set forth in Figure 8 .
- Esterification of the dihydroxy acid 1 with, for example, methanol under acid catalysis provides ester 2 . Protection of the A-ring hydroxyl group with ethyl chloroformate provides carbonate 3 . Oxidation of the 7-hydroxyl group with, for example potassium chromate gives ketone 4 . Bromination with, for example, bromine in HBr gives bromo ketone 5 . Reduction of the ketone with, for example, gives bromo alcohol 6 .
- Reductive elimination of bromine using, for example, zinc metal provides olefin 7 .
- Cis-dihydroxylation with, for example, osmium tetroxide gives cis diol 8 .
- Hydrolysis of both esters provides ⁇ -muricholic acid 9 .
- ⁇ -muricholic acid 9 can be conjugated with taurine using a suitable coupling agent provides tauro- ⁇ -muricholic acid 10 .
- Glycine can be substituted for taurine to provide the glycine conjugate of ⁇ -muricholic acid ( 16 ).
- 2-aminoethylphosphonic acid can be substituted for taurine to provide the phosphonic acid analog of tauro- ⁇ -muricholic acid.
- the PGL4-Shp-TK firefly luciferase construct and human Fxr expression plasmid were provided by Grace L. Guo of Rutgers University.
- the human Asbt expression plasmid was provided by Paul A. Dawson of Wake Forest University School of Medicine.
- the plasmids were transfected into cells using X-TREMEGENETM HP DNA Transfection Reagent (Roche). The cells were lysed, and luciferase activities measured with a DUAL-LUCIFERASETM assay kit (Promega). Firefly luciferase activity was normalized to Remilla luciferase activity.
- ATP detection was performed using the following protocol.
- 10 mg of ileum mucosa were homogenized with 1.0 mL of ice-cold TE saturated phenol (Sigma-Aldrich).
- a mixture of 200 ⁇ L of chloroform and 150 ⁇ L of deionized water were added and the homogenate thoroughly shaken for 20 s and centrifuged at 10,000 g for 5 min at 4° C.
- the aliquot from the supernatant was diluted 100-fold with deionized water, and 10 ⁇ L of the diluted extract was measured by ATP determination kit (Invitrogen Corp.) ( Chida et al., Analytica Chimica Acta 727: 8-12 (2012 ).
- Tempol, bacitracin, neomycin, and streptomycin were purchased from Sigma-Aldrich (St. Louis, MO). Bile acids were ordered from Steraloids, Inc. (Newport, RI) and Sigma (St. Louis, MO), and taurocholic acid-d5 sodium salt was from Toronto Research Chemicals Inc. (Toronto, Ontario). Ceramides were obtained from Avanti Polar Lipids. HFD (60kcal% fat) were purchased from Bio-Serv (Frenchtown, NJ). T- ⁇ -MCA and Gly-MCA were synthesized as according to the scheme shown in Figure 41 and described in Example 1. All solvents and organic reagents were of the highest grade available.
- High-fat diet (60% kcal consisting of fat) was purchased from Bioserv. Inc.
- Fxr fl/fl and Fxr ⁇ IE Kim et al., J. Lipid Res. 48:2664-2672, 2007 ) mice were backcrossed with C57BL/6N mice for over 10 generations.
- mice Male C57BL/6N mice from 6 weeks of age were fed a HFD and treated with the antibiotics (0.1% of each compound of bacitracin, neomycin, and streptomycin combination) for 3days.
- Vehicle saline
- TCA 400mg/kg body weight, dissolved in saline
- T ⁇ MCA 400 mg/kg body weight of each compound, dissolved in saline
- mice were orally administered to the mice and followed by a second dose 12 h later. The mice were killed 2 h later for tissue collection.
- Gly-MCA was custom synthesized.
- mice fed a high-fat diet for 12 weeks were administered (0.25 mg Gly-MCA/pill, dose of 5 mg/kg).
- Leptin-deficient db / db mice, 6- to 8-weeks-old, fed a chow diet were administered Gly-MCA (0.25 mg/pill/day, 10 mg/kg).
- Mice were housed individually in their home cages. Cumulative food intake and TEE bal were measured for 1 week in vehicle and Gly-MCA-treated mice from 6 to 7 weeks of HFD. TEE bal was measured as previously described ( Ravussin et al., Int. J. Obesity 37:399-403, 2013 ).
- hepatocytes from 6-week-old C57BL/6N mice were obtained by collagenase 1 (Invitrogen, Carlsbad, CA) perfusion. The cells were purified by 45% Percoll (Sigma, St. Louis, MO) density centrifugation and cultured in DMEM (Invitrogen, Carlsbad, CA) with 10% fetal bovine serum and 1% Insulin-Transferrin-Selenium-Ethanolamine (ITS - X) (Invitrogen, Carlsbad, CA). The viability of hepatocytes was determined using trypan blue dye exclusion, and those with higher than 85% viability were used. The medium was changed to DMEM with 1% fetal bovine serum after culturing for 4 hours. After starvation for 4 hours, the cells were exposed to ceramide. At the prescribed time points, cells were harvested and subjected to qPCR analysis and TG content detection.
- Liver whole-cell or nuclear extracts were prepared. Membranes were incubated with antibodies against FXR (Santa Cruz Biotechnology, Inc., Santa Cruz, CA), SREBP1 (BD Biosciences, San Jose, CA), and CIDEA (Abcam, Cambridge, MA). The signals obtained were normalized to ⁇ -ACTIN (Abcam) for whole cell extract and LAMIN A/C (Santa Cruz) for nuclear extracts.
- the bacteria in feces and cecum content were extracted using PowerSoil DNA Isolation Kit (Mo Bio laboratory, Inc., Carlsbad, CA).
- the PCR products (approximately 1000 bps) were purified using the Agencourt AMPure technology (Beckman Coulter, Brea, CA) as described in 454 Technical Bulletin #2011-002, Short Fragment Removal Procedure. After purification, the products were quantified by both Qubit (Lifetech, Carlsbad, CA) and qPCR, using the KAPA Biosystems Library Quantification Kit (KapaBiosystems, Woburn, MA), pooled based on molar amounts, run on a 1% agarose gel and extracted.
- each sample contained on average 11 thousand reads.
- the Mothur software package was used to preprocess the sequencing data and the RDP multi-classifier to assign each sequence to a taxonomic rank. Preprocessing consisted of filtering reads for an average quality of 20, removing duplicated sequences and splitting into samples by barcodes while allowing for one mismatch in the barcode. To account for differences in total reads per sample, classifications were converted to percent of total reads. This approach then permitted accurate comparisons within and between groups.
- Lipidomics analysis For serum lipidomics analysis 25 ⁇ l serum were extracted by 4-fold cold chloroform: methanol (2:1) solution containing 2 ⁇ M LPC (17:0), PC (17:0), SM (17:0) and CER (17:0) (Avanti Polar Lipids, Alabaster, AL) as internal standards. The samples were vortexed for 30 s and then allowed to stand for 5 min at room temperature. The mixture was centrifuged at 13,000 rpm for 5 min and then the lower organic phase was collected and evaporated at room temperature under vacuum.
- urine samples were prepared by adding 20 ⁇ L of urine to 180 ⁇ L 50% aqueous acetonitrile (50:50 water/acetonitrile). Samples were vortexed for 5 min and centrifuged at 18000 ⁇ g for 20 min at 4° C to remove particulates and precipitated protein. The supernatant was transferred to an autosampler vial for analysis. 50 mg tissue samples were homogenized in 500 mL 50% aqueous acetonitrile containing 5 ⁇ M of chlorpropamide (internal standard). The samples were vortexed and centrifuged at 13,000 rpm for 20 min at 4° C to remove particulates and precipitate protein.
- the supernatant was transferred to an autosampler vial for analysis.
- a 5 ⁇ l aliquot of supernatant samples was injected into the UPLC-ESI-QTOFMS system (Waters, Milford, MA) with a Waters Acquity BEH 1.7um C18 (2.1x50mm) column.
- the gradient mobile phase comprises 0.1% formic acid in water (A) and 0.1% formic acid in acetonitrile (B).
- the gradient was maintained at initial 95% A for 0.5 min, to 40% A at 4min, and then to 1% A at 8min.
- the column was flushed for 1 min, then equilibrated at initial conditions for 1.5 min. Flow rate was 0.5ml/min.
- Biomarker identification and quantitation Biomarkers were screened by analyzing ions in the loading scatter plot, and metabolomics databases (METLIN and Madison Metabolomics Consortium Database) were searched to find potential candidates. To confirm the identities of the putative markers, the authentic standards were compared with the metabolites based on MS/MS fragmentation pattern and retention time. Concentrations of the metabolites were determined by multiple reaction-monitoring mass spectrometry based on standard curves using authentic standards.
- Chromatographic and spectral data were deconvoluted by MarkerLynx software (Waters).
- a multivariate data matrix containing information on sample identity, ion identity (retention time and m/z), and ion abundance was generated through centroiding, deisotoping, filtering, peak recognition, and integration. The intensity of each ion was calculated by normalizing the single ion counts vs. the total ion counts in the whole chromatogram.
- the data matrix was further exported into SIMCA-P software (Umetrics, Kinnelon, NJ) and transformed by mean-centering and pareto scaling, a technique that increases the importance of low abundance ions without significant amplification of noise.
- Statistical models including principal components analysis (PCA), partial least squares-discriminant analysis (PLS-DA), and orthogonal projections to latent structures-discriminant analysis (OPLS-DA) were established to represent the major latent variables in the data matrix.
- PCA principal components analysis
- PLS-DA partial least
- each of the aqueous extracts was separately reconstituted into 600 ⁇ L phosphate buffer containing 50% D 2 O and 0.005% TSP-d4 (chemical shift reference). Following centrifugation, 550 ⁇ L of each extract was transferred into a 5 mm NMR tube. Cecal content samples were directly extracted using an optimized procedure described previously (Wu et al., 2010). Briefly, samples ( ⁇ 50 mg) were mixed with 600 ⁇ L precooled phosphate buffer, vortexed for 30 s and subjected to three consecutive freeze-thaws followed by homogenization using the PrecellysTM Tissue Homogenizer. After centrifugation (11,180 x g, 4° C) for 10 min, the supernatants (550 ⁇ L) were transferred into 5 mm NMR tubes for NMR analysis.
- the 90° pulse length was adjusted to approximately 10 ⁇ s for each sample and 64 transients were collected into 32 k data points for each spectrum with spectral width of 20 ppm.
- a range of 2D NMR spectra were acquired and processed as described previously (Dai et al., 2010; Ding et al., 2009) for selected samples including 1 H- 1 H correlation spectroscopy (COSY), 1 H- 1 H total correlation spectroscopy (TOCSY), 1 H- 13 C heteronuclear single quantum correlation (HSQC), and 1 H- 13 C heteronuclear multiple bond correlation spectra (HMBC).
- COSY 1 H- 1 H correlation spectroscopy
- TOCSY 1 H- 1 H total correlation spectroscopy
- HSQC 1 H- 13 C heteronuclear single quantum correlation
- HMBC heteronuclear multiple bond correlation spectra
- Multivariate data analysis was carried out with SIMCAP+ software (version 13.0, Umetrics, Sweden).
- Principal Component Analysis was initially carried out on the NMR data to generate an overview and to assess data quality.
- Orthogonal projection to latent structures with discriminant analysis was subsequently conducted on the NMR data.
- the OPLS-DA models were validated using a 7-fold cross validation method and the quality of the model was described by the parameters R2X and Q2 values.
- back-transformation Cloarec et al., Anal. Chem.
- Fecal proteins were prepared from feces samples (0.5 g) in pH 7.4 phosphate buffered saline (PBS, 5.0 mL) using sonication.
- Bile salt hydrolase (BSH) activity was measured based on the generation of CDCA from TCDCA in the feces. Briefly, incubation was carried out in 3 mM sodium acetate buffer, pH 5.2, containing 0.1 mg/ml fecal protein and 50 ⁇ M TCDCA-d5 in a final volume of 200 ⁇ L. After a 20 min incubation at 37° C, the reaction was stopped by plunging the samples into dry ice. 100 ⁇ L of acetonitrile was directly added to the reaction mix.
- BSH Bile salt hydrolase
- mitochondrial homogenization buffer 225mM mannitol, 75 mM sucrose, 5 mM MOPS, 0.5 mM EGTA and 2 mM taurine (pH 7.25)
- BSA 0.5 mM EGTA and 2 mM taurine
- homogenized in a loose fitting homogenizer Homogenates were centrifuged at 500xg for 10 min at 4° C. The supernatant was then centrifuged at 10,000xg for 10 min at 4° C. The final mitochondrial pellet was resuspended in mitochondrial isolation buffer containing 0.2% BSA at a concentration of 0.5 mg/ml before functional assessment.
- the oxygen consumption of isolated mitochondria was measured in a chamber connected to a Clark-type O 2 electrode (Instech) and O 2 monitor (Model 5300, YSI Inc) at 25° C.
- Mitochondria were incubated in respiration buffer (120 mM KCl, 5 mM MOPS, 0.1mM EGTA, 5 mM KH 2 PO 4 and 0.2% BSA) with substrates for either complex I (5 mM glutamate and 5 mM malate), or complex II (5 mM succinate and 1 ⁇ M rotenone).
- State 3 (maximal) respiration activity was measured after addition of 1 mM ADP.
- ADP independent respiration activity (State 4) was monitored after addition of 2 ⁇ M oligomycin.
- the respiratory control ratio was determined by the state 3/state 4 respiration rates.
- Hematoxylin and eosin (H&E) staining were performed on formalin fixed paraffin embedded sections using a standard protocol. Oil red O staining was performed on frozen liver sections using a standard protocol. At least three discontinuous liver sections were evaluated for each mouse.
- Hepatic lipids were extracted using a 2:1 chloroform-methanol solution. Liver triglycerides were measured with a triglyceride colorimetric assay kit, according to the manufacturer's recommendation (Bioassay Systems, Hayward, CA).
- Caco-2 (ATCCTM HTB-37TM) cells were induced to differentiate following the method as described previously ( Ferraretto et al., Anticancer Res. 27:3919-3925, 2007 ).
- the differentiated Caco-2 cells were incubated for 8 hours with DMEM media with 1% fetal bovine serum, and then exposed to Gly-MCA/CDCA/GW4064 for 24 hours.
- RNA was extracted from frozen intestine using TRIzol reagent (Invitrogen).
- cDNA was synthesized from 1 ⁇ g total RNA using Superscript II reverse transcriptase (Invitrogen).
- Fecal proteins were prepared from the fecal sample (0.5 g) in pH 7.4 PBS (5.0 ml) using sonication. Incubation was carried out in 3 mM sodium acetate buffer, pH 5.2, containing 0.1 mg/ml fecal protein and 50 ⁇ M Gly-MCA or T- ⁇ -MCA in a final volume of 200 ml. After a 20-min incubation at 37° C, the samples were plunged into dry ice to stop the reaction. 100 of ⁇ L methanol was directly added to the 100 ml reaction mixture.
- High fat diet (60% kcal consisting of fat) was purchased from Bioserv. Inc. Gly-MCA was custom synthesized.
- mice Male wild-type (WT) C57BL/6N mice, 6- to 8-weeks-old, were fed a HFD (Bio-Serv, Frenchtown, NJ; 60 kcal% fat) from the age of 6 weeks and were orally administered with vehicle (control pills) or Gly-MCA (0.25 mg/pill/day, 10 mg/kg). Mice were housed individually in their home cages. Cumulative food intake and TEE bal were measured for 1 week in vehicle and Gly-MCA-treated mice from 6 to 7 weeks of HFD. TEE bal was measured as previously described ( Ravussin et al., Int. J. Obesity 37:399-403, 2013 ). All animal studies were performed in accordance with the Institute of Laboratory Animal Resources guidelines and approved by the NCI Animal Care and Use Committee.
- mice were fasted for 16 h, blood was drawn, and mice were injected intraperitoneally (i.p.) with 1 g/kg glucose.
- ITT insulin tolerance test
- mice were fasted 4 h, blood was drawn, and then were injected with insulin (Eli Lilly, Washington, DC), by i.p. at a dose of 1 U/kg body weight. Blood samples were taken from the tail at 15, 30, 60, and 90 min after injection, and glucose measured using a Glucometer (Bayer, Pittsburgh, PA).
- T ⁇ MCA tauro- ⁇ -muricholic
- TCA taurocholic acid
- Caco-2 cells were transfected with PGL4-Shp-TK firefly luciferase construct, the control plasmid phRL-SV40, and human FXR and human ASBT expression plasmids. After 24 h, the cells were treated with 100 ⁇ M TCA, T ⁇ MCA, or T ⁇ MCA with 100 ⁇ L 100 ⁇ M TCA. The cells were lysed, and luciferase activities measured as describe herein. The results are depicted in Figure 2 .
- This example demonstrates that ATP levels in mouse ileum mucosa were markedly elevated in Fxr ⁇ IE mice as compared to Fxr fl / fl mice after 14 weeks on a high fat diet.
- Gly-MCA glycine- ⁇ -muricholic acid
- Gly-MCA Mice make T ⁇ MCA in the liver while humans preferentially make Gly-MCA. Thus, it was of interest to determine whether Gly-MCA was also an FXR antagonist. Chenodeoxycholic acid (CDCA), an FXR agonist at a dose of 100 ⁇ M, increased expression of the Fxr target gene Shp mRNA four-fold and the induction of Shp mRNA with CDCA was inhibited by Gly-MCA in a dose dependent manner ( Fig. 4 ).
- DUA Chenodeoxycholic acid
- Gw4064 a synthetic FXR agonist, induced expression of the FXR target genes Shp and Fgf19 at both 2 ⁇ M and 5 ⁇ M concentrations, and induction of both genes was blocked by Gly-MCA ⁇ in a dose dependent manner ( Figures 5 and 6 ).
- Gw4064 treatment inhibited Atp5g mRNA expression and Gly-MCA reversed this inhibition ( Figure 7 ).
- This example demonstrates the effect of tempol on body mass of high-fat diet-treated Fxr fl / fl and Fxr ⁇ IE mice.
- FIG. 11 depicts the body mass gain in grams for vehicle and tempol-treated Fxr fl / fl and Fxr ⁇ IE mice after 10 weeks of a high-fat diet feeding.
- tempol treatment of Fxr fl / fl mice resulted in a weight gain that was approximately 65% less of the weight gain exhibited by vehicle treated mice.
- Tempol treatment of Fxr ⁇ IE mice which are intestinal-specific Fxr -null mice, resulted in an insignificant difference in weight gain, thereby implicating intestinal FXR in mediating the lower weight gain by tempol of mice fed a high-fat diet.
- This example demonstrates the role of intestinal FXR in lipid and glucose metabolism.
- the glucose tolerance test revealed that Fxr ⁇ IE mice had improved glucose intolerance compared to Fxr fl / fl mice, which is depicted in Figure 13 , which shows the area under the curve for blood glucose (in mg/dL) as a function of time.
- the insulin tolerance test which is depicted in Figure 14 , demonstrated that the insulin sensitivity in Fxr ⁇ IE mice was significantly increased as compared to Fxr fl / fl mice.
- This example demonstrates the results of a human FXR competition assay using the synthetic agonist Gw4064 and varied doses of TUDCA, T ⁇ MCA, T ⁇ MCA, T ⁇ MCA. Results were normalized to Renilla expression.
- HEK293T cells were co-transfected with: 1) a chimeric receptor construct in which the carboxy terminal portions of human FXR (containing the native ligand-binding domain and AF2 transactivation domain) was fused to an amino terminal GAL4 DNA-binding domain under regulatory control of the constitutively active SV40 promoter; 2) a firefly luciferase reporter plasmid driven by the UAS GAL4 DNA response element; and, 3) a Renilla luciferase reporter gene (pRL-luciferase; Promega; Madison, WI) as a transfection efficiency control.
- pRL-luciferase Renilla luciferase reporter gene
- Luciferase detection was conducted using the Dual Luciferase Reporter Assay kit (Promega Corp., Madison, WI) and a Tecan GeniosPro luminescent plate reader (Research Triangle Park, NC). The results are illustrated in Figure 18 .
- High-fat diet is extensively used as a mouse model for NAFLD.
- the antioxidant tempol selectively modulates the gut microbiota composition and metabolism under normal diet conditions ( Li et al., Nat. Commun. 4: 2384, 2013 ).
- 16S rRNA gene sequencing analysis was carried out.
- Weighted UniFracTM analysis showed distinct clustering of cecal communities isolated from vehicle and tempol-treated groups on a HFD for 12 weeks.
- Principal coordinate 1 (PC1) explains 56.08% of the variation, indicating that tempol had a stronger effect on microbiota composition than vehicle in mice on a HFD for 12 weeks ( Figure 19A ).
- the separation of samples in the principal components analysis plot reflects abundance differences in significantly decreased Firmicutes and markedly increased Proteobacteria.
- the genus Desulfovibrio was identified as a major contributor of the increased Proteobacteria ( Figure 19B ), which was found to be significantly lower in obese subjects ( Karlsson et al., Obesity 20:2257-2261, 2012 ).
- a dramatic increase in the genus Roseburia was observed ( Figure 19C ), which is negatively correlated with body weight in dogs ( Handi et al., FEMS Microbiol. Ecol. 84332-343, 2013 ).
- the genus Clostridium sensu stricto and Lactobacillus levels were also significantly decreased in tempol-treated mice, whereas the levels of genus Bacteroides and Streptococcus remained similar ( Figure 19D-G ).
- liver histology indicated a significant reduction in hepatic lipid droplets in tempol-treated mice on a HFD for 16 weeks and antibiotic-treated mice on a HFD for 7 weeks ( Figure 22A and B , and Figure 23A ).
- Tempol treatment and antibiotic treatment which also changes the gut microbiota composition, decreased liver weights and liver/body mass ratios, respectively ( Figure 22C and D , Figure 23A and B ).
- Hepatic triglyceride (TG) contents were decreased to approximately 50% and 35% in mice treated with antibiotic and tempol, respectively ( Figure 22E and Figure 23D ).
- the gut microbiota is tightly associated with bile acid metabolism.
- UPLC-ESI-QTOFMS-based metabolomics analysis was adopted to determine bile acid composition and levels of bile acid metabolites in the intestine.
- Scores scatter plot of a PCA model of the UPLC-ESI-QTOFMS negative mode data from mouse ileum indicated distinct metabolic profiles between the vehicle and antibiotic groups ( Figure 24A ).
- T ⁇ MCA top enriched metabolite
- the gut microbiota can modify bile acid composition by microbial enzymatic activities.
- BSH bile salt hydrolase
- T ⁇ MCA treatment significantly blunted the Shp and Fgf15 induction by the FXR agonist TCA in the ileum of mice treated with antibiotic on a HFD for three days ( Figure 26E ).
- intestine-specific Fxr -null ( Fxr ⁇ IE ) mice were treated with HFD for 14 weeks.
- H&E staining and Oil red O staining of liver sections showed a significant decrease in lipid accumulation in livers of Fxr ⁇ IE mice compared to wild-type ( Fxr fl/fl ) mice ( Figures 27A and B ).
- Fxr ⁇ IE mice displayed significantly reduced liver weight and ratio of liver weight ( Figures 27C ).
- each ceramide was confirmed by LC-MS fragmentography ( Figure 30A-G ). Further, intestinal mRNAs encoding de novo ceramide synthesis-related genes, such as serine palmitoyltransferase, long chain base subunit 3 ( Sptlc3 ), ceramide synthase 4 ( Cers4 ), degenerative spermatocyte homolog 1 ( Degs1 ), and sphingomyelin phosphodiesterase 3 ( Smpd3 ) waned significantly in Fxr ⁇ 1E mice and antibiotic-treated mice ( Figure 29C and D ).
- de novo ceramide synthesis-related genes such as serine palmitoyltransferase, long chain base subunit 3 ( Sptlc3 ), ceramide synthase 4 ( Cers4 ), degenerative spermatocyte homolog 1 ( Degs1 ), and sphingomyelin phosphodiesterase 3 ( Smpd3 ) waned significantly in Fxr
- the expression of genes involved in ceramide catabolism such as sphingomyelin synthase 1 and 2 ( Sgms1 and Sgms2 ), and alkaline ceramidase 1 and 3 ( Acer1 and Acer3 ) remained similar in Fxr ⁇ IE mice and antibiotic-treated mice ( Figure 29C and D )
- This example demonstrates that ceramide regulates the SREBP1c-CIDEA pathway in the liver.
- mice on a HFD were treated with antibiotics for a short duration.
- Three days of antibiotic treatment did not decrease triglyceride content in the liver ( Figure 31A ).
- the FXR signaling pathway was inhibited as revealed by decreased expression of the FXR target gene Shp and Fgf15 mRNAs ( Figure 31B ).
- ceramide levels in the ileum of antibiotic-treated mice were significantly decreased ( Figure 31C ).
- ceramide The contribution of ceramide to NAFLD was further evaluated in cultured primary mouse hepatocytes. Ceramide treatment induced a significantly increased triglyceride contents in primary hepatocytes in a dose-dependent manner ( Figure 31D ). To elucidate the mechanisms by which ceramide leads to hepatic steatosis, the expression of the genes involved in hepatic lipogenesis and fatty acid oxidation were measured.
- Fatty acid synthesis-related genes such as sterol response element-binding protein 1c ( Srebp1c ), DNA fragmentation factor-alpha-like effector a ( Cidea ), elongation of very-long-chain fatty acids protein 6 ( Elovl6 ) and TG formulation related genes such as diacylglycerol O-acyltransferase 2 ( Dgat2 ) were significantly upregulated by ceramide in primary hepatocytes ( Figure 31E ).
- Srebp1c sterol response element-binding protein 1c
- Cidea DNA fragmentation factor-alpha-like effector a
- Elovl6 elongation of very-long-chain fatty acids protein 6
- Dgat2 diacylglycerol O-acyltransferase 2
- genes involved in fatty acid ⁇ -oxidation such as carnitine palmitoyltransferase 1 ( Cpt1 ), acyl-coenzyme A oxidase 1 ( Acox1 ), enoyl-coenzyme A, hydratase/3-hydroxyacyl coenzyme A dehydrogenase ( Ehhadh ), and acetyl-coenzyme A acyltransferase 1A ( Acaa1a ) were not affected by ceramide treatment ( Figure 31E ).
- inflammation-related genes such as toll-like receptor 2 ( Tlr2 ), toll-like receptor 4 ( Tlr4 ), toll-like receptor 9 ( Tlr9 ) and tumor necrosis factor ⁇ ( Tnf ⁇ ), were comparable in antibiotic- and tempol-mice ( Figure 32I and J ).
- Tlr2 toll-like receptor 2
- Tlr4 toll-like receptor 4
- Tlr9 toll-like receptor 9
- Tnf ⁇ tumor necrosis factor ⁇
- Fxr ⁇ IE mice were employed to determine the role of intestinal FXR in the progression of the NAFLD.
- Liver histology revealed that antibiotic and tempol treatment decreased hepatic lipid droplets in Fxr fl/fl mice on a HFD for 14 and 16 weeks, respectively; no changes in hepatic lipid were observed in Fxr ⁇ 1E mice with these treatments ( Figure 33A and B and Figure 34A and B ).
- the liver weights and liver/body mass ratios of antibiotic- and tempol-treated Fxr fl/fl mice were significantly reduced, whereas the liver weights and liver/body mass ratios were similar in Fxr ⁇ IE and Fxr fl/fl mice ( Figure 33C and D , Figure 34C and D ).
- Hepatic triglyceride content analysis confirmed that antibiotic and tempol treatment did not alleviate hepatic steatosis in Fxr ⁇ 1E mice ( Figure 33E and Figure 34E ).
- Ileum and serum C16:0, C18:0, C20:0, C22:0, C24:0 and C24:1 ceramide levels were significantly decreased in Fxr ⁇ IE mice and tempol-treated Fxr fl/fl mice, but not in Fxr ⁇ IE mice ( Figure 33F and G ).
- This example demonstrates the systemic responses of mice on a high-fat diet, to tempol and antibiotic treatment.
- pair-wise OPLS-DA was performed between data obtained from cecal contents or liver of mice after tempol or antibiotic treatment.
- the quality of these models was further validated by evaluation with CV-ANOVA (p ⁇ 0.05) and permutation test (200 tests) for the OPLS-DA and PLS-DA models.
- tempol treatment significantly decreased the levels of SCFAs (acetate, propionate, and butyrate) but significantly elevated the levels of oligosaccharides and glucose in the cecal contents.
- Similar changes in SCFAs and oligosaccharides were also observed from the cecal contents of the antibiotic-treated wild type mice compared to those from the respective controls.
- no significant differences in the levels of SCFAs and oligosaccharides were observed in the cecal contents between tempol-treated and vehicle-treated Fxr ⁇ 1E mice.
- Tempol treatment significantly decreased the levels of lipid and unsaturated fatty acid (UFA) in the livers, whereas tempol treatment significantly elevated the levels of glucose, glycogen, bile acids and a range of nucleotide metabolites (e.g., uridine, hypoxanthine and 5'-IMP), nicotinurate, and choline in comparison with the vehicle-treated wild-type mice.
- nucleotide metabolites e.g., uridine, hypoxanthine and 5'-IMP
- antibiotic treatment significantly elevated the levels of bile acids, trimethylamine oxide (TMAO, choline, fumarate, formate, amino acids including branched chain amino acids (leucine, isoleucine and valine), alanine, glycine, tyrosine and phenylalanine, and some nucleic acids such as hypoxanthine, uridine and 5'-IMP in the liver.
- TMAO trimethylamine oxide
- choline choline
- fumarate formate
- amino acids including branched chain amino acids (leucine, isoleucine and valine)
- alanine glycine
- tyrosine and phenylalanine a nucleic acids
- nucleic acids such as hypoxanthine, uridine and 5'-IMP
- This example demonstrates a synthesis of ⁇ -muricholic acid 9 , glycine- ⁇ -muricholic acid (Gly-MCA) 10 , and tauro- ⁇ -muricholic acid (T- ⁇ -MCA) 11 in accordance with an embodiment of the invention.
- ⁇ -Muricholic acid ( ⁇ -MCA) 9 was prepared as illustrated in Figure 41 by following the literature procedure ( Iida T, Momose T, et al., Journal of Lipid Research, 30: 1267-1279 (1989 )).
- esterification of the dihydroxy acid 1 with methanol under acid catalysis provided ester 2 in quantitative yield. Protection of the hydroxyl group in the 3 position with ethyl chloroformate provided carbonate 3 .
- Oxidation of the 6-hydroxyl group with potassium chromate gave ketone 4 in quantitative yield. Bromination with 47% HBr solution gave bromo ketone 5 , which on reduction with NaBH 4 gave bromohydrin 6 in moderate yield.
- Reductive dehydrobromination with zinc metal provided olefin 7 in about 80% yield.
- Cis-dihydroxylation with osmium tetroxide to give cis diol 8 followed by hydrolysis provided s-muricholic acid 9 in quantitative yield.
- r-muricholic acid 9 was conjugated with glycine to provide glycine- ⁇ -muricholic acid (Gly-MCA) 10 .
- Gly-MCA glycine- ⁇ -muricholic acid
- a suspension of ethyl glycinate was reacted with ⁇ -MCA 9 and EEDQ by refluxing overnight.
- the residue obtained after workup was dissolved in boiling ethanol and hydrolyzed with 10% K 2 CO 3 .
- the aqueous solution was acidified to give Gly-MCA 10 as a white powder in 68% yield.
- T ⁇ MCA 11 was similarly prepared from 9 by conjugation with taurine instead of glycine.
- Fecal extracts were prepared as described above. Gly-MCA (50 ⁇ M) was incubated with fecal extract (0.1 mg/mL). The negative control was fecal extract alone. The positive control was fecal extract (0.1 mg/mL) and T ⁇ MCA acid (50 ⁇ M). The samples were analyzed by UPLC to determine the amount of ⁇ -MCA (hydrolysis product) and the results shown in Figure 35 .
- Gly-MCA was given to mice via oral gavage at dosages of 0, 1, 5, and 50 mg/kg of Gly-MCA, with the Gly-MCA dosed in corn oil.
- Gly-MCA was detected using ultra performance liquid chromatography-electrospray ionization-quadrupole time-of-flight mass spectrometry (UPLC-ESI-QTOFMS). The results are shown in Figure 36 .
- mice treated with Gly-MCA do not develop significant liver toxicity.
- mice were dosed with vehicle or Gly-MCA at 1 mg/kg, 5 mg/kg, and 50 mg/kg. After 24 h, serum aminotransferase (ALT) and aspirate aminotransferase (AST) levels were determined and the results shown in Figure 37 .
- ALT serum aminotransferase
- AST aspirate aminotransferase
- HEK293T fibroblasts were transiently co-transfected with (1) a chimeric receptor construct in which the carboxy terminal portions of human FXR (containing the native ligand-binding domain and AF2 transactivation domain) was fused to an amino terminal GAL4 DNA-binding domain under regulatory control of the constitutively active SV40 promoter, (2) a firefly luciferase reporter plasmid driven by the UAS GAL4 DNA response element, and (3) a Renilla luciferase reporter gene (pRL-luciferase; Promega; Madison, WI) as a transfection efficiency control.
- pRL-luciferase Renilla luciferase reporter gene
- GW4064 or GW4064 and Gly-MCA were added to the media for 24 h, the cells were harvested, and cell extracts prepared. Luciferase detection was conducted using the Dual Luciferase Reporter Assay kit (Promega; Madison, WI) and a Tecan GeniosProTM luminescent plate reader (Research Triangle Park, NC). The results are shown in Figure 38 .
- Differentiated Caco-2 cells were treated with 100 ⁇ M of the FXR agonist chenodeoxycholic acid (CDCA) and with 0, 100 ⁇ M, or 200 ⁇ M Gly-MCA, and expression of the FXR target gene Shp mRNA measured.
- CDCA caused a 4-fold increase in expression of Shp mRNA.
- Gly-MCA inhibited the induction of Shp mRNA with CDCA in a dose-dependent manner.
- Differentiated Caco-2 cells were treated with 0.2 ⁇ M or 5 ⁇ M GW4064 and with 100 ⁇ M or 200 ⁇ M Gly-MCA. Control cells were not treated with either agent.
- Relative expression of the FXR target gene mRNAs, Shp mRNA, Fgf19 mRNA, and Atp5g mRNA were determined and the results shown in Figures 40A-C , respectively.
- Expression of Shp mRNA and Fgf19 mRNA induced by GW4064 was blocked by Gly-MCA in a dose-dependent manner ( Figures 40A and B ).
- GW4064 treatment inhibited expression of the FXR target gene Atp5g mRNA and Gly-MCA reversed the inhibition ( Figure 40C ).
- HFD-treated mice were orally administered Gly-MCA.
- Gly-MCA treatment reduced body weight gain after one week of treatment with a HFD ( Figure 41A and B ).
- the absolute fat mass and the fat/lean mass ratio, measured by NMR, were significantly decreased in Gly-MCA-treated mice after 7 weeks of treatment compared with vehicle-treated mice ( Figure 41C and D ).
- ALT and AST serum aminotransferase and aspartate aminotransferase biomarkers of liver toxicity were determined.
- ALT and AST were significantly higher on a HFD and GlyMCA treatment significantly decreased serum ALT and AST levels ( Figure 45A and B ), thus indicating that the dose of Gly-MCA employed was not toxic, but actually decreased HFD-induced hepatic toxicity.
- NAFLD is tightly associated with bile acid metabolism.
- UPLC-ESI-QTOFMS-based metabolomics analysis was adopted to determine bile acid composition and levels of bile acid metabolites in the feces and intestine.
- Levels of T- ⁇ -MCA were significantly increased whereas TCA levels were significantly decreased in feces after Gly-MCA treatment ( Figure 46C ).
- Serum C16:0, C20:0, C22:0, and C24:1 ceramides levels, and ileum C16:0, C18:1, and C24:0 ceramides levels were reduced in Gly-MCA treated mice on a HFD for 9 weeks ( Figure 49A and B ).
- Gly-MCA treatment decreased Shp and Fgf15 mRNAs indicating that FXR signaling was inhibited in the ileum ( Figure 50A ).
- Intestinal mRNAs encoding ceramide de novo synthesis-related genes, such as serine Sptlc3, Cers4, Degs1, and Smpd3 were significantly lower in Gly-MCA -treated mice ( Figure 50B ).
- Gly-MCA treatment significantly decreased serum ALT and AST levels ( Figures 55A and 55B ), thus indicating that the dose of Gly-MCA employed was not toxic to the db / db mice and reduced liver toxicity in this mouse model.
- Levels of T- ⁇ -MCA and T ⁇ MCA were significantly increased in feces and ileum after Gly-MCA treatment ( Figure 56A and 56B ).
- the accumulation of Gly-MCA in the ileum is far much more than liver, feces, and serum ( Figure 56C ).
- Serum triglyceride levels remained similar after 6 weeks of Gly-MCA treatment ( Figure 57A ).
- Serum C16:0, C20:0, C22:0, and C24:1 ceramides levels, and ileum C16:0, C18:0, C18:1, C20:0, C22:0, C24:0 and C24:1 ceramides levels were reduced in Gly-MCA treated mice compare to vehicle treatment ( Figure 57B and C ).
- C57BL/6N mice made obese by 12 weeks of feeding a high-fat diet were treated with Gly-MCA. Due to limited amounts of Gly-MCA, these mice were treated with only 5 mg/kg GMCA. Despite the lower dosing, they had reduced body weight gain as compared to vehicle-treated mice from two weeks of treatment ( Figure 58 ).
- Levels of T ⁇ MCA and T ⁇ MCA were significantly enhanced in feces and ileum after Gly-MCA treatment ( Figure 61A and 61B ).
- the accumulation of Gly-MCA in the ileum is far greated than liver, feces, and serum ( Figure 61C ).
Landscapes
- Health & Medical Sciences (AREA)
- Chemical & Material Sciences (AREA)
- Organic Chemistry (AREA)
- General Health & Medical Sciences (AREA)
- Diabetes (AREA)
- Public Health (AREA)
- Animal Behavior & Ethology (AREA)
- Veterinary Medicine (AREA)
- Bioinformatics & Cheminformatics (AREA)
- Chemical Kinetics & Catalysis (AREA)
- General Chemical & Material Sciences (AREA)
- Medicinal Chemistry (AREA)
- Nuclear Medicine, Radiotherapy & Molecular Imaging (AREA)
- Engineering & Computer Science (AREA)
- Pharmacology & Pharmacy (AREA)
- Life Sciences & Earth Sciences (AREA)
- Hematology (AREA)
- Obesity (AREA)
- Endocrinology (AREA)
- Emergency Medicine (AREA)
- Child & Adolescent Psychology (AREA)
- Gastroenterology & Hepatology (AREA)
- Pharmaceuticals Containing Other Organic And Inorganic Compounds (AREA)
- Steroid Compounds (AREA)
- Acyclic And Carbocyclic Compounds In Medicinal Compositions (AREA)
- Medicines That Contain Protein Lipid Enzymes And Other Medicines (AREA)
Description
- This patent application claims the benefit of
U.S. Provisional Patent Applications Nos. 61/861,109, filed August 1, 2013 62/004,436, filed May 29, 2014 - Obesity has reached epidemic proportions worldwide and is associated with chronic diseases such as
type 2 diabetes mellitus, cardiovascular diseases, hepatosteatosis, and cancer. Obesity develops as a result of energy intake that exceeds energy expenditure, leading to a net storage of excess calories in the form of fat in adipose tissue. Obesity is metabolically linked withtype 2 diabetes (insulin resistance) and hepatosteatosis, the latter of which can lead to steatohepatitis, hepatocarcinogenesis and liver failure. Thus, a pharmaceutical approach that suppresses appetite, blocks dietary fat absorption, induces fat mobilization, or increases metabolism would be ideal in the treatment of obesity and related metabolic disorders. - Farnesoid X Receptor (FXR) is an orphan nuclear receptor initially identified from a rat liver cDNA library (Forman, et al., Cell 81:687-693,1995) that is most closely related to the insect ecdysone receptor. FXR is a member of the nuclear receptor superfamily of transcription factors that includes receptors for the steroid, retinoid, and thyroid hormones (Mangelsdorf, et al., Cell 83:841-850,1995). Northern blotting and in situ hybridization analysis showed that FXR is most abundantly expressed in the liver, intestine, kidney, and adrenal (B.M. Forman, et al., Cell 81:687-693.1995; Seol, et al., Mol. Endocrinol. 9:72-85, 1995). FXR is a ligand-activated nuclear receptor that binds to DNA as a heterodimer with the retinoic acid receptor α (RXRα) that is activated by the vitamin A derivative 9-cis retinoic acid. The FXR/RXRα heterodimer preferentially binds to response elements composed of two nuclear receptor half sites of the consensus AG(G/T)TCA organized as an inverted repeat and separated by a single nucleotide (IR-1 motif) (Forman, et al., Cell 81:687-693,1995). An early report showed that rat FXR is activated by micromolar concentrations of farnesoids such as farnesol and juvenile hormone thus accounting for the original name (Forman, et al., Cell 81:687-693, 1995). However, these compounds were weak ligands and also failed to activate the corresponding mouse and human FXR, leaving the nature of the endogenous FXR ligand in doubt. However, several naturally-occurring bile acids were found to bind to and activate FXR at physiological concentrations (Makishima, et al., Science 284:1362-1365, 1999; Parks, et al., Science 284:1365-1368, 1999; Wang et al., Mol. Cell 3:543-553,1999;
PCT WO 00/37077, published June 29, 2000 - Bile acids are cholesterol metabolites that are formed in the liver and secreted into the duodenum of the intestine, where they have important roles in the solubilization and absorption of dietary lipids and vitamins. About 95% of bile acids are subsequently reabsorbed in the ileum and returned to the liver via the enterohepatic circulatory system. The conversion of cholesterol to bile acids in the liver is under feedback regulation, and bile acids down-regulate transcription of cytochrome P450 7A1 (CYP7A1), which encodes the enzyme that catalyzes the rate-limiting step in bile acid biosynthesis. FXR is involved in the repression of CYP7A1 expression by bile acids through an indirect mechanism involving the FXR target gene small heterodimer partner (SHP) and liver receptor homolog 1 (Goodwin et al., Mol. Cell 6:517-528, 2000; reviewed in Matsubara et al., Mol. Cell. Endocrinol. 368:17-29, 2013). In the ileum, in an FXR dependent manner, bile acids induce the expression of the intestinal bile acid binding protein (IBABP), a cytoplasmic protein which binds bile acids with high affinity and may be involved in their cellular uptake and trafficking. Two groups have now demonstrated that bile acids mediate their effects on IBABP expression through activation of FXR, which binds to an IR-1 type response element that is conserved in the human, rat, and mouse IBABP gene promoters. Thus, FXR is involved in both the stimulation (IBABP) and the repression (CYP7A1) of target genes involved in bile acid and cholesterol homeostasis. FXR also induces expression of the bile salt export pump (BSEP, ABC11) that transports unconjugated and conjugated bile acids/salts from hepatocyte into the bile (reviewed in Matsubara et al., Mol. Cell. Endocrinol. 368:17-29, 2013).
- Tempol (4-hydroxy-2,2,6,6,-tetramethylpiperidine-1-oxyl), an antioxidant and a radiation protector, was reported to prevent obesity in mice (Mitchell et al., Free Radic. Biol Med. 34: 93-102, 2003). A recent mass spectrometry-based investigation revealed that tempol can affect fatty acid metabolism and the altered levels of suspected gut microbe-generated metabolites provided initial clues that tempol may alter the microbiome (Li et al., J. Proteome Res., 12:1369-1376, 2013). Previous studies demonstrated that the alteration of the gut microbiome can affect the level of bile acids in liver, heart, and kidney (Swann et al., Proc. Natl. Acad. Sci. USA 108:4523-4530, 2011). High fat diets can induce changes in the expression of genes in the small intestine that are controlled by nuclear receptors including FXR (de Wit et al., BMC Med. Genomics 1:14, 2008). Thus, there may be relationship between altered bile acids in the intestine and FXR signaling that can alter high fat diet-induced obesity. While there are known natural and synthetic FXR agonist, no therapeutic agents have been disclosed which antagonize FXR. Recent studies revealed that the secondary bile acid tauro-β-muricholic acid (TβMCA) can antagonize bile acid signaling in the intestine (Sayin et al., Cell Metab. 225-235, 2013; Li et al., Nat. Commun. 4:2384, 2013). Trisubstituted-pyrazol carboxamide analogs have been synthesized that are FXR antagonist, but their effect on metabolism and physiology were not investigated (Yu et al., Bioorg. Med. Chem. 2919-2938, 2014).
- Non-alcoholic fatty liver disease (NAFLD) is characterized by massive ectopic triglyceride (TG) accumulation in the liver in the absence of other liver disease or significant alcohol consumption (Weiß et al., Dtsch. Arzteb.l Int. 2014; 111:447-452, 2014). NAFLD is the most common liver disorder affecting 20-30% of the adult population and more than 80% of obese people in the world. NAFLD can develop into nonalcoholic steatohepatitis (NASH), fibrosis, cirrhosis and even hepatocellular carcinoma (Browning et al., J. Clin Invest. 114:147-152, 2004). As a component of metabolic syndrome, NAFLD is tightly associated with obesity, insulin resistance/
type 2 diabetes, and coronary heart disease and atherosclerosis (Bhatia et al., Eur. Heart J. 33:1190-1200, 2012). To date, the underlying molecular mechanism of NAFLD development remains largely unknown and the identification of novel targets for NAFLD therapy is of high priority. - The foregoing shows that there is an unmet need for antagonists of the FXR receptor and a method of treating obese patients to induce weight loss, insulin resistance, and NAFLD.
- The present invention provides a compound represented by the structure illustrated in
claim 1, or a pharmaceutically acceptable salt thereof, for use in treating or preventing a disease or disorder selected from obesity, insulin resistance, and non alcoholic fatty liver disease in a mammal in need thereof. -
-
Figure 1 depicts results of luciferase assays showing that tauro-β-muricholic acid (TβMCA) antagonizes farnesoid X receptor (FXR) activation by the FXR agonist taurocholic acid (TCA) in cultured primary hepatocytes. -
Figure 2 depicts results of luciferase assays showing that tauro-β-muricholic acid (TβMCA) antagonizes FXR activation by the FXR agonist taurocholic acid (TCA) in Caco2 cells. -
Figure 3 illustrates ATP levels in the ileum mucosa of Fxr fl/fl mice and Fxr ΔIE mice that were kept on a high fat diet for 8 weeks. -
Figure 4 illustrates the blocking of induction of Shp mRNA with chenodeoxycholic acid by glycine-β-muricholic acid. -
Figure 5 illustrates the blocking of induction of Shp mRNA with GW4064 by glycine-β-muricholic acid. -
Figure 6 illustrates the blocking of induction of Fgf19 mRNA with GW4064 by glycine-β-muricholic acid. -
Figure 7 illustrates the reversal of Atp5g mRNA inhibition by GW4064 by glycine-β-muricholic acid. -
Figure 8 depicts a synthesis of a compound which is for use in accordance with the invention (R = -CH2-COOH). -
Figure 9 depicts a synthesis of compounds in accordance with an embodiment of the disclosure. -
Figure 10 depicts the structures of β-muricholic acid, tauro-β-muricholic acid (TβMCA), glycine-β-muricholic acid, chenodeoxycholic acid, taurochenodeoxycholic acid (TCA), and glycine-chenodeoxycholic acid. -
Figure 11 illustrates the body mass gain for Fxr fl/fl and Fxr ΔIE mice treated with vehicle or tempol after 10 weeks of a high fat diet. -
Figure 12 illustrates the fat mass in grams and as a percentage of body mass for Fxr fl/fl and Fxr ΔIE mice after 14 weeks of a high fat diet. -
Figure 13 illustrates the results of a glucose tolerance test (GTT) for Fxr fl/fl and Fxr ΔIE mice after 7 weeks of a high fat diet. -
Figure 14 illustrates the results of an insulin tolerance test (ITT) for Fxr fl/fl and Fxr ΔIE mice after 13 weeks of a high fat diet. -
Figure 15 illustrates the fasted glucose, fasted serum insulin, and HOMA index for Fxr fl/fl and Fxr ΔIE mice after 15 weeks of a high fat diet. -
Figure 16 depicts the shift from Firmicutes to Bacteroidetes in mice being fed a normal chow diet upon treatment with tempol. -
Figure 17 depicts a comparison of the ratio of Firmicutes to Bacteroidetes and the bile salt hydrolase enzymatic activity in the feces of mice on a normal chow diet and treated with vehicle or tempol. -
Figure 18 illustrates a human FXR competition assay using the synthetic agonist GW4064 and varied doses of TUDCA, TωMCA, TβMCA, TαMCA. Results were normalized to Renilla expression. -
Figure 19A shows a principal coordinates analysis plot of weighted UniFrac distances. Circles represent cecal communities in vehicle-treated mice and squares represent cecal communities in tempol-treated mice. Both groups were fed a high-fat diet for 10 weeks. -
Figure 19B-G shows 16S rRNA gene sequencing analysis of genus levels of cecum content. Data are presented as mean±SD. -
Figure 20A shows a scores scatter plot of a principal components analysis (PCA) model of urine ions in vehicle- and tempol-treated mice fed a high-fat diet for 14 weeks. -
Figure 20B shows a loadings scatter plot of all detected urine ions in the PCA model. The p[1] and p[2] values represent the contributing weights of each ion toprincipal components -
Figure 20C shows urine levels of p-cresol sulfate and p-cresol glucuronide. Values were normalized to those of vehicle-treated mice and were expressed as relative abundance. -
Figure 20D shows tandem MS and chemical structures of p-cresol sulfate (lower panel) and p-cresol glucuronide (upper panel). -
Figure 21A shows scores scatter plot of a PCA model of urine ions in vehicle- and tempol-treated mice after 14 weeks of high-fat diet treatment. -
Figure 21B shows loadings scatter plot of a PCA model of urine ions in vehicle- and antibiotic-treated mice after 14 weeks of HFD. The p[1] and p[2] values represent the contributing weights of each ion toprincipal components -
Figure 21C shows urine levels of p-cresol sulfate and p-cresol glucuronide in vehicle- and antibiotic-treated mice after 14 weeks of high-fat diet treatment. Values were normalized to those of vehicle-treated mice and were expressed as relative abundance. n=5 mice per group. All data are presented as mean ± SD. Analysis of variance followed by two-tailed Student's t-test. *P<0.05, **P<0.01 compared to vehicle-treated mice. -
Figure 22A shows representative H&E staining of liver sections from vehicle- and tempol-treated mice fed a high-fat diet for 14 weeks. -
Figure 22B shows representative Oil Red O staining of lipid droplets in liver sections from vehicle- and tempol-treated mice fed a high-fat diet for 14 weeks. -
Figures 22C shows liver weights from vehicle- and tempol-treated mice fed a high-fat diet for 16 weeks. -
Figures 22D shows liver weight to body weight ratios in vehicle- and tempol-treated mice fed a high-fat diet for 16 weeks. -
Figure 22E shows liver triglyceride (TG) contents from vehicle- and tempol-treated mice fed a high-fat diet for 16 weeks. -
Figure 23A shows representative H&E staining of liver sections from vehicle- and tempol-treated mice fed a high-fat diet for 16 weeks. -
Figures 23B shows liver weights from vehicle- and tempol-treated mice fed a high-fat diet for 16 weeks. -
Figures 23C shows liver weight to body weight ratios from vehicle- and tempol-treated mice fed a high-fat diet for 16 weeks. -
Figure 23D shows liver TG contents from vehicle- and antibiotic-treated fed a high-fat diet for 16 weeks. -
Figure 24A shows a scores scatter plot of a PCA model of ileum ions from vehicle- and antibiotic-treated mice fed a high-fat diet for 7 weeks. -
Figure 24B shows loadings scatter plot of a PCA model of ileum ions in vehicle- and antibiotic-treated mice fed a high-fat diet for 7 weeks. The p[1] and p[2] values represent the contributing weights of each ion toprincipal components -
Figure 25A shows the ratio of individual taurine-conjugated bile acids to total bile acids in the ileum from vehicle- and antibiotic-treated mice fed a high-fat diet for 14 weeks. -
Figure 25B shows the ratio of individual taurine-conjugated bile acids to total bile acids in the ileum from vehicle- and tempol-treated mice fed a high-fat diet for 7 weeks.. -
Figure 26A shows fecal BSH enzyme activity from vehicle- and antibiotic-treated mice fed a high-fat diet for 7 weeks. n=4-5 mice per group. -
Figure 26B shows western blot analysis of ileum FXR expression in mice fed a high-fat diet for 12 weeks. Each lane represents one mouse. -
Figure 26C shows Fxr mRNA levels and mRNA levels of the FXR target genes Shp and Fgf15 in the ileum from mice fed a high-fat diet for 12 weeks. n=3 mice per group. -
Figure 26D shows mRNA levels of the FXR target genes Shp and Fgf15 in the ileum from vehicle- and antibiotic-treated mice fed a high-fat diet for 7 weeks. n=3 mice per group. -
Figure 26E shows mRNA levels of the FXR target genes Shp and Fgf15 in the ileum after 24 hours of treatment of mice fed a high-fat diet for 7 weeks with vehicle, taurocholic acid (TCA), and taurine-β-muricholic acid (TβMCA) with TCA. n=3 mice per group. -
Figure 27A shows a representative H&E staining of liver sections from control-floxed (Fxr fl/fl) mice and intestine-specific knockout mice (Fxr Δ1E) mice fed a high-fat diet for 14 weeks. -
Figure 27B shows a representative Oil Red O staining of lipid droplets in liver sections from Fxr fl/fl and Fxr Δ1E mice fed a high-fat diet for 14 weeks. -
Figure 27C shows liver weights from Fxr fl/fl and Fxr Δ1E mice fed a high-fat diet for 14 weeks. -
Figure 27D shows liver triglyceride contents from Fxr fl/fl and Fxr Δ1E mice fed a high-fat diet for 14 weeks. -
Figure 28A shows mRNA levels of mitochondrial oxidative phosphorylation (OXPHOS) related enzymes from the ileum mucosa from Fxr fl/fl and Fxr Δ1E mice fed a high-fat diet for 14 weeks. -
Figure 28B shows mRNA levels of mitochondrial oxidative phosphorylation (OXPHOS)-related genes from ileum mucosa of vehicle- and antibiotic-treated mice fed a high-fat diet for 7 weeks. n=3 mice per group. -
Figure 28C shows measured state III respiration for complex-I- and complex-II-dependent respiration from the ileum mucosa from Fxr fl/fl and Fxr Δ1E mice fed a high-fat diet for 12 weeks. -
Figure 28D shows ATP levels in the ileum mucosa of Fxr fl/fl mice and Fxr Δ1E mice fed a high-fat diet for 7 weeks. -
Figure 29A shows serum free fatty acids. The bars for each fatty acid, from left to right, are from vehicle-treated Fxr fl/fl mice, tempol-treated Fxr fl/fl mice, vehicle-treated Fxr Δ1E mice and tempol-treated Fxr ΔIE mice. -
Figure 29B shows serum ceramides from vehicle- and antibiotic-treated mice fed a high-fat diet for 7 weeks..n=3 mice per group. -
Figure 29C shows expression of mRNAs encoding ceramide synthesis- and catabolism-related enzymes in the ileum from Fxr fl/fl and Fxr Δ1E mice fed a high-fat diet for 14 weeks. -
Figure 29D shows levels of mRNAs encoding ceramide synthesis- and catabolism-related enzymes in the ileum after 7 weeks antibiotic of treatment of mice fed a high-fat diet for 14 weeks. -
Figure 30A shows the structure of MS fragments derived from ceramides and -
Figure 30B-30G shows tandem MS and chemical structures of the various ceramides. -
Figure 31A shows liver TG contents in vehicle- and antibiotic-treated mice fed a high-fat diet for 3 days. -
Figure 31B shows Fxr, Shp and Fgf15 mRNA levels in the ileum of mice fed a high-fat diet for 14 weeks and then treated with vehicle or antibiotic for 3 days. -
Figure 31C shows the profile of ceramides from ileum from mice fed a high-fat diet for 14 weeks, and then treated with vehicle or antibiotic for 3 days. -
Figure 31D shows primary hepatocyte triglyceride (TG) content after 24 hours of incubation with vehicle and 2 µM, 5 µM and 10 µM ceramide (n=4). -
Figure 31E shows mRNA levels of fatty acid synthesis, triglyceride synthesis, and fatty acid catabolism related genes in primary hepatocytes after 16 hours of incubation with vehicle and 2 µM, 5 µM and 10 µM ceramide (left to right bar for each mRNA, respectively, n=5). -
Figure 31F shows western blot analysis of nuclear SREBP1-N expression in primary hepatocytes after 24 hours of incubation with vehicle, and 2µM and 10µM ceramide (n=3). -
Figure 31G shows western blot analysis of CIDEA expression in primary hepatocytes after 24 hours of incubation with vehicle, and 2 µM and 10 µM ceramide (n=3). -
Figure 32A shows levels of mRNAs encoding fatty acid synthesis and triglyceride synthesis related enzymes in the livers from vehicle- and antibiotic-treated mice fed a high-fat diet for 14 weeks. -
Figure 32B shows expression of mRNAs encoding enzymes involved in fatty acid and triglyceride synthesis in the livers of Fxr fl/fl and Fxr ΔIE mice fed a high-fat diet for 14 weeks. -
Figure 32C shows mRNA levels of fatty acid oxidation-related genes in the livers from mice fed a high-fat diet for 7 weeks. -
Figure 32D shows mRNA levels of fatty acid oxidation-related genes in the livers from Fxr fl/fl mice and Fxr ΔIE mice fed a high-fat diet for 14 weeks. -
Figure 32E shows western blot analysis of SREBP1-N protein expression in livers from vehicle- and antibiotic-treated mice fed a high-fat diet for 7 weeks. LAMIN A/C is used as a loading control (n=3). -
Figure 32F shows western blot analysis of CIDEA protein expression in livers of vehicle- and antibiotic-treated mice fed a high-fat diet for 7 weeks. β-ACTIN is used as a loading control (n=3). -
Figure 32G shows Cyp7a1mRNA levels in the livers of vehicle- and antibiotic-treated mice fed a high-fat diet for 7 weeks (n=3). -
Figure 32H shows Cyp7a1mRNA levels in the livers of vehicle- and tempol-treated mice fed a high-fat diet for 7 weeks (n=3). -
Figure 32I shows mRNA levels of inflammation related genes in the livers of vehicle- and antibiotic-treated fed a high-fat diet for 7 weeks. (n=3). -
Figure 32J shows mRNA levels of inflammation related genes in the livers of vehicle- and tempol-treated mice fed a high-fat diet for 7 weeks (n=3). -
Figure 33A shows a representative H&E staining of liver sections from vehicle- and antibiotic-treated Fxr fl/fl and Fxr ΔIE mice fed a high-fat diet for 14 weeks. -
Figure 33B shows Oil red O staining of lipid droplets in liver sections from vehicle- and antibiotic-treated Fxr fl/fl and Fxr ΔIE mice fed a high-fat diet for 14 weeks. -
Figure 33C shows liver weights of vehicle- and antibiotic-treated Fxr fl/fl and Fxr ΔIE mice fed a high-fat diet for 14 weeks. -
Figure 33D shows liver weight to body weight ratios of vehicle- and antibiotic-treated Fxr fl/fl and Fxr ΔIE mice fed a high-fat diet for 14 weeks. -
Figure 33E shows liver triglyceride contents of vehicle and antibiotic-treated Fxr fl/fl and Fxr ΔIE mice fed a high-fat diet for 14 weeks. -
Figure 33F shows lipidomics profile of ceramides in ileum of vehicle- and antibiotic-treated Fxr fl/fl and Fxr ΔIE mice fed a high-fat diet for 14 weeks (bars from left to right for each ceramide, respectively). -
Figure 33G shows serum ceramides levels from vehicle- and antibiotic-treated Fxr fl/fl and Fxr ΔIE mice fed a high-fat diet for 14 weeks (bars from left to right for each ceramide, respectively). -
Figure 34A shows representative H&E staining of liver sections from vehicle- and tempol-treated Fxr fl/fl and Fxr ΔIE mice fed a high-fat diet for 14 weeks. -
Figure 34B shows Oil red O staining of lipid droplets in liver sections from vehicle and tempol-treated Fxr fl/fl mice and Fxr ΔIE mice on a high-fat diet for 14 weeks. -
Figure 34C shows liver weights -of vehicle and tempol-treated Fxr fl/fl mice and Fxr Δ1E mice on a high-fat diet for 14 weeks. -
Figure 34D shows liver weight to body weight ratios from vehicle- and tempol-treated Fxr fl/fl mice and Fxr ΔIE mice on a high-fat diet for 14 weeks. -
Figure 34E shows liver triglyceride levels from vehicle- and tempol-treated Fxr fl/fl mice and Fxr Δ1E mice on a high-fat diet for 14 weeks. -
Figure 34F shows mRNA levels of fatty acid synthesis, triglyceride synthesis, and fatty acid catabolism related genes in livers from vehicle and tempol-treated Fxr fl/fl mice and Fxr Δ1E mice on a high-fat diet for 14 weeks. The bars under each mRNA from left to right are vehicle-treated Fxr fl/fl , tempol-treated Fxr fl/fl, vehicle-treated Fxr ΔIE, tempol-treated Fxr ΔIE mice. -
Figure 34G shows western blot analysis of liver nuclear SREBP1-N expression after tempol treatment of Fxr fl/fl and Fxr ΔIE, mice on a high-fat diet for 16 weeks. Each lane represents an individual mouse. -
Figure 34H shows western blot analysis of liver CIDEA expression after tempol treatment of Fxr fl/fl and Fxr ΔIE, mice on a high-fat diet for 16 weeks. Each lane represents an individual mouse. -
Figure 35 shows the metabolism of the positive control tauro-β-murichollic acid (TβMCA) and glycine-β-muricholic acid (Gly-MCA) to the product β-murichlolic acid (TβMCA) after incubation with fecal protein containing intestinal bacteria. -
Figure 36 shows concentrations of Gly-MCA in mouse ileum after oral gavage of 0, 1, 5, and 50 mg/kg of Gly-MCA. -
Figure 37A shows serum aminotransferase (ALT) levels in mice after 24 hours of treatment with Gly-MCA. -
Figure 37B shows aspartate aminotransferase (ALT) levels in mice after 24 hours of treatment with Gly-MCA. -
Figure 38 shows luciferase activity observed in HEK293T fibroblasts transiently co-transfected with a chimeric receptor construct as a function of concentration of the added FXR agonist GW4064 in the presence and absence of Gly-MCA. -
Figure 39 shows Shp mRNA expression in differentiated Caco-2 cells treated with 100 µM CDCA and vehicle (control), or 100 µM and 200 µM Gly-MCA with 100 µM CDCA (n=3). -
Figure 40A shows levels of Shp mRNA in differentiated Caco-2 cells after treatment with 100 µM and 200 µM Gly-MCA and with 2 µM GW4064 or 5 µM GW4064 (n=3). For each dosage of Gly-MCA from left to right is shown further treatment with no GW4064, 2 µM GW4064, and 5 µM GW4064. -
Figure 40B shows levels of Fgf19 mRNA in differentiated Caco-2 cells after treatment with 100 µM and 200 µM Gly-MCA and with 2 µM GW4064 or 5 µM GW4064 (n=3). For each dosage of Gly-MCA from left to right is shown further treatment with no GW4064, 2 µM GW4064, and 5 µM GW4064. -
Figure 40C shows levels of Atp5g mRNAs in differentiated Caco-2 cells after treatment with 100 µM and 200 µM Gly-MCA and with 2 µM or 5µM GW4064 (n=3). For each dosage of Gly-MCA from left to right is shown treatment with no GW4064, 2 µM GW4064, and 5 µM GW4064. -
Figures 41A and 41B show growth curves of changes in body mass (A) and % changes in initial body weight (B), over the course of 9 weeks, of vehicle- and Gly-MCA-treated mice, respectively, fed a high-fat diet. n=5 mice per group. -
Figures 41C and 41D show body composition as determined by NMR to show the fat mass (C) and fat mass to lean mass ratio (D) in vehicle and Gly-MCA-treated mice, respectively, after 9 weeks on a high-fat diet. n=5 mice per group. -
Figure 42A shows cumulative food intake per day averaged over a period of 1 week (from 6 to 7 weeks) in vehicle- and Gly-MCA-treated mice fed a high-fat diet. -
Figure 42B shows 24 h energy expenditure using an indirect energy balance (TEEbal) for an average period of 1 week (from 6 to 7 weeks) in vehicle- and Gly-MCA-treated mice fed a high-fat diet. n=5 mice per group. -
Figure 43A shows the glucose tolerance test (GTT) in vehicle- and Gly-MCA-treated mice after 6 to 7 weeks of feeding a high-fat diet. n=5 mice per group. -
Figure 43B shows the area under the curve (AUC) of the glucose tolerance test depicted inFigure 45A . -
Figure 43C shows the insulin tolerance test (ITT) in vehicle- and Gly-MCA-treated mice after 6 to 7 weeks of feeding a high-fat diet. n=5 mice per group. -
Figure 44A shows representative H&E staining of liver sections in vehicle- and Gly-MCA-treated mice fed a high-fat diet for 7 weeks. -
Figures 44B shows liver weights in vehicle- and Gly-MCA-treated mice fed a high-fat diet for 7 weeks. n=5 mice per group. -
Figures 44C shows liver weight to body weight ratios in vehicle- and Gly-MCA-treated mice fed a high-fat diet for 7 weeks. n=5 mice per group. -
Figure 44D shows liver triglyceride content of vehicle- and Gly-MCA-treated mice fed a high-fat diet for 9 weeks. n=5 mice per group. -
Figures 45A and 45B show serum alanine aminotransferase (ALT) and aspartate aminotransferase (AST) levels of vehicle- and Gly-MCA-treated mice, respectively, fed a high-fat diet for 9 weeks. n=5 mice per group. -
Figure 46A shows a scores scatter plot of a PCA model of feces ions from vehicle- and Gly-MCA-treated mice fed a high-fat diet for 9 weeks. -
Figure 46B shows a scatter plot of partial least squares discriminant analysis (PLS-DA) of feces ions from vehicle and Gly-MCA-treated mice fed a high-fat diet for 9 weeks. Each point represents an individual mouse feces ion. The labeled ions are identified as β-MCA, TβMCA, taurocholic acid (TCA) and Gly-MCA, which are affected by Gly-MCA treatment. The p(corr)[1]P values represent the interclass difference and p[1]P values represent the relative abundance of the ions. Data were obtained in negative ionization mode (ESI-). -
Figure 46C shows individual bile acid compositions in feces ions from vehicle- and Gly-MCA-treated mice fed a high-fat diet for 9 weeks. -
Figure 46D shows Gly-MCA levels in feces of vehicle- and Gly-MCA-treated mice fed a high-fat diet for 9 weeks. n=5 mice per group. All data are presented as mean ± SD. -
Figure 47A shows a scores scatter plot of a PCA model of ileum ions in vehicle- and Gly-MCA-treated mice fed a high-fat diet for 9 weeks. -
Figure 47B shows a scatter plot of PLS-DA of ileum ions from vehicle and Gly-MCA-treated mice fed a high-fat diet for 9 weeks. Each point represents an individual mouse feces ion. The labeled ions are identified as T-α-MCA, TβMCA, taurocholic acid (TCA), tauroursodeoxycholic acid (TUDCA), taurodeoxycholic acid (TDCA) and taurochenodeoxycholic acid (TCDCA) and Gly-MCA, which are induced by Gly-MCA treatment. The p(corr)[1]P values represent the interclass difference and p[1]P values represent the relative abundance of the ions. All the data are obtained in negative mode (ESI-). -
Figure 47C shows the bile acid composition in ileum from vehicle and Gly-MCA-treated mice fed a high-fat diet for 9 weeks. -
Figure 47D shows Gly-MCA levels in ileum of vehicle- and Gly-MCA-treated mice fed a high-fat diet for 9 weeks. n=5 mice per group. All data are presented as mean ± SD. -
Figure 48 shows serum total triglyceride levels of vehicle- and Gly-MCA-treated mice fed a high-fat diet for 9 weeks. n=5 mice per group. -
Figure 48 shows the profile of serum triglyceride species from vehicle- and Gly-MCA-treated mice fed a high-fat diet for 9 weeks. n=5 mice per group. All data are presented as mean ± SD. -
Figure 49 shows profiles of serum ceramides from vehicle- and Gly-MCA-treated mice fed a high-fat diet for 9 weeks. n=5 mice per group. -
Figure 49 shows profiles of ileum ceramides from vehicle- and Gly-MCA-treated mice fed a high-fat diet for 9 weeks. n=5 mice per group. All data are presented as mean ± SD. -
Figure 50A shows mRNA levels of FXR target genes Shp and Fgf15 in the ileum of vehicle- and Gly-MCA-treated mice fed a high-fat diet for 9 weeks. n=5 mice per group. -
Figure 50B shows levels of mRNAs encoding genes involved in ceramide metabolism in ileum from vehicle- and Gly-MCA-treated mice fed a high-fat diet for 9 weeks. n=5 mice per group. All data are presented as mean ± SD. -
Figure 51A shows mRNA levels of the FXR target gene Shp in the liver of vehicle- and Gly-MCA-treated mice fed a high-fat diet for 9 weeks. n=5 mice per group. -
Figure 51B shows mRNA levels of Cyp7a1 in the liver of vehicle- and Gly-MCA-treated mice fed a high-fat diet for 9 weeks. n=5 mice per group. All data are presented as mean ± SD. -
Figure 52 shows growth curves of genetically obese leptin receptor-deficient (db/db) treated with vehicle and Gly-MCA for 6 weeks. n=5 mice per group. All data are presented as mean ± SD. -
Figures 53A and 53B show the body composition, as determined by NMR, of the fat mass, and fat mass to lean mass ratio in db/db mice treated with vehicle and Gly-MCA for 6 weeks. n=5 mice per group. All data are presented as mean ± SD. -
Figure 54A shows representative H&E staining of liver sections in db/db mice treated with vehicle and Gly-MCA for 6 weeks. n=5 mice per group. -
Figure 54B and 54C shows liver weights, and liver weight to body weight ratios in db/db mice treated with vehicle and Gly-MCA for 6 weeks. n=5 mice per group. -
Figure 54D shows liver triglyceride content of db/db mice treated with vehicle and Gly-MCA for 6 weeks. n=5 mice per group. All data are presented as mean ± SD. -
Figures 55A and 55B show serum ALT and AST levels in db/db mice treated with vehicle and Gly-MCA for 6 weeks. n=5 mice per group. All data are presented as mean ± SD. -
Figures 56A and56B shows the bile acid composition in feces and ileum from vehicle and Gly-MCA-treated db/db mice for 6 weeks. n=5 mice per group. -
Figure 56C shows relative levels of Gly-MCA in ileum, feces, liver and serum of vehicle and Gly-MCA-treated db/db mice for 6 weeks. n=5 mice per group. All data are presented as mean ± SD. -
Figure 57A shows the profile of serum triglyceride species in db/db mice treated with vehicle and Gly-MCA for 6 weeks. n=5 mice per group. -
Figure 57B and 57C shows profiles of serum and ileum ceramides species from vehicle and Gly-MCA-treated mice fed a high-fat diet for 9 weeks. n=5 mice per group. All data are presented as mean ± SD. -
Figure 58 show the curves of body mass of HFD-induced obese mice treated with vehicle- and Gly-MCA for 6 weeks. n=5 mice per group. -
Figure 59 show body composition as determined by NMR in high-fat diet-induced obese mice treated with vehicle- and Gly-MCA for 6 weeks. n=5 mice per group. -
Figure 60A shows representative H&E staining of liver sections in high-fat diet-induced obese mice treated with vehicle- and Gly-MCA for 6 weeks. n=5 mice per group. -
Figure 60B and 60C shows liver weights and liver weight to body weight ratios in high-fat diet-induced obese mice treated with vehicle- and Gly-MCA for 6 weeks. n=5 mice per group. -
Figures 61A and61B shows the bile acid composition in feces and ileum from high-fat diet-induced obese mice treated with vehicle- and Gly-MCA for 6 weeks. n=5 mice per group. -
Figure 61C shows relative levels of Gly-MCA in the ileum, feces, liver and serum of vehicle and Gly-MCA-treated high-fat diet-induced obese mice for 6 weeks. n=5 mice per group. All data are presented as mean ± SD. - The present invention provides a compound represented by the structure illustrated in
claim 1, or a pharmaceutically acceptable salt thereof, for use in treating or preventing a disease or disorder selected from obesity, insulin resistance, and non alcoholic fatty liver disease in a mammal in need thereof. - In accordance with the invention, the compound for use in the treatment or prevention of obesity, insulin resistance or non-alcoholic fatty liver disease is

- The phrase "pharmaceutically acceptable salt" is intended to include nontoxic salts synthesized from the parent compound which contains a basic or acidic moiety by conventional chemical methods. Generally, such salts can be prepared by reacting the free acid or base forms of these compounds with a stoichiometric amount of the appropriate base or acid in water or in an organic solvent, or in a mixture of the two. Generally, nonaqueous media such as ether, ethyl acetate, ethanol, isopropanol, or acetonitrile are preferred. Lists of suitable salts are found in Remington's Pharmaceutical Sciences, 18th ed., Mack Publishing Company, Easton, PA, 1990, p. 1445, and Journal of Pharmaceutical Science, 66, 2-19 (1977).
- Suitable bases include inorganic bases such as alkali and alkaline earth metal bases, e.g., those containing metallic cations such as sodium, potassium, magnesium, calcium and the like. Non-limiting examples of suitable bases include sodium hydroxide, potassium hydroxide, sodium carbonate, and potassium carbonate. Suitable acids include inorganic acids such as hydrochloric acid, hydrobromic acid, hydroiodic acid, sulfuric acid, phosphoric acid, and the like, and organic acids such as p-toluenesulfonic, methanesulfonic acid, benzenesulfonic acid, oxalic acid, p-bromophenylsulfonic acid, carbonic acid, succinic acid, citric acid, benzoic acid, acetic acid, maleic acid, tartaric acid, fatty acids, long chain fatty acids, and the like. Preferred pharmaceutically acceptable salts of the compound for use according to
claim 1 having an acidic moiety include sodium and potassium salts. The compound for use according to the present invention containing an acidic moiety is useful in the form of the free acid or in the form of a pharmaceutically acceptable salt thereof. - It should be recognized that the particular counterion forming a part of any salt of this invention is usually not of a critical nature, so long as the salt as a whole is pharmacologically acceptable and as long as the counterion does not contribute undesired qualities to the salt as a whole.
- It is further understood that the above compound and salts may form solvates, or exist in a substantially uncomplexed form, such as the anhydrous form. As used herein, the term "solvate" refers to a molecular complex wherein the solvent molecule, such as the crystallizing solvent, is incorporated into the crystal lattice. When the solvent incorporated in the solvate is water, the molecular complex is called a hydrate. Pharmaceutically acceptable solvates include hydrates, alcoholates such as methanolates and ethanolates, acetonitrilates and the like. These compounds can also exist in polymorphic forms.
- The present disclosure is further directed to a pharmaceutical composition comprising a pharmaceutically acceptable carrier and at least one compound or salt described herein.
- It is preferred that the pharmaceutically acceptable carrier be one that is chemically inert to the active compounds and one that has no detrimental side effects or toxicity under the conditions of use.
- The choice of carrier will be determined in part by the particular compound of the present disclosure chosen, as well as by the particular method used to administer the composition. Accordingly, there is a wide variety of suitable formulations of the pharmaceutical composition of the present disclosure. In certain embodiments, the formulation is suitable for administration to the alimentary tract, and in particular, to the small intestine.
- Formulations suitable for oral administration can consist of (a) liquid solutions, such as a therapeutically effective amount of the inventive compound dissolved in diluents, such as water, saline, or orange juice, (b) capsules, sachets, tablets, lozenges, and troches, each containing a predetermined amount of the active ingredient, as solids or granules, (c) powders, (d) suspensions in an appropriate liquid, and (e) suitable emulsions. Liquid formulations may include diluents, such as water and alcohols, for example, ethanol, benzyl alcohol, and the polyethylene alcohols, either with or without the addition of a pharmaceutically acceptable surfactant, suspending agent, or emulsifying agent. Capsule forms can be of the ordinary hard- or soft-shelled gelatin type containing, for example, surfactants, lubricants, and inert fillers, such as lactose, sucrose, calcium phosphate, and corn starch. Tablet forms can include one or more of lactose, sucrose, mannitol, corn starch, potato starch, alginic acid, microcrystalline cellulose, acacia, gelatin, guar gum, colloidal silicon dioxide, croscarmellose sodium, talc, magnesium stearate, calcium stearate, zinc stearate, stearic acid, and other excipients, colorants, diluents, buffering agents, disintegrating agents, moistening agents, preservatives, flavoring agents, and pharmacologically compatible excipients. Lozenge forms can comprise the active ingredient in a flavor, usually sucrose and acacia or tragacanth, as well as pastilles comprising the active ingredient in an inert base, such as gelatin and glycerin, or sucrose and acacia, emulsions, gels, and the like containing, in addition to the active ingredient, such excipients as are known in the art.
- In some embodiments, the formulation can be suitable to prolonging the amount of time that the compound of the present disclosure is contacted with the alimentary tract of the mammal, and in particular with the small intestine of the mammal. In this regard, various formulations such as extended release formulation and formulations designed to prolong the amount of time that the compound is retained in the stomach before release into the small intestine can be utilized. A number of suitable formulations are presented in Remington: The Science and Practice of Pharmacy, Gennaro, A.R., ed., pp. 858-929, Lippincott Williams and Wilkins (2000).
- In some embodiments, the compound or salt for use according to the present invention can be administered in the form of a food additive, that is, in admixture with foodstuffs or beverages. For use as a food additive, the compound or salt can be mixed with a foodstuff or beverage per se, or can be formulated as a composition comprising one or more suitable excipients prior to mixing with a foodstuff or beverage. The foodstuff or beverage can be any suitable foodstuff or beverage. In some embodiments, the foodstuff or beverage has a relatively high fat content.
- It will be appreciated by one of ordinary skill in the art that, in addition to the aforedescribed pharmaceutical compositions, the compound or salt for use according to the present invention may be formulated as inclusion complexes, such as cyclodextrin inclusion complexes, or liposomes. Liposomes serve to target the compounds to a particular tissue, such as lymphoid tissue or cancerous hepatic cells. Liposomes can also be used to increase the half-life of the inventive compound. Liposomes useful in the present invention include emulsions, foams, micelles, insoluble monolayers, liquid crystals, phospholipid dispersions, lamellar layers and the like. In these preparations, the active agent to be delivered is incorporated as part of a liposome, alone or in conjunction with a suitable chemotherapeutic agent. Thus, liposomes filled with the compound for use according to the invention or salt thereof, can be directed to the site of a specific tissue type, hepatic cells, for example, where the liposomes then deliver the selected compositions. Liposomes for use in the invention are formed from standard vesicle-forming lipids, which generally include neutral and negatively charged phospholipids and a sterol, such as cholesterol. The selection of lipids is generally guided by consideration of, for example, liposome size and stability of the liposomes in the blood stream. A variety of methods are available for preparing liposomes, as described in, for example, Szoka et al., Ann. Rev. Biophys. Bioeng., 9, 467 (1980), and
U.S. Patents 4,235,871 ,4,501,728 ,4,837,028 , and5,019,369 . For targeting to the cells of a particular tissue type, a ligand to be incorporated into the liposome can include, for example, antibodies or fragments thereof specific for cell surface determinants of the targeted tissue type. A liposome suspension containing a compound or salt of the present invention may be administered intravenously, locally, topically, etc. in a dose that varies according to the mode of administration, the agent being delivered, and the stage of disease being treated. - In certain embodiments, the pharmaceutical composition can be administered parenterally, e.g., intravenously, subcutaneously, intradermally, or intramuscularly. Thus, the disclosure provides compositions for parenteral administration that comprise a solution or suspension of the compound or salt for use according to the invention dissolved or suspended in an acceptable carrier suitable for parenteral administration, including aqueous and non-aqueous isotonic sterile injection solutions. Many such compositions are known in the art.
- In accordance with an embodiment, the disclosure provides a method of inhibiting a farnesoid X receptor in a mammal in need thereof, which method comprises administering to the mammal an effective amount of a compound for use according to the invention.
- Preferably, the animal is a mammal. More preferably, the mammal is a human.
- The term "mammal" includes, but is not limited to, the order Rodentia, such as mice, and the order Logomorpha, such as rabbits. It is preferred that the mammals are from the order Carnivora, including Felines (cats) and Canines (dogs). It is more preferred that the mammals are from the order Artiodactyla, including Bovines (cows) and Swines (pigs) or of the order Perssodactyla, including Equines (horses). It is most preferred that the mammals are of the order Primates, Ceboids, or Simioids (monkeys) or of the order Anthropoids (humans and apes). An especially preferred mammal is the human.
- According to the invention, the FXR mediated disease to be treated is chosen from obesity, insulin resistance and non-alcoholic fatty liver disease.
- In accordance with a preferred embodiment, the invention provides a compound for use in treating or preventing obesity in a mammal in need thereof, comprising administering to the mammal an effective amount of a compound or salt of the invention.
- As used herein, obesity can be considered as a condition in which excess body fat may put a person at health risk (see Barlow and Dietz, Pediatrics 102: E29, 1998; National Institutes of Health, Obes. Res. 6 (suppl. 2):51S-209S, 1998). Excess body fat is a result of an imbalance of energy intake and energy expenditure. In one embodiment in humans, the Body Mass Index (BMI) is used to assess obesity. In one embodiment, a BMI of 25.0 kg/m to 29.9 kg/m2 is overweight (also called grade I obesity), while a BMI of 30 kg/m2 is truly obese (also called grade II obesity).
- In another embodiment in humans, waist circumference is used to assess obesity. In this embodiment, in men a waist circumference of 102 cm or more is considered obese, while in women a waist circumference of 89 cm or more is considered obese. Strong evidence shows that obesity affects both the morbidity and mortality of individuals. For example, an obese individual is at increased risk for heart disease, non-insulin dependent (type 2) diabetes, hypertension, stroke, cancer (e.g. endometrial, breast, prostate, and colon cancer), dyslipidemia, gall bladder disease, sleep apnea, reduced fertility, and osteoarthritis, amongst others (see Lyznicki et al., Am. Fam. Phys. 63:2185, 2001).
- The dose administered to a mammal, particularly, a human, in accordance with the present disclosure should be sufficient to effect the desired response. Such responses include reversal or prevention of the undesirable effects of the disease or disorder mediated by the farnesoid X receptor expressed in the intestine for which treatment is desired or to elicit the desired benefit. According to the invention, the disorder is non-alcoholic fatty liver disease, obesity and
type 2 diabetes (insulin resistance). One skilled in the art will recognize that dosage will depend upon a variety of factors, including the age, condition, and body weight of the human, as well as the extent of the non-alcoholic fatty liver disease in the human. The size of the dose will also be determined by the route, timing and frequency of administration as well as the existence, nature, and extent of any adverse side-effects that might accompany the administration of a particular compound and the desired physiological effect. It will be appreciated by one of skill in the art that successful treatment of non-alcoholic fatty liver disease, obesity ortype 2 diabetes (insulin resistance) may require prolonged treatment involving multiple administrations. - In this regard, treatment of NAFLD via inhibition of the intestinal farnesoid X receptor can be regarded as a reduction in the clinical manifestations of hepatic steatosis in a mammal. While in many cases NAFLD does not cause signs or symptoms, NAFLD may cause fatigue, pain, particularly in the upper right abdomen, and weight loss. In some instances, NAFLD may progress to nonalcoholic steatohepatitis, an inflammation in the liver. NAFLD may progress to nonalcoholic fatty liver disease-associated cirrhosis which is a scarring of the liver accompanied by markedly decreased liver function. Over time, scarring can become so severe that the liver no longer functions adequately.
- NAFLD can be assessed, for example, by ultrasound, computed tomography, magnetic resonance studies, or by liver biopsy. In certain embodiments, the mammal is consuming a high fat diet. A high fat diet can be considered as one that provides more than 30% of energy as fat (see, for example, Churchill Livingstone's Dictionary of Sport and Exercise Science and Medicine, S. Jennett, Elsevier Limited, 2008). In other embodiments, the disclosure provides a method of preventing non-alcoholic fatty liver disease in a mammal. Preventing non-alcoholic fatty liver disease can be regarded as reducing an expected manifestation of hepatic steatosis in a mammal that is subjected to a dietary change from a low fat or intermediate fat diet to a high fat diet.
- Currently, no standard treatment for NAFLD exists. Physicians typically treat the risk factors that contribute to the disease. For example, physicians assist afflicted patients with weight loss programs and choice of a healthy diet, control of diabetes, and lowering of cholesterol.
- In this regard, treatment of obesity via inhibition of the farnesoid X receptor can be regarded as a reduction in the rate of weight gain in a mammal. In certain embodiments, the mammal is consuming a high fat diet. A high fat diet can be consider as one which provides more than 30% of energy as fat (see, for example, Churchill Livingstone's Dictionary of Sport and Exercise Science and Medicine, S. Jennett, Elsevier Limited, 2008). In other embodiments, the disclosure provides a method of preventing obesity in a mammal. Preventing obesity can be regarded as reducing an expected weight gain in a normal weight mammal that is subjected to a dietary change from a low fat or intermediate fat diet to a high fat diet.
- In this regard, treatment of diabetes via inhibition of the farnesoid X receptor can be regarded as a reduction of insulin resistance in a patient afflicted therewith. Insulin resistance can result in hyperglycemia, and a reduction in insulin resistance can result in a lowering of blood glucose levels. Non-limiting examples of symptoms that be treated via inhibition of the farnesoid X receptor include brain fogginess and inability to focus, high blood sugar, intestinal bloating, sleepiness, weight gain, fat storage, difficulty losing weight, increased blood triglyceride levels, increased blood pressure, increased pro-inflammatory cytokines associated with cardiovascular disease, depression, acanthosis nigricans, and increased hunger.
- The dose administered to a mammal, particularly, a human, in accordance with the present disclosure should be sufficient to effect the desired response. Such responses include reversal or prevention of the bad effects of the disease or disorder mediated by the farnesoid X receptor for which treatment is desired or to elicit the desired benefit. In certain embodiments, the disorder is obesity. One skilled in the art will recognize that dosage will depend upon a variety of factors, including the age, condition, and body weight of the human, as well as the extent of the obesity in the human. The size of the dose will also be determined by the route, timing and frequency of administration as well as the existence, nature, and extent of any adverse side-effects that might accompany the administration of a particular compound and the desired physiological effect. It will be appreciated by one of skill in the art that successful treatment of obesity or other disease or disorder may require prolonged treatment involving multiple administrations.
- In this regard, treatment of obesity via inhibition of the farnesoid X receptor can be regarded as a reduction in the rate of weight gain in a mammal. In certain embodiments, the mammal is consuming a high fat diet. A high fat diet can be consider as one which provides more than 30% of energy as fat (see, for example, Churchill Livingstone's Dictionary of Sport and Exercise Science and Medicine, S. Jennett, Elsevier Limited (2008)). In other embodiments, the disclosure provides a method of preventing obesity in a mammal. Preventing obesity can be regarded as reducing an expected weight gain in a normal weight mammal that is subjected to a dietary change from a low fat or intermediate fat diet to a high fat diet.
- Suitable doses and dosage regimens can be determined by conventional range-finding techniques known to those of ordinary skill in the art. Generally, treatment is initiated with smaller dosages that are less than the optimum dose of the compound. Thereafter, the dosage is increased by small increments until the optimum effect under the circumstances is reached. The present method typically will involve the administration of about 0.1 to about 300 mg (e.g., about 0.1 to about 150 mg, about 0.1 to about 100 mg, or about 0.1 to about 50 mg) of one or more of the compounds described above per kg body weight of the mammal.
- The therapeutically effective amount of the compound or compounds administered can vary depending upon the desired effects and the factors noted above. Typically, dosages will be between 0.01 mg/kg and 250 mg/kg of the subject's body weight, and more typically between about 0.05 mg/kg and 100 mg/kg, such as from about 0.2 to about 80 mg/kg, from about 5 to about 40 mg/kg or from about 10 to about 30 mg/kg of the subject's body weight. Thus, unit dosage forms can be formulated based upon the suitable ranges recited above and the subject's body weight. The term "unit dosage form" as used herein refers to a physically discrete unit of therapeutic agent appropriate for the subject to be treated.
- Alternatively, dosages are calculated based on body surface area and from about 1 mg/m2 to about 200 mg/m2, such as from about 5 mg/m2 to about 100 mg/m2 will be administered to the subject per day. In particular embodiments, administration of the therapeutically effective amount of the compound or compounds involves administering to the subject from about 5 mg/m2 to about 50 mg/m2, such as from about 10 mg/m2 to about 40 mg/m2 per day. It is currently believed that a single dosage of the compound or compounds is suitable, however a therapeutically effective dosage can be supplied over an extended period of time or in multiple doses per day. Thus, unit dosage forms also can be calculated using a subject's body surface area based on the suitable ranges recited above and the desired dosing schedule.
- As demonstrated herein, farnesoid X receptor is implicated in the development of obesity. Thus, administration of inhibitors of farnesoid X receptor is expected to treat or prevent the development of obesity, particularly in a mammal consuming a high fat diet.
- Here, it has also been shown that intestinal farnesoid X receptor plays an essential role in the progression of NAFLD. Inhibition of intestinal farnesoid X receptor in embodiments of the disclosure has been shown to ameliorate NAFLD induced by a high fat diet.
- Through studies on tempol and antibiotics that remodel and kill gut bacteria, respectively, a novel pathway was uncovered in which these agents alter the population of the gut microbiota resulting in loss of bacteria that express the enzyme bile salt hydrolase (BSH). Lower BSH results in increased levels of conjugated bile acids in the intestine, such as T-β-MCA. T-β-MCA in turn is an antagonist of intestinal FXR. Lower FXR signaling in the intestine results in decreased obesity, insulin resistance and NAFLD in mice fed a high-fat diet, and in genetically obese mice. These studies led to the hypothesis that inhibiting FXR would be a promising approach for treating patients with obesity, insulin resistance and NAFLD. Oral administration of a new chemical entity glycine β-muricholic acid (Gly-MCA) decreases obesity, insulin resistance and NAFLD in high-fat diet-treated mice and in genetically obese mice. It is proposed that any compound that is orally administered and retained in the intestine and that inhibits intestinal FXR and has no effect on FXR expressed in liver, would have utility in the treatment of patients with obesity, insulin resistance and NAFLD.
- β-
Muricholic acid 9 and conjugates thereof, such as the representative embodiments of tauro-β-Muricholic acid 10 and glycine-P-Muricholic acid 16 can be prepared as illustrated in the scheme set forth inFigure 8 . Esterification of thedihydroxy acid 1 with, for example, methanol under acid catalysis providesester 2 . Protection of the A-ring hydroxyl group with ethyl chloroformate providescarbonate 3 . Oxidation of the 7-hydroxyl group with, for example potassium chromate givesketone 4 . Bromination with, for example, bromine in HBr gives bromoketone 5 . Reduction of the ketone with, for example, givesbromo alcohol 6 . Reductive elimination of bromine using, for example, zinc metal providesolefin 7 . Cis-dihydroxylation with, for example, osmium tetroxide givescis diol 8 . Hydrolysis of both esters provides β-muricholic acid 9 . β-muricholic acid 9 can be conjugated with taurine using a suitable coupling agent provides tauro-β-muricholic acid 10 . Glycine can be substituted for taurine to provide the glycine conjugate of β-muricholic acid ( 16 ). 2-aminoethylphosphonic acid can be substituted for taurine to provide the phosphonic acid analog of tauro-β-muricholic acid. The chemistry is as described in Iida, T., et al., Lipid, 16: 863-5 (1981), Iida T., et al., Journal of Lipid Research, 30: 1267-1279 (1989), and Tserng K-Y., et al., J. Lipid Research, 18: 404-407 (1977). - The following examples further illustrate the disclosure but, of course, should not be construed as in any way limiting its scope.
- The PGL4-Shp-TK firefly luciferase construct and human Fxr expression plasmid were provided by Grace L. Guo of Rutgers University. The human Asbt expression plasmid was provided by Paul A. Dawson of Wake Forest University School of Medicine. The plasmids were transfected into cells using X-TREMEGENE™ HP DNA Transfection Reagent (Roche). The cells were lysed, and luciferase activities measured with a DUAL-LUCIFERASE™ assay kit (Promega). Firefly luciferase activity was normalized to Remilla luciferase activity.
- ATP detection was performed using the following protocol. For extraction of ATP, 10 mg of ileum mucosa were homogenized with 1.0 mL of ice-cold TE saturated phenol (Sigma-Aldrich). A mixture of 200 µL of chloroform and 150 µL of deionized water were added and the homogenate thoroughly shaken for 20 s and centrifuged at 10,000 g for 5 min at 4° C. The aliquot from the supernatant was diluted 100-fold with deionized water, and 10 µL of the diluted extract was measured by ATP determination kit (Invitrogen Corp.) (Chida et al., Analytica Chimica Acta 727: 8-12 (2012).
- Tempol, bacitracin, neomycin, and streptomycin were purchased from Sigma-Aldrich (St. Louis, MO). Bile acids were ordered from Steraloids, Inc. (Newport, RI) and Sigma (St. Louis, MO), and taurocholic acid-d5 sodium salt was from Toronto Research Chemicals Inc. (Toronto, Ontario). Ceramides were obtained from Avanti Polar Lipids. HFD (60kcal% fat) were purchased from Bio-Serv (Frenchtown, NJ). T-β-MCA and Gly-MCA were synthesized as according to the scheme shown in
Figure 41 and described in Example 1. All solvents and organic reagents were of the highest grade available. - High-fat diet (HFD) (60% kcal consisting of fat) was purchased from Bioserv. Inc. Intestine-specific Fxr-null (Fxr ΔIE) mice and wild-type (Fxr fl/fl) mice had a C57BL/6N genetic background. Fxr fl/fl and Fxr ΔIE (Kim et al., J. Lipid Res. 48:2664-2672, 2007) mice were backcrossed with C57BL/6N mice for over 10 generations. For the antibiotic (the combination of bacitracin, neomycin, and streptomycin) study, male C57BL/6N mice from 6 weeks of age were fed a high-fat diet ("HFD) and administered 0.1% (w/v) of each compound (the combination of bacitracin, neomycin, and streptomycin) in the drinking water. For the tempol study, male C57BL/6N mice from 6 weeks of age were fed a HFD and administered 0.064% (w/v) tempol in the drinking water. For TβMCA in vivo, male C57BL/6N mice from 6 weeks of age were fed a HFD and treated with the antibiotics (0.1% of each compound of bacitracin, neomycin, and streptomycin combination) for 3days. Vehicle (saline), TCA (400mg/kg body weight, dissolved in saline) or a combination of TCA and TβMCA (400 mg/kg body weight of each compound, dissolved in saline) were orally administered to the mice and followed by a second dose 12 h later. The mice were killed 2 h later for tissue collection. For the Gly-MCA study, Gly-MCA was custom synthesized. Bacon-flavored dough pills were produced as described (Walker et al., Toxicol. Appl. Pharmacol. 260:65-69, 2012) for oral administration of Gly-MCA (0.25 mg Gly-MCA/pill, dose of 10 mg/kg). Mice were trained to eat the dough pills prior to the study. For the prevention of obesity, insulin resistance and NAFLD, male wild-type (WT) C57BL/6N mice, 6- to 8-weeks-old, were fed a high-fat diet (Bio-Serv, Frenchtown, NJ; 60 kcal% fat) from the age of 6 weeks and were orally administered with vehicle (control pills) or Gly-MCA (0.25 mg/pill/day, dose10 mg/kg). C57BL/6N mice fed a high-fat diet for 12 weeks were administered (0.25 mg Gly-MCA/pill, dose of 5 mg/kg). Leptin-deficient db/db mice, 6- to 8-weeks-old, fed a chow diet, were administered Gly-MCA (0.25 mg/pill/day, 10 mg/kg). Mice were housed individually in their home cages. Cumulative food intake and TEEbal were measured for 1 week in vehicle and Gly-MCA-treated mice from 6 to 7 weeks of HFD. TEEbal was measured as previously described (Ravussin et al., Int. J. Obesity 37:399-403, 2013).
- All animal studies were performed in accordance with the Institute of Laboratory Animal Resources guidelines and approved by the NCI Animal Care and Use Committee.
- Primary hepatocytes from 6-week-old C57BL/6N mice were obtained by collagenase 1 (Invitrogen, Carlsbad, CA) perfusion. The cells were purified by 45% Percoll (Sigma, St. Louis, MO) density centrifugation and cultured in DMEM (Invitrogen, Carlsbad, CA) with 10% fetal bovine serum and 1% Insulin-Transferrin-Selenium-Ethanolamine (ITS - X) (Invitrogen, Carlsbad, CA). The viability of hepatocytes was determined using trypan blue dye exclusion, and those with higher than 85% viability were used. The medium was changed to DMEM with 1% fetal bovine serum after culturing for 4 hours. After starvation for 4 hours, the cells were exposed to ceramide. At the prescribed time points, cells were harvested and subjected to qPCR analysis and TG content detection.
- The mucosa of intestine was gently scraped and liver was taken and both were flash frozen in liquid nitrogen and stored at -80° C until RNA was prepared. RNA was extracted from frozen intestine and liver using TRIzol reagent (Invitrogen, Carlsbad, CA). cDNA was synthesized from 1 µg total RNA using Superscript II reverse transcriptase (Invitrogen, Carlsbad, CA). qPCR primers were designed with qPrimerDepot. Measured mRNA levels were normalized to those of 18S ribosomal RNA and expressed as fold change relative to those of control group.
- Liver whole-cell or nuclear extracts were prepared. Membranes were incubated with antibodies against FXR (Santa Cruz Biotechnology, Inc., Santa Cruz, CA), SREBP1 (BD Biosciences, San Jose, CA), and CIDEA (Abcam, Cambridge, MA). The signals obtained were normalized to β-ACTIN (Abcam) for whole cell extract and LAMIN A/C (Santa Cruz) for nuclear extracts.
- The bacteria in feces and cecum content were extracted using PowerSoil DNA Isolation Kit (Mo Bio laboratory, Inc., Carlsbad, CA). The PCR products (approximately 1000 bps) were purified using the Agencourt AMPure technology (Beckman Coulter, Brea, CA) as described in 454 Technical Bulletin #2011-002, Short Fragment Removal Procedure. After purification, the products were quantified by both Qubit (Lifetech, Carlsbad, CA) and qPCR, using the KAPA Biosystems Library Quantification Kit (KapaBiosystems, Woburn, MA), pooled based on molar amounts, run on a 1% agarose gel and extracted. After purification with a QIAquick PCR Purification kit (Qiagen,Valencia, CA), the quality and quantity were assessed using a DNA 7500LabChip on the Agilent 2100 Bioanalyzer (Agilent Technologies, Santa Clara, CA) and Qubit quantification. The sequencing was performed using a quarter PTP plate on a 454 Life Sciences Genome Sequencer FLX+ (Roche Diagnostics, Indianapolis, IN). 16S rRNA gene sequencing analysis was performed as previously described (Lozupone and Knight, Appl. Environ. Microbiol. 71:8228-8235, 2005). Weighted UniFrac analysis to assess changes in the bacterial abundance was performed on the Galaxy web-based platform (Blankenberg et al., Bioinformatics 26:1783-1785, 2010; Goecks et al., Genome Biol. 11: 126, 2010; Giardine et al., Genome Res. 15:1451-1455, 2005).
- After quality filtering and deduplication, each sample contained on average 11 thousand reads. The Mothur software package was used to preprocess the sequencing data and the RDP multi-classifier to assign each sequence to a taxonomic rank. Preprocessing consisted of filtering reads for an average quality of 20, removing duplicated sequences and splitting into samples by barcodes while allowing for one mismatch in the barcode. To account for differences in total reads per sample, classifications were converted to percent of total reads. This approach then permitted accurate comparisons within and between groups.
- Lipidomics analysis: For
serum lipidomics analysis 25 µl serum were extracted by 4-fold cold chloroform: methanol (2:1) solution containing 2 µM LPC (17:0), PC (17:0), SM (17:0) and CER (17:0) (Avanti Polar Lipids, Alabaster, AL) as internal standards. The samples were vortexed for 30 s and then allowed to stand for 5 min at room temperature. The mixture was centrifuged at 13,000 rpm for 5 min and then the lower organic phase was collected and evaporated at room temperature under vacuum. The residue was dissolved in chloroform: methanol (1:1), followed by diluting with isopropanol: acetonitrile: H2O (2:1:1) containing 2 µM PC (17:0) prior to UPLC-MS analysis. For tissue lipidomics analysis, about 50 mg of accurately weighted tissues were homogenized with 700 µL methanol: H2O (4:3) solution and then extracted using 800 µL chloroform containing 2 µM LPC (17:0), SM (17:0) and CER (17:0) as internal standards. The homogenate was incubated at 37° C for 20 min followed by centrifuged for 20 min at 13,000 rpm. The lower organic phase was transferred to a new tube and dried under vacuum. The residue was suspended with 100 µL chloroform: methanol (1:1) solution and then diluted with isopropanol: acetonitrile: H2O (2:1:1) solution containing 2 µM PC (17:0) before injection. For lipidomics discovery, samples were analyzed by UPLC-ESI-QTOF MS using a Water Acquity CSH 1.7um C18 column (2.1x100 mm) under the following conditions: UPLC: A-acetonitrile/water (60/40), B-isopropanol/acetonitrile (90/10). Both A and B contained 10M Ammonium acetate and 0.1% formic acid. Gradient: initial 60% A to 57% A at 2 min, to 50% A at 2.1min*, to 46%A at 12 min, to 30% A at 12.1 min*, to 1% A at 18 min before returning to initial conditions at 18.5 min with equilibration for 2 additional minutes (an *indicates ballistic gradient). Flow rate was 0.4 ml/min. Column temperature was maintained at 55° C. MS, same conditions as above, except run time was 18 min. - Global metabolomics analysis: urine samples were prepared by adding 20 µL of urine to 180 µL 50% aqueous acetonitrile (50:50 water/acetonitrile). Samples were vortexed for 5 min and centrifuged at 18000×g for 20 min at 4° C to remove particulates and precipitated protein. The supernatant was transferred to an autosampler vial for analysis. 50 mg tissue samples were homogenized in 500
mL 50% aqueous acetonitrile containing 5 µM of chlorpropamide (internal standard). The samples were vortexed and centrifuged at 13,000 rpm for 20 min at 4° C to remove particulates and precipitate protein. The supernatant was transferred to an autosampler vial for analysis. For metabolomics discovery, a 5 µl aliquot of supernatant samples was injected into the UPLC-ESI-QTOFMS system (Waters, Milford, MA) with a Waters Acquity BEH 1.7um C18 (2.1x50mm) column. The gradient mobile phase comprises 0.1% formic acid in water (A) and 0.1% formic acid in acetonitrile (B). The gradient was maintained at initial 95% A for 0.5 min, to 40% A at 4min, and then to 1% A at 8min. The column was flushed for 1 min, then equilibrated at initial conditions for 1.5 min. Flow rate was 0.5ml/min. Column temperature was maintained at 60° C. Waters Synapt HDMS Q-TOF was operated in both positive and negative modes, scanning 50-850 amu, at a rate of 0.3 scans/sec. The following instrument conditions were used: capillary 3kV,source temperature 120° C, sampling cove 30V, desolvation gas flow 850 L/h at 400° C. Biomarker identification and quantitation: Biomarkers were screened by analyzing ions in the loading scatter plot, and metabolomics databases (METLIN and Madison Metabolomics Consortium Database) were searched to find potential candidates. To confirm the identities of the putative markers, the authentic standards were compared with the metabolites based on MS/MS fragmentation pattern and retention time. Concentrations of the metabolites were determined by multiple reaction-monitoring mass spectrometry based on standard curves using authentic standards. - Chromatographic and spectral data were deconvoluted by MarkerLynx software (Waters). A multivariate data matrix containing information on sample identity, ion identity (retention time and m/z), and ion abundance was generated through centroiding, deisotoping, filtering, peak recognition, and integration. The intensity of each ion was calculated by normalizing the single ion counts vs. the total ion counts in the whole chromatogram. The data matrix was further exported into SIMCA-P software (Umetrics, Kinnelon, NJ) and transformed by mean-centering and pareto scaling, a technique that increases the importance of low abundance ions without significant amplification of noise. Statistical models including principal components analysis (PCA), partial least squares-discriminant analysis (PLS-DA), and orthogonal projections to latent structures-discriminant analysis (OPLS-DA) were established to represent the major latent variables in the data matrix.
- Methanol, K2HPO4, NaH2PO4 (all in analytical grade), sodium 3-trimethylsilyl [2,2,3,3-d4] propionate (TSP-d4) and D2O (99.9% in D) were purchased from Sigma-Aldrich (St. Louis, MO). Phosphate buffer (0.1 M K2HPO4/ NaH2PO4 and PH 7.4) was prepared with K2HPO and NaH2PO4 for their good solubility and low-temperature stability. Liver samples (∼50 mg) were extracted three times with 0.6
mL 600 µL of precooled methanol-water mixture (2/1, v/v) using the PreCellys Tissue Homogenizer (Bertin Technologies, Rockville, MD). After centrifugation at 11180 x g for 10 min at 4° C, the combined supernatants were dried. Each of the aqueous extracts was separately reconstituted into 600 µL phosphate buffer containing 50% D2O and 0.005% TSP-d4 (chemical shift reference). Following centrifugation, 550 µL of each extract was transferred into a 5 mm NMR tube. Cecal content samples were directly extracted using an optimized procedure described previously (Wu et al., 2010). Briefly, samples (∼50 mg) were mixed with 600 µL precooled phosphate buffer, vortexed for 30 s and subjected to three consecutive freeze-thaws followed by homogenization using the Precellys™ Tissue Homogenizer. After centrifugation (11,180 x g, 4° C) for 10 min, the supernatants (550 µL) were transferred into 5 mm NMR tubes for NMR analysis. - 1H NMR spectra of aqueous liver and fecal extracts were recorded at 298 K on a Bruker Avance III 850 MHz spectrometer (operating at 850.23 MHz for 1H) equipped with a Bruker inverse cryogenic probe (Bruker Biospin, Germany). A typical one-dimensional NMR spectrum was acquired for each of all samples employing the first increment of NOESY pulse sequence (NOESYPR1D). To suppress the water signal, a weak continuous wave irradiation was applied to the water peak during recycle delay (2 s) and mixing time (100 ms). The 90° pulse length was adjusted to approximately 10 µs for each sample and 64 transients were collected into 32 k data points for each spectrum with spectral width of 20 ppm. To facilitate NMR signal assignments, a range of 2D NMR spectra were acquired and processed as described previously (Dai et al., 2010; Ding et al., 2009) for selected samples including 1H-1H correlation spectroscopy (COSY), 1H-1H total correlation spectroscopy (TOCSY), 1H-13C heteronuclear single quantum correlation (HSQC), and 1H-13C heteronuclear multiple bond correlation spectra (HMBC).
- All free induction decays (FID) were multiplied by an exponential function with a 1 Hz line broadening factor prior to Fourier transformation. 1H NMR spectra were corrected manually for phase and baseline distortions and spectral region δ 0.5-9.5 was integrated into regions with equal width of 0.004 ppm (2.4 Hz) using AMIX software package (V3.8, Bruker-Biospin, Germany). Region δ 4.45-5.20 was discarded by imperfect water saturation. Regions δ 1.15-1.23 and δ 3.62-3.69 were also removed for ethanol contaminations in the cecal contents during mice dissection process. Each bucketed region was then normalized to the total sum of the spectral integrals to compensate for the overall concentration differences prior to statistical data analysis.
- Multivariate data analysis was carried out with SIMCAP+ software (version 13.0, Umetrics, Sweden). Principal Component Analysis (PCA) was initially carried out on the NMR data to generate an overview and to assess data quality. Orthogonal projection to latent structures with discriminant analysis (OPLS-DA) was subsequently conducted on the NMR data. The OPLS-DA models were validated using a 7-fold cross validation method and the quality of the model was described by the parameters R2X and Q2 values. To facilitate interpretation of the results, back-transformation (Cloarec et al., Anal. Chem. 77:517-526, 2005) of the loadings generated from the OPLS-DA was performed prior to generating the loadings plots, which were color-coded with the Pearson linear correlation coefficients of variables (or metabolites) using an in-house developed script for MATLAB (The Mathworks Inc.; Natwick, MA). In this study, a cutoff value of |r| > 0.811 (r > 0.755 and r < -0.755) was chosen for correlation coefficient as significant based on the discrimination significance (p ≤ 0.05).
- Fecal proteins were prepared from feces samples (0.5 g) in pH 7.4 phosphate buffered saline (PBS, 5.0 mL) using sonication. Bile salt hydrolase (BSH) activity was measured based on the generation of CDCA from TCDCA in the feces. Briefly, incubation was carried out in 3 mM sodium acetate buffer, pH 5.2, containing 0.1 mg/ml fecal protein and 50 µM TCDCA-d5 in a final volume of 200 µL. After a 20 min incubation at 37° C, the reaction was stopped by plunging the samples into dry ice. 100 µL of acetonitrile was directly added to the reaction mix. After centrifuging at 14,000 x g for 20 min, 5 µL of the supernatant was transferred to an auto sampler vial subjected to analysis by a UPLC system coupled with a XEVO triple quadrupole tandem mass spectrometer (Waters Corp., Milford, MA).
- For intestinal mitochondria, the mucosa of ileum was gently scraped, washed 2X with PBS, minced in ice-cold mitochondrial homogenization buffer (225mM mannitol, 75 mM sucrose, 5 mM MOPS, 0.5 mM EGTA and 2 mM taurine (pH 7.25)) containing 0.2% BSA, and homogenized in a loose fitting homogenizer. Homogenates were centrifuged at 500xg for 10 min at 4° C. The supernatant was then centrifuged at 10,000xg for 10 min at 4° C. The final mitochondrial pellet was resuspended in mitochondrial isolation buffer containing 0.2% BSA at a concentration of 0.5 mg/ml before functional assessment.
- The oxygen consumption of isolated mitochondria was measured in a chamber connected to a Clark-type O2 electrode (Instech) and O2 monitor (Model 5300, YSI Inc) at 25° C. Mitochondria were incubated in respiration buffer (120 mM KCl, 5 mM MOPS, 0.1mM EGTA, 5 mM KH2PO4 and 0.2% BSA) with substrates for either complex I (5 mM glutamate and 5 mM malate), or complex II (5 mM succinate and 1 µM rotenone). State 3 (maximal) respiration activity was measured after addition of 1 mM ADP. ADP independent respiration activity (State 4) was monitored after addition of 2 µM oligomycin. The respiratory control ratio was determined by the
state 3/state 4 respiration rates. - Hematoxylin and eosin (H&E) staining were performed on formalin fixed paraffin embedded sections using a standard protocol. Oil red O staining was performed on frozen liver sections using a standard protocol. At least three discontinuous liver sections were evaluated for each mouse.
- Hepatic lipids were extracted using a 2:1 chloroform-methanol solution. Liver triglycerides were measured with a triglyceride colorimetric assay kit, according to the manufacturer's recommendation (Bioassay Systems, Hayward, CA).
- Caco-2 (ATCC™ HTB-37™) cells were induced to differentiate following the method as described previously (Ferraretto et al., Anticancer Res. 27:3919-3925, 2007). The differentiated Caco-2 cells were incubated for 8 hours with DMEM media with 1% fetal bovine serum, and then exposed to Gly-MCA/CDCA/GW4064 for 24 hours. RNA was extracted from frozen intestine using TRIzol reagent (Invitrogen). cDNA was synthesized from 1 µg total RNA using Superscript II reverse transcriptase (Invitrogen).
- Fecal proteins were prepared from the fecal sample (0.5 g) in pH 7.4 PBS (5.0 ml) using sonication. Incubation was carried out in 3 mM sodium acetate buffer, pH 5.2, containing 0.1 mg/ml fecal protein and 50 µM Gly-MCA or T-β-MCA in a final volume of 200 ml. After a 20-min incubation at 37° C, the samples were plunged into dry ice to stop the reaction. 100 of µL methanol was directly added to the 100 ml reaction mixture. After centrifuging at 14,000g for 20 min, 5 ml of the supernatant was transferred to an autosampler vial subjected to analysis by a UPLC system coupled with a XEVO triple quadrupole tandem mass spectrometer (Waters Corp., Milford, MA).
- High fat diet (HFD) (60% kcal consisting of fat) was purchased from Bioserv. Inc. Gly-MCA was custom synthesized.
- Bacon-flavored dough pills were produced as described (Walker et al., Toxicol. Appl. Pharmacol. 260:65-69, 2012) for oral administration of Gly-MCA (0.25 mg Gly-MCA/pill). Mice were trained to eat the dough pills prior to the study.
- Male wild-type (WT) C57BL/6N mice, 6- to 8-weeks-old, were fed a HFD (Bio-Serv, Frenchtown, NJ; 60 kcal% fat) from the age of 6 weeks and were orally administered with vehicle (control pills) or Gly-MCA (0.25 mg/pill/day, 10 mg/kg). Mice were housed individually in their home cages. Cumulative food intake and TEEbal were measured for 1 week in vehicle and Gly-MCA-treated mice from 6 to 7 weeks of HFD. TEEbal was measured as previously described (Ravussin et al., Int. J. Obesity 37:399-403, 2013). All animal studies were performed in accordance with the Institute of Laboratory Animal Resources guidelines and approved by the NCI Animal Care and Use Committee.
- For the glucose tolerance test (GTT), mice were fasted for 16 h, blood was drawn, and mice were injected intraperitoneally (i.p.) with 1 g/kg glucose. For the insulin tolerance test (ITT), mice were fasted 4 h, blood was drawn, and then were injected with insulin (Eli Lilly, Washington, DC), by i.p. at a dose of 1 U/kg body weight. Blood samples were taken from the tail at 15, 30, 60, and 90 min after injection, and glucose measured using a Glucometer (Bayer, Pittsburgh, PA).
- This example demonstrates that tauro-β-muricholic (TβMCA) acid antagonized FXR activation by taurocholic acid (TCA) in primary mouse hepatocytes.
- Primary hepatocytes from Fxr +/+ and Fxr -/- mice were transfected with PGL4-Shp-TK firefly luciferase construct and the control plasmid phRL-SV40. After 24 h, the cells were treated with 100 µM taurocholic acid (TCA), TβMCA, or TβMCA with TCA. The cells were lysed, and luciferase activities measured as describe herein. The results are depicted in
Figure 1 . - As is apparent from the results depicted in
Figure 1 , TβMCA antagonized FXR activation by TCA in primary hepatocytes from Fxr +/+ mice, but not from Fxr -/- mice. - This example demonstrates that TβMCA antagonized FXR activation by TCA in Caco-2 cells.
- Caco-2 cells were transfected with PGL4-Shp-TK firefly luciferase construct, the control plasmid phRL-SV40, and human FXR and human ASBT expression plasmids. After 24 h, the cells were treated with 100 µM TCA, TβMCA, or TβMCA with 100
µL 100 µM TCA. The cells were lysed, and luciferase activities measured as describe herein. The results are depicted inFigure 2 . - As is apparent from the results depicted in
Figure 2 , TβMCA antagonized FXR activation by TCA in Caco-2 cells. - This example demonstrates that ATP levels in mouse ileum mucosa were markedly elevated in Fxr ΔIE mice as compared to Fxr fl/fl mice after 14 weeks on a high fat diet.
- Two separate groups of Fxr fl/fl mice and Fxr ΔIE mice were kept on a high fat diet for 14 weeks. ATP levels in the ileum mucosa of both groups of mice were determined as described herein. The results are depicted in
Figure 3 . - As is apparent from the results depicted in
Figure 3 , ATP levels in the ileum mucosa of Fxr ΔIE mice, which do not express farnesoid X receptor (FXR) in the intestine, were markedly elevated as compared with ATP levels in the ileum mucosa of control Fxr fl/fl mice that express intestinal FXR. These results indicate increased energy expenditure occurred in the small intestine in the absence of the nuclear receptor FXR. - This example demonstrates that glycine-β-muricholic acid (Gly-MCA) is an FXR antagonist.
- Mice make TβMCA in the liver while humans preferentially make Gly-MCA. Thus, it was of interest to determine whether Gly-MCA was also an FXR antagonist. Chenodeoxycholic acid (CDCA), an FXR agonist at a dose of 100 µM, increased expression of the Fxr target gene Shp mRNA four-fold and the induction of Shp mRNA with CDCA was inhibited by Gly-MCA in a dose dependent manner (
Fig. 4 ). Gw4064, a synthetic FXR agonist, induced expression of the FXR target genes Shp and Fgf19 at both 2 µM and 5µM concentrations, and induction of both genes was blocked by Gly-MCA □in a dose dependent manner (Figures 5 and6 ). In addition, Gw4064 treatment inhibited Atp5g mRNA expression and Gly-MCA reversed this inhibition (Figure 7 ). These data indicate that Gly-MCA, produced in humans, is an FXR antagonist similar to TβMCA. - This example demonstrates the effect of tempol on body mass of high-fat diet-treated Fxr fl/fl and Fxr ΔIE mice.
- Vehicle and tempol-treated Fxr fl/fl and Fxr ΔIE mice were maintained on a high-fat diet for 10 weeks.
Figure 11 depicts the body mass gain in grams for vehicle and tempol-treated Fxr fl/fl and Fxr ΔIE mice after 10 weeks of a high-fat diet feeding. - As is apparent from the results depicted in
Figure 11 , tempol treatment of Fxr fl/fl mice resulted in a weight gain that was approximately 65% less of the weight gain exhibited by vehicle treated mice. Tempol treatment of Fxr ΔIE mice, which are intestinal-specific Fxr-null mice, resulted in an insignificant difference in weight gain, thereby implicating intestinal FXR in mediating the lower weight gain by tempol of mice fed a high-fat diet. - This example demonstrates the role of intestinal FXR in lipid and glucose metabolism.
- Male Fxr fl/fl and Fxr ΔIE mice were fed a high fat diet revealing that Fxr ΔIE mice were resistant to high fat diet-induced obesity. The fat mass in grams and as a percentage of body mass was measured in non-anesthetized mice using an Echo 3-in-1 NMR analyzer (Echo Medical Systems, Houston, TX), and the results depicted in
Figure 12 . The results show that fat mass and the ratio of fat and body mass of Fxr fl/fl mice were higher than for Fxr ΔIE mice. The glucose tolerance test (GTT) revealed that Fxr ΔIE mice had improved glucose intolerance compared to Fxr fl/fl mice, which is depicted inFigure 13 , which shows the area under the curve for blood glucose (in mg/dL) as a function of time. The insulin tolerance test (ITT), which is depicted inFigure 14 , demonstrated that the insulin sensitivity in Fxr ΔIE mice was significantly increased as compared to Fxr fl/fl mice. In addition, fasted serum insulin levels and the HOMA in Fxr ΔIE mice was significantly increased as compared to Fxr fl/fl mice, while fasted glucose was approximately the same in both groups of mice, as depicted inFigure 15 . - This example demonstrates that tempol affects bile acid homeostasis via inhibition of the genus Lactobacillus.
- Significant phylum-level shifts from Firmicutes to Bacteroidetes in the gut microbiome composition were observed in mouse cecum following 5 days of tempol treatment by gavage (250 mg/kg) of mice on normal chow diet. Heat map diagrams of 16S rRNA sequencing indicated that tempol treatment dramatically decreased the family Lactobacillacieae. It was found that tempol treatment robustly reduced the genus Lactobacillus. Similar to the results of acute treatment via gavage, qPCR analysis of suspected fecal microbes obtained from mice on a high fat diet revealed total bacteria remain unchanged between vehicle and tempol treated mice, while tempol treatment cause a shift from Firmicutes to Bacteroidetes, as depicted in
Figure 16 . These results indicate that the effects of tempol on the gut microbiome are independent of diet and obesity conditions. Furthermore, the genus Lactobacillus of the Lactobacillaceae was decreased, coincident with significant downregulation of bile salt hydrolase (BSH) enzymatic activity in the feces, as depicted inFigure 17 . Bile salt hydrolase (BSH) deconjugates taurine-conjugated bile acids produced in the liver to free bile acids. - These results indicate that tempol affects bile acid homeostasis via inhibition of the genus Lactobacillus.
- This example demonstrates the results of a human FXR competition assay using the synthetic agonist Gw4064 and varied doses of TUDCA, TωMCA, TβMCA, TαMCA. Results were normalized to Renilla expression.
- HEK293T cells were co-transfected with: 1) a chimeric receptor construct in which the carboxy terminal portions of human FXR (containing the native ligand-binding domain and AF2 transactivation domain) was fused to an amino terminal GAL4 DNA-binding domain under regulatory control of the constitutively active SV40 promoter; 2) a firefly luciferase reporter plasmid driven by the UAS GAL4 DNA response element; and, 3) a Renilla luciferase reporter gene (pRL-luciferase; Promega; Madison, WI) as a transfection efficiency control. Luciferase detection was conducted using the Dual Luciferase Reporter Assay kit (Promega Corp., Madison, WI) and a Tecan GeniosPro luminescent plate reader (Research Triangle Park, NC). The results are illustrated in
Figure 18 . - As is apparent from the results illustrated in
Figure 18 , all of the bile acid conjugates TUDCA, TωMCA, TβMCA, and TαMCA inhibited FXR in the presence of the synthetic agonist Gw4064. - This example demonstrates that changes in the gut microbiota brought about by tempol are correlated with NAFLD.
- High-fat diet (HFD) is extensively used as a mouse model for NAFLD. The antioxidant tempol selectively modulates the gut microbiota composition and metabolism under normal diet conditions (Li et al., Nat. Commun. 4: 2384, 2013). In an effort to determine whether tempol modifies the gut microbiome in the HFD-induced NAFLD model, 16S rRNA gene sequencing analysis was carried out. Weighted UniFrac™ analysis showed distinct clustering of cecal communities isolated from vehicle and tempol-treated groups on a HFD for 12 weeks. Principal coordinate 1 (PC1) explains 56.08% of the variation, indicating that tempol had a stronger effect on microbiota composition than vehicle in mice on a HFD for 12 weeks (
Figure 19A ). The separation of samples in the principal components analysis plot reflects abundance differences in significantly decreased Firmicutes and markedly increased Proteobacteria. The genus Desulfovibrio was identified as a major contributor of the increased Proteobacteria (Figure 19B ), which was found to be significantly lower in obese subjects (Karlsson et al., Obesity 20:2257-2261, 2012). A dramatic increase in the genus Roseburia was observed (Figure 19C ), which is negatively correlated with body weight in dogs (Handi et al., FEMS Microbiol. Ecol. 84332-343, 2013). The genus Clostridium sensu stricto and Lactobacillus levels were also significantly decreased in tempol-treated mice, whereas the levels of genus Bacteroides and Streptococcus remained similar (Figure 19D-G ). - To identify gut microbiota related markers in urine, ultra-performance liquid chromatography coupled with electrospray ionization quadrupole time-of-flight mass spectrometry (UPLC-ESI-QTOFMS)-based metabolomics analysis was employed. PCA modeling of UPLC-ESI-QTOFMS negative mode data from mouse urine demonstrated clear discrimination between the tempol and the control group (
Figure 20A ). Loadings scatter plot analysis revealed that two compounds, p-cresol sulfate (m/s 187.0060 with retention time 2.61 min) and p-cresol glucuronide (m/s 283.0812 with retention time 3.04 min) were significantly reduced in urine of the tempol-treated group (Figure 20B and C ). The identities of these compounds were confirmed by MS/MS analysis (Figure 20D ). These results indicated that tempol remodeled the gut microbiota composition and altered gut microbiota-related metabolism markers in mice on HFD for 14 weeks. Similar to the results of the tempol treatment model to specifically modulate the gut flora, metabolomics analysis revealed that the urinary levels of p-cresol sulfate and p-cresol glucuronide were almost absent in antibiotic-treated mice on a HFD for 14 weeks (Figure 21A-C ). Following the change of the gut microbiota composition and related metabolites, liver histology indicated a significant reduction in hepatic lipid droplets in tempol-treated mice on a HFD for 16 weeks and antibiotic-treated mice on a HFD for 7 weeks (Figure 22A andB , andFigure 23A ). Tempol treatment and antibiotic treatment, which also changes the gut microbiota composition, decreased liver weights and liver/body mass ratios, respectively (Figure 22C andD ,Figure 23A and B ). Hepatic triglyceride (TG) contents were decreased to approximately 50% and 35% in mice treated with antibiotic and tempol, respectively (Figure 22E andFigure 23D ). - This example demonstrates that gut microbiota modifies bile acid metabolism and affects FXR signaling.
- The gut microbiota is tightly associated with bile acid metabolism. UPLC-ESI-QTOFMS-based metabolomics analysis was adopted to determine bile acid composition and levels of bile acid metabolites in the intestine. Scores scatter plot of a PCA model of the UPLC-ESI-QTOFMS negative mode data from mouse ileum indicated distinct metabolic profiles between the vehicle and antibiotic groups (
Figure 24A ). The top enriched metabolite, TβMCA (m/z 514.2871, retention time = 6.64 min), was increased in the antibiotic-treated mice on a HFD for 7 weeks as revealed in the loading scatter plot (Figure 24B ) according to previous methods; this increase was similar to what was observed with tempol treatment (Li et al., J. Proteome Res., 12:1369-1376, 2013). Analysis of ileum bile acid composition revealed that the levels of taurine-conjugated bile acid TβMCA were significantly increased after antibiotic treatment (Figure 25A ). Similar results were obtained from tempol-treated mice on a HFD for 16 weeks (Figure 25B ). The gut microbiota can modify bile acid composition by microbial enzymatic activities. The activity of bile salt hydrolase (BSH), a bacterial enzyme that hydrolyzes taurine-conjugated bile acids to free bile acids, was greatly reduced in the antibiotic-treated mice on a HFD for 7 weeks (Figure 26A ). This likely accounts for the most significantly enriched bile acid in the ileum of antibiotic- and tempol-treated mice on a HFD that was TβMCA, an FXR antagonist (Li et al., J. Proteome Res., 12:1369-1376, 2013; Sayin et al., Cell Metab. 225-235, 2013). Western blot and qPCR analysis indicated that 12 weeks of HFD treatment significantly induced FXR protein levels (Figure 26B ) and FXR signaling in the ileum as revealed by increases in mRNAs from the FXR target genes, small heterodimer partner (Shp) and fibroblast growth factor 15 (Fgf15) mRNAs (Figure 26 C) . Conversely, antibiotic treatment decreased Shp and Fgf15 mRNAs indicating that FXR signaling was inhibited in the ileum (Figure 26D ). The question arose as to whether TβMCA inhibited FXR signaling in mice on HFD treatment in vivo. TβMCA treatment significantly blunted the Shp and Fgf15 induction by the FXR agonist TCA in the ileum of mice treated with antibiotic on a HFD for three days (Figure 26E ). These results indicated that both antibiotic and tempol treatments regulated bile acid composition, mainly by increasing TβMCA as a result of lower bacterial BSH activity, which inhibited FXR signaling in the ileum of HFD-fed mice. - This example demonstrates that intestine-specific Fxr disruption reduces hepatic lipid accumulation in high-fat diet fed mice.
- To further clarify the role of intestinal FXR in the development of NAFLD, intestine-specific Fxr-null (Fxr ΔIE) mice were treated with HFD for 14 weeks. H&E staining and Oil red O staining of liver sections showed a significant decrease in lipid accumulation in livers of Fxr ΔIE mice compared to wild-type (Fxr fl/fl) mice (
Figures 27A and B ). Fxr ΔIE mice displayed significantly reduced liver weight and ratio of liver weight (Figures 27C ). This change in liver weight was largely due to hepatic triglyceride (TG) levels that were 50% lower in Fxr ΔIE mice compared to Fxr fl/fl mice on a HFD for 14 weeks (Figure 27D ). Mechanistic studies revealed that the expression of mitochondrial electron transport chain (ETC) complex II related genes such as succinate dehydrogenase complex, subunit D, integral membrane protein (Sdhd), complex III related gene such as cytochrome c1 (Cyc1), complex IV related gene such as mitochondrially-encoded cytochrome c oxidase II (mt-Co2), cytochrome c oxidase subunit IV isoform 1 (Cox4i1), cytochrome c oxidase subunit Va (Cox5a), ATP synthase, H+ transporting, mitochondrial F0 complex, subunit C1 (subunit 9) (Atp5g) and ATP synthase, H+ transporting, mitochondrial F0 complex, subunit D (Atp5h), were elevated in the ileum epithelium of Fxr Δ1E mice (Figure 28A ). Similar results were obtained from antibiotic-treated mice (Figure 28B ). Subsequently, there was an approximately 70% increased activity of complex II and no significant elevation in activity of complex I in the ileum mitochondria of Fxr ΔIE mice compared to Fxr fl/fl mice (Figure 28C ). Ileum ATP levels in Fxr ΔIE mice were also significantly higher than in Fxr fl/fl mice (Figure 28D ). Free fatty acids are closely associated with the development of hepatic steatosis (Donnelly et al., J. Clin. Invest. 115:1343-1351, 20052005). However, serum lipidomics revealed that a subset of species of free fatty acids were at similar levels in vehicle- and tempol-treated Fxr ΔIE mice and Fxr fl/fl mice (Figure 29A ). LC-MS/MS quantitation confirmed that ileum C16:0, C18:0, C20:0, C22:0, C24:0 and C24:1 ceramide levels were significantly reduced in antibiotic-treated mice on a HFD for 7 weeks (Figure 29B ). Accordingly, serum C16:0, C18:0, C20:0, C24:0 and C24:1 ceramide levels in antibiotic-treated mice were also significantly lower than in vehicle-treated mice (Figure 29C ). The identity of each ceramide was confirmed by LC-MS fragmentography (Figure 30A-G ). Further, intestinal mRNAs encoding de novo ceramide synthesis-related genes, such as serine palmitoyltransferase, long chain base subunit 3 (Sptlc3), ceramide synthase 4 (Cers4), degenerative spermatocyte homolog 1 (Degs1), and sphingomyelin phosphodiesterase 3 (Smpd3) waned significantly in Fxr Δ1E mice and antibiotic-treated mice (Figure 29C andD ). Ceramide synthase 2 (Cers2) mRNA levels were significantly decreased in antibiotic-treated mice, and have a reduced trend (P=0.06) in Fxr Δ1E mice. The expression of genes involved in ceramide catabolism such assphingomyelin synthase 1 and 2 (Sgms1 and Sgms2), and alkaline ceramidase 1 and 3 (Acer1 and Acer3) remained similar in Fxr ΔIE mice and antibiotic-treated mice (Figure 29C andD ) - This example demonstrates that ceramide regulates the SREBP1c-CIDEA pathway in the liver.
- To establish a causal relationship between the decrease in ceramide levels and improvement of NAFLD, mice on a HFD were treated with antibiotics for a short duration. Three days of antibiotic treatment did not decrease triglyceride content in the liver (
Figure 31A ). Subsequently, the FXR signaling pathway was inhibited as revealed by decreased expression of the FXR target gene Shp and Fgf15 mRNAs (Figure 31B ). As early as 3 days after antibiotic treatment, ceramide levels in the ileum of antibiotic-treated mice were significantly decreased (Figure 31C ). These results indicated ceramide might be the cause rather than the result of the development of NAFLD and a a biomarker to monitor NAFLD. The contribution of ceramide to NAFLD was further evaluated in cultured primary mouse hepatocytes. Ceramide treatment induced a significantly increased triglyceride contents in primary hepatocytes in a dose-dependent manner (Figure 31D ). To elucidate the mechanisms by which ceramide leads to hepatic steatosis, the expression of the genes involved in hepatic lipogenesis and fatty acid oxidation were measured. Fatty acid synthesis-related genes such as sterol response element-binding protein 1c (Srebp1c), DNA fragmentation factor-alpha-like effector a (Cidea), elongation of very-long-chain fatty acids protein 6 (Elovl6) and TG formulation related genes such as diacylglycerol O-acyltransferase 2 (Dgat2) were significantly upregulated by ceramide in primary hepatocytes (Figure 31E ). In contrast, the expression of genes involved in fatty acid β-oxidation such as carnitine palmitoyltransferase 1 (Cpt1), acyl-coenzyme A oxidase 1 (Acox1), enoyl-coenzyme A, hydratase/3-hydroxyacyl coenzyme A dehydrogenase (Ehhadh), and acetyl-coenzyme A acyltransferase 1A (Acaa1a) were not affected by ceramide treatment (Figure 31E ). In agreement with the mRNA results, ceramide exposure at 2 µM and 10 µM significantly induced the protein levels of the mature nuclear form of SREBP1-N and the SREBP1-N target gene protein CIDEA (Figure 31F and G ). In vivo, mRNAs encoded by the hepatic fatty acid synthesis related genes Srebp1c, Cidea, fatty acid synthase (Fasn), and Elovl6 were decreased in antibiotic-treated mice compared to vehicle-treated mice, and Fxr Δ1E compared to Fxr fl/fl mice (Figure 32A and B ). The expression of genes involved in fatty acid remained at similar levels in antibiotic-treated mice compared to vehicle-treated mice, and Fxr ΔIE compared to Fxr fl/fl mice (Figure 32C and D ). Western blot analysis further revealed that the protein levels of the mature nuclear form of SREBP1-N and CIDEA were significantly downregulated in livers of antibiotic-treated mice on a HFD for 7 weeks (Figure 32E and F ). The rate limiting enzyme cholesterol 7α-hydroxylase (CYP7A1) initiates the classic pathway for bile acid synthesis and plays an important role in regulating lipid metabolism. Cyp7a1 mRNA levels were marginally induced in antibiotic-treated mice, but not in tempol-treated mice (Figure 32G andH ). In addition, inflammation-related genes such as toll-like receptor 2 (Tlr2), toll-like receptor 4 (Tlr4), toll-like receptor 9 (Tlr9) and tumor necrosis factor α (Tnfα), were comparable in antibiotic- and tempol-mice (Figure 32I andJ ). The present findings revealed that inhibition of ceramide metabolism might be a major contributing factor to improve HFD-induced NAFLD development in antibiotic-treated mice. - This example demonstrates that inhibition of intestinal FXR is required for gut microbiome-mediated progression of NAFLD.
- Fxr ΔIE mice were employed to determine the role of intestinal FXR in the progression of the NAFLD. Liver histology revealed that antibiotic and tempol treatment decreased hepatic lipid droplets in Fxr fl/fl mice on a HFD for 14 and 16 weeks, respectively; no changes in hepatic lipid were observed in Fxr Δ1E mice with these treatments (
Figure 33A andB andFigure 34A and B ). The liver weights and liver/body mass ratios of antibiotic- and tempol-treated Fxr fl/fl mice were significantly reduced, whereas the liver weights and liver/body mass ratios were similar in Fxr ΔIE and Fxr fl/fl mice (Figure 33C andD ,Figure 34C andD ). Hepatic triglyceride content analysis confirmed that antibiotic and tempol treatment did not alleviate hepatic steatosis in Fxr Δ1E mice (Figure 33E andFigure 34E ). Ileum and serum C16:0, C18:0, C20:0, C22:0, C24:0 and C24:1 ceramide levels were significantly decreased in Fxr ΔIE mice and tempol-treated Fxr fl/fl mice, but not in Fxr ΔIE mice (Figure 33F and G ). In Fxr Δ1E mice, hepatic fatty acid synthesis related genes such as Srebp1c, Cidea, Fasn, and Elovl6 remained unchanged between vehicle-treated and antibiotic-treated mice (Figure 34F ). Further, the protein levels of the mature nuclear form of SREBP1 and CIDEA proteins were significantly reduced in the liver of tempol-treated mice, whereas no decrease was noted in Fxr Δ1E mice treated with tempol (Figure 34G and H ). The present findings revealed that inhibition of intestinal FXR mediates the amelioration of NAFLD caused by antibiotic and tempol treatments. - This example demonstrates the systemic responses of mice on a high-fat diet, to tempol and antibiotic treatment.
- A total of 53 metabolites involved in the metabolism of amino acids, carbohydrates and nucleotides were identified by 1H NMR. 1D 1H NMR spectra of the cecal contents are dominated by short chain fatty acids (SCFAs), nucleotides, oligosaccharides and some amino acids. Glycogen, glucose, amino acids and nucleotides are the dominant metabolites observed in the 1H NMR spectra of liver.
- In order to obtain the metabolic variations associated with different biological sample groups, pair-wise OPLS-DA was performed between data obtained from cecal contents or liver of mice after tempol or antibiotic treatment. The quality of these models was further validated by evaluation with CV-ANOVA (p < 0.05) and permutation test (200 tests) for the OPLS-DA and PLS-DA models. Compared with the vehicle-treated wild-type mice, tempol treatment significantly decreased the levels of SCFAs (acetate, propionate, and butyrate) but significantly elevated the levels of oligosaccharides and glucose in the cecal contents. Similar changes in SCFAs and oligosaccharides were also observed from the cecal contents of the antibiotic-treated wild type mice compared to those from the respective controls. However, no significant differences in the levels of SCFAs and oligosaccharides were observed in the cecal contents between tempol-treated and vehicle-treated Fxr Δ1E mice.
- Tempol treatment significantly decreased the levels of lipid and unsaturated fatty acid (UFA) in the livers, whereas tempol treatment significantly elevated the levels of glucose, glycogen, bile acids and a range of nucleotide metabolites (e.g., uridine, hypoxanthine and 5'-IMP), nicotinurate, and choline in comparison with the vehicle-treated wild-type mice. These observations are consistent with reduced lipogenesis in the liver due to tempol treatment. However, no significant change in lipid and glucose metabolism was observed in the liver of Fxr Δ1E mice after tempol-treatment. In addition, antibiotic treatment significantly elevated the levels of bile acids, trimethylamine oxide (TMAO, choline, fumarate, formate, amino acids including branched chain amino acids (leucine, isoleucine and valine), alanine, glycine, tyrosine and phenylalanine, and some nucleic acids such as hypoxanthine, uridine and 5'-IMP in the liver. Compared with the vehicle-treated Fxr fl/fl mice, Fxr Δ1E mice exhibit lower lipid and UFA levels but higher taurine and glycogen levels in the livers.
- This example demonstrates a synthesis of β-
muricholic acid 9 , glycine-β-muricholic acid (Gly-MCA) 10 , and tauro-β-muricholic acid (T-β-MCA) 11 in accordance with an embodiment of the invention. - β-Muricholic acid (β-MCA) 9 was prepared as illustrated in
Figure 41 by following the literature procedure (Iida T, Momose T, et al., Journal of Lipid Research, 30: 1267-1279 (1989)). In general, esterification of thedihydroxy acid 1 with methanol under acid catalysis providedester 2 in quantitative yield. Protection of the hydroxyl group in the 3 position with ethyl chloroformate providedcarbonate 3 . Oxidation of the 6-hydroxyl group with potassium chromate gaveketone 4 in quantitative yield. Bromination with 47% HBr solution gavebromo ketone 5 , which on reduction with NaBH4 gavebromohydrin 6 in moderate yield. Reductive dehydrobromination with zinc metal providedolefin 7 in about 80% yield. Cis-dihydroxylation with osmium tetroxide to givecis diol 8 followed by hydrolysis provided s-muricholic acid 9 in quantitative yield. r-muricholic acid 9 was conjugated with glycine to provide glycine-β-muricholic acid (Gly-MCA) 10 . A suspension of ethyl glycinate was reacted with β-MCA 9 and EEDQ by refluxing overnight. The residue obtained after workup was dissolved in boiling ethanol and hydrolyzed with 10% K2CO3. The aqueous solution was acidified to give Gly-MCA 10 as a white powder in 68% yield. 1H NMR (CDCl3) 0.75 (s, 3H, 18-Me), 1.01 (d, 3H, J=6.5Hz, 21-Me), 1.14 (s, 3H, 19-Me), 3.44-3.56 (m, 2H), 3.58-3.61 (m, 1H), 3.91 (s, 2H). -
TβMCA 11 was similarly prepared from 9 by conjugation with taurine instead of glycine. - This example demonstrates that Gly-MCA is stable in the intestine.
- Fecal extracts were prepared as described above. Gly-MCA (50 µM) was incubated with fecal extract (0.1 mg/mL). The negative control was fecal extract alone. The positive control was fecal extract (0.1 mg/mL) and TβMCA acid (50 µM). The samples were analyzed by UPLC to determine the amount of ββ-MCA (hydrolysis product) and the results shown in
Figure 35 . - Gly-MCA was given to mice via oral gavage at dosages of 0, 1, 5, and 50 mg/kg of Gly-MCA, with the Gly-MCA dosed in corn oil. Gly-MCA was detected using ultra performance liquid chromatography-electrospray ionization-quadrupole time-of-flight mass spectrometry (UPLC-ESI-QTOFMS). The results are shown in
Figure 36 . - As is apparent from the results shown in
Figures 35 and 36 , Gly-MCA is stable in the intestine. - This example demonstrates that mice treated with Gly-MCA do not develop significant liver toxicity.
- Mice were dosed with vehicle or Gly-MCA at 1 mg/kg, 5 mg/kg, and 50 mg/kg. After 24 h, serum aminotransferase (ALT) and aspirate aminotransferase (AST) levels were determined and the results shown in
Figure 37 . - As is apparent from the results shown in
Figure 37 , Gly-MCA did not exhibit significant liver toxicity at each of the doses as compared with vehicle. - This example demonstrates that Gly-MCA significantly inhibited the FXR activity induced by the synthetic FXR agonist GW4064.
- HEK293T fibroblasts were transiently co-transfected with (1) a chimeric receptor construct in which the carboxy terminal portions of human FXR (containing the native ligand-binding domain and AF2 transactivation domain) was fused to an amino terminal GAL4 DNA-binding domain under regulatory control of the constitutively active SV40 promoter, (2) a firefly luciferase reporter plasmid driven by the UAS GAL4 DNA response element, and (3) a Renilla luciferase reporter gene (pRL-luciferase; Promega; Madison, WI) as a transfection efficiency control. GW4064 or GW4064 and Gly-MCA were added to the media for 24 h, the cells were harvested, and cell extracts prepared. Luciferase detection was conducted using the Dual Luciferase Reporter Assay kit (Promega; Madison, WI) and a Tecan GeniosPro™ luminescent plate reader (Research Triangle Park, NC). The results are shown in
Figure 38 . - As is apparent from the results shown in
Figure 38 , Gly-MCA significantly inhibited the FXR activity induced by GW4064. - This example demonstrates that Gly-MCA is a potent antagonist of FXR.
- Differentiated Caco-2 cells were treated with 100 µM of the FXR agonist chenodeoxycholic acid (CDCA) and with 0, 100 µM, or 200 µM Gly-MCA, and expression of the FXR target gene Shp mRNA measured. As is apparent from the results shown in
Figure 39 , CDCA caused a 4-fold increase in expression of Shp mRNA. Gly-MCA inhibited the induction of Shp mRNA with CDCA in a dose-dependent manner. - Differentiated Caco-2 cells were treated with 0.2 µM or 5 µM GW4064 and with 100 µM or 200 µM Gly-MCA. Control cells were not treated with either agent. Relative expression of the FXR target gene mRNAs, Shp mRNA, Fgf19 mRNA, and Atp5g mRNA were determined and the results shown in
Figures 40A-C , respectively. Expression of Shp mRNA and Fgf19 mRNA induced by GW4064 was blocked by Gly-MCA in a dose-dependent manner (Figures 40A and B ). GW4064 treatment inhibited expression of the FXR target gene Atp5g mRNA and Gly-MCA reversed the inhibition (Figure 40C ). - This example demonstrates that inhibition of FXR signaling by Gly-MCA is a potent therapeutic strategy for treatment of obesity, insulin resistance and NAFLD.
- To determine whether inhibition of intestinal FXR could be a therapeutic target for high-fat diet (HFD)-induced obesity, insulin resistance and NAFLD, and confirm that this transcription factor is a suitable drug target, HFD-treated mice were orally administered Gly-MCA. Gly-MCA treatment reduced body weight gain after one week of treatment with a HFD (
Figure 41A and B ). The absolute fat mass and the fat/lean mass ratio, measured by NMR, were significantly decreased in Gly-MCA-treated mice after 7 weeks of treatment compared with vehicle-treated mice (Figure 41C and D ). To explore the mechanism of reduced adiposity in Gly-MCA-treated mice, cumulative food intake, energy expenditure (EE) using an energy balance technique (TEEbal: food energy intake and body composition change) were measured. Food intake was comparable between the two groups (Figure 44A ). Gly-MCA treatment increased the energy expenditure significantly, which could contribute to the decreased body weight gain of mice on a HFD compared with vehicle-treated mice (Figure 42B ). To clarify the role of Gly-MCA in obesity-related glucose homeostasis, glucose and insulin tolerance tests (GTT and ITT, respectively) were performed. The GTT revealed that after 6 weeks of HFD challenge, Gly-MCA-treated mice displayed significantly reduced blood glucose levels after glucose loading compared with vehicle-treated mice (Figure 43A andB ). The ITT demonstrated that the insulin sensitivity was significantly increased after Gly-MCA treatment (Figure 43C ). These results indicated that Gly-MCA improved HFD-induced obesity and insulin resistance. Liver histology indicated a marked reduction in hepatic lipid droplets after Gly-MCA treatment of mice that were fed a HFD for 7 weeks (Figure 44A ). Gly-MCA treatment decreased liver weights and liver/body mass ratios (Figure 44B ). Hepatic triglyceride contents were decreased to approximately 51% in mice treated with Gly-MCA (Figure 44D ). These results indicated that Gly-MCA treatment protected mice from HFD-induced non-alcoholic fatty liver disease (NAFLD). To exclude the possibility that the effect of Gly-MCA on body weight and NAFLD were due to a nonspecific toxicological effects, serum aminotransferase (ALT) and aspartate aminotransferase (AST) biomarkers of liver toxicity were determined. ALT and AST were significantly higher on a HFD and GlyMCA treatment significantly decreased serum ALT and AST levels (Figure 45A and B ), thus indicating that the dose of Gly-MCA employed was not toxic, but actually decreased HFD-induced hepatic toxicity. NAFLD is tightly associated with bile acid metabolism. UPLC-ESI-QTOFMS-based metabolomics analysis was adopted to determine bile acid composition and levels of bile acid metabolites in the feces and intestine. A Scores scatter plot of a PCA model of the UPLC-ESI-QTOFMS negative mode data from mouse feces and ileum indicated distinct metabolic profiles between the vehicle- and Gly-MCA-treated groups (Figures 46A andB ). The top enriched metabolite, TβMCA (m/z 514.2871, retention time = 6.64 min), was increased in the Gly-MCA-treated mice on a HFD for 9 weeks as revealed in the loading scatters plot (Figures 46B and47B ). Levels of T-β-MCA were significantly increased whereas TCA levels were significantly decreased in feces after Gly-MCA treatment (Figure 46C ). The levels of taurine-conjugated bile acids were increased in the ileum of Gly-MCA-treated mice, notably, levels of TβMCA were significantly increased (Figure 46C ). Gly-MCA levels were markedly increased in the feces and ileum after Gly-MCA treatment for 9 weeks (Figure 46D and47D , respectively). Serum triglyceride levels remained similar between the two groups on a HFD for 9 weeks (Figure 48A andB ). Serum C16:0, C20:0, C22:0, and C24:1 ceramides levels, and ileum C16:0, C18:1, and C24:0 ceramides levels were reduced in Gly-MCA treated mice on a HFD for 9 weeks (Figure 49A andB ). Gly-MCA treatment decreased Shp and Fgf15 mRNAs indicating that FXR signaling was inhibited in the ileum (Figure 50A ). Intestinal mRNAs encoding ceramide de novo synthesis-related genes, such as serine Sptlc3, Cers4, Degs1, and Smpd3 were significantly lower in Gly-MCA -treated mice (Figure 50B ). The expression of Shp mRNA was similar between two groups indicating that FXR signaling wasn't affected in the liver (Figure 51A ). Cyp7a1 mRNA levels were induced in Gly-MCA-treated mice (Figure 51B ). Since Fgf15 mRNA levels were lower, this might contribute to the increase of Cyp7a1 mRNA levels in Gly-MCA-treated mice. In a model of genetically-induced obesity, leptin receptor-deficient (db/db) mice treated with Gly-MCA for 6 weeks had reduced body weight as compared to vehicle-treated mice; weight loss was significant after just one week of treatment (Figure 52 ). The absolute fat mass and the fat/lean mass ratio, as measured by NMR, were significantly decreased in Gly-MCA-treated db/db mice after 6 weeks of Gly-MCA treatment compared with vehicle-treated mice (Figures 53A and B ). Liver histology indicated a significant decrease in hepatic lipid droplets after Gly-MCA treatment (Figure 54A ). Gly-MCA treatment decreased liver weights and liver/body mass ratios (Figures 54B and C ). Liver TG contents were dramatically improved in mice treated with Gly-MCA (Figure 54D ). Gly-MCA treatment significantly decreased serum ALT and AST levels (Figures 55A and 55B ), thus indicating that the dose of Gly-MCA employed was not toxic to the db/db mice and reduced liver toxicity in this mouse model. Levels of T-α-MCA and TβMCA were significantly increased in feces and ileum after Gly-MCA treatment (Figure 56A and56B ). The accumulation of Gly-MCA in the ileum is far much more than liver, feces, and serum (Figure 56C ). Serum triglyceride levels remained similar after 6 weeks of Gly-MCA treatment (Figure 57A ). Serum C16:0, C20:0, C22:0, and C24:1 ceramides levels, and ileum C16:0, C18:0, C18:1, C20:0, C22:0, C24:0 and C24:1 ceramides levels were reduced in Gly-MCA treated mice compare to vehicle treatment (Figure 57B and C ). In another model of HFD-induced obesity, C57BL/6N mice made obese by 12 weeks of feeding a high-fat diet, were treated with Gly-MCA. Due to limited amounts of Gly-MCA, these mice were treated with only 5 mg/kg GMCA. Despite the lower dosing, they had reduced body weight gain as compared to vehicle-treated mice from two weeks of treatment (Figure 58 ). The absolute fat mass, as measured by NMR, were significantly decreased in Gly-MCA-treated obese mice after 6 weeks of treatment compared with vehicle-treated mice (Figure 59 ). Liver histology indicated a marked amelioration in hepatic lipid droplets after Gly-MCA treatment (Figure 60A ). Gly-MCA treatment reduced liver weights and liver/body mass ratios (Figures 60B and C ). Levels of TαMCA and TβMCA were significantly enhanced in feces and ileum after Gly-MCA treatment (Figure 61A and61B ). The accumulation of Gly-MCA in the ileum is far greated than liver, feces, and serum (Figure 61C ). - The use of the terms "a" and "an" and "the" and "at least one" and similar referents in the context of describing the invention (especially in the context of the following claims) are to be construed to cover both the singular and the plural, unless otherwise indicated herein or clearly contradicted by context. The use of the term "at least one" followed by a list of one or more items (for example, "at least one of A and B") is to be construed to mean one item selected from the listed items (A or B) or any combination of two or more of the listed items (A and B), unless otherwise indicated herein or clearly contradicted by context. The terms "comprising," "having," "including," and "containing" are to be construed as open-ended terms (i.e., meaning "including, but not limited to,") unless otherwise noted. Recitation of ranges of values herein are merely intended to serve as a shorthand method of referring individually to each separate value falling within the range, unless otherwise indicated herein, and each separate value is incorporated into the specification as if it were individually recited herein. All methods described herein can be performed in any suitable order unless otherwise indicated herein or otherwise clearly contradicted by context. The use of any and all examples, or exemplary language (e.g., "such as") provided herein, is intended merely to better illuminate the invention and does not pose a limitation on the scope of the invention unless otherwise claimed. No language in the specification should be construed as indicating any non-claimed element as essential to the practice of the invention.
Claims (4)
- A compound represented by the structure:

for use in treating or preventing a disease or disorder selected from obesity, insulin resistance, and non-alcoholic fatty liver disease in a mammal in need thereof. - The compound for use according to claim 1, wherein the disease or disorder is obesity.
- The compound for use according to claim 1, wherein the disease or disorder is insulin resistance.
- The compound for use according to claim 1, wherein the disease or disorder is non-alcoholic liver disease.
Applications Claiming Priority (3)
| Application Number | Priority Date | Filing Date | Title |
|---|---|---|---|
| US201361861109P | 2013-08-01 | 2013-08-01 | |
| US201462004436P | 2014-05-29 | 2014-05-29 | |
| PCT/US2014/049460 WO2015017813A2 (en) | 2013-08-01 | 2014-08-01 | Inhibitors of the farnesoid x receptor and uses in medicine |
Publications (2)
| Publication Number | Publication Date |
|---|---|
| EP3027637A2 EP3027637A2 (en) | 2016-06-08 |
| EP3027637B1 true EP3027637B1 (en) | 2019-10-09 |
Family
ID=51358096
Family Applications (1)
| Application Number | Title | Priority Date | Filing Date |
|---|---|---|---|
| EP14752716.2A Active EP3027637B1 (en) | 2013-08-01 | 2014-08-01 | The glycine conjugate of beta-muricholic acid as an inhibitor of the farnesoid x receptor for the treatment of obesity, insulin resistance or non-alcoholic fatty liver disease |
Country Status (9)
| Country | Link |
|---|---|
| US (2) | US9540415B2 (en) |
| EP (1) | EP3027637B1 (en) |
| JP (1) | JP6556129B2 (en) |
| CN (2) | CN105593237B (en) |
| AU (1) | AU2014296023B2 (en) |
| BR (1) | BR112016002268B1 (en) |
| CA (1) | CA2920017C (en) |
| NZ (1) | NZ716568A (en) |
| WO (1) | WO2015017813A2 (en) |
Families Citing this family (25)
| Publication number | Priority date | Publication date | Assignee | Title |
|---|---|---|---|---|
| EP2545964A1 (en) | 2011-07-13 | 2013-01-16 | Phenex Pharmaceuticals AG | Novel FXR (NR1H4) binding and activity modulating compounds |
| US10407462B2 (en) | 2014-05-29 | 2019-09-10 | Bar Pharmaceuticals S.R.L. | Cholane derivatives for use in the treatment and/or prevention of FXR and TGR5/GPBAR1 mediated diseases |
| AU2015343025A1 (en) | 2014-11-06 | 2017-06-08 | Enanta Pharmaceuticals, Inc. | Bile acid analogs an FXR/TGR5 agonists and methods of use thereof |
| US10208081B2 (en) | 2014-11-26 | 2019-02-19 | Enanta Pharmaceuticals, Inc. | Bile acid derivatives as FXR/TGR5 agonists and methods of use thereof |
| US11578097B2 (en) | 2014-11-26 | 2023-02-14 | Enanta Pharmaceuticals, Inc. | Tetrazole derivatives of bile acids as FXR/TGR5 agonists and methods of use thereof |
| CA2968404A1 (en) | 2014-11-26 | 2016-06-02 | Enanta Pharmaceuticals, Inc. | Bile acid analogs as fxr/tgr5 agonists and methods of use thereof |
| CA2975257A1 (en) | 2015-02-11 | 2016-08-18 | Enanta Pharmaceuticals, Inc. | Bile acid analogs as fxr/tgr5 agonists and methods of use thereof |
| US10457703B2 (en) * | 2015-03-31 | 2019-10-29 | Enanta Pharmaceuticals, Inc. | Bile acid derivatives as FXR/TGR5 agonists and methods of use thereof |
| JP2018519246A (en) * | 2015-04-28 | 2018-07-19 | ジエンス ハンセン ファーマセウティカル グループ カンパニー リミテッド | Cholic acid derivative, production method thereof and pharmaceutical use |
| US10323060B2 (en) | 2016-02-23 | 2019-06-18 | Enanta Pharmaceuticals, Inc. | Benzoic acid derivatives of bile acid as FXR/TGR5 agonists and methods of use thereof |
| NZ748641A (en) | 2016-06-13 | 2020-04-24 | Gilead Sciences Inc | Fxr (nr1h4) modulating compounds |
| CA2968836A1 (en) | 2016-06-13 | 2017-12-13 | Gilead Sciences, Inc. | Fxr (nr1h4) modulating compounds |
| IT201600068742A1 (en) * | 2016-07-01 | 2018-01-01 | Bar Pharmaceuticals Soc A Responsabilita Limitata | DERIVATIVES OF IODESEXICOLIC ACID AND THEIR USE |
| CN106237332A (en) * | 2016-08-11 | 2016-12-21 | 河南大学 | Nuclear receptor FXR application in liver-cancer stem cell targeted therapy |
| MX2019006165A (en) | 2016-11-29 | 2019-10-14 | Enanta Pharm Inc | Process for preparation of sulfonylurea bile acid derivatives. |
| WO2018152171A1 (en) | 2017-02-14 | 2018-08-23 | Enanta Pharmaceuticals, Inc. | Bile acid derivatives as fxr agonists and methods of use thereof |
| WO2018183193A1 (en) | 2017-03-28 | 2018-10-04 | Gilead Sciences, Inc. | Therapeutic combinations for treating liver diseases |
| US10676500B2 (en) | 2017-04-07 | 2020-06-09 | Enanta Pharmaceuticals, Inc. | Process for preparation of sulfonyl carbamate bile acid derivatives |
| EP3730509B1 (en) * | 2017-12-19 | 2024-10-16 | Xi'an Biocare Pharma Ltd. | Compound for treating metabolic diseases and preparation method and use thereof |
| IT201800005598A1 (en) | 2018-05-22 | 2019-11-22 | OXADIAZOLS AS ANTAGONISTS OF THE FXR RECEPTOR | |
| WO2020150136A1 (en) | 2019-01-15 | 2020-07-23 | Gilead Sciences, Inc. | Fxr (nr1h4) modulating compounds |
| CN118388473A (en) | 2019-02-19 | 2024-07-26 | 吉利德科学公司 | Solid forms of FXR agonists |
| CN112409435B (en) * | 2019-08-23 | 2023-07-18 | 深圳云合医药科技合伙企业(有限合伙) | Bile acid derivatives, compositions and uses thereof |
| US20220378766A1 (en) * | 2021-05-25 | 2022-12-01 | Louis Habash | Modulating expression level of a gene encoding an uncoupling protein by treating a human subject with a nitroxide |
| US20230128120A1 (en) * | 2021-10-21 | 2023-04-27 | University Of Washington | Omega muricholic acid as a pregnane x receptor ligand for treating hepato-intestinal diseases |
Family Cites Families (24)
| Publication number | Priority date | Publication date | Assignee | Title |
|---|---|---|---|---|
| US4235871A (en) | 1978-02-24 | 1980-11-25 | Papahadjopoulos Demetrios P | Method of encapsulating biologically active materials in lipid vesicles |
| US4501728A (en) | 1983-01-06 | 1985-02-26 | Technology Unlimited, Inc. | Masking of liposomes from RES recognition |
| US5019369A (en) | 1984-10-22 | 1991-05-28 | Vestar, Inc. | Method of targeting tumors in humans |
| WO1987002367A2 (en) | 1985-10-18 | 1987-04-23 | The Upjohn Company | Cyclic hydrocarbons with an aminoalkyl sidechain |
| US4837028A (en) | 1986-12-24 | 1989-06-06 | Liposome Technology, Inc. | Liposomes with enhanced circulation time |
| IT1222395B (en) * | 1987-07-30 | 1990-09-05 | Pierrel Spa | PHARMACEUTICAL COMPOSITION FOR INTRANASAL ADMINISTRATION INCLUDING THE HORMONE GHRH, A COLINERGIC AGONIST AND / OR A BILE SALT |
| IT1219733B (en) | 1988-06-28 | 1990-05-24 | Istituto Chemioterapico Di Lod | URSODESOXYOLIC ACID DERIVATIVE |
| JPH0637392B2 (en) * | 1988-11-25 | 1994-05-18 | 健二 片桐 | Cholestasis improver |
| IT1229570B (en) | 1989-04-17 | 1991-09-04 | Giuliani Spa | FLUORATED DERIVATIVES OF BILIARY ACIDS, THEIR PREPARATION AND PHARMACEUTICAL COMPOSITIONS CONTAINING THEM. |
| IT1264131B1 (en) | 1993-04-16 | 1996-09-16 | D R Drug Research Srl | DERIVED FROM IODESOXICOLIC ACID |
| US6551623B1 (en) * | 1993-09-09 | 2003-04-22 | Lorus Therapeutics Inc. | Immunomodulating compositions from bile |
| GB9320597D0 (en) * | 1993-10-06 | 1993-11-24 | Proteus Molecular Design | Improvements in and realting to vaccines |
| IT1299270B1 (en) * | 1998-05-15 | 2000-02-29 | Moreno Paolini | BILE ACIDS AS INDUCERS OF THE CYTOCHROME P450-EMPLOYEE SYSTEM, IN PARTICULAR TO ANTI-COLESTATIC ACTIVITY |
| ATE433106T1 (en) | 1998-12-23 | 2009-06-15 | Glaxo Group Ltd | DETERMINATION METHOD FOR LIGANDS OF NUCLEAR RECEPTORS |
| US20020132223A1 (en) | 1999-03-26 | 2002-09-19 | City Of Hope | Methods for modulating activity of the FXR nuclear receptor |
| US20040171811A1 (en) | 2001-05-24 | 2004-09-02 | Kliewer Steven Anthony | Nonhuman pregnane x receptor sequences for use in comparative pharmacology |
| US7595311B2 (en) | 2002-05-24 | 2009-09-29 | Exelixis, Inc. | Azepinoindole derivatives as pharmaceutical agents |
| US7902237B2 (en) | 2004-08-10 | 2011-03-08 | Exelixis, Inc. | Heterocyclic compounds as pharmaceutical agents |
| WO2007095174A2 (en) * | 2006-02-14 | 2007-08-23 | Intercept Pharmaceuticals, Inc. | Bile acid derivatives as fxr ligands for the prevention or treatment of fxr-mediated diseases or conditions |
| PT2040713E (en) * | 2006-06-27 | 2014-10-13 | Intercept Pharmaceuticals Inc | Bile acid derivatives as fxr ligands for the prevention or treatment of fxr-mediated deseases or conditions |
| EP2285369A2 (en) * | 2008-05-05 | 2011-02-23 | Tiltan Pharma Ltd | Sulfobetaines for cancer, obesity, macular degeneration, neurodegenerative diseases |
| EP2324046B1 (en) * | 2008-07-30 | 2014-09-03 | Intercept Pharmaceuticals, Inc. | Tgr5 modulators and methods of use thereof |
| CN101891791B (en) | 2009-05-22 | 2012-10-03 | 中国科学院上海应用物理研究所 | Derivate for labeling bile acid and reference compound, preparation method and application thereof |
| BR112012004284B8 (en) * | 2009-08-25 | 2021-05-25 | Ahab Sheps Jonathan | Polyhydroxylated bile acids for treatment of bile disorders |
-
2014
- 2014-08-01 CA CA2920017A patent/CA2920017C/en active Active
- 2014-08-01 BR BR112016002268-8A patent/BR112016002268B1/en active IP Right Grant
- 2014-08-01 EP EP14752716.2A patent/EP3027637B1/en active Active
- 2014-08-01 CN CN201480054322.2A patent/CN105593237B/en active Active
- 2014-08-01 US US14/909,263 patent/US9540415B2/en active Active
- 2014-08-01 CN CN201910393592.0A patent/CN110437297B9/en active Active
- 2014-08-01 NZ NZ716568A patent/NZ716568A/en unknown
- 2014-08-01 AU AU2014296023A patent/AU2014296023B2/en active Active
- 2014-08-01 JP JP2016531936A patent/JP6556129B2/en active Active
- 2014-08-01 WO PCT/US2014/049460 patent/WO2015017813A2/en active Application Filing
-
2016
- 2016-12-06 US US15/371,032 patent/US10233209B2/en active Active
Non-Patent Citations (1)
| Title |
|---|
| None * |
Also Published As
| Publication number | Publication date |
|---|---|
| US10233209B2 (en) | 2019-03-19 |
| US20160159851A1 (en) | 2016-06-09 |
| CN110437297A (en) | 2019-11-12 |
| CN110437297B (en) | 2021-12-21 |
| JP2016527277A (en) | 2016-09-08 |
| NZ716568A (en) | 2021-07-30 |
| AU2014296023B2 (en) | 2020-02-06 |
| WO2015017813A3 (en) | 2015-04-02 |
| CN105593237A (en) | 2016-05-18 |
| US9540415B2 (en) | 2017-01-10 |
| EP3027637A2 (en) | 2016-06-08 |
| CN110437297B9 (en) | 2022-01-11 |
| CA2920017C (en) | 2021-11-23 |
| CN105593237B (en) | 2019-06-04 |
| US20170152283A1 (en) | 2017-06-01 |
| BR112016002268B1 (en) | 2022-11-01 |
| WO2015017813A2 (en) | 2015-02-05 |
| JP6556129B2 (en) | 2019-08-07 |
| BR112016002268A2 (en) | 2017-08-01 |
| AU2014296023A1 (en) | 2016-02-25 |
| CA2920017A1 (en) | 2015-02-05 |
Similar Documents
| Publication | Publication Date | Title |
|---|---|---|
| EP3027637B1 (en) | The glycine conjugate of beta-muricholic acid as an inhibitor of the farnesoid x receptor for the treatment of obesity, insulin resistance or non-alcoholic fatty liver disease | |
| US10844089B2 (en) | Nuclear sulfated oxysterol, potent regulator of lipid homeostasis, for therapy of hypercholesterolemia, hypertriglycerides, fatty liver diseases, and atherosclerosis | |
| Ushiroda et al. | Green tea polyphenol (epigallocatechin-3-gallate) improves gut dysbiosis and serum bile acids dysregulation in high-fat diet-fed mice | |
| Jiang et al. | Intestinal farnesoid X receptor signaling promotes nonalcoholic fatty liver disease | |
| Liang et al. | Effect of phytosterols and their oxidation products on lipoprotein profiles and vascular function in hamster fed a high cholesterol diet | |
| Marschall et al. | Fxr−/− mice adapt to biliary obstruction by enhanced phase I detoxification and renal elimination of bile acids | |
| US8399441B2 (en) | Nuclear sulfated oxysterol, potent regulator of lipid homeostasis, for therapy of hypercholesterolemia, hypertriglycerides, fatty liver diseases, and atherosclerosis | |
| Hui et al. | Capsaicin improves glucose homeostasis by enhancing glucagon‐like peptide‐1 secretion through the regulation of bile acid metabolism via the remodeling of the gut microbiota in male mice | |
| La Frano et al. | Diet-induced obesity and weight loss alter bile acid concentrations and bile acid–sensitive gene expression in insulin target tissues of C57BL/6J mice | |
| EA020140B1 (en) | Tgr5 modulators and method of use thereof | |
| Xu et al. | L‐Theanine regulates lipid metabolism by modulating gut microbiota and bile acid metabolism | |
| Song et al. | Dihydromyricetin prevents obesity via regulating bile acid metabolism associated with the farnesoid X receptor in ob/ob mice | |
| US20240350562A1 (en) | Bile Acids and Use in Disease Treatment | |
| Xin et al. | Stigmasterol protects against steatohepatitis induced by high-fat and high-cholesterol diet in mice by enhancing the alternative bile acid synthesis pathway | |
| Thevis et al. | Synthetic anabolic agents: steroids and nonsteroidal selective androgen receptor modulators | |
| Lv et al. | Phytosterols alleviate hyperlipidemia by regulating gut microbiota and cholesterol metabolism in mice | |
| Gao et al. | Microbial transformations of bile acids and their receptors in the regulation of metabolic dysfunction-associated steatotic liver disease | |
| Higuchi et al. | The 16α-hydroxylated Bile Acid, Pythocholic Acid Decreases Food Intake and Increases Oleoylethanolamide in Male Mice | |
| Higuchi et al. | The python-derived 16α-hydroxylated bile acid, pythocholic acid decreases food intake and increases jejunal fatty acid ethanolamides in mice | |
| US8623909B2 (en) | Prophylactic/therapeutic agents for lifestyle-related diseases | |
| Decloedt | Anabolic-androgenic steroids in horses: natural presence and underlying biomechanisms | |
| Lemonde | A study using tandem mass spectrometry and molecular biological techniques to facilitate the diagnosis of inborn errors of bile acid synthesis, with particular reference to [delta] 4-3-oxosteroid 5 [beta]-reductase deficiency | |
| Angelin et al. | Regulation of HMG-(30A |
Legal Events
| Date | Code | Title | Description |
|---|---|---|---|
| PUAI | Public reference made under article 153(3) epc to a published international application that has entered the european phase |
Free format text: ORIGINAL CODE: 0009012 |
|
| 17P | Request for examination filed |
Effective date: 20160129 |
|
| AK | Designated contracting states |
Kind code of ref document: A2 Designated state(s): AL AT BE BG CH CY CZ DE DK EE ES FI FR GB GR HR HU IE IS IT LI LT LU LV MC MK MT NL NO PL PT RO RS SE SI SK SM TR |
|
| AX | Request for extension of the european patent |
Extension state: BA ME |
|
| RIN1 | Information on inventor provided before grant (corrected) |
Inventor name: JIANG, CHANGTAO Inventor name: DESAI, DHIMANT Inventor name: LI, FEI Inventor name: GONZALEZ, FRANK J. Inventor name: MITCHELL, JAMES B. Inventor name: AMIN, SHANTU Inventor name: XIE, CEN Inventor name: PATTERSON, ANDREW D. |
|
| DAX | Request for extension of the european patent (deleted) | ||
| STAA | Information on the status of an ep patent application or granted ep patent |
Free format text: STATUS: EXAMINATION IS IN PROGRESS |
|
| 17Q | First examination report despatched |
Effective date: 20170817 |
|
| REG | Reference to a national code |
Ref country code: DE Ref legal event code: R079 Ref document number: 602014054913 Country of ref document: DE Free format text: PREVIOUS MAIN CLASS: C07J0009000000 Ipc: A61K0031575000 |
|
| GRAP | Despatch of communication of intention to grant a patent |
Free format text: ORIGINAL CODE: EPIDOSNIGR1 |
|
| STAA | Information on the status of an ep patent application or granted ep patent |
Free format text: STATUS: GRANT OF PATENT IS INTENDED |
|
| RIC1 | Information provided on ipc code assigned before grant |
Ipc: A61P 3/10 20060101ALI20190225BHEP Ipc: A61P 3/04 20060101ALI20190225BHEP Ipc: A61P 5/50 20060101ALI20190225BHEP Ipc: A61P 1/16 20060101ALI20190225BHEP Ipc: A61K 31/575 20060101AFI20190225BHEP |
|
| INTG | Intention to grant announced |
Effective date: 20190321 |
|
| GRAS | Grant fee paid |
Free format text: ORIGINAL CODE: EPIDOSNIGR3 |
|
| GRAA | (expected) grant |
Free format text: ORIGINAL CODE: 0009210 |
|
| STAA | Information on the status of an ep patent application or granted ep patent |
Free format text: STATUS: THE PATENT HAS BEEN GRANTED |
|
| AK | Designated contracting states |
Kind code of ref document: B1 Designated state(s): AL AT BE BG CH CY CZ DE DK EE ES FI FR GB GR HR HU IE IS IT LI LT LU LV MC MK MT NL NO PL PT RO RS SE SI SK SM TR |
|
| REG | Reference to a national code |
Ref country code: GB Ref legal event code: FG4D |
|
| REG | Reference to a national code |
Ref country code: CH Ref legal event code: EP |
|
| REG | Reference to a national code |
Ref country code: IE Ref legal event code: FG4D |
|
| REG | Reference to a national code |
Ref country code: DE Ref legal event code: R096 Ref document number: 602014054913 Country of ref document: DE |
|
| REG | Reference to a national code |
Ref country code: AT Ref legal event code: REF Ref document number: 1188000 Country of ref document: AT Kind code of ref document: T Effective date: 20191115 |
|
| REG | Reference to a national code |
Ref country code: NL Ref legal event code: MP Effective date: 20191009 |
|
| REG | Reference to a national code |
Ref country code: LT Ref legal event code: MG4D |
|
| REG | Reference to a national code |
Ref country code: AT Ref legal event code: MK05 Ref document number: 1188000 Country of ref document: AT Kind code of ref document: T Effective date: 20191009 |
|
| PG25 | Lapsed in a contracting state [announced via postgrant information from national office to epo] |
Ref country code: ES Free format text: LAPSE BECAUSE OF FAILURE TO SUBMIT A TRANSLATION OF THE DESCRIPTION OR TO PAY THE FEE WITHIN THE PRESCRIBED TIME-LIMIT Effective date: 20191009 Ref country code: PT Free format text: LAPSE BECAUSE OF FAILURE TO SUBMIT A TRANSLATION OF THE DESCRIPTION OR TO PAY THE FEE WITHIN THE PRESCRIBED TIME-LIMIT Effective date: 20200210 Ref country code: GR Free format text: LAPSE BECAUSE OF FAILURE TO SUBMIT A TRANSLATION OF THE DESCRIPTION OR TO PAY THE FEE WITHIN THE PRESCRIBED TIME-LIMIT Effective date: 20200110 Ref country code: AT Free format text: LAPSE BECAUSE OF FAILURE TO SUBMIT A TRANSLATION OF THE DESCRIPTION OR TO PAY THE FEE WITHIN THE PRESCRIBED TIME-LIMIT Effective date: 20191009 Ref country code: NL Free format text: LAPSE BECAUSE OF FAILURE TO SUBMIT A TRANSLATION OF THE DESCRIPTION OR TO PAY THE FEE WITHIN THE PRESCRIBED TIME-LIMIT Effective date: 20191009 Ref country code: FI Free format text: LAPSE BECAUSE OF FAILURE TO SUBMIT A TRANSLATION OF THE DESCRIPTION OR TO PAY THE FEE WITHIN THE PRESCRIBED TIME-LIMIT Effective date: 20191009 Ref country code: BG Free format text: LAPSE BECAUSE OF FAILURE TO SUBMIT A TRANSLATION OF THE DESCRIPTION OR TO PAY THE FEE WITHIN THE PRESCRIBED TIME-LIMIT Effective date: 20200109 Ref country code: NO Free format text: LAPSE BECAUSE OF FAILURE TO SUBMIT A TRANSLATION OF THE DESCRIPTION OR TO PAY THE FEE WITHIN THE PRESCRIBED TIME-LIMIT Effective date: 20200109 Ref country code: LT Free format text: LAPSE BECAUSE OF FAILURE TO SUBMIT A TRANSLATION OF THE DESCRIPTION OR TO PAY THE FEE WITHIN THE PRESCRIBED TIME-LIMIT Effective date: 20191009 Ref country code: PL Free format text: LAPSE BECAUSE OF FAILURE TO SUBMIT A TRANSLATION OF THE DESCRIPTION OR TO PAY THE FEE WITHIN THE PRESCRIBED TIME-LIMIT Effective date: 20191009 Ref country code: LV Free format text: LAPSE BECAUSE OF FAILURE TO SUBMIT A TRANSLATION OF THE DESCRIPTION OR TO PAY THE FEE WITHIN THE PRESCRIBED TIME-LIMIT Effective date: 20191009 Ref country code: SE Free format text: LAPSE BECAUSE OF FAILURE TO SUBMIT A TRANSLATION OF THE DESCRIPTION OR TO PAY THE FEE WITHIN THE PRESCRIBED TIME-LIMIT Effective date: 20191009 |
|
| PG25 | Lapsed in a contracting state [announced via postgrant information from national office to epo] |
Ref country code: HR Free format text: LAPSE BECAUSE OF FAILURE TO SUBMIT A TRANSLATION OF THE DESCRIPTION OR TO PAY THE FEE WITHIN THE PRESCRIBED TIME-LIMIT Effective date: 20191009 Ref country code: RS Free format text: LAPSE BECAUSE OF FAILURE TO SUBMIT A TRANSLATION OF THE DESCRIPTION OR TO PAY THE FEE WITHIN THE PRESCRIBED TIME-LIMIT Effective date: 20191009 Ref country code: IS Free format text: LAPSE BECAUSE OF FAILURE TO SUBMIT A TRANSLATION OF THE DESCRIPTION OR TO PAY THE FEE WITHIN THE PRESCRIBED TIME-LIMIT Effective date: 20200224 |
|
| PG25 | Lapsed in a contracting state [announced via postgrant information from national office to epo] |
Ref country code: AL Free format text: LAPSE BECAUSE OF FAILURE TO SUBMIT A TRANSLATION OF THE DESCRIPTION OR TO PAY THE FEE WITHIN THE PRESCRIBED TIME-LIMIT Effective date: 20191009 |
|
| REG | Reference to a national code |
Ref country code: DE Ref legal event code: R097 Ref document number: 602014054913 Country of ref document: DE |
|
| PG2D | Information on lapse in contracting state deleted |
Ref country code: IS |
|
| PG25 | Lapsed in a contracting state [announced via postgrant information from national office to epo] |
Ref country code: RO Free format text: LAPSE BECAUSE OF FAILURE TO SUBMIT A TRANSLATION OF THE DESCRIPTION OR TO PAY THE FEE WITHIN THE PRESCRIBED TIME-LIMIT Effective date: 20191009 Ref country code: CZ Free format text: LAPSE BECAUSE OF FAILURE TO SUBMIT A TRANSLATION OF THE DESCRIPTION OR TO PAY THE FEE WITHIN THE PRESCRIBED TIME-LIMIT Effective date: 20191009 Ref country code: DK Free format text: LAPSE BECAUSE OF FAILURE TO SUBMIT A TRANSLATION OF THE DESCRIPTION OR TO PAY THE FEE WITHIN THE PRESCRIBED TIME-LIMIT Effective date: 20191009 Ref country code: EE Free format text: LAPSE BECAUSE OF FAILURE TO SUBMIT A TRANSLATION OF THE DESCRIPTION OR TO PAY THE FEE WITHIN THE PRESCRIBED TIME-LIMIT Effective date: 20191009 Ref country code: IS Free format text: LAPSE BECAUSE OF FAILURE TO SUBMIT A TRANSLATION OF THE DESCRIPTION OR TO PAY THE FEE WITHIN THE PRESCRIBED TIME-LIMIT Effective date: 20200209 |
|
| PLBE | No opposition filed within time limit |
Free format text: ORIGINAL CODE: 0009261 |
|
| STAA | Information on the status of an ep patent application or granted ep patent |
Free format text: STATUS: NO OPPOSITION FILED WITHIN TIME LIMIT |
|
| PG25 | Lapsed in a contracting state [announced via postgrant information from national office to epo] |
Ref country code: SK Free format text: LAPSE BECAUSE OF FAILURE TO SUBMIT A TRANSLATION OF THE DESCRIPTION OR TO PAY THE FEE WITHIN THE PRESCRIBED TIME-LIMIT Effective date: 20191009 Ref country code: IT Free format text: LAPSE BECAUSE OF FAILURE TO SUBMIT A TRANSLATION OF THE DESCRIPTION OR TO PAY THE FEE WITHIN THE PRESCRIBED TIME-LIMIT Effective date: 20191009 Ref country code: SM Free format text: LAPSE BECAUSE OF FAILURE TO SUBMIT A TRANSLATION OF THE DESCRIPTION OR TO PAY THE FEE WITHIN THE PRESCRIBED TIME-LIMIT Effective date: 20191009 |
|
| 26N | No opposition filed |
Effective date: 20200710 |
|
| PG25 | Lapsed in a contracting state [announced via postgrant information from national office to epo] |
Ref country code: MC Free format text: LAPSE BECAUSE OF FAILURE TO SUBMIT A TRANSLATION OF THE DESCRIPTION OR TO PAY THE FEE WITHIN THE PRESCRIBED TIME-LIMIT Effective date: 20191009 |
|
| REG | Reference to a national code |
Ref country code: CH Ref legal event code: PL |
|
| PG25 | Lapsed in a contracting state [announced via postgrant information from national office to epo] |
Ref country code: LU Free format text: LAPSE BECAUSE OF NON-PAYMENT OF DUE FEES Effective date: 20200801 Ref country code: CH Free format text: LAPSE BECAUSE OF NON-PAYMENT OF DUE FEES Effective date: 20200831 Ref country code: LI Free format text: LAPSE BECAUSE OF NON-PAYMENT OF DUE FEES Effective date: 20200831 |
|
| REG | Reference to a national code |
Ref country code: BE Ref legal event code: MM Effective date: 20200831 |
|
| PG25 | Lapsed in a contracting state [announced via postgrant information from national office to epo] |
Ref country code: IE Free format text: LAPSE BECAUSE OF NON-PAYMENT OF DUE FEES Effective date: 20200801 Ref country code: BE Free format text: LAPSE BECAUSE OF NON-PAYMENT OF DUE FEES Effective date: 20200831 |
|
| PG25 | Lapsed in a contracting state [announced via postgrant information from national office to epo] |
Ref country code: TR Free format text: LAPSE BECAUSE OF FAILURE TO SUBMIT A TRANSLATION OF THE DESCRIPTION OR TO PAY THE FEE WITHIN THE PRESCRIBED TIME-LIMIT Effective date: 20191009 Ref country code: MT Free format text: LAPSE BECAUSE OF FAILURE TO SUBMIT A TRANSLATION OF THE DESCRIPTION OR TO PAY THE FEE WITHIN THE PRESCRIBED TIME-LIMIT Effective date: 20191009 Ref country code: CY Free format text: LAPSE BECAUSE OF FAILURE TO SUBMIT A TRANSLATION OF THE DESCRIPTION OR TO PAY THE FEE WITHIN THE PRESCRIBED TIME-LIMIT Effective date: 20191009 |
|
| PG25 | Lapsed in a contracting state [announced via postgrant information from national office to epo] |
Ref country code: MK Free format text: LAPSE BECAUSE OF FAILURE TO SUBMIT A TRANSLATION OF THE DESCRIPTION OR TO PAY THE FEE WITHIN THE PRESCRIBED TIME-LIMIT Effective date: 20191009 |
|
| PG25 | Lapsed in a contracting state [announced via postgrant information from national office to epo] |
Ref country code: SI Free format text: LAPSE BECAUSE OF FAILURE TO SUBMIT A TRANSLATION OF THE DESCRIPTION OR TO PAY THE FEE WITHIN THE PRESCRIBED TIME-LIMIT Effective date: 20191009 |
|
| P01 | Opt-out of the competence of the unified patent court (upc) registered |
Effective date: 20230825 |
|
| PGFP | Annual fee paid to national office [announced via postgrant information from national office to epo] |
Ref country code: GB Payment date: 20230828 Year of fee payment: 10 |
|
| PGFP | Annual fee paid to national office [announced via postgrant information from national office to epo] |
Ref country code: FR Payment date: 20230825 Year of fee payment: 10 Ref country code: DE Payment date: 20230829 Year of fee payment: 10 |