EP3014258B1 - Transient signal error trap for an analyte measurement determined from a specified sampling time derived from a sensed physical characteristic of the sample containing the analyte - Google Patents
Transient signal error trap for an analyte measurement determined from a specified sampling time derived from a sensed physical characteristic of the sample containing the analyte Download PDFInfo
- Publication number
- EP3014258B1 EP3014258B1 EP14734118.4A EP14734118A EP3014258B1 EP 3014258 B1 EP3014258 B1 EP 3014258B1 EP 14734118 A EP14734118 A EP 14734118A EP 3014258 B1 EP3014258 B1 EP 3014258B1
- Authority
- EP
- European Patent Office
- Prior art keywords
- signal
- electrodes
- interval
- sampling time
- physical characteristic
- Prior art date
- Legal status (The legal status is an assumption and is not a legal conclusion. Google has not performed a legal analysis and makes no representation as to the accuracy of the status listed.)
- Active
Links
- 239000012491 analyte Substances 0.000 title claims description 104
- 238000005259 measurement Methods 0.000 title claims description 82
- 238000005070 sampling Methods 0.000 title claims description 77
- 230000001052 transient effect Effects 0.000 title description 26
- 238000012360 testing method Methods 0.000 claims description 174
- 239000008103 glucose Substances 0.000 claims description 85
- WQZGKKKJIJFFOK-GASJEMHNSA-N Glucose Natural products OC[C@H]1OC(O)[C@H](O)[C@@H](O)[C@@H]1O WQZGKKKJIJFFOK-GASJEMHNSA-N 0.000 claims description 79
- 238000005534 hematocrit Methods 0.000 claims description 61
- 238000000034 method Methods 0.000 claims description 58
- 239000012530 fluid Substances 0.000 claims description 45
- 239000003153 chemical reaction reagent Substances 0.000 claims description 27
- 239000000758 substrate Substances 0.000 claims description 19
- 239000011159 matrix material Substances 0.000 claims description 10
- 230000002255 enzymatic effect Effects 0.000 claims description 8
- 230000003247 decreasing effect Effects 0.000 claims description 7
- 238000004891 communication Methods 0.000 claims description 4
- 238000000151 deposition Methods 0.000 claims description 4
- 238000006911 enzymatic reaction Methods 0.000 claims description 4
- 238000012545 processing Methods 0.000 claims description 3
- 230000010363 phase shift Effects 0.000 description 38
- 239000010410 layer Substances 0.000 description 36
- 210000004369 blood Anatomy 0.000 description 27
- 239000008280 blood Substances 0.000 description 27
- 210000004027 cell Anatomy 0.000 description 21
- 108010015776 Glucose oxidase Proteins 0.000 description 19
- 239000004366 Glucose oxidase Substances 0.000 description 15
- 229940116332 glucose oxidase Drugs 0.000 description 15
- 235000019420 glucose oxidase Nutrition 0.000 description 15
- 210000001124 body fluid Anatomy 0.000 description 14
- 238000001514 detection method Methods 0.000 description 13
- OKTJSMMVPCPJKN-UHFFFAOYSA-N Carbon Chemical compound [C] OKTJSMMVPCPJKN-UHFFFAOYSA-N 0.000 description 12
- 239000000306 component Substances 0.000 description 11
- 230000009977 dual effect Effects 0.000 description 10
- 230000002829 reductive effect Effects 0.000 description 10
- 229910052799 carbon Inorganic materials 0.000 description 9
- 230000006870 function Effects 0.000 description 9
- 230000008569 process Effects 0.000 description 9
- 238000006243 chemical reaction Methods 0.000 description 8
- 238000010586 diagram Methods 0.000 description 8
- 210000003743 erythrocyte Anatomy 0.000 description 7
- 230000007274 generation of a signal involved in cell-cell signaling Effects 0.000 description 6
- 108090000790 Enzymes Proteins 0.000 description 5
- 102000004190 Enzymes Human genes 0.000 description 5
- 230000000694 effects Effects 0.000 description 5
- 229940088598 enzyme Drugs 0.000 description 5
- 230000004044 response Effects 0.000 description 5
- YAGKRVSRTSUGEY-UHFFFAOYSA-N ferricyanide Chemical compound [Fe+3].N#[C-].N#[C-].N#[C-].N#[C-].N#[C-].N#[C-] YAGKRVSRTSUGEY-UHFFFAOYSA-N 0.000 description 4
- 238000009413 insulation Methods 0.000 description 4
- RGHNJXZEOKUKBD-UHFFFAOYSA-N D-gluconic acid Natural products OCC(O)C(O)C(O)C(O)C(O)=O RGHNJXZEOKUKBD-UHFFFAOYSA-N 0.000 description 3
- RGHNJXZEOKUKBD-SQOUGZDYSA-N Gluconic acid Natural products OC[C@@H](O)[C@@H](O)[C@H](O)[C@@H](O)C(O)=O RGHNJXZEOKUKBD-SQOUGZDYSA-N 0.000 description 3
- 239000000853 adhesive Substances 0.000 description 3
- 230000001070 adhesive effect Effects 0.000 description 3
- 238000004422 calculation algorithm Methods 0.000 description 3
- 238000004364 calculation method Methods 0.000 description 3
- 239000006229 carbon black Substances 0.000 description 3
- 230000008859 change Effects 0.000 description 3
- 150000001875 compounds Chemical class 0.000 description 3
- 230000001419 dependent effect Effects 0.000 description 3
- 235000012208 gluconic acid Nutrition 0.000 description 3
- 239000000174 gluconic acid Substances 0.000 description 3
- 229910002804 graphite Inorganic materials 0.000 description 3
- 239000010439 graphite Substances 0.000 description 3
- 238000007254 oxidation reaction Methods 0.000 description 3
- 230000037361 pathway Effects 0.000 description 3
- 238000003825 pressing Methods 0.000 description 3
- 239000011347 resin Substances 0.000 description 3
- 229920005989 resin Polymers 0.000 description 3
- 238000012546 transfer Methods 0.000 description 3
- 238000011144 upstream manufacturing Methods 0.000 description 3
- 239000012790 adhesive layer Substances 0.000 description 2
- 238000003556 assay Methods 0.000 description 2
- HVYWMOMLDIMFJA-DPAQBDIFSA-N cholesterol Chemical compound C1C=C2C[C@@H](O)CC[C@]2(C)[C@@H]2[C@@H]1[C@@H]1CC[C@H]([C@H](C)CCCC(C)C)[C@@]1(C)CC2 HVYWMOMLDIMFJA-DPAQBDIFSA-N 0.000 description 2
- 230000001934 delay Effects 0.000 description 2
- 230000008021 deposition Effects 0.000 description 2
- 238000000840 electrochemical analysis Methods 0.000 description 2
- 238000003487 electrochemical reaction Methods 0.000 description 2
- 238000011156 evaluation Methods 0.000 description 2
- 230000003203 everyday effect Effects 0.000 description 2
- 230000036541 health Effects 0.000 description 2
- 238000003780 insertion Methods 0.000 description 2
- 230000037431 insertion Effects 0.000 description 2
- 239000000203 mixture Substances 0.000 description 2
- 238000012986 modification Methods 0.000 description 2
- 230000004048 modification Effects 0.000 description 2
- 238000007650 screen-printing Methods 0.000 description 2
- 125000006850 spacer group Chemical group 0.000 description 2
- 239000000126 substance Substances 0.000 description 2
- 102000001554 Hemoglobins Human genes 0.000 description 1
- 108010054147 Hemoglobins Proteins 0.000 description 1
- 208000013016 Hypoglycemia Diseases 0.000 description 1
- 241001465754 Metazoa Species 0.000 description 1
- 230000006978 adaptation Effects 0.000 description 1
- 230000002411 adverse Effects 0.000 description 1
- 238000004458 analytical method Methods 0.000 description 1
- 230000000903 blocking effect Effects 0.000 description 1
- 239000012503 blood component Substances 0.000 description 1
- 239000003795 chemical substances by application Substances 0.000 description 1
- 235000012000 cholesterol Nutrition 0.000 description 1
- 230000002596 correlated effect Effects 0.000 description 1
- 230000000875 corresponding effect Effects 0.000 description 1
- 230000008878 coupling Effects 0.000 description 1
- 238000010168 coupling process Methods 0.000 description 1
- 238000005859 coupling reaction Methods 0.000 description 1
- 230000009089 cytolysis Effects 0.000 description 1
- 238000009795 derivation Methods 0.000 description 1
- 206010012601 diabetes mellitus Diseases 0.000 description 1
- 238000009792 diffusion process Methods 0.000 description 1
- 238000004090 dissolution Methods 0.000 description 1
- 229940079593 drug Drugs 0.000 description 1
- 239000003814 drug Substances 0.000 description 1
- 238000002848 electrochemical method Methods 0.000 description 1
- 239000007772 electrode material Substances 0.000 description 1
- 230000005284 excitation Effects 0.000 description 1
- 210000003722 extracellular fluid Anatomy 0.000 description 1
- 230000037406 food intake Effects 0.000 description 1
- 235000012631 food intake Nutrition 0.000 description 1
- 238000009472 formulation Methods 0.000 description 1
- 125000002791 glucosyl group Chemical group C1([C@H](O)[C@@H](O)[C@H](O)[C@H](O1)CO)* 0.000 description 1
- 230000000977 initiatory effect Effects 0.000 description 1
- 230000002452 interceptive effect Effects 0.000 description 1
- 238000011835 investigation Methods 0.000 description 1
- 230000001678 irradiating effect Effects 0.000 description 1
- 150000002576 ketones Chemical class 0.000 description 1
- 230000000670 limiting effect Effects 0.000 description 1
- 239000004973 liquid crystal related substance Substances 0.000 description 1
- 238000004519 manufacturing process Methods 0.000 description 1
- 239000003550 marker Substances 0.000 description 1
- 239000000463 material Substances 0.000 description 1
- 230000003287 optical effect Effects 0.000 description 1
- 230000003647 oxidation Effects 0.000 description 1
- 230000003071 parasitic effect Effects 0.000 description 1
- 229920000728 polyester Polymers 0.000 description 1
- -1 polyethylene tetraphthalate Polymers 0.000 description 1
- 239000000376 reactant Substances 0.000 description 1
- 238000000611 regression analysis Methods 0.000 description 1
- 230000000630 rising effect Effects 0.000 description 1
- 239000012453 solvate Substances 0.000 description 1
- 239000002904 solvent Substances 0.000 description 1
- 238000001228 spectrum Methods 0.000 description 1
- 230000001360 synchronised effect Effects 0.000 description 1
- 230000000007 visual effect Effects 0.000 description 1
Images


Classifications
-
- G—PHYSICS
- G01—MEASURING; TESTING
- G01N—INVESTIGATING OR ANALYSING MATERIALS BY DETERMINING THEIR CHEMICAL OR PHYSICAL PROPERTIES
- G01N27/00—Investigating or analysing materials by the use of electric, electrochemical, or magnetic means
- G01N27/26—Investigating or analysing materials by the use of electric, electrochemical, or magnetic means by investigating electrochemical variables; by using electrolysis or electrophoresis
- G01N27/28—Electrolytic cell components
- G01N27/30—Electrodes, e.g. test electrodes; Half-cells
- G01N27/327—Biochemical electrodes, e.g. electrical or mechanical details for in vitro measurements
- G01N27/3271—Amperometric enzyme electrodes for analytes in body fluids, e.g. glucose in blood
- G01N27/3274—Corrective measures, e.g. error detection, compensation for temperature or hematocrit, calibration
Definitions
- Electrochemical glucose test strips such as those used in the OneTouch ® Ultra ® whole blood testing kit, which is available from LifeScan, Inc., are designed to measure the concentration of glucose in a physiological fluid sample from patients with diabetes.
- the measurement of glucose can be based on the selective oxidation of glucose by the enzyme glucose oxidase (GO).
- the reactions that can occur in a glucose test strip are summarized below in Equations 1 and 2.
- glucose is oxidized to gluconic acid by the oxidized form of glucose oxidase (GO (ox) ).
- GO (ox) may also be referred to as an "oxidized enzyme.”
- the oxidized enzyme GO (ox) is converted to its reduced state, which is denoted as GO (red) (i.e., “reduced enzyme”).
- the reduced enzyme GO (red) is re-oxidized back to GO (ox) by "reduced enzyme”).
- the reduced enzyme GO (red) is re-oxidized back to GO (ox) by reaction with Fe(CN) 6 3- (referred to as either the oxidized mediator or ferricyanide) as illustrated in Equation 2.
- Fe(CN) 6 3- referred to as either the oxidized mediator or ferricyanide
- Equation 2 the reduced enzyme GO (red) is re-oxidized back to GO (ox) by reaction with Fe(CN) 6 3- (referred to as either the oxidized mediator or ferricyanide) as illustrated in Equation 2.
- Fe(CN) 6 3- referred to as either the oxidized mediator or ferricyanide
- a test current can be created by the electrochemical re-oxidation of the reduced mediator at the electrode surface.
- a mediator such as ferricyanide
- ferricyanide is a compound that accepts electrons from an enzyme such as glucose oxidase and then donates the electrons to an electrode.
- the concentration of glucose in the sample increases, the amount of reduced mediator formed also increases; hence, there is a direct relationship between the test current, resulting from the re-oxidation of reduced mediator, and glucose concentration.
- the transfer of electrons across the electrical interface results in the flow of a test current (2 moles of electrons for every mole of glucose that is oxidized).
- the test current resulting from the introduction of glucose can, therefore, be referred to as a glucose signal.
- Electrochemical biosensors may be adversely affected by the presence of certain blood components that may undesirably affect the measurement and lead to inaccuracies in the detected signal. This inaccuracy may result in an inaccurate glucose reading, leaving the patient unaware of a potentially dangerous blood sugar level, for example.
- the blood hematocrit level i.e. the percentage of the amount of blood that is occupied by red blood cells
- Variations in a volume of red blood cells within blood can cause variations in glucose readings measured with disposable electrochemical test strips.
- a negative bias i.e., lower calculated analyte concentration
- a positive bias i.e., higher calculated analyte concentration as compared to referential analyte concentration
- the red blood cells may impede the reaction of enzymes and electrochemical mediators, reduce the rate of chemistry dissolution since there is less plasma volume to solvate the chemical reactants, and slow diffusion of the mediator. These factors can result in a lower than expected glucose reading as less signal is produced during the electrochemical process.
- fewer red blood cells may affect the electrochemical reaction than expected, and a higher measured signal can result.
- the physiological fluid sample resistance is also hematocrit dependent, which can affect voltage and/or current measurements.
- test strips have been designed to incorporate meshes to remove red blood cells from the samples, or have included various compounds or formulations designed to increase the viscosity of red blood cells and attenuate the effect of low hematocrit on concentration determinations.
- Other test strips have included lysis agents and systems configured to determine hemoglobin concentration in an attempt to correct hematocrit.
- biosensors have been configured to measure hematocrit by measuring an electrical response of the fluid sample via alternating current signals or change in optical variations after irradiating the physiological fluid sample with light, or measuring hematocrit based on a function of sample chamber fill time.
- a common technique of the strategies involving detection of hematocrit is to use the measured hematocrit value to correct or change the measured analyte concentration, which technique is generally shown and described in the following respective US Patent Application Publication Nos. 2010/0283488 ; 2010/0206749 ; 2009/0236237 ; 2010/0276303 ; 2010/0206749 ; 2009/0223834 ; 2008/0083618 ; 2004/0079652 ; 2010/0283488 ; 2010/0206749 ; 2009/0194432 ; or US Patent Nos., 7,972,861 and 7,258,769 .
- WO2013030375 A1 describes hematocrit corrected glucose measurements that allow for determination of hematocrit by a time differential between the input and output signals such that a glucose measurement for a blood sample can be corrected by the measured hematocrit of the blood sample.
- WO2012164271 A1 describes measurement with a test strip having two working electrodes, using the current transient for each working electrode measured at a predetermined durational offset from a peak of the current transient.
- the terms “about” or “approximately” for any numerical values or ranges indicate a suitable dimensional tolerance that allows the part or collection of components to function for its intended purpose as described herein. More specifically, “about” or “approximately” may refer to the range of values ⁇ 10% of the recited value, e.g. “about 90%” may refer to the range of values from 81% to 99%.
- the terms “patient,” “host,” “user,” and “subject” refer to any human or animal subject and are not intended to limit the systems or methods to human use, although use of the subject invention in a human patient represents a preferred embodiment.
- oscillating signal includes voltage signal(s) or current signal(s) that, respectively, change polarity or alternate direction of current or are multi-directional.
- electrical signal or “signal” is intended to include direct current signal, alternating signal or any signal within the electromagnetic spectrum.
- processor or “microcontroller” are intended to have the same meaning and are intended to be used interchangeably.
- an announcement may be provided via text, audio, visual or a combination of all modes or mediums of communication to a user.
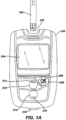
- FIGURE 1A illustrates a test meter 200 for testing analyte (glucose) levels in the blood of an individual with a biosensor produced by the methods and techniques illustrated and described herein.
- Test meter 200 may include user interface inputs (206, 210, 214), which can be in the form of buttons, for entry of data, navigation of menus, and execution of commands.
- Data can include values representative of analyte concentration, and/or information that are related to the everyday lifestyle of an individual.
- Information which is related to the everyday lifestyle, can include food intake, medication use, the occurrence of health check-ups, general health condition and exercise levels of an individual.
- Test meter 200 can also include a display 204 that can be used to report measured glucose levels, and to facilitate entry of lifestyle related information.
- Test meter 200 may include a first user interface input 206, a second user interface input 210, and a third user interface input 214.
- User interface inputs 206, 210, and 214 facilitate entry and analysis of data stored in the testing device, enabling a user to navigate through the user interface displayed on display 204.
- User interface inputs 206, 210, and 214 include a first marking 208, a second marking 212, and a third marking 216, which help in correlating user interface inputs to characters on display 204.
- Test meter 200 can be turned on by inserting a biosensor 100 (or its variants) into a strip port connector 220, by pressing and briefly holding first user interface input 206, or by the detection of data traffic across a data port 218. Test meter 200 can be switched off by removing biosensor 100 (or its variants), pressing and briefly holding first user interface input 206, navigating to and selecting a meter off option from a main menu screen, or by not pressing any buttons for a predetermined time. Display 104 can optionally include a backlight.
- test meter 200 can be configured to not receive a calibration input for example, from any external source, when switching from a first test strip batch to a second test strip batch.
- the meter is configured to not receive a calibration input from external sources, such as a user interface (such as inputs 206, 210, 214), an inserted test strip, a separate code key or a code strip, data port 218.
- a calibration input is not necessary when all of the biosensor batches have a substantially uniform calibration characteristic.
- the calibration input can be a set of values ascribed to a particular biosensor batch.
- the calibration input can include a batch "slope" value and a batch "intercept" value for a particular biosensor batch.
- the calibrations input such as batch slope and intercept values, may be preset within the meter as will be described below.
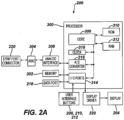
- Test meter 200 includes a processor 300, which in some embodiments described and illustrated herein is a 32-bit RISC microcontroller.
- processor 300 is preferably selected from the MSP 430 family of ultra-low power microcontrollers manufactured by Texas Instruments of Dallas, Texas.
- the processor can be bi-directionally connected via I/O ports 314 to a memory 302, which in some embodiments described and illustrated herein is an EEPROM.
- I/O ports 214 Also connected to processor 300 via I/O ports 214 are the data port 218, the user interface inputs 206, 210, and 214, and a display driver 320.
- Data port 218 can be connected to processor 300, thereby enabling transfer of data between memory 302 and an external device, such as a personal computer.
- User interface inputs 206, 210, and 214 are directly connected to processor 300.
- Processor 300 controls display 204 via display driver 320.
- Memory 302 may be pre-loaded with calibration information, such as batch slope and batch intercept values, during production of test meter 200. This pre-loaded calibration information can be accessed and used by processor 300 upon receiving a suitable signal (such as current) from the strip via strip port connector 220 so as to calculate a corresponding analyte level ( blood glucose concentration) using the signal and the calibration information without receiving calibration input from any external source.
- test meter 200 may include an Application Specific Integrated Circuit (ASIC) 304, so as to provide electronic circuitry used in measurements of glucose level in blood that has been applied to a test strip 100 (or its variants) inserted into strip port connector 220.
- ASIC Application Specific Integrated Circuit
- Analog voltages can pass to and from ASIC 304 by way of an analog interface 306.
- Analog signals from analog interface 306 can be converted to digital signals by an A/D converter 316.
- Processor 300 further includes a core 308, a ROM 310 (containing computer code), a RAM 312, and a clock 318.
- the processor 300 is configured (or programmed) to disable all of the user interface inputs except for a single input upon a display of an analyte value by the display unit such as, for example, during a time period after an analyte measurement. In an alternative embodiment, the processor 300 is configured (or programmed) to ignore any input from all of the user interface inputs except for a single input upon a display of an analyte value by the display unit.
- Detailed descriptions and illustrations of the meter 200 are shown and described in International Patent Application Publication No. WO2006070200 .
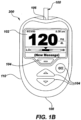
- hand-held test meter 200 includes a display 102, a plurality of user interface buttons 104, a strip port connector 106, a USB interface 108, and a housing.
- hand-held test meter 200 also includes a microcontroller block 112, a physical characteristic measurement block 114, a display control block 116, a memory block 118 and other electronic components (not shown) for applying a test voltage to biosensor, and also for measuring an electrochemical response (e.g., plurality of test current values) and determining an analyte based on the electrochemical response.
- the FIGURES do not depict all such electronic circuitry.
- Display 102 can be, for example, a liquid crystal display or a bi-stable display configured to show a screen image.
- An example of a screen image may include a glucose concentration, a date and time, an error message, and a user interface for instructing an end user how to perform a test.
- Strip port connector 106 is configured to operatively interface with a biosensor 100, such as an electrochemical-based biosensor configured for the determination of glucose in a whole blood sample. Therefore, the biosensor is configured for operative insertion into strip port connector 106 and to operatively interface with phase-shift-based hematocrit measurement block 114 via, for example, suitable electrical contacts.
- a biosensor 100 such as an electrochemical-based biosensor configured for the determination of glucose in a whole blood sample. Therefore, the biosensor is configured for operative insertion into strip port connector 106 and to operatively interface with phase-shift-based hematocrit measurement block 114 via, for example, suitable electrical contacts.
- USB Interface 108 can be any suitable interface known to one skilled in the art.
- USB Interface 108 is essentially a passive component that is configured to power and provide a data line to hand-held test meter 200.
- a bodily fluid sample e.g., a whole blood sample
- a bodily fluid sample e.g., a whole blood sample
- the biosensor includes enzymatic reagents that selectively and quantitatively transform an analyte into another predetermined chemical form.
- the biosensor can include an enzymatic reagent with ferricyanide and glucose oxidase so that glucose can be physically transformed into an oxidized form.
- Memory block 118 of hand-held test meter 200 includes a suitable algorithm and can be configured, along with microcontroller block 112 to determine an analyte based on the electrochemical response of biosensor and the hematocrit of the introduced sample. For example, in the determination of the analyte blood glucose, the hematocrit can be used to compensate for the effect of hematocrit on electrochemically determined blood glucose concentrations.
- Microcontroller block 112 is disposed within housing and can include any suitable microcontroller and/or micro-processer known to those of skill in the art.
- One such suitable microcontroller is a microcontroller commercially available from Texas Instruments, Dallas, TX USA and part number MSP430F5138. This microcontroller can generate a square wave of 25 to 250 kHz and a 90 degree phase-shifted wave of the same frequency and, thereby, function as a signal generation s-block described further below.
- MSP430F5138 also has Analog-to-Digital (A/D) processing capabilities suitable for measuring voltages generated by phase shift based hematocrit measurement blocks employed in embodiments of the present disclosure.
- A/D Analog-to-Digital
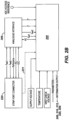
- phase-shift-based hematocrit measurement block 114 includes a signal generation sub-block 120, a low pass filter sub-block 122, an biosensor sample cell interface sub-block 124, an optional calibration load block 126 (within the dashed lines of FIGURE 2D ), a transimpedance amplifier sub-block 128, and a phase detector sub-block 130.
- phase-shift-based hematocrit measurement block 114 and microcontroller block 112 are configured to measure the phase shift of a bodily fluid sample in a sample cell of an biosensor inserted in the hand-held test meter by, for example, measuring the phase shift of one or more high frequency electrical signals driven through the bodily fluid sample.
- microcontroller block 112 is configured to compute the hematocrit of the bodily fluid based on the measured phase shift.
- Microcontroller 112 can compute the hematocrit by, for example, employing an A/D converter to measure voltages received from a phase-detector sub-block, convert the voltages into a phase-shift and then employing a suitable algorithm or look-up table to convert the phase-shit into a hematocrit value.
- an algorithm and/or look-up table will be configured to take into account various factors such as strip geometry (including electrode area and sample chamber volume) and signal frequency.
- the hematocrit of a bodily fluid sample can be measured by, for example, driving AC signals of known frequency through the bodily fluid sample and detecting their phase shift.
- the phase-shift of a signal with a frequency in the range of 10 kHz to 25 kHz can be used as a reference reading in such a hematocrit measurement while the phase shift of a signal with a frequency in the range of 250 kHz to 500 kHz can be used as the primary measurement.
- signal generation sub-block 120 can be any suitable signal generation block and is configured to generate a square wave (0V to Vref) of a desired frequency.
- Such a signal generation sub-block can, if desired, be integrated into microcontroller block 112.
- the signal generated by signal generation sub-block 120 is communicated to dual low pass filter sub-block 122, which is configured to convert the square wave signal to a sine wave signal of a predetermined frequency.
- the dual LPF of FIGURE 2E is configured to provide both a signal of a first frequency (such as a frequency in the range of 10kHz to 25kHz) and a signal of a second frequency (such as a frequency in the range of 250 kHz to 500kHz) to the biosensor sample cell interface sub-block and an biosensors' sample chamber (also referred to as the HCT measurement cell). Selection of the first and second frequency is accomplished using switch IC7 of FIGURE 2E .
- the dual LPF of FIGURE 2E includes employs two suitable operational amplifiers (IC4 and IC5) such as the operational amplifier available from Texas Instruments, Dallas, Texas, USA as high-speed, voltage feedback, CMOS operational amplifier part number OPA354.
- F-DRV represents a square wave input of either a low or high frequency (e.g., 25kHz or 250 kHz) and is connected to both IC4 and IC5.
- Signal Fi-HIGH/LOW selects the output of dual low pass filter sub-block 122 via switch IC7.
- C5 in FIGURE 2E is configured to block the operating voltage of dual low pass filter sub-block 122 from the HCT measurement cell.
- dual low pass filter sub-block 122 can be any suitable low pass filter sub-block known to one skilled in the art including, for example, any suitable multiple feedback low pass filter, or a Sallen and Key low pass filter.
- Biosensor sample cell interface sub-block 124 can be any suitable sample cell interface block including, for example, an interface block configured to operatively interface with the sample cell of the biosensor via first electrode and second electrodes of the biosensor disposed in the sample cell.
- the signal can be driven into the sample cell (from the low pass filter sub-block) via the first electrode and picked-up from the sample cell (by the transimpedance amplifier sub-block) via the second electrode as depicted in FIGURE 2G .
- the current produced by driving the signal across the sample cell is picked-up by transimpedance amplifier sub-block 128 and converted into a voltage signal for communication to phase detector sub-block 130.
- Transimpedance sub-block 128 can be any suitable transimpedance sub-block known to one skilled in the art.
- FIGURE 2F is a simplified annotated schematic block diagram of one such transimpedance amplifier sub-block (based on two OPA354 operational amplifiers, IC3 and IC9).
- the first stage of TIA sub-block 128 operates at, for example, 400mV, which limits the AC amplitude to +/-400mV.
- the second stage of TIA sub-block 128 operates at Vref/2, a configuration which enables the generation of an output of the full span of the microcontroller A/D inputs.
- C9 of TIA sub-block 128 serves as a blocking component that only allows an AC sine wave signal to pass.
- Phase detector sub-block 130 can be any suitable phase detector sub-block that produces either a digital frequency that can be read back by microcontroller block 112 using a capture function, or an analog voltage that can be read back by microcontroller block 112 using an analog to digital converter.
- FIGURE 2G depicts a schematic that includes two such phase detector sub-blocks, namely an XOR phase detector (in the upper half of FIGURE 2G and including IC22 and IC23) and a Quadrature DEMUX phase detector (in the lower half of FIGURE 2G and including IC12 and IC13).
- FIGURE 2G also depicts a calibration load sub-block 126 that includes a switch (IC16) and a dummy load R7 and C6.
- Calibration load sub-block 126 is configured for the dynamic measurement of a phase offset for the known phase shift of zero degrees produced by resistor R7, thus providing a phase offset for use in calibration.
- C6 is configured to force a predetermined slight phase shift, e.g. to compensate for phase delays caused by parasitic capacities in the signal traces to the sample cell, or for phase delays in the electrical circuits (LPF and TIA).
- the Quadrature DEMUX phase detector circuit of FIGURE 2G includes two portions, one portion for a resistive part of the incoming AC signal and one portion for the reactive portion of the incoming AC signal. Use of such two portions enables the simultaneous measurement of both the resistive and reactive portion of the AC signal and a measurement range that covers 0 degrees to 360 degrees.
- the Quadrature DEMUX circuit of FIGURE 2G generates two separate output voltages. One of these output voltages represents the "in phase measurement” and is proportional to the "resistive" part of the AC signal, the other output voltage represents the “Quadrature Measurement” and is proportional to the "reactive part of the signal.
- Quadrature DEMUX phase detector circuit can also be employed to measure the impedance of a bodily fluid sample in the sample cell. It is hypothesized, without being bound, that the impedance could be employed along with the phase-shift, or independently thereof, to determine the hematocrit of the bodily sample.
- This amplitude can then be compared to an amplitude measured for the known resistor of calibration load block 126 to determine the impedance.
- the XOR phase detector portion has a measurement range of 0° to 180°, or alternatively a measurement range of -90° to +90°, depending whether the "Square wave input from ⁇ C" is in phase to the sine wave or is set to a 90° phase shift.
- the XOR phase detector produces an output frequency that is always double the input frequency, however the duty cycle varies. If both inputs are perfectly in phase, the output is LOW, if both inputs are 180° shifted the output is always HIGH.
- a voltage can be generated that is directly proportional to the phase shift between both inputs.
- phase detector sub-blocks employed in embodiments of the present disclosure can take any suitable form and include, for example, forms that employ rising edge capture techniques, dual edge capture techniques, XOR techniques and synchronous demodulation techniques.
- calibration load block 126 can be optionally included in the phase-shift-based hematocrit measurement block.
- Calibration load block 126 is configured to be essentially resistive in nature (for example a 33k-ohm load) and, therefore, induces no phase shift between excitation voltage and generated current.
- Calibration load block 126 is configured to be switched in across the circuit to give a "zero" calibration reading. Once calibrated, the hand-held test meter can measure the phase shift of a bodily fluid sample, subtract the "zero" reading to compute a corrected phase shift and subsequently compute the physical characteristic of the sample based on the corrected phase shift.
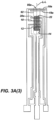
- FIGURE 3A(1) is an exemplary exploded perspective view of a test strip 100, which may include seven layers disposed on a substrate 5.
- the seven layers disposed on substrate 5 can be a first conductive layer 50 (which can also be referred to as electrode layer 50), an insulation layer 16, two overlapping reagent layers 22a and 22b, an adhesive layer 60 which includes adhesive portions 24, 26, and 28, a hydrophilic layer 70, and a top layer 80 which forms a cover 94 for the test strip 100.
- Test strip 100 may be manufactured in a series of steps where the conductive layer 50, insulation layer 16, reagent layers 22, and adhesive layer 60 are sequentially deposited on substrate 5 using, for example, a screen-printing process.
- Test strip 100 has a distal portion 3 and a proximal portion 4 as shown in FIGURE 3A(1) .
- Test strip 100 includes a sample-receiving chamber 92 through which a physiological fluid sample 95 may be drawn through or deposited ( Fig. 3A(2) ).
- the physiological fluid sample discussed herein may be blood.
- Sample-receiving chamber 92 can include an inlet at a proximal end and an outlet at the side edges of test strip 100, as illustrated in FIGURE 3A(1) .
- a fluid sample 95 can be applied to the inlet along axis L-L ( Fig. 3A(2) ) to fill a sample-receiving chamber 92 so that glucose can be measured.
- the side edges of a first adhesive pad 24 and a second adhesive pad 26 located adjacent to reagent layer 22 each define a wall of sample-receiving chamber 92, as illustrated in FIGURE 3A(1) .
- a bottom portion or "floor” of sample-receiving chamber 92 may include a portion of substrate 5, conductive layer 50, and insulation layer 16, as illustrated in FIGURE 3A(1) .
- a top portion or "roof' of sample-receiving chamber 92 may include distal hydrophilic portion 32, as illustrated in FIGURE 3A(1) .
- substrate 5 can be used as a foundation for helping support subsequently applied layers.
- Substrate 5 can be in the form of a polyester sheet such as a polyethylene tetraphthalate (PET) material (Hostaphan PET supplied by Mitsubishi).
- PET polyethylene tetraphthalate
- Substrate 5 can be in a roll format, nominally 350 microns thick by 370 millimeters wide and approximately 60 meters in length.
- First conductive layer 50 can be made from a carbon ink that is screen-printed onto substrate 5.
- carbon ink is loaded onto a screen and then transferred through the screen using a squeegee.
- the printed carbon ink can be dried using hot air at about 140°C.
- the carbon ink can include VAGH resin, carbon black, graphite (KS15), and one or more solvents for the resin, carbon and graphite mixture. More particularly, the carbon ink may incorporate a ratio of carbon black: VAGH resin of about 2.90:1 and a ratio of graphite: carbon black of about 2.62:1 in the carbon ink.
- first conductive layer 50 may include a reference electrode 10, a first working electrode 12, a second working electrode 14, third and fourth physical characteristic sensing electrodes 19a and 19b, a first contact pad 13, a second contact pad 15, a reference contact pad 11, a first working electrode track 8, a second working electrode track 9, a reference electrode track 7, and a strip detection bar 17.
- the physical characteristic sensing electrodes 19a and 20a are provided with respective electrode tracks 19b and 20b.
- the conductive layer may be formed from carbon ink.
- First contact pad 13, second contact pad 15, and reference contact pad 11 may be adapted to electrically connect to a test meter.
- First working electrode track 8 provides an electrically continuous pathway from first working electrode 12 to first contact pad 13.
- second working electrode track 9 provides an electrically continuous pathway from second working electrode 14 to second contact pad 15.
- reference electrode track 7 provides an electrically continuous pathway from reference electrode 10 to reference contact pad 11.
- Strip detection bar 17 is electrically connected to reference contact pad 11.
- Third and fourth electrode tracks 19b and 20b connect to the respective electrodes 19a and 20a.
- a test meter can detect that test strip 100 has been properly inserted by measuring a continuity between reference contact pad 11 and strip detection bar 17, as illustrated in FIGURE 3A(1) .
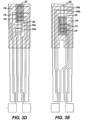
- test strip 100 Variations of the test strip 100 ( FIGURE 3A(1) , 3A(2) , 3A(3) , or 3A(4) ) are shown in FIGURES 3B-3F .
- these test strips include an enzymatic reagent layer disposed on the working electrode, a patterned spacer layer disposed over the first patterned conductive layer and configured to define a sample chamber within the biosensor, and a second patterned conductive layer disposed above the first patterned conductive layer.
- the second patterned conductive layer includes a first phase-shift measurement electrode and a second phase-shift measurement electrode.
- the first and second phase-shift measurement electrodes are disposed in the sample chamber and are configured to measure, along with the hand-held test meter, a phase shift of an electrical signal forced through a bodily fluid sample introduced into the sample chamber during use of the biosensor.
- phase-shift measurement electrodes are also referred to herein as bodily fluid phase-shift measurement electrodes.
- Biosensors of various embodiments described herein are believed to be advantageous in that, for example, the first and second phase-shift measurement electrodes are disposed above the working and reference electrodes, thus enabling a sample chamber of advantageously low volume.
- first and second phase-shift measurement electrodes are disposed in a co-planar relationship with the working and reference electrodes thus requiring a larger bodily fluid sample volume and sample chamber to enable the bodily fluid sample to cover the first and second phase-shift measurement electrodes as well as the working and reference electrodes.
- an additional electrode 10a is provided as an extension of any of the plurality of electrodes 19a, 20a, 14, 12, and 10.
- the built-in shielding or grounding electrode 10a is used to reduce or eliminate any capacitance coupling between the finger or body of the user and the characteristic measurement electrodes 19a and 20a.
- the grounding electrode 10a allows for any capacitance to be directed away from the sensing electrodes 19a and 20a.
- the grounding electrode 10a can be connected any one of the other five electrodes or to its own separate contact pad (and track) for connection to ground on the meter instead of one or more of contact pads 15, 17, 13 via respective tracks 7, 8, and 9.
- the grounding electrode 10a is connected to one of the three electrodes that has reagent 22 disposed thereon.
- the grounding electrode 10a is connected to electrode 10. Being the grounding electrode, it is advantageous to connect the grounding electrode to the reference electrode (10) so not to contribute any additional current to the working electrode measurements which may come from background interfering compounds in the sample. Further by connecting the shield or grounding electrode 10a to electrode 10 this is believed to effectively increase the size of the counter electrode 10 which can become limiting especially at high signals.
- the reagent are arranged so that they are not in contact with the measurement electrodes 19a and 20a.
- the reagent 22 is arranged so that the reagent 22 contacts at least one of the sensing electrodes 19a and 20a.
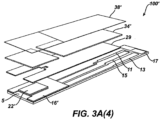
- test strip 100 shown here in FIGURE 3A(4) , the top layer 38, hydrophilic film layer 34 and spacer 29 have been combined together to form an integrated assembly for mounting to the substrate 5 with reagent layer 22' disposed proximate insulation layer 16'.
- the analyte measurement electrodes 10, 12, and 14 are disposed in generally the same configuration as in Fig. 3A(1) , 3A(2) , or 3A(3) .
- the electrodes 19a and 20a to sense physical characteristic (hematocrit) level are disposed in a spaced apart configuration in which one electrode 19a is proximate an entrance 92a to the test chamber 92 and another electrode 20a is at the opposite end of the test chamber 92.
- Electrodes 10, 12, and 14 are disposed to be in contact with a reagent layer 22.
- the physical characteristic (hematocrit) sensing electrodes 19a and 20a are disposed adjacent each other and may be placed at the opposite end 92b of the entrance 92a to the test chamber 92 ( Figs. 3C and 3D ) or adjacent the entrance 92a ( Figs. 3E and 3F ).
- the physical characteristic sensing electrodes are spaced apart from the reagent layer 22 so that these physical characteristic sensing electrodes are not impacted by the electrochemical reaction of the reagent in the presence of a fluid sample (e.g., blood or interstitial fluid) containing glucose.
- a fluid sample e.g., blood or interstitial fluid
- the biosensor there are two measurements that are made to a fluid sample deposited on the biosensor.
- One measurement is that of the concentration of the analyte (glucose) in the fluid sample while the other is that of physical characteristic (hematocrit) in the same sample.
- the measurement of the physical characteristic (hematocrit) is used to modify or correct the glucose measurement so as to remove or reduce the effect of red blood cells on the glucose measurements.
- Both measurements can be performed in sequence, simultaneously or overlapping in duration.
- the glucose measurement can be performed first then the physical characteristic (hematocrit); the physical characteristic (hematocrit) measurement first then the glucose measurement; both measurements at the same time; or a duration of one measurement may overlap a duration of the other measurement.
- hematocrit physical characteristic
- hematocrit physical characteristic
- FIGURE 4A is an exemplary chart of a test signal applied to test strip 100 and its variations shown here in FIGUREs 3A -3T.
- test meter 200 Before a fluid sample is applied to test strip 100 (or its variants), test meter 200 is in a fluid detection mode in which a first test signal of about 400 millivolts is applied between second working electrode and reference electrode.
- a second test signal of about 400 millivolts is preferably applied simultaneously between first working electrode (e.g., electrode 12 of strip 100) and reference electrode (e.g., electrode 10 of strip 100).
- the second test signal may also be applied contemporaneously such that a time interval of the application of the first test signal overlaps with a time interval in the application of the second test voltage.
- test meter 200 may be in a fluid detection mode during fluid detection time interval T FD prior to the detection of physiological fluid at starting time at zero.
- test meter 200 determines when a fluid is applied to test strip 100 (or its variants) such that the fluid wets either the first working electrode 12 or second working electrode 14 (or both working electrodes) with respect to reference electrode 10. Once test meter 200 recognizes that the physiological fluid has been applied because of, for example, a sufficient increase in the measured test current at either or both of first working electrode 12 and second working electrode 14, test meter 200 assigns a zero second marker at zero time "0" and starts the test time interval T S .
- Test meter 200 may sample the current transient output at a suitable sampling rate, such as, for example, every 1 milliseconds to every 100 milliseconds. Upon the completion of the test time interval T S , the test signal is removed. For simplicity, FIGURE 4A only shows the first test signal applied to test strip 100 (or its variants).
- analyte (glucose) concentration is determined from the known signal transients (e.g., the measured electrical signal response in nanoamperes as a function of time) that are measured when the test voltages of FIGURE 4A are applied to the test strip 100 (or its variants).
- known signal transients e.g., the measured electrical signal response in nanoamperes as a function of time
- the first and second test voltages applied to test strip 100 are generally from about +100 millivolts to about +600 millivolts.
- the test signal is about +400 millivolts.
- Other mediator and electrode material combinations will require different test voltages, as is known to those skilled in the art.
- the duration of the test voltages is generally from about 1 to about 5 seconds after a reaction period and is typically about 3 seconds after a reaction period.
- test sequence time T S is measured relative to time t 0 .
- output signals are generated, shown here in FIGURE 4B with the current transient 702 for the first working electrode 12 being generated starting at zero time and likewise the current transient 404 for the second working electrode 14 is also generated with respect to the zero time.
- the signal transients 702 and 404 have been placed on the same referential zero point for purposes of explaining the process, in physical term, there is a slight time differential between the two signals due to fluid flow in the chamber towards each of the working electrodes 12 and 14 along axis L-L.
- the current transients are sampled and configured in the microcontroller to have the same start time.
- the current transients build up to a peak proximate peak time Tp at which time, the current slowly drops off until approximately one of 2.5 seconds or 5 seconds after zero time.
- the output signal for each of the working electrodes 12 and 14 may be measured and added together. Alternatively, the signal from only one of the working electrodes 12 and 14 can be doubled.
- the system drives a signal to measure or sample the output signals I E from at least one the working electrodes (12 and 14) at any one of a plurality of time points or positions T 1 , T 2 , T 3 , .... T N .
- the time position can be any time point or interval in the test sequence T S .
- the time position at which the output signal is measured can be a single time point T 1.5 at 1.5 seconds or an interval 708 (e.g., interval-10 milliseconds or more depending on the sampling rate of the system) overlapping the time point T 2.8 proximate 2.8 seconds.
- the analyte (glucose) concentration can be calculated.
- Output transient 702 and 704 can be sampled to derive signals I E (by summation of each of the current I WE1 and I WE2 or doubling of one of I WE1 or I WE2 ) at various time positions during the test sequence.
- the analyte (glucose) concentration can be calculated.
- Intercept and “Slope” are the values obtained by measuring calibration data from a batch of biosensors. Typically around 1500 biosensors are selected at random from the lot or batch.
- Physiological fluid e.g., blood
- Physiological fluid e.g., blood
- analyte levels typically six different glucose concentrations.
- blood from 12 different donors is spiked to each of the six levels.
- YSI Yellow Springs Instrument
- the applicants have also provided methods and systems in which the batch slope is derived during the determination of an analyte concentration.
- the "batch slope”, or “Slope”, may therefore be defined as the measured or derived gradient of the line of best fit for a graph of measured glucose concentration plotted against actual glucose concentration (or measured current versus YSI current).
- the "batch intercept”, or “Intercept” may therefore be defined as the point at which the line of best fit for a graph of measured glucose concentration plotted against actual glucose concentration (or measured current versus YSI current) meets the y axis.
- this system includes a biosensor that has a substrate and a plurality of electrodes connected to respective electrode connectors.
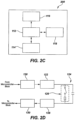
- the system further includes an analyte meter 200 that has a housing, a test strip port connector configured to connect to the respective electrode connectors of the test strip, and a microcontroller 300, shown here in FIGURE 2B .
- the microcontroller 300 is in electrical communication with the test strip port connector 220 to apply electrical signals or sense electrical signals from the plurality of electrodes.
- a strip port connector 220 is connected to the analogue interface 306 by five lines including an impedance sensing line EIC to receive signals from physical characteristic sensing electrode(s), alternating signal line AC driving signals to the physical characteristic sensing electrode(s), reference line for a reference electrode, and signal sensing lines from respective working electrode 1 and working electrode 2.
- a strip detection line 221 can also be provided for the connector 220 to indicate insertion of a test strip.
- the analog interface 306 provides four inputs to the processor 300: (1) real impedance Z'; (2) imaginary impedance Z"; (3) signal sampled or measured from working electrode 1 of the biosensor or I we1 ; (4) signal sampled or measured from working electrode 2 of the biosensor or I we2 .
- ) from line Z' and Z" of the interface 306 can be determined where M Z ′ 2 + Z " 2
- the microprocessor is configured to: (a) apply a first signal to the plurality of electrodes so that a batch slope defined by a physical characteristic of a fluid sample is derived and (b) apply a second signal to the plurality of electrodes so that an analyte concentration is determined based on the derived batch slope.
- the plurality of electrodes of the test strip or biosensor includes at least two electrodes to measure the physical characteristic and at least two other electrodes to measure the analyte concentration.
- the at least two electrodes and the at least two other electrodes are disposed in the same chamber provided on the substrate.
- the at least two electrodes and the at least two other electrodes are disposed in respective two different chambers provided on the substrate.
- all of the electrodes are disposed on the same plane defined by the substrate.
- a reagent is disposed proximate the at least two other electrodes and no reagent is disposed on the at least two electrodes.
- One feature of note in this system is the ability to provide for an accurate analyte measurement within about 10 seconds of deposition of a fluid sample (which may be a physiological sample) onto the biosensor as part of the test sequence.
- an average of the signal from each working electrode can be used as the total measured current I E for Equations 3.3, 6, and 5-7 described herein, and of course, with appropriate modification to the operational coefficients (as known to those skilled in the art) to account for a lower total measured current I E than as compared to an embodiment where the measured signals are added together.
- the average of the measured signals can be multiplied by two and used as I E in Equations 3.3, 6, and 5-7 without the necessity of deriving the operational coefficients as in the prior example.
- analyte (glucose) concentration here is not corrected for any physical characteristic (hematocrit value) and that certain offsets may be provided to the signal values I we1 and I we2 to account for errors or delay time in the electrical circuit of the meter 200. Temperature compensation can also be utilized to ensure that the results are calibrated to a referential temperature such as for example room temperature of about 20 degrees Celsius.
- an analyte (glucose) concentration G 0
- G 0 an analyte concentration
- a description of applicant's technique to determine the physical characteristic (hematocrit) of the fluid sample is provided in relation to FIGURE 5 .
- the system 200 applies a first oscillating input signal 800 at a first frequency (e.g., of about 25kilo-Hertz) to a pair of sensing electrodes.
- the system is also set up to measure or detect a first oscillating output signal 802 from the third and fourth electrodes, which in particular involve measuring a first time differential ⁇ t 1 between the first input and output oscillating signals.
- hematocrit Another technique to determine physical characteristic (hematocrit) can be by two independent measurements of physical characteristic (hematocrit). This can be obtained by determining: (a) the impedance of the fluid sample at a first frequency and (b) the phase angle of the fluid sample at a second frequency substantially higher than the first frequency. In this technique, the fluid sample is modeled as a circuit having unknown reactance and unknown resistance.
- ”) for measurement (a) can be determined from the applied voltage, the voltage across a known resistor (e.g., the intrinsic strip resistance), and the voltage across the unknown impedance Vz; and similarly, for measurement (b) the phase angle can be measured from a time difference between the input and output signals by those skilled in the art. Details of this technique is shown and described in pending provisional patent application S.N. 61/530,808 filed September 2, 2011 (Attorney Docket No. DDI5215PSP). Other suitable techniques for determining the physical characteristic (hematocrit) of the fluid sample can also be utilized such as, for example, US Patent No. 7,972,861 , US Patent Application Publication Nos. 2010/0206749 , or US2009/0223834 .
- hematocrit a technique to determine the physical characteristic (hematocrit) can be obtained by knowing the phase difference (e.g., phase angle) and magnitude of the impedance of the sample.
- phase difference e.g., phase angle
- magnitude of the impedance of the sample e.g., magnitude of the phase difference
- IC M 2 * y 1 + M * y 2 + y 3 + P 2 * y 4 + P * y 5
- the parametric terms y 1 and y 2 relating to the magnitude of impedance M may be ⁇ 200% of the exemplary values given herein such that each of the parametric terms may include zero or even a negative value.
- the parametric terms y 4 and y 5 relating to the phase angle P may be ⁇ 200% of the exemplary values given herein such that each of the parametric terms may include zero or even a negative value.
- a magnitude of H or HCT is generally equal to the magnitude of IC. In one exemplary implementation, H or HCT is equal to IC as H or HCT is used herein this application.
- a technique to achieve an analyte measurement with output transient error trapping can be understood with reference to Figure 6 .
- This technique involves depositing a fluid sample (which may be a physiological sample or a control solution sample) on a biosensor at step 604 (e.g., in the form of a test strip as show in Figures 3A(1) , 3A(2) , 3A(3) through 3F ) that has been inserted into a meter (step 602).
- a signal is applied to the strip 100 (or its variants) and when the sample is deposited onto the test chamber, the applied signal (in conjunction with the appropriate reagent) physically transforms the analyte (glucose) in the sample into a different physical form (e.g., gluconic acid) due to the enzymatic reaction of the analyte with the reagent in the test chamber.
- a signal is applied to the strip 100 (or its variants) and when the sample is deposited onto the test chamber, the applied signal (in conjunction with the appropriate reagent) physically transforms the analyte (glucose) in the sample into a different physical form (e.g., gluconic acid) due to the enzymatic reaction of the analyte with the reagent in the test chamber.
- a different physical form e.g., gluconic acid
- a specified sampling time Tss is defined (at step 612) at which the signal output (due to electrons transfer shown in Equations 1 and 2) from the sample during the test sequence is measured (at step 614) and used for calculating the analyte concentration in step 616.
- the determination of the appropriate point (or time interval) Tss during the test sequence T S as a function of the measured or estimated physical characteristic(s) is determined by the use of a look-up table programmed into the microprocessor of the system.
- a look-up table may be provided that allows for the system to select the appropriate sampling time Tss for the analyte with measured or known physical characteristic of the sample.
- an appropriate sampling time point is based on an early estimation of the analyte and the measured or known physical characteristic to arrive at the appropriate sampling time that gives the lowest error or bias as compared to referential values.
- a look up table is provided in which the defined sampling time point is correlated to (a) the estimated analyte concentration and (b) the physical characteristic of the sample.
- Table 1 may be programmed into the meter to provide a matrix in which qualitative categories (low, medium, and high glucose) of the estimated analyte form the main column and the qualitative categories (low, medium, and high) of the measured or estimated physical characteristic form the header row.
- Table 1 Estimated Analyte t/ Hct (in milliseconds) Specified sampling time Tss for Lo Hct (from start of test sequence, in seconds) Specified sampling time Tss for Mid Hct (from start of test sequence, in seconds) Specified sampling time Tss for High Hct (from start of test sequence, in seconds) Lo-Glucose 40 5.5 5 4.5 Mid-Glucose 90 6.1 5 3.9 Hi-Glucose 110 6.3 5 3.6
- the time Tss (i.e., a specified sampling time) at which the system should be sampling or measuring the output signal of the biosensor is based on both the qualitative category of the estimated analyte and measured or estimated physical characteristic and is predetermined based on regression analysis of a large sample size of actual physiological fluid samples.
- the appropriate sampling time is measured from the start of the test sequence but any appropriate datum may be utilized in order to determine when to sample the output signal.
- the system can be programmed to sample the output signal at an appropriate time sampling interval during the entire test sequence such as for example, one sampling every 100 milliseconds or even as little as about 1 milliseconds. By sampling the entire signal output transient during the test sequence, the system can perform all of the needed calculations near the end of the test sequence rather than attempting to synchronize the sampling time with the set time point, which may introduce timing errors due to system delay.
- an "Estimated Analyte” can be obtained by sampling the signal at a convenient time point, typically at five seconds during a typical 10 seconds test sequence. The measurement sampled at this five second time point allows for an accurate estimate of the analyte (in this case blood glucose).
- the system then refers to a look-up table (e.g., Table 1) to determine when to measure the signal output from the test chamber at a specified sampling time Tss based on two criteria: (a) estimated analyte and (b) qualitative value of the physical characteristic of the sample. For criteria (b), the qualitative value of the physical characteristic is broken down into three sub-categories of Low Hct, Mid Hct and High Hct.
- the test time for the system to measure the signal output of test chamber would be about 3.6 seconds.
- the specified sampling time Tss for the system to measure the signal output of test chamber would be about 5.5 seconds.
- the signal output I T of the test chamber is measured at the specified sampling time Tss(which is governed by the measured or estimated physical characteristic)
- the signal I T is thereafter used in the calculation of the analyte concentration (in this case glucose) with Equation 5 below.
- G 0 I T ⁇ Intercept Slope
- the step of applying the first signal and the driving of the second signal is sequential in that the order may be the first signal then the second signal or both signals overlapping in sequence; alternatively, the second signal first then the first signal or both signals overlapping in sequence. Alternatively, the applying of the first signal and the driving of the second signal may take place simultaneously.
- the step of applying of the first signal involves directing an alternating signal provided by an appropriate power source (e.g., the meter 200) to the sample so that a physical characteristic of the sample is determined from an output of the alternating signal from the sample.
- the physical characteristic being detected is hematocrit.
- the directing step may include driving first and second alternating signal at different respective frequencies in which a first frequency is lower than the second frequency.
- the first frequency is at least one order of magnitude lower than the second frequency.
- the first frequency may be any frequency in the range of about 10 kHz to about 100 kHz and the second frequency may be from about 250 kHz to about 1 MHz or more.
- alternating signal or “oscillating signal” can have some portions of the signal alternating in polarity or all alternating current signal or an alternating current with a direct current offset or even a multi-directional signal combined with a direct-current signal.
- a measured or estimated physical characteristic is used in Table 2 along with an estimated analyte concentration to derive a time Tss at which the sample is to be measured. For example, if the measured charactertistic is about 30% and the estimated glucose (e.g., by sampling at about 2.5 to 3 seconds) is about 350, the time at which the microcontroller should sample the fluid is about 7 seconds. In another example, where the estimated glucose is about 300 mg/dL and the measured or estimated physical characteristic is 60%, the specified sampling time would be about 3.1 seconds.
- the method may include sampling as many time points as required, such as, for example, sampling the signal output continuously (e.g., at specified sampling time Tss such as, every 1 milliseconds to 100 milliseconds) from the start of the test sequence until at least about 10 seconds after the start and the results stored for processing near the end of the test sequence.
- Tss such as, every 1 milliseconds to 100 milliseconds
- the sampled signal output at the specified sampling time Tss (which may be different from the predetermined sampling time point) is the value used to calculate the analyte concentration.
- the measurement of a signal output for the value that is somewhat proportional to analyte (glucose) concentration is performed prior to the estimation of the hematocrit.
- the hematocrit level can be estimated prior to the measurement of the preliminary glucose concentration.
- the estimated glucose measurement G E is obtained by Equation 3.3 with I E sampled at about one of 2.5 seconds or 5 seconds, as in FIGURE 7
- the physical characteristic e.g., Hct
- the glucose measurement G is obtained by using the measured signal output I D at the designated sampling time point(s) (e.g., the measured signal output I D being sampled at 3.5 seconds or 6.5 seconds) for the signal transient 1000.
- the system is configured to detect whether the output transient from each of the working electrodes is near an optimal condition for an accurate analyte determination.
- the optimal state for the output signals to be measured or sampled from the working electrodes should be at a point as close as possible to a steady condition of the output signals. Over the contemplated test sequence of less than 10 seconds, steady-state of the output signal is never reached but an important pre-condition is that the output transient signal is trending towards steady state.
- step 616 (or step 618) would return a true and the process would move immediately to step 620 to annunciate an error and terminate the analyte determination process.
- the offset time can be any value between 100 milliseconds to 500 milliseconds and most preferably about 300 milliseconds.
- applicant has devised the logic to set an error flag as active ( ⁇ 1 state) or to annunciate an error whenever the magnitude of the output signal for each working electrode (of working electrodes 1 and 2) at sampling time Tss- ⁇ t is equal to or greater than the magnitude of the working electrode at specified sampling time Tss (i.e., where I we1(Tss- ⁇ t) ⁇ I we1(Tss) or I we2(Tss- ⁇ t) ⁇ I we2(Tss) ).
- no error flag is set ( ⁇ 0) whenever the magnitude of the output signal for each working electrode (of working electrodes 1 and 2) at sampling time Tss- ⁇ t is less than the magnitude of the measured or sampled output signal of the working electrode at Tss (i.e., where I we1(Tss- ⁇ t) ⁇ I we1(Tss) or I we2(Tss- ⁇ t) ⁇ I we2(Tss) ).
- the predetermined offset time interval ⁇ t can be any value from about 100 millisecond to 600 milliseconds or from about -100 milliseconds to about -600 milliseconds.
- Applicant notes that the technique is designed so that if such output transient error is detected at step 616 or step 618, the system will quickly annunciate an error (from step 616 directly to step 620) and return to the main routine or terminate the assay process.
- step 616 or step 6128 which is used to evaluate the output transient signals from the working electrodes. If step 616 (or step 618) returns a true then the process moves to step 617 (instead of step 620) for the system to set an error flag. After the error flag has been set at 617 (or 619), the system continues ahead to step 622 to calculate the analyte concentration using the measured output signals at Tss.
- step 623 the system checks to see if one or more error flags (besides the transient output error flag from step 617 or 619) have been set. If true, the system moves to step 620 to annunciate the error otherwise the analyte concentration is annunciated.
- this alternative technique does not provide an immediate feedback as in the other technique, it allows for the system to assess the number of error flag(s) being set before actually declaring that an error has occurred.
- the detection of the physical characteristic does not have to be done by alternating signals but can be done with other techniques.
- microcontroller or an equivalent microprocessor and associated components that allow the microcontroller to function for its intended purpose in the intended environment such as, for example, the processor 300 in FIGURE 2B ) can be utilized with computer codes or software instructions to carry out the methods and techniques described herein.
- the exemplary microcontroller 300 (along with suitable components for functional operation of the processor 300) in FIGURE 2B is embedded with firmware or loaded with computer software representative of the logic diagrams in FIGURE 6 and the microcontroller 300, along with associated connector 220 and interface 306 and equivalents thereof, are the means for: (a) determining a specified sampling time based on a sensed or estimated physical characteristic, the specified sampling time being at least one time point or interval referenced from a start of a test sequence upon deposition of a sample on the test strip and (b) determining an analyte concentration based on the specified sampling time.
- the means for determining may include means for applying a first signal to the plurality of electrodes so that a batch slope defined by a physical characteristic of a fluid sample is derived and for applying a second signal to the plurality of electrodes so that an analyte concentration is determined based on the derived batch slope and the specified sampling time.
- the means for determining may include means for estimating an analyte concentration based on a predetermined sampling time point from the start of the test sequence and for selecting a specified sampling time from a matrix of estimated analyte concentration and sensed or estimated physical characteristic.
- the means for determining may include means for selecting a batch slope based on the sensed or estimated physical characteristic and for ascertaining the specified sampling time from the batch slope.
Landscapes
- Health & Medical Sciences (AREA)
- Life Sciences & Earth Sciences (AREA)
- Chemical & Material Sciences (AREA)
- Hematology (AREA)
- Physics & Mathematics (AREA)
- Immunology (AREA)
- Molecular Biology (AREA)
- Pathology (AREA)
- Analytical Chemistry (AREA)
- Biochemistry (AREA)
- General Health & Medical Sciences (AREA)
- General Physics & Mathematics (AREA)
- Electrochemistry (AREA)
- Chemical Kinetics & Catalysis (AREA)
- Investigating Or Analysing Biological Materials (AREA)
- Engineering & Computer Science (AREA)
- Biomedical Technology (AREA)
- Investigating Or Analyzing Materials By The Use Of Electric Means (AREA)
- Apparatus Associated With Microorganisms And Enzymes (AREA)
- Biophysics (AREA)
- Urology & Nephrology (AREA)
- Food Science & Technology (AREA)
- Medicinal Chemistry (AREA)
- Measuring Or Testing Involving Enzymes Or Micro-Organisms (AREA)
Description
- This patent application claims the benefits of priority under 35 USC§§119, 120, 365, 371 and the Paris Convention from prior filed
U.S. patent application S.N. 13/929,782 with the same title as this application (Attorney Docket No. DDI5271USNP), which was filed on June 28, 2013 U.S. patent application S.N. 61/840,360 with the same title as this application (Attorney Docket No. DDI5271USPSP), which was filed on June 28, 2013 - Electrochemical glucose test strips, such as those used in the OneTouch® Ultra® whole blood testing kit, which is available from LifeScan, Inc., are designed to measure the concentration of glucose in a physiological fluid sample from patients with diabetes. The measurement of glucose can be based on the selective oxidation of glucose by the enzyme glucose oxidase (GO). The reactions that can occur in a glucose test strip are summarized below in
Equations 

- As illustrated in
Equation 1, glucose is oxidized to gluconic acid by the oxidized form of glucose oxidase (GO(ox)). It should be noted that GO(ox) may also be referred to as an "oxidized enzyme." During the reaction inEquation 1, the oxidized enzyme GO(ox) is converted to its reduced state, which is denoted as GO(red) (i.e., "reduced enzyme"). Next, the reduced enzyme GO(red) is re-oxidized back to GO(ox) by "reduced enzyme"). Next, the reduced enzyme GO(red) is re-oxidized back to GO(ox) by reaction with Fe(CN)6 3- (referred to as either the oxidized mediator or ferricyanide) as illustrated inEquation 2. During the re-generation of GO(red) back to its oxidized state GO(ox), Fe(CN)6 3- is reduced to Fe(CN)6 4- (referred to as either reduced mediator or ferrocyanide). - When the reactions set forth above are conducted with a test signal applied between two electrodes, a test current can be created by the electrochemical re-oxidation of the reduced mediator at the electrode surface. Thus, since, in an ideal environment, the amount of ferrocyanide created during the chemical reaction described above is directly proportional to the amount of glucose in the sample positioned between the electrodes, the test current generated would be proportional to the glucose content of the sample. A mediator, such as ferricyanide, is a compound that accepts electrons from an enzyme such as glucose oxidase and then donates the electrons to an electrode. As the concentration of glucose in the sample increases, the amount of reduced mediator formed also increases; hence, there is a direct relationship between the test current, resulting from the re-oxidation of reduced mediator, and glucose concentration. In particular, the transfer of electrons across the electrical interface results in the flow of a test current (2 moles of electrons for every mole of glucose that is oxidized). The test current resulting from the introduction of glucose can, therefore, be referred to as a glucose signal.
- Electrochemical biosensors may be adversely affected by the presence of certain blood components that may undesirably affect the measurement and lead to inaccuracies in the detected signal. This inaccuracy may result in an inaccurate glucose reading, leaving the patient unaware of a potentially dangerous blood sugar level, for example. As one example, the blood hematocrit level (i.e. the percentage of the amount of blood that is occupied by red blood cells) can erroneously affect a resulting analyte concentration measurement.
- Variations in a volume of red blood cells within blood can cause variations in glucose readings measured with disposable electrochemical test strips. Typically, a negative bias (i.e., lower calculated analyte concentration) is observed at high hematocrit, while a positive bias (i.e., higher calculated analyte concentration as compared to referential analyte concentration) is observed at low hematocrit. At high hematocrit, for example, the red blood cells may impede the reaction of enzymes and electrochemical mediators, reduce the rate of chemistry dissolution since there is less plasma volume to solvate the chemical reactants, and slow diffusion of the mediator. These factors can result in a lower than expected glucose reading as less signal is produced during the electrochemical process. Conversely, at low hematocrit, fewer red blood cells may affect the electrochemical reaction than expected, and a higher measured signal can result. In addition, the physiological fluid sample resistance is also hematocrit dependent, which can affect voltage and/or current measurements.
- Several strategies have been used to reduce or avoid hematocrit based variations on blood glucose. For example, test strips have been designed to incorporate meshes to remove red blood cells from the samples, or have included various compounds or formulations designed to increase the viscosity of red blood cells and attenuate the effect of low hematocrit on concentration determinations. Other test strips have included lysis agents and systems configured to determine hemoglobin concentration in an attempt to correct hematocrit. Further, biosensors have been configured to measure hematocrit by measuring an electrical response of the fluid sample via alternating current signals or change in optical variations after irradiating the physiological fluid sample with light, or measuring hematocrit based on a function of sample chamber fill time. These sensors have certain disadvantages. A common technique of the strategies involving detection of hematocrit is to use the measured hematocrit value to correct or change the measured analyte concentration, which technique is generally shown and described in the following respective
US Patent Application Publication Nos. 2010/0283488 ;2010/0206749 ;2009/0236237 ;2010/0276303 ;2010/0206749 ;2009/0223834 ;2008/0083618 ;2004/0079652 ;2010/0283488 ;2010/0206749 ;2009/0194432 ; orUS Patent Nos., 7,972,861 and7,258,769 . -
WO2013030375 A1 describes hematocrit corrected glucose measurements that allow for determination of hematocrit by a time differential between the input and output signals such that a glucose measurement for a blood sample can be corrected by the measured hematocrit of the blood sample.WO2012164271 A1 describes measurement with a test strip having two working electrodes, using the current transient for each working electrode measured at a predetermined durational offset from a peak of the current transient. - The invention is defined by the appended independent claims. Certain embodiments are defined in the appended dependent claims.
- The accompanying drawings, which are incorporated herein and constitute part of this specification, illustrate presently preferred embodiments of the invention, and, together with the general description given above and the detailed description given below, serve to explain features of the invention (wherein like numerals represent like elements), in which:
-
FIGURE 1A illustrates an analyte measurement system including a meter and a biosensor. -
Figure 1B illustrates yet another analyte measurement system including a meter and a biosensor. -
FIGURE 2A illustrates in simplified schematic form the components of themeter 200. -
FIGURE 2B illustrates in simplified schematic form a preferred implementation of a variation ofmeter 200. -
FIGURE 2C is a simplified block diagram of various blocks of the hand-held test meter ofFigures 1A and1B ; -
FIGURE 2D is a simplified block diagram of a physical characteristic measurement block as can be employed in embodiments according to the present disclosure; -
FIGURE 2E is a simplified annotated schematic diagram of a dual low pass filter sub-block as can be employed in embodiments of the present disclosure; -
FIGURE 2F is a simplified annotated schematic diagram of a transimpedance amplifier (TIA) sub-block as can be employed in embodiments of the present disclosure; -
FIGURE 2G is a simplified annotated schematic block diagram depicting a dual low pass filter sub-block, a calibration load sub-block, an biosensor sample cell interface sub-block, a transimpedance amplifier sub-block, an XOR phase shift measurement sub-block and a Quadratur DEMUX phase-shift measurement sub-block as can be employed in a physical characteristic measurement block of embodiments of the present disclosure -
FIGURE 3A(1) illustrates thetest strip 100 of the system ofFIGURE 1 in which there are two physical characteristic sensing electrodes upstream of the measurement electrodes. -
FIGURE 3A(2) illustrates a variation of the test strip ofFIGURE 3A(1) in which a shielding or grounding electrode is provided for proximate the entrance of the test chamber; -
FIGURE 3A(3) illustrates a variation of the test strip ofFIGURE 3A(2) in which a reagent area has been extended upstream to cover at least one of the physical characteristic sensing electrodes; -
FIGURE 3A(4) illustrates a variation oftest strip 100 ofFIGUREs 3A(1) ,3A(2) and3A(3) in which certain components of the test strip have been integrated together into a single unit; -
FIGURE 3B illustrates a variation of the test strip ofFIGURE 3A(1) ,3A(2) , or3A(3) in which one physical characteristic sensing electrode is disposed proximate the entrance and the other physical characteristic sensing electrode is at the terminal end of the test cell with the measurement electrodes disposed between the pair of physical characteristic sensing electrodes. -
FIGURES 3C and3D illustrate variations ofFIGURE 3A(1) ,3A(2) , or3A(3) in which the physical characteristic sensing electrodes are disposed next to each other at the terminal end of the test chamber with the measurement electrodes upstream of the physical characteristic sensing electrodes. -
FIGURES 3E and3F illustrates a physical characteristic sensing electrodes arrangement similar to that ofFIGURE 3A(1) ,3A(2) , or3A(3) in which the pair of physical characteristic sensing electrodes are proximate the entrance of the test chamber. -
FIGURE 4A illustrates a graph of time over applied potential to the biosensor ofFIGUREs 3A(1) ,3A(2) ,3A(3) and3B-3F . -
FIGURE 4B illustrates a graph of time over output current from the biosensor ofFIGUREs 3A(1) ,3A(2) ,3A(3) and3B-3F . -
FIGURE 5 illustrates an exemplary waveform applied to the test chamber and a waveform as measured from the test chamber to show a time delay between the waveforms. -
FIGURE 6 illustrates a logic diagram of an exemplary method to achieve a more accurate analyte determination with error detection for insufficient sample fill of the biosensor. -
FIGURE 7 illustrates a signal output transient of the biosensor and the range of time point utilized for determination of the analyte, as well as the estimation of the analyte concentration. -
FIGURE 8 illustrates data from test measurements conducted with the exemplary technique herein such that the data show the bias of less than about ±10% for the hematocrit range of about 30% to about 55%. -
Figure 9 illustrates a slope of the output signal transient where the slope is increasing relative to time and therefore is unsuitable for an analyte measurement. -
Figure 10 illustrates a slope of the output signal transient between two sampled time points such that the slope is decreasing thereby indicating that the current transient is heading towards steady-state which would render the sampled signal suitable for an analyte measurement. - The following detailed description should be read with reference to the drawings, in which like elements in different drawings are identically numbered. The drawings, which are not necessarily to scale, depict selected embodiments and are not intended to limit the scope of the invention. The detailed description illustrates by way of example, not by way of limitation, the principles of the invention. This description will clearly enable one skilled in the art to make and use the invention, and describes several embodiments, adaptations, variations, alternatives and uses of the invention, including what is presently believed to be the best mode of carrying out the invention.
- As used herein, the terms "about" or "approximately" for any numerical values or ranges indicate a suitable dimensional tolerance that allows the part or collection of components to function for its intended purpose as described herein. More specifically, "about" or "approximately" may refer to the range of values ± 10% of the recited value, e.g. "about 90%" may refer to the range of values from 81% to 99%. In addition, as used herein, the terms "patient," "host," "user," and "subject" refer to any human or animal subject and are not intended to limit the systems or methods to human use, although use of the subject invention in a human patient represents a preferred embodiment. As used herein, "oscillating signal" includes voltage signal(s) or current signal(s) that, respectively, change polarity or alternate direction of current or are multi-directional. Also used herein, the phrase "electrical signal" or "signal" is intended to include direct current signal, alternating signal or any signal within the electromagnetic spectrum. The terms "processor"; "microprocessor"; or "microcontroller" are intended to have the same meaning and are intended to be used interchangeably. As used herein, the term "annunciated" and variations on its root term indicate that an announcement may be provided via text, audio, visual or a combination of all modes or mediums of communication to a user.
-
FIGURE 1A illustrates atest meter 200 for testing analyte (glucose) levels in the blood of an individual with a biosensor produced by the methods and techniques illustrated and described herein.Test meter 200 may include user interface inputs (206, 210, 214), which can be in the form of buttons, for entry of data, navigation of menus, and execution of commands. Data can include values representative of analyte concentration, and/or information that are related to the everyday lifestyle of an individual. Information, which is related to the everyday lifestyle, can include food intake, medication use, the occurrence of health check-ups, general health condition and exercise levels of an individual.Test meter 200 can also include adisplay 204 that can be used to report measured glucose levels, and to facilitate entry of lifestyle related information. -
Test meter 200 may include a firstuser interface input 206, a seconduser interface input 210, and a third user interface input 214.User interface inputs display 204.User interface inputs first marking 208, asecond marking 212, and athird marking 216, which help in correlating user interface inputs to characters ondisplay 204. -
Test meter 200 can be turned on by inserting a biosensor 100 (or its variants) into astrip port connector 220, by pressing and briefly holding firstuser interface input 206, or by the detection of data traffic across adata port 218.Test meter 200 can be switched off by removing biosensor 100 (or its variants), pressing and briefly holding firstuser interface input 206, navigating to and selecting a meter off option from a main menu screen, or by not pressing any buttons for a predetermined time.Display 104 can optionally include a backlight. - In one embodiment,
test meter 200 can be configured to not receive a calibration input for example, from any external source, when switching from a first test strip batch to a second test strip batch. Thus, in one exemplary embodiment, the meter is configured to not receive a calibration input from external sources, such as a user interface (such asinputs data port 218. Such a calibration input is not necessary when all of the biosensor batches have a substantially uniform calibration characteristic. The calibration input can be a set of values ascribed to a particular biosensor batch. For example, the calibration input can include a batch "slope" value and a batch "intercept" value for a particular biosensor batch. The calibrations input, such as batch slope and intercept values, may be preset within the meter as will be described below. - Referring to
FIGURE 2A , an exemplary internal layout oftest meter 200 is shown.Test meter 200 includes aprocessor 300, which in some embodiments described and illustrated herein is a 32-bit RISC microcontroller. In the preferred embodiments described and illustrated herein,processor 300 is preferably selected from the MSP 430 family of ultra-low power microcontrollers manufactured by Texas Instruments of Dallas, Texas. The processor can be bi-directionally connected via I/O ports 314 to amemory 302, which in some embodiments described and illustrated herein is an EEPROM. Also connected toprocessor 300 via I/O ports 214 are thedata port 218, theuser interface inputs display driver 320.Data port 218 can be connected toprocessor 300, thereby enabling transfer of data betweenmemory 302 and an external device, such as a personal computer.User interface inputs processor 300.Processor 300 controls display 204 viadisplay driver 320.Memory 302 may be pre-loaded with calibration information, such as batch slope and batch intercept values, during production oftest meter 200. This pre-loaded calibration information can be accessed and used byprocessor 300 upon receiving a suitable signal (such as current) from the strip viastrip port connector 220 so as to calculate a corresponding analyte level ( blood glucose concentration) using the signal and the calibration information without receiving calibration input from any external source. - In embodiments described and illustrated herein,
test meter 200 may include an Application Specific Integrated Circuit (ASIC) 304, so as to provide electronic circuitry used in measurements of glucose level in blood that has been applied to a test strip 100 (or its variants) inserted intostrip port connector 220. Analog voltages can pass to and fromASIC 304 by way of ananalog interface 306. Analog signals fromanalog interface 306 can be converted to digital signals by an A/D converter 316.Processor 300 further includes acore 308, a ROM 310 (containing computer code), aRAM 312, and aclock 318. In one embodiment, theprocessor 300 is configured (or programmed) to disable all of the user interface inputs except for a single input upon a display of an analyte value by the display unit such as, for example, during a time period after an analyte measurement. In an alternative embodiment, theprocessor 300 is configured (or programmed) to ignore any input from all of the user interface inputs except for a single input upon a display of an analyte value by the display unit. Detailed descriptions and illustrations of themeter 200 are shown and described in International Patent Application Publication No.WO2006070200 . - Referring to
FIGUREs 1B AND 2C THROUGH 2G, another embodiment of a hand-heldtest meter 200 is provided. This version of themeter 200 includes adisplay 102, a plurality ofuser interface buttons 104, astrip port connector 106, aUSB interface 108, and a housing. Referring toFIGUREs 1B AND 2C in particular, hand-heldtest meter 200 also includes amicrocontroller block 112, a physicalcharacteristic measurement block 114, adisplay control block 116, amemory block 118 and other electronic components (not shown) for applying a test voltage to biosensor, and also for measuring an electrochemical response (e.g., plurality of test current values) and determining an analyte based on the electrochemical response. To simplify the current descriptions, the FIGURES do not depict all such electronic circuitry. -
Display 102 can be, for example, a liquid crystal display or a bi-stable display configured to show a screen image. An example of a screen image may include a glucose concentration, a date and time, an error message, and a user interface for instructing an end user how to perform a test. -
Strip port connector 106 is configured to operatively interface with abiosensor 100, such as an electrochemical-based biosensor configured for the determination of glucose in a whole blood sample. Therefore, the biosensor is configured for operative insertion intostrip port connector 106 and to operatively interface with phase-shift-basedhematocrit measurement block 114 via, for example, suitable electrical contacts. -
USB Interface 108 can be any suitable interface known to one skilled in the art.USB Interface 108 is essentially a passive component that is configured to power and provide a data line to hand-heldtest meter 200. - Once a biosensor is interfaced with hand-held
test meter 200, or prior thereto, a bodily fluid sample (e.g., a whole blood sample) is introduced into a sample chamber of the biosensor. The biosensor includes enzymatic reagents that selectively and quantitatively transform an analyte into another predetermined chemical form. For example, the biosensor can include an enzymatic reagent with ferricyanide and glucose oxidase so that glucose can be physically transformed into an oxidized form. -
Memory block 118 of hand-heldtest meter 200 includes a suitable algorithm and can be configured, along withmicrocontroller block 112 to determine an analyte based on the electrochemical response of biosensor and the hematocrit of the introduced sample. For example, in the determination of the analyte blood glucose, the hematocrit can be used to compensate for the effect of hematocrit on electrochemically determined blood glucose concentrations. -
Microcontroller block 112 is disposed within housing and can include any suitable microcontroller and/or micro-processer known to those of skill in the art. One such suitable microcontroller is a microcontroller commercially available from Texas Instruments, Dallas, TX USA and part number MSP430F5138. This microcontroller can generate a square wave of 25 to 250 kHz and a 90 degree phase-shifted wave of the same frequency and, thereby, function as a signal generation s-block described further below. MSP430F5138 also has Analog-to-Digital (A/D) processing capabilities suitable for measuring voltages generated by phase shift based hematocrit measurement blocks employed in embodiments of the present disclosure. - Referring in particular to
FIGURE 2D , phase-shift-basedhematocrit measurement block 114 includes asignal generation sub-block 120, a lowpass filter sub-block 122, an biosensor samplecell interface sub-block 124, an optional calibration load block 126 (within the dashed lines ofFIGURE 2D ), atransimpedance amplifier sub-block 128, and aphase detector sub-block 130. - As described further below, phase-shift-based
hematocrit measurement block 114 andmicrocontroller block 112 are configured to measure the phase shift of a bodily fluid sample in a sample cell of an biosensor inserted in the hand-held test meter by, for example, measuring the phase shift of one or more high frequency electrical signals driven through the bodily fluid sample. In addition,microcontroller block 112 is configured to compute the hematocrit of the bodily fluid based on the measured phase shift.Microcontroller 112 can compute the hematocrit by, for example, employing an A/D converter to measure voltages received from a phase-detector sub-block, convert the voltages into a phase-shift and then employing a suitable algorithm or look-up table to convert the phase-shit into a hematocrit value. Once apprised of the present disclosure, one skilled in the art will recognize that such an algorithm and/or look-up table will be configured to take into account various factors such as strip geometry (including electrode area and sample chamber volume) and signal frequency. - It has been determined that a relationship exists between the reactance of a whole blood sample and the hematocrit of that sample. Electrical modeling of a bodily fluid sample (i.e., a whole blood sample) as parallel capacitive and resistive components indicates that when an alternating current (AC) signal is forced through the bodily fluid sample, the phase shift of the AC signal will be dependent on both the frequency of the AC voltage and the hematocrit of the sample. Moreover, modeling indicates that hematocrit has a relatively minor effect on the phase shift when the frequency of the signal is in the range of approximately 10 kHz to 25 kHz and a maximum effect on the phase shift when the frequency of the signal is in the range of approximately 250 kHz to 500 KHz. Therefore, the hematocrit of a bodily fluid sample can be measured by, for example, driving AC signals of known frequency through the bodily fluid sample and detecting their phase shift. For example, the phase-shift of a signal with a frequency in the range of 10 kHz to 25 kHz can be used as a reference reading in such a hematocrit measurement while the phase shift of a signal with a frequency in the range of 250 kHz to 500 kHz can be used as the primary measurement.
- Referring to
FIGUREs 2C-2G , in particular, signal generation sub-block 120 can be any suitable signal generation block and is configured to generate a square wave (0V to Vref) of a desired frequency. Such a signal generation sub-block can, if desired, be integrated intomicrocontroller block 112. - The signal generated by
signal generation sub-block 120 is communicated to dual lowpass filter sub-block 122, which is configured to convert the square wave signal to a sine wave signal of a predetermined frequency. The dual LPF ofFIGURE 2E is configured to provide both a signal of a first frequency (such as a frequency in the range of 10kHz to 25kHz) and a signal of a second frequency (such as a frequency in the range of 250 kHz to 500kHz) to the biosensor sample cell interface sub-block and an biosensors' sample chamber (also referred to as the HCT measurement cell). Selection of the first and second frequency is accomplished using switch IC7 ofFIGURE 2E . The dual LPF ofFIGURE 2E includes employs two suitable operational amplifiers (IC4 and IC5) such as the operational amplifier available from Texas Instruments, Dallas, Texas, USA as high-speed, voltage feedback, CMOS operational amplifier part number OPA354. - Referring to
FIGURE 2E , F-DRV represents a square wave input of either a low or high frequency (e.g., 25kHz or 250 kHz) and is connected to both IC4 and IC5. Signal Fi-HIGH/LOW (from the microcontroller) selects the output of dual lowpass filter sub-block 122 via switch IC7. C5 inFIGURE 2E is configured to block the operating voltage of dual low pass filter sub-block 122 from the HCT measurement cell. - Although a specific dual LPF is depicted in
FIGURE 2E , dual lowpass filter sub-block 122 can be any suitable low pass filter sub-block known to one skilled in the art including, for example, any suitable multiple feedback low pass filter, or a Sallen and Key low pass filter. - The sine wave produced by low
pass filter sub-block 122 is communicated to biosensor samplecell interface sub-block 124 where it is driven across the sample cell of the biosensor (also referred to as an HCT measurement cell). Biosensor samplecell interface block 124 can be any suitable sample cell interface block including, for example, an interface block configured to operatively interface with the sample cell of the biosensor via first electrode and second electrodes of the biosensor disposed in the sample cell. In such a configuration, the signal can be driven into the sample cell (from the low pass filter sub-block) via the first electrode and picked-up from the sample cell (by the transimpedance amplifier sub-block) via the second electrode as depicted inFIGURE 2G . - The current produced by driving the signal across the sample cell is picked-up by
transimpedance amplifier sub-block 128 and converted into a voltage signal for communication to phasedetector sub-block 130. -
Transimpedance sub-block 128 can be any suitable transimpedance sub-block known to one skilled in the art.FIGURE 2F is a simplified annotated schematic block diagram of one such transimpedance amplifier sub-block (based on two OPA354 operational amplifiers, IC3 and IC9). The first stage of TIA sub-block 128 operates at, for example, 400mV, which limits the AC amplitude to +/-400mV. The second stage of TIA sub-block 128 operates at Vref/2, a configuration which enables the generation of an output of the full span of the microcontroller A/D inputs. C9 of TIA sub-block 128 serves as a blocking component that only allows an AC sine wave signal to pass. -
Phase detector sub-block 130 can be any suitable phase detector sub-block that produces either a digital frequency that can be read back bymicrocontroller block 112 using a capture function, or an analog voltage that can be read back bymicrocontroller block 112 using an analog to digital converter.FIGURE 2G depicts a schematic that includes two such phase detector sub-blocks, namely an XOR phase detector (in the upper half ofFIGURE 2G and including IC22 and IC23) and a Quadrature DEMUX phase detector (in the lower half ofFIGURE 2G and including IC12 and IC13). -
FIGURE 2G also depicts acalibration load sub-block 126 that includes a switch (IC16) and a dummy load R7 and C6.Calibration load sub-block 126 is configured for the dynamic measurement of a phase offset for the known phase shift of zero degrees produced by resistor R7, thus providing a phase offset for use in calibration. C6 is configured to force a predetermined slight phase shift, e.g. to compensate for phase delays caused by parasitic capacities in the signal traces to the sample cell, or for phase delays in the electrical circuits (LPF and TIA). - The Quadrature DEMUX phase detector circuit of
FIGURE 2G includes two portions, one portion for a resistive part of the incoming AC signal and one portion for the reactive portion of the incoming AC signal. Use of such two portions enables the simultaneous measurement of both the resistive and reactive portion of the AC signal and a measurement range that covers 0 degrees to 360 degrees. The Quadrature DEMUX circuit ofFIGURE 2G generates two separate output voltages. One of these output voltages represents the "in phase measurement" and is proportional to the "resistive" part of the AC signal, the other output voltage represents the "Quadrature Measurement" and is proportional to the "reactive part of the signal. The phase shift is calculated as:
- Such a Quadrature DEMUX phase detector circuit can also be employed to measure the impedance of a bodily fluid sample in the sample cell. It is hypothesized, without being bound, that the impedance could be employed along with the phase-shift, or independently thereof, to determine the hematocrit of the bodily sample. The amplitude of a signal forced through the sample cell can be calculated using the two voltage outputs of the Quadrature DEMUX circuit as follows :

- This amplitude can then be compared to an amplitude measured for the known resistor of
calibration load block 126 to determine the impedance. - The XOR phase detector portion has a measurement range of 0° to 180°, or alternatively a measurement range of -90° to +90°, depending whether the "Square wave input from µC" is in phase to the sine wave or is set to a 90° phase shift. The XOR phase detector produces an output frequency that is always double the input frequency, however the duty cycle varies. If both inputs are perfectly in phase, the output is LOW, if both inputs are 180° shifted the output is always HIGH. By integrating the output signal (e.g. via a simple RC element) a voltage can be generated that is directly proportional to the phase shift between both inputs.
- As provided herein, one skilled in the art will recognize that phase detector sub-blocks employed in embodiments of the present disclosure can take any suitable form and include, for example, forms that employ rising edge capture techniques, dual edge capture techniques, XOR techniques and synchronous demodulation techniques.
- Since low
pass filter sub-block 122,transimpedance amplifier sub-block 128 andphase detector sub-block 130 can introduce a residual phase shift into phase-shift-basedhematocrit measurement block 114,calibration load block 126 can be optionally included in the phase-shift-based hematocrit measurement block.Calibration load block 126 is configured to be essentially resistive in nature (for example a 33k-ohm load) and, therefore, induces no phase shift between excitation voltage and generated current.Calibration load block 126 is configured to be switched in across the circuit to give a "zero" calibration reading. Once calibrated, the hand-held test meter can measure the phase shift of a bodily fluid sample, subtract the "zero" reading to compute a corrected phase shift and subsequently compute the physical characteristic of the sample based on the corrected phase shift. -
FIGURE 3A(1) is an exemplary exploded perspective view of atest strip 100, which may include seven layers disposed on asubstrate 5. The seven layers disposed onsubstrate 5 can be a first conductive layer 50 (which can also be referred to as electrode layer 50), aninsulation layer 16, two overlappingreagent layers 22a and 22b, an adhesive layer 60 which includesadhesive portions hydrophilic layer 70, and atop layer 80 which forms acover 94 for thetest strip 100.Test strip 100 may be manufactured in a series of steps where theconductive layer 50,insulation layer 16, reagent layers 22, and adhesive layer 60 are sequentially deposited onsubstrate 5 using, for example, a screen-printing process. Note that theelectrodes reagent layer 22a and 22b whereas the physicalcharacteristic sensing electrodes reagent layer 22.Hydrophilic layer 70 andtop layer 80 can be disposed from a roll stock and laminated ontosubstrate 5 as either an integrated laminate or as separate layers.Test strip 100 has adistal portion 3 and a proximal portion 4 as shown inFIGURE 3A(1) . -
Test strip 100 includes a sample-receivingchamber 92 through which aphysiological fluid sample 95 may be drawn through or deposited (Fig. 3A(2) ). The physiological fluid sample discussed herein may be blood. Sample-receivingchamber 92 can include an inlet at a proximal end and an outlet at the side edges oftest strip 100, as illustrated inFIGURE 3A(1) . Afluid sample 95 can be applied to the inlet along axis L-L (Fig. 3A(2) ) to fill a sample-receivingchamber 92 so that glucose can be measured. The side edges of a firstadhesive pad 24 and a secondadhesive pad 26 located adjacent toreagent layer 22 each define a wall of sample-receivingchamber 92, as illustrated inFIGURE 3A(1) . A bottom portion or "floor" of sample-receivingchamber 92 may include a portion ofsubstrate 5,conductive layer 50, andinsulation layer 16, as illustrated inFIGURE 3A(1) . A top portion or "roof' of sample-receivingchamber 92 may include distalhydrophilic portion 32, as illustrated inFIGURE 3A(1) . Fortest strip 100, as illustrated inFIGURE 3A(1 ),substrate 5 can be used as a foundation for helping support subsequently applied layers.Substrate 5 can be in the form of a polyester sheet such as a polyethylene tetraphthalate (PET) material (Hostaphan PET supplied by Mitsubishi).Substrate 5 can be in a roll format, nominally 350 microns thick by 370 millimeters wide and approximately 60 meters in length. - A conductive layer is required for forming electrodes that can be used for the electrochemical measurement of glucose. First
conductive layer 50 can be made from a carbon ink that is screen-printed ontosubstrate 5. In a screen-printing process, carbon ink is loaded onto a screen and then transferred through the screen using a squeegee. The printed carbon ink can be dried using hot air at about 140°C. The carbon ink can include VAGH resin, carbon black, graphite (KS15), and one or more solvents for the resin, carbon and graphite mixture. More particularly, the carbon ink may incorporate a ratio of carbon black: VAGH resin of about 2.90:1 and a ratio of graphite: carbon black of about 2.62:1 in the carbon ink. - For
test strip 100, as illustrated inFIGURE 3A(1) , firstconductive layer 50 may include areference electrode 10, a first workingelectrode 12, a second workingelectrode 14, third and fourth physicalcharacteristic sensing electrodes 19a and 19b, afirst contact pad 13, asecond contact pad 15, areference contact pad 11, a first working electrode track 8, a second working electrode track 9, a reference electrode track 7, and astrip detection bar 17. The physicalcharacteristic sensing electrodes First contact pad 13,second contact pad 15, andreference contact pad 11 may be adapted to electrically connect to a test meter. First working electrode track 8 provides an electrically continuous pathway from first workingelectrode 12 tofirst contact pad 13. Similarly, second working electrode track 9 provides an electrically continuous pathway from second workingelectrode 14 tosecond contact pad 15. Similarly, reference electrode track 7 provides an electrically continuous pathway fromreference electrode 10 toreference contact pad 11.Strip detection bar 17 is electrically connected to referencecontact pad 11. Third and fourth electrode tracks 19b and 20b connect to therespective electrodes test strip 100 has been properly inserted by measuring a continuity betweenreference contact pad 11 andstrip detection bar 17, as illustrated inFIGURE 3A(1) . - Variations of the test strip 100 (
FIGURE 3A(1) ,3A(2) ,3A(3) , or3A(4) ) are shown inFIGURES 3B-3F . Briefly, with regard to variations of test strip 100 (illustrated exemplarily inFIGUREs 3A(2), 3A(2) ), these test strips include an enzymatic reagent layer disposed on the working electrode, a patterned spacer layer disposed over the first patterned conductive layer and configured to define a sample chamber within the biosensor, and a second patterned conductive layer disposed above the first patterned conductive layer. The second patterned conductive layer includes a first phase-shift measurement electrode and a second phase-shift measurement electrode. Moreover, the first and second phase-shift measurement electrodes are disposed in the sample chamber and are configured to measure, along with the hand-held test meter, a phase shift of an electrical signal forced through a bodily fluid sample introduced into the sample chamber during use of the biosensor. Such phase-shift measurement electrodes are also referred to herein as bodily fluid phase-shift measurement electrodes. Biosensors of various embodiments described herein are believed to be advantageous in that, for example, the first and second phase-shift measurement electrodes are disposed above the working and reference electrodes, thus enabling a sample chamber of advantageously low volume. This is in contrast to a configuration wherein the first and second phase-shift measurement electrodes are disposed in a co-planar relationship with the working and reference electrodes thus requiring a larger bodily fluid sample volume and sample chamber to enable the bodily fluid sample to cover the first and second phase-shift measurement electrodes as well as the working and reference electrodes. - In the embodiment of
FIGURE 3A(2) which is a variation of the test strip ofFIGURE 3A(1) , anadditional electrode 10a is provided as an extension of any of the plurality ofelectrodes grounding electrode 10a is used to reduce or eliminate any capacitance coupling between the finger or body of the user and thecharacteristic measurement electrodes grounding electrode 10a allows for any capacitance to be directed away from thesensing electrodes grounding electrode 10a can be connected any one of the other five electrodes or to its own separate contact pad (and track) for connection to ground on the meter instead of one or more ofcontact pads grounding electrode 10a is connected to one of the three electrodes that hasreagent 22 disposed thereon. In a most preferred embodiment, thegrounding electrode 10a is connected toelectrode 10. Being the grounding electrode, it is advantageous to connect the grounding electrode to the reference electrode (10) so not to contribute any additional current to the working electrode measurements which may come from background interfering compounds in the sample. Further by connecting the shield orgrounding electrode 10a to electrode 10 this is believed to effectively increase the size of thecounter electrode 10 which can become limiting especially at high signals. In the embodiment ofFIGURE 3A(2) , the reagent are arranged so that they are not in contact with themeasurement electrodes FIGURE 3A(3) , thereagent 22 is arranged so that thereagent 22 contacts at least one of thesensing electrodes - In alternate version of
test strip 100, shown here inFIGURE 3A(4) , thetop layer 38,hydrophilic film layer 34 andspacer 29 have been combined together to form an integrated assembly for mounting to thesubstrate 5 with reagent layer 22' disposed proximate insulation layer 16'. - In the embodiment of
FIGURE 3B , theanalyte measurement electrodes Fig. 3A(1) ,3A(2) , or3A(3) . Theelectrodes electrode 19a is proximate anentrance 92a to thetest chamber 92 and anotherelectrode 20a is at the opposite end of thetest chamber 92.Electrodes reagent layer 22. - In
FIGUREs 3C ,3D ,3E and3F , the physical characteristic (hematocrit)sensing electrodes entrance 92a to the test chamber 92 (Figs. 3C and3D ) or adjacent theentrance 92a (Figs. 3E and3F ). In all of these embodiments, the physical characteristic sensing electrodes are spaced apart from thereagent layer 22 so that these physical characteristic sensing electrodes are not impacted by the electrochemical reaction of the reagent in the presence of a fluid sample (e.g., blood or interstitial fluid) containing glucose. - In the various embodiments of the biosensor, there are two measurements that are made to a fluid sample deposited on the biosensor. One measurement is that of the concentration of the analyte (glucose) in the fluid sample while the other is that of physical characteristic (hematocrit) in the same sample. The measurement of the physical characteristic (hematocrit) is used to modify or correct the glucose measurement so as to remove or reduce the effect of red blood cells on the glucose measurements. Both measurements (glucose and hematocrit) can be performed in sequence, simultaneously or overlapping in duration. For example, the glucose measurement can be performed first then the physical characteristic (hematocrit); the physical characteristic (hematocrit) measurement first then the glucose measurement; both measurements at the same time; or a duration of one measurement may overlap a duration of the other measurement. Each measurement is discussed in detail as follow with respect to
FIGUREs 4A, 4B and5 . -
FIGURE 4A is an exemplary chart of a test signal applied totest strip 100 and its variations shown here inFIGUREs 3A -3T. Before a fluid sample is applied to test strip 100 (or its variants),test meter 200 is in a fluid detection mode in which a first test signal of about 400 millivolts is applied between second working electrode and reference electrode. A second test signal of about 400 millivolts is preferably applied simultaneously between first working electrode (e.g.,electrode 12 of strip 100) and reference electrode (e.g.,electrode 10 of strip 100). Alternatively, the second test signal may also be applied contemporaneously such that a time interval of the application of the first test signal overlaps with a time interval in the application of the second test voltage. The test meter may be in a fluid detection mode during fluid detection time interval TFD prior to the detection of physiological fluid at starting time at zero. In the fluid detection mode,test meter 200 determines when a fluid is applied to test strip 100 (or its variants) such that the fluid wets either the first workingelectrode 12 or second working electrode 14 (or both working electrodes) with respect toreference electrode 10. Oncetest meter 200 recognizes that the physiological fluid has been applied because of, for example, a sufficient increase in the measured test current at either or both of first workingelectrode 12 and second workingelectrode 14,test meter 200 assigns a zero second marker at zero time "0" and starts the test time interval TS .Test meter 200 may sample the current transient output at a suitable sampling rate, such as, for example, every 1 milliseconds to every 100 milliseconds. Upon the completion of the test time interval TS , the test signal is removed. For simplicity,FIGURE 4A only shows the first test signal applied to test strip 100 (or its variants). - Hereafter, a description of how analyte (glucose) concentration is determined from the known signal transients (e.g., the measured electrical signal response in nanoamperes as a function of time) that are measured when the test voltages of
FIGURE 4A are applied to the test strip 100 (or its variants). - In
FIGURE 4A , the first and second test voltages applied to test strip 100 (or its variants described herein) are generally from about +100 millivolts to about +600 millivolts. In one embodiment in which the electrodes include carbon ink and the mediator includes ferricyanide, the test signal is about +400 millivolts. Other mediator and electrode material combinations will require different test voltages, as is known to those skilled in the art. The duration of the test voltages is generally from about 1 to about 5 seconds after a reaction period and is typically about 3 seconds after a reaction period. Typically, test sequence time TS is measured relative to time t0 . As thevoltage 401 is maintained inFIGURE 4A for the duration of TS , output signals are generated, shown here inFIGURE 4B with thecurrent transient 702 for the first workingelectrode 12 being generated starting at zero time and likewise thecurrent transient 404 for the second workingelectrode 14 is also generated with respect to the zero time. It is noted that while thesignal transients electrodes FIGURE 4B , the current transients build up to a peak proximate peak time Tp at which time, the current slowly drops off until approximately one of 2.5 seconds or 5 seconds after zero time. At thepoint 706, approximately at 5 seconds, the output signal for each of the workingelectrodes electrodes - Referring back to
Fig. 2B , the system drives a signal to measure or sample the output signals IE from at least one the working electrodes (12 and 14) at any one of a plurality of time points or positions T1, T2 , T3, .... TN. As can be seen inFig. 4B , the time position can be any time point or interval in the test sequence TS. For example, the time position at which the output signal is measured can be a single time point T1.5 at 1.5 seconds or an interval 708 (e.g., interval-10 milliseconds or more depending on the sampling rate of the system) overlapping the time point T2.8 proximate 2.8 seconds. - From knowledge of the parameters of the biosensor (e.g., batch calibration code offset and batch slope) for the
particular test strip 100 and its variations, the analyte (glucose) concentration can be calculated.Output transient 702 and 704 can be sampled to derive signals IE (by summation of each of the current IWE1 and IWE2 or doubling of one of IWE1 or IWE2) at various time positions during the test sequence. From knowledge of the batch calibration code offset and batch slope for theparticular test strip 100, the analyte (glucose) concentration can be calculated. - It is noted that "Intercept" and "Slope" are the values obtained by measuring calibration data from a batch of biosensors. Typically around 1500 biosensors are selected at random from the lot or batch. Physiological fluid (e.g., blood) from donors is spiked to various analyte levels, typically six different glucose concentrations. Typically, blood from 12 different donors is spiked to each of the six levels. Eight biosensors (or strips in this embodiment) are given blood from identical donors and levels so that a total of 12 x 6 x 8 = 576 tests are conducted for that lot. These are benchmarked against actual analyte level ( blood glucose concentration) by measuring these using a standard laboratory analyzer such as Yellow Springs Instrument (YSI). A graph of measured glucose concentration is plotted against actual glucose concentration (or measured current versus YSI current) and a formula y = mx+c least squares fitted to the graph to give a value for batch slope m and batch intercept c for the remaining strips from the lot or batch. The applicants have also provided methods and systems in which the batch slope is derived during the determination of an analyte concentration. The "batch slope", or "Slope", may therefore be defined as the measured or derived gradient of the line of best fit for a graph of measured glucose concentration plotted against actual glucose concentration (or measured current versus YSI current). The "batch intercept", or "Intercept", may therefore be defined as the point at which the line of best fit for a graph of measured glucose concentration plotted against actual glucose concentration (or measured current versus YSI current) meets the y axis.
- It is worthwhile here to note that the various components, systems and procedures described earlier allow for applicant to provide an analyte measurement system that heretofore was not available in the art. In particular, this system includes a biosensor that has a substrate and a plurality of electrodes connected to respective electrode connectors. The system further includes an
analyte meter 200 that has a housing, a test strip port connector configured to connect to the respective electrode connectors of the test strip, and amicrocontroller 300, shown here inFIGURE 2B . Themicrocontroller 300 is in electrical communication with the teststrip port connector 220 to apply electrical signals or sense electrical signals from the plurality of electrodes. - Referring to
FIGURE 2B , details of a preferred implementation ofmeter 200 where the same numerals inFIGURES 2A and2B have a common description. InFIGURE 2B , astrip port connector 220 is connected to theanalogue interface 306 by five lines including an impedance sensing line EIC to receive signals from physical characteristic sensing electrode(s), alternating signal line AC driving signals to the physical characteristic sensing electrode(s), reference line for a reference electrode, and signal sensing lines from respective workingelectrode 1 and workingelectrode 2. Astrip detection line 221 can also be provided for theconnector 220 to indicate insertion of a test strip. Theanalog interface 306 provides four inputs to the processor 300: (1) real impedance Z'; (2) imaginary impedance Z"; (3) signal sampled or measured from workingelectrode 1 of the biosensor or I we1; (4) signal sampled or measured from workingelectrode 2 of the biosensor or I we2. There is one output from theprocessor 300 to theinterface 306 to drive an oscillating signal AC of any value from 25kHz to about 250kHz or higher to the physical characteristic sensing electrodes. A phase differential P (in degrees) can be determined from the real impedance Z' and imaginary impedance Z" where:
and magnitude M (in ohms and conventionally written as |Z |) from line Z' and Z" of theinterface 306 can be determined where
- In this system, the microprocessor is configured to: (a) apply a first signal to the plurality of electrodes so that a batch slope defined by a physical characteristic of a fluid sample is derived and (b) apply a second signal to the plurality of electrodes so that an analyte concentration is determined based on the derived batch slope. For this system, the plurality of electrodes of the test strip or biosensor includes at least two electrodes to measure the physical characteristic and at least two other electrodes to measure the analyte concentration. For example, the at least two electrodes and the at least two other electrodes are disposed in the same chamber provided on the substrate. Alternatively, the at least two electrodes and the at least two other electrodes are disposed in respective two different chambers provided on the substrate. It is noted that for some embodiments, all of the electrodes are disposed on the same plane defined by the substrate. In particular, in some of the embodiments described herein, a reagent is disposed proximate the at least two other electrodes and no reagent is disposed on the at least two electrodes. One feature of note in this system is the ability to provide for an accurate analyte measurement within about 10 seconds of deposition of a fluid sample (which may be a physiological sample) onto the biosensor as part of the test sequence.
- As an example of an analyte calculation (glucose) for strip 100 (
Fig. 3A(1) ,3A(2) , or3A(3) and its variants inFIGURES 3B -3T), it is assumed inFig. 4B that the sampled signal value at 706 for the first workingelectrode 12 is about 1600 nanoamperes whereas the signal value at 706 for the second workingelectrode 14 is about 1300 nanoamperes and the calibration code of the test strip indicates that the Intercept is about 500 nanoamperes and the Slope is about 18 nanoamperes/mg/dL. Glucose concentration G0 can be thereafter be determined from Equation 3.3 as follow:
- IE is a signal (proportional to analyte concentration) which is the total signal from all of the electrodes in the biosensor (e.g., for
sensor 100, bothelectrodes 12 and 14 (or Iwe1 + Iwe2)); - Iwe1 is the signal measured for the first working electrode at the set sampling time;
- Iwe2 is the signal measured for the second working electrode at the set sampling time;
- Slope is the value obtained from calibration testing of a batch of test strips of which this particular strip comes from;
- Intercept is the value obtained from calibration testing of a batch of test strips of which this particular strip comes from.
G0 = [(1600+1300)-500]/18 and therefore, G0 = 133.33 nanoamp ~ 133 mg/dL. - It is noted here that although the examples have been given in relation to a
biosensor 100 which has two working electrodes (12 and 14 inFig. 3A(1) ) such that the measured currents from respective working electrodes have been added together to provide for a total measured current IE, the signal resulting from only one of the two working electrodes can be multiplied by two in a variation oftest strip 100 where there is only one working electrode (eitherelectrode 12 or 14). Instead of a total signal, an average of the signal from each working electrode can be used as the total measured current IE for Equations 3.3, 6, and 5-7 described herein, and of course, with appropriate modification to the operational coefficients (as known to those skilled in the art) to account for a lower total measured current IE than as compared to an embodiment where the measured signals are added together. Alternatively, the average of the measured signals can be multiplied by two and used as IE in Equations 3.3, 6, and 5-7 without the necessity of deriving the operational coefficients as in the prior example. It is noted that the analyte (glucose) concentration here is not corrected for any physical characteristic (hematocrit value) and that certain offsets may be provided to the signal values Iwe1 and Iwe2 to account for errors or delay time in the electrical circuit of themeter 200. Temperature compensation can also be utilized to ensure that the results are calibrated to a referential temperature such as for example room temperature of about 20 degrees Celsius. - Now that an analyte (glucose) concentration (G0) can be determined from the signal IE, a description of applicant's technique to determine the physical characteristic (hematocrit) of the fluid sample is provided in relation to
FIGURE 5 .
InFIGURE 5 , the system 200 (Fig. 2 ) applies a firstoscillating input signal 800 at a first frequency (e.g., of about 25kilo-Hertz) to a pair of sensing electrodes. The system is also set up to measure or detect a firstoscillating output signal 802 from the third and fourth electrodes, which in particular involve measuring a first time differential Δt1 between the first input and output oscillating signals. At the same time or during overlapping time durations, the system may also apply a second oscillating input signal (not shown for brevity) at a second frequency (e.g., about 100kilo-Hertz to about 1MegaHertz or higher, and preferably about 250 kilo Hertz) to a pair of electrodes and then measure or detect a second oscillating output signal from the third and fourth electrodes, which may involve measuring a second time differential Δt2 (not shown) between the first input and output oscillating signals. From these signals, the system estimates a physical characteristic (hematocrit) of the fluid sample based on the first and second time differentials Δt1 and Δt2. Thereafter, the system is able to derive a glucose concentration. The estimate of the physical characteristic (hematocrit) can be done by applying an equation of the form
- each of C1, C2, and C3 is an operational constant for the test strip and
- m1 represent a parameter from regressions data.
- Details of this exemplary technique can be found in Provisional
U.S. Patent Application S.N. 61/530,795 filed on September 2, 2011 - Another technique to determine physical characteristic (hematocrit) can be by two independent measurements of physical characteristic (hematocrit). This can be obtained by determining: (a) the impedance of the fluid sample at a first frequency and (b) the phase angle of the fluid sample at a second frequency substantially higher than the first frequency. In this technique, the fluid sample is modeled as a circuit having unknown reactance and unknown resistance. With this model, an impedance (as signified by notation " |Z |") for measurement (a) can be determined from the applied voltage, the voltage across a known resistor (e.g., the intrinsic strip resistance), and the voltage across the unknown impedance Vz; and similarly, for measurement (b) the phase angle can be measured from a time difference between the input and output signals by those skilled in the art. Details of this technique is shown and described in pending provisional patent application S.N.
61/530,808 filed September 2, 2011 US Patent No. 7,972,861 ,US Patent Application Publication Nos. 2010/0206749 , orUS2009/0223834 . - Another technique to determine the physical characteristic (hematocrit) can be obtained by knowing the phase difference (e.g., phase angle) and magnitude of the impedance of the sample. In one example, the following relationship is provided for the estimate of the physical characteristic or impedance characteristic of the sample ("IC"):

- M represents a magnitude |Z | of a measured impedance in ohms);
- P represents a phase difference between the input and output signals (in degrees)
y1 is about -3.2e-08 and ± 10%, 5% or 1% of the numerical value provided hereof (and depending on the frequency of the input signal, can be zero); - y2 is about 4.1e-03 and ± 10%, 5% or 1% of the numerical value provided hereof (and depending on the frequency of the input signal, can be zero);
- y3 is about -2.5e+01 and ± 10%, 5% or 1% of the numerical value provided hereof;
- y4 is about 1.5e-01 and ± 10%, 5% or 1% of the numerical value provided hereof (and depending on the frequency of the input signal, can be zero); and
- y5 is about 5.0 and ± 10%, 5% or 1% of the numerical value provided hereof(and depending on the frequency of the input signal, can be zero);.
- It is noted here that where the frequency of the input AC signal is high (e.g., greater than 75kHz) then the parametric terms y1 and y2 relating to the magnitude of impedance M may be ±200% of the exemplary values given herein such that each of the parametric terms may include zero or even a negative value. On the other hand, where the frequency of the AC signal is low (e.g., less than 75 kHz), the parametric terms y4 and y5 relating to the phase angle P may be ±200% of the exemplary values given herein such that each of the parametric terms may include zero or even a negative value. It is noted here that a magnitude of H or HCT, as used herein, is generally equal to the magnitude of IC. In one exemplary implementation, H or HCT is equal to IC as H or HCT is used herein this application.
- In another alternative implementation, Equation 4.3 is provided. Equation 4.3 is the exact derivation of the quadratic relationship, without using phase angles as in Equation 4.2.

- IC is the Impedance Characteristic [%];
- M is the magnitude of impedance [Ohm];
- y1 is about 1.2292e1 and ± 10%, 5% or 1% of the numerical value provided hereof;
- y2 is about -4.3431e2 and ± 10%, 5% or 1% of the numerical value provided hereof;
- y3 is about 3.5260e4 and ± 10%, 5% or 1% of the numerical value provided hereof.
- By virtue of the various components, systems and insights provided herein, a technique to achieve an analyte measurement with output transient error trapping can be understood with reference to
Figure 6 . This technique involves depositing a fluid sample (which may be a physiological sample or a control solution sample) on a biosensor at step 604 (e.g., in the form of a test strip as show inFigures 3A(1) ,3A(2) ,3A(3) through 3F ) that has been inserted into a meter (step 602). Once themeter 200 is turned on, a signal is applied to the strip 100 (or its variants) and when the sample is deposited onto the test chamber, the applied signal (in conjunction with the appropriate reagent) physically transforms the analyte (glucose) in the sample into a different physical form (e.g., gluconic acid) due to the enzymatic reaction of the analyte with the reagent in the test chamber. As the sample flows into the capillary channel of the test cell, at least one physical characteristic of the sample is obtained from an output of another signal driven into the sample (step 608) along with estimate of the analyte concentration (step 610). From the obtained physical characteristic (step 608) and estimated analyte concentration (step 610), a specified sampling time Tss is defined (at step 612) at which the signal output (due to electrons transfer shown inEquations 1 and 2) from the sample during the test sequence is measured (at step 614) and used for calculating the analyte concentration instep 616. In particular, the step of obtaining the physical characteristic (step 608) may include applying a first signal to the sample to measure a physical characteristic of the sample, while thestep 606 of initiating an enzymatic reaction may involve driving a second signal to the sample, and the step of measuring (step 614) may entail evaluating an output signal from the at least two electrodes at a point in time after the start of the test sequence, in which the point in time is set (at step 612) as a function of at least the measured or estimated physical characteristic (step 608) and estimated analyte concentration (step 610). - The determination of the appropriate point (or time interval) Tss during the test sequence TS as a function of the measured or estimated physical characteristic(s) (in step 612) is determined by the use of a look-up table programmed into the microprocessor of the system. For example, a look-up table may be provided that allows for the system to select the appropriate sampling time Tss for the analyte with measured or known physical characteristic of the sample.
- In particular, an appropriate sampling time point is based on an early estimation of the analyte and the measured or known physical characteristic to arrive at the appropriate sampling time that gives the lowest error or bias as compared to referential values. In this technique, a look up table is provided in which the defined sampling time point is correlated to (a) the estimated analyte concentration and (b) the physical characteristic of the sample. For example, Table 1 may be programmed into the meter to provide a matrix in which qualitative categories (low, medium, and high glucose) of the estimated analyte form the main column and the qualitative categories (low, medium, and high) of the measured or estimated physical characteristic form the header row. In the second column, t/Hct is a value determined experimentally of the time shift per % hematocrit difference from nominal hematocrit of 42%. As one example, for 55% hematocrit at "Mid-Glucose" would indicate a time shift of (42 - 55)*90 = -1170ms. The time of -1170 milliseconds is added to the original test time of about 5000 milliseconds giving (5000-1170=3830 milliseconds) - 3.9seconds.
Table 1 Estimated Analyte t/ Hct (in milliseconds) Specified sampling time Tss for Lo Hct (from start of test sequence, in seconds) Specified sampling time Tss for Mid Hct (from start of test sequence, in seconds) Specified sampling time Tss for High Hct (from start of test sequence, in seconds) Lo- Glucose 40 5.5 5 4.5 Mid-Glucose 90 6.1 5 3.9 Hi- Glucose 110 6.3 5 3.6 - The time Tss (i.e., a specified sampling time) at which the system should be sampling or measuring the output signal of the biosensor is based on both the qualitative category of the estimated analyte and measured or estimated physical characteristic and is predetermined based on regression analysis of a large sample size of actual physiological fluid samples. Applicants note that the appropriate sampling time is measured from the start of the test sequence but any appropriate datum may be utilized in order to determine when to sample the output signal. As a practical matter, the system can be programmed to sample the output signal at an appropriate time sampling interval during the entire test sequence such as for example, one sampling every 100 milliseconds or even as little as about 1 milliseconds. By sampling the entire signal output transient during the test sequence, the system can perform all of the needed calculations near the end of the test sequence rather than attempting to synchronize the sampling time with the set time point, which may introduce timing errors due to system delay.
- Applicant hereafter will discuss the look-up Table 1 in relation to the particular analyte of glucose in physiological fluid samples. Qualitative categories of blood glucose are defined in the first column of Table 1 in which low blood glucose concentrations of less than about 70 mg/dL are designated as "Lo-Glucose"; blood glucose concentrations of higher than about 70 mg/dL but less than about 250 mg/dL are designated as "Mid-Glucose"; and blood glucose concentrations of higher than about 250 mg/dL are designated as "Hi-Glucose".
- During a test sequence, an "Estimated Analyte" can be obtained by sampling the signal at a convenient time point, typically at five seconds during a typical 10 seconds test sequence. The measurement sampled at this five second time point allows for an accurate estimate of the analyte (in this case blood glucose). The system then refers to a look-up table (e.g., Table 1) to determine when to measure the signal output from the test chamber at a specified sampling time Tss based on two criteria: (a) estimated analyte and (b) qualitative value of the physical characteristic of the sample. For criteria (b), the qualitative value of the physical characteristic is broken down into three sub-categories of Low Hct, Mid Hct and High Hct. Thus, in the event that the measured or estimated physical characteristic (hematocrit) is high (e.g., greater than 46%) and the estimated glucose is also high, then according to Table 1, the test time for the system to measure the signal output of test chamber would be about 3.6 seconds. On the other hand, if the measured hematocrit is low (e.g., less than 38%) and the estimated glucose is low then according to Table 1, the specified sampling time Tss for the system to measure the signal output of test chamber would be about 5.5 seconds.
- Once the signal output IT of the test chamber is measured at the specified sampling time Tss(which is governed by the measured or estimated physical characteristic), the signal IT is thereafter used in the calculation of the analyte concentration (in this case glucose) with
Equation 5 below.
- G0 represents an analyte concentration;
- IT represents a signal (proportional to analyte concentration) determined from the sum of the end signals measured at a specified sampling time Tss , which may be the total current measured at the specified sampling time Tss ;
- Slope represents the value obtained from calibration testing of a batch of test strips of which this particular strip comes from and is typically about 0.02; and
- Intercept represents the value obtained from calibration testing of a batch of test strips of which this particular strip comes from and is typically from about 0.6 to about 0.7.
- It should be noted that the step of applying the first signal and the driving of the second signal is sequential in that the order may be the first signal then the second signal or both signals overlapping in sequence; alternatively, the second signal first then the first signal or both signals overlapping in sequence. Alternatively, the applying of the first signal and the driving of the second signal may take place simultaneously.
- In the method, the step of applying of the first signal involves directing an alternating signal provided by an appropriate power source (e.g., the meter 200) to the sample so that a physical characteristic of the sample is determined from an output of the alternating signal from the sample. The physical characteristic being detected is hematocrit. The directing step may include driving first and second alternating signal at different respective frequencies in which a first frequency is lower than the second frequency. Preferably, the first frequency is at least one order of magnitude lower than the second frequency. As an example, the first frequency may be any frequency in the range of about 10 kHz to about 100 kHz and the second frequency may be from about 250 kHz to about 1 MHz or more. As used herein, the phrase "alternating signal" or "oscillating signal" can have some portions of the signal alternating in polarity or all alternating current signal or an alternating current with a direct current offset or even a multi-directional signal combined with a direct-current signal.
- Further refinements of Table 1 based on additional investigations of the technique allowed applicants to devise Table 2, shown below.


- As in Table 1, a measured or estimated physical characteristic is used in Table 2 along with an estimated analyte concentration to derive a time Tss at which the sample is to be measured. For example, if the measured charactertistic is about 30% and the estimated glucose (e.g., by sampling at about 2.5 to 3 seconds) is about 350, the time at which the microcontroller should sample the fluid is about 7 seconds. In another example, where the estimated glucose is about 300 mg/dL and the measured or estimated physical characteristic is 60%, the specified sampling time would be about 3.1 seconds.
- For the embodiments utilized with Table 2, the estimated glucose concentration is provided with an equation:

- Gest represents the estimated glucose concentration;
- IE is the signal measured at about 2.5 seconds;
- x1 is the slope (e.g., x1 =1.3e01);
- x2 is the intercept (e.g., x2 =6.9e02)
- From the estimated glucose, the glucose concentration can be determined from:

- G O represents the glucose concentration;
- Is is the signal measured at a specified sampling time Tss from Table 2;
- x3 is the slope (e.g., x3 =9.6); and
- x4 is the intercept (e.g., x4 =4.8e02).
- Although applicant's technique may specify only one sampling time point, the method may include sampling as many time points as required, such as, for example, sampling the signal output continuously (e.g., at specified sampling time Tss such as, every 1 milliseconds to 100 milliseconds) from the start of the test sequence until at least about 10 seconds after the start and the results stored for processing near the end of the test sequence. In this variation, the sampled signal output at the specified sampling time Tss (which may be different from the predetermined sampling time point) is the value used to calculate the analyte concentration.
- It is noted that in the preferred embodiments, the measurement of a signal output for the value that is somewhat proportional to analyte (glucose) concentration is performed prior to the estimation of the hematocrit. Alternatively, the hematocrit level can be estimated prior to the measurement of the preliminary glucose concentration. In either case, the estimated glucose measurement GE is obtained by Equation 3.3 with IE sampled at about one of 2.5 seconds or 5 seconds, as in
FIGURE 7 , the physical characteristic (e.g., Hct) is obtained by Equation 4 and the glucose measurement G is obtained by using the measured signal output ID at the designated sampling time point(s) (e.g., the measured signal output ID being sampled at 3.5 seconds or 6.5 seconds) for thesignal transient 1000. - Other techniques for determining the analyte concentration or value are shown and described in
PCT/GB2012/053276 (Attorney Docket No. DDI 5220WOPCT) filed on December 28, 2012 PCT/GB2012/053279 (Attorney Docket No. DDI5246WOPCT) filed on December 28, 2012 PCT/GB2012/053277 (Attorney Docket No. DDI5228WOPCT) filed on December 28, 2012 - Referring back to step 616 in
Figure 6 , the system is configured to detect whether the output transient from each of the working electrodes is near an optimal condition for an accurate analyte determination. The optimal state for the output signals to be measured or sampled from the working electrodes should be at a point as close as possible to a steady condition of the output signals. Over the contemplated test sequence of less than 10 seconds, steady-state of the output signal is never reached but an important pre-condition is that the output transient signal is trending towards steady state. - Consequently, applicant has devised a solution to this problem of the output signal not trending towards steady state.
- The mathematical representation of the evaluation that would trigger an error is shown by Eqs. 8.1 and 8.2:


- Iwe1(Δt+Tss) is the output signal proximate time point defined by (Tss+Δt); Tss is the specified sampling time and Δt is a positive or negative time differential, and preferably about -30 milliseconds;
- Iwe2(Δt+Tss) is the output signal proximate time point defined by (Tss+Δt); Tss is the specified sampling time and Δt is a positive or negative time differential, and preferably about -30 milliseconds;
- Iwe1(Tss) is the output signal proximate the specified sampling time Tss;
- Iwe2(Tss) is the output signal proximate the specified sampling time Tss;
- Δt comprises a predetermined time interval from about ±100 milliseconds to ±600 milliseconds;
- m1 is an estimate of the slope of the output signals for the first working electrode proximate the specified sampling time;
- m2 is an estimate of the slope of the output signals for the first working electrode proximate the specified sampling time;
- m1 of m2 ≥ 0 indicates an error in the output signal;
- m1 of m2 < indicates a decreasing trend in the output signal and therefore the output signal is normal (i.e., not erroneous).
- In the evaluation at
step current samples 900 to 902 along the "current transient" (at Tss and Tss-Δt) is positive (i.e., approximately zero or increasing) then there is an inference that the current transient is not approaching steady-state and therefore unsuitable for determining the analyte concentration. This scenario can be seen inFigure 9 in which the gradient or slope of the current transient for the first working electrode is increasing for the interval between the specified sampling time Tss and the predetermined offset time interval Δt (e.g., 300 milliseconds) during the test sequence at Tss- Δt. Because the slope from 900 to 902 inFigure 9 is positive or increasing, there is an inference that the current transient output is not trending towards steady state and therefore is unsuitable for determining the analyte concentration. As such, step 616 (or step 618) would return a true and the process would move immediately to step 620 to annunciate an error and terminate the analyte determination process. - On the other hand, if the slope (i.e., "m") of the two current samples (in
Figure 10 ) from 900 to 902 (at sampling time intervals Tss and Tss-Δt) is negative (i.e., decreasing) then there is an inference that the current transient is approaching steady-state and therefore suitable for determining the analyte concentration. This scenario can be seen inFigure 10 in which the gradient or slope of the current transient for the first working electrode is decreasing for the interval between 900 and 902 for the specified sampling time Tss and the predetermined offset time interval or Δt (e.g., 30 milliseconds) or during the test sequence at Tss- Δt. Because the slope from 900 to 902 inFigure 10 is negative or decreasing, there is an inference that the current transient output is trending towards steady state and therefore is suitable for determining the analyte concentration. As such, step 616 (or step 618) would return a false, and the process moves to step 622 in order for the system to determine the analyte concentration. In the preferred embodiments, the offset time can be any value between 100 milliseconds to 500 milliseconds and most preferably about 300 milliseconds. - In an alternative embodiment that requires less computing power, applicant has devised the logic to set an error flag as active (~1 state) or to annunciate an error whenever the magnitude of the output signal for each working electrode (of working
electrodes 1 and 2) at sampling time Tss- Δt is equal to or greater than the magnitude of the working electrode at specified sampling time Tss (i.e., where Iwe1(Tss-Δt) ≥ Iwe1(Tss) or Iwe2(Tss-Δt) ≥ Iwe2(Tss)). Likewise, no error flag is set (~0) whenever the magnitude of the output signal for each working electrode (of workingelectrodes 1 and 2) at sampling time Tss- Δt is less than the magnitude of the measured or sampled output signal of the working electrode at Tss (i.e., where Iwe1(Tss-Δt) < Iwe1(Tss) or Iwe2(Tss-Δt) < Iwe2(Tss) ). In the preferred embodiments, the predetermined offset time interval Δt can be any value from about 100 millisecond to 600 milliseconds or from about -100 milliseconds to about -600 milliseconds. - Applicant notes that the technique is designed so that if such output transient error is detected at
step 616 or step 618, the system will quickly annunciate an error (fromstep 616 directly to step 620) and return to the main routine or terminate the assay process. - An alternative technique has also been devised by applicant that allows for the system to set an error flag while allowing the continuation of the acquisition of an analyte concentration and then terminating the assay only thereafter. In particular, this technique can be achieved with reference to step 616 (or step 618) which is used to evaluate the output transient signals from the working electrodes. If step 616 (or step 618) returns a true then the process moves to step 617 (instead of step 620) for the system to set an error flag. After the error flag has been set at 617 (or 619), the system continues ahead to step 622 to calculate the analyte concentration using the measured output signals at Tss. At
step 623, the system checks to see if one or more error flags (besides the transient output error flag fromstep 617 or 619) have been set. If true, the system moves to step 620 to annunciate the error otherwise the analyte concentration is annunciated. Although this alternative technique does not provide an immediate feedback as in the other technique, it allows for the system to assess the number of error flag(s) being set before actually declaring that an error has occurred. - Although the techniques described herein have been directed to determination of glucose, the techniques can also applied to other analytes (with appropriate modifications by those skilled in the art) that are affected by physical characteristic(s) of the fluid sample in which the analyte(s) is disposed in the fluid sample. These techniques are however not according to the present invention. example, the physical characteristic of a physiological fluid sample could be accounted for in determination of ketone or cholesterol in the fluid sample, which may be physiological fluid, calibration, or control fluid. Other biosensor configurations can also be utilized. For example, the biosensors shown and described in the following US Patents can be utilized with the various embodiments described herein:
US Patent Nos. 6179979 ;6193873 ;6284125 ;6413410 ;6475372 ;6716577 ;6749887 ;6863801 ;6860421 ;7045046 ;7291256 ;7498132 . - As is known, the detection of the physical characteristic does not have to be done by alternating signals but can be done with other techniques.
- As described earlier, the microcontroller or an equivalent microprocessor (and associated components that allow the microcontroller to function for its intended purpose in the intended environment such as, for example, the
processor 300 inFIGURE 2B ) can be utilized with computer codes or software instructions to carry out the methods and techniques described herein. Applicants note that the exemplary microcontroller 300 (along with suitable components for functional operation of the processor 300) inFIGURE 2B is embedded with firmware or loaded with computer software representative of the logic diagrams inFIGURE 6 and themicrocontroller 300, along with associatedconnector 220 andinterface 306 and equivalents thereof, are the means for: (a) determining a specified sampling time based on a sensed or estimated physical characteristic, the specified sampling time being at least one time point or interval referenced from a start of a test sequence upon deposition of a sample on the test strip and (b) determining an analyte concentration based on the specified sampling time. Alternatively, the means for determining may include means for applying a first signal to the plurality of electrodes so that a batch slope defined by a physical characteristic of a fluid sample is derived and for applying a second signal to the plurality of electrodes so that an analyte concentration is determined based on the derived batch slope and the specified sampling time. Furthermore, the means for determining may include means for estimating an analyte concentration based on a predetermined sampling time point from the start of the test sequence and for selecting a specified sampling time from a matrix of estimated analyte concentration and sensed or estimated physical characteristic. Yet further, the means for determining may include means for selecting a batch slope based on the sensed or estimated physical characteristic and for ascertaining the specified sampling time from the batch slope. - Moreover, while the invention has been described in terms of particular variations and illustrative Figures, those of ordinary skill in the art will recognize that the invention is not limited to the variations or Figures described. In addition, where methods and steps described above indicate certain events occurring in certain order, it is intended that certain steps do not have to be performed in the order described but in any order as long as the steps allow the embodiments to function for their intended purposes. Therefore, to the extent there are variations of the invention, which fall under the inventions found in the claims, it is the intent that this patent will cover those variations as well.
Claims (15)
- An analyte measurement system comprising:a test strip (100) including:a substrate (5);a plurality of electrodes (10, 12, 14, 19a, 20a) connected to respective electrode connectors (11, 13, 15, 17); anda test chamber (92) comprising the plurality of electrodes and an enzymatic reagent (22); andan analyte meter (200) including:a housing;a test strip port connector (220) configured to connect to the respective electrode connectors of the test strip; anda microprocessor (300) in electrical communication with the test strip port connector to apply electrical signals or sense electrical signals from the plurality of electrodes, wherein the microprocessor is configured to:(a) apply a second signal to the plurality of electrodes to initiate an enzymatic reaction of the analyte in a fluid sample with the enzymatic reagent in the test chamber (606);(b) apply a first signal to the plurality of electrodes so that a physical characteristic of the fluid sample deposited onto the test chamber is determined from the output resulting from the applied signal, wherein the physical characteristic is a hematocrit level (608);(c) estimate an analyte concentration from the output resulting from the applied signal at a predetermined sampling time point during a test sequence, wherein the analyte concentration is a glucose concentration (610);(d) determining a specified sampling time point or interval during the test sequence by referring to a look-up table programmed into the microprocessor, wherein said specified sampling time point or interval (Tss) is based on the estimated analyte concentration and the determined physical characteristic (612);(e) measure a signal output at a plurality of time points including the specified sampling time point or interval (Tss) for each of the first and second electrodes (614);(f) measure a signal output at a predetermined offset time interval (Δt) from the specified sampling time point or interval (Tss) for each of the first and second electrodes;(g) evaluate, for each of the first and second electrodes, whether a slope of the signal outputs between the predetermined offset time interval (Δt) and the specified sampling time point or interval (Tss) is approximately zero or increasing over time (616, 618);(h) if the slope of the signal output for each electrode at the predetermined offset time interval (Δt) to the specified sampling time point or interval (Tss) is approximately zero or increasing over time then annunciate an error (620); and(i) if the slope of the signal output for each electrode at the predetermined offset time interval (Δt) to the specified sampling time point or interval (Tss) is decreasing then determine or calculate the analyte concentration from the signal outputs of the first and second electrodes at the specified sampling time point or interval (Tss) (622) and annunciate the analyte concentration (624).
- The system of claim 1, in which the plurality of electrodes comprises four electrodes with the first and second electrodes to measure the analyte concentration and third and fourth electrodes to measure the physical characteristic.
- The system of claim 2, in which the first, second, third and fourth electrodes are disposed in the same chamber provided on the substrate, or in which the first and second electrodes and third and fourth electrodes are disposed in respective two different chambers provided on the substrate.
- The system of claim 2, in which all of the electrodes are disposed on the same plane defined by the substrate.
- The system of claim 2, in which the enzymatic reagent is disposed proximate the first and second electrodes and no reagent is disposed on the third and fourth electrodes.
- The system of claim 2, in which the analyte concentration is determined from the second signal within about 10 seconds of a start of the test sequence and the predetermined offset time interval (Δt) comprises any value from about +0.1 second to about +0.6 seconds or about -0.1 second to about -0.6 second.
- The system of claim 2, wherein the look-up table that includes a matrix in which different qualitative categories of the estimated analyte are set forth in the leftmost column of the matrix and different qualitative categories of the measured or estimated physical characteristic are set forth in the topmost row of the matrix and the specified sampling time points or intervals (Tss) are provided in the remaining cells of the matrix.
- A method of determining an analyte concentration from a fluid sample, the method comprising:
Depositing a fluid sample onto a test chamber of a biosensor, the biosensor (100) including a substrate (5), a plurality of electrodes (10, 12, 14, 19a, 20a) and the test chamber comprising the plurality of electrodes and an enzymatic reagent (22);(a) applying a second signal to the plurality of electrodes to initiate an enzymatic reaction of the analyte in the fluid sample with an enzymatic reagent in the test chamber (606);(b) applying a first signal to the plurality of electrodes and measuring at least one physical characteristic of the sample from the output resulting from the applied signal, wherein the physical characteristic is a hematocrit level (608);(c) estimating an analyte concentration in the sample from the output resulting from the applied signal at a predetermined sampling time point during a test sequence, wherein the analyte concentration is a glucose concentration (610);(d) determining, by referring to a look-up table programmed into a microprocessor, a specified sampling time point or interval (Tss) from the start of the test sequence to sample signal outputs of the biosensor based on the estimated analyte concentration from the estimating step and at least one physical characteristic from the measuring step (612);(e) sampling signal outputs from a first electrode and a second electrode of the biosensor at a plurality of time points including the specified sampling time point or interval (Tss) (614);(f) measuring a signal output at a predetermined offset time interval (Δt) from the specified sampling time point or interval (Tss) for each of the first and second electrodes;(g) evaluating, for each of the first and second electrodes, whether a slope of the signal outputs between the predetermined offset time interval (Δt) and the specified sampling time point or interval (Tss) is approximately zero or increasing over time (616, 618);(h) if the slope of the signal output for each electrode at the predetermined offset time interval (Δt) to the specified sampling time point or interval (Tss) is approximately zero or increasing over time then annunciating an error and terminating further processing (620);(i) if the slope of the signal output for each electrode at the predetermined offset time interval (Δt) to the specified sampling time point or interval (Tss) is decreasing then determining the analyte concentration from the sampled signal outputs of respective first and second electrodes at the specified sampling time point or interval (Tss) (622). - The method of claim 8, in which the measuring comprises applying a first signal to the sample to measure a physical characteristic of the sample; the causing step comprises driving a second signal to the sample; the measuring comprises evaluating a signal output from at least two electrodes of the biosensor at a point in time after the start of the test sequence, in which the point in time is set as a function of at least the measured or estimated physical characteristic; and the determining step comprises calculating an analyte concentration from the measured signal output at said point in time.
- The method of claims 8, in which the defining comprises selecting a defined time point based on both the measured or estimated physical characteristic and the estimated analyte concentration.
- The method of claim 8, further comprising estimating an analyte concentration based on a measurement of the signal output at a predetermined time.
- The method of claim 11, in which the determining a specified sampling time point or interval step comprises comparing the estimated analyte concentration and the measured physical characteristic against the look-up table, the look-up table having different respective ranges of analyte concentration and physical characteristic of the sample indexed against different sample measurement times so that the point in time for measurement of the output from the sample of the second signal is obtained for the calculating step.
- The method of claim 8, in which the calculating step comprises utilizing an equation of the form:
 G0 represents an analyte concentration;IT represents a signal measured at the specified sampling time point or interval (Tss);Slope represents the value obtained from calibration testing of a batch of test strips of which this particular strip comes from; andIntercept represents the value obtained from calibration testing of a batch of test strips of which this particular strip comes from.
 - The method of claim 8, in which the applying of the first signal and the driving of the second signal is sequential, or in which the applying of the first signal overlaps with the driving of the second signal.
- The method of claim 8, wherein the look-up table includes a matrix in which different qualitative categories of the estimated analyte are set forth in the leftmost column of the matrix and different qualitative categories of the measured or estimated physical characteristic are set forth in the topmost row of the matrix and the sampling time point or interval (Tss) are provided in the remaining cells of the matrix.
Applications Claiming Priority (3)
| Application Number | Priority Date | Filing Date | Title |
|---|---|---|---|
| US201361840360P | 2013-06-27 | 2013-06-27 | |
| US13/929,782 US9435764B2 (en) | 2013-06-27 | 2013-06-28 | Transient signal error trap for an analyte measurement determined from a specified sampling time derived from a sensed physical characteristic of the sample containing the analyte |
| PCT/EP2014/063588 WO2014207138A1 (en) | 2013-06-27 | 2014-06-26 | Transient signal error trap for an analyte measurement determined from a specified sampling time derived from a sensed physical characteristic of the sample containing the analyte |
Publications (2)
| Publication Number | Publication Date |
|---|---|
| EP3014258A1 EP3014258A1 (en) | 2016-05-04 |
| EP3014258B1 true EP3014258B1 (en) | 2024-08-21 |
Family
ID=52114529
Family Applications (1)
| Application Number | Title | Priority Date | Filing Date |
|---|---|---|---|
| EP14734118.4A Active EP3014258B1 (en) | 2013-06-27 | 2014-06-26 | Transient signal error trap for an analyte measurement determined from a specified sampling time derived from a sensed physical characteristic of the sample containing the analyte |
Country Status (12)
| Country | Link |
|---|---|
| US (1) | US9435764B2 (en) |
| EP (1) | EP3014258B1 (en) |
| JP (1) | JP6456372B2 (en) |
| KR (1) | KR20160024387A (en) |
| CN (1) | CN105579837B (en) |
| AU (1) | AU2014301060B2 (en) |
| BR (1) | BR112015032574A8 (en) |
| CA (1) | CA2916627C (en) |
| HK (1) | HK1223683A1 (en) |
| RU (1) | RU2669550C2 (en) |
| TW (1) | TWI639827B (en) |
| WO (1) | WO2014207138A1 (en) |
Families Citing this family (4)
| Publication number | Priority date | Publication date | Assignee | Title |
|---|---|---|---|---|
| US9423374B2 (en) * | 2015-01-26 | 2016-08-23 | Lifescan Scotland Limited | Reference electrode error trap determined from a specified sampling time and a pre-determined sampling time |
| RU2745479C1 (en) * | 2017-07-03 | 2021-03-25 | Ф. Хоффманн-Ля Рош Аг | Method and the electronics unit for determining biosensor properties under in vivo conditions |
| KR102209132B1 (en) * | 2017-09-29 | 2021-01-28 | 주식회사 비바이오 | Apparatus and method for determining error of electrochemical biosensor |
| WO2020226623A1 (en) * | 2019-05-07 | 2020-11-12 | Hewlett-Packard Development Company, L.P. | Fluid analysis with channels formed in lids |
Family Cites Families (42)
| Publication number | Priority date | Publication date | Assignee | Title |
|---|---|---|---|---|
| DE3228542A1 (en) | 1982-07-30 | 1984-02-02 | Siemens AG, 1000 Berlin und 8000 München | METHOD FOR DETERMINING THE CONCENTRATION OF ELECTROCHEMICALLY IMPLEMENTABLE SUBSTANCES |
| AUPN363995A0 (en) | 1995-06-19 | 1995-07-13 | Memtec Limited | Electrochemical cell |
| US6413410B1 (en) | 1996-06-19 | 2002-07-02 | Lifescan, Inc. | Electrochemical cell |
| US6863801B2 (en) | 1995-11-16 | 2005-03-08 | Lifescan, Inc. | Electrochemical cell |
| AUPN661995A0 (en) | 1995-11-16 | 1995-12-07 | Memtec America Corporation | Electrochemical cell 2 |
| AUPO581397A0 (en) | 1997-03-21 | 1997-04-17 | Memtec America Corporation | Sensor connection means |
| US6475372B1 (en) * | 2000-02-02 | 2002-11-05 | Lifescan, Inc. | Electrochemical methods and devices for use in the determination of hematocrit corrected analyte concentrations |
| US6193873B1 (en) | 1999-06-15 | 2001-02-27 | Lifescan, Inc. | Sample detection to initiate timing of an electrochemical assay |
| US6716577B1 (en) | 2000-02-02 | 2004-04-06 | Lifescan, Inc. | Electrochemical test strip for use in analyte determination |
| US6767441B1 (en) | 2001-07-31 | 2004-07-27 | Nova Biomedical Corporation | Biosensor with peroxidase enzyme |
| US6749887B1 (en) | 2001-11-28 | 2004-06-15 | Lifescan, Inc. | Solution drying system |
| KR100475634B1 (en) | 2001-12-24 | 2005-03-15 | 주식회사 아이센스 | Biosensor equipped with sample introducing part which enables quick introduction of a small amount of sample |
| ITMI20020369A1 (en) | 2002-02-25 | 2003-08-25 | Gi Bi Effe Srl | BOX WITH CLOSING PANEL AND GUARANTEE SEAL AND WITH ELEMENT TO KEEP THE PANEL CLOSED AFTER THE SEAL IS BROKEN |
| WO2004011921A1 (en) * | 2002-07-25 | 2004-02-05 | Arkray, Inc. | Sample analyzing method and sample analyzing device |
| AU2003234944A1 (en) | 2002-08-27 | 2004-03-18 | Bayer Healthcare, Llc | Methods of Determining Glucose Concentration in Whole Blood Samples |
| US7291256B2 (en) | 2002-09-12 | 2007-11-06 | Lifescan, Inc. | Mediator stabilized reagent compositions and methods for their use in electrochemical analyte detection assays |
| RU2006144458A (en) | 2004-05-14 | 2008-06-20 | БАЙЕР ХЕЛТКЭР ЭлЭлСи (US) | METHODS FOR IMPLEMENTING HEMATOCRITIS CORRECTION IN GLUCOSE ANALYSIS AND DEVICE FOR THIS |
| RU2413228C2 (en) | 2004-12-29 | 2011-02-27 | Лайфскэн Скотланд Лимитед | System for performing test of organism fluid |
| DE602005023433D1 (en) * | 2005-07-07 | 2010-10-21 | Asulab Sa | System for the differential determination of the amount of a proteolytic enzyme in a body fluid |
| JPWO2007026683A1 (en) * | 2005-09-02 | 2009-03-05 | アークレイ株式会社 | Sample supply state detection method and analysis tool |
| DE602005021236D1 (en) | 2005-12-30 | 2010-06-24 | Schlumberger Technology Bv | Density and viscosity sensor |
| JP5018777B2 (en) | 2006-07-05 | 2012-09-05 | パナソニック株式会社 | Liquid sample measuring method and apparatus |
| EP1882745A1 (en) * | 2006-07-25 | 2008-01-30 | The Swatch Group Research and Development Ltd. | Electrochemical system for dosing of a biological compound by an enzyme |
| CN101495857B (en) * | 2006-07-26 | 2012-11-07 | 松下电器产业株式会社 | Biosensor measurement system and abnormal waveform detection method in biosensor |
| US20080083618A1 (en) | 2006-09-05 | 2008-04-10 | Neel Gary T | System and Methods for Determining an Analyte Concentration Incorporating a Hematocrit Correction |
| CN101529236B (en) | 2006-10-19 | 2013-04-03 | 松下电器产业株式会社 | Method for measuring hematocrit value of blood sample, method for measuring concentration of analyte in blood sample, sensor chip and sensor unit |
| US8101062B2 (en) | 2007-07-26 | 2012-01-24 | Nipro Diagnostics, Inc. | System and methods for determination of analyte concentration using time resolved amperometry |
| EP2193367B1 (en) | 2007-09-27 | 2019-01-23 | Philosys CO., LTD. | Method for correcting erroneous results of measurement in biosensors and apparatus using the same |
| US8603768B2 (en) * | 2008-01-17 | 2013-12-10 | Lifescan, Inc. | System and method for measuring an analyte in a sample |
| US8344733B2 (en) * | 2008-03-27 | 2013-01-01 | Panasonic Corporation | Sample measurement device, sample measurement system and sample measurement method |
| JP4555368B2 (en) | 2008-07-10 | 2010-09-29 | 株式会社セコニック | Method for measuring viscoelasticity of liquid |
| US20110057671A1 (en) * | 2009-09-04 | 2011-03-10 | Lifescan Scotland, Ltd. | Methods, system and device to identify a type of test strip |
| EP2634572B1 (en) * | 2009-09-04 | 2018-05-02 | Lifescan Scotland Limited | Method for determining a hematocrit-corrected test current in glucose measurements |
| IL209760A (en) * | 2009-12-11 | 2015-05-31 | Lifescan Scotland Ltd | Fill sufficiency method and system |
| RU2012140730A (en) * | 2010-02-25 | 2014-03-27 | Лайфскэн Скотлэнд Лимитед | DETERMINATION OF CAPACITY AT ANALYSIS BY ELECTROCHEMICAL METHOD |
| EP2601520B1 (en) * | 2010-08-02 | 2014-05-14 | Cilag GmbH International | Method for improved accuracy for temperature correction of glucose results for control solution |
| CA2811565C (en) * | 2010-09-28 | 2019-12-17 | Lifescan Scotland Limited | Analyte measurement method and system with error trapping |
| US9316649B2 (en) * | 2011-05-10 | 2016-04-19 | Panasonic Healthcare Holdings Co., Ltd. | Biological sample measuring device and method for measuring biological sample using same |
| EP2715330B1 (en) | 2011-05-27 | 2018-05-23 | Lifescan Scotland Limited | Peak offset correction for analyte test strip |
| ES2710186T3 (en) | 2011-09-02 | 2019-04-23 | Lifescan Scotland Ltd | Corrected glucose measurements of hematocrit for the electrochemical test strip using the signal time differential |
| US9903830B2 (en) | 2011-12-29 | 2018-02-27 | Lifescan Scotland Limited | Accurate analyte measurements for electrochemical test strip based on sensed physical characteristic(s) of the sample containing the analyte |
| BR112015001808A2 (en) * | 2012-07-27 | 2017-07-04 | Bayer Healthcare Llc | system and method for detecting dry and used sensors |
-
2013
- 2013-06-28 US US13/929,782 patent/US9435764B2/en active Active
-
2014
- 2014-06-25 TW TW103121816A patent/TWI639827B/en not_active IP Right Cessation
- 2014-06-26 BR BR112015032574A patent/BR112015032574A8/en not_active Application Discontinuation
- 2014-06-26 JP JP2016522507A patent/JP6456372B2/en active Active
- 2014-06-26 KR KR1020167001919A patent/KR20160024387A/en active Search and Examination
- 2014-06-26 WO PCT/EP2014/063588 patent/WO2014207138A1/en active Application Filing
- 2014-06-26 CA CA2916627A patent/CA2916627C/en active Active
- 2014-06-26 RU RU2016102343A patent/RU2669550C2/en not_active IP Right Cessation
- 2014-06-26 CN CN201480047408.2A patent/CN105579837B/en not_active Expired - Fee Related
- 2014-06-26 AU AU2014301060A patent/AU2014301060B2/en not_active Ceased
- 2014-06-26 EP EP14734118.4A patent/EP3014258B1/en active Active
-
2016
- 2016-10-14 HK HK16111876.8A patent/HK1223683A1/en unknown
Also Published As
| Publication number | Publication date |
|---|---|
| WO2014207138A1 (en) | 2014-12-31 |
| CN105579837B (en) | 2018-09-18 |
| JP6456372B2 (en) | 2019-01-23 |
| TW201518717A (en) | 2015-05-16 |
| US9435764B2 (en) | 2016-09-06 |
| RU2016102343A (en) | 2017-08-01 |
| JP2016523369A (en) | 2016-08-08 |
| US20150001070A1 (en) | 2015-01-01 |
| BR112015032574A2 (en) | 2017-07-25 |
| CA2916627A1 (en) | 2014-12-31 |
| AU2014301060B2 (en) | 2018-08-09 |
| EP3014258A1 (en) | 2016-05-04 |
| CA2916627C (en) | 2022-11-29 |
| KR20160024387A (en) | 2016-03-04 |
| RU2016102343A3 (en) | 2018-03-19 |
| AU2014301060A1 (en) | 2016-01-28 |
| CN105579837A (en) | 2016-05-11 |
| RU2669550C2 (en) | 2018-10-11 |
| HK1223683A1 (en) | 2017-08-04 |
| BR112015032574A8 (en) | 2020-01-07 |
| TWI639827B (en) | 2018-11-01 |
Similar Documents
| Publication | Publication Date | Title |
|---|---|---|
| EP3014257B1 (en) | Temperature compensation for an analyte measurement | |
| EP3206022B1 (en) | Blood glucose measurements for electrochemical test strip based on multiple discrete measurements defined by sensed hematocrit of the blood sample | |
| US9828621B2 (en) | Anomalous signal error trap for an analyte measurement determined from a specified sampling time derived from a sensed physical characteristic of the sample containing the analyte | |
| EP3014258B1 (en) | Transient signal error trap for an analyte measurement determined from a specified sampling time derived from a sensed physical characteristic of the sample containing the analyte | |
| AU2015323722A1 (en) | Accurate analyte measurements for electrochemical test strip to determine analyte measurement time based on measured temperature, physical characteristic and estimated analyte value and their temperature compensated values | |
| EP3250916B1 (en) | Reference electrode error trap determined from a specified sampling time and a pre-determined sampling time | |
| AU2014301074B2 (en) | Fill error trap for an analyte measurement determined from a specified sampling time derived from a sensed physical characteristic of the sample containing the analyte | |
| AU2015323723A1 (en) | Accurate analyte measurements for electrochemical test strip to determine analyte measurement time based on measured temperature, physical characteristic and estimated analyte value |
Legal Events
| Date | Code | Title | Description |
|---|---|---|---|
| PUAI | Public reference made under article 153(3) epc to a published international application that has entered the european phase |
Free format text: ORIGINAL CODE: 0009012 |
|
| 17P | Request for examination filed |
Effective date: 20160126 |
|
| AK | Designated contracting states |
Kind code of ref document: A1 Designated state(s): AL AT BE BG CH CY CZ DE DK EE ES FI FR GB GR HR HU IE IS IT LI LT LU LV MC MK MT NL NO PL PT RO RS SE SI SK SM TR |
|
| AX | Request for extension of the european patent |
Extension state: BA ME |
|
| DAX | Request for extension of the european patent (deleted) | ||
| REG | Reference to a national code |
Ref country code: HK Ref legal event code: DE Ref document number: 1223683 Country of ref document: HK |
|
| STAA | Information on the status of an ep patent application or granted ep patent |
Free format text: STATUS: EXAMINATION IS IN PROGRESS |
|
| 17Q | First examination report despatched |
Effective date: 20190515 |
|
| STAA | Information on the status of an ep patent application or granted ep patent |
Free format text: STATUS: EXAMINATION IS IN PROGRESS |
|
| REG | Reference to a national code |
Ref country code: HK Ref legal event code: WD Ref document number: 1223683 Country of ref document: HK |
|
| GRAP | Despatch of communication of intention to grant a patent |
Free format text: ORIGINAL CODE: EPIDOSNIGR1 |
|
| STAA | Information on the status of an ep patent application or granted ep patent |
Free format text: STATUS: GRANT OF PATENT IS INTENDED |
|
| INTG | Intention to grant announced |
Effective date: 20240315 |
|
| GRAS | Grant fee paid |
Free format text: ORIGINAL CODE: EPIDOSNIGR3 |
|
| GRAA | (expected) grant |
Free format text: ORIGINAL CODE: 0009210 |
|
| STAA | Information on the status of an ep patent application or granted ep patent |
Free format text: STATUS: THE PATENT HAS BEEN GRANTED |
|
| AK | Designated contracting states |
Kind code of ref document: B1 Designated state(s): AL AT BE BG CH CY CZ DE DK EE ES FI FR GB GR HR HU IE IS IT LI LT LU LV MC MK MT NL NO PL PT RO RS SE SI SK SM TR |
|
| REG | Reference to a national code |
Ref country code: GB Ref legal event code: FG4D |
|
| REG | Reference to a national code |
Ref country code: CH Ref legal event code: EP |
|
| P01 | Opt-out of the competence of the unified patent court (upc) registered |
Free format text: CASE NUMBER: APP_44728/2024 Effective date: 20240801 |
|
| REG | Reference to a national code |
Ref country code: DE Ref legal event code: R096 Ref document number: 602014090721 Country of ref document: DE |