EP2984506B1 - Procedes et systemes d'outil de visualisation de direction de diagraphie en cours de forage (lwd) - Google Patents
Procedes et systemes d'outil de visualisation de direction de diagraphie en cours de forage (lwd) Download PDFInfo
- Publication number
- EP2984506B1 EP2984506B1 EP13886830.2A EP13886830A EP2984506B1 EP 2984506 B1 EP2984506 B1 EP 2984506B1 EP 13886830 A EP13886830 A EP 13886830A EP 2984506 B1 EP2984506 B1 EP 2984506B1
- Authority
- EP
- European Patent Office
- Prior art keywords
- map view
- formation
- tool
- bed boundary
- bit
- Prior art date
- Legal status (The legal status is an assumption and is not a legal conclusion. Google has not performed a legal analysis and makes no representation as to the accuracy of the status listed.)
- Active
Links
- 238000000034 method Methods 0.000 title claims description 33
- 238000005553 drilling Methods 0.000 title description 15
- 238000012800 visualization Methods 0.000 title description 10
- 230000015572 biosynthetic process Effects 0.000 claims description 107
- 238000005259 measurement Methods 0.000 claims description 30
- 230000035699 permeability Effects 0.000 claims description 16
- 239000003086 colorant Substances 0.000 claims description 12
- 230000000153 supplemental effect Effects 0.000 claims description 11
- 230000004044 response Effects 0.000 claims description 7
- 238000005755 formation reaction Methods 0.000 description 91
- 230000006870 function Effects 0.000 description 21
- 230000002452 interceptive effect Effects 0.000 description 12
- 238000004891 communication Methods 0.000 description 6
- 239000000463 material Substances 0.000 description 6
- 239000012530 fluid Substances 0.000 description 3
- 230000008569 process Effects 0.000 description 3
- 238000012552 review Methods 0.000 description 3
- 238000004458 analytical method Methods 0.000 description 2
- 238000005520 cutting process Methods 0.000 description 2
- 238000010586 diagram Methods 0.000 description 2
- XLYOFNOQVPJJNP-UHFFFAOYSA-N water Substances O XLYOFNOQVPJJNP-UHFFFAOYSA-N 0.000 description 2
- 229910000831 Steel Inorganic materials 0.000 description 1
- 238000007792 addition Methods 0.000 description 1
- 238000004364 calculation method Methods 0.000 description 1
- 238000012512 characterization method Methods 0.000 description 1
- 230000000295 complement effect Effects 0.000 description 1
- 238000012217 deletion Methods 0.000 description 1
- 230000037430 deletion Effects 0.000 description 1
- 238000002347 injection Methods 0.000 description 1
- 239000007924 injection Substances 0.000 description 1
- 230000014759 maintenance of location Effects 0.000 description 1
- 238000013507 mapping Methods 0.000 description 1
- 238000012986 modification Methods 0.000 description 1
- 230000004048 modification Effects 0.000 description 1
- 239000010959 steel Substances 0.000 description 1
- 238000006467 substitution reaction Methods 0.000 description 1
- 230000032258 transport Effects 0.000 description 1
- 230000001960 triggered effect Effects 0.000 description 1
- 230000000007 visual effect Effects 0.000 description 1
Images


Classifications
-
- G—PHYSICS
- G01—MEASURING; TESTING
- G01V—GEOPHYSICS; GRAVITATIONAL MEASUREMENTS; DETECTING MASSES OR OBJECTS; TAGS
- G01V3/00—Electric or magnetic prospecting or detecting; Measuring magnetic field characteristics of the earth, e.g. declination, deviation
- G01V3/38—Processing data, e.g. for analysis, for interpretation, for correction
-
- E—FIXED CONSTRUCTIONS
- E21—EARTH DRILLING; MINING
- E21B—EARTH DRILLING, e.g. DEEP DRILLING; OBTAINING OIL, GAS, WATER, SOLUBLE OR MELTABLE MATERIALS OR A SLURRY OF MINERALS FROM WELLS
- E21B7/00—Special methods or apparatus for drilling
- E21B7/04—Directional drilling
-
- G—PHYSICS
- G01—MEASURING; TESTING
- G01V—GEOPHYSICS; GRAVITATIONAL MEASUREMENTS; DETECTING MASSES OR OBJECTS; TAGS
- G01V3/00—Electric or magnetic prospecting or detecting; Measuring magnetic field characteristics of the earth, e.g. declination, deviation
- G01V3/18—Electric or magnetic prospecting or detecting; Measuring magnetic field characteristics of the earth, e.g. declination, deviation specially adapted for well-logging
-
- G—PHYSICS
- G06—COMPUTING; CALCULATING OR COUNTING
- G06T—IMAGE DATA PROCESSING OR GENERATION, IN GENERAL
- G06T11/00—2D [Two Dimensional] image generation
Definitions
- US 2012/298420 A1 discloses methods for characterization of formations, navigating drill paths, and placing wells in earth boreholes.
- WO2009/029517 A2 discloses a look ahead logging system.
- a method comprising: acquiring ahead of bit or around bit data related to a formation from measurements by a tool; and generating a two-dimensional (2D) map view of the formation using the acquired data, wherein the 2D map view displays formation properties in a single predetermined direction with respect to a reference point for the tool as a function of depth, wherein the map view includes a sloped line to represent a bed boundary between two formation layers displayed for a depth value, and wherein an angle of the sloped line corresponds to a relative dip angle indicator between the predetermined direction and said bed boundary.
- a method comprising: acquiring ahead of bit or around bit data related to a formation from measurements by a tool; and generating a two-dimensional (2D) map view of the formation using the acquired data, wherein the 2D map view displays formation properties in a single predetermined direction with respect to a reference point for the tool as a function of depth, wherein the map view includes a straight line to represent a bed boundary between two formation layers displayed for a depth value, and wherein a relative dip angle indicator separate from the straight line is displayed for the depth value to represent an angle between the predetermined direction and said bed boundary.
- a method comprising: acquiring ahead of bit or around bit data related to a formation from measurements by a tool; and generating a two-dimensional (2D) or three-dimensional (3D) map view of the formation using the acquired data, wherein the 2D or 3D map view displays a drill path and a separate 2D or 3D drill path object for each of a plurality of distinct depth values along the drill path, wherein the map view displays at least one 2D or 3D bed boundary object for each of a plurality distinct depth values along the drill path, and wherein at least one of the displayed bed boundary objects includes an orientation attribute corresponding to a relative dip angle for a bed boundary with respect to a reference point for the tool.
- the present invention further provides a computer-readable storage device having instructions stored thereon, which, when executed by one or more processors of a computer, cause the computer to perform operations, the operations comprising the method of any of the first to third aspects of the present invention.
- the present invention provides a system comprising: one or more processors; a user interface operable with the one or more processors; and a computer-readable storage device that stores a steering visualization software tool that when executed by the one or more processors, causes the system to perform operations, the operations comprising the method of the first to third aspects of the present invention.
- FIG. 1 is a logging while drilling (LWD) environment.
- a drilling platform 2 supports a derrick 4 having a traveling block 6 for raising and lowering a drill string 8.
- a drill string kelly 10 supports the rest of the drill string 8 as it is lowered through a rotary table 12.
- the rotary table 12 rotates the drill string 8, thereby turning a drill bit 14.
- a pump 20 circulates drilling fluid through a feed pipe 22 to kelly 10, downhole through the interior of drill string 8, through orifices in drill bit 14, back to the surface via the annulus 9 around drill string 8, and into a retention pit 24.
- the drilling fluid transports cuttings from the borehole 16 into the pit 24 and aids in maintaining the integrity of the borehole.
- the drilling fluid may be oil-based (with a high resistivity) or water-based (with a low resistivity).
- the drill bit 14 is just one piece of an open-hole LWD assembly that includes one or more drill collars 26 and logging tool 28.
- Drill collars 26 are thick-walled steel pipe sections that provide weight and rigidity for the drilling process.
- the logging tool 28 (which may be built in to the drill collars) gather measurements of various drilling or formation parameters.
- logging instrument 28 may be integrated into the bottom-hole assembly near the bit 14 to collect look-ahead and/or look around measurements. The collected measurements may be plotted and used for steering the drill string 8 as described herein.
- Measurements from the logging tool 28 can be acquired by a telemetry sub (e.g., built in to logging tool 28) to be stored in internal memory and/or communicated to the surface via a communications link.
- Mud pulse telemetry is one common technique for providing a communications link for transferring logging measurements to a surface receiver 30 and for receiving commands from the surface, but other telemetry techniques can also be used.
- measurements collected from the logging tool 28 may processed by a computer system executing a steering visualization software tool with various map view options.
- FIG. 2 shows an illustrative computer system 43 for managing logging operations and/or steering visualization options.
- the computer system 43 may correspond to, e.g., an onsite logging facility for the LWD system of FIG. 1 , or a remote computing system that receives logging measurements from such logging facilities.
- the computer system 43 may include wired or wireless communication interfaces receiving such logging measurements.
- the illustrative computer system 43 comprises user workstation 51 with a computer chassis 46 coupled to a display device 48 and a user input device 50.
- the computer chassis 46 includes one or more information storage devices for accessing software (shown in FIG.
- illustrative computer system 43 executes steering visualization software that provides various map view options to facilitate formation analysis and LWD steering decisions.
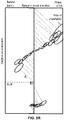
- FIG. 3 shows an illustration of logging tool 28 in a subterranean environment with multiple formation beds or layers 18A-18D and bed boundaries 90A-90E.
- the formation beds 18A-18D and bed boundaries 90A-90E are represented as a two-dimensional (2D) image with straight lines, it should be understood that subterranean environments usually have sloped or curved formation beds and bed boundaries.
- Arrow 70 represents the direction to the side of the logging tool 28 extending radially outward
- arrow 72 represents the direction ahead of the logging tool 28
- arrow 74 represents a true vertical direction extending downward from the logging tool 28
- arrow 76 represents a true horizontal direction extending sideways from the logging tool 28.
- Various angles are also shown in FIG. 3 , including angle 80, which corresponds to the relative dip of logging tool 28 ( i.e., the angle between arrow 74 and arrow 72), and angle 82, which corresponds to the azimuth for bed boundary 90C with respect to a tool azimuth reference point.
- arrow 80 represents the vertical distance between logging tool 28 and bed boundary 90B
- arrow 82 represents the vertical distance between logging tool 28 and bed boundary 90A
- arrow 84 represents the vertical distance between logging tool 28 and bed boundary 90C
- arrow 86 represents the vertical distance between logging tool 28 and bed boundary 90D.
- distance information and angle information such as the distances and angles described in FIG. 3 are plotted or mapped by steering visualization software that receives ahead of bit and/or around bit measurements.
- the parameters that are displayed or represented by steering visualization software may include physical parameters such as tool orientation, formation resistivity values, vertical resistivity, horizontal resistivity, relative dip angles, relative azimuth angles, bed dips, bed azimuths, drill path, distance to bed boundaries, water saturation, and formation porosity.
- trust parameters such as uncertainty estimates, inversion type information, and/or comparison information may be displayed or represented by steering visualization software. By displaying or representing physical parameters and trust parameters, the steering visualization software enables an LWD operator to make steering decisions for an LWD tool or to review past steering operations as described herein.
- FIG. 4 shows a block diagram of an illustrative LWD visualization system 400.
- the LWD visualization system 400 includes a logging tool 440 (e.g., logging tool 28) with look-ahead/around systems 442 to collect ahead of bit and/or around bit measurements.
- the logging tool 440 also includes memory 444 to store collected measurements and/or to store logging instructions.
- a communication interface 446 of the logging tool 440 enables ahead of bit and/or around bit measurement data to be transferred to a surface communication interface 430.
- the surface communication interface 430 provides the ahead of bit and/or around bit measurement data to a surface computer 402.
- the surface computer 402 includes a processor 404 coupled to a display 405, input device(s) 406, and a storage medium 408.
- the display 405 and input device(s) 406 function as a user interface that enables a LWD operator to view information and to input steering commands or interface option commands (to control how information is viewed).
- the storage medium 408 stores a steering visualization software tool 410 that, when executed by processor 404, provides various map view options 416 based on ahead or bit and/or around bit measurements collected by the logging tool 440.
- the input device(s) 406 include a touch screen, mouse, and/or keyboard operable with a user interface to provide user inputs to switch between different map views, to display multiple map views, to enable different map view features, and/or to disable different map view features. Further, the input device(s) 406 enable an operator to interact with a steering visualization interface that assists the operator with steering decisions using one or more of the map views described herein.
- the map view options 416 include various two-dimensional (2D) or three-dimensional (3D) data plot options in which tool position/orientation and formation properties (e.g ., resistivity or electromagnetic permeability) are represented by colors, patterns, and/or shapes. Particular formation materials also may be identified by colors, patterns, and/or shapes. In some embodiments, the patterns or shapes used to represent formation properties have a default appearance to represent isotropic formation properties and a scaled appearance (relative to the default appearance) to represent anisotropic formation properties.
- the 2D/3D data plot options may include use of arrows, lines, and/or strips to represent directions and distances (e.g ., the direction and distance between the drill bit and a bed boundary).
- the 2D/3D data plot options also may include an uncertainty estimate for the data being displayed or represented. In some embodiments, uncertainty is represented by varying the transparency of data being displayed (higher transparency representing higher uncertainty), varying the shade of data being displayed, or by displaying an area of uncertainty for data being displayed.
- the 2D/3D data plot options also may include displaying data corresponding to different inversions along with inversion identifiers.
- the 2D/3D data plot options also may include wrapping plotted data that extends beyond map view boundaries.
- the 2D/3D data plot options also may include radar style plots to show the distance and direction between bed boundaries and the drill bit.
- storage medium 408 stores instructions that, when executed by processor 404, cause the processor 404 to display map views with map view features and/or options as described herein.
- the instructions, when executed by the processor 404 may further cause the processor 404 to enable or disable different map view features in response to a user request.
- the map view options 416 described herein display data based on inversion options 412 and corresponding uncertainty calculations 414 employed for the steering visualization software tool 410. Further, in some embodiments, the map view options 416 described herein are interactive and display additional formation information when interactive plotted data is selected by a user.
- the steering visualization software tool 410 includes a formation details module 418.
- the steering visualization software tool 410 also includes a suggestion system 420 to suggest steering actions based on predetermined criteria and the collected ahead of bit and/or around bit measurements.
- the suggestion system 420 may display steering suggestions as lines, arrow, or other direction indicators on a map view option 416 of the steering visualization software tool 410.
- the suggestion system 420 also may display an alarm in response to predetermined criteria (e.g., the distance to a nearest bed boundary being less than a threshold amount).
- FIGS. 5A-5U show various illustrative map view options for the steering visualization software tool 410.
- the various map view options of FIGS. 5A-5U may include color or symbol legends to help an operator interpret the displayed data.
- Some of the map view options ( see e.g., FIGS. 5A-5F , and 5L-5S ) provide easy to read 2D map views to facilitate steering decisions.
- FIGS. 5A-5F show real-time look-ahead or look-around measurements within the range of the logging tool, but do not show behind the bit data.
- map views similar to FIGS. 5A-5F may display behind the bit measurements or prior inversion information.
- FIGS. 5L-5S provide easy to read 2D map views of ahead of bit and behind bit measurements to show where the bit has been and where the bit is headed within a small range (e.g., the range of the logging tool).
- Other map view options see e.g., FIGS. 5G-5J , 5T, and 5U ) enable operators to view the drill path over a long distance to review steering strategies and subsurface formations.
- Other map view options see e.g., FIG. 5K ) enable an operator to view bed boundary details.
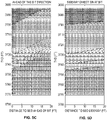
- FIG. 5A shows a 2D map view option that plots look-ahead distance to bed boundary as a function of true vertical depth (TVD), and that uses different colors to identify different formation resistivity values.
- color may be used to identify a resistivity value, an electromagnetic permeability value, or other formation parameters discernible by logging sensors/tools.
- the ahead of bit data represented for each TVD is in the direction of arrow 72 (see FIG. 3 ).
- distance 0 zero
- distance 0 corresponds to a reference point on or near the bit, where represented data is shown with respect to that reference point (up to 20 ft or another distance value within a logging tool's range) in the direction of arrow 72.
- three formation materials and two boundaries are ahead of the bit within 20 ft of the reference point in the direction of arrow 72. More specifically, at TVD 3730, a first formation material is between 0-10 ft ahead of the reference point, a second formation material is between 10-15 ft ahead of the bit, and a third formation material is between 15-20 ft ahead of the bit in the direction of arrow 72.
- Each of these bed boundaries is represented by a line, which corresponds to the relative dip of the tool with respect to the bed boundary (i.e., angle 80 discussed for FIG. 3 ). It should be understood that this angle may vary for different bed boundaries and for different TVDs.
- FIG. 5B shows a 2D map view option that plots "look-around” or “sideway” distance to the next bed boundary as a function of true vertical depth (TVD), and that uses different colors to identify different formation resistivity values.
- color may be used to identify a resistivity value, an electromagnetic permeability value, or other formation parameters discernible by logging sensors/tools.
- the sideway distance data represented for each TVD is in the direction of arrow 70 (see FIG. 3 ).
- distance 0 corresponds to a reference point on or near the bit, where represented data is shown with respect to that reference point (up to 20 ft or another distance value within a logging tool's range) in the direction of arrow 70.
- the bed boundary is represented by a line having an angle related to the dip angle (angle 80 in Fig. 3 ). It should be understood that this angle may vary for different bed boundaries and for different TVDs.
- FIG. 5C shows a 2D map view option that plots look-ahead distance to bed boundary as a function of true vertical depth (TVD), and that uses pattern density (i.e., a higher pattern density represents a higher resistivity value) to identify different formation resistivity values.
- pattern density i.e., a higher pattern density represents a higher resistivity value
- pattern density or specific patterns may be used to identify a resistivity value, an electromagnetic permeability value, or other formation parameters discernible by logging sensors/tools.
- the represented data of FIG. 5C is the same as the represented data of FIG. 5A , except that pattern density is used in FIG. 5C to identify different formation resistivity values instead of color.
- FIG. 5D shows a 2D map view option that plots look-around distance to bed boundary as a function of true vertical depth (TVD), and that uses pattern density to identify different formation resistivity values.
- pattern density or specific patterns may be used to identify a resistivity value, an electromagnetic permeability value, or other formation parameters discernible by logging sensors/tools.
- the represented data of FIG. 5D is the same as the represented data of FIG. 5B , except that pattern density is used in FIG. 5D to identify different formation resistivity values instead of color.
- FIG. 5E shows isotropic and anisotropic formation models, which may be employed in a given map view options.
- the anisotropic formation model is a scaled version of the isotropic formation model, which may correspond to a default pattern.
- different scaling may be applied in different directions, where each scaling corresponds to the formation property in that direction.
- the pattern itself may vary.
- FIG. 5E shows various illustrative patterns that may be suitable for showing anisotropy, including shape patterns, line/arrow patterns, and crosshatch patterns.
- FIG. 5F is similar to FIG. 5A and shows a 2D map view option that plots look-ahead distance to bed boundary as a function of true vertical depth (TVD), and that uses different colors to identify different formation resistivity values.
- the lines representing bed boundaries are straight and do not convey relative dip angle information. Instead, relative dip angle information is represented for each distinct TVD as an arrow with its tail at distance 0 (zero). Each arrow or other relative dip angle indicator represents the relative dip between the bit or reference point and the nearest bed boundary.
- the size, the position, and/or the relative dip angle indicator may vary. Further, a numeric value may be shown in addition to or instead of a shape-based indictor. Further, the relative dip angle information may be omitted for some TVDs.
- a 2D map view similar to FIG. 5B may be displayed, where bed boundary lines are straight and a sideway relative to dip angle indicator (i.e ., the 90 degree complement of dip angle 80 in FIG. 3 ) is shown for each TVD.
- a sideway relative to dip angle indicator i.e ., the 90 degree complement of dip angle 80 in FIG. 3
- the size, the position, and/or the sideway relative to dip angle indicator may vary.
- a numeric value may be shown in addition to or instead of a shape-based indictor. It should be understood that the angle value may vary for different bed boundaries and for different TVDs. Further, the sideway relative to dip angle indicator may be omitted for some TVDs.
- FIGS. 5A-5F illustrate 2D map views that display formation properties (e.g ., formation resistivity and/or electromagnetic permeability) in a single predetermined direction with respect to a reference point for the tool as a function of depth.
- the predetermined direction corresponds to an ahead of bit direction relative to the reference point.
- the predetermined direction corresponds to a sideways of bit direction relative to the reference point.
- a sloped line may be displayed in the map views of FIGS. 5A-5F to represent a bed boundary between two formation layers displayed for a depth value, where an angle of the sloped line corresponds to a relative dip angle indicator between the predetermined direction and the bed boundary.
- a straight line may be displayed in the map views of FIGS. 5A-5F to represent a bed boundary between two formation layers displayed for a depth value, where a relative dip angle indicator separate from the straight line is displayed for the depth value to represent an angle between the predetermined direction and the bed boundary.
- the relative dip angle indicator may be an arrow whose tail is at or near the reference point for the tool, where an angle of the arrow with respect to the reference point conveys relative dip angle information.
- a distinct relative dip angle indicator for each depth value with a bed boundary may be displayed in the map views of FIGS. 5A-5F .
- the map views of FIGS. 5A-5F may use color, where different colors represent different formation property values.
- the map views of FIGS. 5A-5F may use patterns to display formation properties, where different pattern densities represent different formation property values. Further, the pattern may be scaled in at least one direction relative to a default pattern to represent anisotropic formation property values.
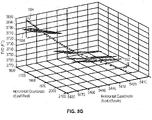
- FIG. 5G shows a 3D map view option that plots a drill path and bed boundaries, and that uses different colors, shapes, or patterns to identify different formation attribute values for the bed boundaries.
- a cube or other shape is positioned along the drill path at each TVD value, where the orientation of the cube or shape may correspond to the orientation of the tool.
- By plotting ahead of bit and/or around bit data at multiple TVDs along the well path a representation of bed boundaries within the logging tool range is displayed.
- the bed boundaries may be represented by color, shapes, prisms, or lines, where the displayed angle or inclination of the bed boundary corresponds to the dip of the boundary with respect to the perspective view provided by the 3D map view.
- tool object 504 along well path 502 may be associated with a formation property object 506, where the angle of tool object 504 represents the orientation of the tool and the angle of formation property object 506 represents the relative dip angle of nearest bed boundary ( i.e ., angle 80 discussed for FIG. 3 ).
- the relative dip angle may vary for different bed boundaries and for different TVDs.
- not every TVD will have an associated bed boundary shapes (if there are no bed boundaries within the range of the tool at a given TVD).
- some TVDs may be associated with multiple bed boundaries shapes (if there are multiple bed boundaries within the range of the tool at a given TVD).
- the 3D map view option of FIG. 5G includes a plurality of interactive points along the drill path that display, upon selection, additional information such as a distance to a nearest bed boundary, a relative dip angle to the nearest bed boundary, an azimuth angle for the nearest bed boundary, and/or other information.
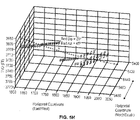
- FIG. 5H shows a rotated 3D map view option related to the 3D map view option of FIG. 5G .
- the rotated 3D map views as illustrated in FIG. 5H may facilitate viewing plotted data.
- the formation details may be displayed when a user selects a particular interactive point or passes over the interactive point with a cursor.
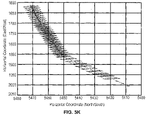
- FIGS. 5I-5J shows 2D map view options related to the 3D map view option of FIG. 5G . More specifically, FIG. 5I shows the drill path and bed boundaries plotted as a function of TVD and east/west horizontal coordinates, FIG. 5J shows the drill path and bed boundaries plotted as a function of TVD and north/south horizontal coordinates, and FIG. 5K shows bed boundaries objects plotted as a function of east/west horizontal coordinates and north/south horizontal coordinates. As in FIG. 5G , different colors or patterns may be used in FIGS. 5I-5J to identify different formation resistivity values for the bed boundaries. Also, the 2D map view options of FIGS.
- 5I-5J may include interactive points along the drill path that display formation parameters, upon selection, as described herein.
- the 2D/3D map view options of FIGS. 5G-5J may use different patterns, different pattern densities, and/or different pattern scaling to shows resistivity values as described herein.
- FIGS. 5G-5J illustrate 2D or 3D map views that display a drill path (e.g., path 502 in FIG. 5G ) with drill path objects (e.g., object 504) and bed boundary objects (e.g ., object 506 in FIG. 5G ) corresponding to various depth values along the drill path.
- each displayed bed boundary object marks part of a bed boundary.
- each displayed bed boundary object may convey formation property information such as resistivity or electromagnetic permeability.
- each displayed drill path object is located on or near the drill path and may convey tool orientation and/or formation property information along the drill path. For example, each bed boundary object or drill path object of FIGS.
- each bed boundary object may have a dip angle attribute to indicate a relative dip angle value for a bed boundary with respect to a reference point for the tool.
- each bed boundary object may have an azimuth angle attribute to indicate a relative azimuth for a bed boundary with respect to a reference point for the tool.
- each drill path object may have a dip angle attribute to indicate a relative dip angle value for the tool with respect to a reference point, and may have an azimuth angle attribute to indicate an azimuth angle value for the tool with respect to a reference point.
- the map views of FIGS. 5G-5J are rotatable in at least one direction. Further, the map views of FIGS. 5G-5J may support zoom in and zoom out features. Further, the map views of FIGS. 5G-5J may support selecting a bed boundary object or drill path object to display supplemental data related to the bed boundary object or drill path object.
- the supplemental drill path object data may include a numeric value for a tool dip angle relative to a reference point, a numeric value for a tool azimuth relative to a reference point, and a numeric value for formation resistivity or electromagnetic permeability at or near a selected drill path object.
- supplemental bed boundary object data may include a numeric value for a relative dip angle of a bed boundary, a numeric value for an azimuth angle between a tool orientation and a bed boundary, and a numeric value for formation resistivity or electromagnetic permeability at or near a bed boundary object.
- FIGS. 5L-5R show 2D map view options that plot distance to bed boundary lines as a function of vertical depth. The length of the distance to bed boundary lines corresponds to a scaled physical distance. Meanwhile, the angle of the distance to bed boundary lines (relative to the center line in FIGS. 5L-5R ) corresponds to a relative dip to the bed boundary at the vertical depth associated with each distance to bed boundary lines. It should be noted that the angle for the distance to bed boundary lines can be measured with respect to horizontal or vertical axis.
- FIG. 5L arrows are employed as the distance lines. Further, FIG. 5L shows, for several distance lines, formation details including relative dip to the nearest bed boundary (0), azimuth for the nearest bed boundary ( ⁇ ), and distance to the nearest bed boundary (d).
- an azimuth indicator e.g ., a circle with a line representing a degree
- the azimuth information is drawn as a line inside a circle, where the orientation of the line inside the circle represents the azimuth of the nearest bed boundary.
- an azimuth indicator for each distance line is shown along one side to show azimuth information for a bed boundary relative to a tool orientation.
- direction or distance to a bed boundary are defined with respect to a selected point of the bed boundary to a predetermined reference point of the tool.
- the selected point of the bed boundary can be the point with the shortest distance to the predetermined reference point of the tool.
- the depth of each azimuth indicator in FIG. 5N corresponds to the depth of its associated distance line.
- the distance lines are dashed and the azimuth indicators are simplified to be a line at the end of each distance line.
- strips are used to represent distance lines.
- the top three lines or strips have a higher transparency to convey a higher degree of uncertainty with respect to their values.
- color variations or shades e.g., a lighter shade represents more uncertainty
- FIG. 5Q shows two sets of distance lines.
- the first set of distance lines (dashed line arrows) is associated with a first inversion algorithm
- the second set of distance lines (solid line arrows) is associated with a second inversion algorithm.
- the two sets of distance lines vary slightly.
- the different inversions may correspond to two sets of logging data for the same region collected at different frequencies.
- Some LWD operators may favor the distance lines associated with the first inversion algorithm, while others favor the distance lines associated with the second inversion algorithm. Further, some operators may want to review the difference between the distance lines associated with two or more inversion algorithms.
- FIG. 5R shows distance lines with an area of uncertainty at the end of each distance line.
- the area of uncertainty is estimated using a noise injection operation that injects noise into a measurement plotting process and analyses the density of the result.
- a quality of inversion (Q f ) estimate may be displayed for each distance line.
- FIGS. 5L-5R illustrate 2D map views that display a separate distance to bed boundary indicator (e.g., distance lines) for each of a plurality of distinct depth values.
- the map views of FIGS. 5L-5R also may display a center line to represent a reference point for the tool as a function of depth.
- each distance to bed boundary indicator corresponds to an arrow extending between the center line and a bed boundary.
- each distance to bed boundary indicator corresponds to a strip extending at least between the center line and a nearest bed boundary. It should be understood that each arrow or strip may have a color or pattern to provide formation resistivity or electromagnetic permeability information.
- the map views of FIGS. 5L-5R may display an azimuth indicator for at least one of the distance to bed boundary indicators to represent an angle between a bed boundary azimuth and a tool reference point azimuth.
- the azimuth indicator may be displayed at or near a bed boundary related to a distance to nearest bed boundary indicator (e.g., at or near an arrow tip that ends at the bed boundary).
- the azimuth indicator may be displayed along a side of the map view at a depth corresponding to a related distance to bed boundary indicator.
- the azimuth indicator may be a radial line inside a circular shape to represent the angle between a bed boundary azimuth and a tool reference point azimuth.
- map views of FIGS. 5L-5R may display a bed boundary line for one or more distance to bed boundary indicators, where an angle of bed boundary line corresponds to a relative dip angle value with respect to a reference point for the tool. Further, in some embodiments, at least one of the displayed distance to bed boundary indicators is partially transparent to show a level of uncertainty as described herein.
- the map views of FIGS. 5L-5R are interactive and support selecting a distance to nearest bed boundary indicator to display supplemental data related to the distance to bed boundary indicator.
- the supplemental data may include a numeric value of a relative dip angle value between a tool orientation and the related bed boundary, a numeric value of relative azimuth angle value between a tool orientation and the related bed boundary, and/or a numeric value of a distance between a reference point for the tool and the related bed boundary.
- map views of FIGS. 5L-5R may display an area of uncertainty for at least one distance to bed boundary indicator, where the area of uncertainty corresponds to a range of possible values for the related distance to bed boundary indicator.
- the area of uncertainty may be an enclosed shape (e.g., a circle), where a related distance to bed boundary indicator points to a center of the shape.
- a map view (e.g., the map view of FIG. 5Q ) displays two sets of distance to bed boundary indicators corresponding to two different data sets collected by the tool.
- the different data sets may correspond to logging data sets captured using two different frequencies for a logging tool, or to logging data sets captured using two different types of logging tools.
- map views such as those shown in FIGS. 5L-5R may display multiple distance to bed boundary indicators extending from the same depth value. For example, multiple arrows are strips may extend from a single depth value to different bed boundaries. In such case, different arrow colors and/or patterns may be utilized to ensure different distance to bed boundary indicators are distinguishable. Further, it should be understood that even if multiple bed boundaries are within the measurement range of the tool, map views such as those shown in FIGS. 5L-5R may only show distance to bed boundary indicators for the nearest bed boundaries.
- FIG. 5S shows a radar map view option that plots look-ahead or look-around distance to a nearest bed boundary as a function of azimuth.
- the bit is displayed at the center of the radar map, and concentric circles are used to represent distance.
- resistivity colors/patterns, formation details, and algorithm information may be displayed as described herein.
- FIG. 5S illustrates a radar map view that displays a tool reference point and concentric circles around the tool reference point to represent distance from the tool reference point.
- the radar map view displays formation properties as a function of azimuth with respect to an axis for the tool.
- the radar map view of FIG. 5S may display an azimuth indicator relative to an azimuth reference point for the tool.
- the map view may display a cross-section view along the tool axis, where the cross-section angle is relative to an azimuth reference point for the tool. It should be understood that many different cross-section views are possible along the tool axis ( i.e., there is a range of 360 degrees), and thus different map views are possible.
- a radar map view may display a tool object extending from the tool reference point (at the center) to a top of the radar map view.
- a radar map view may display a tool object extending from the tool reference point to a side of the radar map view along an angle related to an orientation of the tool.
- the cross-section view along the tool axis, which is represented by the radar map view would be adjusted accordingly.
- the radar map view may be interactive and supports selecting a displayed formation property to display supplemental data.
- the supplemental data includes a numeric value of a relative dip angle value between a tool orientation and a bed boundary, a numeric value of relative azimuth angle value between a tool orientation and a bed boundary, and/or a numeric value of a distance between the tool reference point and a bed boundary.
- a radar map view displays an inversion algorithm indicator for each displayed formation layer. Such inversion algorithm indicators may provide information regarding the particular logging tool, frequency, and/or inversion technique related to the displayed formation layers.
- FIGS. 5T and 5U show wrapping map view options that plot a well path as a function of true vertical depth (TVD), and that wrap well path data or other data when map boundaries are exceeded.
- wrapping means making a mapping of coordinates such that the position of the shape will always be inside the drawing canvas.
- One particular type of wrapping moves the lines that exit the canvas from the right-hand side, to the left-hand side, and vice-versa.
- distance lines distance to nearest bed boundary indicators
- FIG. 5U bed boundary lines and vertical depth information are displayed.
- FIGS. 5T and 5U illustrates wrapping map views that display a drill path and bed boundaries as a function of depth and horizontal position, where the map view wraps the horizontal position of the displayed drill path to an opposite side of the map view when a horizontal length of the drill path exceeds a horizontal position range of the map view.
- a wrapping map view may display distance to nearest bed boundary indicators for each of a plurality of distinct depth values. Further, a wrapping map view may display a separate bed boundary line for each of the distance to nearest bed boundary indicators. Further, a wrapping map view may display a relative dip angle indicator for at least one of the distance to nearest bed boundary indicators.
- a wrapping map view may display a continuous line for each bed boundary. In such case, distance to nearest bed boundary indicators may be omitted. Further, some wrapping map view may display a vertical depth value for each bed boundary.
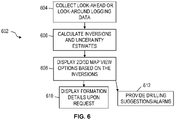
- FIG. 6 is a flowchart of an illustrative method 602 for an LWD system.
- the method 602 includes collecting look-ahead or look-around logging data (block 604).
- inversions and uncertainty estimates are calculated.
- 2D or 3D map view options are displayed based on the inversions.
- the map view options displayed at block 608 may correspond to any of the map view examples described in FIGS. 5A-5U , combinations thereof, or variations thereof. In some embodiments, different map views may be displayed at the same time.
- formation details are displayed at block 610.
- the formation details may refer to alphanumeric characters and values that appear upon selection of a line, shape, or interactive point in a displayed map view.
- drilling suggestions or alarms are provided.
- the drilling suggestions may correspond to lines or arrows in a map view to show a suggested drilling direction.
- an alarm may correspond to audio or visual indicator, and related values that triggered the alarm ( e.g ., being closer to a nearest bed boundary than a predetermined threshold).
- a drilling suggestion may or may not accompany an alarm.
- the method 602 is performed by a computer executing steering visualization software as described herein. With the information provided by the method 602, an LWD operator is able to select appropriate steering commands for a LWD tool.
- displaying a map view option at block 608 includes displaying a 2D map view showing formation properties in a single predetermined direction with respect to a reference point for the tool as a function of depth. Additionally or alternatively, displaying a map view option at block 608 includes displaying a 2D or 3D map view showing a drill path and at least one separate 2D or 3D drill path object for each of a plurality of distinct depth values along the drill path. Additionally or alternatively, displaying a map view option at block 608 includes displaying a 2D map view showing a separate distance to bed boundary indicator for each of a plurality of distinct depth values.
- displaying a map view option at block 608 includes displaying a radar map view showing a tool reference point and concentric circles around the tool reference point to represent distance from the tool reference point, where the radar map view displays formation property objects as a function of azimuth with respect to an axis for the tool.
- the formation property objects may be boundary lines and/or formation information such as resistivity or electromagnetic permeability.
- displaying a map view option at block 608 includes displaying a map view showing a drill path and bed boundaries as a function of depth and horizontal position, where the map view wraps the horizontal position of the displayed drill path to an opposite side of the map view when a horizontal length of the drill path exceeds a horizontal position range of the map view.
- map views may employ a resistivity scaling feature that scales a pattern to represent anisotropic formation property values.
- map views may employ different colors or patterns to identify different formation resistivity or permeability values.
- map views may employ interactive drill path objects and/or bed boundary objects, where selecting ( e.g ., by clicking or moving a cursor over an object) an object causes supplemental data to be displayed as described herein.
- displaying a map view option at block 608 includes showing uncertainty features that use transparency, areas of uncertainty, or different inversion data plots to show a level of uncertainty for plotted data.
- map view options are merely examples of useful map view embodied by the principles of the disclosure, which is not limited to any specific details of these embodiments.
- a person skilled in the art would, upon a careful consideration of the above description of representative embodiments of the disclosure, readily appreciate that many modifications, additions, substitutions, deletions, and other changes may be made to the specific embodiments while remaining within the scope of the claims.
Claims (19)
- Procédé comprenant :l'acquisition de données devant un trépan (14) ou autour d'un trépan (14) relatives à une formation (18) à partir de mesures par un outil (28, 440) ; etla génération d'une vue cartographique bidimensionnelle (2D) de la formation (18) à l'aide des données acquises, dans lequel la vue cartographique 2D affiche des propriétés de formation (18) dans une seule direction prédéterminée (70, 72) par rapport à un point de référence pour l'outil (28, 440) en fonction de la profondeur,dans lequel la vue cartographique comporte une ligne inclinée pour représenter une limite de strate (90A à 90E) entre deux couches de formation (18A à 18D) affichées pour une valeur de profondeur, et dans lequel un angle de la ligne inclinée correspond à un indicateur d'angle d'inclinaison relatif (80) entre la direction prédéterminée (70, 72) et ladite limite de strate (90A à 90E).
- Procédé comprenant :l'acquisition de données devant un trépan (14) ou autour d'un trépan (14) relatives à une formation (18) à partir de mesures par un outil (28, 440) ; etla génération d'une vue cartographique bidimensionnelle (2D) de la formation (18) à l'aide des données acquises, dans lequel la vue cartographique 2D affiche des propriétés de formation (18) dans une seule direction prédéterminée (70, 72) par rapport à un point de référence pour l'outil (28, 440) en fonction de la profondeur,dans lequel la vue cartographique comporte une ligne droite pour représenter une limite de strate (90A à 90E) entre deux couches de formation (18A à 18D) affichées pour une valeur de profondeur, et dans lequel un indicateur d'angle d'inclinaison relatif (80) séparé de la ligne droite est affiché pour que la valeur de profondeur représente un angle entre la direction prédéterminée (70, 72) et ladite limite de strate (90A à 90E).
- Procédé selon la revendication 1 ou 2, dans lequel la direction prédéterminée (70, 72) correspond soit à une direction (72) devant un trépan (14) par rapport au point de référence, soit à une direction (70) latérale au trépan (14) par rapport au point de référence.
- Procédé selon une quelconque revendication précédente, dans lequel la vue cartographique affiche la résistivité ou la perméabilité électromagnétique de la formation (18).
- Procédé selon une quelconque revendication précédente, dans lequel la vue cartographique comporte un indicateur d'angle d'inclinaison relatif (80) distinct pour chaque valeur de profondeur avec une limite de strate (90A à 90E) affichée.
- Procédé selon une quelconque revendication précédente, dans lequel la vue cartographique affiche une propriété de formation (18) à l'aide de la couleur, dans lequel différentes couleurs représentent différentes valeurs de propriété de formation (18), ou
dans lequel la vue cartographique affiche une propriété de formation (18) à l'aide d'un motif, dans lequel différentes densités de motif représentent différentes valeurs de propriété de formation (18), dans lequel, éventuellement, le motif est mis à l'échelle dans au moins une direction par rapport à un motif par défaut pour représenter des valeurs anisotropes. - Procédé comprenant :l'acquisition de données devant un trépan (14) ou autour d'un trépan (14) relatives à une formation à partir de mesures par un outil (28, 440) ; etla génération d'une vue cartographique bidimensionnelle (2D) ou tridimensionnelle (3D) de la formation (18) à l'aide des données acquises, dans lequel la vue cartographique 2D ou 3D affiche un tracé de forage (502) et un objet (504) de tracé de forage 2D ou 3D séparé pour chacune d'une pluralité de valeurs de profondeur distinctes le long du tracé de forage (502),dans lequel la vue cartographique affiche au moins un objet de limite de strate (506) 2D ou 3D pour chacune d'une pluralité de valeurs de profondeur distinctes le long du tracé de forage (502), et dans lequel au moins l'un des objets de limite de strate (506) affichés comporte un attribut d'orientation correspondant à un angle d'inclinaison relatif (80) pour une limite de strate (90A à 90E) par rapport à un point de référence pour l'outil (28, 440).
- Procédé selon la revendication 7, dans lequel au moins l'un des objets (504) de tracé de forage affichés comporte un attribut de couleur ou de motif pour transmettre des informations de résistivité ou de perméabilité électromagnétique de la formation (18).
- Procédé selon la revendication 7 ou 8, dans lequel au moins l'un des objets (504) de tracé de forage affichés comporte un attribut d'orientation correspondant à une orientation d'outil (28, 440).
- Procédé selon la revendication 7, 8 ou 9, dans lequel la vue cartographique permet la sélection d'un objet (504) de tracé de forage affiché pour afficher des données supplémentaires d'objet (504) de tracé de forage.
- Procédé selon l'une quelconque des revendications 7 à 10, dans lequel la vue cartographique est une vue cartographique 2D et prend en charge la sélection d'un indicateur de distance à la limite de strate (90A à 90E) pour afficher des données supplémentaires relatives à l'indicateur de distance à la limite de strate (90A à 90E).
- Procédé selon la revendication 11, dans lequel les données supplémentaires comportent au moins une valeur choisie dans le groupe constitué d'une valeur numérique d'un angle d'inclinaison relatif (80) entre une orientation d'outil (28, 440) et la limite de strate (90A à 90E), d'une valeur numérique d'angle d'azimut relatif (82) entre une orientation d'outil et la limite de strate (90A à 90E), et d'une valeur numérique d'une distance entre un point de référence pour l'outil (28, 440) et la limite de strate (90A à 90E).
- Dispositif de stockage lisible par ordinateur (408) sur lequel sont stockées des instructions qui, lorsqu'elles sont exécutées par un ou plusieurs processeurs (404) d'un ordinateur (402), amènent l'ordinateur (402) à mettre en œuvre des opérations, les opérations comprenant le procédé selon l'une quelconque des revendications 1 à 12.
- Dispositif de stockage lisible par ordinateur (408) selon la revendication 13, dans lequel les instructions, lorsqu'elles sont exécutées par un ou plusieurs processeurs (404) de l'ordinateur (402), amènent l'ordinateur (402) à basculer entre différentes vues cartographiques en réponse à une demande d'utilisateur.
- Dispositif de stockage lisible par ordinateur (408) selon la revendication 13 ou 14, dans lequel les instructions, lorsqu'elles sont exécutées par un ou plusieurs processeurs (404) de l'ordinateur (402), amènent l'ordinateur (402) à afficher plusieurs vues cartographiques en réponse à une demande d'utilisateur.
- Dispositif de stockage lisible par ordinateur (408)S selon la revendication 13, 14 ou 15, dans lequel les instructions, lorsqu'elles sont exécutées par un ou plusieurs processeurs (404) de l'ordinateur (402), amènent l'ordinateur (402) à activer ou à désactiver différentes fonctionnalités de vue cartographique en réponse à une demande d'utilisateur.
- Système comprenant :un ou plusieurs processeurs (404) ;une interface utilisateur pouvant fonctionner avec les un ou plusieurs processeurs (404) ; etun dispositif de stockage lisible par ordinateur (408) qui stocke un outil logiciel de visualisation de direction (410) qui, lorsqu'il est exécuté par les un ou plusieurs processeurs (404), amène le système à mettre en œuvre des opérations, les opérations comprenant le procédé selon l'une quelconque des revendications 1 à 12.
- Système selon la revendication 17, comportant en outre l'outil (28, 440) pour acquérir des données devant un trépan (14) ou autour d'un trépan (14).
- Système selon la revendication 17 ou 18, comportant en outre un dispositif d'entrée (406) pouvant fonctionner avec l'interface utilisateur, dans lequel le dispositif d'entrée fournit des entrées utilisateur pour l'outil logiciel de visualisation de direction (410) afin de basculer entre différentes vues cartographiques, d'afficher plusieurs vues cartographiques, d'activer différentes fonctionnalités de vue cartographique ou de désactiver différentes fonctionnalités de vue cartographique.
Applications Claiming Priority (1)
| Application Number | Priority Date | Filing Date | Title |
|---|---|---|---|
| PCT/US2013/045650 WO2014200491A1 (fr) | 2013-06-13 | 2013-06-13 | Procedes et systemes d'outil de visualisation de direction de diagraphie en cours de forage (lwd) |
Publications (3)
| Publication Number | Publication Date |
|---|---|
| EP2984506A1 EP2984506A1 (fr) | 2016-02-17 |
| EP2984506A4 EP2984506A4 (fr) | 2017-07-26 |
| EP2984506B1 true EP2984506B1 (fr) | 2022-07-20 |
Family
ID=52022621
Family Applications (1)
| Application Number | Title | Priority Date | Filing Date |
|---|---|---|---|
| EP13886830.2A Active EP2984506B1 (fr) | 2013-06-13 | 2013-06-13 | Procedes et systemes d'outil de visualisation de direction de diagraphie en cours de forage (lwd) |
Country Status (12)
| Country | Link |
|---|---|
| US (1) | US10197699B2 (fr) |
| EP (1) | EP2984506B1 (fr) |
| CN (1) | CN105229492B (fr) |
| AR (1) | AR096259A1 (fr) |
| AU (3) | AU2013392071B2 (fr) |
| BR (1) | BR112015027610A2 (fr) |
| CA (1) | CA2911648C (fr) |
| DE (1) | DE112013007153T5 (fr) |
| GB (1) | GB2529771B (fr) |
| MX (1) | MX367014B (fr) |
| RU (1) | RU2660218C2 (fr) |
| WO (1) | WO2014200491A1 (fr) |
Families Citing this family (10)
| Publication number | Priority date | Publication date | Assignee | Title |
|---|---|---|---|---|
| GB2529771B (en) | 2013-06-13 | 2020-09-02 | Halliburton Energy Services Inc | Logging while drilling (LWD) steering visualization tool methods and systems |
| WO2017058692A1 (fr) * | 2015-09-30 | 2017-04-06 | Schlumberger Technology Corporation | Procédés et systèmes pour analyser la détection de limite de lit |
| WO2017091667A1 (fr) * | 2015-11-25 | 2017-06-01 | Baker Hughes Incorporated | Système et procédé de cartographie de propriétés de réservoir à distance du puits |
| EP3356643B1 (fr) | 2015-12-31 | 2021-12-29 | Halliburton Energy Services, Inc. | Visualisation conjointe de résultat d'inversion et de journaux de mesure |
| MX2018013564A (es) * | 2016-05-08 | 2019-08-21 | Schlumberger Technology Bv | Métodos y sistemas que emplean inversión circundante y de anticipación de mediciones de fondo de pozo. |
| CN108828662B (zh) * | 2018-05-24 | 2020-04-07 | 深圳大学 | 一种地震震源反演可视分析方法、存储介质及服务器 |
| US11015432B2 (en) | 2018-07-10 | 2021-05-25 | Halliburton Energy Services, Inc. | Relative azimuth correction for resistivity inversion |
| US20210208302A1 (en) * | 2020-01-03 | 2021-07-08 | Halliburton Energy Services,Inc. | Visualization for look-ahead inversion |
| US11614558B2 (en) | 2020-10-15 | 2023-03-28 | Halliburton Energy Services, Inc. | Look ahead information for a geo-steering system |
| CN112731384A (zh) * | 2020-12-24 | 2021-04-30 | 南阳理工学院 | 钻孔地质探测系统及覆岩综合破断角、垮落形态实测方法 |
Family Cites Families (23)
| Publication number | Priority date | Publication date | Assignee | Title |
|---|---|---|---|---|
| US6088294A (en) | 1995-01-12 | 2000-07-11 | Baker Hughes Incorporated | Drilling system with an acoustic measurement-while-driving system for determining parameters of interest and controlling the drilling direction |
| US6885943B2 (en) * | 2002-09-20 | 2005-04-26 | Halliburton Energy Services, Inc. | Simultaneous resolution enhancement and dip correction of resistivity logs through nonlinear iterative deconvolution |
| US7557581B2 (en) | 2003-11-05 | 2009-07-07 | Shell Oil Company | Method for imaging subterranean formations |
| CA2455359C (fr) * | 2004-01-16 | 2013-01-08 | Geotango International Corp. | Systeme, programme informatique et methode applicables a la mesure et a la cartographie d'un objet tridimensionnel a partir d'une seule imagerie |
| US7027925B2 (en) * | 2004-04-01 | 2006-04-11 | Schlumberger Technology Corporation | Adaptive borehole assembly visualization in a three-dimensional scene |
| US8736270B2 (en) | 2004-07-14 | 2014-05-27 | Schlumberger Technology Corporation | Look ahead logging system |
| US7630872B2 (en) | 2004-09-16 | 2009-12-08 | Schlumberger Technology Corporation | Methods for visualizing distances between wellbore and formation boundaries |
| US7366616B2 (en) | 2006-01-13 | 2008-04-29 | Schlumberger Technology Corporation | Computer-based method for while-drilling modeling and visualization of layered subterranean earth formations |
| RU61441U1 (ru) * | 2006-10-24 | 2007-02-27 | Аркадий Львович Жизняков | Устройство фильтрации особенностей изображения на основе непрерывного вейвлет-преобразования |
| US7606666B2 (en) | 2007-01-29 | 2009-10-20 | Schlumberger Technology Corporation | System and method for performing oilfield drilling operations using visualization techniques |
| US8049508B2 (en) | 2007-03-16 | 2011-11-01 | Baker Hughes Incorporated | Method and apparatus for determining formation boundary near the bit for conductive mud |
| US9638022B2 (en) | 2007-03-27 | 2017-05-02 | Halliburton Energy Services, Inc. | Systems and methods for displaying logging data |
| US8582825B2 (en) * | 2007-06-07 | 2013-11-12 | Paradigm Geophysical Ltd. | Device and method for displaying full azimuth angle domain image data |
| BRPI0815932A2 (pt) * | 2007-08-27 | 2018-01-09 | Prad Research And Development Limited | sistema para uso em um poço, método para determinar a presença e posição de um ou mais contrastes de resistividade em uma formação à frente de um sistema de perfuração de poço, método para determinar uma propriedade de uma formação a diante de um sistema de perfuração de poço. |
| US8294467B2 (en) * | 2009-09-21 | 2012-10-23 | Schlumberger Technology Corporation | Imaging using directional resistivity measurements |
| US8433518B2 (en) * | 2009-10-05 | 2013-04-30 | Schlumberger Technology Corporation | Multilevel workflow method to extract resistivity anisotropy data from 3D induction measurements |
| EP2513422A4 (fr) * | 2009-10-20 | 2017-11-08 | Schlumberger Technology B.V. | Procédés pour caractériser des formations, parcourir des trajectoires de forage et mettre en place de puits dans des trous de forage terrestres |
| BR112012029805A2 (pt) * | 2010-05-24 | 2019-09-24 | Prad Research And Development Limited | método para perfurar um furo de poço próximo a uma estrutura de sal, e sistema para perfuração direcional próxima a uma estrutura de sal |
| EP2603821B1 (fr) * | 2010-08-16 | 2015-08-05 | Halliburton Energy Services, Inc. | Ensembles optimisés pour des applications de vision en avant du trépan |
| US9051825B2 (en) * | 2011-01-26 | 2015-06-09 | Schlumberger Technology Corporation | Visualizing fluid flow in subsurface reservoirs |
| BR112014011977A2 (pt) * | 2011-11-18 | 2017-05-30 | Halliburton Energy Services Inc | método para analisar uma formação subterrânea e sistema para analisar propriedades de formação |
| RU2635848C2 (ru) | 2013-02-05 | 2017-11-16 | Хэллибертон Энерджи Сервисиз, Инк. | Устройства и способы визуального отображения относящихся к пластам особенностей |
| GB2529771B (en) | 2013-06-13 | 2020-09-02 | Halliburton Energy Services Inc | Logging while drilling (LWD) steering visualization tool methods and systems |
-
2013
- 2013-06-13 GB GB1519522.5A patent/GB2529771B/en not_active Expired - Fee Related
- 2013-06-13 AU AU2013392071A patent/AU2013392071B2/en not_active Ceased
- 2013-06-13 MX MX2015015503A patent/MX367014B/es active IP Right Grant
- 2013-06-13 CN CN201380076606.7A patent/CN105229492B/zh not_active Expired - Fee Related
- 2013-06-13 DE DE112013007153.3T patent/DE112013007153T5/de not_active Withdrawn
- 2013-06-13 BR BR112015027610A patent/BR112015027610A2/pt not_active Application Discontinuation
- 2013-06-13 RU RU2015148612A patent/RU2660218C2/ru not_active IP Right Cessation
- 2013-06-13 CA CA2911648A patent/CA2911648C/fr active Active
- 2013-06-13 EP EP13886830.2A patent/EP2984506B1/fr active Active
- 2013-06-13 US US14/892,558 patent/US10197699B2/en active Active
- 2013-06-13 WO PCT/US2013/045650 patent/WO2014200491A1/fr active Application Filing
-
2014
- 2014-05-12 AR ARP140101907A patent/AR096259A1/es active IP Right Grant
-
2017
- 2017-06-14 AU AU2017204026A patent/AU2017204026B2/en not_active Ceased
-
2019
- 2019-12-12 AU AU2019280034A patent/AU2019280034B2/en active Active
Also Published As
| Publication number | Publication date |
|---|---|
| EP2984506A4 (fr) | 2017-07-26 |
| WO2014200491A1 (fr) | 2014-12-18 |
| US20160195633A1 (en) | 2016-07-07 |
| AU2017204026B2 (en) | 2019-09-12 |
| US10197699B2 (en) | 2019-02-05 |
| BR112015027610A2 (pt) | 2017-09-19 |
| AU2019280034A1 (en) | 2020-01-16 |
| AU2013392071A1 (en) | 2015-11-26 |
| MX2015015503A (es) | 2016-06-21 |
| CN105229492B (zh) | 2019-08-16 |
| AR096259A1 (es) | 2015-12-16 |
| AU2019280034B2 (en) | 2021-02-25 |
| GB2529771A (en) | 2016-03-02 |
| EP2984506A1 (fr) | 2016-02-17 |
| AU2017204026A1 (en) | 2017-07-06 |
| RU2015148612A (ru) | 2017-07-18 |
| CA2911648A1 (fr) | 2014-12-18 |
| RU2660218C2 (ru) | 2018-07-05 |
| MX367014B (es) | 2019-08-02 |
| AU2013392071B2 (en) | 2017-06-29 |
| GB2529771B (en) | 2020-09-02 |
| CA2911648C (fr) | 2020-04-14 |
| CN105229492A (zh) | 2016-01-06 |
| GB201519522D0 (en) | 2015-12-23 |
| DE112013007153T5 (de) | 2016-03-03 |
Similar Documents
| Publication | Publication Date | Title |
|---|---|---|
| AU2019280034B2 (en) | Logging while drilling (LWD) steering visualization tool methods and systems | |
| US7925483B2 (en) | Methods for visualizing distances between wellbore and formation boundaries | |
| AU2011382642B2 (en) | Geological monitoring console | |
| RU2635848C2 (ru) | Устройства и способы визуального отображения относящихся к пластам особенностей | |
| US10428642B2 (en) | Transposition of logs onto horizontal wells | |
| CA2888037C (fr) | Systeme, procede et produit programme d'ordinateur pour diagramme matriciel pour applications de pilotage geologique | |
| WO2009099825A1 (fr) | Système et procédé permettant l’affichage de données associées à des réservoirs souterrains | |
| CA3057831C (fr) | Systeme et procede d'evaluation d'une formation a l'aide d'une distribution statistique de donnees de formation | |
| US10598817B2 (en) | Local layer geometry engine with work zone generated from buffer defined relative to a wellbore trajectory | |
| NO20201179A1 (en) | Three dimensional visualization from point-by-point one dimensional inversion with bed azimuth | |
| US20210208302A1 (en) | Visualization for look-ahead inversion | |
| US10739485B2 (en) | Joint visualization of inversion results and measurement logs | |
| Pathak et al. | Successful geo-steering in complex reservoir lateral changes, dip uncertainties and low resistivity contrast with the help of distance to boundary measuring, forward modeling and imaging capabilities | |
| Bourgeois et al. | Enhanced Deep-Resistivity Measurement and High-Resolution Multilayer Inversions Improve Geosteering and Reservoir Mapping Performance Offshore UAE | |
| Bazara et al. | Ultra-Deep Directional Resistivity Measurements and The Way of Revealing Formation Tops Ahead of Time |
Legal Events
| Date | Code | Title | Description |
|---|---|---|---|
| PUAI | Public reference made under article 153(3) epc to a published international application that has entered the european phase |
Free format text: ORIGINAL CODE: 0009012 |
|
| STAA | Information on the status of an ep patent application or granted ep patent |
Free format text: STATUS: REQUEST FOR EXAMINATION WAS MADE |
|
| 17P | Request for examination filed |
Effective date: 20151110 |
|
| AK | Designated contracting states |
Kind code of ref document: A1 Designated state(s): AL AT BE BG CH CY CZ DE DK EE ES FI FR GB GR HR HU IE IS IT LI LT LU LV MC MK MT NL NO PL PT RO RS SE SI SK SM TR |
|
| AX | Request for extension of the european patent |
Extension state: BA ME |
|
| DAX | Request for extension of the european patent (deleted) | ||
| RIC1 | Information provided on ipc code assigned before grant |
Ipc: G01V 3/18 20060101AFI20170227BHEP Ipc: G01V 3/38 20060101ALI20170227BHEP |
|
| A4 | Supplementary search report drawn up and despatched |
Effective date: 20170622 |
|
| RIC1 | Information provided on ipc code assigned before grant |
Ipc: G01V 3/38 20060101ALI20170616BHEP Ipc: G01V 3/18 20060101AFI20170616BHEP |
|
| STAA | Information on the status of an ep patent application or granted ep patent |
Free format text: STATUS: EXAMINATION IS IN PROGRESS |
|
| 17Q | First examination report despatched |
Effective date: 20210415 |
|
| STAA | Information on the status of an ep patent application or granted ep patent |
Free format text: STATUS: EXAMINATION IS IN PROGRESS |
|
| GRAP | Despatch of communication of intention to grant a patent |
Free format text: ORIGINAL CODE: EPIDOSNIGR1 |
|
| STAA | Information on the status of an ep patent application or granted ep patent |
Free format text: STATUS: GRANT OF PATENT IS INTENDED |
|
| INTG | Intention to grant announced |
Effective date: 20220203 |
|
| GRAS | Grant fee paid |
Free format text: ORIGINAL CODE: EPIDOSNIGR3 |
|
| GRAA | (expected) grant |
Free format text: ORIGINAL CODE: 0009210 |
|
| STAA | Information on the status of an ep patent application or granted ep patent |
Free format text: STATUS: THE PATENT HAS BEEN GRANTED |
|
| AK | Designated contracting states |
Kind code of ref document: B1 Designated state(s): AL AT BE BG CH CY CZ DE DK EE ES FI FR GB GR HR HU IE IS IT LI LT LU LV MC MK MT NL NO PL PT RO RS SE SI SK SM TR |
|
| REG | Reference to a national code |
Ref country code: GB Ref legal event code: FG4D |
|
| REG | Reference to a national code |
Ref country code: CH Ref legal event code: EP |
|
| REG | Reference to a national code |
Ref country code: DE Ref legal event code: R096 Ref document number: 602013082126 Country of ref document: DE |
|
| REG | Reference to a national code |
Ref country code: AT Ref legal event code: REF Ref document number: 1505879 Country of ref document: AT Kind code of ref document: T Effective date: 20220815 |
|
| REG | Reference to a national code |
Ref country code: IE Ref legal event code: FG4D |
|
| REG | Reference to a national code |
Ref country code: NO Ref legal event code: T2 Effective date: 20220720 |
|
| REG | Reference to a national code |
Ref country code: LT Ref legal event code: MG9D |
|
| REG | Reference to a national code |
Ref country code: NL Ref legal event code: MP Effective date: 20220720 |
|
| PG25 | Lapsed in a contracting state [announced via postgrant information from national office to epo] |
Ref country code: SE Free format text: LAPSE BECAUSE OF FAILURE TO SUBMIT A TRANSLATION OF THE DESCRIPTION OR TO PAY THE FEE WITHIN THE PRESCRIBED TIME-LIMIT Effective date: 20220720 Ref country code: RS Free format text: LAPSE BECAUSE OF FAILURE TO SUBMIT A TRANSLATION OF THE DESCRIPTION OR TO PAY THE FEE WITHIN THE PRESCRIBED TIME-LIMIT Effective date: 20220720 Ref country code: PT Free format text: LAPSE BECAUSE OF FAILURE TO SUBMIT A TRANSLATION OF THE DESCRIPTION OR TO PAY THE FEE WITHIN THE PRESCRIBED TIME-LIMIT Effective date: 20221121 Ref country code: NL Free format text: LAPSE BECAUSE OF FAILURE TO SUBMIT A TRANSLATION OF THE DESCRIPTION OR TO PAY THE FEE WITHIN THE PRESCRIBED TIME-LIMIT Effective date: 20220720 Ref country code: LV Free format text: LAPSE BECAUSE OF FAILURE TO SUBMIT A TRANSLATION OF THE DESCRIPTION OR TO PAY THE FEE WITHIN THE PRESCRIBED TIME-LIMIT Effective date: 20220720 Ref country code: LT Free format text: LAPSE BECAUSE OF FAILURE TO SUBMIT A TRANSLATION OF THE DESCRIPTION OR TO PAY THE FEE WITHIN THE PRESCRIBED TIME-LIMIT Effective date: 20220720 Ref country code: FI Free format text: LAPSE BECAUSE OF FAILURE TO SUBMIT A TRANSLATION OF THE DESCRIPTION OR TO PAY THE FEE WITHIN THE PRESCRIBED TIME-LIMIT Effective date: 20220720 Ref country code: ES Free format text: LAPSE BECAUSE OF FAILURE TO SUBMIT A TRANSLATION OF THE DESCRIPTION OR TO PAY THE FEE WITHIN THE PRESCRIBED TIME-LIMIT Effective date: 20220720 |
|
| REG | Reference to a national code |
Ref country code: AT Ref legal event code: MK05 Ref document number: 1505879 Country of ref document: AT Kind code of ref document: T Effective date: 20220720 |
|
| PG25 | Lapsed in a contracting state [announced via postgrant information from national office to epo] |
Ref country code: PL Free format text: LAPSE BECAUSE OF FAILURE TO SUBMIT A TRANSLATION OF THE DESCRIPTION OR TO PAY THE FEE WITHIN THE PRESCRIBED TIME-LIMIT Effective date: 20220720 Ref country code: IS Free format text: LAPSE BECAUSE OF FAILURE TO SUBMIT A TRANSLATION OF THE DESCRIPTION OR TO PAY THE FEE WITHIN THE PRESCRIBED TIME-LIMIT Effective date: 20221120 Ref country code: HR Free format text: LAPSE BECAUSE OF FAILURE TO SUBMIT A TRANSLATION OF THE DESCRIPTION OR TO PAY THE FEE WITHIN THE PRESCRIBED TIME-LIMIT Effective date: 20220720 Ref country code: GR Free format text: LAPSE BECAUSE OF FAILURE TO SUBMIT A TRANSLATION OF THE DESCRIPTION OR TO PAY THE FEE WITHIN THE PRESCRIBED TIME-LIMIT Effective date: 20221021 |
|
| REG | Reference to a national code |
Ref country code: DE Ref legal event code: R097 Ref document number: 602013082126 Country of ref document: DE |
|
| PG25 | Lapsed in a contracting state [announced via postgrant information from national office to epo] |
Ref country code: SM Free format text: LAPSE BECAUSE OF FAILURE TO SUBMIT A TRANSLATION OF THE DESCRIPTION OR TO PAY THE FEE WITHIN THE PRESCRIBED TIME-LIMIT Effective date: 20220720 Ref country code: RO Free format text: LAPSE BECAUSE OF FAILURE TO SUBMIT A TRANSLATION OF THE DESCRIPTION OR TO PAY THE FEE WITHIN THE PRESCRIBED TIME-LIMIT Effective date: 20220720 Ref country code: DK Free format text: LAPSE BECAUSE OF FAILURE TO SUBMIT A TRANSLATION OF THE DESCRIPTION OR TO PAY THE FEE WITHIN THE PRESCRIBED TIME-LIMIT Effective date: 20220720 Ref country code: CZ Free format text: LAPSE BECAUSE OF FAILURE TO SUBMIT A TRANSLATION OF THE DESCRIPTION OR TO PAY THE FEE WITHIN THE PRESCRIBED TIME-LIMIT Effective date: 20220720 Ref country code: AT Free format text: LAPSE BECAUSE OF FAILURE TO SUBMIT A TRANSLATION OF THE DESCRIPTION OR TO PAY THE FEE WITHIN THE PRESCRIBED TIME-LIMIT Effective date: 20220720 |
|
| PLBE | No opposition filed within time limit |
Free format text: ORIGINAL CODE: 0009261 |
|
| STAA | Information on the status of an ep patent application or granted ep patent |
Free format text: STATUS: NO OPPOSITION FILED WITHIN TIME LIMIT |
|
| PG25 | Lapsed in a contracting state [announced via postgrant information from national office to epo] |
Ref country code: SK Free format text: LAPSE BECAUSE OF FAILURE TO SUBMIT A TRANSLATION OF THE DESCRIPTION OR TO PAY THE FEE WITHIN THE PRESCRIBED TIME-LIMIT Effective date: 20220720 Ref country code: EE Free format text: LAPSE BECAUSE OF FAILURE TO SUBMIT A TRANSLATION OF THE DESCRIPTION OR TO PAY THE FEE WITHIN THE PRESCRIBED TIME-LIMIT Effective date: 20220720 |
|
| 26N | No opposition filed |
Effective date: 20230421 |
|
| PG25 | Lapsed in a contracting state [announced via postgrant information from national office to epo] |
Ref country code: AL Free format text: LAPSE BECAUSE OF FAILURE TO SUBMIT A TRANSLATION OF THE DESCRIPTION OR TO PAY THE FEE WITHIN THE PRESCRIBED TIME-LIMIT Effective date: 20220720 |
|
| PGFP | Annual fee paid to national office [announced via postgrant information from national office to epo] |
Ref country code: NO Payment date: 20230525 Year of fee payment: 11 |
|
| PG25 | Lapsed in a contracting state [announced via postgrant information from national office to epo] |
Ref country code: SI Free format text: LAPSE BECAUSE OF FAILURE TO SUBMIT A TRANSLATION OF THE DESCRIPTION OR TO PAY THE FEE WITHIN THE PRESCRIBED TIME-LIMIT Effective date: 20220720 |
|
| PGFP | Annual fee paid to national office [announced via postgrant information from national office to epo] |
Ref country code: GB Payment date: 20230403 Year of fee payment: 11 |
|
| REG | Reference to a national code |
Ref country code: DE Ref legal event code: R119 Ref document number: 602013082126 Country of ref document: DE |
|
| PG25 | Lapsed in a contracting state [announced via postgrant information from national office to epo] |
Ref country code: MC Free format text: LAPSE BECAUSE OF FAILURE TO SUBMIT A TRANSLATION OF THE DESCRIPTION OR TO PAY THE FEE WITHIN THE PRESCRIBED TIME-LIMIT Effective date: 20220720 |
|
| PG25 | Lapsed in a contracting state [announced via postgrant information from national office to epo] |
Ref country code: MC Free format text: LAPSE BECAUSE OF FAILURE TO SUBMIT A TRANSLATION OF THE DESCRIPTION OR TO PAY THE FEE WITHIN THE PRESCRIBED TIME-LIMIT Effective date: 20220720 |
|
| REG | Reference to a national code |
Ref country code: CH Ref legal event code: PL |
|
| REG | Reference to a national code |
Ref country code: BE Ref legal event code: MM Effective date: 20230630 |
|
| PG25 | Lapsed in a contracting state [announced via postgrant information from national office to epo] |
Ref country code: LU Free format text: LAPSE BECAUSE OF NON-PAYMENT OF DUE FEES Effective date: 20230613 |
|
| REG | Reference to a national code |
Ref country code: IE Ref legal event code: MM4A |
|
| PG25 | Lapsed in a contracting state [announced via postgrant information from national office to epo] |
Ref country code: LU Free format text: LAPSE BECAUSE OF NON-PAYMENT OF DUE FEES Effective date: 20230613 |
|
| PG25 | Lapsed in a contracting state [announced via postgrant information from national office to epo] |
Ref country code: IE Free format text: LAPSE BECAUSE OF NON-PAYMENT OF DUE FEES Effective date: 20230613 |
|
| PG25 | Lapsed in a contracting state [announced via postgrant information from national office to epo] |
Ref country code: IE Free format text: LAPSE BECAUSE OF NON-PAYMENT OF DUE FEES Effective date: 20230613 Ref country code: DE Free format text: LAPSE BECAUSE OF NON-PAYMENT OF DUE FEES Effective date: 20240103 Ref country code: CH Free format text: LAPSE BECAUSE OF NON-PAYMENT OF DUE FEES Effective date: 20230630 |