EP2929773A1 - User interface performance graph for operation of a mobile machine - Google Patents
User interface performance graph for operation of a mobile machine Download PDFInfo
- Publication number
- EP2929773A1 EP2929773A1 EP15160067.3A EP15160067A EP2929773A1 EP 2929773 A1 EP2929773 A1 EP 2929773A1 EP 15160067 A EP15160067 A EP 15160067A EP 2929773 A1 EP2929773 A1 EP 2929773A1
- Authority
- EP
- European Patent Office
- Prior art keywords
- metric
- time continuous
- displaying
- continuous display
- display
- Prior art date
- Legal status (The legal status is an assumption and is not a legal conclusion. Google has not performed a legal analysis and makes no representation as to the accuracy of the status listed.)
- Granted
Links
- 230000009471 action Effects 0.000 claims description 27
- 238000000034 method Methods 0.000 claims description 17
- 230000003993 interaction Effects 0.000 claims description 9
- 230000004044 response Effects 0.000 claims description 6
- 238000004091 panning Methods 0.000 claims 1
- 235000013339 cereals Nutrition 0.000 description 33
- 238000010586 diagram Methods 0.000 description 14
- 230000007246 mechanism Effects 0.000 description 12
- 238000004891 communication Methods 0.000 description 11
- 239000000463 material Substances 0.000 description 11
- 230000008859 change Effects 0.000 description 10
- 238000004140 cleaning Methods 0.000 description 6
- 238000012545 processing Methods 0.000 description 6
- 230000000007 visual effect Effects 0.000 description 6
- 241000251169 Alopias vulpinus Species 0.000 description 5
- 230000003750 conditioning effect Effects 0.000 description 5
- 230000003287 optical effect Effects 0.000 description 5
- 210000003813 thumb Anatomy 0.000 description 5
- 230000006870 function Effects 0.000 description 3
- 230000002093 peripheral effect Effects 0.000 description 3
- 240000008042 Zea mays Species 0.000 description 2
- 235000005824 Zea mays ssp. parviglumis Nutrition 0.000 description 2
- 235000002017 Zea mays subsp mays Nutrition 0.000 description 2
- 238000004458 analytical method Methods 0.000 description 2
- 230000001413 cellular effect Effects 0.000 description 2
- 230000001143 conditioned effect Effects 0.000 description 2
- 238000010276 construction Methods 0.000 description 2
- 235000005822 corn Nutrition 0.000 description 2
- 230000003247 decreasing effect Effects 0.000 description 2
- 238000005516 engineering process Methods 0.000 description 2
- 238000003306 harvesting Methods 0.000 description 2
- 239000010903 husk Substances 0.000 description 2
- 239000010720 hydraulic oil Substances 0.000 description 2
- 230000006855 networking Effects 0.000 description 2
- 230000008569 process Effects 0.000 description 2
- 238000012549 training Methods 0.000 description 2
- 101000822695 Clostridium perfringens (strain 13 / Type A) Small, acid-soluble spore protein C1 Proteins 0.000 description 1
- 101000655262 Clostridium perfringens (strain 13 / Type A) Small, acid-soluble spore protein C2 Proteins 0.000 description 1
- 229920000742 Cotton Polymers 0.000 description 1
- 241000196324 Embryophyta Species 0.000 description 1
- 244000068988 Glycine max Species 0.000 description 1
- 235000010469 Glycine max Nutrition 0.000 description 1
- 101000655256 Paraclostridium bifermentans Small, acid-soluble spore protein alpha Proteins 0.000 description 1
- 101000655264 Paraclostridium bifermentans Small, acid-soluble spore protein beta Proteins 0.000 description 1
- 240000000111 Saccharum officinarum Species 0.000 description 1
- 235000007201 Saccharum officinarum Nutrition 0.000 description 1
- 241000209140 Triticum Species 0.000 description 1
- 235000021307 Triticum Nutrition 0.000 description 1
- 238000003491 array Methods 0.000 description 1
- 238000013528 artificial neural network Methods 0.000 description 1
- 230000003111 delayed effect Effects 0.000 description 1
- 230000000694 effects Effects 0.000 description 1
- 238000001914 filtration Methods 0.000 description 1
- 239000008187 granular material Substances 0.000 description 1
- 239000011344 liquid material Substances 0.000 description 1
- 238000005259 measurement Methods 0.000 description 1
- 230000005055 memory storage Effects 0.000 description 1
- 238000012544 monitoring process Methods 0.000 description 1
- 230000008447 perception Effects 0.000 description 1
- 238000013442 quality metrics Methods 0.000 description 1
- 238000009877 rendering Methods 0.000 description 1
- 230000035945 sensitivity Effects 0.000 description 1
- 238000005507 spraying Methods 0.000 description 1
- 238000012546 transfer Methods 0.000 description 1
- 230000007723 transport mechanism Effects 0.000 description 1
Images


Classifications
-
- A—HUMAN NECESSITIES
- A01—AGRICULTURE; FORESTRY; ANIMAL HUSBANDRY; HUNTING; TRAPPING; FISHING
- A01D—HARVESTING; MOWING
- A01D41/00—Combines, i.e. harvesters or mowers combined with threshing devices
- A01D41/12—Details of combines
- A01D41/127—Control or measuring arrangements specially adapted for combines
-
- G—PHYSICS
- G05—CONTROLLING; REGULATING
- G05B—CONTROL OR REGULATING SYSTEMS IN GENERAL; FUNCTIONAL ELEMENTS OF SUCH SYSTEMS; MONITORING OR TESTING ARRANGEMENTS FOR SUCH SYSTEMS OR ELEMENTS
- G05B19/00—Programme-control systems
- G05B19/02—Programme-control systems electric
- G05B19/04—Programme control other than numerical control, i.e. in sequence controllers or logic controllers
- G05B19/042—Programme control other than numerical control, i.e. in sequence controllers or logic controllers using digital processors
- G05B19/0421—Multiprocessor system
-
- B—PERFORMING OPERATIONS; TRANSPORTING
- B60—VEHICLES IN GENERAL
- B60W—CONJOINT CONTROL OF VEHICLE SUB-UNITS OF DIFFERENT TYPE OR DIFFERENT FUNCTION; CONTROL SYSTEMS SPECIALLY ADAPTED FOR HYBRID VEHICLES; ROAD VEHICLE DRIVE CONTROL SYSTEMS FOR PURPOSES NOT RELATED TO THE CONTROL OF A PARTICULAR SUB-UNIT
- B60W2300/00—Indexing codes relating to the type of vehicle
- B60W2300/15—Agricultural vehicles
- B60W2300/158—Harvesters
-
- G—PHYSICS
- G07—CHECKING-DEVICES
- G07C—TIME OR ATTENDANCE REGISTERS; REGISTERING OR INDICATING THE WORKING OF MACHINES; GENERATING RANDOM NUMBERS; VOTING OR LOTTERY APPARATUS; ARRANGEMENTS, SYSTEMS OR APPARATUS FOR CHECKING NOT PROVIDED FOR ELSEWHERE
- G07C5/00—Registering or indicating the working of vehicles
- G07C5/08—Registering or indicating performance data other than driving, working, idle, or waiting time, with or without registering driving, working, idle or waiting time
- G07C5/0816—Indicating performance data, e.g. occurrence of a malfunction
- G07C5/0825—Indicating performance data, e.g. occurrence of a malfunction using optical means
Definitions
- the present disclosure relates to mobile equipment. More specifically, the present disclosure relates to displaying performance metrics for an operator of a mobile machine.
- the sensors provide sensor signals that are fed back to a main control computer.
- the main control computer generates various displays that are indicative of the sensed variables. These displays can be provided in order to assist the operator in making adjustments in order to improve performance.
- a machine control system receives sensor signals indicative of sensed variables and calculates performance metrics based upon the sensed variables.
- the machine control system displays the performance metrics on a time continuous user interface display.
- FIG. 1 is a block diagram of one illustrative control system architecture 100.
- Architecture 100 illustratively includes mobile machine 102, and it can include an external machine 104.
- mobile machine 102 may be an agricultural machine, such as a combine, and no external machine 104 is used.
- machine 102 is a tractor and external machine 104 may be an attachment, or another machine that is towed behind the tractor. These are exemplary embodiments only.
- FIG. 1 shows that mobile machine 102 illustratively generates user interface displays 106 with user input mechanisms 108 that are provided for interaction by user (or operator) 110.
- the user interface displays 106 can illustratively include a time continuous display (such as a strip chart or another type of display) that displays measured or calculated values, or values determined in other ways, plotted along a timeline.
- Figure 1 also shows that mobile machine 102 can illustratively communicate with one or more remote systems 112.
- Remote systems 112 can include a wide variety of systems, and some examples of those are described below with respect to Figure 4 .
- mobile machine 102 illustratively includes processor 114, user interface component 116, display device 118, communication component 120, sensor conditioning components 122, on-board sensors 124, control components 126 and controlled systems 128. It can include other components 129 as well.
- User interface component 116 can, either by itself or under the control of another item in machine 102, generate user interface displays 106 for display on display device 118.
- On-board sensors 124 sense a variety of variables and provide sensor signals to sensor conditioning components 122.
- Sensor conditioning components 122 can perform compensation, linearization, filtering, or other calibration and conditioning operations on the sensor signals.
- Control components 126 illustratively receive the sensor signals, after they are conditioned, and generate control signals to control various aspects of mobile machine 102, or external machine 104, based upon the sensed variables.
- the control signals are provided to various controlled systems 128 that are controlled based upon the sensor signals.
- the controlled systems can be electrical systems, mechanical systems, hydraulic systems, pneumatic systems, air-over-hydraulic systems, or other systems.
- the sensor signals and control signals can also be provided to user interface component 116 which uses them to generate the time continuous user interface display 106.
- FIG. 1 shows that external machine 104 can also include a variety of different external sensors 130 which sense variables and provide sensor signals (after they are conditioned) to external control components 132.
- Control components 132 generate control signals for controlling external controlled systems on external machine 104.
- the external controlled systems are indicated by block 134 in Figure 1 .
- the sensor signals and control signals can also be provided to user interface component 116 on machine 102, where they are used to generate the time continuous display.
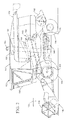
- FIG. 2 shows one pictorial illustration in which mobile machine 102 is a combine.
- combine 102 illustratively includes an operator's compartment 136, a header 138, a cutter generally indicated at 140, a thresher generally indicated at 142, a set of ground engaging wheels 144, a separator 146, a spreader 148, an elevator 150, a clean grain tank 152 and a spout 154.
- combine 102 illustratively travels in the direction generally indicated by arrow 156.
- Header 138 engages the product being harvested and gathers it toward cutter 140. After it is cut, it is moved toward thresher 142 where it is threshed, and then moved to separator 143.
- the grain falls to cleaning shoe 146 and the clean grain is moved by elevator 150 into clean grain tank 152. Tailings can be passed back to thresher 142 where they are re-threshed. Material other than grain (such as stalks, husks, etc.) are chopped and removed from machine 102 by spreader 148.
- FIG. 2 also shows that, in one embodiment, combine 102 includes a ground speed sensor 158, one or more cleaning shoe loss sensors 160, one or more separator loss sensors 162, a yield monitor sensor 164, a clean grain camera 166 and a tailings camera 168.
- Ground speed sensor 158 illustratively senses the travel speed of combine 102 over the ground. This can be done by sensing the speed of rotation of the wheels, the drive shaft, the axle, or other components. The travel speed can also be sensed by a position sensing system, such as a global positioning system (GPS), a dead reckoning system, a LORAN system, or a wide variety of other systems or sensors that provide an indication of travel speed.
- GPS global positioning system
- dead reckoning system a dead reckoning system
- LORAN LORAN system
- Cleaning shoe loss sensors 160 illustratively provide an output signal indicative of the quantity of grain lost by both the right and left cleaning shoes.
- sensors 160 are strike sensors which count grain strikes per unit of time to provide an indication of the cleaning shoe grain loss.
- Separator loss sensors 162 provide a signal indicative of grain loss in the left and right separators 143. This can be done by a wide variety of different types of sensors as well.
- Yield monitor sensor 164 is a sensor that senses yield. In one embodiment, it can sense mass flow through elevator 150. It provides an output signal indicative of this, to indicate the particular yield. This can be measured in bushels per hour, bushels per acre, or in other ways.
- Tailings camera 168 illustratively generates a video image of the tailings that are being passed back to the thresher for re-threshing.
- Clean grain camera 166 provides a video image indicative of the quality of the grain being deposited in clean grain tank 152.
- FIG 3 is a block diagram of the control system architecture 100, shown in Figure 1 , but implemented using the components described with respect to combine 102 shown in Figure 2 . While architecture 100 can be disposed on any mobile machine, it is described in the context of a combine for the sake of example only.
- the on-board sensors 124 illustratively include ground speed sensor 158, cleaning shoe loss sensors 160, separator loss sensors 162, yield monitor sensor 164 and cameras 166 and 168.
- an image processing system 167 comprises one of the sensor conditioning components 122. It receives the video signals from cameras 166 and 168 and processes them to generate output signals indicative of various parameters or performance metrics.
- system 167 illustratively includes a material other than grain (MOG) identifier 176, a broken grain identifier 178 and an un-threshed product identifier 180.
- MOG identifier 176 Based upon the video signal from camera 166 in the clean grain tank 152, MOG identifier 176 generates an output signal indicative of a quantity (or percent or other measure) of material other than grain (such as cobs, husks, stalks, chaff, etc.) that is entering clean grain tank 172.
- Broken grain identifier 178 processes the video signal from camera 166 and identifies a quantity (or percent or other measure) of broken grain entering clean grain tank 152.
- Un-threshed product identifier 180 illustratively receives the video signal from tailings camera 168 and generates an output signal indicative of a quantity (or a percent or other measure) of un-threshed product that is being sent by the tailings elevator back to the thresher, for re-threshing.
- Control components 126 illustratively include an engine control unit 169 that has an expert control system 170 deployed thereon.
- engine control unit 169 receives the sensor signals and determines metric values for a plurality of different metrics based on the sensor signals. The metric values can be calculated, retrieved from memory or determined in other ways. It also illustratively uses expert control system 170, which can be a neural network, a rules-based system, or another type of expert system that can generate control signals 172. The control signals 172 can be output to the various controlled systems. The control signals 172 and the metric values can be output by system 169 to generate the time continuous user interface display, such as display 174 shown in Figure 3 .
- expert control system 170 can generate not only the control signals 172, but it also generates recommendations that can be displayed to the user or operator.
- the recommendations can direct the operator to change the settings on the sieves, chaffers, concaves, fan/rotor, or other items on combine 102.
- expert control system 170 can generate the control signals, to automatically change or otherwise modify those settings.
- time continuous display 174 also indicates when recommendations were made to the operator, what those recommendations were, and when changes were made to the machine (either automatically or by the operator) and what those particular changes were.
- Figure 4 is a flow diagram illustrating one embodiment of the operation of the system shown in Figure 3 in generating the time continuous display 174.
- Figures 5 and 6 show two different embodiments of the time continuous display.
- Figures 3-6 will now be described in conjunction with one another.
- Machine 102 first receives operator inputs to begin operation of the machine. This is indicated by block 182. This can be done in a variety of different ways. For instance, the operator can provide initial machine settings based on recommendations from expert control system 170. Alternatively, the operator can input these settings based upon his or her own prior experience and knowledge. The settings can be made manually, such as through mechanical or other user input mechanisms, or they can be made automatically by the machine itself, or they can be input in a different way, such as through a touch screen or other user input mechanism. Receiving initial operator settings is indicated by block 184. The operator then provides a start input indicating that the operator wishes to start operation of machine 102. This is indicated by block 186. The operator can of course provide other inputs as well, and this is indicated by block 188.
- control system 169 receives the inputs from the various sensors. This is indicated by block 190 in Figure 4 . Control system 169 then determines the various performance metric values that are derived from the sensor signals and generates the time continuous display of those performance metrics. This is indicated by block 192.
- the performance metrics include one or more productivity metrics 194, one or more quality metrics 196, one or more loss metrics 198, and they can include other metrics 200 as well.
- the operator illustratively provides a calibration input. This is indicated by block 202.
- the operator can illustratively actuate a calibration user input mechanism on the time continuous display, or the operator can provide this input using other user input mechanisms as well.
- control system 169 calculates a threshold value for the performance metrics that can be displayed.
- the threshold value is represented by a performance window.
- the control system 169 identifies that the operator believes that the performance metrics are currently adequate, based on the calibration input. Therefore, system 169 may calculate a window around a current value for each of the performance metrics. The corresponding performance metric can vary within the range of its window, without causing system 169 to alert the operator that the metric is outside of a given range defined by the window.
- the performance window around each performance metric can be calculated in a wide variety of different ways. In one embodiment, it can be set empirically, based upon the operator's previous operation of machine 102. In another embodiment, it can be a predefined window that is set around each performance metric. In yet another embodiment, it can be set heuristically, and it can even vary based upon context. For instance, if the machine is a combine that is harvesting corn, the windows may be set to one level. If it is harvesting soybeans or wheat, they may be set to different levels. The size of the windows can vary by performance metric, or they can all be set the same. Setting the performance window for the performance metrics is indicated by block 204 in Figure 4 .
- Control system 169 then continues to receive the sensor signals and generate the time continuous display, as machine 102 is being operated. This is indicated by block 206 in Figure 4 .
- Figure 5 shows one embodiment of a time continuous display 174.
- the performance metrics for which the time continuous display 174 is generated include shoe loss, separator loss, MOG, broken grain, un-threshed product, yield and ground speed.
- Each of the performance metrics has an associated strip chart. For instance, shoe loss is displayed by strip chart 208. Separator loss is displayed by strip chart 210. MOG is displayed by strip chart 212. Broken grain is displayed by strip chart 214. Un-threshed product is displayed by strip chart 216. Yield is displayed by strip chart 218, and ground speed is displayed by strip chart 220.
- Each strip chart indicates a relative value of the corresponding performance metric along a timeline 222. It can be seen in the embodiment shown in Figure 5 that the timeline extends from a current position (indicated by the numeral 0), to a position one hour in the past (indicated by 60 minutes). Thus, each strip chart 208-220 shows how the value of the corresponding performance metric varied over time.
- the time continuous displays for each performance metric are generated in quasi-real time. This means that, as the metric values are calculated, looked up, or otherwise determined based on the sensor signals, they are displayed without delay, other than the processing delay occurred in determining and rendering the values.
- the time continuous display can be generated from memory or otherwise as well and need not be quasi-real time. That is just one embodiment.
- Figure 5 also shows that a number of performance metrics have the calculated performance window displayed as well.
- the performance windows for each displayed metric are indicated by the horizontal dashed lines.
- system 169 indicates that, so long as the displayed performance metric varies within its corresponding performance window, the performance is adequate. If a performance metric deviates from its performance window, then system 169 can illustratively take action or make suggestions.
- Display 174 also illustratively includes vertical lines 224 and 226. Each of the vertical lines marks a spot on the timeline 222 where an adjustment to the settings of machine 102 was made. For instance, at 45 minutes in the past, the rotor or fan speed was increased by 20 rpms. At 12 minutes in the past, the rotor or fan speed was decreased by 10 rpms.
- display 174 not only includes a time continuous display of various performance metrics, but it also shows a performance window and it marks when adjustments were made to the settings of machine 102, and what those adjustment were. The operator can then easily learn how the adjustments affect the performance metrics.
- Figure 6 shows another embodiment of a time continuous display 228.
- Display 228 is broken into two sections. The first being a productivity display section 230, and the second being a quality display section 232. Therefore, as one example, the display in Figure 6 may be generated instead of that shown in Figure 5 , when the user wishes to see the displayed metrics grouped into different sections.
- the productivity display section 230 displays performance metrics related to productivity. It includes a yield graph display 236 that shows the yield, for example, in bar graph form, plotted along time axis 234. The yield is calculated at a plurality of discrete points in time and plotted along time axis 234.
- Productivity section 230 also includes strip chart 238 corresponding to separator loss, strip chart 240 corresponding to shoe loss, and strip chart 242 corresponding to tailings loss.
- Each of the performance metrics (separator loss, shoe loss and tailings loss) displayed in section 230 includes a corresponding indicator light 244, 246, and 248, respectively. These time continuous displays could also be in histogram form as well, such as by plotting a frequency of grain strikes per unit time.
- the corresponding indicator light can change color, blink or otherwise provide a visual indication that the performance has deviated.
- the user interface component 116 can generate other user interface alerts as well, such as audible or haptic alerts, etc.
- quality display section 232 also includes three strip charts that indicate performance metric values for performance metrics related to quality.
- Strip chart 252 corresponds to broken grain.
- Strip chart 254 corresponds to foreign material in the clean grain tank, and strip chart 256 corresponds to un-threshed product in the tailings.
- the quality performance window corresponding to each of the quality performance metrics is indicated by dashed lines 258.
- the performance metrics in section 232 each have a corresponding indicator light 260, 262 and 264, respectively.
- the indicator light 260-264 can change color, blink, or otherwise visually indicate the deviation.
- display 228 can also include a set of vertically oriented sections 266 and 268. They show when the settings for machine 102 were changed, and what those changes were. For instance, section 266 indicates that the rotor speed was decreased by 10 rpms. Section 268 indicates that the blower speed was increased by 100 rpms. These are exemplary changes only.
- Display 228 can also include a plurality of zoom buttons 270 and 272.
- the buttons When the buttons are actuated, they change the time scale displayed on timeline 234. For instance, when the user presses the "zoom in” button 270, the time scale on timeline 234 changes so that timeline 234 shows fewer minutes.
- the time scale on timeline 234 is changed so that timeline 234 displays more minutes.
- Figure 6 also illustratively shows a thumb 269.
- the user can illustratively drag the thumb 269 backward in time, along timeline 234, to scroll to various periods in the history on timeline 234.
- system 169 generates the time continuous display (such as one of those shown in Figures 5 and 6 or another display). So long as none of the performance metrics deviate outside of the corresponding performance window, and so long as the operator does not make any changes, this operation continues. This is indicated by block 276 in Figure 4 .
- the action signal can generate one or more of a variety of different actions.
- the action signal can generate an indicator on the time continuous display. For instance, it can turn on one of the indicator lights, flash a display element, generate an audible sound or otherwise generate an indicator indicating that the performance metric has deviated from the performance window.
- it may be that the list of performance metrics is too long to have them all displayed on a single display.
- the action signal may cause it to be moved onto the current display and generate the corresponding indicator as well. Having the action signal generate an effect on the display is indicated by block 280.
- the action signal can cause expert system 170 to determine and display recommendations to the operator for changing the settings of machine 102. For instance, it may suggest that the operator change the rotor speed, the concave or sieve settings, the chopper settings, etc. Determining and displaying recommendations is indicated by block 282.
- expert control system 170 generates the control signals 172 in response to the action signal, and automatically provides the control signals 172 to the controlled systems to make automatic adjustments to the settings on machine 102.
- system 170 can provide a display indicating that the adjustments are about to be made. If desired, the operator can be provided with an option to override the automatic adjustments. For instance, if the field or crop conditions have changed, and system 170 is about to make adjustments, but the operator can visually perceive that the changes in conditions will last for only a very short time, then the operator can override the adjustments. Making the automatic adjustments, is indicated by block 284.
- the system 169 can provide an action signal for other actions as well. This is indicated by block 286.
- Control system 169 determines whether the actions were taken (either manually or automatically). This is indicated by block 288 in Figure 4 . If they were taken, then system 169 outputs a display element, for example vertical line 224 of Figure 5 , on the time continuous display to mark the time when the action was taken, and to identify the action. This is indicated by block 290 in Figure 4 .
- system 169 can store the data that was used to generate the time continuous display, so that it can be replayed or otherwise analyzed. Storing the data is indicated by block 291 in Figure 4 .
- system 169 can also send the data to a remote location. This is indicated by block 292.
- the data can be sent, as it is generated, to a farm manager 294 who is monitoring the operator and machine 102.
- information can be sent to a remote analysis system 296 where it is analyzed for ways to improve either the operator's training, or the performance of machine 102, or for other reasons. It can also be sent to an agronomist 298, to an equipment manufacturer 300, to various vendors 302, or to other remote locations 304.
- control reverts back to block 206 in Figure 4 where the time continuous display is generated based on the sensor signals. At some point, the operator will terminate operation of machine 102. This is indicated by block 306 in Figure 4 .
- Figure 7 is a flow diagram illustrating one embodiment of the operation of system 169, in greater detail, when the operator interacts with the time continuous display.
- Figures 8 and 9 are exemplary user interface displays. Figures 7-9 will now be described in conjunction with one another.
- system 169 is receiving the sensor signals and generating the time continuous display. This is indicated by block 308 in Figure 7 .
- System 169 then receives a user interaction input interacting with one or more of the various user input mechanisms on the time continuous display. This is indicated by block 310.
- the interactions can take a wide variety of different forms.
- the user may provide a drill-down input indicating that the user wishes system 169 to show a more detailed display of some portion of the time continuous display. This is indicated by block 312 in Figure 7 .
- Figure 8 shows one embodiment of a user interface display 314 that can be generated by system 169 when the user drills down into the quality display section 232 shown in Figure 6 .
- User interface display 314 shows that more detailed information is now displayed with respect to the quality performance metrics. For instance, the broken grain strip chart 252 and the un-threshed strip chart 256 are displayed in more detailed fashion so that the timeline 316 only stretches between a current value and five minutes in the past.
- the user can touch a portion of the strip chart at a given spot and see any five minute period around that spot in greater detail.
- strip charts 252 and 256 show a more fine-grained variation of the corresponding performance metrics.
- Display 314 also shows that the foreign material strip chart 254 has now been broken into two separate strip charts 318 and 320.
- Strip chart 318 is indicative of light material other than grain that is entering the clean grain tank 152. This may include such items such as chaff or other relatively light, non-grain materials.
- Strip chart 320 is indicative of material other than grain that is relatively heavy, such as corn cobs, stalks, etc.
- display 314 displays more detailed information corresponding to the quality performance metrics than display 228 shown in Figure 6 .
- display 314 illustratively includes a visual image displayed in visual image display section 322.
- section 322 shows an image generated by quality camera 166 ( Figure 3 ). The user can thus visually perceive the material entering the clean grain tank to determine whether the quality is acceptable.
- display 314 also includes a pair of camera actuators 324 and 326. It can be seen that camera actuator 324 has been selected so that the live camera is camera 166. Thus the user is viewing the image generated by camera 166 in the clean grain tank 152. If the user actuates camera button 326, then the live camera switches so that the video display is from tailings camera 168.
- Figure 9 shows a user interface display 328 that displays more detailed information that can be generated when the user actuates the productivity display section 230 on user interface display 228 of Figure 6 . It can be seen in Figure 9 that the strip charts 238, 240 and 242 are shown in greater detail (e.g., the timeline is zoomed in more) in Figure 9 than they are in Figure 6 . Also, visual image display section 330 displays the video image generated by tailings camera 168.
- the user can continue to drill down for more detailed information by providing a drill down input on either of the displays shown in Figures 8 and 9 .
- a drill down input For example, if the user actuates the shoe loss strip chart 240 in Figure 9 , then system 169 generates a display that shows strip charts for both the left and right shoes, instead of the combined strip chart 240 that combines the performance metric for both shoes.
- Other drill down actuations can be performed to see other detailed information as well.
- each of the various strip charts or display elements on the time continuous display can be displayed in various units.
- the user can illustratively actuate a user input mechanism to change the units of the displayed element. For instance, in the user interface display of Figure 6 , if the user actuates the productivity display 236, it toggles between displaying productivity in bushels per hour and bushels per acre or hectare. Toggling through various displays is indicated by block 332 in Figure 7 .
- the user can also illustratively actuate user input mechanisms (such as “zoom in” and “zoom out” buttons 270 and 272 shown in Figure 6 ) to change the time scale on the timeline. This is indicated by block 334.
- user input mechanisms such as “zoom in” and “zoom out” buttons 270 and 272 shown in Figure 6 .
- the user can illustratively drag thumb 269 to pan horizontally along the timeline. This is indicated by block 336.
- the time continuous display displays only a subset of the performance metrics that are actually calculated. Therefore, in such an embodiment, the user can illustratively scroll the display vertically to see time continuous display elements corresponding to other performance metrics.
- the user can illustratively scroll the display vertically to see time continuous display elements corresponding to other performance metrics.
- system 169 calculates additional performance metrics. By scrolling vertically, the user can see the display for those performance metrics as well. Scrolling vertically to see other performance metrics is indicated by block 338 in Figure 7 .
- the user can actuate the different camera buttons 324 and 326 to see the visual images generated by the corresponding cameras. This is indicated by block 340.
- the user can also illustratively interact with the time continuous displays in other ways. This is indicated by block 342.
- the time continuous display displays performance metrics along a timeline, and it can also indicate when adjustments to the machine are recommended or made, or both. This allows the user to better understand how changes to the machine settings affect the performance of machine 102.
- the user can also interact with the display to perform various operations, and the data used to generate the display can be stored or sent to a remote site for later analysis or for other reasons.
- the data used to generate the display can be sent to a remote site where the display is generated in quasi-real time, or in an asynchronous, time delayed manner. This can be done on any computing system.
- the displays can be stored and re-played at the remote site, when desired.
- mobile machine 102 can be a tractor, a cotton harvester, a sugarcane harvester, a seeder, or a variety of other agricultural, construction, turf or forestry machines.
- the sensors 124 can sense the seed population (e.g., the number of seeds planted per linear measurement, per acre, etc.).
- the time continuous display illustratively provides a quasi-real time display indicating how the seed population varies over time. Adjustments to the machine settings that can be automatically made, or suggested, to modify the seed population (or the variations in seed population).
- a fan in a planter creates a vacuum that pulls seeds through a tube to the ends of the planter.
- the hydraulic oil temperature in the planter can vary.
- the fan speed that creates the vacuum that pulls the seeds out to the end of the planter can vary as well. This can affect the seed population.
- the time continuous display of seed population can indicate whether the planter is skipping areas or is planting seeds too close together, too far apart or whether the population is simply varying too much.
- the recommended actions or automatic adjustments can be those which would stabilize hydraulic oil temperature, and thus fan speed.
- the sensors 124 can sense the flow of the sprayed material to the spraying nozzles, and onto the field or plant.
- the time continuous display can thus identify whether the sprayed material is flowing at a consistent rate or whether it is varying.
- some relatively large sprayers can be 90-120 feet wide (or more).
- a controller controls mechanical actuators to manage the vertical position of the booms on the sprayer as well as the left-to-right tilt of those booms.
- sensors 124 can sense fluctuations in the mechanical actuators and this can be displayed on the time continuous display. If the time continuous display shows that the vertical position of the booms is varying relatively frequently, this may indicate that the controller is not maintaining the booms at a uniform height over the field. This can also indicate that the controller should be tuned by the operator.
- a user input mechanism is provided so that the user can change the sensitivity of the controller so that the vertical boom position does not change so frequently.
- processors and servers include computer processors with associated memory and timing circuitry, not separately shown. They are functional parts of the systems or devices to which they belong and are activated by, and facilitate the functionality of the other components or items in those systems.
- the user actuatable input mechanisms can be text boxes, check boxes, icons, links, drop-down menus, search boxes, etc. They can also be actuated in a wide variety of different ways. For instance, they can be actuated using a point and click device (such as a track ball or mouse). They can be actuated using hardware buttons, switches, a joystick or keyboard, thumb switches or thumb pads, etc. They can also be actuated using a virtual keyboard or other virtual actuators. In addition, where the screen on which they are displayed is a touch sensitive screen, they can be actuated using touch gestures. Also, where the device that displays them has speech recognition components, they can be actuated using speech commands.
- a number of data stores have also been discussed. It will be noted they can each be broken into multiple data stores. All can be local to the systems accessing them, all can be remote, or some can be local while others are remote. All of these configurations are contemplated herein.
- the figures show a number of blocks with functionality ascribed to each block. It will be noted that fewer blocks can be used so the functionality is performed by fewer components. Also, more blocks can be used with the functionality distributed among more components.
- architecture 100 can be disposed on a wide variety of different devices. Some of those devices include servers, desktop computers, laptop computers, tablet computers, or other mobile devices, such as handheld computers, cell phones, smart phones, multimedia players, personal digital assistants, etc.
- Figure 10 is a simplified block diagram of one illustrative embodiment of a handheld or mobile computing device that can be used as a user's or client's hand held device 16, in which the present system (or parts of it) can be deployed.
- device 16 can be a smart phone or tablet computer mounted within, or carried by the operator within, the operator's compartment of machine 102. It can be used to generate and display the time continuous display.
- Figure 10 provides a general block diagram of the components of a client device 16 that can run some components of architecture 100 shown Figure 1 , that interacts with architecture 100, or both.
- a communications link 13 is provided that allows the handheld device to communicate with other computing devices and under some embodiments provides a channel for receiving information automatically, such as by scanning. Examples of communications link 13 include allowing communication though one or more communication protocols, such as wireless services used to provide cellular access to a network, as well as protocols that provide local wireless connections to networks.
- SD Secure Digital
- Interface 15 and communication links 13 communicate with a processor 17 (which can also embody processor 114 from Figure 1 or Figure 3 ) along a bus 19 that is also connected to memory 21 and input/output (I/O) components 23, as well as clock 25 and location system 27.
- processor 17 which can also embody processor 114 from Figure 1 or Figure 3
- bus 19 that is also connected to memory 21 and input/output (I/O) components 23, as well as clock 25 and location system 27.
- I/O components 23 are provided to facilitate input and output operations.
- I/O components 23 for various embodiments of the device 16 can include input components such as buttons, touch sensors, optical sensors, microphones, touch screens, proximity sensors, accelerometers, orientation sensors and output components such as a display device, a speaker, and or a printer port.
- Other I/O components 23 can be used as well.
- Clock 25 illustratively comprises a real time clock component that outputs a time and date. It can also, illustratively, provide timing functions for processor 17.
- Location system 27 illustratively includes a component that outputs a current geographical location of device 16. This can include, for instance, a global positioning system (GPS) receiver, a LORAN system, a dead reckoning system, a cellular triangulation system, or other positioning system. It can also include, for example, mapping software or navigation software that generates desired maps, navigation routes and other geographic functions.
- GPS global positioning system
- Memory 21 stores operating system 29, network settings 31, applications 33, application configuration settings 35, data store 37, communication drivers 39, and communication configuration settings 41.
- Memory 21 can include all types of tangible volatile and non-volatile computer-readable memory devices. It can also include computer storage media (described below).
- Memory 21 stores computer readable instructions that, when executed by processor 17, cause the processor to perform computer-implemented steps or functions according to the instructions. Processor 17 can be activated by other components to facilitate their functionality as well.
- Figure 11 shows one embodiment in which device 16 is a tablet computer 600.
- computer 600 is shown with user interface display screen 602.
- Screen 602 can be a touch screen or a pen-enabled interface that receives inputs from a pen or stylus. It can also use an on-screen virtual keyboard. Of course, it might also be attached to a keyboard or other user input device through a suitable attachment mechanism, such as a wireless link or USB port, for instance.
- Computer 600 can also illustratively receive voice inputs as well.
- Figure 12 is one embodiment of a computing environment in which elements of Figure 1 , or parts of it, (for example) can be deployed.
- an exemplary system for implementing some embodiments includes a general-purpose computing device in the form of a computer 810.
- Components of computer 810 may include, but are not limited to, a processing unit 820 (which can comprise processor 114), a system memory 830, and a system bus 821 that couples various system components including the system memory to the processing unit 820.
- the system bus 821 may be any of several types of bus structures including a memory bus or memory controller, a peripheral bus, and a local bus using any of a variety of bus architectures. Memory and programs described with respect to Figure 1 can be deployed in corresponding portions of Figure 12 .
- Computer 810 typically includes a variety of computer readable media.
- Computer readable media can be any available media that can be accessed by computer 810 and includes both volatile and nonvolatile media, removable and non-removable media.
- Computer readable media may comprise computer storage media and communication media.
- Computer storage media is different from, and does not include, a modulated data signal or carrier wave. It includes hardware storage media including both volatile and nonvolatile, removable and non-removable media implemented in any method or technology for storage of information such as computer readable instructions, data structures, program modules or other data.
- Computer storage media includes, but is not limited to, RAM, ROM, EEPROM, flash memory or other memory technology, CD-ROM, digital versatile disks (DVD) or other optical disk storage, magnetic cassettes, magnetic tape, magnetic disk storage or other magnetic storage devices, or any other medium which can be used to store the desired information and which can be accessed by computer 810.
- Communication media may embody computer readable instructions, data structures, program modules or other data in a transport mechanism and includes any information delivery media.
- modulated data signal means a signal that has one or more of its characteristics set or changed in such a manner as to encode information in the signal.
- the system memory 830 includes computer storage media in the form of volatile and/or nonvolatile memory such as read only memory (ROM) 831 and random access memory (RAM) 832.
- ROM read only memory
- RAM random access memory
- BIOS basic input/output system 833
- RAM 832 typically contains data and/or program modules that are immediately accessible to and/or presently being operated on by processing unit 820.
- Figure 12 illustrates operating system 834, application programs 835, other program modules 836, and program data 837.
- the computer 810 may also include other removable/non-removable volatile/nonvolatile computer storage media.
- Figure 12 illustrates a hard disk drive 841 that reads from or writes to non-removable, nonvolatile magnetic media, a magnetic disk drive 851, nonvolatile magnetic disk 852, an optical disk drive 855, and nonvolatile optical disk 856.
- the hard disk drive 841 is typically connected to the system bus 821 through a non-removable memory interface such as interface 840, and magnetic disk drive 851 and optical disk drive 855 are typically connected to the system bus 821 by a removable memory interface, such as interface 850.
- the functionality described herein can be performed, at least in part, by one or more hardware logic components.
- illustrative types of hardware logic components include Field-programmable Gate Arrays (FPGAs), Program-specific Integrated Circuits (ASICs), Program-specific Standard Products (ASSPs), System-on-a-chip systems (SOCs), Complex Programmable Logic Devices (CPLDs), etc.
- hard disk drive 841 is illustrated as storing operating system 844, application programs 845, other program modules 846, and program data 847. Note that these components can either be the same as or different from operating system 834, application programs 835, other program modules 836, and program data 837.
- a user may enter commands and information into the computer 810 through input devices such as a keyboard 862, a microphone 863, and a pointing device 861, such as a mouse, trackball or touch pad.
- Other input devices may include a joystick, game pad, satellite dish, scanner, or the like.
- a visual display 891 or other type of display device is also connected to the system bus 821 via an interface, such as a video interface 890.
- computers may also include other peripheral output devices such as speakers 897 and printer 896, which may be connected through an output peripheral interface 895.
- the computer 810 is operated in a networked environment using logical connections (such as a local area network - LAN, or wide area network WAN) to one or more remote computers, such as a remote computer 880.
- logical connections such as a local area network - LAN, or wide area network WAN
- remote computers such as a remote computer 880.
- the computer 810 When used in a LAN networking environment, the computer 810 is connected to the LAN 871 through a network interface or adapter 870. When used in a WAN networking environment, the computer 810 typically includes a modem 872 or other means for establishing communications over the WAN 873, such as the Internet. In a networked environment, program modules may be stored in a remote memory storage device. Figure 12 illustrates, for example, that remote application programs 885 can reside on remote computer 880.
Landscapes
- Life Sciences & Earth Sciences (AREA)
- Environmental Sciences (AREA)
- Engineering & Computer Science (AREA)
- Physics & Mathematics (AREA)
- General Physics & Mathematics (AREA)
- Automation & Control Theory (AREA)
- Testing And Monitoring For Control Systems (AREA)
- User Interface Of Digital Computer (AREA)
- Management, Administration, Business Operations System, And Electronic Commerce (AREA)
- General Engineering & Computer Science (AREA)
Abstract
Description
- The present disclosure relates to mobile equipment. More specifically, the present disclosure relates to displaying performance metrics for an operator of a mobile machine.
- There are a wide variety of different types of mobile machines, such as construction equipment, turf and forestry equipment, agricultural equipment, etc. They can be very complex and difficult to operate. For example, an operator of a combine, may require years of experience and many hours of training before he or she can achieve relatively high performance in operating the combine.
- While some pieces of mobile equipment have a variety of different sensors and control systems, they often still rely on operator perception and manual control inputs. As part of such control systems, the sensors provide sensor signals that are fed back to a main control computer. The main control computer generates various displays that are indicative of the sensed variables. These displays can be provided in order to assist the operator in making adjustments in order to improve performance.
- The discussion above is merely provided for general background information and is not intended to be used as an aid in determining the scope of the claimed subject matter.
- A machine control system receives sensor signals indicative of sensed variables and calculates performance metrics based upon the sensed variables. The machine control system displays the performance metrics on a time continuous user interface display.
-
-
Figure 1 is a block diagram of one embodiment of a control system that generates a time continuous display of performance metrics. -
Figure 2 is a pictorial illustration of one implementation of the control system shown inFigure 1 deployed on a combine. -
Figure 3 is a more detailed block diagram of the control system shown inFigure 1 , when deployed on a combine. -
Figure 4 is a flow diagram illustrating one embodiment of the overall operation of the control system shown inFigure 3 in generating a time continuous display. -
Figures 5 and6 are two exemplary time continuous user interface displays. -
Figure 7 is a flow diagram illustrating one embodiment of the operation of the control system shown inFigure 3 in receiving user interactions with the time continuous user interface displays. -
Figures 8-9 show exemplary user interface displays where a user drills into a display to view more details. -
Figure 10 is a block diagram of one embodiment of a mobile device that may reside in the operator compartment of a mobile machine. -
Figure 11 shows an exemplary mobile device that may reside in the operator compartment of the mobile machine. -
Figure 12 is a block diagram of one illustrative computing environment which can embody the control systems shown inFigures 1 and3 . -
Figure 1 is a block diagram of one illustrative control system architecture 100. Architecture 100 illustratively includesmobile machine 102, and it can include anexternal machine 104. By way of example,mobile machine 102 may be an agricultural machine, such as a combine, and noexternal machine 104 is used. In another embodiment,machine 102 is a tractor andexternal machine 104 may be an attachment, or another machine that is towed behind the tractor. These are exemplary embodiments only. -
Figure 1 shows thatmobile machine 102 illustratively generates user interface displays 106 withuser input mechanisms 108 that are provided for interaction by user (or operator) 110. As is described in greater detail below, the user interface displays 106 can illustratively include a time continuous display (such as a strip chart or another type of display) that displays measured or calculated values, or values determined in other ways, plotted along a timeline. -
Figure 1 also shows thatmobile machine 102 can illustratively communicate with one or moreremote systems 112.Remote systems 112 can include a wide variety of systems, and some examples of those are described below with respect toFigure 4 . - In the embodiment shown in
Figure 1 ,mobile machine 102 illustratively includesprocessor 114,user interface component 116,display device 118,communication component 120,sensor conditioning components 122, on-board sensors 124,control components 126 and controlledsystems 128. It can includeother components 129 as well.User interface component 116 can, either by itself or under the control of another item inmachine 102, generate user interface displays 106 for display ondisplay device 118. On-board sensors 124 sense a variety of variables and provide sensor signals tosensor conditioning components 122.Sensor conditioning components 122 can perform compensation, linearization, filtering, or other calibration and conditioning operations on the sensor signals.Control components 126 illustratively receive the sensor signals, after they are conditioned, and generate control signals to control various aspects ofmobile machine 102, orexternal machine 104, based upon the sensed variables. The control signals are provided to various controlledsystems 128 that are controlled based upon the sensor signals. The controlled systems can be electrical systems, mechanical systems, hydraulic systems, pneumatic systems, air-over-hydraulic systems, or other systems. The sensor signals and control signals can also be provided touser interface component 116 which uses them to generate the time continuoususer interface display 106. Some more detailed embodiments for generating the display are described below with respect toFigures 2-9 . -
Figure 1 shows thatexternal machine 104 can also include a variety of differentexternal sensors 130 which sense variables and provide sensor signals (after they are conditioned) toexternal control components 132.Control components 132 generate control signals for controlling external controlled systems onexternal machine 104. The external controlled systems are indicated byblock 134 inFigure 1 . In one embodiment, the sensor signals and control signals can also be provided touser interface component 116 onmachine 102, where they are used to generate the time continuous display. -
Figure 2 shows one pictorial illustration in whichmobile machine 102 is a combine. It can be seen inFigure 2 that combine 102 illustratively includes an operator'scompartment 136, aheader 138, a cutter generally indicated at 140, a thresher generally indicated at 142, a set of groundengaging wheels 144, aseparator 146, aspreader 148, anelevator 150, aclean grain tank 152 and aspout 154. In operation, combine 102 illustratively travels in the direction generally indicated byarrow 156.Header 138 engages the product being harvested and gathers it towardcutter 140. After it is cut, it is moved toward thresher 142 where it is threshed, and then moved toseparator 143. The grain falls to cleaningshoe 146 and the clean grain is moved byelevator 150 intoclean grain tank 152. Tailings can be passed back to thresher 142 where they are re-threshed. Material other than grain (such as stalks, husks, etc.) are chopped and removed frommachine 102 byspreader 148. -
Figure 2 also shows that, in one embodiment,combine 102 includes aground speed sensor 158, one or more cleaningshoe loss sensors 160, one or moreseparator loss sensors 162, ayield monitor sensor 164, aclean grain camera 166 and atailings camera 168.Ground speed sensor 158 illustratively senses the travel speed ofcombine 102 over the ground. This can be done by sensing the speed of rotation of the wheels, the drive shaft, the axle, or other components. The travel speed can also be sensed by a position sensing system, such as a global positioning system (GPS), a dead reckoning system, a LORAN system, or a wide variety of other systems or sensors that provide an indication of travel speed. - Cleaning
shoe loss sensors 160 illustratively provide an output signal indicative of the quantity of grain lost by both the right and left cleaning shoes. In one embodiment,sensors 160 are strike sensors which count grain strikes per unit of time to provide an indication of the cleaning shoe grain loss. -
Separator loss sensors 162 provide a signal indicative of grain loss in the left andright separators 143. This can be done by a wide variety of different types of sensors as well. -
Yield monitor sensor 164 is a sensor that senses yield. In one embodiment, it can sense mass flow throughelevator 150. It provides an output signal indicative of this, to indicate the particular yield. This can be measured in bushels per hour, bushels per acre, or in other ways. -
Tailings camera 168 illustratively generates a video image of the tailings that are being passed back to the thresher for re-threshing.Clean grain camera 166 provides a video image indicative of the quality of the grain being deposited inclean grain tank 152. -
Figure 3 is a block diagram of the control system architecture 100, shown inFigure 1 , but implemented using the components described with respect to combine 102 shown inFigure 2 . While architecture 100 can be disposed on any mobile machine, it is described in the context of a combine for the sake of example only. Thus, it can be seen inFigure 3 that the on-board sensors 124 illustratively includeground speed sensor 158, cleaningshoe loss sensors 160,separator loss sensors 162,yield monitor sensor 164 andcameras Figure 3 , animage processing system 167 comprises one of thesensor conditioning components 122. It receives the video signals fromcameras system 167 illustratively includes a material other than grain (MOG)identifier 176, abroken grain identifier 178 and anun-threshed product identifier 180. Based upon the video signal fromcamera 166 in theclean grain tank 152,MOG identifier 176 generates an output signal indicative of a quantity (or percent or other measure) of material other than grain (such as cobs, husks, stalks, chaff, etc.) that is enteringclean grain tank 172.Broken grain identifier 178 processes the video signal fromcamera 166 and identifies a quantity (or percent or other measure) of broken grain enteringclean grain tank 152.Un-threshed product identifier 180 illustratively receives the video signal fromtailings camera 168 and generates an output signal indicative of a quantity (or a percent or other measure) of un-threshed product that is being sent by the tailings elevator back to the thresher, for re-threshing. -
Control components 126 illustratively include anengine control unit 169 that has anexpert control system 170 deployed thereon. In one embodiment,engine control unit 169 receives the sensor signals and determines metric values for a plurality of different metrics based on the sensor signals. The metric values can be calculated, retrieved from memory or determined in other ways. It also illustratively usesexpert control system 170, which can be a neural network, a rules-based system, or another type of expert system that can generate control signals 172. The control signals 172 can be output to the various controlled systems. The control signals 172 and the metric values can be output bysystem 169 to generate the time continuous user interface display, such asdisplay 174 shown inFigure 3 . - In one embodiment,
expert control system 170 can generate not only the control signals 172, but it also generates recommendations that can be displayed to the user or operator. By way of example, the recommendations can direct the operator to change the settings on the sieves, chaffers, concaves, fan/rotor, or other items oncombine 102. Alternately, or in addition,expert control system 170 can generate the control signals, to automatically change or otherwise modify those settings. Further, in one embodiment, timecontinuous display 174 also indicates when recommendations were made to the operator, what those recommendations were, and when changes were made to the machine (either automatically or by the operator) and what those particular changes were. These items are described in greater detail below. -
Figure 4 is a flow diagram illustrating one embodiment of the operation of the system shown inFigure 3 in generating the timecontinuous display 174.Figures 5 and6 show two different embodiments of the time continuous display.Figures 3-6 will now be described in conjunction with one another. -
Machine 102 first receives operator inputs to begin operation of the machine. This is indicated byblock 182. This can be done in a variety of different ways. For instance, the operator can provide initial machine settings based on recommendations fromexpert control system 170. Alternatively, the operator can input these settings based upon his or her own prior experience and knowledge. The settings can be made manually, such as through mechanical or other user input mechanisms, or they can be made automatically by the machine itself, or they can be input in a different way, such as through a touch screen or other user input mechanism. Receiving initial operator settings is indicated byblock 184. The operator then provides a start input indicating that the operator wishes to start operation ofmachine 102. This is indicated byblock 186. The operator can of course provide other inputs as well, and this is indicated byblock 188. - During operation of the
machine 102,control system 169 receives the inputs from the various sensors. This is indicated byblock 190 inFigure 4 .Control system 169 then determines the various performance metric values that are derived from the sensor signals and generates the time continuous display of those performance metrics. This is indicated byblock 192. In one embodiment, the performance metrics include one ormore productivity metrics 194, one ormore quality metrics 196, one ormore loss metrics 198, and they can includeother metrics 200 as well. - When the operator believes that everything is set so that
machine 102 is performing in an acceptable way, the operator illustratively provides a calibration input. This is indicated byblock 202. For instance, the operator can illustratively actuate a calibration user input mechanism on the time continuous display, or the operator can provide this input using other user input mechanisms as well. - In any case, once
control system 169 receives the operator calibration input,control system 169 calculates a threshold value for the performance metrics that can be displayed. In one embodiment, the threshold value is represented by a performance window. For instance, thecontrol system 169 identifies that the operator believes that the performance metrics are currently adequate, based on the calibration input. Therefore,system 169 may calculate a window around a current value for each of the performance metrics. The corresponding performance metric can vary within the range of its window, without causingsystem 169 to alert the operator that the metric is outside of a given range defined by the window. - The performance window around each performance metric can be calculated in a wide variety of different ways. In one embodiment, it can be set empirically, based upon the operator's previous operation of
machine 102. In another embodiment, it can be a predefined window that is set around each performance metric. In yet another embodiment, it can be set heuristically, and it can even vary based upon context. For instance, if the machine is a combine that is harvesting corn, the windows may be set to one level. If it is harvesting soybeans or wheat, they may be set to different levels. The size of the windows can vary by performance metric, or they can all be set the same. Setting the performance window for the performance metrics is indicated byblock 204 inFigure 4 . -
Control system 169 then continues to receive the sensor signals and generate the time continuous display, asmachine 102 is being operated. This is indicated byblock 206 inFigure 4 . - Before proceeding with the description of
Figure 4 , a number of embodiments of the time continuous display will be described.Figure 5 shows one embodiment of a timecontinuous display 174. It can be seen that the performance metrics for which the timecontinuous display 174 is generated include shoe loss, separator loss, MOG, broken grain, un-threshed product, yield and ground speed. Each of the performance metrics has an associated strip chart. For instance, shoe loss is displayed bystrip chart 208. Separator loss is displayed bystrip chart 210. MOG is displayed bystrip chart 212. Broken grain is displayed bystrip chart 214. Un-threshed product is displayed bystrip chart 216. Yield is displayed bystrip chart 218, and ground speed is displayed bystrip chart 220. Each strip chart indicates a relative value of the corresponding performance metric along atimeline 222. It can be seen in the embodiment shown inFigure 5 that the timeline extends from a current position (indicated by the numeral 0), to a position one hour in the past (indicated by 60 minutes). Thus, each strip chart 208-220 shows how the value of the corresponding performance metric varied over time. - In one embodiment, the time continuous displays for each performance metric are generated in quasi-real time. This means that, as the metric values are calculated, looked up, or otherwise determined based on the sensor signals, they are displayed without delay, other than the processing delay occurred in determining and rendering the values. The time continuous display can be generated from memory or otherwise as well and need not be quasi-real time. That is just one embodiment.
-
Figure 5 also shows that a number of performance metrics have the calculated performance window displayed as well. The performance windows for each displayed metric are indicated by the horizontal dashed lines. Thus,system 169 indicates that, so long as the displayed performance metric varies within its corresponding performance window, the performance is adequate. If a performance metric deviates from its performance window, thensystem 169 can illustratively take action or make suggestions. -
Display 174 also illustratively includesvertical lines timeline 222 where an adjustment to the settings ofmachine 102 was made. For instance, at 45 minutes in the past, the rotor or fan speed was increased by 20 rpms. At 12 minutes in the past, the rotor or fan speed was decreased by 10 rpms. Thus, in the exemplary embodiment shown inFigure 5 ,display 174 not only includes a time continuous display of various performance metrics, but it also shows a performance window and it marks when adjustments were made to the settings ofmachine 102, and what those adjustment were. The operator can then easily learn how the adjustments affect the performance metrics. -
Figure 6 shows another embodiment of a timecontinuous display 228.Display 228 is broken into two sections. The first being aproductivity display section 230, and the second being aquality display section 232. Therefore, as one example, the display inFigure 6 may be generated instead of that shown inFigure 5 , when the user wishes to see the displayed metrics grouped into different sections. Theproductivity display section 230 displays performance metrics related to productivity. It includes ayield graph display 236 that shows the yield, for example, in bar graph form, plotted alongtime axis 234. The yield is calculated at a plurality of discrete points in time and plotted alongtime axis 234.Productivity section 230 also includesstrip chart 238 corresponding to separator loss,strip chart 240 corresponding to shoe loss, andstrip chart 242 corresponding to tailings loss. Each of the performance metrics (separator loss, shoe loss and tailings loss) displayed insection 230 includes acorresponding indicator light lines 250, the corresponding indicator light can change color, blink or otherwise provide a visual indication that the performance has deviated. Theuser interface component 116 can generate other user interface alerts as well, such as audible or haptic alerts, etc. - In the illustrated example,
quality display section 232 also includes three strip charts that indicate performance metric values for performance metrics related to quality.Strip chart 252 corresponds to broken grain.Strip chart 254 corresponds to foreign material in the clean grain tank, andstrip chart 256 corresponds to un-threshed product in the tailings. The quality performance window corresponding to each of the quality performance metrics is indicated by dashedlines 258. Also, as withsection 230, the performance metrics insection 232 each have acorresponding indicator light lines 258, the indicator light 260-264 can change color, blink, or otherwise visually indicate the deviation. - As with
display 174 shown inFigure 5 ,display 228 can also include a set of vertically orientedsections machine 102 were changed, and what those changes were. For instance,section 266 indicates that the rotor speed was decreased by 10 rpms.Section 268 indicates that the blower speed was increased by 100 rpms. These are exemplary changes only. -
Display 228 can also include a plurality ofzoom buttons timeline 234. For instance, when the user presses the "zoom in"button 270, the time scale ontimeline 234 changes so thattimeline 234 shows fewer minutes. When the user presses the "zoom out"button 272, the time scale ontimeline 234 is changed so thattimeline 234 displays more minutes. -
Figure 6 also illustratively shows athumb 269. The user can illustratively drag thethumb 269 backward in time, alongtimeline 234, to scroll to various periods in the history ontimeline 234. - Referring again to the flow diagram of
Figure 4 , it can be seen that, atblock 206,system 169 generates the time continuous display (such as one of those shown inFigures 5 and6 or another display). So long as none of the performance metrics deviate outside of the corresponding performance window, and so long as the operator does not make any changes, this operation continues. This is indicated byblock 276 inFigure 4 . - However, if one of the performance metrics deviates outside of the performance window, then
system 169 generates an action signal. This is indicated byblock 278. The action signal can generate one or more of a variety of different actions. In one embodiment, the action signal can generate an indicator on the time continuous display. For instance, it can turn on one of the indicator lights, flash a display element, generate an audible sound or otherwise generate an indicator indicating that the performance metric has deviated from the performance window. In another embodiment, it may be that the list of performance metrics is too long to have them all displayed on a single display. In an example where a performance metric is not currently being displayed and its value deviates outside the performance window, the action signal may cause it to be moved onto the current display and generate the corresponding indicator as well. Having the action signal generate an effect on the display is indicated byblock 280. - In another embodiment, the action signal can cause
expert system 170 to determine and display recommendations to the operator for changing the settings ofmachine 102. For instance, it may suggest that the operator change the rotor speed, the concave or sieve settings, the chopper settings, etc. Determining and displaying recommendations is indicated byblock 282. - In yet another embodiment,
expert control system 170 generates the control signals 172 in response to the action signal, and automatically provides the control signals 172 to the controlled systems to make automatic adjustments to the settings onmachine 102. As one example,system 170 can provide a display indicating that the adjustments are about to be made. If desired, the operator can be provided with an option to override the automatic adjustments. For instance, if the field or crop conditions have changed, andsystem 170 is about to make adjustments, but the operator can visually perceive that the changes in conditions will last for only a very short time, then the operator can override the adjustments. Making the automatic adjustments, is indicated byblock 284. - The
system 169 can provide an action signal for other actions as well. This is indicated byblock 286. -
Control system 169 then determines whether the actions were taken (either manually or automatically). This is indicated byblock 288 inFigure 4 . If they were taken, thensystem 169 outputs a display element, for examplevertical line 224 ofFigure 5 , on the time continuous display to mark the time when the action was taken, and to identify the action. This is indicated byblock 290 inFigure 4 . - At some point, either intermittently during operation, or after operation, or otherwise,
system 169 can store the data that was used to generate the time continuous display, so that it can be replayed or otherwise analyzed. Storing the data is indicated byblock 291 inFigure 4 . - In one embodiment,
system 169 can also send the data to a remote location. This is indicated byblock 292. For instance, the data can be sent, as it is generated, to afarm manager 294 who is monitoring the operator andmachine 102. In another embodiment, information can be sent to aremote analysis system 296 where it is analyzed for ways to improve either the operator's training, or the performance ofmachine 102, or for other reasons. It can also be sent to anagronomist 298, to anequipment manufacturer 300, tovarious vendors 302, or to otherremote locations 304. - As long as the operator continues to operate
machine 102, control reverts back to block 206 inFigure 4 where the time continuous display is generated based on the sensor signals. At some point, the operator will terminate operation ofmachine 102. This is indicated byblock 306 inFigure 4 . - It will be appreciated that, in one embodiment, the operator can interact with the time continuous display in various ways.
Figure 7 is a flow diagram illustrating one embodiment of the operation ofsystem 169, in greater detail, when the operator interacts with the time continuous display.Figures 8 and9 are exemplary user interface displays.Figures 7-9 will now be described in conjunction with one another. - It is first assumed that
system 169 is receiving the sensor signals and generating the time continuous display. This is indicated byblock 308 inFigure 7 .System 169 then receives a user interaction input interacting with one or more of the various user input mechanisms on the time continuous display. This is indicated byblock 310. - The interactions can take a wide variety of different forms. For instance, the user may provide a drill-down input indicating that the user wishes
system 169 to show a more detailed display of some portion of the time continuous display. This is indicated byblock 312 inFigure 7 . -
Figure 8 shows one embodiment of auser interface display 314 that can be generated bysystem 169 when the user drills down into thequality display section 232 shown inFigure 6 .User interface display 314 shows that more detailed information is now displayed with respect to the quality performance metrics. For instance, the brokengrain strip chart 252 and theun-threshed strip chart 256 are displayed in more detailed fashion so that thetimeline 316 only stretches between a current value and five minutes in the past. In another embodiment, the user can touch a portion of the strip chart at a given spot and see any five minute period around that spot in greater detail. Thus, strip charts 252 and 256 show a more fine-grained variation of the corresponding performance metrics. -
Display 314 also shows that the foreignmaterial strip chart 254 has now been broken into twoseparate strip charts Strip chart 318 is indicative of light material other than grain that is entering theclean grain tank 152. This may include such items such as chaff or other relatively light, non-grain materials.Strip chart 320 is indicative of material other than grain that is relatively heavy, such as corn cobs, stalks, etc. Thus,display 314 displays more detailed information corresponding to the quality performance metrics thandisplay 228 shown inFigure 6 . - In addition,
display 314 illustratively includes a visual image displayed in visualimage display section 322. In the embodiment illustrated,section 322 shows an image generated by quality camera 166 (Figure 3 ). The user can thus visually perceive the material entering the clean grain tank to determine whether the quality is acceptable. - In the embodiment shown in
Figure 8 ,display 314 also includes a pair ofcamera actuators camera actuator 324 has been selected so that the live camera iscamera 166. Thus the user is viewing the image generated bycamera 166 in theclean grain tank 152. If the user actuatescamera button 326, then the live camera switches so that the video display is fromtailings camera 168. -
Figure 9 shows auser interface display 328 that displays more detailed information that can be generated when the user actuates theproductivity display section 230 onuser interface display 228 ofFigure 6 . It can be seen inFigure 9 that the strip charts 238, 240 and 242 are shown in greater detail (e.g., the timeline is zoomed in more) inFigure 9 than they are inFigure 6 . Also, visualimage display section 330 displays the video image generated bytailings camera 168. - In one embodiment, the user can continue to drill down for more detailed information by providing a drill down input on either of the displays shown in
Figures 8 and9 . For example, if the user actuates the shoeloss strip chart 240 inFigure 9 , thensystem 169 generates a display that shows strip charts for both the left and right shoes, instead of the combinedstrip chart 240 that combines the performance metric for both shoes. Other drill down actuations can be performed to see other detailed information as well. - Referring again to the flow diagram of
Figure 7 , in one embodiment, each of the various strip charts or display elements on the time continuous display can be displayed in various units. The user can illustratively actuate a user input mechanism to change the units of the displayed element. For instance, in the user interface display ofFigure 6 , if the user actuates theproductivity display 236, it toggles between displaying productivity in bushels per hour and bushels per acre or hectare. Toggling through various displays is indicated byblock 332 inFigure 7 . - As discussed above, the user can also illustratively actuate user input mechanisms (such as "zoom in" and "zoom out"
buttons Figure 6 ) to change the time scale on the timeline. This is indicated byblock 334. - As also mentioned above with respect to
Figure 6 , the user can illustratively dragthumb 269 to pan horizontally along the timeline. This is indicated byblock 336. - In yet another embodiment, the time continuous display displays only a subset of the performance metrics that are actually calculated. Therefore, in such an embodiment, the user can illustratively scroll the display vertically to see time continuous display elements corresponding to other performance metrics. By way of example, and referring again to the time
continuous display 328 shown inFigure 9 , it may be thatsystem 169 calculates additional performance metrics. By scrolling vertically, the user can see the display for those performance metrics as well. Scrolling vertically to see other performance metrics is indicated byblock 338 inFigure 7 . - Also, as discussed above, the user can actuate the
different camera buttons block 340. - The user can also illustratively interact with the time continuous displays in other ways. This is indicated by
block 342. - Again, at some point, the user will end the operation of
machine 102. This is indicated byblock 344. - It can thus be seen that the time continuous display displays performance metrics along a timeline, and it can also indicate when adjustments to the machine are recommended or made, or both. This allows the user to better understand how changes to the machine settings affect the performance of
machine 102. The user can also interact with the display to perform various operations, and the data used to generate the display can be stored or sent to a remote site for later analysis or for other reasons. - It should also be noted that portions of the current description discuss the time continuous display being shown on
machine 102. However, that need not be the case. Instead, the data used to generate the display can be sent to a remote site where the display is generated in quasi-real time, or in an asynchronous, time delayed manner. This can be done on any computing system. The displays can be stored and re-played at the remote site, when desired. - It will also be noted that while the time continuous display has been described with respect to an embodiment in which
machine 102 is a combine, it can be used on a wide variety of other machines as well. For instance,mobile machine 102 can be a tractor, a cotton harvester, a sugarcane harvester, a seeder, or a variety of other agricultural, construction, turf or forestry machines. - As an example, where
machine 102 is a planter (or seeder), thesensors 124 can sense the seed population (e.g., the number of seeds planted per linear measurement, per acre, etc.). The time continuous display illustratively provides a quasi-real time display indicating how the seed population varies over time. Adjustments to the machine settings that can be automatically made, or suggested, to modify the seed population (or the variations in seed population). - For instance, a fan in a planter creates a vacuum that pulls seeds through a tube to the ends of the planter. The hydraulic oil temperature in the planter can vary. When it fluctuates, then the fan speed that creates the vacuum that pulls the seeds out to the end of the planter can vary as well. This can affect the seed population. Thus, the time continuous display of seed population can indicate whether the planter is skipping areas or is planting seeds too close together, too far apart or whether the population is simply varying too much. The recommended actions or automatic adjustments can be those which would stabilize hydraulic oil temperature, and thus fan speed.
- In another embodiment, if the
machine 102 is a sprayer (of a liquid or granular material) thesensors 124 can sense the flow of the sprayed material to the spraying nozzles, and onto the field or plant. The time continuous display can thus identify whether the sprayed material is flowing at a consistent rate or whether it is varying. - In another embodiment, some relatively large sprayers can be 90-120 feet wide (or more). In some such sprayers, a controller controls mechanical actuators to manage the vertical position of the booms on the sprayer as well as the left-to-right tilt of those booms. In such an embodiment,
sensors 124 can sense fluctuations in the mechanical actuators and this can be displayed on the time continuous display. If the time continuous display shows that the vertical position of the booms is varying relatively frequently, this may indicate that the controller is not maintaining the booms at a uniform height over the field. This can also indicate that the controller should be tuned by the operator. In one embodiment, a user input mechanism is provided so that the user can change the sensitivity of the controller so that the vertical boom position does not change so frequently. These are exemplary embodiments only. Others can be used as well. - The present discussion has mentioned processors and servers. In one embodiment, the processors and servers include computer processors with associated memory and timing circuitry, not separately shown. They are functional parts of the systems or devices to which they belong and are activated by, and facilitate the functionality of the other components or items in those systems.
- Also, a number of user interface displays have been discussed. They can take a wide variety of different forms and can have a wide variety of different user actuatable input mechanisms disposed thereon. For instance, the user actuatable input mechanisms can be text boxes, check boxes, icons, links, drop-down menus, search boxes, etc. They can also be actuated in a wide variety of different ways. For instance, they can be actuated using a point and click device (such as a track ball or mouse). They can be actuated using hardware buttons, switches, a joystick or keyboard, thumb switches or thumb pads, etc. They can also be actuated using a virtual keyboard or other virtual actuators. In addition, where the screen on which they are displayed is a touch sensitive screen, they can be actuated using touch gestures. Also, where the device that displays them has speech recognition components, they can be actuated using speech commands.
- A number of data stores have also been discussed. It will be noted they can each be broken into multiple data stores. All can be local to the systems accessing them, all can be remote, or some can be local while others are remote. All of these configurations are contemplated herein.
- Also, the figures show a number of blocks with functionality ascribed to each block. It will be noted that fewer blocks can be used so the functionality is performed by fewer components. Also, more blocks can be used with the functionality distributed among more components.
- It will also be noted that architecture 100, or portions of it, can be disposed on a wide variety of different devices. Some of those devices include servers, desktop computers, laptop computers, tablet computers, or other mobile devices, such as handheld computers, cell phones, smart phones, multimedia players, personal digital assistants, etc.
-
Figure 10 is a simplified block diagram of one illustrative embodiment of a handheld or mobile computing device that can be used as a user's or client's hand helddevice 16, in which the present system (or parts of it) can be deployed. For instance,device 16 can be a smart phone or tablet computer mounted within, or carried by the operator within, the operator's compartment ofmachine 102. It can be used to generate and display the time continuous display. - More specifically,
Figure 10 provides a general block diagram of the components of aclient device 16 that can run some components of architecture 100 shownFigure 1 , that interacts with architecture 100, or both. In thedevice 16, acommunications link 13 is provided that allows the handheld device to communicate with other computing devices and under some embodiments provides a channel for receiving information automatically, such as by scanning. Examples of communications link 13 include allowing communication though one or more communication protocols, such as wireless services used to provide cellular access to a network, as well as protocols that provide local wireless connections to networks. - Under other embodiments, applications can be received on a removable Secure Digital (SD) card that is connected to an
interface 15.Interface 15 andcommunication links 13 communicate with a processor 17 (which can also embodyprocessor 114 fromFigure 1 orFigure 3 ) along abus 19 that is also connected to memory 21 and input/output (I/O)components 23, as well asclock 25 andlocation system 27. - I/
O components 23, in one embodiment, are provided to facilitate input and output operations. I/O components 23 for various embodiments of thedevice 16 can include input components such as buttons, touch sensors, optical sensors, microphones, touch screens, proximity sensors, accelerometers, orientation sensors and output components such as a display device, a speaker, and or a printer port. Other I/O components 23 can be used as well. -
Clock 25 illustratively comprises a real time clock component that outputs a time and date. It can also, illustratively, provide timing functions forprocessor 17. -
Location system 27 illustratively includes a component that outputs a current geographical location ofdevice 16. This can include, for instance, a global positioning system (GPS) receiver, a LORAN system, a dead reckoning system, a cellular triangulation system, or other positioning system. It can also include, for example, mapping software or navigation software that generates desired maps, navigation routes and other geographic functions. - Memory 21
stores operating system 29,network settings 31,applications 33,application configuration settings 35,data store 37,communication drivers 39, andcommunication configuration settings 41. Memory 21 can include all types of tangible volatile and non-volatile computer-readable memory devices. It can also include computer storage media (described below). Memory 21 stores computer readable instructions that, when executed byprocessor 17, cause the processor to perform computer-implemented steps or functions according to the instructions.Processor 17 can be activated by other components to facilitate their functionality as well. -
Figure 11 shows one embodiment in whichdevice 16 is atablet computer 600. InFigure 11 ,computer 600 is shown with userinterface display screen 602.Screen 602 can be a touch screen or a pen-enabled interface that receives inputs from a pen or stylus. It can also use an on-screen virtual keyboard. Of course, it might also be attached to a keyboard or other user input device through a suitable attachment mechanism, such as a wireless link or USB port, for instance.Computer 600 can also illustratively receive voice inputs as well. - Note that other forms of the
devices 16 are possible. -
Figure 12 is one embodiment of a computing environment in which elements ofFigure 1 , or parts of it, (for example) can be deployed. With reference toFigure 12 , an exemplary system for implementing some embodiments includes a general-purpose computing device in the form of acomputer 810. Components ofcomputer 810 may include, but are not limited to, a processing unit 820 (which can comprise processor 114), asystem memory 830, and asystem bus 821 that couples various system components including the system memory to theprocessing unit 820. Thesystem bus 821 may be any of several types of bus structures including a memory bus or memory controller, a peripheral bus, and a local bus using any of a variety of bus architectures. Memory and programs described with respect toFigure 1 can be deployed in corresponding portions ofFigure 12 . -
Computer 810 typically includes a variety of computer readable media. Computer readable media can be any available media that can be accessed bycomputer 810 and includes both volatile and nonvolatile media, removable and non-removable media. By way of example, and not limitation, computer readable media may comprise computer storage media and communication media. Computer storage media is different from, and does not include, a modulated data signal or carrier wave. It includes hardware storage media including both volatile and nonvolatile, removable and non-removable media implemented in any method or technology for storage of information such as computer readable instructions, data structures, program modules or other data. Computer storage media includes, but is not limited to, RAM, ROM, EEPROM, flash memory or other memory technology, CD-ROM, digital versatile disks (DVD) or other optical disk storage, magnetic cassettes, magnetic tape, magnetic disk storage or other magnetic storage devices, or any other medium which can be used to store the desired information and which can be accessed bycomputer 810. Communication media may embody computer readable instructions, data structures, program modules or other data in a transport mechanism and includes any information delivery media. The term "modulated data signal" means a signal that has one or more of its characteristics set or changed in such a manner as to encode information in the signal. - The
system memory 830 includes computer storage media in the form of volatile and/or nonvolatile memory such as read only memory (ROM) 831 and random access memory (RAM) 832. A basic input/output system 833 (BIOS), containing the basic routines that help to transfer information between elements withincomputer 810, such as during start-up, is typically stored inROM 831.RAM 832 typically contains data and/or program modules that are immediately accessible to and/or presently being operated on by processingunit 820. By way of example, and not limitation,Figure 12 illustratesoperating system 834,application programs 835,other program modules 836, andprogram data 837. - The
computer 810 may also include other removable/non-removable volatile/nonvolatile computer storage media. By way of example only,Figure 12 illustrates ahard disk drive 841 that reads from or writes to non-removable, nonvolatile magnetic media, a magnetic disk drive 851, nonvolatilemagnetic disk 852, anoptical disk drive 855, and nonvolatileoptical disk 856. Thehard disk drive 841 is typically connected to thesystem bus 821 through a non-removable memory interface such asinterface 840, and magnetic disk drive 851 andoptical disk drive 855 are typically connected to thesystem bus 821 by a removable memory interface, such asinterface 850. - Alternatively, or in addition, the functionality described herein can be performed, at least in part, by one or more hardware logic components. For example, and without limitation, illustrative types of hardware logic components that can be used include Field-programmable Gate Arrays (FPGAs), Program-specific Integrated Circuits (ASICs), Program-specific Standard Products (ASSPs), System-on-a-chip systems (SOCs), Complex Programmable Logic Devices (CPLDs), etc.
- The drives and their associated computer storage media discussed above and illustrated in
Figure 12 , provide storage of computer readable instructions, data structures, program modules and other data for thecomputer 810. InFigure 12 , for example,hard disk drive 841 is illustrated as storingoperating system 844,application programs 845,other program modules 846, andprogram data 847. Note that these components can either be the same as or different fromoperating system 834,application programs 835,other program modules 836, andprogram data 837. - A user may enter commands and information into the
computer 810 through input devices such as akeyboard 862, amicrophone 863, and apointing device 861, such as a mouse, trackball or touch pad. Other input devices (not shown) may include a joystick, game pad, satellite dish, scanner, or the like. These and other input devices are often connected to theprocessing unit 820 through auser input interface 860 that is coupled to the system bus, but may be connected by other interface and bus structures. Avisual display 891 or other type of display device is also connected to thesystem bus 821 via an interface, such as avideo interface 890. In addition to the monitor, computers may also include other peripheral output devices such asspeakers 897 andprinter 896, which may be connected through an outputperipheral interface 895. - The
computer 810 is operated in a networked environment using logical connections (such as a local area network - LAN, or wide area network WAN) to one or more remote computers, such as aremote computer 880. - When used in a LAN networking environment, the
computer 810 is connected to theLAN 871 through a network interface oradapter 870. When used in a WAN networking environment, thecomputer 810 typically includes amodem 872 or other means for establishing communications over theWAN 873, such as the Internet. In a networked environment, program modules may be stored in a remote memory storage device.Figure 12 illustrates, for example, thatremote application programs 885 can reside onremote computer 880. - It should also be noted that the different embodiments described herein can be combined in different ways. That is, parts of one or more embodiments can be combined with parts of one or more other embodiments. All of this is contemplated herein.
- Although the subject matter has been described in language specific to structural features and/or methodological acts, it is to be understood that the subject matter defined in the appended claims is not necessarily limited to the specific features or acts described above. Rather, the specific features and acts described above are disclosed as example forms of implementing the claim.
Claims (15)
- A method, comprising:receiving a sensor signal indicative of a sensed variable on a mobile machine;determining a metric value for a metric based on the sensor signal; anddisplaying a time continuous display indicative of the metric value.
- The method of claim 1 and further comprising:receiving a user calibration input;in response to the user calibration input, determining a metric tolerance based on the metric value; anddisplaying the metric tolerance along with the time continuous display.
- The method of claim 2 wherein determining the metric tolerance comprises:determining a metric tolerance window around the metric value when the user calibration input is received.
- The method of claim 2 and further comprising:identifying an action condition based on a relationship between the metric value andthe metric tolerance; andgenerating an action signal in response to identifying the action condition.
- The method of claim 4 wherein identifying the action condition comprises:identifying the action condition when the metric value moves outside the metric tolerance.
- The method of claim 4 and further comprising:displaying on the time continuous display an indication of where, along a timeline, the action signal is generated.
- The method of claim 6 and further comprising:displaying, on the time continuous display, an action identifier identifying an action taken in response to the action signal.
- The method of claim 4 wherein generating the action signal comprises:generating a control signal to automatically control a controlled system on the mobile machine; andcontrolling the controlled system with the control signal.
- The method of claim 4 wherein generating the action signal comprises:determining recommendations based on the action condition; anddisplaying the recommendations.
- The method of claim 1 and further comprising:receiving a user interaction with the time continuous display; andmodifying the time continuous display based on the user interaction.
- The method of claim 10 wherein receiving a user interaction comprises receiving a drill input, and wherein modifying the time continuous display comprises:displaying a more detailed display indicative of more detailed information corresponding to the metric value on the time continuous display.
- The method of claim 11 wherein the metric comprises a performance metric derived from a plurality of sensed variables and wherein displaying a more detailed display comprises displaying a time continuous display for each of the plurality of sensed variables and/or wherein displaying a more detailed display comprises displaying a video image corresponding to the sensed variable.
- The method of claim 10 wherein receiving a user interaction comprises receiving one of a pan input and a scroll input and wherein modifying the time continuous display comprises panning the time continuous display horizontally along a timeline in response to the pan input; and scrolling the time continuous display vertically to show an additional time continuous display for additional metrics in response to the scroll input and/or wherein receiving a user interaction comprises receiving a zoom input and wherein modifying the time continuous display comprises changing a time scale of a timeline in the time continuous display.
- The method of claim 1 wherein receiving a sensor signal comprises receiving a plurality of sensor signals indicative of a plurality of sensed variables, wherein determining a metric value comprises determining a plurality of performance metric values indicative of a plurality of performance metrics and wherein displaying a time continuous display comprises simultaneously displaying a plurality of strip charts, each indicative of one of the performance metrics, wherein the plurality of performance metrics preferably comprise a productivity performance metric, a product quality performance metric and a product loss performance metric and wherein displaying a plurality of strip charts comprises displaying a strip chart for each of the productivity performance metric, the product quality performance metric and the product loss performance metric and/or wherein displaying the time continuous display comprises determining the metric value at a plurality of discrete points in time; and displaying the metric value determined at the plurality of discrete points in time plotted along a timeline, wherein displaying the metric value determined at the plurality of discrete points in time preferably comprises displaying a histogram display.
- A control system for a mobile machine, comprising:a plurality of sensors each sensing a variable on the mobile machine and providing a sensor signal indicative of the sensed variable;a control unit configured to calculate a performance metric based on the sensor signals; anda user interface component configured to generate a display of metric values of the performance metric plotted along a timeline in quasi real time.
Applications Claiming Priority (1)
| Application Number | Priority Date | Filing Date | Title |
|---|---|---|---|
| US14/251,161 US10426087B2 (en) | 2014-04-11 | 2014-04-11 | User interface performance graph for operation of a mobile machine |
Publications (2)
| Publication Number | Publication Date |
|---|---|
| EP2929773A1 true EP2929773A1 (en) | 2015-10-14 |
| EP2929773B1 EP2929773B1 (en) | 2018-01-31 |
Family
ID=52784930
Family Applications (1)
| Application Number | Title | Priority Date | Filing Date |
|---|---|---|---|
| EP15160067.3A Active EP2929773B1 (en) | 2014-04-11 | 2015-03-20 | User interface performance graph for operation of a mobile machine |
Country Status (5)
| Country | Link |
|---|---|
| US (1) | US10426087B2 (en) |
| EP (1) | EP2929773B1 (en) |
| CN (1) | CN104977861B (en) |
| AU (1) | AU2015201810B2 (en) |
| BR (1) | BR102015007934A2 (en) |
Cited By (5)
| Publication number | Priority date | Publication date | Assignee | Title |
|---|---|---|---|---|
| EP3125670A4 (en) * | 2014-04-01 | 2017-12-20 | The Climate Corporation | Agricultural implement and implement operator monitoring apparatus, systems, and methods |
| GB2555377A (en) * | 2016-10-13 | 2018-05-02 | Thermoteknix Systems Ltd | Monitoring system with interactive display interface |
| US10426087B2 (en) | 2014-04-11 | 2019-10-01 | Deere & Company | User interface performance graph for operation of a mobile machine |
| EP3689125B1 (en) | 2019-01-31 | 2022-11-30 | CNH Industrial Belgium N.V. | Combine loss monitor mapping |
| EP4169368A1 (en) * | 2021-07-28 | 2023-04-26 | Deere & Company | System for dynamically detecting alert conditions and optimization criteria |
Families Citing this family (32)
| Publication number | Priority date | Publication date | Assignee | Title |
|---|---|---|---|---|
| US9629308B2 (en) * | 2011-03-11 | 2017-04-25 | Intelligent Agricultural Solutions, Llc | Harvesting machine capable of automatic adjustment |
| US10321624B2 (en) | 2011-03-11 | 2019-06-18 | Intelligent Agriculture Solutions LLC | Air seeder manifold system |
| US10318138B2 (en) * | 2011-03-11 | 2019-06-11 | Intelligent Agricultural Solutions Llc | Harvesting machine capable of automatic adjustment |
| US9631964B2 (en) | 2011-03-11 | 2017-04-25 | Intelligent Agricultural Solutions, Llc | Acoustic material flow sensor |
| US9880529B2 (en) * | 2013-08-28 | 2018-01-30 | James Ward Girardeau, Jr. | Recreating machine operation parameters for distribution to one or more remote terminals |
| US10085379B2 (en) | 2014-09-12 | 2018-10-02 | Appareo Systems, Llc | Grain quality sensor |
| AU2015314684B2 (en) | 2014-09-12 | 2020-09-03 | Appareo Systems, Llc | Non-image-based grain quality sensor |
| US9901031B2 (en) * | 2014-09-24 | 2018-02-27 | Deere & Company | Automatic tuning of an intelligent combine |
| US9934538B2 (en) | 2014-09-24 | 2018-04-03 | Deere & Company | Recalling crop-specific performance targets for controlling a mobile machine |
| CN104737721B (en) * | 2015-03-04 | 2016-08-31 | 江苏大学 | A kind of combined harvester self adaptation cleans control device and self adaptation cleans method |
| US20170112061A1 (en) * | 2015-10-27 | 2017-04-27 | Cnh Industrial America Llc | Graphical yield monitor static (previous) data display on in-cab display |
| US20170115862A1 (en) * | 2015-10-27 | 2017-04-27 | Cnh Industrial America Llc | Graphical yield monitor real-time data display |
| BR112019009492B1 (en) * | 2016-11-10 | 2022-09-27 | Cnh Industrial America Llc | WASTE PROCESSOR FOR USE IN AN AGRICULTURAL MOWER AND AGRICULTURAL MOWER |
| US20180271015A1 (en) * | 2017-03-21 | 2018-09-27 | Blue River Technology Inc. | Combine Harvester Including Machine Feedback Control |
| US11589507B2 (en) | 2017-06-19 | 2023-02-28 | Deere & Company | Combine harvester control interface for operator and/or remote user |
| US11789413B2 (en) * | 2017-06-19 | 2023-10-17 | Deere & Company | Self-learning control system for a mobile machine |
| DE102017130435A1 (en) * | 2017-12-19 | 2019-06-19 | Claas Selbstfahrende Erntemaschinen Gmbh | Agricultural work machine for processing an agricultural work process |
| US11818982B2 (en) | 2018-09-18 | 2023-11-21 | Deere & Company | Grain quality control system and method |
| US11197417B2 (en) * | 2018-09-18 | 2021-12-14 | Deere & Company | Grain quality control system and method |
| US11375662B2 (en) * | 2019-06-12 | 2022-07-05 | Cnh Industrial America Llc | Apparatus and method for monitoring grain content within a tailings system of an agricultural harvester |
| CN114631337A (en) * | 2019-11-05 | 2022-06-14 | 高通股份有限公司 | Sensor performance indication |
| US11589494B2 (en) | 2019-11-06 | 2023-02-28 | Cnh Industrial Canada, Ltd. | System and method for managing material accumulation relative to ground engaging tools of an agricultural implement |
| USD1018575S1 (en) | 2019-12-09 | 2024-03-19 | Caterpillar Inc. | Display screen having a graphical user interface |
| US11669093B2 (en) * | 2020-03-26 | 2023-06-06 | Deere & Company | Mobile work machine control based on control zone map data |
| DE102021101219A1 (en) * | 2021-01-21 | 2022-07-21 | Claas Selbstfahrende Erntemaschinen Gmbh | System for determining a fraction of broken grain |
| US11782453B2 (en) * | 2021-02-16 | 2023-10-10 | Deere & Company | Image-based position assessment of agricultural machine components |
| US11980134B2 (en) | 2021-03-09 | 2024-05-14 | Deere & Company | Operator commanded placement for control of filling mechanisms |
| US12004449B2 (en) | 2021-03-24 | 2024-06-11 | Deere & Company | Control system for controlling filling mechanisms in communication with a mobile device |
| US11765993B2 (en) | 2021-05-17 | 2023-09-26 | Deere & Company | Control system detecting fill level on receiving vehicle(s) |
| US11930738B2 (en) | 2021-06-28 | 2024-03-19 | Deere & Company | Closed loop control of filling mechanisms |
| US12114601B2 (en) * | 2021-09-28 | 2024-10-15 | Deere & Company | Agricultural machine speed control based on work quality metrics |
| US12120972B2 (en) | 2021-09-28 | 2024-10-22 | Deere & Company | Agricultural machine control using work quality based on in situ operation sensing |
Citations (3)
| Publication number | Priority date | Publication date | Assignee | Title |
|---|---|---|---|---|
| EP1714540A1 (en) * | 2005-04-20 | 2006-10-25 | Cnh U.K. Limited | Agricultural vehicle performance maps |
| WO2006128786A1 (en) * | 2005-05-30 | 2006-12-07 | John Deere Forestry Oy | A system for measuring the performance of a forest machine |
| EP1900272A1 (en) * | 2006-09-15 | 2008-03-19 | CLAAS Selbstfahrende Erntemaschinen GmbH | Display unit for an agricultural machine |
Family Cites Families (17)
| Publication number | Priority date | Publication date | Assignee | Title |
|---|---|---|---|---|
| DE10147733A1 (en) * | 2001-09-27 | 2003-04-10 | Claas Selbstfahr Erntemasch | Method and device for determining a harvester setting |
| US20040051721A1 (en) * | 2002-09-18 | 2004-03-18 | Ramseth Douglas J. | Method and apparatus for interactive annotation and measurement of time series data |
| US7406399B2 (en) * | 2003-08-26 | 2008-07-29 | Siemens Energy & Automation, Inc. | System and method for distributed reporting of machine performance |
| US7242311B2 (en) * | 2004-10-29 | 2007-07-10 | Caterpillar Inc. | Method and system for providing work machine multi-functional user interface |
| US7580781B2 (en) * | 2005-12-14 | 2009-08-25 | Clark Equipment Company | Diagnostic system for a power machine |
| WO2007115140A2 (en) * | 2006-03-31 | 2007-10-11 | Alaka'i Technologies | Aircraft-engine trend monitoring methods and systems |
| US8271429B2 (en) * | 2006-09-11 | 2012-09-18 | Wiredset Llc | System and method for collecting and processing data |
| DE102008027906A1 (en) * | 2008-06-12 | 2009-12-17 | Claas Selbstfahrende Erntemaschinen Gmbh | Agricultural harvester |
| DE102008057461A1 (en) * | 2008-11-14 | 2010-05-20 | Claas Selbstfahrende Erntemaschinen Gmbh | display unit |
| US8594883B2 (en) * | 2009-01-09 | 2013-11-26 | Bosch Automotive Service Solutions Llc | Data meter with bar graph and histogram |
| DE102009009767A1 (en) * | 2009-02-20 | 2010-08-26 | Claas Selbstfahrende Erntemaschinen Gmbh | Driver assistance system for agricultural machine |
| CN101637080A (en) | 2009-08-27 | 2010-02-03 | 天津工程机械研究院 | Harvester control system |
| CN102379189B (en) * | 2010-08-31 | 2013-06-26 | 中国农业机械化科学研究院 | Grain yield distribution information measurement method and device |
| US20130144827A1 (en) * | 2011-02-03 | 2013-06-06 | Schaffert Manufacturing Company, Inc. | Systems and methods for supporting fertilizer decisions |
| US8779916B2 (en) * | 2011-10-24 | 2014-07-15 | Fisher-Rosemount Systems, Inc. | Timeline presentations of process control system alarms |
| CN103404298A (en) * | 2013-06-05 | 2013-11-27 | 西北农林科技大学 | Electrically-driven intelligent combine-harvester control system |
| US10426087B2 (en) | 2014-04-11 | 2019-10-01 | Deere & Company | User interface performance graph for operation of a mobile machine |
-
2014
- 2014-04-11 US US14/251,161 patent/US10426087B2/en active Active
-
2015
- 2015-03-20 EP EP15160067.3A patent/EP2929773B1/en active Active
- 2015-04-09 BR BR102015007934A patent/BR102015007934A2/en not_active Application Discontinuation
- 2015-04-10 CN CN201510169311.5A patent/CN104977861B/en active Active
- 2015-04-10 AU AU2015201810A patent/AU2015201810B2/en active Active
Patent Citations (3)
| Publication number | Priority date | Publication date | Assignee | Title |
|---|---|---|---|---|
| EP1714540A1 (en) * | 2005-04-20 | 2006-10-25 | Cnh U.K. Limited | Agricultural vehicle performance maps |
| WO2006128786A1 (en) * | 2005-05-30 | 2006-12-07 | John Deere Forestry Oy | A system for measuring the performance of a forest machine |
| EP1900272A1 (en) * | 2006-09-15 | 2008-03-19 | CLAAS Selbstfahrende Erntemaschinen GmbH | Display unit for an agricultural machine |
Cited By (6)
| Publication number | Priority date | Publication date | Assignee | Title |
|---|---|---|---|---|
| EP3125670A4 (en) * | 2014-04-01 | 2017-12-20 | The Climate Corporation | Agricultural implement and implement operator monitoring apparatus, systems, and methods |
| US10515425B2 (en) | 2014-04-01 | 2019-12-24 | The Climate Corporation | Agricultural implement and implement operator monitoring apparatus, systems, and methods |
| US10426087B2 (en) | 2014-04-11 | 2019-10-01 | Deere & Company | User interface performance graph for operation of a mobile machine |
| GB2555377A (en) * | 2016-10-13 | 2018-05-02 | Thermoteknix Systems Ltd | Monitoring system with interactive display interface |
| EP3689125B1 (en) | 2019-01-31 | 2022-11-30 | CNH Industrial Belgium N.V. | Combine loss monitor mapping |
| EP4169368A1 (en) * | 2021-07-28 | 2023-04-26 | Deere & Company | System for dynamically detecting alert conditions and optimization criteria |
Also Published As
| Publication number | Publication date |
|---|---|
| AU2015201810B2 (en) | 2019-06-20 |
| BR102015007934A2 (en) | 2015-12-29 |
| CN104977861B (en) | 2020-05-19 |
| US20150293507A1 (en) | 2015-10-15 |
| CN104977861A (en) | 2015-10-14 |
| AU2015201810A1 (en) | 2015-10-29 |
| EP2929773B1 (en) | 2018-01-31 |
| US10426087B2 (en) | 2019-10-01 |
Similar Documents
| Publication | Publication Date | Title |
|---|---|---|
| EP2929773B1 (en) | User interface performance graph for operation of a mobile machine | |
| US10209235B2 (en) | Sensing and surfacing of crop loss data | |
| US11635765B2 (en) | Crop state map generation and control system | |
| US9934538B2 (en) | Recalling crop-specific performance targets for controlling a mobile machine | |
| US20240090377A1 (en) | Map generation and control system | |
| US11983009B2 (en) | Map generation and control system | |
| US12063886B2 (en) | Machine control using a predictive map | |
| EP4159016A1 (en) | Historical crop state model, predictive crop state map generation and control system | |
| US11927459B2 (en) | Machine control using a predictive map | |
| US20220110238A1 (en) | Machine control using a predictive map | |
| US20240357964A1 (en) | Map generation and control system | |
| US20220110247A1 (en) | Crop state map generation and control system | |
| CN114793602A (en) | Machine control using a map with status regions | |
| EP3525050A1 (en) | State machine for multiple input-multiple output harvester control | |
| EP3146824B1 (en) | Control system for agricultural equipment | |
| US12013245B2 (en) | Predictive map generation and control system | |
| EP3981243B1 (en) | Map generation and control system | |
| EP3981235B1 (en) | Predictive map generation and control system |
Legal Events
| Date | Code | Title | Description |
|---|---|---|---|
| PUAI | Public reference made under article 153(3) epc to a published international application that has entered the european phase |
Free format text: ORIGINAL CODE: 0009012 |
|
| AK | Designated contracting states |
Kind code of ref document: A1 Designated state(s): AL AT BE BG CH CY CZ DE DK EE ES FI FR GB GR HR HU IE IS IT LI LT LU LV MC MK MT NL NO PL PT RO RS SE SI SK SM TR |
|
| AX | Request for extension of the european patent |
Extension state: BA ME |
|
| 17P | Request for examination filed |
Effective date: 20160414 |
|
| RBV | Designated contracting states (corrected) |
Designated state(s): AL AT BE BG CH CY CZ DE DK EE ES FI FR GB GR HR HU IE IS IT LI LT LU LV MC MK MT NL NO PL PT RO RS SE SI SK SM TR |
|
| GRAP | Despatch of communication of intention to grant a patent |
Free format text: ORIGINAL CODE: EPIDOSNIGR1 |
|
| INTG | Intention to grant announced |
Effective date: 20170919 |
|
| GRAS | Grant fee paid |
Free format text: ORIGINAL CODE: EPIDOSNIGR3 |
|
| GRAA | (expected) grant |
Free format text: ORIGINAL CODE: 0009210 |
|
| AK | Designated contracting states |
Kind code of ref document: B1 Designated state(s): AL AT BE BG CH CY CZ DE DK EE ES FI FR GB GR HR HU IE IS IT LI LT LU LV MC MK MT NL NO PL PT RO RS SE SI SK SM TR |
|
| REG | Reference to a national code |
Ref country code: GB Ref legal event code: FG4D Ref country code: CH Ref legal event code: EP |
|
| REG | Reference to a national code |
Ref country code: AT Ref legal event code: REF Ref document number: 966484 Country of ref document: AT Kind code of ref document: T Effective date: 20180215 |
|
| REG | Reference to a national code |
Ref country code: IE Ref legal event code: FG4D |
|
| REG | Reference to a national code |
Ref country code: DE Ref legal event code: R096 Ref document number: 602015007654 Country of ref document: DE |
|
| REG | Reference to a national code |
Ref country code: NL Ref legal event code: MP Effective date: 20180131 |
|
| REG | Reference to a national code |
Ref country code: LT Ref legal event code: MG4D |
|
| REG | Reference to a national code |
Ref country code: AT Ref legal event code: MK05 Ref document number: 966484 Country of ref document: AT Kind code of ref document: T Effective date: 20180131 |
|
| PG25 | Lapsed in a contracting state [announced via postgrant information from national office to epo] |
Ref country code: LT Free format text: LAPSE BECAUSE OF FAILURE TO SUBMIT A TRANSLATION OF THE DESCRIPTION OR TO PAY THE FEE WITHIN THE PRESCRIBED TIME-LIMIT Effective date: 20180131 Ref country code: FI Free format text: LAPSE BECAUSE OF FAILURE TO SUBMIT A TRANSLATION OF THE DESCRIPTION OR TO PAY THE FEE WITHIN THE PRESCRIBED TIME-LIMIT Effective date: 20180131 Ref country code: ES Free format text: LAPSE BECAUSE OF FAILURE TO SUBMIT A TRANSLATION OF THE DESCRIPTION OR TO PAY THE FEE WITHIN THE PRESCRIBED TIME-LIMIT Effective date: 20180131 Ref country code: NL Free format text: LAPSE BECAUSE OF FAILURE TO SUBMIT A TRANSLATION OF THE DESCRIPTION OR TO PAY THE FEE WITHIN THE PRESCRIBED TIME-LIMIT Effective date: 20180131 Ref country code: HR Free format text: LAPSE BECAUSE OF FAILURE TO SUBMIT A TRANSLATION OF THE DESCRIPTION OR TO PAY THE FEE WITHIN THE PRESCRIBED TIME-LIMIT Effective date: 20180131 Ref country code: NO Free format text: LAPSE BECAUSE OF FAILURE TO SUBMIT A TRANSLATION OF THE DESCRIPTION OR TO PAY THE FEE WITHIN THE PRESCRIBED TIME-LIMIT Effective date: 20180430 |
|
| PG25 | Lapsed in a contracting state [announced via postgrant information from national office to epo] |
Ref country code: GR Free format text: LAPSE BECAUSE OF FAILURE TO SUBMIT A TRANSLATION OF THE DESCRIPTION OR TO PAY THE FEE WITHIN THE PRESCRIBED TIME-LIMIT Effective date: 20180501 Ref country code: RS Free format text: LAPSE BECAUSE OF FAILURE TO SUBMIT A TRANSLATION OF THE DESCRIPTION OR TO PAY THE FEE WITHIN THE PRESCRIBED TIME-LIMIT Effective date: 20180131 Ref country code: AT Free format text: LAPSE BECAUSE OF FAILURE TO SUBMIT A TRANSLATION OF THE DESCRIPTION OR TO PAY THE FEE WITHIN THE PRESCRIBED TIME-LIMIT Effective date: 20180131 Ref country code: BG Free format text: LAPSE BECAUSE OF FAILURE TO SUBMIT A TRANSLATION OF THE DESCRIPTION OR TO PAY THE FEE WITHIN THE PRESCRIBED TIME-LIMIT Effective date: 20180430 Ref country code: LV Free format text: LAPSE BECAUSE OF FAILURE TO SUBMIT A TRANSLATION OF THE DESCRIPTION OR TO PAY THE FEE WITHIN THE PRESCRIBED TIME-LIMIT Effective date: 20180131 Ref country code: IS Free format text: LAPSE BECAUSE OF FAILURE TO SUBMIT A TRANSLATION OF THE DESCRIPTION OR TO PAY THE FEE WITHIN THE PRESCRIBED TIME-LIMIT Effective date: 20180531 Ref country code: SE Free format text: LAPSE BECAUSE OF FAILURE TO SUBMIT A TRANSLATION OF THE DESCRIPTION OR TO PAY THE FEE WITHIN THE PRESCRIBED TIME-LIMIT Effective date: 20180131 Ref country code: PL Free format text: LAPSE BECAUSE OF FAILURE TO SUBMIT A TRANSLATION OF THE DESCRIPTION OR TO PAY THE FEE WITHIN THE PRESCRIBED TIME-LIMIT Effective date: 20180131 |
|
| PG25 | Lapsed in a contracting state [announced via postgrant information from national office to epo] |
Ref country code: EE Free format text: LAPSE BECAUSE OF FAILURE TO SUBMIT A TRANSLATION OF THE DESCRIPTION OR TO PAY THE FEE WITHIN THE PRESCRIBED TIME-LIMIT Effective date: 20180131 Ref country code: RO Free format text: LAPSE BECAUSE OF FAILURE TO SUBMIT A TRANSLATION OF THE DESCRIPTION OR TO PAY THE FEE WITHIN THE PRESCRIBED TIME-LIMIT Effective date: 20180131 Ref country code: AL Free format text: LAPSE BECAUSE OF FAILURE TO SUBMIT A TRANSLATION OF THE DESCRIPTION OR TO PAY THE FEE WITHIN THE PRESCRIBED TIME-LIMIT Effective date: 20180131 |
|
| REG | Reference to a national code |
Ref country code: CH Ref legal event code: PL |
|
| REG | Reference to a national code |
Ref country code: DE Ref legal event code: R097 Ref document number: 602015007654 Country of ref document: DE |
|
| PG25 | Lapsed in a contracting state [announced via postgrant information from national office to epo] |
Ref country code: CZ Free format text: LAPSE BECAUSE OF FAILURE TO SUBMIT A TRANSLATION OF THE DESCRIPTION OR TO PAY THE FEE WITHIN THE PRESCRIBED TIME-LIMIT Effective date: 20180131 Ref country code: SK Free format text: LAPSE BECAUSE OF FAILURE TO SUBMIT A TRANSLATION OF THE DESCRIPTION OR TO PAY THE FEE WITHIN THE PRESCRIBED TIME-LIMIT Effective date: 20180131 Ref country code: MC Free format text: LAPSE BECAUSE OF FAILURE TO SUBMIT A TRANSLATION OF THE DESCRIPTION OR TO PAY THE FEE WITHIN THE PRESCRIBED TIME-LIMIT Effective date: 20180131 Ref country code: DK Free format text: LAPSE BECAUSE OF FAILURE TO SUBMIT A TRANSLATION OF THE DESCRIPTION OR TO PAY THE FEE WITHIN THE PRESCRIBED TIME-LIMIT Effective date: 20180131 Ref country code: SM Free format text: LAPSE BECAUSE OF FAILURE TO SUBMIT A TRANSLATION OF THE DESCRIPTION OR TO PAY THE FEE WITHIN THE PRESCRIBED TIME-LIMIT Effective date: 20180131 |
|
| PLBE | No opposition filed within time limit |
Free format text: ORIGINAL CODE: 0009261 |
|
| STAA | Information on the status of an ep patent application or granted ep patent |
Free format text: STATUS: NO OPPOSITION FILED WITHIN TIME LIMIT |
|
| REG | Reference to a national code |
Ref country code: IE Ref legal event code: MM4A |
|
| PG25 | Lapsed in a contracting state [announced via postgrant information from national office to epo] |
Ref country code: LU Free format text: LAPSE BECAUSE OF NON-PAYMENT OF DUE FEES Effective date: 20180320 |
|
| 26N | No opposition filed |
Effective date: 20181102 |
|
| PG25 | Lapsed in a contracting state [announced via postgrant information from national office to epo] |
Ref country code: IE Free format text: LAPSE BECAUSE OF NON-PAYMENT OF DUE FEES Effective date: 20180320 |
|
| PG25 | Lapsed in a contracting state [announced via postgrant information from national office to epo] |
Ref country code: SI Free format text: LAPSE BECAUSE OF FAILURE TO SUBMIT A TRANSLATION OF THE DESCRIPTION OR TO PAY THE FEE WITHIN THE PRESCRIBED TIME-LIMIT Effective date: 20180131 Ref country code: CH Free format text: LAPSE BECAUSE OF NON-PAYMENT OF DUE FEES Effective date: 20180331 Ref country code: LI Free format text: LAPSE BECAUSE OF NON-PAYMENT OF DUE FEES Effective date: 20180331 |
|
| PG25 | Lapsed in a contracting state [announced via postgrant information from national office to epo] |
Ref country code: FR Free format text: LAPSE BECAUSE OF NON-PAYMENT OF DUE FEES Effective date: 20180331 |
|
| GBPC | Gb: european patent ceased through non-payment of renewal fee |
Effective date: 20190320 |
|
| PG25 | Lapsed in a contracting state [announced via postgrant information from national office to epo] |
Ref country code: GB Free format text: LAPSE BECAUSE OF NON-PAYMENT OF DUE FEES Effective date: 20190320 Ref country code: MT Free format text: LAPSE BECAUSE OF NON-PAYMENT OF DUE FEES Effective date: 20180320 |
|
| PG25 | Lapsed in a contracting state [announced via postgrant information from national office to epo] |
Ref country code: TR Free format text: LAPSE BECAUSE OF FAILURE TO SUBMIT A TRANSLATION OF THE DESCRIPTION OR TO PAY THE FEE WITHIN THE PRESCRIBED TIME-LIMIT Effective date: 20180131 |
|
| PG25 | Lapsed in a contracting state [announced via postgrant information from national office to epo] |
Ref country code: PT Free format text: LAPSE BECAUSE OF FAILURE TO SUBMIT A TRANSLATION OF THE DESCRIPTION OR TO PAY THE FEE WITHIN THE PRESCRIBED TIME-LIMIT Effective date: 20180131 |
|
| PG25 | Lapsed in a contracting state [announced via postgrant information from national office to epo] |
Ref country code: CY Free format text: LAPSE BECAUSE OF FAILURE TO SUBMIT A TRANSLATION OF THE DESCRIPTION OR TO PAY THE FEE WITHIN THE PRESCRIBED TIME-LIMIT Effective date: 20180131 Ref country code: MK Free format text: LAPSE BECAUSE OF NON-PAYMENT OF DUE FEES Effective date: 20180131 Ref country code: HU Free format text: LAPSE BECAUSE OF FAILURE TO SUBMIT A TRANSLATION OF THE DESCRIPTION OR TO PAY THE FEE WITHIN THE PRESCRIBED TIME-LIMIT; INVALID AB INITIO Effective date: 20150320 |
|
| PGFP | Annual fee paid to national office [announced via postgrant information from national office to epo] |
Ref country code: IT Payment date: 20220322 Year of fee payment: 8 |
|
| PG25 | Lapsed in a contracting state [announced via postgrant information from national office to epo] |
Ref country code: IT Free format text: LAPSE BECAUSE OF NON-PAYMENT OF DUE FEES Effective date: 20230320 |
|
| PGFP | Annual fee paid to national office [announced via postgrant information from national office to epo] |
Ref country code: DE Payment date: 20240221 Year of fee payment: 10 |
|
| PGFP | Annual fee paid to national office [announced via postgrant information from national office to epo] |
Ref country code: BE Payment date: 20240327 Year of fee payment: 10 |