EP2925885B1 - Molecular diagnostic test for cancer - Google Patents
Molecular diagnostic test for cancer Download PDFInfo
- Publication number
- EP2925885B1 EP2925885B1 EP13808178.1A EP13808178A EP2925885B1 EP 2925885 B1 EP2925885 B1 EP 2925885B1 EP 13808178 A EP13808178 A EP 13808178A EP 2925885 B1 EP2925885 B1 EP 2925885B1
- Authority
- EP
- European Patent Office
- Prior art keywords
- sense
- fully exonic
- expression
- dna
- homo sapiens
- Prior art date
- Legal status (The legal status is an assumption and is not a legal conclusion. Google has not performed a legal analysis and makes no representation as to the accuracy of the status listed.)
- Active
Links
- 206010028980 Neoplasm Diseases 0.000 title claims description 154
- 201000011510 cancer Diseases 0.000 title claims description 102
- 238000002405 diagnostic procedure Methods 0.000 title description 6
- 239000000090 biomarker Substances 0.000 claims description 393
- 230000014509 gene expression Effects 0.000 claims description 333
- 239000000523 sample Substances 0.000 claims description 200
- 238000000034 method Methods 0.000 claims description 151
- 239000003814 drug Substances 0.000 claims description 91
- 206010033128 Ovarian cancer Diseases 0.000 claims description 62
- 229940124597 therapeutic agent Drugs 0.000 claims description 61
- 210000001519 tissue Anatomy 0.000 claims description 59
- 206010061535 Ovarian neoplasm Diseases 0.000 claims description 54
- 230000001772 anti-angiogenic effect Effects 0.000 claims description 42
- 238000002493 microarray Methods 0.000 claims description 40
- 229960000397 bevacizumab Drugs 0.000 claims description 35
- 238000004393 prognosis Methods 0.000 claims description 34
- 230000004043 responsiveness Effects 0.000 claims description 34
- 230000004083 survival effect Effects 0.000 claims description 34
- 238000011282 treatment Methods 0.000 claims description 34
- 238000012360 testing method Methods 0.000 claims description 27
- 239000003795 chemical substances by application Substances 0.000 claims description 26
- 101001076292 Homo sapiens Insulin-like growth factor II Proteins 0.000 claims description 24
- 102100025947 Insulin-like growth factor II Human genes 0.000 claims description 24
- 102100037362 Fibronectin Human genes 0.000 claims description 21
- 101001027128 Homo sapiens Fibronectin Proteins 0.000 claims description 21
- 102100037156 Gap junction beta-2 protein Human genes 0.000 claims description 20
- 101000954092 Homo sapiens Gap junction beta-2 protein Proteins 0.000 claims description 20
- 101000864786 Homo sapiens Secreted frizzled-related protein 2 Proteins 0.000 claims description 20
- 101000633605 Homo sapiens Thrombospondin-2 Proteins 0.000 claims description 20
- 102100030054 Secreted frizzled-related protein 2 Human genes 0.000 claims description 20
- 102100029529 Thrombospondin-2 Human genes 0.000 claims description 20
- 102100024337 Collagen alpha-1(VIII) chain Human genes 0.000 claims description 19
- 206010009944 Colon cancer Diseases 0.000 claims description 19
- 101000909492 Homo sapiens Collagen alpha-1(VIII) chain Proteins 0.000 claims description 19
- 102100027004 Inhibin beta A chain Human genes 0.000 claims description 19
- 108010019691 inhibin beta A subunit Proteins 0.000 claims description 19
- 230000001225 therapeutic effect Effects 0.000 claims description 19
- 101000638886 Homo sapiens Urokinase-type plasminogen activator Proteins 0.000 claims description 18
- 102100023915 Insulin Human genes 0.000 claims description 18
- 102100031358 Urokinase-type plasminogen activator Human genes 0.000 claims description 18
- 102100026802 72 kDa type IV collagenase Human genes 0.000 claims description 16
- 206010006187 Breast cancer Diseases 0.000 claims description 16
- 208000026310 Breast neoplasm Diseases 0.000 claims description 16
- 101000627872 Homo sapiens 72 kDa type IV collagenase Proteins 0.000 claims description 16
- 238000012549 training Methods 0.000 claims description 16
- 230000037361 pathway Effects 0.000 claims description 14
- -1 CXCR2P1 Proteins 0.000 claims description 13
- 101001060862 Homo sapiens Ras-related protein Rab-31 Proteins 0.000 claims description 13
- 102100027838 Ras-related protein Rab-31 Human genes 0.000 claims description 13
- 102000005789 Vascular Endothelial Growth Factors Human genes 0.000 claims description 13
- 108010019530 Vascular Endothelial Growth Factors Proteins 0.000 claims description 13
- 230000002491 angiogenic effect Effects 0.000 claims description 13
- 238000003018 immunoassay Methods 0.000 claims description 13
- 101710088083 Glomulin Proteins 0.000 claims description 12
- 102100023832 Prolyl endopeptidase FAP Human genes 0.000 claims description 12
- 108091006277 SLC5A1 Proteins 0.000 claims description 12
- 102000058090 Sodium-Glucose Transporter 1 Human genes 0.000 claims description 12
- 208000001333 Colorectal Neoplasms Diseases 0.000 claims description 11
- 208000005017 glioblastoma Diseases 0.000 claims description 11
- 102100039435 C-X-C motif chemokine 17 Human genes 0.000 claims description 10
- 102100023708 Coiled-coil domain-containing protein 80 Human genes 0.000 claims description 10
- 101000889048 Homo sapiens C-X-C motif chemokine 17 Proteins 0.000 claims description 10
- 101000978383 Homo sapiens Coiled-coil domain-containing protein 80 Proteins 0.000 claims description 10
- 101000825086 Homo sapiens Transcription factor SOX-11 Proteins 0.000 claims description 10
- 206010060862 Prostate cancer Diseases 0.000 claims description 10
- 208000000236 Prostatic Neoplasms Diseases 0.000 claims description 10
- 102100022415 Transcription factor SOX-11 Human genes 0.000 claims description 10
- 108091046261 miR-198 stem-loop Proteins 0.000 claims description 10
- 239000003112 inhibitor Substances 0.000 claims description 9
- 102100027995 Collagenase 3 Human genes 0.000 claims description 8
- 101000577887 Homo sapiens Collagenase 3 Proteins 0.000 claims description 8
- 101000977638 Homo sapiens Immunoglobulin superfamily containing leucine-rich repeat protein Proteins 0.000 claims description 8
- 102100023538 Immunoglobulin superfamily containing leucine-rich repeat protein Human genes 0.000 claims description 8
- 239000004037 angiogenesis inhibitor Substances 0.000 claims description 8
- 229940120638 avastin Drugs 0.000 claims description 8
- 238000004422 calculation algorithm Methods 0.000 claims description 8
- 208000029742 colonic neoplasm Diseases 0.000 claims description 8
- 102100024155 Cadherin-11 Human genes 0.000 claims description 7
- 102100033424 Glutamine-fructose-6-phosphate aminotransferase [isomerizing] 2 Human genes 0.000 claims description 7
- 101000762236 Homo sapiens Cadherin-11 Proteins 0.000 claims description 7
- 101000997966 Homo sapiens Glutamine-fructose-6-phosphate aminotransferase [isomerizing] 2 Proteins 0.000 claims description 7
- 101000976075 Homo sapiens Insulin Proteins 0.000 claims description 7
- 101000575378 Homo sapiens Microfibrillar-associated protein 2 Proteins 0.000 claims description 7
- 101000635777 Homo sapiens Receptor-transporting protein 4 Proteins 0.000 claims description 7
- 101000787917 Homo sapiens Transmembrane protein 200A Proteins 0.000 claims description 7
- 102100025599 Microfibrillar-associated protein 2 Human genes 0.000 claims description 7
- 102100030854 Receptor-transporting protein 4 Human genes 0.000 claims description 7
- 102100025940 Transmembrane protein 200A Human genes 0.000 claims description 7
- 230000031018 biological processes and functions Effects 0.000 claims description 7
- ZBNZXTGUTAYRHI-UHFFFAOYSA-N Dasatinib Chemical compound C=1C(N2CCN(CCO)CC2)=NC(C)=NC=1NC(S1)=NC=C1C(=O)NC1=C(C)C=CC=C1Cl ZBNZXTGUTAYRHI-UHFFFAOYSA-N 0.000 claims description 6
- 101001095308 Homo sapiens Periostin Proteins 0.000 claims description 6
- 101000831866 Homo sapiens Transmembrane protein 45A Proteins 0.000 claims description 6
- 239000002067 L01XE06 - Dasatinib Substances 0.000 claims description 6
- 108010072582 Matrilin Proteins Proteins 0.000 claims description 6
- 102100033670 Matrilin-3 Human genes 0.000 claims description 6
- 102100037765 Periostin Human genes 0.000 claims description 6
- 102100024186 Transmembrane protein 45A Human genes 0.000 claims description 6
- 210000002307 prostate Anatomy 0.000 claims description 6
- 238000003753 real-time PCR Methods 0.000 claims description 5
- ZHBXLZQQVCDGPA-UHFFFAOYSA-N 5-[(1,3-dioxo-2-benzofuran-5-yl)sulfonyl]-2-benzofuran-1,3-dione Chemical compound C1=C2C(=O)OC(=O)C2=CC(S(=O)(=O)C=2C=C3C(=O)OC(C3=CC=2)=O)=C1 ZHBXLZQQVCDGPA-UHFFFAOYSA-N 0.000 claims description 4
- 102100033825 Collagen alpha-1(XI) chain Human genes 0.000 claims description 4
- 101000710623 Homo sapiens Collagen alpha-1(XI) chain Proteins 0.000 claims description 4
- 101000918141 Homo sapiens Protein eva-1 homolog C Proteins 0.000 claims description 4
- 239000002147 L01XE04 - Sunitinib Substances 0.000 claims description 4
- 239000005536 L01XE08 - Nilotinib Substances 0.000 claims description 4
- 239000003798 L01XE11 - Pazopanib Substances 0.000 claims description 4
- 102100029273 Protein eva-1 homolog C Human genes 0.000 claims description 4
- 230000008236 biological pathway Effects 0.000 claims description 4
- 229960002412 cediranib Drugs 0.000 claims description 4
- 229960002448 dasatinib Drugs 0.000 claims description 4
- 230000002519 immonomodulatory effect Effects 0.000 claims description 4
- HHZIURLSWUIHRB-UHFFFAOYSA-N nilotinib Chemical compound C1=NC(C)=CN1C1=CC(NC(=O)C=2C=C(NC=3N=C(C=CN=3)C=3C=NC=CC=3)C(C)=CC=2)=CC(C(F)(F)F)=C1 HHZIURLSWUIHRB-UHFFFAOYSA-N 0.000 claims description 4
- CUIHSIWYWATEQL-UHFFFAOYSA-N pazopanib Chemical compound C1=CC2=C(C)N(C)N=C2C=C1N(C)C(N=1)=CC=NC=1NC1=CC=C(C)C(S(N)(=O)=O)=C1 CUIHSIWYWATEQL-UHFFFAOYSA-N 0.000 claims description 4
- 229960002633 ramucirumab Drugs 0.000 claims description 4
- 101000852489 Homo sapiens Inositol 1,4,5-triphosphate receptor associated 1 Proteins 0.000 claims description 3
- 101001000631 Homo sapiens Peripheral myelin protein 22 Proteins 0.000 claims description 3
- 101001082860 Homo sapiens Peroxisomal membrane protein 2 Proteins 0.000 claims description 3
- 101000873646 Homo sapiens Protein bicaudal C homolog 1 Proteins 0.000 claims description 3
- 102100036344 Inositol 1,4,5-triphosphate receptor associated 1 Human genes 0.000 claims description 3
- 102100030564 Peroxisomal membrane protein 2 Human genes 0.000 claims description 3
- 102100035896 Protein bicaudal C homolog 1 Human genes 0.000 claims description 3
- 229960000575 trastuzumab Drugs 0.000 claims description 3
- KCOYQXZDFIIGCY-CZIZESTLSA-N (3e)-4-amino-5-fluoro-3-[5-(4-methylpiperazin-1-yl)-1,3-dihydrobenzimidazol-2-ylidene]quinolin-2-one Chemical compound C1CN(C)CCN1C1=CC=C(N\C(N2)=C/3C(=C4C(F)=CC=CC4=NC\3=O)N)C2=C1 KCOYQXZDFIIGCY-CZIZESTLSA-N 0.000 claims description 2
- JRMGHBVACUJCRP-BTJKTKAUSA-N (z)-but-2-enedioic acid;4-[(4-fluoro-2-methyl-1h-indol-5-yl)oxy]-6-methoxy-7-(3-pyrrolidin-1-ylpropoxy)quinazoline Chemical compound OC(=O)\C=C/C(O)=O.COC1=CC2=C(OC=3C(=C4C=C(C)NC4=CC=3)F)N=CN=C2C=C1OCCCN1CCCC1 JRMGHBVACUJCRP-BTJKTKAUSA-N 0.000 claims description 2
- UEJJHQNACJXSKW-UHFFFAOYSA-N 2-(2,6-dioxopiperidin-3-yl)-1H-isoindole-1,3(2H)-dione Chemical compound O=C1C2=CC=CC=C2C(=O)N1C1CCC(=O)NC1=O UEJJHQNACJXSKW-UHFFFAOYSA-N 0.000 claims description 2
- XXJWYDDUDKYVKI-UHFFFAOYSA-N 4-[(4-fluoro-2-methyl-1H-indol-5-yl)oxy]-6-methoxy-7-[3-(1-pyrrolidinyl)propoxy]quinazoline Chemical compound COC1=CC2=C(OC=3C(=C4C=C(C)NC4=CC=3)F)N=CN=C2C=C1OCCCN1CCCC1 XXJWYDDUDKYVKI-UHFFFAOYSA-N 0.000 claims description 2
- 102400000068 Angiostatin Human genes 0.000 claims description 2
- 108010079709 Angiostatins Proteins 0.000 claims description 2
- 102000003916 Arrestin Human genes 0.000 claims description 2
- 108090000328 Arrestin Proteins 0.000 claims description 2
- MLDQJTXFUGDVEO-UHFFFAOYSA-N BAY-43-9006 Chemical compound C1=NC(C(=O)NC)=CC(OC=2C=CC(NC(=O)NC=3C=C(C(Cl)=CC=3)C(F)(F)F)=CC=2)=C1 MLDQJTXFUGDVEO-UHFFFAOYSA-N 0.000 claims description 2
- 102400000730 Canstatin Human genes 0.000 claims description 2
- 101800000626 Canstatin Proteins 0.000 claims description 2
- 102100031186 Chromogranin-A Human genes 0.000 claims description 2
- 108010079505 Endostatins Proteins 0.000 claims description 2
- 108010047761 Interferon-alpha Proteins 0.000 claims description 2
- 102000006992 Interferon-alpha Human genes 0.000 claims description 2
- 239000005551 L01XE03 - Erlotinib Substances 0.000 claims description 2
- FZCSTZYAHCUGEM-UHFFFAOYSA-N aspergillomarasmine B Natural products OC(=O)CNC(C(O)=O)CNC(C(O)=O)CC(O)=O FZCSTZYAHCUGEM-UHFFFAOYSA-N 0.000 claims description 2
- RITAVMQDGBJQJZ-FMIVXFBMSA-N axitinib Chemical compound CNC(=O)C1=CC=CC=C1SC1=CC=C(C(\C=C\C=2N=CC=CC=2)=NN2)C2=C1 RITAVMQDGBJQJZ-FMIVXFBMSA-N 0.000 claims description 2
- AEULIVPVIDOLIN-UHFFFAOYSA-N cep-11981 Chemical compound C1=C2C3=C4CNC(=O)C4=C4C5=CN(C)N=C5CCC4=C3N(CC(C)C)C2=CC=C1NC1=NC=CC=N1 AEULIVPVIDOLIN-UHFFFAOYSA-N 0.000 claims description 2
- PIQCTGMSNWUMAF-UHFFFAOYSA-N chembl522892 Chemical compound C1CN(C)CCN1C1=CC=C(NC(=N2)C=3C(NC4=CC=CC(F)=C4C=3N)=O)C2=C1 PIQCTGMSNWUMAF-UHFFFAOYSA-N 0.000 claims description 2
- 229950005778 dovitinib Drugs 0.000 claims description 2
- 229960001433 erlotinib Drugs 0.000 claims description 2
- AAKJLRGGTJKAMG-UHFFFAOYSA-N erlotinib Chemical compound C=12C=C(OCCOC)C(OCCOC)=CC2=NC=NC=1NC1=CC=CC(C#C)=C1 AAKJLRGGTJKAMG-UHFFFAOYSA-N 0.000 claims description 2
- XGALLCVXEZPNRQ-UHFFFAOYSA-N gefitinib Chemical compound C=12C=C(OCCCN3CCOCC3)C(OC)=CC2=NC=NC=1NC1=CC=C(F)C(Cl)=C1 XGALLCVXEZPNRQ-UHFFFAOYSA-N 0.000 claims description 2
- 229940022353 herceptin Drugs 0.000 claims description 2
- KTUFNOKKBVMGRW-UHFFFAOYSA-N imatinib Chemical compound C1CN(C)CCN1CC1=CC=C(C(=O)NC=2C=C(NC=3N=C(C=CN=3)C=3C=NC=CC=3)C(C)=CC=2)C=C1 KTUFNOKKBVMGRW-UHFFFAOYSA-N 0.000 claims description 2
- 229960004942 lenalidomide Drugs 0.000 claims description 2
- GOTYRUGSSMKFNF-UHFFFAOYSA-N lenalidomide Chemical compound C1C=2C(N)=CC=CC=2C(=O)N1C1CCC(=O)NC1=O GOTYRUGSSMKFNF-UHFFFAOYSA-N 0.000 claims description 2
- MPVGZUGXCQEXTM-UHFFFAOYSA-N linifanib Chemical compound CC1=CC=C(F)C(NC(=O)NC=2C=CC(=CC=2)C=2C=3C(N)=NNC=3C=CC=2)=C1 MPVGZUGXCQEXTM-UHFFFAOYSA-N 0.000 claims description 2
- CPMDPSXJELVGJG-UHFFFAOYSA-N methyl 2-hydroxy-3-[N-[4-[methyl-[2-(4-methylpiperazin-1-yl)acetyl]amino]phenyl]-C-phenylcarbonimidoyl]-1H-indole-6-carboxylate Chemical compound OC=1NC2=CC(=CC=C2C=1C(=NC1=CC=C(C=C1)N(C(CN1CCN(CC1)C)=O)C)C1=CC=CC=C1)C(=O)OC CPMDPSXJELVGJG-UHFFFAOYSA-N 0.000 claims description 2
- 229950003968 motesanib Drugs 0.000 claims description 2
- RAHBGWKEPAQNFF-UHFFFAOYSA-N motesanib Chemical compound C=1C=C2C(C)(C)CNC2=CC=1NC(=O)C1=CC=CN=C1NCC1=CC=NC=C1 RAHBGWKEPAQNFF-UHFFFAOYSA-N 0.000 claims description 2
- LBWFXVZLPYTWQI-IPOVEDGCSA-N n-[2-(diethylamino)ethyl]-5-[(z)-(5-fluoro-2-oxo-1h-indol-3-ylidene)methyl]-2,4-dimethyl-1h-pyrrole-3-carboxamide;(2s)-2-hydroxybutanedioic acid Chemical compound OC(=O)[C@@H](O)CC(O)=O.CCN(CC)CCNC(=O)C1=C(C)NC(\C=C/2C3=CC(F)=CC=C3NC\2=O)=C1C LBWFXVZLPYTWQI-IPOVEDGCSA-N 0.000 claims description 2
- 229960001346 nilotinib Drugs 0.000 claims description 2
- 229960000639 pazopanib Drugs 0.000 claims description 2
- 229950003647 semaxanib Drugs 0.000 claims description 2
- WUWDLXZGHZSWQZ-WQLSENKSSA-N semaxanib Chemical compound N1C(C)=CC(C)=C1\C=C/1C2=CC=CC=C2NC\1=O WUWDLXZGHZSWQZ-WQLSENKSSA-N 0.000 claims description 2
- 229940068117 sprycel Drugs 0.000 claims description 2
- 229960001796 sunitinib Drugs 0.000 claims description 2
- WINHZLLDWRZWRT-ATVHPVEESA-N sunitinib Chemical compound CCN(CC)CCNC(=O)C1=C(C)NC(\C=C/2C3=CC(F)=CC=C3NC\2=O)=C1C WINHZLLDWRZWRT-ATVHPVEESA-N 0.000 claims description 2
- 229940034785 sutent Drugs 0.000 claims description 2
- 229940069905 tasigna Drugs 0.000 claims description 2
- 229960003433 thalidomide Drugs 0.000 claims description 2
- 108010075758 trebananib Proteins 0.000 claims description 2
- 108010012374 type IV collagen alpha3 chain Proteins 0.000 claims description 2
- UHTHHESEBZOYNR-UHFFFAOYSA-N vandetanib Chemical compound COC1=CC(C(/N=CN2)=N/C=3C(=CC(Br)=CC=3)F)=C2C=C1OCC1CCN(C)CC1 UHTHHESEBZOYNR-UHFFFAOYSA-N 0.000 claims description 2
- 108010060757 vasostatin Proteins 0.000 claims description 2
- 229950000578 vatalanib Drugs 0.000 claims description 2
- YCOYDOIWSSHVCK-UHFFFAOYSA-N vatalanib Chemical compound C1=CC(Cl)=CC=C1NC(C1=CC=CC=C11)=NN=C1CC1=CC=NC=C1 YCOYDOIWSSHVCK-UHFFFAOYSA-N 0.000 claims description 2
- 229940069559 votrient Drugs 0.000 claims description 2
- 102400001047 Endostatin Human genes 0.000 claims 1
- 102400000731 Tumstatin Human genes 0.000 claims 1
- 241000282414 Homo sapiens Species 0.000 description 985
- 108020004414 DNA Proteins 0.000 description 978
- 108090000623 proteins and genes Proteins 0.000 description 147
- 230000000692 anti-sense effect Effects 0.000 description 126
- 230000033115 angiogenesis Effects 0.000 description 123
- 208000037265 diseases, disorders, signs and symptoms Diseases 0.000 description 47
- 201000010099 disease Diseases 0.000 description 46
- 239000012472 biological sample Substances 0.000 description 38
- 230000008569 process Effects 0.000 description 37
- 238000003556 assay Methods 0.000 description 36
- 230000000875 corresponding effect Effects 0.000 description 34
- 238000004458 analytical method Methods 0.000 description 32
- 108091032973 (ribonucleotides)n+m Proteins 0.000 description 29
- 230000004044 response Effects 0.000 description 29
- 210000004027 cell Anatomy 0.000 description 28
- 239000002299 complementary DNA Substances 0.000 description 28
- 150000007523 nucleic acids Chemical class 0.000 description 28
- 102000039446 nucleic acids Human genes 0.000 description 24
- 108020004707 nucleic acids Proteins 0.000 description 24
- 238000009396 hybridization Methods 0.000 description 23
- 108020004999 messenger RNA Proteins 0.000 description 23
- 102000004169 proteins and genes Human genes 0.000 description 23
- 101000840272 Homo sapiens Immunoglobulin lambda constant 3 Proteins 0.000 description 21
- 102100029619 Immunoglobulin lambda constant 3 Human genes 0.000 description 21
- 229940079593 drug Drugs 0.000 description 19
- 230000006870 function Effects 0.000 description 18
- 239000000047 product Substances 0.000 description 18
- 101001043321 Homo sapiens Lysyl oxidase homolog 1 Proteins 0.000 description 17
- 102100021958 Lysyl oxidase homolog 1 Human genes 0.000 description 17
- 102100026261 Metalloproteinase inhibitor 3 Human genes 0.000 description 17
- 108010031429 Tissue Inhibitor of Metalloproteinase-3 Proteins 0.000 description 17
- 101000860430 Homo sapiens Versican core protein Proteins 0.000 description 16
- 102100028437 Versican core protein Human genes 0.000 description 16
- 208000007571 Ovarian Epithelial Carcinoma Diseases 0.000 description 15
- 239000003153 chemical reaction reagent Substances 0.000 description 15
- 239000013610 patient sample Substances 0.000 description 15
- 101001065609 Homo sapiens Lumican Proteins 0.000 description 14
- 102100032114 Lumican Human genes 0.000 description 14
- 238000003491 array Methods 0.000 description 14
- 238000011161 development Methods 0.000 description 14
- 230000018109 developmental process Effects 0.000 description 14
- 238000005516 engineering process Methods 0.000 description 14
- 238000010230 functional analysis Methods 0.000 description 14
- 230000002611 ovarian Effects 0.000 description 14
- 238000003908 quality control method Methods 0.000 description 14
- 101150100859 45 gene Proteins 0.000 description 13
- 101150026651 63 gene Proteins 0.000 description 13
- 239000000463 material Substances 0.000 description 13
- 230000032665 vasculature development Effects 0.000 description 13
- YBJHBAHKTGYVGT-ZKWXMUAHSA-N (+)-Biotin Chemical compound N1C(=O)N[C@@H]2[C@H](CCCCC(=O)O)SC[C@@H]21 YBJHBAHKTGYVGT-ZKWXMUAHSA-N 0.000 description 12
- 102100030401 Biglycan Human genes 0.000 description 12
- 102100023226 Early growth response protein 1 Human genes 0.000 description 12
- 101001126865 Homo sapiens Biglycan Proteins 0.000 description 12
- 101001049697 Homo sapiens Early growth response protein 1 Proteins 0.000 description 12
- 108091026053 miR-1245 stem-loop Proteins 0.000 description 12
- 102100033804 Alpha-protein kinase 2 Human genes 0.000 description 11
- 102100031611 Collagen alpha-1(III) chain Human genes 0.000 description 11
- 102100036213 Collagen alpha-2(I) chain Human genes 0.000 description 11
- 101000779565 Homo sapiens Alpha-protein kinase 2 Proteins 0.000 description 11
- 101000993285 Homo sapiens Collagen alpha-1(III) chain Proteins 0.000 description 11
- 101000875067 Homo sapiens Collagen alpha-2(I) chain Proteins 0.000 description 11
- 101000840271 Homo sapiens Immunoglobulin lambda constant 2 Proteins 0.000 description 11
- 101000994369 Homo sapiens Integrin alpha-5 Proteins 0.000 description 11
- 101000972890 Homo sapiens Protein naked cuticle homolog 2 Proteins 0.000 description 11
- 102100029620 Immunoglobulin lambda constant 2 Human genes 0.000 description 11
- 102100032817 Integrin alpha-5 Human genes 0.000 description 11
- 102100022619 Protein naked cuticle homolog 2 Human genes 0.000 description 11
- 238000002790 cross-validation Methods 0.000 description 11
- 230000012010 growth Effects 0.000 description 11
- 230000028993 immune response Effects 0.000 description 11
- 238000002560 therapeutic procedure Methods 0.000 description 11
- 101150055869 25 gene Proteins 0.000 description 10
- 108010044012 STAT1 Transcription Factor Proteins 0.000 description 10
- 102100029904 Signal transducer and activator of transcription 1-alpha/beta Human genes 0.000 description 10
- 230000008901 benefit Effects 0.000 description 10
- 108091070501 miRNA Proteins 0.000 description 10
- 239000002679 microRNA Substances 0.000 description 10
- 238000010200 validation analysis Methods 0.000 description 10
- 230000027455 binding Effects 0.000 description 9
- 238000001514 detection method Methods 0.000 description 9
- 102100031168 CCN family member 2 Human genes 0.000 description 8
- 238000002965 ELISA Methods 0.000 description 8
- WSFSSNUMVMOOMR-UHFFFAOYSA-N Formaldehyde Chemical compound O=C WSFSSNUMVMOOMR-UHFFFAOYSA-N 0.000 description 8
- 101000777550 Homo sapiens CCN family member 2 Proteins 0.000 description 8
- 101000840257 Homo sapiens Immunoglobulin kappa constant Proteins 0.000 description 8
- 102100029572 Immunoglobulin kappa constant Human genes 0.000 description 8
- 108010083162 Twist-Related Protein 1 Proteins 0.000 description 8
- 102100030398 Twist-related protein 1 Human genes 0.000 description 8
- 238000002512 chemotherapy Methods 0.000 description 8
- 230000003828 downregulation Effects 0.000 description 8
- 230000004547 gene signature Effects 0.000 description 8
- 238000013178 mathematical model Methods 0.000 description 8
- 230000007170 pathology Effects 0.000 description 8
- 230000011664 signaling Effects 0.000 description 8
- 238000011269 treatment regimen Methods 0.000 description 8
- 102100036217 Collagen alpha-1(X) chain Human genes 0.000 description 7
- 102100027442 Collagen alpha-1(XII) chain Human genes 0.000 description 7
- 101000875027 Homo sapiens Collagen alpha-1(X) chain Proteins 0.000 description 7
- 101000861874 Homo sapiens Collagen alpha-1(XII) chain Proteins 0.000 description 7
- 101000840566 Homo sapiens Insulin-like growth factor-binding protein 5 Proteins 0.000 description 7
- 101001011906 Homo sapiens Matrix metalloproteinase-14 Proteins 0.000 description 7
- 101000805613 Homo sapiens Vacuole membrane protein 1 Proteins 0.000 description 7
- 102100029225 Insulin-like growth factor-binding protein 5 Human genes 0.000 description 7
- 102100030216 Matrix metalloproteinase-14 Human genes 0.000 description 7
- 102100040557 Osteopontin Human genes 0.000 description 7
- 101710168942 Sphingosine-1-phosphate phosphatase 1 Proteins 0.000 description 7
- 102100038001 Vacuole membrane protein 1 Human genes 0.000 description 7
- 238000013459 approach Methods 0.000 description 7
- 230000000295 complement effect Effects 0.000 description 7
- 239000012634 fragment Substances 0.000 description 7
- 102000040430 polynucleotide Human genes 0.000 description 7
- 108091033319 polynucleotide Proteins 0.000 description 7
- 239000002157 polynucleotide Substances 0.000 description 7
- 238000007781 pre-processing Methods 0.000 description 7
- 230000035945 sensitivity Effects 0.000 description 7
- 230000003827 upregulation Effects 0.000 description 7
- 102100025672 Angiopoietin-related protein 2 Human genes 0.000 description 6
- 102100033601 Collagen alpha-1(I) chain Human genes 0.000 description 6
- 102100031502 Collagen alpha-2(V) chain Human genes 0.000 description 6
- 102100028976 HLA class I histocompatibility antigen, B alpha chain Human genes 0.000 description 6
- 108010058607 HLA-B Antigens Proteins 0.000 description 6
- 101000693081 Homo sapiens Angiopoietin-related protein 2 Proteins 0.000 description 6
- 101000941594 Homo sapiens Collagen alpha-2(V) chain Proteins 0.000 description 6
- 101000961156 Homo sapiens Immunoglobulin heavy constant gamma 1 Proteins 0.000 description 6
- 101000830565 Homo sapiens Tumor necrosis factor ligand superfamily member 10 Proteins 0.000 description 6
- 102100039345 Immunoglobulin heavy constant gamma 1 Human genes 0.000 description 6
- 206010058467 Lung neoplasm malignant Diseases 0.000 description 6
- 238000011529 RT qPCR Methods 0.000 description 6
- 102100024598 Tumor necrosis factor ligand superfamily member 10 Human genes 0.000 description 6
- 108091007416 X-inactive specific transcript Proteins 0.000 description 6
- 108091035715 XIST (gene) Proteins 0.000 description 6
- 108010029483 alpha 1 Chain Collagen Type I Proteins 0.000 description 6
- 230000003321 amplification Effects 0.000 description 6
- 239000012491 analyte Substances 0.000 description 6
- 238000001574 biopsy Methods 0.000 description 6
- 229960002685 biotin Drugs 0.000 description 6
- 235000020958 biotin Nutrition 0.000 description 6
- 239000011616 biotin Substances 0.000 description 6
- 238000006243 chemical reaction Methods 0.000 description 6
- 238000012937 correction Methods 0.000 description 6
- 230000034994 death Effects 0.000 description 6
- 238000009826 distribution Methods 0.000 description 6
- 230000008030 elimination Effects 0.000 description 6
- 238000003379 elimination reaction Methods 0.000 description 6
- 201000005202 lung cancer Diseases 0.000 description 6
- 208000020816 lung neoplasm Diseases 0.000 description 6
- 239000011159 matrix material Substances 0.000 description 6
- 238000003199 nucleic acid amplification method Methods 0.000 description 6
- 239000012188 paraffin wax Substances 0.000 description 6
- BASFCYQUMIYNBI-UHFFFAOYSA-N platinum Substances [Pt] BASFCYQUMIYNBI-UHFFFAOYSA-N 0.000 description 6
- 108090000765 processed proteins & peptides Proteins 0.000 description 6
- 238000011255 standard chemotherapy Methods 0.000 description 6
- 238000011285 therapeutic regimen Methods 0.000 description 6
- 102100036451 Apolipoprotein C-I Human genes 0.000 description 5
- 101000693933 Arabidopsis thaliana Fructose-bisphosphate aldolase 8, cytosolic Proteins 0.000 description 5
- 108700003785 Baculoviral IAP Repeat-Containing 3 Proteins 0.000 description 5
- 102100021662 Baculoviral IAP repeat-containing protein 3 Human genes 0.000 description 5
- 101150104237 Birc3 gene Proteins 0.000 description 5
- 102100028252 Brain acid soluble protein 1 Human genes 0.000 description 5
- 102100024436 Caldesmon Human genes 0.000 description 5
- 102100024940 Cathepsin K Human genes 0.000 description 5
- 102100035212 Gamma-aminobutyric acid type B receptor subunit 1 Human genes 0.000 description 5
- 102100023528 Glucoside xylosyltransferase 2 Human genes 0.000 description 5
- 102100035688 Guanylate-binding protein 1 Human genes 0.000 description 5
- 102100028966 HLA class I histocompatibility antigen, alpha chain F Human genes 0.000 description 5
- 101000928628 Homo sapiens Apolipoprotein C-I Proteins 0.000 description 5
- 101000935689 Homo sapiens Brain acid soluble protein 1 Proteins 0.000 description 5
- 101100382122 Homo sapiens CIITA gene Proteins 0.000 description 5
- 101000910297 Homo sapiens Caldesmon Proteins 0.000 description 5
- 101000761509 Homo sapiens Cathepsin K Proteins 0.000 description 5
- 101000906420 Homo sapiens Glucoside xylosyltransferase 2 Proteins 0.000 description 5
- 101001001336 Homo sapiens Guanylate-binding protein 1 Proteins 0.000 description 5
- 101000986080 Homo sapiens HLA class I histocompatibility antigen, alpha chain F Proteins 0.000 description 5
- 101000961146 Homo sapiens Immunoglobulin heavy constant gamma 2 Proteins 0.000 description 5
- 101000961149 Homo sapiens Immunoglobulin heavy constant gamma 4 Proteins 0.000 description 5
- 101000599951 Homo sapiens Insulin-like growth factor I Proteins 0.000 description 5
- 101000645296 Homo sapiens Metalloproteinase inhibitor 2 Proteins 0.000 description 5
- 101001103036 Homo sapiens Nuclear receptor ROR-alpha Proteins 0.000 description 5
- 101000878920 Homo sapiens Putative uncharacterized protein encoded by MIR22HG Proteins 0.000 description 5
- 101000577877 Homo sapiens Stromelysin-3 Proteins 0.000 description 5
- 101000801701 Homo sapiens Tropomyosin alpha-1 chain Proteins 0.000 description 5
- 101000814514 Homo sapiens XIAP-associated factor 1 Proteins 0.000 description 5
- 102100039346 Immunoglobulin heavy constant gamma 2 Human genes 0.000 description 5
- 102100039347 Immunoglobulin heavy constant gamma 4 Human genes 0.000 description 5
- 102100037852 Insulin-like growth factor I Human genes 0.000 description 5
- 102100026371 MHC class II transactivator Human genes 0.000 description 5
- 108700002010 MHC class II transactivator Proteins 0.000 description 5
- 102100026262 Metalloproteinase inhibitor 2 Human genes 0.000 description 5
- 238000000636 Northern blotting Methods 0.000 description 5
- 102100037987 Putative uncharacterized protein encoded by MIR22HG Human genes 0.000 description 5
- 101100379220 Saccharomyces cerevisiae (strain ATCC 204508 / S288c) API2 gene Proteins 0.000 description 5
- 102100028847 Stromelysin-3 Human genes 0.000 description 5
- 102100033632 Tropomyosin alpha-1 chain Human genes 0.000 description 5
- 102100039488 XIAP-associated factor 1 Human genes 0.000 description 5
- 210000004369 blood Anatomy 0.000 description 5
- 239000008280 blood Substances 0.000 description 5
- 150000001875 compounds Chemical class 0.000 description 5
- 238000002651 drug therapy Methods 0.000 description 5
- 238000010195 expression analysis Methods 0.000 description 5
- 238000003364 immunohistochemistry Methods 0.000 description 5
- 239000002773 nucleotide Substances 0.000 description 5
- 125000003729 nucleotide group Chemical group 0.000 description 5
- 229920001184 polypeptide Polymers 0.000 description 5
- 238000010837 poor prognosis Methods 0.000 description 5
- 238000002360 preparation method Methods 0.000 description 5
- 102000004196 processed proteins & peptides Human genes 0.000 description 5
- 238000012545 processing Methods 0.000 description 5
- 230000001105 regulatory effect Effects 0.000 description 5
- 238000003757 reverse transcription PCR Methods 0.000 description 5
- 108010090953 subunit 1 GABA type B receptor Proteins 0.000 description 5
- WMLBMYGMIFJTCS-HUROMRQRSA-N (2r,3s,5r)-2-[(9-phenylxanthen-9-yl)oxymethyl]-5-purin-9-yloxolan-3-ol Chemical compound C([C@H]1O[C@H](C[C@@H]1O)N1C2=NC=NC=C2N=C1)OC1(C2=CC=CC=C2OC2=CC=CC=C21)C1=CC=CC=C1 WMLBMYGMIFJTCS-HUROMRQRSA-N 0.000 description 4
- 102100030346 Antigen peptide transporter 1 Human genes 0.000 description 4
- 102100037086 Bone marrow stromal antigen 2 Human genes 0.000 description 4
- 101001110283 Canis lupus familiaris Ras-related C3 botulinum toxin substrate 1 Proteins 0.000 description 4
- 102100021633 Cathepsin B Human genes 0.000 description 4
- 102100024203 Collagen alpha-1(XIV) chain Human genes 0.000 description 4
- 102100025849 Complement C1q subcomponent subunit C Human genes 0.000 description 4
- 102100024823 DNA polymerase delta subunit 2 Human genes 0.000 description 4
- 102100028539 Guanylate-binding protein 5 Human genes 0.000 description 4
- 102100030595 HLA class II histocompatibility antigen gamma chain Human genes 0.000 description 4
- 102100027385 Hematopoietic lineage cell-specific protein Human genes 0.000 description 4
- 101000740785 Homo sapiens Bone marrow stromal antigen 2 Proteins 0.000 description 4
- 101000898449 Homo sapiens Cathepsin B Proteins 0.000 description 4
- 101000909626 Homo sapiens Collagen alpha-1(XIV) chain Proteins 0.000 description 4
- 101000933636 Homo sapiens Complement C1q subcomponent subunit C Proteins 0.000 description 4
- 101000909189 Homo sapiens DNA polymerase delta subunit 2 Proteins 0.000 description 4
- 101001058850 Homo sapiens Guanylate-binding protein 5 Proteins 0.000 description 4
- 101001082627 Homo sapiens HLA class II histocompatibility antigen gamma chain Proteins 0.000 description 4
- 101001009091 Homo sapiens Hematopoietic lineage cell-specific protein Proteins 0.000 description 4
- 101000935040 Homo sapiens Integrin beta-2 Proteins 0.000 description 4
- 101001131990 Homo sapiens Peroxidasin homolog Proteins 0.000 description 4
- 101000611888 Homo sapiens Platelet-derived growth factor C Proteins 0.000 description 4
- 101000771012 Homo sapiens Protein CMSS1 Proteins 0.000 description 4
- 101001110313 Homo sapiens Ras-related C3 botulinum toxin substrate 2 Proteins 0.000 description 4
- 101000666607 Homo sapiens Rho-related BTB domain-containing protein 3 Proteins 0.000 description 4
- 101000666429 Homo sapiens Terminal nucleotidyltransferase 5C Proteins 0.000 description 4
- 101000659879 Homo sapiens Thrombospondin-1 Proteins 0.000 description 4
- 108010067060 Immunoglobulin Variable Region Proteins 0.000 description 4
- 102000017727 Immunoglobulin Variable Region Human genes 0.000 description 4
- 102100025390 Integrin beta-2 Human genes 0.000 description 4
- 108010023335 Member 2 Subfamily B ATP Binding Cassette Transporter Proteins 0.000 description 4
- 102100039614 Nuclear receptor ROR-alpha Human genes 0.000 description 4
- 108091028043 Nucleic acid sequence Proteins 0.000 description 4
- 102100034601 Peroxidasin homolog Human genes 0.000 description 4
- 102100040681 Platelet-derived growth factor C Human genes 0.000 description 4
- 208000026149 Primary peritoneal carcinoma Diseases 0.000 description 4
- 102100029154 Protein CMSS1 Human genes 0.000 description 4
- 238000002123 RNA extraction Methods 0.000 description 4
- 102100022129 Ras-related C3 botulinum toxin substrate 2 Human genes 0.000 description 4
- 102100038342 Rho-related BTB domain-containing protein 3 Human genes 0.000 description 4
- 102100038305 Terminal nucleotidyltransferase 5C Human genes 0.000 description 4
- 102100036034 Thrombospondin-1 Human genes 0.000 description 4
- 238000011122 anti-angiogenic therapy Methods 0.000 description 4
- 239000012830 cancer therapeutic Substances 0.000 description 4
- 238000013145 classification model Methods 0.000 description 4
- 230000002596 correlated effect Effects 0.000 description 4
- 238000003795 desorption Methods 0.000 description 4
- 238000003745 diagnosis Methods 0.000 description 4
- 238000010586 diagram Methods 0.000 description 4
- 238000002408 directed self-assembly Methods 0.000 description 4
- 230000000694 effects Effects 0.000 description 4
- 238000002866 fluorescence resonance energy transfer Methods 0.000 description 4
- 230000002068 genetic effect Effects 0.000 description 4
- 238000004949 mass spectrometry Methods 0.000 description 4
- 238000005259 measurement Methods 0.000 description 4
- 238000000491 multivariate analysis Methods 0.000 description 4
- 230000036961 partial effect Effects 0.000 description 4
- 230000002974 pharmacogenomic effect Effects 0.000 description 4
- 230000000306 recurrent effect Effects 0.000 description 4
- 238000011160 research Methods 0.000 description 4
- 238000013517 stratification Methods 0.000 description 4
- 238000002626 targeted therapy Methods 0.000 description 4
- 229940126585 therapeutic drug Drugs 0.000 description 4
- 238000007473 univariate analysis Methods 0.000 description 4
- 238000001262 western blot Methods 0.000 description 4
- 102100036438 Amyloid beta precursor protein binding family B member 2 Human genes 0.000 description 3
- 108020005544 Antisense RNA Proteins 0.000 description 3
- 102100030762 Apolipoprotein L1 Human genes 0.000 description 3
- ZEOWTGPWHLSLOG-UHFFFAOYSA-N Cc1ccc(cc1-c1ccc2c(n[nH]c2c1)-c1cnn(c1)C1CC1)C(=O)Nc1cccc(c1)C(F)(F)F Chemical compound Cc1ccc(cc1-c1ccc2c(n[nH]c2c1)-c1cnn(c1)C1CC1)C(=O)Nc1cccc(c1)C(F)(F)F ZEOWTGPWHLSLOG-UHFFFAOYSA-N 0.000 description 3
- 102100035360 Cerebellar degeneration-related antigen 1 Human genes 0.000 description 3
- 102100022145 Collagen alpha-1(IV) chain Human genes 0.000 description 3
- 102100031457 Collagen alpha-1(V) chain Human genes 0.000 description 3
- 102100039551 Collagen triple helix repeat-containing protein 1 Human genes 0.000 description 3
- 102100037077 Complement C1q subcomponent subunit A Human genes 0.000 description 3
- 102100037417 Dexamethasone-induced protein Human genes 0.000 description 3
- 102100037573 Dual specificity protein phosphatase 12 Human genes 0.000 description 3
- 102000004190 Enzymes Human genes 0.000 description 3
- 108090000790 Enzymes Proteins 0.000 description 3
- 108700039887 Essential Genes Proteins 0.000 description 3
- 102100021655 Extracellular sulfatase Sulf-1 Human genes 0.000 description 3
- 102100040669 F-box only protein 32 Human genes 0.000 description 3
- 102100023593 Fibroblast growth factor receptor 1 Human genes 0.000 description 3
- 101710182386 Fibroblast growth factor receptor 1 Proteins 0.000 description 3
- 102100026546 Fibronectin type III domain-containing protein 1 Human genes 0.000 description 3
- 102100037181 Fructose-1,6-bisphosphatase 1 Human genes 0.000 description 3
- 102100031493 Growth arrest-specific protein 7 Human genes 0.000 description 3
- 102100028538 Guanylate-binding protein 4 Human genes 0.000 description 3
- 102100028972 HLA class I histocompatibility antigen, A alpha chain Human genes 0.000 description 3
- 102100029966 HLA class II histocompatibility antigen, DP alpha 1 chain Human genes 0.000 description 3
- 108010075704 HLA-A Antigens Proteins 0.000 description 3
- 108010093061 HLA-DPA1 antigen Proteins 0.000 description 3
- 101100323521 Homo sapiens APOL1 gene Proteins 0.000 description 3
- 101000928680 Homo sapiens Amyloid beta precursor protein binding family B member 2 Proteins 0.000 description 3
- 101000737793 Homo sapiens Cerebellar degeneration-related antigen 1 Proteins 0.000 description 3
- 101000901150 Homo sapiens Collagen alpha-1(IV) chain Proteins 0.000 description 3
- 101000941708 Homo sapiens Collagen alpha-1(V) chain Proteins 0.000 description 3
- 101000746121 Homo sapiens Collagen triple helix repeat-containing protein 1 Proteins 0.000 description 3
- 101000740726 Homo sapiens Complement C1q subcomponent subunit A Proteins 0.000 description 3
- 101000806442 Homo sapiens Dexamethasone-induced protein Proteins 0.000 description 3
- 101000641077 Homo sapiens Diamine acetyltransferase 1 Proteins 0.000 description 3
- 101000924017 Homo sapiens Dual specificity protein phosphatase 1 Proteins 0.000 description 3
- 101000881110 Homo sapiens Dual specificity protein phosphatase 12 Proteins 0.000 description 3
- 101000820630 Homo sapiens Extracellular sulfatase Sulf-1 Proteins 0.000 description 3
- 101000892323 Homo sapiens F-box only protein 32 Proteins 0.000 description 3
- 101000913643 Homo sapiens Fibronectin type III domain-containing protein 1 Proteins 0.000 description 3
- 101001028852 Homo sapiens Fructose-1,6-bisphosphatase 1 Proteins 0.000 description 3
- 101000923044 Homo sapiens Growth arrest-specific protein 7 Proteins 0.000 description 3
- 101001058851 Homo sapiens Guanylate-binding protein 4 Proteins 0.000 description 3
- 101000840273 Homo sapiens Immunoglobulin lambda constant 1 Proteins 0.000 description 3
- 101001082070 Homo sapiens Interferon alpha-inducible protein 6 Proteins 0.000 description 3
- 101001076431 Homo sapiens NF-kappa-B inhibitor zeta Proteins 0.000 description 3
- 101001073422 Homo sapiens Pigment epithelium-derived factor Proteins 0.000 description 3
- 101001136981 Homo sapiens Proteasome subunit beta type-9 Proteins 0.000 description 3
- 101000864990 Homo sapiens Serine incorporator 5 Proteins 0.000 description 3
- 101000713305 Homo sapiens Sodium-coupled neutral amino acid transporter 1 Proteins 0.000 description 3
- 101000822540 Homo sapiens Sterile alpha motif domain-containing protein 9-like Proteins 0.000 description 3
- 101000652736 Homo sapiens Transgelin Proteins 0.000 description 3
- 102100029610 Immunoglobulin lambda constant 1 Human genes 0.000 description 3
- 102100027354 Interferon alpha-inducible protein 6 Human genes 0.000 description 3
- 108091008065 MIR21 Proteins 0.000 description 3
- 108010063737 Myristoylated Alanine-Rich C Kinase Substrate Proteins 0.000 description 3
- 102000015695 Myristoylated Alanine-Rich C Kinase Substrate Human genes 0.000 description 3
- 102100026009 NF-kappa-B inhibitor zeta Human genes 0.000 description 3
- 108090000770 Neuropilin-2 Proteins 0.000 description 3
- 102100035846 Pigment epithelium-derived factor Human genes 0.000 description 3
- 102100035764 Proteasome subunit beta type-9 Human genes 0.000 description 3
- 102100023075 Protein Niban 2 Human genes 0.000 description 3
- 102100034433 Protein kinase C-binding protein NELL2 Human genes 0.000 description 3
- 102100029726 Serine incorporator 5 Human genes 0.000 description 3
- 102100022459 Sterile alpha motif domain-containing protein 9-like Human genes 0.000 description 3
- 102100030100 Sulfate anion transporter 1 Human genes 0.000 description 3
- 102100031013 Transgelin Human genes 0.000 description 3
- 101100022813 Zea mays MEG3 gene Proteins 0.000 description 3
- 230000004913 activation Effects 0.000 description 3
- 238000013528 artificial neural network Methods 0.000 description 3
- 238000000668 atmospheric pressure chemical ionisation mass spectrometry Methods 0.000 description 3
- 238000001854 atmospheric pressure photoionisation mass spectrometry Methods 0.000 description 3
- 238000003705 background correction Methods 0.000 description 3
- 230000001413 cellular effect Effects 0.000 description 3
- 238000011334 debulking surgery Methods 0.000 description 3
- 238000002330 electrospray ionisation mass spectrometry Methods 0.000 description 3
- 238000001914 filtration Methods 0.000 description 3
- 239000012530 fluid Substances 0.000 description 3
- 238000011223 gene expression profiling Methods 0.000 description 3
- 238000007417 hierarchical cluster analysis Methods 0.000 description 3
- 238000001114 immunoprecipitation Methods 0.000 description 3
- 150000002500 ions Chemical class 0.000 description 3
- 210000000265 leukocyte Anatomy 0.000 description 3
- 230000007246 mechanism Effects 0.000 description 3
- 238000007481 next generation sequencing Methods 0.000 description 3
- 230000002018 overexpression Effects 0.000 description 3
- 230000008506 pathogenesis Effects 0.000 description 3
- 238000003909 pattern recognition Methods 0.000 description 3
- 229910052697 platinum Inorganic materials 0.000 description 3
- 239000000092 prognostic biomarker Substances 0.000 description 3
- 230000002829 reductive effect Effects 0.000 description 3
- 238000012552 review Methods 0.000 description 3
- 230000008685 targeting Effects 0.000 description 3
- 102100027621 2'-5'-oligoadenylate synthase 2 Human genes 0.000 description 2
- 102100035389 2'-5'-oligoadenylate synthase 3 Human genes 0.000 description 2
- GXAFMKJFWWBYNW-OWHBQTKESA-N 2-[3-[(1r)-1-[(2s)-1-[(2s)-3-cyclopropyl-2-(3,4,5-trimethoxyphenyl)propanoyl]piperidine-2-carbonyl]oxy-3-(3,4-dimethoxyphenyl)propyl]phenoxy]acetic acid Chemical compound C1=C(OC)C(OC)=CC=C1CC[C@H](C=1C=C(OCC(O)=O)C=CC=1)OC(=O)[C@H]1N(C(=O)[C@@H](CC2CC2)C=2C=C(OC)C(OC)=C(OC)C=2)CCCC1 GXAFMKJFWWBYNW-OWHBQTKESA-N 0.000 description 2
- 108091007507 ADAM12 Proteins 0.000 description 2
- 102100036732 Actin, aortic smooth muscle Human genes 0.000 description 2
- 102100030446 Adenosine 5'-monophosphoramidase HINT1 Human genes 0.000 description 2
- 102100031323 Anthrax toxin receptor 1 Human genes 0.000 description 2
- 102100031325 Anthrax toxin receptor 2 Human genes 0.000 description 2
- 102100030343 Antigen peptide transporter 2 Human genes 0.000 description 2
- 102100022976 B-cell lymphoma/leukemia 11A Human genes 0.000 description 2
- 102100023006 Basic leucine zipper transcriptional factor ATF-like 2 Human genes 0.000 description 2
- 241000212384 Bifora Species 0.000 description 2
- 102100036301 C-C chemokine receptor type 7 Human genes 0.000 description 2
- 102100032367 C-C motif chemokine 5 Human genes 0.000 description 2
- 102100025248 C-X-C motif chemokine 10 Human genes 0.000 description 2
- 102100025250 C-X-C motif chemokine 14 Human genes 0.000 description 2
- 102100040527 CKLF-like MARVEL transmembrane domain-containing protein 3 Human genes 0.000 description 2
- 102100028226 COUP transcription factor 2 Human genes 0.000 description 2
- 102100038542 Calcium homeostasis modulator protein 6 Human genes 0.000 description 2
- 102100026252 Calcium/calmodulin-dependent protein kinase II inhibitor 1 Human genes 0.000 description 2
- 102100033377 Carbohydrate sulfotransferase 15 Human genes 0.000 description 2
- 102100035654 Cathepsin S Human genes 0.000 description 2
- 102100024253 Coatomer subunit zeta-2 Human genes 0.000 description 2
- 102100034951 Coiled-coil domain-containing protein 69 Human genes 0.000 description 2
- 206010052358 Colorectal cancer metastatic Diseases 0.000 description 2
- 102100034622 Complement factor B Human genes 0.000 description 2
- 108010024682 Core Binding Factor Alpha 1 Subunit Proteins 0.000 description 2
- 102000015775 Core Binding Factor Alpha 1 Subunit Human genes 0.000 description 2
- 102100038688 Cysteine-rich secretory protein LCCL domain-containing 2 Human genes 0.000 description 2
- 102100031127 Cysteine/serine-rich nuclear protein 1 Human genes 0.000 description 2
- 102100036696 Cytochrome P450 27C1 Human genes 0.000 description 2
- 102100022286 DNA repair-scaffolding protein Human genes 0.000 description 2
- 102100024426 Dihydropyrimidinase-related protein 2 Human genes 0.000 description 2
- 102100024425 Dihydropyrimidinase-related protein 3 Human genes 0.000 description 2
- 102100031112 Disintegrin and metalloproteinase domain-containing protein 12 Human genes 0.000 description 2
- 102100032633 E3 ubiquitin-protein ligase SH3RF2 Human genes 0.000 description 2
- 102100036516 Ectonucleoside triphosphate diphosphohydrolase 7 Human genes 0.000 description 2
- 108010043939 Ephrin-A5 Proteins 0.000 description 2
- 102100033941 Ephrin-A5 Human genes 0.000 description 2
- 102100039621 Epithelial-stromal interaction protein 1 Human genes 0.000 description 2
- 102100021654 Extracellular sulfatase Sulf-2 Human genes 0.000 description 2
- 238000004252 FT/ICR mass spectrometry Methods 0.000 description 2
- 102100040936 FXYD domain-containing ion transport regulator 6 Human genes 0.000 description 2
- 201000001342 Fallopian tube cancer Diseases 0.000 description 2
- 208000013452 Fallopian tube neoplasm Diseases 0.000 description 2
- 102100036089 Fascin Human genes 0.000 description 2
- 102100021259 Frizzled-1 Human genes 0.000 description 2
- 102100028464 Galactose-3-O-sulfotransferase 4 Human genes 0.000 description 2
- 102100028652 Gamma-enolase Human genes 0.000 description 2
- 102100021337 Gap junction alpha-1 protein Human genes 0.000 description 2
- 102100037260 Gap junction beta-1 protein Human genes 0.000 description 2
- 206010051066 Gastrointestinal stromal tumour Diseases 0.000 description 2
- 102100025945 Glutaredoxin-1 Human genes 0.000 description 2
- 102100040517 Golgi-associated kinase 1B Human genes 0.000 description 2
- 102100031153 Growth arrest and DNA damage-inducible protein GADD45 beta Human genes 0.000 description 2
- 102100028541 Guanylate-binding protein 2 Human genes 0.000 description 2
- 102100031546 HLA class II histocompatibility antigen, DO beta chain Human genes 0.000 description 2
- 102100040505 HLA class II histocompatibility antigen, DR alpha chain Human genes 0.000 description 2
- 108010067802 HLA-DR alpha-Chains Proteins 0.000 description 2
- 102100026119 High affinity immunoglobulin gamma Fc receptor IB Human genes 0.000 description 2
- 102100022599 Homeobox protein Hox-C6 Human genes 0.000 description 2
- 102100028707 Homeobox protein MSX-1 Human genes 0.000 description 2
- 101001008910 Homo sapiens 2'-5'-oligoadenylate synthase 2 Proteins 0.000 description 2
- 101000597332 Homo sapiens 2'-5'-oligoadenylate synthase 3 Proteins 0.000 description 2
- 101000929319 Homo sapiens Actin, aortic smooth muscle Proteins 0.000 description 2
- 101000842270 Homo sapiens Adenosine 5'-monophosphoramidase HINT1 Proteins 0.000 description 2
- 101000796095 Homo sapiens Anthrax toxin receptor 1 Proteins 0.000 description 2
- 101000796085 Homo sapiens Anthrax toxin receptor 2 Proteins 0.000 description 2
- 101000903703 Homo sapiens B-cell lymphoma/leukemia 11A Proteins 0.000 description 2
- 101000903615 Homo sapiens Basic leucine zipper transcriptional factor ATF-like 2 Proteins 0.000 description 2
- 101000716065 Homo sapiens C-C chemokine receptor type 7 Proteins 0.000 description 2
- 101000797762 Homo sapiens C-C motif chemokine 5 Proteins 0.000 description 2
- 101000858088 Homo sapiens C-X-C motif chemokine 10 Proteins 0.000 description 2
- 101000858068 Homo sapiens C-X-C motif chemokine 14 Proteins 0.000 description 2
- 101000749433 Homo sapiens CKLF-like MARVEL transmembrane domain-containing protein 3 Proteins 0.000 description 2
- 101000860860 Homo sapiens COUP transcription factor 2 Proteins 0.000 description 2
- 101000741361 Homo sapiens Calcium homeostasis modulator protein 6 Proteins 0.000 description 2
- 101000913913 Homo sapiens Calcium/calmodulin-dependent protein kinase II inhibitor 1 Proteins 0.000 description 2
- 101000943842 Homo sapiens Carbohydrate sulfotransferase 15 Proteins 0.000 description 2
- 101000909619 Homo sapiens Coatomer subunit zeta-2 Proteins 0.000 description 2
- 101000946601 Homo sapiens Coiled-coil domain-containing protein 69 Proteins 0.000 description 2
- 101000957715 Homo sapiens Cysteine-rich secretory protein LCCL domain-containing 2 Proteins 0.000 description 2
- 101000922196 Homo sapiens Cysteine/serine-rich nuclear protein 1 Proteins 0.000 description 2
- 101000714865 Homo sapiens Cytochrome P450 27C1 Proteins 0.000 description 2
- 101000825159 Homo sapiens DNA repair-scaffolding protein Proteins 0.000 description 2
- 101001036287 Homo sapiens DNA-binding protein inhibitor ID-3 Proteins 0.000 description 2
- 101001053503 Homo sapiens Dihydropyrimidinase-related protein 2 Proteins 0.000 description 2
- 101001053501 Homo sapiens Dihydropyrimidinase-related protein 3 Proteins 0.000 description 2
- 101000654568 Homo sapiens E3 ubiquitin-protein ligase SH3RF2 Proteins 0.000 description 2
- 101000852006 Homo sapiens Ectonucleoside triphosphate diphosphohydrolase 7 Proteins 0.000 description 2
- 101000814134 Homo sapiens Epithelial-stromal interaction protein 1 Proteins 0.000 description 2
- 101000820626 Homo sapiens Extracellular sulfatase Sulf-2 Proteins 0.000 description 2
- 101000893722 Homo sapiens FXYD domain-containing ion transport regulator 6 Proteins 0.000 description 2
- 101001021925 Homo sapiens Fascin Proteins 0.000 description 2
- 101000819438 Homo sapiens Frizzled-1 Proteins 0.000 description 2
- 101001061348 Homo sapiens Galactose-3-O-sulfotransferase 4 Proteins 0.000 description 2
- 101001058231 Homo sapiens Gamma-enolase Proteins 0.000 description 2
- 101000894966 Homo sapiens Gap junction alpha-1 protein Proteins 0.000 description 2
- 101000954104 Homo sapiens Gap junction beta-1 protein Proteins 0.000 description 2
- 101000856983 Homo sapiens Glutaredoxin-1 Proteins 0.000 description 2
- 101000893979 Homo sapiens Golgi-associated kinase 1B Proteins 0.000 description 2
- 101001066164 Homo sapiens Growth arrest and DNA damage-inducible protein GADD45 beta Proteins 0.000 description 2
- 101001058858 Homo sapiens Guanylate-binding protein 2 Proteins 0.000 description 2
- 101000866281 Homo sapiens HLA class II histocompatibility antigen, DO beta chain Proteins 0.000 description 2
- 101000913077 Homo sapiens High affinity immunoglobulin gamma Fc receptor IB Proteins 0.000 description 2
- 101001045154 Homo sapiens Homeobox protein Hox-C6 Proteins 0.000 description 2
- 101000985653 Homo sapiens Homeobox protein MSX-1 Proteins 0.000 description 2
- 101000604674 Homo sapiens Immunoglobulin kappa variable 4-1 Proteins 0.000 description 2
- 101000903806 Homo sapiens Inactive glycosyltransferase 25 family member 3 Proteins 0.000 description 2
- 101001076311 Homo sapiens Insulin growth factor-like family member 2 Proteins 0.000 description 2
- 101001077604 Homo sapiens Insulin receptor substrate 1 Proteins 0.000 description 2
- 101000840572 Homo sapiens Insulin-like growth factor-binding protein 4 Proteins 0.000 description 2
- 101000840577 Homo sapiens Insulin-like growth factor-binding protein 7 Proteins 0.000 description 2
- 101000598002 Homo sapiens Interferon regulatory factor 1 Proteins 0.000 description 2
- 101000840293 Homo sapiens Interferon-induced protein 44 Proteins 0.000 description 2
- 101000959664 Homo sapiens Interferon-induced protein 44-like Proteins 0.000 description 2
- 101001082058 Homo sapiens Interferon-induced protein with tetratricopeptide repeats 2 Proteins 0.000 description 2
- 101001083151 Homo sapiens Interleukin-10 receptor subunit alpha Proteins 0.000 description 2
- 101000977636 Homo sapiens Isthmin-1 Proteins 0.000 description 2
- 101001050321 Homo sapiens Junctional adhesion molecule C Proteins 0.000 description 2
- 101001027602 Homo sapiens Kinesin-like protein KIF26B Proteins 0.000 description 2
- 101001121408 Homo sapiens L-amino-acid oxidase Proteins 0.000 description 2
- 101001054649 Homo sapiens Latent-transforming growth factor beta-binding protein 2 Proteins 0.000 description 2
- 101001054646 Homo sapiens Latent-transforming growth factor beta-binding protein 3 Proteins 0.000 description 2
- 101000780205 Homo sapiens Long-chain-fatty-acid-CoA ligase 5 Proteins 0.000 description 2
- 101000623901 Homo sapiens Mucin-16 Proteins 0.000 description 2
- 101000970023 Homo sapiens NUAK family SNF1-like kinase 1 Proteins 0.000 description 2
- 101000603202 Homo sapiens Nicotinamide N-methyltransferase Proteins 0.000 description 2
- 101000878215 Homo sapiens Peptidyl-prolyl cis-trans isomerase FKBP7 Proteins 0.000 description 2
- 101000595918 Homo sapiens Phospholipase A and acyltransferase 4 Proteins 0.000 description 2
- 101001129788 Homo sapiens Piezo-type mechanosensitive ion channel component 2 Proteins 0.000 description 2
- 101001126417 Homo sapiens Platelet-derived growth factor receptor alpha Proteins 0.000 description 2
- 101000600766 Homo sapiens Podoplanin Proteins 0.000 description 2
- 101000620009 Homo sapiens Polyunsaturated fatty acid 5-lipoxygenase Proteins 0.000 description 2
- 101000952073 Homo sapiens Probable ATP-dependent RNA helicase DDX60-like Proteins 0.000 description 2
- 101000702560 Homo sapiens Probable global transcription activator SNF2L1 Proteins 0.000 description 2
- 101000931462 Homo sapiens Protein FosB Proteins 0.000 description 2
- 101000979565 Homo sapiens Protein NLRC5 Proteins 0.000 description 2
- 101000613615 Homo sapiens Protein mono-ADP-ribosyltransferase PARP14 Proteins 0.000 description 2
- 101000652794 Homo sapiens Protein shisa-4 Proteins 0.000 description 2
- 101000824318 Homo sapiens Protocadherin Fat 1 Proteins 0.000 description 2
- 101000575037 Homo sapiens Putative homeobox protein Meis3-like 2 Proteins 0.000 description 2
- 101000908015 Homo sapiens Putative inactive carboxylesterase 4 Proteins 0.000 description 2
- 101000717450 Homo sapiens RCC1 and BTB domain-containing protein 1 Proteins 0.000 description 2
- 101000657037 Homo sapiens Radical S-adenosyl methionine domain-containing protein 2 Proteins 0.000 description 2
- 101001091984 Homo sapiens Rho GTPase-activating protein 26 Proteins 0.000 description 2
- 101001081189 Homo sapiens Rho GTPase-activating protein 45 Proteins 0.000 description 2
- 101000633784 Homo sapiens SLAM family member 7 Proteins 0.000 description 2
- 101000588007 Homo sapiens SPARC-like protein 1 Proteins 0.000 description 2
- 101000864800 Homo sapiens Serine/threonine-protein kinase Sgk1 Proteins 0.000 description 2
- 101000641015 Homo sapiens Sterile alpha motif domain-containing protein 9 Proteins 0.000 description 2
- 101000617130 Homo sapiens Stromal cell-derived factor 1 Proteins 0.000 description 2
- 101000880098 Homo sapiens Sushi repeat-containing protein SRPX Proteins 0.000 description 2
- 101000874179 Homo sapiens Syndecan-1 Proteins 0.000 description 2
- 101000809875 Homo sapiens TYRO protein tyrosine kinase-binding protein Proteins 0.000 description 2
- 101000800055 Homo sapiens Testican-1 Proteins 0.000 description 2
- 101000800116 Homo sapiens Thy-1 membrane glycoprotein Proteins 0.000 description 2
- 101000622236 Homo sapiens Transcription cofactor vestigial-like protein 3 Proteins 0.000 description 2
- 101000904724 Homo sapiens Transmembrane glycoprotein NMB Proteins 0.000 description 2
- 101000795130 Homo sapiens Trehalase Proteins 0.000 description 2
- 101000838463 Homo sapiens Tubulin alpha-1A chain Proteins 0.000 description 2
- 101000648507 Homo sapiens Tumor necrosis factor receptor superfamily member 14 Proteins 0.000 description 2
- 101000679907 Homo sapiens Tumor necrosis factor receptor superfamily member 27 Proteins 0.000 description 2
- 101000847156 Homo sapiens Tumor necrosis factor-inducible gene 6 protein Proteins 0.000 description 2
- 101001057508 Homo sapiens Ubiquitin-like protein ISG15 Proteins 0.000 description 2
- 101000761740 Homo sapiens Ubiquitin/ISG15-conjugating enzyme E2 L6 Proteins 0.000 description 2
- 101000622304 Homo sapiens Vascular cell adhesion protein 1 Proteins 0.000 description 2
- 101000997307 Homo sapiens Voltage-gated potassium channel subunit beta-2 Proteins 0.000 description 2
- 101000964613 Homo sapiens Zinc finger protein 154 Proteins 0.000 description 2
- 101000723645 Homo sapiens Zinc finger protein 697 Proteins 0.000 description 2
- 101000795753 Homo sapiens mRNA decay activator protein ZFP36 Proteins 0.000 description 2
- 108010044240 IFIH1 Interferon-Induced Helicase Proteins 0.000 description 2
- 102100038198 Immunoglobulin kappa variable 4-1 Human genes 0.000 description 2
- 102100022966 Inactive glycosyltransferase 25 family member 3 Human genes 0.000 description 2
- 102100025965 Insulin growth factor-like family member 2 Human genes 0.000 description 2
- 102100025087 Insulin receptor substrate 1 Human genes 0.000 description 2
- 102100029224 Insulin-like growth factor-binding protein 4 Human genes 0.000 description 2
- 102100029228 Insulin-like growth factor-binding protein 7 Human genes 0.000 description 2
- 102100036981 Interferon regulatory factor 1 Human genes 0.000 description 2
- 102100027353 Interferon-induced helicase C domain-containing protein 1 Human genes 0.000 description 2
- 102100029607 Interferon-induced protein 44 Human genes 0.000 description 2
- 102100039953 Interferon-induced protein 44-like Human genes 0.000 description 2
- 102100027303 Interferon-induced protein with tetratricopeptide repeats 2 Human genes 0.000 description 2
- 102100030236 Interleukin-10 receptor subunit alpha Human genes 0.000 description 2
- 102100023539 Isthmin-1 Human genes 0.000 description 2
- 102100023429 Junctional adhesion molecule C Human genes 0.000 description 2
- 102100037692 Kinesin-like protein KIF26B Human genes 0.000 description 2
- 102100026388 L-amino-acid oxidase Human genes 0.000 description 2
- 102100027017 Latent-transforming growth factor beta-binding protein 2 Human genes 0.000 description 2
- 238000003657 Likelihood-ratio test Methods 0.000 description 2
- 102100034318 Long-chain-fatty-acid-CoA ligase 5 Human genes 0.000 description 2
- 206010027476 Metastases Diseases 0.000 description 2
- 102100023123 Mucin-16 Human genes 0.000 description 2
- 108010018525 NFATC Transcription Factors Proteins 0.000 description 2
- 102000002673 NFATC Transcription Factors Human genes 0.000 description 2
- 102100021732 NUAK family SNF1-like kinase 1 Human genes 0.000 description 2
- 102100035107 Neurotrimin Human genes 0.000 description 2
- 102100038951 Nicotinamide N-methyltransferase Human genes 0.000 description 2
- 108020004711 Nucleic Acid Probes Proteins 0.000 description 2
- 229930012538 Paclitaxel Natural products 0.000 description 2
- 102100036983 Peptidyl-prolyl cis-trans isomerase FKBP7 Human genes 0.000 description 2
- 102100035200 Phospholipase A and acyltransferase 4 Human genes 0.000 description 2
- 102100031694 Piezo-type mechanosensitive ion channel component 2 Human genes 0.000 description 2
- 102100030485 Platelet-derived growth factor receptor alpha Human genes 0.000 description 2
- 102100037265 Podoplanin Human genes 0.000 description 2
- 102100022364 Polyunsaturated fatty acid 5-lipoxygenase Human genes 0.000 description 2
- 102100037440 Probable ATP-dependent RNA helicase DDX60-like Human genes 0.000 description 2
- 102100031031 Probable global transcription activator SNF2L1 Human genes 0.000 description 2
- 102100020847 Protein FosB Human genes 0.000 description 2
- 102100023432 Protein NLRC5 Human genes 0.000 description 2
- 102100040848 Protein mono-ADP-ribosyltransferase PARP14 Human genes 0.000 description 2
- 102100030902 Protein shisa-4 Human genes 0.000 description 2
- 102100026858 Protein-lysine 6-oxidase Human genes 0.000 description 2
- 102100022095 Protocadherin Fat 1 Human genes 0.000 description 2
- 102100025549 Putative homeobox protein Meis3-like 2 Human genes 0.000 description 2
- 102100023322 Putative inactive carboxylesterase 4 Human genes 0.000 description 2
- 102100020837 RCC1 and BTB domain-containing protein 1 Human genes 0.000 description 2
- 102100033749 Radical S-adenosyl methionine domain-containing protein 2 Human genes 0.000 description 2
- 208000015634 Rectal Neoplasms Diseases 0.000 description 2
- 206010038111 Recurrent cancer Diseases 0.000 description 2
- 102100021258 Regulator of G-protein signaling 2 Human genes 0.000 description 2
- 101710140412 Regulator of G-protein signaling 2 Proteins 0.000 description 2
- 102100035744 Rho GTPase-activating protein 26 Human genes 0.000 description 2
- 102100027748 Rho GTPase-activating protein 45 Human genes 0.000 description 2
- 102100027611 Rho-related GTP-binding protein RhoB Human genes 0.000 description 2
- 101150054980 Rhob gene Proteins 0.000 description 2
- 102100029198 SLAM family member 7 Human genes 0.000 description 2
- 108091006531 SLC28A3 Proteins 0.000 description 2
- 102100031581 SPARC-like protein 1 Human genes 0.000 description 2
- 102100030070 Serine/threonine-protein kinase Sgk1 Human genes 0.000 description 2
- 108010003723 Single-Domain Antibodies Proteins 0.000 description 2
- 102000039471 Small Nuclear RNA Human genes 0.000 description 2
- 102100021470 Solute carrier family 28 member 3 Human genes 0.000 description 2
- 102100034291 Sterile alpha motif domain-containing protein 9 Human genes 0.000 description 2
- 102100021669 Stromal cell-derived factor 1 Human genes 0.000 description 2
- 102100032891 Superoxide dismutase [Mn], mitochondrial Human genes 0.000 description 2
- 102100037352 Sushi repeat-containing protein SRPX Human genes 0.000 description 2
- 102100035721 Syndecan-1 Human genes 0.000 description 2
- 102100038717 TYRO protein tyrosine kinase-binding protein Human genes 0.000 description 2
- 101800000849 Tachykinin-associated peptide 2 Proteins 0.000 description 2
- 102100033390 Testican-1 Human genes 0.000 description 2
- 102100033523 Thy-1 membrane glycoprotein Human genes 0.000 description 2
- 102100023476 Transcription cofactor vestigial-like protein 3 Human genes 0.000 description 2
- 108020004566 Transfer RNA Proteins 0.000 description 2
- 102000056172 Transforming growth factor beta-3 Human genes 0.000 description 2
- 108090000097 Transforming growth factor beta-3 Proteins 0.000 description 2
- 102100023935 Transmembrane glycoprotein NMB Human genes 0.000 description 2
- 102100029677 Trehalase Human genes 0.000 description 2
- 102100028968 Tubulin alpha-1A chain Human genes 0.000 description 2
- 102100028785 Tumor necrosis factor receptor superfamily member 14 Human genes 0.000 description 2
- 102100022202 Tumor necrosis factor receptor superfamily member 27 Human genes 0.000 description 2
- 102100032807 Tumor necrosis factor-inducible gene 6 protein Human genes 0.000 description 2
- 102100027266 Ubiquitin-like protein ISG15 Human genes 0.000 description 2
- 102100024843 Ubiquitin/ISG15-conjugating enzyme E2 L6 Human genes 0.000 description 2
- 102100023543 Vascular cell adhesion protein 1 Human genes 0.000 description 2
- 102100034074 Voltage-gated potassium channel subunit beta-2 Human genes 0.000 description 2
- 102100040784 Zinc finger protein 154 Human genes 0.000 description 2
- 102100028373 Zinc finger protein 697 Human genes 0.000 description 2
- 230000002411 adverse Effects 0.000 description 2
- 230000004520 agglutination Effects 0.000 description 2
- 230000006481 angiogenic pathway Effects 0.000 description 2
- 239000002246 antineoplastic agent Substances 0.000 description 2
- 238000002820 assay format Methods 0.000 description 2
- 230000009286 beneficial effect Effects 0.000 description 2
- 238000005251 capillar electrophoresis Methods 0.000 description 2
- 229960004562 carboplatin Drugs 0.000 description 2
- 190000008236 carboplatin Chemical compound 0.000 description 2
- 238000004113 cell culture Methods 0.000 description 2
- 238000007635 classification algorithm Methods 0.000 description 2
- 238000007621 cluster analysis Methods 0.000 description 2
- 210000001072 colon Anatomy 0.000 description 2
- 229940127089 cytotoxic agent Drugs 0.000 description 2
- 238000011393 cytotoxic chemotherapy Methods 0.000 description 2
- 238000009795 derivation Methods 0.000 description 2
- 230000009274 differential gene expression Effects 0.000 description 2
- 238000010201 enrichment analysis Methods 0.000 description 2
- 238000011156 evaluation Methods 0.000 description 2
- 230000001747 exhibiting effect Effects 0.000 description 2
- 238000000605 extraction Methods 0.000 description 2
- 201000001343 fallopian tube carcinoma Diseases 0.000 description 2
- 201000010255 female reproductive organ cancer Diseases 0.000 description 2
- 238000000684 flow cytometry Methods 0.000 description 2
- 201000011243 gastrointestinal stromal tumor Diseases 0.000 description 2
- 108091008053 gene clusters Proteins 0.000 description 2
- 238000003065 hierarchial clustering Methods 0.000 description 2
- 238000003365 immunocytochemistry Methods 0.000 description 2
- 238000000126 in silico method Methods 0.000 description 2
- 238000000338 in vitro Methods 0.000 description 2
- 230000005764 inhibitory process Effects 0.000 description 2
- 238000002372 labelling Methods 0.000 description 2
- 238000000370 laser capture micro-dissection Methods 0.000 description 2
- 238000001001 laser micro-dissection Methods 0.000 description 2
- 239000003446 ligand Substances 0.000 description 2
- 238000007477 logistic regression Methods 0.000 description 2
- 230000007774 longterm Effects 0.000 description 2
- 102100031622 mRNA decay activator protein ZFP36 Human genes 0.000 description 2
- 238000010801 machine learning Methods 0.000 description 2
- 238000013507 mapping Methods 0.000 description 2
- 239000003550 marker Substances 0.000 description 2
- 238000001840 matrix-assisted laser desorption--ionisation time-of-flight mass spectrometry Methods 0.000 description 2
- 238000012544 monitoring process Methods 0.000 description 2
- 230000000877 morphologic effect Effects 0.000 description 2
- NJHLGKJQFKUSEA-UHFFFAOYSA-N n-[2-(4-hydroxyphenyl)ethyl]-n-methylnitrous amide Chemical compound O=NN(C)CCC1=CC=C(O)C=C1 NJHLGKJQFKUSEA-UHFFFAOYSA-N 0.000 description 2
- 230000014399 negative regulation of angiogenesis Effects 0.000 description 2
- 238000004848 nephelometry Methods 0.000 description 2
- 238000010606 normalization Methods 0.000 description 2
- 238000007899 nucleic acid hybridization Methods 0.000 description 2
- 239000002853 nucleic acid probe Substances 0.000 description 2
- 229960001592 paclitaxel Drugs 0.000 description 2
- 238000010238 partial least squares regression Methods 0.000 description 2
- 201000002524 peritoneal carcinoma Diseases 0.000 description 2
- 239000000902 placebo Substances 0.000 description 2
- 229940068196 placebo Drugs 0.000 description 2
- 230000026341 positive regulation of angiogenesis Effects 0.000 description 2
- 230000001023 pro-angiogenic effect Effects 0.000 description 2
- 238000000575 proteomic method Methods 0.000 description 2
- 238000012797 qualification Methods 0.000 description 2
- 238000007637 random forest analysis Methods 0.000 description 2
- 206010038038 rectal cancer Diseases 0.000 description 2
- 201000001275 rectum cancer Diseases 0.000 description 2
- 239000013074 reference sample Substances 0.000 description 2
- 238000002271 resection Methods 0.000 description 2
- 108020004418 ribosomal RNA Proteins 0.000 description 2
- 235000002020 sage Nutrition 0.000 description 2
- 238000012163 sequencing technique Methods 0.000 description 2
- 210000002966 serum Anatomy 0.000 description 2
- 108091029842 small nuclear ribonucleic acid Proteins 0.000 description 2
- 239000007858 starting material Substances 0.000 description 2
- 108010045815 superoxide dismutase 2 Proteins 0.000 description 2
- 238000012706 support-vector machine Methods 0.000 description 2
- RCINICONZNJXQF-MZXODVADSA-N taxol Chemical compound O([C@@H]1[C@@]2(C[C@@H](C(C)=C(C2(C)C)[C@H](C([C@]2(C)[C@@H](O)C[C@H]3OC[C@]3([C@H]21)OC(C)=O)=O)OC(=O)C)OC(=O)[C@H](O)[C@@H](NC(=O)C=1C=CC=CC=1)C=1C=CC=CC=1)O)C(=O)C1=CC=CC=C1 RCINICONZNJXQF-MZXODVADSA-N 0.000 description 2
- 231100000419 toxicity Toxicity 0.000 description 2
- 230000001988 toxicity Effects 0.000 description 2
- 230000009466 transformation Effects 0.000 description 2
- 238000004879 turbidimetry Methods 0.000 description 2
- 230000006459 vascular development Effects 0.000 description 2
- 239000011534 wash buffer Substances 0.000 description 2
- 102100030471 1-acyl-sn-glycerol-3-phosphate acyltransferase delta Human genes 0.000 description 1
- 102100026210 1-phosphatidylinositol 4,5-bisphosphate phosphodiesterase gamma-2 Human genes 0.000 description 1
- FSPQCTGGIANIJZ-UHFFFAOYSA-N 2-[[(3,4-dimethoxyphenyl)-oxomethyl]amino]-4,5,6,7-tetrahydro-1-benzothiophene-3-carboxamide Chemical compound C1=C(OC)C(OC)=CC=C1C(=O)NC1=C(C(N)=O)C(CCCC2)=C2S1 FSPQCTGGIANIJZ-UHFFFAOYSA-N 0.000 description 1
- 102100027399 A disintegrin and metalloproteinase with thrombospondin motifs 2 Human genes 0.000 description 1
- 102100027400 A disintegrin and metalloproteinase with thrombospondin motifs 4 Human genes 0.000 description 1
- 102100039720 A-kinase-interacting protein 1 Human genes 0.000 description 1
- 108091005662 ADAMTS2 Proteins 0.000 description 1
- 108091005664 ADAMTS4 Proteins 0.000 description 1
- 102100039645 ADP-ribosylation factor-like protein 4A Human genes 0.000 description 1
- 108010004483 APOBEC-3G Deaminase Proteins 0.000 description 1
- 102100030834 AT-rich interactive domain-containing protein 5A Human genes 0.000 description 1
- 102100020963 Actin-binding LIM protein 1 Human genes 0.000 description 1
- 241000251468 Actinopterygii Species 0.000 description 1
- 102100026026 Acyl-CoA synthetase short-chain family member 3, mitochondrial Human genes 0.000 description 1
- 102100039140 Acyloxyacyl hydrolase Human genes 0.000 description 1
- 102100025976 Adenosine deaminase 2 Human genes 0.000 description 1
- 102100024394 Adipocyte enhancer-binding protein 1 Human genes 0.000 description 1
- 102100039702 Alcohol dehydrogenase class-3 Human genes 0.000 description 1
- 102100039075 Aldehyde dehydrogenase family 1 member A3 Human genes 0.000 description 1
- 102100022749 Aminopeptidase N Human genes 0.000 description 1
- 102100040357 Angiomotin-like protein 1 Human genes 0.000 description 1
- 108010049777 Ankyrins Proteins 0.000 description 1
- 102000008102 Ankyrins Human genes 0.000 description 1
- 102100037435 Antiviral innate immune response receptor RIG-I Human genes 0.000 description 1
- 108091023037 Aptamer Proteins 0.000 description 1
- 101001007348 Arachis hypogaea Galactose-binding lectin Proteins 0.000 description 1
- 108010031480 Artificial Receptors Proteins 0.000 description 1
- 206010003445 Ascites Diseases 0.000 description 1
- 102100021979 Asporin Human genes 0.000 description 1
- 102100027766 Atlastin-1 Human genes 0.000 description 1
- 102100027205 B-cell antigen receptor complex-associated protein alpha chain Human genes 0.000 description 1
- 102100022983 B-cell lymphoma/leukemia 11B Human genes 0.000 description 1
- 102100038080 B-cell receptor CD22 Human genes 0.000 description 1
- 102100022005 B-lymphocyte antigen CD20 Human genes 0.000 description 1
- 102100027360 BAH and coiled-coil domain-containing protein 1 Human genes 0.000 description 1
- 108091032955 Bacterial small RNA Proteins 0.000 description 1
- 102100030686 Beta-sarcoglycan Human genes 0.000 description 1
- 206010005003 Bladder cancer Diseases 0.000 description 1
- 208000003174 Brain Neoplasms Diseases 0.000 description 1
- 206010055113 Breast cancer metastatic Diseases 0.000 description 1
- 102100027155 Butyrophilin subfamily 3 member A2 Human genes 0.000 description 1
- 102100027154 Butyrophilin subfamily 3 member A3 Human genes 0.000 description 1
- 102100031172 C-C chemokine receptor type 1 Human genes 0.000 description 1
- 101710149814 C-C chemokine receptor type 1 Proteins 0.000 description 1
- 102100036846 C-C motif chemokine 21 Human genes 0.000 description 1
- 102100036170 C-X-C motif chemokine 9 Human genes 0.000 description 1
- 102100024217 CAMPATH-1 antigen Human genes 0.000 description 1
- 108010049990 CD13 Antigens Proteins 0.000 description 1
- 102000053028 CD36 Antigens Human genes 0.000 description 1
- 108010045374 CD36 Antigens Proteins 0.000 description 1
- 102100032912 CD44 antigen Human genes 0.000 description 1
- 108010065524 CD52 Antigen Proteins 0.000 description 1
- 102000017925 CHRM3 Human genes 0.000 description 1
- 102100028228 COUP transcription factor 1 Human genes 0.000 description 1
- 102100036361 Calcium-binding and coiled-coil domain-containing protein 2 Human genes 0.000 description 1
- 241000283707 Capra Species 0.000 description 1
- 102100026247 Carabin Human genes 0.000 description 1
- 102100033040 Carbonic anhydrase 12 Human genes 0.000 description 1
- 102100033041 Carbonic anhydrase 13 Human genes 0.000 description 1
- 102100035249 Carbonyl reductase [NADPH] 3 Human genes 0.000 description 1
- 208000005623 Carcinogenesis Diseases 0.000 description 1
- 201000009030 Carcinoma Diseases 0.000 description 1
- 102100026622 Cartilage intermediate layer protein 1 Human genes 0.000 description 1
- 102100032230 Caveolae-associated protein 1 Human genes 0.000 description 1
- 108010072135 Cell Adhesion Molecule-1 Proteins 0.000 description 1
- 102100024649 Cell adhesion molecule 1 Human genes 0.000 description 1
- 102100037677 Cell surface hyaluronidase Human genes 0.000 description 1
- 206010008342 Cervix carcinoma Diseases 0.000 description 1
- 102100025942 Chemokine-like protein TAFA-5 Human genes 0.000 description 1
- 102100038221 Chromodomain-helicase-DNA-binding protein 5 Human genes 0.000 description 1
- 102100025816 Coiled-coil domain-containing protein 152 Human genes 0.000 description 1
- 102100022640 Collagen alpha-1(XV) chain Human genes 0.000 description 1
- 102100031162 Collagen alpha-1(XVIII) chain Human genes 0.000 description 1
- 102100031544 Collagen alpha-1(XXVII) chain Human genes 0.000 description 1
- 102100040496 Collagen alpha-2(VIII) chain Human genes 0.000 description 1
- 102100033780 Collagen alpha-3(IV) chain Human genes 0.000 description 1
- 102100024338 Collagen alpha-3(VI) chain Human genes 0.000 description 1
- 102100037085 Complement C1q subcomponent subunit B Human genes 0.000 description 1
- 102100025890 Complement C1q tumor necrosis factor-related protein 3 Human genes 0.000 description 1
- 102100027309 Cyclic AMP-responsive element-binding protein 5 Human genes 0.000 description 1
- 108010058546 Cyclin D1 Proteins 0.000 description 1
- 108010025468 Cyclin-Dependent Kinase 6 Proteins 0.000 description 1
- 102100026804 Cyclin-dependent kinase 6 Human genes 0.000 description 1
- 102100027417 Cytochrome P450 1B1 Human genes 0.000 description 1
- 102100025621 Cytochrome b-245 heavy chain Human genes 0.000 description 1
- 102100026234 Cytokine receptor common subunit gamma Human genes 0.000 description 1
- 230000004544 DNA amplification Effects 0.000 description 1
- 102100038076 DNA dC->dU-editing enzyme APOBEC-3G Human genes 0.000 description 1
- 102100037799 DNA-binding protein Ikaros Human genes 0.000 description 1
- 102100039436 DNA-binding protein inhibitor ID-3 Human genes 0.000 description 1
- 102000015968 Dact3 Human genes 0.000 description 1
- 108050004246 Dact3 Proteins 0.000 description 1
- 101100317380 Danio rerio wnt4a gene Proteins 0.000 description 1
- 102100024352 Dedicator of cytokinesis protein 4 Human genes 0.000 description 1
- 102100030442 Derlin-3 Human genes 0.000 description 1
- 108010086291 Deubiquitinating Enzyme CYLD Proteins 0.000 description 1
- 102100022735 Diacylglycerol kinase alpha Human genes 0.000 description 1
- 102100032302 Diphosphoinositol polyphosphate phosphohydrolase NUDT4B Human genes 0.000 description 1
- 102100028572 Disabled homolog 2 Human genes 0.000 description 1
- 206010061818 Disease progression Diseases 0.000 description 1
- 102100028555 Disheveled-associated activator of morphogenesis 1 Human genes 0.000 description 1
- 102100024364 Disintegrin and metalloproteinase domain-containing protein 8 Human genes 0.000 description 1
- 102100037844 Divergent protein kinase domain 1C Human genes 0.000 description 1
- 102100027085 Dual specificity protein phosphatase 4 Human genes 0.000 description 1
- 102100021179 Dynamin-3 Human genes 0.000 description 1
- 102100023228 Dynein axonemal intermediate chain 4 Human genes 0.000 description 1
- 102100031534 E3 ubiquitin-protein ligase RNF144A Human genes 0.000 description 1
- 102100036275 E3 ubiquitin-protein ligase RNF149 Human genes 0.000 description 1
- 102100040278 E3 ubiquitin-protein ligase RNF19A Human genes 0.000 description 1
- 102100034597 E3 ubiquitin-protein ligase TRIM22 Human genes 0.000 description 1
- 102100031814 EGF-containing fibulin-like extracellular matrix protein 1 Human genes 0.000 description 1
- 102100021659 ER membrane protein complex subunit 10 Human genes 0.000 description 1
- 101150029707 ERBB2 gene Proteins 0.000 description 1
- 102100039563 ETS translocation variant 1 Human genes 0.000 description 1
- 102100021717 Early growth response protein 3 Human genes 0.000 description 1
- 102100035087 Ectoderm-neural cortex protein 1 Human genes 0.000 description 1
- 208000001976 Endocrine Gland Neoplasms Diseases 0.000 description 1
- 206010014733 Endometrial cancer Diseases 0.000 description 1
- 206010014759 Endometrial neoplasm Diseases 0.000 description 1
- 102100023882 Endoribonuclease ZC3H12A Human genes 0.000 description 1
- 108010009900 Endothelial Protein C Receptor Proteins 0.000 description 1
- 102000009839 Endothelial Protein C Receptor Human genes 0.000 description 1
- 102100029110 Endothelin-2 Human genes 0.000 description 1
- 102100040513 Endothelin-converting enzyme-like 1 Human genes 0.000 description 1
- 102100033183 Epithelial membrane protein 1 Human genes 0.000 description 1
- 208000000461 Esophageal Neoplasms Diseases 0.000 description 1
- 102100038636 FYVE, RhoGEF and PH domain-containing protein 2 Human genes 0.000 description 1
- 102100030431 Fatty acid-binding protein, adipocyte Human genes 0.000 description 1
- 102100035049 Feline leukemia virus subgroup C receptor-related protein 2 Human genes 0.000 description 1
- 102100031509 Fibrillin-1 Human genes 0.000 description 1
- 102100027634 Fibronectin type 3 and ankyrin repeat domains protein 1 Human genes 0.000 description 1
- 102100031812 Fibulin-1 Human genes 0.000 description 1
- 102100031813 Fibulin-2 Human genes 0.000 description 1
- 240000008168 Ficus benjamina Species 0.000 description 1
- 102100037564 Filamin-binding LIM protein 1 Human genes 0.000 description 1
- 102100022629 Fructose-2,6-bisphosphatase Human genes 0.000 description 1
- 102100021200 G-protein coupled receptor 176 Human genes 0.000 description 1
- 102100024165 G1/S-specific cyclin-D1 Human genes 0.000 description 1
- 102100024412 GTPase IMAP family member 4 Human genes 0.000 description 1
- 102100031351 Galectin-9 Human genes 0.000 description 1
- 102100040225 Gamma-interferon-inducible lysosomal thiol reductase Human genes 0.000 description 1
- 102100040903 Gamma-parvin Human genes 0.000 description 1
- 238000012357 Gap analysis Methods 0.000 description 1
- 208000032612 Glial tumor Diseases 0.000 description 1
- 206010018338 Glioma Diseases 0.000 description 1
- 102100039611 Glutamine synthetase Human genes 0.000 description 1
- 102100028971 HLA class I histocompatibility antigen, C alpha chain Human genes 0.000 description 1
- 102100031258 HLA class II histocompatibility antigen, DM beta chain Human genes 0.000 description 1
- 102100031547 HLA class II histocompatibility antigen, DO alpha chain Human genes 0.000 description 1
- 102100031618 HLA class II histocompatibility antigen, DP beta 1 chain Human genes 0.000 description 1
- 102100036242 HLA class II histocompatibility antigen, DQ alpha 2 chain Human genes 0.000 description 1
- 108010052199 HLA-C Antigens Proteins 0.000 description 1
- 108010050568 HLA-DM antigens Proteins 0.000 description 1
- 108010045483 HLA-DPB1 antigen Proteins 0.000 description 1
- 108010086786 HLA-DQA1 antigen Proteins 0.000 description 1
- 102100029360 Hematopoietic cell signal transducer Human genes 0.000 description 1
- 108010007707 Hepatitis A Virus Cellular Receptor 2 Proteins 0.000 description 1
- 102100034458 Hepatitis A virus cellular receptor 2 Human genes 0.000 description 1
- 102100031188 Hephaestin Human genes 0.000 description 1
- 102100022132 High affinity immunoglobulin epsilon receptor subunit gamma Human genes 0.000 description 1
- 102100026122 High affinity immunoglobulin gamma Fc receptor I Human genes 0.000 description 1
- 102100029235 Histone-lysine N-methyltransferase NSD3 Human genes 0.000 description 1
- 102100027704 Histone-lysine N-methyltransferase SETD7 Human genes 0.000 description 1
- 102100021090 Homeobox protein Hox-A9 Human genes 0.000 description 1
- 102100029426 Homeobox protein Hox-C10 Human genes 0.000 description 1
- 102100020762 Homeobox protein Hox-C5 Human genes 0.000 description 1
- 102100040228 Homeobox protein Hox-D3 Human genes 0.000 description 1
- 102100028798 Homeodomain-only protein Human genes 0.000 description 1
- 241000282412 Homo Species 0.000 description 1
- 101001126450 Homo sapiens 1-acyl-sn-glycerol-3-phosphate acyltransferase delta Proteins 0.000 description 1
- 101000691589 Homo sapiens 1-phosphatidylinositol 4,5-bisphosphate phosphodiesterase gamma-2 Proteins 0.000 description 1
- 101000959553 Homo sapiens A-kinase-interacting protein 1 Proteins 0.000 description 1
- 101000886015 Homo sapiens ADP-ribosylation factor-like protein 4A Proteins 0.000 description 1
- 101000792952 Homo sapiens AT-rich interactive domain-containing protein 5A Proteins 0.000 description 1
- 101000783802 Homo sapiens Actin-binding LIM protein 1 Proteins 0.000 description 1
- 101000720147 Homo sapiens Acyl-CoA synthetase short-chain family member 3, mitochondrial Proteins 0.000 description 1
- 101000889541 Homo sapiens Acyloxyacyl hydrolase Proteins 0.000 description 1
- 101000720051 Homo sapiens Adenosine deaminase 2 Proteins 0.000 description 1
- 101000833122 Homo sapiens Adipocyte enhancer-binding protein 1 Proteins 0.000 description 1
- 101000959452 Homo sapiens Alcohol dehydrogenase class-3 Proteins 0.000 description 1
- 101000959046 Homo sapiens Aldehyde dehydrogenase family 1 member A3 Proteins 0.000 description 1
- 101000891169 Homo sapiens Angiomotin-like protein 1 Proteins 0.000 description 1
- 101000952099 Homo sapiens Antiviral innate immune response receptor RIG-I Proteins 0.000 description 1
- 101000752724 Homo sapiens Asporin Proteins 0.000 description 1
- 101000914489 Homo sapiens B-cell antigen receptor complex-associated protein alpha chain Proteins 0.000 description 1
- 101000903697 Homo sapiens B-cell lymphoma/leukemia 11B Proteins 0.000 description 1
- 101000884305 Homo sapiens B-cell receptor CD22 Proteins 0.000 description 1
- 101000897405 Homo sapiens B-lymphocyte antigen CD20 Proteins 0.000 description 1
- 101000937836 Homo sapiens BAH and coiled-coil domain-containing protein 1 Proteins 0.000 description 1
- 101000703495 Homo sapiens Beta-sarcoglycan Proteins 0.000 description 1
- 101000984917 Homo sapiens Butyrophilin subfamily 3 member A2 Proteins 0.000 description 1
- 101000984916 Homo sapiens Butyrophilin subfamily 3 member A3 Proteins 0.000 description 1
- 101000713085 Homo sapiens C-C motif chemokine 21 Proteins 0.000 description 1
- 101000947172 Homo sapiens C-X-C motif chemokine 9 Proteins 0.000 description 1
- 101000868273 Homo sapiens CD44 antigen Proteins 0.000 description 1
- 101000860854 Homo sapiens COUP transcription factor 1 Proteins 0.000 description 1
- 101000714579 Homo sapiens Calcium-binding and coiled-coil domain-containing protein 2 Proteins 0.000 description 1
- 101000835644 Homo sapiens Carabin Proteins 0.000 description 1
- 101000867855 Homo sapiens Carbonic anhydrase 12 Proteins 0.000 description 1
- 101000867860 Homo sapiens Carbonic anhydrase 13 Proteins 0.000 description 1
- 101000737274 Homo sapiens Carbonyl reductase [NADPH] 3 Proteins 0.000 description 1
- 101000913767 Homo sapiens Cartilage intermediate layer protein 1 Proteins 0.000 description 1
- 101000869049 Homo sapiens Caveolae-associated protein 1 Proteins 0.000 description 1
- 101000880605 Homo sapiens Cell surface hyaluronidase Proteins 0.000 description 1
- 101000788164 Homo sapiens Chemokine-like protein TAFA-5 Proteins 0.000 description 1
- 101000883731 Homo sapiens Chromodomain-helicase-DNA-binding protein 5 Proteins 0.000 description 1
- 101000883736 Homo sapiens Chromodomain-helicase-DNA-binding protein 6 Proteins 0.000 description 1
- 101000932658 Homo sapiens Coiled-coil domain-containing protein 152 Proteins 0.000 description 1
- 101000899935 Homo sapiens Collagen alpha-1(XV) chain Proteins 0.000 description 1
- 101000940372 Homo sapiens Collagen alpha-1(XXVII) chain Proteins 0.000 description 1
- 101000749886 Homo sapiens Collagen alpha-2(VIII) chain Proteins 0.000 description 1
- 101000909506 Homo sapiens Collagen alpha-3(VI) chain Proteins 0.000 description 1
- 101000740680 Homo sapiens Complement C1q subcomponent subunit B Proteins 0.000 description 1
- 101000933673 Homo sapiens Complement C1q tumor necrosis factor-related protein 3 Proteins 0.000 description 1
- 101000710032 Homo sapiens Complement factor B Proteins 0.000 description 1
- 101000726193 Homo sapiens Cyclic AMP-responsive element-binding protein 5 Proteins 0.000 description 1
- 101000725164 Homo sapiens Cytochrome P450 1B1 Proteins 0.000 description 1
- 101001055227 Homo sapiens Cytokine receptor common subunit gamma Proteins 0.000 description 1
- 101000599038 Homo sapiens DNA-binding protein Ikaros Proteins 0.000 description 1
- 101001052955 Homo sapiens Dedicator of cytokinesis protein 4 Proteins 0.000 description 1
- 101000842622 Homo sapiens Derlin-3 Proteins 0.000 description 1
- 101001044817 Homo sapiens Diacylglycerol kinase alpha Proteins 0.000 description 1
- 101000590225 Homo sapiens Diphosphoinositol polyphosphate phosphohydrolase NUDT4B Proteins 0.000 description 1
- 101000915391 Homo sapiens Disabled homolog 2 Proteins 0.000 description 1
- 101000915413 Homo sapiens Disheveled-associated activator of morphogenesis 1 Proteins 0.000 description 1
- 101000832767 Homo sapiens Disintegrin and metalloproteinase domain-containing protein 8 Proteins 0.000 description 1
- 101000806090 Homo sapiens Divergent protein kinase domain 1C Proteins 0.000 description 1
- 101001057621 Homo sapiens Dual specificity protein phosphatase 4 Proteins 0.000 description 1
- 101000817599 Homo sapiens Dynamin-3 Proteins 0.000 description 1
- 101000907302 Homo sapiens Dynein axonemal intermediate chain 4 Proteins 0.000 description 1
- 101000848629 Homo sapiens E3 ubiquitin-protein ligase TRIM22 Proteins 0.000 description 1
- 101001065272 Homo sapiens EGF-containing fibulin-like extracellular matrix protein 1 Proteins 0.000 description 1
- 101000896290 Homo sapiens ER membrane protein complex subunit 10 Proteins 0.000 description 1
- 101000813729 Homo sapiens ETS translocation variant 1 Proteins 0.000 description 1
- 101000896450 Homo sapiens Early growth response protein 3 Proteins 0.000 description 1
- 101000877456 Homo sapiens Ectoderm-neural cortex protein 1 Proteins 0.000 description 1
- 101000976212 Homo sapiens Endoribonuclease ZC3H12A Proteins 0.000 description 1
- 101000841197 Homo sapiens Endothelin-2 Proteins 0.000 description 1
- 101000967016 Homo sapiens Endothelin-converting enzyme-like 1 Proteins 0.000 description 1
- 101000850989 Homo sapiens Epithelial membrane protein 1 Proteins 0.000 description 1
- 101001031749 Homo sapiens FYVE, RhoGEF and PH domain-containing protein 2 Proteins 0.000 description 1
- 101001062864 Homo sapiens Fatty acid-binding protein, adipocyte Proteins 0.000 description 1
- 101001022717 Homo sapiens Feline leukemia virus subgroup C receptor-related protein 2 Proteins 0.000 description 1
- 101000846893 Homo sapiens Fibrillin-1 Proteins 0.000 description 1
- 101000937169 Homo sapiens Fibronectin type 3 and ankyrin repeat domains protein 1 Proteins 0.000 description 1
- 101001065276 Homo sapiens Fibulin-1 Proteins 0.000 description 1
- 101001065274 Homo sapiens Fibulin-2 Proteins 0.000 description 1
- 101001028052 Homo sapiens Filamin-binding LIM protein 1 Proteins 0.000 description 1
- 101000823463 Homo sapiens Fructose-2,6-bisphosphatase Proteins 0.000 description 1
- 101001040723 Homo sapiens G-protein coupled receptor 176 Proteins 0.000 description 1
- 101000833375 Homo sapiens GTPase IMAP family member 4 Proteins 0.000 description 1
- 101001130151 Homo sapiens Galectin-9 Proteins 0.000 description 1
- 101001037132 Homo sapiens Gamma-interferon-inducible lysosomal thiol reductase Proteins 0.000 description 1
- 101000613555 Homo sapiens Gamma-parvin Proteins 0.000 description 1
- 101000888841 Homo sapiens Glutamine synthetase Proteins 0.000 description 1
- 101001058854 Homo sapiens Guanylate-binding protein 3 Proteins 0.000 description 1
- 101001038390 Homo sapiens Guided entry of tail-anchored proteins factor 1 Proteins 0.000 description 1
- 101000866278 Homo sapiens HLA class II histocompatibility antigen, DO alpha chain Proteins 0.000 description 1
- 101000990188 Homo sapiens Hematopoietic cell signal transducer Proteins 0.000 description 1
- 101000993183 Homo sapiens Hephaestin Proteins 0.000 description 1
- 101000824104 Homo sapiens High affinity immunoglobulin epsilon receptor subunit gamma Proteins 0.000 description 1
- 101000913074 Homo sapiens High affinity immunoglobulin gamma Fc receptor I Proteins 0.000 description 1
- 101000634046 Homo sapiens Histone-lysine N-methyltransferase NSD3 Proteins 0.000 description 1
- 101000650682 Homo sapiens Histone-lysine N-methyltransferase SETD7 Proteins 0.000 description 1
- 101000989027 Homo sapiens Homeobox protein Hox-C10 Proteins 0.000 description 1
- 101001002966 Homo sapiens Homeobox protein Hox-C5 Proteins 0.000 description 1
- 101001037158 Homo sapiens Homeobox protein Hox-D3 Proteins 0.000 description 1
- 101000839095 Homo sapiens Homeodomain-only protein Proteins 0.000 description 1
- 101001055315 Homo sapiens Immunoglobulin heavy constant alpha 1 Proteins 0.000 description 1
- 101000961145 Homo sapiens Immunoglobulin heavy constant gamma 3 Proteins 0.000 description 1
- 101001047619 Homo sapiens Immunoglobulin kappa variable 3-20 Proteins 0.000 description 1
- 101001008315 Homo sapiens Immunoglobulin kappa variable 3D-20 Proteins 0.000 description 1
- 101000902205 Homo sapiens Inactive cytidine monophosphate-N-acetylneuraminic acid hydroxylase Proteins 0.000 description 1
- 101001037256 Homo sapiens Indoleamine 2,3-dioxygenase 1 Proteins 0.000 description 1
- 101000852486 Homo sapiens Inositol 1,4,5-triphosphate receptor associated 2 Proteins 0.000 description 1
- 101001033889 Homo sapiens Inositol 1,4,5-trisphosphate receptor-interacting protein-like 2 Proteins 0.000 description 1
- 101001077600 Homo sapiens Insulin receptor substrate 2 Proteins 0.000 description 1
- 101000840582 Homo sapiens Insulin-like growth factor-binding protein 6 Proteins 0.000 description 1
- 101001046683 Homo sapiens Integrin alpha-L Proteins 0.000 description 1
- 101000976713 Homo sapiens Integrin beta-like protein 1 Proteins 0.000 description 1
- 101000599852 Homo sapiens Intercellular adhesion molecule 1 Proteins 0.000 description 1
- 101000840275 Homo sapiens Interferon alpha-inducible protein 27, mitochondrial Proteins 0.000 description 1
- 101000998500 Homo sapiens Interferon-induced 35 kDa protein Proteins 0.000 description 1
- 101001082063 Homo sapiens Interferon-induced protein with tetratricopeptide repeats 5 Proteins 0.000 description 1
- 101001034842 Homo sapiens Interferon-induced transmembrane protein 2 Proteins 0.000 description 1
- 101001076407 Homo sapiens Interleukin-1 receptor antagonist protein Proteins 0.000 description 1
- 101001076418 Homo sapiens Interleukin-1 receptor type 1 Proteins 0.000 description 1
- 101001043809 Homo sapiens Interleukin-7 receptor subunit alpha Proteins 0.000 description 1
- 101001046971 Homo sapiens KN motif and ankyrin repeat domain-containing protein 4 Proteins 0.000 description 1
- 101001027204 Homo sapiens Kelch-like protein 36 Proteins 0.000 description 1
- 101001007027 Homo sapiens Keratin, type II cuticular Hb1 Proteins 0.000 description 1
- 101001027606 Homo sapiens Kinesin-like protein KIF26A Proteins 0.000 description 1
- 101001006892 Homo sapiens Krueppel-like factor 10 Proteins 0.000 description 1
- 101001006886 Homo sapiens Krueppel-like factor 12 Proteins 0.000 description 1
- 101001139126 Homo sapiens Krueppel-like factor 6 Proteins 0.000 description 1
- 101001139115 Homo sapiens Krueppel-like factor 8 Proteins 0.000 description 1
- 101001039113 Homo sapiens Leucine-rich repeat-containing protein 15 Proteins 0.000 description 1
- 101000984186 Homo sapiens Leukocyte immunoglobulin-like receptor subfamily B member 4 Proteins 0.000 description 1
- 101000980823 Homo sapiens Leukocyte surface antigen CD53 Proteins 0.000 description 1
- 101001138062 Homo sapiens Leukocyte-associated immunoglobulin-like receptor 1 Proteins 0.000 description 1
- 101001065658 Homo sapiens Leukocyte-specific transcript 1 protein Proteins 0.000 description 1
- 101001130208 Homo sapiens Lipid droplet assembly factor 1 Proteins 0.000 description 1
- 101001044093 Homo sapiens Lipopolysaccharide-induced tumor necrosis factor-alpha factor Proteins 0.000 description 1
- 101001064542 Homo sapiens Liprin-beta-1 Proteins 0.000 description 1
- 101000938676 Homo sapiens Liver carboxylesterase 1 Proteins 0.000 description 1
- 101000780208 Homo sapiens Long-chain-fatty-acid-CoA ligase 4 Proteins 0.000 description 1
- 101000917826 Homo sapiens Low affinity immunoglobulin gamma Fc region receptor II-a Proteins 0.000 description 1
- 101000917824 Homo sapiens Low affinity immunoglobulin gamma Fc region receptor II-b Proteins 0.000 description 1
- 101000917858 Homo sapiens Low affinity immunoglobulin gamma Fc region receptor III-A Proteins 0.000 description 1
- 101001038034 Homo sapiens Lysophosphatidic acid receptor 6 Proteins 0.000 description 1
- 101001051291 Homo sapiens Lysosomal-associated transmembrane protein 5 Proteins 0.000 description 1
- 101000916644 Homo sapiens Macrophage colony-stimulating factor 1 receptor Proteins 0.000 description 1
- 101001012021 Homo sapiens Mammalian ependymin-related protein 1 Proteins 0.000 description 1
- 101000990912 Homo sapiens Matrilysin Proteins 0.000 description 1
- 101000636209 Homo sapiens Matrix-remodeling-associated protein 5 Proteins 0.000 description 1
- 101000972143 Homo sapiens Maturin Proteins 0.000 description 1
- 101000615030 Homo sapiens Mesenteric estrogen-dependent adipogenesis protein Proteins 0.000 description 1
- 101000972278 Homo sapiens Mucin-6 Proteins 0.000 description 1
- 101000928919 Homo sapiens Muscarinic acetylcholine receptor M3 Proteins 0.000 description 1
- 101000583841 Homo sapiens Muscleblind-like protein 2 Proteins 0.000 description 1
- 101001128456 Homo sapiens Myosin regulatory light polypeptide 9 Proteins 0.000 description 1
- 101000906927 Homo sapiens N-chimaerin Proteins 0.000 description 1
- 101001109501 Homo sapiens NKG2-D type II integral membrane protein Proteins 0.000 description 1
- 101000979575 Homo sapiens NLR family CARD domain-containing protein 3 Proteins 0.000 description 1
- 101001024704 Homo sapiens Nck-associated protein 1-like Proteins 0.000 description 1
- 101000995801 Homo sapiens Neural proliferation differentiation and control protein 1 Proteins 0.000 description 1
- 101001128969 Homo sapiens Neuron navigator 1 Proteins 0.000 description 1
- 101000634537 Homo sapiens Neuronal PAS domain-containing protein 2 Proteins 0.000 description 1
- 101000596892 Homo sapiens Neurotrimin Proteins 0.000 description 1
- 101000601047 Homo sapiens Nidogen-1 Proteins 0.000 description 1
- 101000601048 Homo sapiens Nidogen-2 Proteins 0.000 description 1
- 101000969031 Homo sapiens Nuclear protein 1 Proteins 0.000 description 1
- 101000722306 Homo sapiens Outer dense fiber protein 3B Proteins 0.000 description 1
- 101000988401 Homo sapiens PDZ and LIM domain protein 3 Proteins 0.000 description 1
- 101000736367 Homo sapiens PH and SEC7 domain-containing protein 3 Proteins 0.000 description 1
- 101001074571 Homo sapiens PIN2/TERF1-interacting telomerase inhibitor 1 Proteins 0.000 description 1
- 101000735223 Homo sapiens Palmdelphin Proteins 0.000 description 1
- 101000854774 Homo sapiens Pantetheine hydrolase VNN2 Proteins 0.000 description 1
- 101000595751 Homo sapiens Phosphatidylinositol 4,5-bisphosphate 3-kinase catalytic subunit gamma isoform Proteins 0.000 description 1
- 101000596046 Homo sapiens Plastin-2 Proteins 0.000 description 1
- 101000611892 Homo sapiens Platelet-derived growth factor D Proteins 0.000 description 1
- 101000582936 Homo sapiens Pleckstrin Proteins 0.000 description 1
- 101000597239 Homo sapiens Pleckstrin homology-like domain family B member 2 Proteins 0.000 description 1
- 101001067178 Homo sapiens Plexin-A4 Proteins 0.000 description 1
- 101000742006 Homo sapiens Prickle-like protein 2 Proteins 0.000 description 1
- 101001009588 Homo sapiens Probable glutathione peroxidase 8 Proteins 0.000 description 1
- 101000614347 Homo sapiens Prolyl 4-hydroxylase subunit alpha-2 Proteins 0.000 description 1
- 101000684673 Homo sapiens Protein APCDD1 Proteins 0.000 description 1
- 101000933604 Homo sapiens Protein BTG2 Proteins 0.000 description 1
- 101000650177 Homo sapiens Protein WWC2 Proteins 0.000 description 1
- 101000804792 Homo sapiens Protein Wnt-5a Proteins 0.000 description 1
- 101000855004 Homo sapiens Protein Wnt-7a Proteins 0.000 description 1
- 101000735459 Homo sapiens Protein mono-ADP-ribosyltransferase PARP9 Proteins 0.000 description 1
- 101001098557 Homo sapiens Proteinase-activated receptor 3 Proteins 0.000 description 1
- 101001062751 Homo sapiens Pseudokinase FAM20A Proteins 0.000 description 1
- 101000771401 Homo sapiens Putative aquaporin-7-like protein 3 Proteins 0.000 description 1
- 101000575036 Homo sapiens Putative homeobox protein Meis3-like 1 Proteins 0.000 description 1
- 101000784192 Homo sapiens Putative inactive neutral ceramidase B Proteins 0.000 description 1
- 101001121100 Homo sapiens Putative olfactory receptor 2I1 Proteins 0.000 description 1
- 101000723969 Homo sapiens Putative protein ZBED10P Proteins 0.000 description 1
- 101000776455 Homo sapiens Putative uncharacterized protein encoded by LINC00472 Proteins 0.000 description 1
- 101000798007 Homo sapiens RAC-gamma serine/threonine-protein kinase Proteins 0.000 description 1
- 101000905936 Homo sapiens RAS guanyl-releasing protein 2 Proteins 0.000 description 1
- 101000742274 Homo sapiens RELT-like protein 1 Proteins 0.000 description 1
- 101000668168 Homo sapiens RNA-binding motif, single-stranded-interacting protein 3 Proteins 0.000 description 1
- 101000580043 Homo sapiens Ras-specific guanine nucleotide-releasing factor 2 Proteins 0.000 description 1
- 101000738771 Homo sapiens Receptor-type tyrosine-protein phosphatase C Proteins 0.000 description 1
- 101001106787 Homo sapiens Refilin-B Proteins 0.000 description 1
- 101001075466 Homo sapiens Regulatory factor X-associated protein Proteins 0.000 description 1
- 101000856696 Homo sapiens Rho GDP-dissociation inhibitor 2 Proteins 0.000 description 1
- 101000581151 Homo sapiens Rho GTPase-activating protein 9 Proteins 0.000 description 1
- 101000650694 Homo sapiens Roundabout homolog 1 Proteins 0.000 description 1
- 101000693722 Homo sapiens SAM and SH3 domain-containing protein 3 Proteins 0.000 description 1
- 101000637795 Homo sapiens SH3 domain and tetratricopeptide repeat-containing protein 2 Proteins 0.000 description 1
- 101000632535 Homo sapiens SH3 domain-binding protein 4 Proteins 0.000 description 1
- 101000616545 Homo sapiens SH3 domain-containing protein 21 Proteins 0.000 description 1
- 101000724404 Homo sapiens Saccharopine dehydrogenase Proteins 0.000 description 1
- 101000864269 Homo sapiens Schlafen family member 11 Proteins 0.000 description 1
- 101000821449 Homo sapiens Secreted and transmembrane protein 1 Proteins 0.000 description 1
- 101001126009 Homo sapiens Secretory phospholipase A2 receptor Proteins 0.000 description 1
- 101000879840 Homo sapiens Serglycin Proteins 0.000 description 1
- 101001001648 Homo sapiens Serine/threonine-protein kinase pim-2 Proteins 0.000 description 1
- 101000703089 Homo sapiens Set1/Ash2 histone methyltransferase complex subunit ASH2 Proteins 0.000 description 1
- 101000868472 Homo sapiens Sialoadhesin Proteins 0.000 description 1
- 101000665020 Homo sapiens Sorting nexin-5 Proteins 0.000 description 1
- 101000642345 Homo sapiens Sperm-associated antigen 16 protein Proteins 0.000 description 1
- 101000708620 Homo sapiens Spermine oxidase Proteins 0.000 description 1
- 101000651197 Homo sapiens Sphingosine kinase 2 Proteins 0.000 description 1
- 101000642262 Homo sapiens Spondin-1 Proteins 0.000 description 1
- 101000697502 Homo sapiens Stathmin-3 Proteins 0.000 description 1
- 101000639987 Homo sapiens Stearoyl-CoA desaturase 5 Proteins 0.000 description 1
- 101000875401 Homo sapiens Sterol 26-hydroxylase, mitochondrial Proteins 0.000 description 1
- 101000585332 Homo sapiens Sulfotransferase 1C4 Proteins 0.000 description 1
- 101000659053 Homo sapiens Synaptopodin-2 Proteins 0.000 description 1
- 101000692109 Homo sapiens Syndecan-2 Proteins 0.000 description 1
- 101000946860 Homo sapiens T-cell surface glycoprotein CD3 epsilon chain Proteins 0.000 description 1
- 101000762938 Homo sapiens TOX high mobility group box family member 4 Proteins 0.000 description 1
- 101000835665 Homo sapiens TRPM8 channel-associated factor 1 Proteins 0.000 description 1
- 101000835541 Homo sapiens Target of Nesh-SH3 Proteins 0.000 description 1
- 101000800047 Homo sapiens Testican-2 Proteins 0.000 description 1
- 101000794187 Homo sapiens Tetraspanin-18 Proteins 0.000 description 1
- 101000851436 Homo sapiens Thioredoxin-related transmembrane protein 4 Proteins 0.000 description 1
- 101000654935 Homo sapiens Thrombospondin type-1 domain-containing protein 7A Proteins 0.000 description 1
- 101000830710 Homo sapiens Torsin-4A Proteins 0.000 description 1
- 101001057127 Homo sapiens Transcription factor ETV7 Proteins 0.000 description 1
- 101000979190 Homo sapiens Transcription factor MafB Proteins 0.000 description 1
- 101000962469 Homo sapiens Transcription factor MafF Proteins 0.000 description 1
- 101000642514 Homo sapiens Transcription factor SOX-4 Proteins 0.000 description 1
- 101000635958 Homo sapiens Transforming growth factor beta-2 proprotein Proteins 0.000 description 1
- 101000925985 Homo sapiens Translation initiation factor eIF-2B subunit epsilon Proteins 0.000 description 1
- 101000640723 Homo sapiens Transmembrane protein 131-like Proteins 0.000 description 1
- 101000655155 Homo sapiens Transmembrane protein 158 Proteins 0.000 description 1
- 101000801308 Homo sapiens Transmembrane protein 43 Proteins 0.000 description 1
- 101000899433 Homo sapiens Transmembrane protein C1orf162 Proteins 0.000 description 1
- 101000891326 Homo sapiens Treacle protein Proteins 0.000 description 1
- 101000795117 Homo sapiens Triggering receptor expressed on myeloid cells 2 Proteins 0.000 description 1
- 101000800807 Homo sapiens Tumor necrosis factor alpha-induced protein 8 Proteins 0.000 description 1
- 101000795167 Homo sapiens Tumor necrosis factor receptor superfamily member 13B Proteins 0.000 description 1
- 101000606129 Homo sapiens Tyrosine-protein kinase receptor TYRO3 Proteins 0.000 description 1
- 101001103033 Homo sapiens Tyrosine-protein kinase transmembrane receptor ROR2 Proteins 0.000 description 1
- 101000863873 Homo sapiens Tyrosine-protein phosphatase non-receptor type substrate 1 Proteins 0.000 description 1
- 101000708381 Homo sapiens U11/U12 small nuclear ribonucleoprotein 25 kDa protein Proteins 0.000 description 1
- 101000942626 Homo sapiens UMP-CMP kinase 2, mitochondrial Proteins 0.000 description 1
- 101000644847 Homo sapiens Ubl carboxyl-terminal hydrolase 18 Proteins 0.000 description 1
- 101001000119 Homo sapiens Unconventional myosin-If Proteins 0.000 description 1
- 101000585623 Homo sapiens Unconventional myosin-X Proteins 0.000 description 1
- 101000621529 Homo sapiens Vacuolar protein-sorting-associated protein 36 Proteins 0.000 description 1
- 101000666295 Homo sapiens X-box-binding protein 1 Proteins 0.000 description 1
- 101000964590 Homo sapiens Zinc finger protein 175 Proteins 0.000 description 1
- 101000915642 Homo sapiens Zinc finger protein 469 Proteins 0.000 description 1
- 101000802323 Homo sapiens Zinc finger protein 548 Proteins 0.000 description 1
- 101000818832 Homo sapiens Zinc finger protein 608 Proteins 0.000 description 1
- 101000785609 Homo sapiens Zinc finger protein 655 Proteins 0.000 description 1
- 101000782300 Homo sapiens Zinc finger protein 827 Proteins 0.000 description 1
- 101000633054 Homo sapiens Zinc finger protein SNAI2 Proteins 0.000 description 1
- 101000740482 Homo sapiens Zinc finger protein basonuclin-2 Proteins 0.000 description 1
- 101000991029 Homo sapiens [F-actin]-monooxygenase MICAL2 Proteins 0.000 description 1
- 206010020772 Hypertension Diseases 0.000 description 1
- 108060003951 Immunoglobulin Proteins 0.000 description 1
- 108010054477 Immunoglobulin Fab Fragments Proteins 0.000 description 1
- 102000001706 Immunoglobulin Fab Fragments Human genes 0.000 description 1
- 102000018071 Immunoglobulin Fc Fragments Human genes 0.000 description 1
- 108010091135 Immunoglobulin Fc Fragments Proteins 0.000 description 1
- 108010021625 Immunoglobulin Fragments Proteins 0.000 description 1
- 102000008394 Immunoglobulin Fragments Human genes 0.000 description 1
- 102100026217 Immunoglobulin heavy constant alpha 1 Human genes 0.000 description 1
- 102100039348 Immunoglobulin heavy constant gamma 3 Human genes 0.000 description 1
- 102100022964 Immunoglobulin kappa variable 3-20 Human genes 0.000 description 1
- 102100027403 Immunoglobulin kappa variable 3D-20 Human genes 0.000 description 1
- 102100022247 Inactive cytidine monophosphate-N-acetylneuraminic acid hydroxylase Human genes 0.000 description 1
- 102100040061 Indoleamine 2,3-dioxygenase 1 Human genes 0.000 description 1
- 102100036343 Inositol 1,4,5-triphosphate receptor associated 2 Human genes 0.000 description 1
- 102100039741 Inositol 1,4,5-trisphosphate receptor-interacting protein-like 2 Human genes 0.000 description 1
- 102100025092 Insulin receptor substrate 2 Human genes 0.000 description 1
- 102100029180 Insulin-like growth factor-binding protein 6 Human genes 0.000 description 1
- 102100022339 Integrin alpha-L Human genes 0.000 description 1
- 102100023481 Integrin beta-like protein 1 Human genes 0.000 description 1
- 102100037877 Intercellular adhesion molecule 1 Human genes 0.000 description 1
- 102100029604 Interferon alpha-inducible protein 27, mitochondrial Human genes 0.000 description 1
- 102100033273 Interferon-induced 35 kDa protein Human genes 0.000 description 1
- 102100027356 Interferon-induced protein with tetratricopeptide repeats 5 Human genes 0.000 description 1
- 102100040020 Interferon-induced transmembrane protein 2 Human genes 0.000 description 1
- 102100026018 Interleukin-1 receptor antagonist protein Human genes 0.000 description 1
- 102100026016 Interleukin-1 receptor type 1 Human genes 0.000 description 1
- 102100021593 Interleukin-7 receptor subunit alpha Human genes 0.000 description 1
- 102100022904 KN motif and ankyrin repeat domain-containing protein 4 Human genes 0.000 description 1
- 102100037657 Kelch-like protein 36 Human genes 0.000 description 1
- 102100028340 Keratin, type II cuticular Hb1 Human genes 0.000 description 1
- 208000008839 Kidney Neoplasms Diseases 0.000 description 1
- 102100037695 Kinesin-like protein KIF26A Human genes 0.000 description 1
- 102100027798 Krueppel-like factor 10 Human genes 0.000 description 1
- 102100027792 Krueppel-like factor 12 Human genes 0.000 description 1
- 102100020679 Krueppel-like factor 6 Human genes 0.000 description 1
- 102100020691 Krueppel-like factor 8 Human genes 0.000 description 1
- 101710159002 L-lactate oxidase Proteins 0.000 description 1
- 108090001090 Lectins Proteins 0.000 description 1
- 102000004856 Lectins Human genes 0.000 description 1
- 102100040645 Leucine-rich repeat-containing protein 15 Human genes 0.000 description 1
- 102100025578 Leukocyte immunoglobulin-like receptor subfamily B member 4 Human genes 0.000 description 1
- 102100024221 Leukocyte surface antigen CD53 Human genes 0.000 description 1
- 102100020943 Leukocyte-associated immunoglobulin-like receptor 1 Human genes 0.000 description 1
- 102100031359 Lipid droplet assembly factor 1 Human genes 0.000 description 1
- 102100021607 Lipopolysaccharide-induced tumor necrosis factor-alpha factor Human genes 0.000 description 1
- 102100031961 Liprin-beta-1 Human genes 0.000 description 1
- 102100034319 Long-chain-fatty-acid-CoA ligase 4 Human genes 0.000 description 1
- 102100029204 Low affinity immunoglobulin gamma Fc region receptor II-a Human genes 0.000 description 1
- 102100029205 Low affinity immunoglobulin gamma Fc region receptor II-b Human genes 0.000 description 1
- 102100029193 Low affinity immunoglobulin gamma Fc region receptor III-A Human genes 0.000 description 1
- 206010025323 Lymphomas Diseases 0.000 description 1
- 102100040406 Lysophosphatidic acid receptor 6 Human genes 0.000 description 1
- 102100024625 Lysosomal-associated transmembrane protein 5 Human genes 0.000 description 1
- 108010075654 MAP Kinase Kinase Kinase 1 Proteins 0.000 description 1
- 101150033052 MAS5 gene Proteins 0.000 description 1
- 102100028198 Macrophage colony-stimulating factor 1 receptor Human genes 0.000 description 1
- 241000124008 Mammalia Species 0.000 description 1
- 102100030031 Mammalian ependymin-related protein 1 Human genes 0.000 description 1
- 102100030417 Matrilysin Human genes 0.000 description 1
- 102100030776 Matrix-remodeling-associated protein 5 Human genes 0.000 description 1
- 102100022448 Maturin Human genes 0.000 description 1
- 102100021078 Mesenteric estrogen-dependent adipogenesis protein Human genes 0.000 description 1
- 102100031347 Metallothionein-2 Human genes 0.000 description 1
- 108091027766 Mir-143 Proteins 0.000 description 1
- 102100033115 Mitogen-activated protein kinase kinase kinase 1 Human genes 0.000 description 1
- 102100022493 Mucin-6 Human genes 0.000 description 1
- 241001529936 Murinae Species 0.000 description 1
- 241000699670 Mus sp. Species 0.000 description 1
- 102100030964 Muscleblind-like protein 2 Human genes 0.000 description 1
- 101000890749 Mycobacterium tuberculosis (strain ATCC 25618 / H37Rv) F420-dependent hydroxymycolic acid dehydrogenase Proteins 0.000 description 1
- 102100031787 Myosin regulatory light polypeptide 9 Human genes 0.000 description 1
- 102100023648 N-chimaerin Human genes 0.000 description 1
- 108010082739 NADPH Oxidase 2 Proteins 0.000 description 1
- 108010082699 NADPH Oxidase 4 Proteins 0.000 description 1
- 102100021872 NADPH oxidase 4 Human genes 0.000 description 1
- 102100022680 NKG2-D type II integral membrane protein Human genes 0.000 description 1
- 102100023382 NLR family CARD domain-containing protein 3 Human genes 0.000 description 1
- 102100036942 Nck-associated protein 1-like Human genes 0.000 description 1
- 206010029113 Neovascularisation Diseases 0.000 description 1
- 102100034619 Neural proliferation differentiation and control protein 1 Human genes 0.000 description 1
- 206010029260 Neuroblastoma Diseases 0.000 description 1
- 102100031225 Neuron navigator 1 Human genes 0.000 description 1
- 102100029045 Neuronal PAS domain-containing protein 2 Human genes 0.000 description 1
- 108090000772 Neuropilin-1 Proteins 0.000 description 1
- 102100023617 Neutrophil cytosol factor 4 Human genes 0.000 description 1
- 102100037369 Nidogen-1 Human genes 0.000 description 1
- 102100037371 Nidogen-2 Human genes 0.000 description 1
- 102100021133 Nuclear protein 1 Human genes 0.000 description 1
- 206010030155 Oesophageal carcinoma Diseases 0.000 description 1
- 108091034117 Oligonucleotide Proteins 0.000 description 1
- 241000283973 Oryctolagus cuniculus Species 0.000 description 1
- 102100025285 Outer dense fiber protein 3B Human genes 0.000 description 1
- 102100029177 PDZ and LIM domain protein 3 Human genes 0.000 description 1
- 102100036231 PH and SEC7 domain-containing protein 3 Human genes 0.000 description 1
- 102000038030 PI3Ks Human genes 0.000 description 1
- 108091007960 PI3Ks Proteins 0.000 description 1
- 102100036257 PIN2/TERF1-interacting telomerase inhibitor 1 Human genes 0.000 description 1
- 108060006456 POU2AF1 Proteins 0.000 description 1
- 102000036938 POU2AF1 Human genes 0.000 description 1
- 101150084398 PTAFR gene Proteins 0.000 description 1
- 102100035005 Palmdelphin Human genes 0.000 description 1
- 206010061902 Pancreatic neoplasm Diseases 0.000 description 1
- 102100020748 Pantetheine hydrolase VNN2 Human genes 0.000 description 1
- 108091093037 Peptide nucleic acid Proteins 0.000 description 1
- 108010043958 Peptoids Proteins 0.000 description 1
- 102100036052 Phosphatidylinositol 4,5-bisphosphate 3-kinase catalytic subunit gamma isoform Human genes 0.000 description 1
- 208000007913 Pituitary Neoplasms Diseases 0.000 description 1
- 108700023400 Platelet-activating factor receptors Proteins 0.000 description 1
- 102100040682 Platelet-derived growth factor D Human genes 0.000 description 1
- 102100030264 Pleckstrin Human genes 0.000 description 1
- 102100035156 Pleckstrin homology-like domain family B member 2 Human genes 0.000 description 1
- 102100034385 Plexin-A4 Human genes 0.000 description 1
- 102100038629 Prickle-like protein 2 Human genes 0.000 description 1
- 102100030285 Probable glutathione peroxidase 8 Human genes 0.000 description 1
- 206010036790 Productive cough Diseases 0.000 description 1
- 102100024216 Programmed cell death 1 ligand 1 Human genes 0.000 description 1
- 102100040478 Prolyl 4-hydroxylase subunit alpha-2 Human genes 0.000 description 1
- 102100023735 Protein APCDD1 Human genes 0.000 description 1
- 102100026034 Protein BTG2 Human genes 0.000 description 1
- 102100027547 Protein WWC2 Human genes 0.000 description 1
- 102100020729 Protein Wnt-7a Human genes 0.000 description 1
- 101800000618 Protein kinase C delta type catalytic subunit Proteins 0.000 description 1
- 102100023068 Protein kinase C-binding protein NELL1 Human genes 0.000 description 1
- 102100034930 Protein mono-ADP-ribosyltransferase PARP9 Human genes 0.000 description 1
- 102100021004 Protein sidekick-1 Human genes 0.000 description 1
- 102100037133 Proteinase-activated receptor 3 Human genes 0.000 description 1
- 102100030553 Pseudokinase FAM20A Human genes 0.000 description 1
- 201000008183 Pulmonary blastoma Diseases 0.000 description 1
- 102100029407 Putative aquaporin-7-like protein 3 Human genes 0.000 description 1
- 102100025551 Putative homeobox protein Meis3-like 1 Human genes 0.000 description 1
- 102100021030 Putative inactive neutral ceramidase B Human genes 0.000 description 1
- 102100026634 Putative olfactory receptor 2I1 Human genes 0.000 description 1
- 102100028242 Putative protein ZBED10P Human genes 0.000 description 1
- 102100031223 Putative uncharacterized protein encoded by LINC00472 Human genes 0.000 description 1
- 238000001190 Q-PCR Methods 0.000 description 1
- 102100032314 RAC-gamma serine/threonine-protein kinase Human genes 0.000 description 1
- 102100023488 RAS guanyl-releasing protein 2 Human genes 0.000 description 1
- 102100038200 RELT-like protein 1 Human genes 0.000 description 1
- 102100039689 RNA-binding motif, single-stranded-interacting protein 3 Human genes 0.000 description 1
- 108091007328 RNF144A Proteins 0.000 description 1
- 108091007335 RNF149 Proteins 0.000 description 1
- 108091007326 RNF19A Proteins 0.000 description 1
- 102100027555 Ras-specific guanine nucleotide-releasing factor 2 Human genes 0.000 description 1
- 102100020718 Receptor-type tyrosine-protein kinase FLT3 Human genes 0.000 description 1
- 101710151245 Receptor-type tyrosine-protein kinase FLT3 Proteins 0.000 description 1
- 102100037422 Receptor-type tyrosine-protein phosphatase C Human genes 0.000 description 1
- 102100021327 Refilin-B Human genes 0.000 description 1
- 102100021269 Regulator of G-protein signaling 1 Human genes 0.000 description 1
- 101710140408 Regulator of G-protein signaling 1 Proteins 0.000 description 1
- 102100020981 Regulator of G-protein signaling 16 Human genes 0.000 description 1
- 101710148341 Regulator of G-protein signaling 16 Proteins 0.000 description 1
- 102100021043 Regulatory factor X-associated protein Human genes 0.000 description 1
- 206010038389 Renal cancer Diseases 0.000 description 1
- 102100025622 Rho GDP-dissociation inhibitor 2 Human genes 0.000 description 1
- 102100027658 Rho GTPase-activating protein 9 Human genes 0.000 description 1
- 108010053823 Rho Guanine Nucleotide Exchange Factors Proteins 0.000 description 1
- 102100021708 Rho guanine nucleotide exchange factor 1 Human genes 0.000 description 1
- 102100027702 Roundabout homolog 1 Human genes 0.000 description 1
- 102100025544 SAM and SH3 domain-containing protein 3 Human genes 0.000 description 1
- 102100032022 SH3 domain and tetratricopeptide repeat-containing protein 2 Human genes 0.000 description 1
- 102100028409 SH3 domain-binding protein 4 Human genes 0.000 description 1
- 102100021780 SH3 domain-containing protein 21 Human genes 0.000 description 1
- 108091006298 SLC2A3 Proteins 0.000 description 1
- 101100344462 Saccharomyces cerevisiae (strain ATCC 204508 / S288c) YDJ1 gene Proteins 0.000 description 1
- 102100028294 Saccharopine dehydrogenase Human genes 0.000 description 1
- 206010039491 Sarcoma Diseases 0.000 description 1
- 102100029918 Schlafen family member 11 Human genes 0.000 description 1
- 102100021853 Secreted and transmembrane protein 1 Human genes 0.000 description 1
- 102100029392 Secretory phospholipase A2 receptor Human genes 0.000 description 1
- 102100037344 Serglycin Human genes 0.000 description 1
- 102100036120 Serine/threonine-protein kinase pim-2 Human genes 0.000 description 1
- 102100030733 Set1/Ash2 histone methyltransferase complex subunit ASH2 Human genes 0.000 description 1
- 102100032855 Sialoadhesin Human genes 0.000 description 1
- XUIMIQQOPSSXEZ-UHFFFAOYSA-N Silicon Chemical compound [Si] XUIMIQQOPSSXEZ-UHFFFAOYSA-N 0.000 description 1
- 208000000453 Skin Neoplasms Diseases 0.000 description 1
- 102100022722 Solute carrier family 2, facilitated glucose transporter member 3 Human genes 0.000 description 1
- 102100027233 Solute carrier organic anion transporter family member 1B1 Human genes 0.000 description 1
- 102100038624 Sorting nexin-5 Human genes 0.000 description 1
- 238000002105 Southern blotting Methods 0.000 description 1
- 102100036373 Sperm-associated antigen 16 protein Human genes 0.000 description 1
- 102100032800 Spermine oxidase Human genes 0.000 description 1
- 102100027662 Sphingosine kinase 2 Human genes 0.000 description 1
- 102100036428 Spondin-1 Human genes 0.000 description 1
- 102100028052 Stathmin-3 Human genes 0.000 description 1
- 102100033930 Stearoyl-CoA desaturase 5 Human genes 0.000 description 1
- 102100036325 Sterol 26-hydroxylase, mitochondrial Human genes 0.000 description 1
- 208000005718 Stomach Neoplasms Diseases 0.000 description 1
- 102100029863 Sulfotransferase 1C4 Human genes 0.000 description 1
- 102100035603 Synaptopodin-2 Human genes 0.000 description 1
- 102100026087 Syndecan-2 Human genes 0.000 description 1
- 102100035794 T-cell surface glycoprotein CD3 epsilon chain Human genes 0.000 description 1
- 102000003718 TNF receptor-associated factor 5 Human genes 0.000 description 1
- 108090000001 TNF receptor-associated factor 5 Proteins 0.000 description 1
- 102100026749 TOX high mobility group box family member 4 Human genes 0.000 description 1
- 102100026351 TRPM8 channel-associated factor 1 Human genes 0.000 description 1
- 102100026544 Target of Nesh-SH3 Human genes 0.000 description 1
- 229940123237 Taxane Drugs 0.000 description 1
- 102100033371 Testican-2 Human genes 0.000 description 1
- 208000024313 Testicular Neoplasms Diseases 0.000 description 1
- 206010057644 Testis cancer Diseases 0.000 description 1
- 102100030175 Tetraspanin-18 Human genes 0.000 description 1
- 102100036923 Thioredoxin-related transmembrane protein 4 Human genes 0.000 description 1
- 108091046915 Threose nucleic acid Proteins 0.000 description 1
- 206010043515 Throat cancer Diseases 0.000 description 1
- 102100032612 Thrombospondin type-1 domain-containing protein 7A Human genes 0.000 description 1
- 102100024605 Torsin-4A Human genes 0.000 description 1
- 102100027263 Transcription factor ETV7 Human genes 0.000 description 1
- 102100023234 Transcription factor MafB Human genes 0.000 description 1
- 102100039187 Transcription factor MafF Human genes 0.000 description 1
- 102100036693 Transcription factor SOX-4 Human genes 0.000 description 1
- 102100030737 Transforming growth factor beta-2 proprotein Human genes 0.000 description 1
- 102100034267 Translation initiation factor eIF-2B subunit epsilon Human genes 0.000 description 1
- 102100033853 Transmembrane protein 131-like Human genes 0.000 description 1
- 102100033036 Transmembrane protein 158 Human genes 0.000 description 1
- 102100033530 Transmembrane protein 43 Human genes 0.000 description 1
- 102100022518 Transmembrane protein C1orf162 Human genes 0.000 description 1
- 102100040421 Treacle protein Human genes 0.000 description 1
- 102100029678 Triggering receptor expressed on myeloid cells 2 Human genes 0.000 description 1
- 108010023649 Tripartite Motif Proteins Proteins 0.000 description 1
- 108010047933 Tumor Necrosis Factor alpha-Induced Protein 3 Proteins 0.000 description 1
- 102100024596 Tumor necrosis factor alpha-induced protein 3 Human genes 0.000 description 1
- 102100033649 Tumor necrosis factor alpha-induced protein 8 Human genes 0.000 description 1
- 102100029675 Tumor necrosis factor receptor superfamily member 13B Human genes 0.000 description 1
- 208000035896 Twin-reversed arterial perfusion sequence Diseases 0.000 description 1
- 102100039127 Tyrosine-protein kinase receptor TYRO3 Human genes 0.000 description 1
- 102100039616 Tyrosine-protein kinase transmembrane receptor ROR2 Human genes 0.000 description 1
- 102100029948 Tyrosine-protein phosphatase non-receptor type substrate 1 Human genes 0.000 description 1
- 102100031474 U11/U12 small nuclear ribonucleoprotein 25 kDa protein Human genes 0.000 description 1
- 102100032947 UMP-CMP kinase 2, mitochondrial Human genes 0.000 description 1
- 102100024250 Ubiquitin carboxyl-terminal hydrolase CYLD Human genes 0.000 description 1
- 102100020726 Ubl carboxyl-terminal hydrolase 18 Human genes 0.000 description 1
- 102100035825 Unconventional myosin-If Human genes 0.000 description 1
- 102100029827 Unconventional myosin-X Human genes 0.000 description 1
- 208000007097 Urinary Bladder Neoplasms Diseases 0.000 description 1
- 208000006105 Uterine Cervical Neoplasms Diseases 0.000 description 1
- 102100022960 Vacuolar protein-sorting-associated protein 36 Human genes 0.000 description 1
- 241000251539 Vertebrata <Metazoa> Species 0.000 description 1
- 101150010310 WNT-4 gene Proteins 0.000 description 1
- 102000052548 Wnt-4 Human genes 0.000 description 1
- 108700020984 Wnt-4 Proteins 0.000 description 1
- 102000043366 Wnt-5a Human genes 0.000 description 1
- 102100038151 X-box-binding protein 1 Human genes 0.000 description 1
- 102100040810 Zinc finger protein 175 Human genes 0.000 description 1
- 102100029042 Zinc finger protein 469 Human genes 0.000 description 1
- 102100034641 Zinc finger protein 548 Human genes 0.000 description 1
- 102100021354 Zinc finger protein 608 Human genes 0.000 description 1
- 102100026494 Zinc finger protein 655 Human genes 0.000 description 1
- 102100035802 Zinc finger protein 827 Human genes 0.000 description 1
- 102100029570 Zinc finger protein SNAI2 Human genes 0.000 description 1
- 102100037208 Zinc finger protein basonuclin-2 Human genes 0.000 description 1
- 102100030295 [F-actin]-monooxygenase MICAL2 Human genes 0.000 description 1
- 230000002159 abnormal effect Effects 0.000 description 1
- 230000009471 action Effects 0.000 description 1
- 239000002671 adjuvant Substances 0.000 description 1
- 150000001413 amino acids Chemical class 0.000 description 1
- 210000004381 amniotic fluid Anatomy 0.000 description 1
- 238000013103 analytical ultracentrifugation Methods 0.000 description 1
- 230000006427 angiogenic response Effects 0.000 description 1
- 239000000427 antigen Substances 0.000 description 1
- 108091007433 antigens Proteins 0.000 description 1
- 102000036639 antigens Human genes 0.000 description 1
- 230000001174 ascending effect Effects 0.000 description 1
- 238000007622 bioinformatic analysis Methods 0.000 description 1
- 230000004071 biological effect Effects 0.000 description 1
- 239000013060 biological fluid Substances 0.000 description 1
- 239000000091 biomarker candidate Substances 0.000 description 1
- 210000000601 blood cell Anatomy 0.000 description 1
- 210000001124 body fluid Anatomy 0.000 description 1
- 239000010839 body fluid Substances 0.000 description 1
- 239000000872 buffer Substances 0.000 description 1
- 238000004364 calculation method Methods 0.000 description 1
- 230000036952 cancer formation Effects 0.000 description 1
- 230000005907 cancer growth Effects 0.000 description 1
- 231100000504 carcinogenesis Toxicity 0.000 description 1
- 238000001516 cell proliferation assay Methods 0.000 description 1
- 210000001175 cerebrospinal fluid Anatomy 0.000 description 1
- 201000010881 cervical cancer Diseases 0.000 description 1
- 230000008859 change Effects 0.000 description 1
- 238000012512 characterization method Methods 0.000 description 1
- 238000003392 chemiluminescence resonance energy transfer Methods 0.000 description 1
- 230000001447 compensatory effect Effects 0.000 description 1
- 230000002860 competitive effect Effects 0.000 description 1
- 239000003184 complementary RNA Substances 0.000 description 1
- 230000001186 cumulative effect Effects 0.000 description 1
- 108010057085 cytokine receptors Proteins 0.000 description 1
- 102000003675 cytokine receptors Human genes 0.000 description 1
- 231100000433 cytotoxic Toxicity 0.000 description 1
- 230000001472 cytotoxic effect Effects 0.000 description 1
- 238000007405 data analysis Methods 0.000 description 1
- 238000013480 data collection Methods 0.000 description 1
- 238000003066 decision tree Methods 0.000 description 1
- 230000003247 decreasing effect Effects 0.000 description 1
- 230000007812 deficiency Effects 0.000 description 1
- 239000012502 diagnostic product Substances 0.000 description 1
- 238000007865 diluting Methods 0.000 description 1
- 230000005750 disease progression Effects 0.000 description 1
- 239000002552 dosage form Substances 0.000 description 1
- 238000011209 electrochromatography Methods 0.000 description 1
- 238000002101 electrospray ionisation tandem mass spectrometry Methods 0.000 description 1
- 230000007608 epigenetic mechanism Effects 0.000 description 1
- 210000003743 erythrocyte Anatomy 0.000 description 1
- 201000004101 esophageal cancer Diseases 0.000 description 1
- 201000007280 estrogen-receptor negative breast cancer Diseases 0.000 description 1
- 201000007281 estrogen-receptor positive breast cancer Diseases 0.000 description 1
- 230000012953 feeding on blood of other organism Effects 0.000 description 1
- 206010017758 gastric cancer Diseases 0.000 description 1
- 238000001502 gel electrophoresis Methods 0.000 description 1
- 230000000762 glandular Effects 0.000 description 1
- 238000003306 harvesting Methods 0.000 description 1
- 208000029824 high grade glioma Diseases 0.000 description 1
- 230000002962 histologic effect Effects 0.000 description 1
- 108010027263 homeobox protein HOXA9 Proteins 0.000 description 1
- 108091008039 hormone receptors Proteins 0.000 description 1
- 102000018358 immunoglobulin Human genes 0.000 description 1
- 229940072221 immunoglobulins Drugs 0.000 description 1
- 230000002401 inhibitory effect Effects 0.000 description 1
- 238000005040 ion trap Methods 0.000 description 1
- 238000000534 ion trap mass spectrometry Methods 0.000 description 1
- 238000001948 isotopic labelling Methods 0.000 description 1
- 201000010982 kidney cancer Diseases 0.000 description 1
- 239000002523 lectin Substances 0.000 description 1
- 208000032839 leukemia Diseases 0.000 description 1
- 238000004811 liquid chromatography Methods 0.000 description 1
- 201000007270 liver cancer Diseases 0.000 description 1
- 208000014018 liver neoplasm Diseases 0.000 description 1
- 210000004072 lung Anatomy 0.000 description 1
- 210000004880 lymph fluid Anatomy 0.000 description 1
- 238000010841 mRNA extraction Methods 0.000 description 1
- 230000036210 malignancy Effects 0.000 description 1
- 208000029559 malignant endocrine neoplasm Diseases 0.000 description 1
- 201000011614 malignant glioma Diseases 0.000 description 1
- 208000015486 malignant pancreatic neoplasm Diseases 0.000 description 1
- 230000010534 mechanism of action Effects 0.000 description 1
- 201000001441 melanoma Diseases 0.000 description 1
- 230000004060 metabolic process Effects 0.000 description 1
- 230000009401 metastasis Effects 0.000 description 1
- ONCZDRURRATYFI-QTCHDTBASA-N methyl (2z)-2-methoxyimino-2-[2-[[(e)-1-[3-(trifluoromethyl)phenyl]ethylideneamino]oxymethyl]phenyl]acetate Chemical compound CO\N=C(/C(=O)OC)C1=CC=CC=C1CO\N=C(/C)C1=CC=CC(C(F)(F)F)=C1 ONCZDRURRATYFI-QTCHDTBASA-N 0.000 description 1
- 238000001531 micro-dissection Methods 0.000 description 1
- 238000002156 mixing Methods 0.000 description 1
- 238000012986 modification Methods 0.000 description 1
- 230000004048 modification Effects 0.000 description 1
- 210000003097 mucus Anatomy 0.000 description 1
- 238000007837 multiplex assay Methods 0.000 description 1
- 238000010202 multivariate logistic regression analysis Methods 0.000 description 1
- 239000013642 negative control Substances 0.000 description 1
- 210000005170 neoplastic cell Anatomy 0.000 description 1
- 230000004766 neurogenesis Effects 0.000 description 1
- 108010086154 neutrophil cytosol factor 40K Proteins 0.000 description 1
- 239000002547 new drug Substances 0.000 description 1
- 210000002445 nipple Anatomy 0.000 description 1
- 108091027963 non-coding RNA Proteins 0.000 description 1
- 102000042567 non-coding RNA Human genes 0.000 description 1
- 238000002966 oligonucleotide array Methods 0.000 description 1
- 230000006508 oncogene activation Effects 0.000 description 1
- 201000008968 osteosarcoma Diseases 0.000 description 1
- 208000015124 ovarian disease Diseases 0.000 description 1
- 201000002528 pancreatic cancer Diseases 0.000 description 1
- 208000008443 pancreatic carcinoma Diseases 0.000 description 1
- 238000009595 pap smear Methods 0.000 description 1
- 230000003076 paracrine Effects 0.000 description 1
- 238000010239 partial least squares discriminant analysis Methods 0.000 description 1
- 238000005192 partition Methods 0.000 description 1
- 230000001717 pathogenic effect Effects 0.000 description 1
- 230000001575 pathological effect Effects 0.000 description 1
- 239000000816 peptidomimetic Substances 0.000 description 1
- 210000003819 peripheral blood mononuclear cell Anatomy 0.000 description 1
- JTJMJGYZQZDUJJ-UHFFFAOYSA-N phencyclidine Chemical compound C1CCCCN1C1(C=2C=CC=CC=2)CCCCC1 JTJMJGYZQZDUJJ-UHFFFAOYSA-N 0.000 description 1
- 230000035479 physiological effects, processes and functions Effects 0.000 description 1
- 201000002511 pituitary cancer Diseases 0.000 description 1
- 102000030769 platelet activating factor receptor Human genes 0.000 description 1
- 229920000642 polymer Polymers 0.000 description 1
- 102000054765 polymorphisms of proteins Human genes 0.000 description 1
- 230000000069 prophylactic effect Effects 0.000 description 1
- 238000011321 prophylaxis Methods 0.000 description 1
- 238000005173 quadrupole mass spectroscopy Methods 0.000 description 1
- 238000004445 quantitative analysis Methods 0.000 description 1
- 238000010833 quantitative mass spectrometry Methods 0.000 description 1
- 230000002285 radioactive effect Effects 0.000 description 1
- 238000003127 radioimmunoassay Methods 0.000 description 1
- 102000005962 receptors Human genes 0.000 description 1
- 108020003175 receptors Proteins 0.000 description 1
- 210000000664 rectum Anatomy 0.000 description 1
- 230000022532 regulation of transcription, DNA-dependent Effects 0.000 description 1
- 238000010839 reverse transcription Methods 0.000 description 1
- 210000003296 saliva Anatomy 0.000 description 1
- 238000005070 sampling Methods 0.000 description 1
- 238000001004 secondary ion mass spectrometry Methods 0.000 description 1
- 230000028327 secretion Effects 0.000 description 1
- 210000000582 semen Anatomy 0.000 description 1
- 238000000926 separation method Methods 0.000 description 1
- 230000000405 serological effect Effects 0.000 description 1
- 231100000004 severe toxicity Toxicity 0.000 description 1
- 229910052710 silicon Inorganic materials 0.000 description 1
- 239000010703 silicon Substances 0.000 description 1
- 238000009097 single-agent therapy Methods 0.000 description 1
- 201000000849 skin cancer Diseases 0.000 description 1
- 150000003384 small molecules Chemical class 0.000 description 1
- 239000011343 solid material Substances 0.000 description 1
- 239000000243 solution Substances 0.000 description 1
- 238000000638 solvent extraction Methods 0.000 description 1
- 241000894007 species Species 0.000 description 1
- 230000009870 specific binding Effects 0.000 description 1
- 229940043517 specific immunoglobulins Drugs 0.000 description 1
- 238000004611 spectroscopical analysis Methods 0.000 description 1
- 210000003802 sputum Anatomy 0.000 description 1
- 208000024794 sputum Diseases 0.000 description 1
- 238000011272 standard treatment Methods 0.000 description 1
- 238000007619 statistical method Methods 0.000 description 1
- 230000004936 stimulating effect Effects 0.000 description 1
- 239000011550 stock solution Substances 0.000 description 1
- 201000011549 stomach cancer Diseases 0.000 description 1
- 238000001356 surgical procedure Methods 0.000 description 1
- 210000001179 synovial fluid Anatomy 0.000 description 1
- 230000009897 systematic effect Effects 0.000 description 1
- 238000009121 systemic therapy Methods 0.000 description 1
- 210000001138 tear Anatomy 0.000 description 1
- 230000002123 temporal effect Effects 0.000 description 1
- 201000003120 testicular cancer Diseases 0.000 description 1
- 238000001269 time-of-flight mass spectrometry Methods 0.000 description 1
- 231100000331 toxic Toxicity 0.000 description 1
- 230000002588 toxic effect Effects 0.000 description 1
- 230000014616 translation Effects 0.000 description 1
- 230000009452 underexpressoin Effects 0.000 description 1
- 201000005112 urinary bladder cancer Diseases 0.000 description 1
- 210000002700 urine Anatomy 0.000 description 1
- 238000012795 verification Methods 0.000 description 1
- 238000005406 washing Methods 0.000 description 1
Images


Classifications
-
- C—CHEMISTRY; METALLURGY
- C12—BIOCHEMISTRY; BEER; SPIRITS; WINE; VINEGAR; MICROBIOLOGY; ENZYMOLOGY; MUTATION OR GENETIC ENGINEERING
- C12Q—MEASURING OR TESTING PROCESSES INVOLVING ENZYMES, NUCLEIC ACIDS OR MICROORGANISMS; COMPOSITIONS OR TEST PAPERS THEREFOR; PROCESSES OF PREPARING SUCH COMPOSITIONS; CONDITION-RESPONSIVE CONTROL IN MICROBIOLOGICAL OR ENZYMOLOGICAL PROCESSES
- C12Q1/00—Measuring or testing processes involving enzymes, nucleic acids or microorganisms; Compositions therefor; Processes of preparing such compositions
- C12Q1/68—Measuring or testing processes involving enzymes, nucleic acids or microorganisms; Compositions therefor; Processes of preparing such compositions involving nucleic acids
- C12Q1/6876—Nucleic acid products used in the analysis of nucleic acids, e.g. primers or probes
- C12Q1/6883—Nucleic acid products used in the analysis of nucleic acids, e.g. primers or probes for diseases caused by alterations of genetic material
- C12Q1/6886—Nucleic acid products used in the analysis of nucleic acids, e.g. primers or probes for diseases caused by alterations of genetic material for cancer
-
- G—PHYSICS
- G16—INFORMATION AND COMMUNICATION TECHNOLOGY [ICT] SPECIALLY ADAPTED FOR SPECIFIC APPLICATION FIELDS
- G16B—BIOINFORMATICS, i.e. INFORMATION AND COMMUNICATION TECHNOLOGY [ICT] SPECIALLY ADAPTED FOR GENETIC OR PROTEIN-RELATED DATA PROCESSING IN COMPUTATIONAL MOLECULAR BIOLOGY
- G16B25/00—ICT specially adapted for hybridisation; ICT specially adapted for gene or protein expression
-
- G—PHYSICS
- G16—INFORMATION AND COMMUNICATION TECHNOLOGY [ICT] SPECIALLY ADAPTED FOR SPECIFIC APPLICATION FIELDS
- G16B—BIOINFORMATICS, i.e. INFORMATION AND COMMUNICATION TECHNOLOGY [ICT] SPECIALLY ADAPTED FOR GENETIC OR PROTEIN-RELATED DATA PROCESSING IN COMPUTATIONAL MOLECULAR BIOLOGY
- G16B25/00—ICT specially adapted for hybridisation; ICT specially adapted for gene or protein expression
- G16B25/10—Gene or protein expression profiling; Expression-ratio estimation or normalisation
-
- G—PHYSICS
- G16—INFORMATION AND COMMUNICATION TECHNOLOGY [ICT] SPECIALLY ADAPTED FOR SPECIFIC APPLICATION FIELDS
- G16B—BIOINFORMATICS, i.e. INFORMATION AND COMMUNICATION TECHNOLOGY [ICT] SPECIALLY ADAPTED FOR GENETIC OR PROTEIN-RELATED DATA PROCESSING IN COMPUTATIONAL MOLECULAR BIOLOGY
- G16B40/00—ICT specially adapted for biostatistics; ICT specially adapted for bioinformatics-related machine learning or data mining, e.g. knowledge discovery or pattern finding
-
- G—PHYSICS
- G16—INFORMATION AND COMMUNICATION TECHNOLOGY [ICT] SPECIALLY ADAPTED FOR SPECIFIC APPLICATION FIELDS
- G16B—BIOINFORMATICS, i.e. INFORMATION AND COMMUNICATION TECHNOLOGY [ICT] SPECIALLY ADAPTED FOR GENETIC OR PROTEIN-RELATED DATA PROCESSING IN COMPUTATIONAL MOLECULAR BIOLOGY
- G16B40/00—ICT specially adapted for biostatistics; ICT specially adapted for bioinformatics-related machine learning or data mining, e.g. knowledge discovery or pattern finding
- G16B40/20—Supervised data analysis
-
- G—PHYSICS
- G16—INFORMATION AND COMMUNICATION TECHNOLOGY [ICT] SPECIALLY ADAPTED FOR SPECIFIC APPLICATION FIELDS
- G16B—BIOINFORMATICS, i.e. INFORMATION AND COMMUNICATION TECHNOLOGY [ICT] SPECIALLY ADAPTED FOR GENETIC OR PROTEIN-RELATED DATA PROCESSING IN COMPUTATIONAL MOLECULAR BIOLOGY
- G16B40/00—ICT specially adapted for biostatistics; ICT specially adapted for bioinformatics-related machine learning or data mining, e.g. knowledge discovery or pattern finding
- G16B40/30—Unsupervised data analysis
-
- C—CHEMISTRY; METALLURGY
- C12—BIOCHEMISTRY; BEER; SPIRITS; WINE; VINEGAR; MICROBIOLOGY; ENZYMOLOGY; MUTATION OR GENETIC ENGINEERING
- C12Q—MEASURING OR TESTING PROCESSES INVOLVING ENZYMES, NUCLEIC ACIDS OR MICROORGANISMS; COMPOSITIONS OR TEST PAPERS THEREFOR; PROCESSES OF PREPARING SUCH COMPOSITIONS; CONDITION-RESPONSIVE CONTROL IN MICROBIOLOGICAL OR ENZYMOLOGICAL PROCESSES
- C12Q2600/00—Oligonucleotides characterized by their use
- C12Q2600/106—Pharmacogenomics, i.e. genetic variability in individual responses to drugs and drug metabolism
-
- C—CHEMISTRY; METALLURGY
- C12—BIOCHEMISTRY; BEER; SPIRITS; WINE; VINEGAR; MICROBIOLOGY; ENZYMOLOGY; MUTATION OR GENETIC ENGINEERING
- C12Q—MEASURING OR TESTING PROCESSES INVOLVING ENZYMES, NUCLEIC ACIDS OR MICROORGANISMS; COMPOSITIONS OR TEST PAPERS THEREFOR; PROCESSES OF PREPARING SUCH COMPOSITIONS; CONDITION-RESPONSIVE CONTROL IN MICROBIOLOGICAL OR ENZYMOLOGICAL PROCESSES
- C12Q2600/00—Oligonucleotides characterized by their use
- C12Q2600/158—Expression markers
Definitions
- the present invention relates to a molecular diagnostic test useful for diagnosing cancers from different anatomical sites that includes the use of a common subtype related to angiogenesis.
- the invention includes the derivation of a gene classification model from gene expression levels.
- One application is the stratification of response to and selection of patients for cancer therapeutic drug classes and thus guide patient treatment selection.
- Another application is the stratification of cancer patients into those that respond and those that do not respond to anti-angiogenic therapeutics.
- the present invention provides a test that can guide therapy selection as well as selecting patient groups for enrichment strategies during clinical trial evaluation of novel therapeutics.
- the invention can be used as a prognostic indicator for certain cancers including ovarian cancer, breast cancer, colon, prostate, lung and glioblastoma.
- the angiogenesis subtype can be identified from fresh/frozen (FF) or formalin fixed paraffin embedded FFPE patient samples.
- Ovarian cancer is the leading cause of death among all gynecological cancers in western countries. This high death rate is due to the diagnosis at an advanced stage in most patients.
- Epithelial ovarian cancer (EOC) constitutes 90% of ovarian malignancies and is classified into distinct histologic categories including serous, mucinous, endometrioid, clear cell, transitional, mixed, and undifferentiated subtypes. There is increasing evidence that these differed histologies arise from different aetiologies. There have been recent advances in the methodology used to classify epithelial ovarian cancer ( McCluggage, W.G.
- microarrays and molecular genomics have the potential for a significant impact on the diagnostic capability and prognostic classification of disease, which may aid in the prediction of the response of an individual patient to a defined therapeutic regimen.
- Microarrays provide for the analysis of large amounts of genetic information, thereby providing a genetic fingerprint of an individual. There is much enthusiasm that this technology will ultimately provide the necessary tools for custom-made drug treatment regimens.
- Angiogenesis is a key component of neo-vascularisation of tumors and essential to tumorigenesis and metastatsis. As such, it is a key area for therapeutic intervention and has been correlated to poor prognosis and reduced survival. This has promoted the development of a number of agents that target angiogenesis related processes and pathways, including the market leader and first FDA-approved anti-angiogenic, bevacizumab (Avastin), produced by Genentech/Roche.
- Treatment regimens that include bevacizumab have demonstrated broad clinical activity 1-10 .
- OS overall survival
- a substantial proportion of tumours are either initially resistant or quickly develop resistance to VEGF blockade (the mechanism of action of bevacizumab).
- 21% of ovarian, 10% of renal and 33% of rectal cancer patients show partial regression when receiving bevacizumab monotherapy, suggesting that bevacizumab may be active in small subgroups of patients, but that such incremental benefits do not reach significance in unselected patients.
- biomarker of response to bevacizumab would improve assessment of treatment outcomes and thus enable the identification of patient subgroups that would receive the most clinical benefit from bevacizumab treatment. This would be particularly relevant in the case of metastatic breast cancer, where the absence of a clinically beneficial biomarker has undermined the use of bevacizumab. Thus far, no such biomarker has been clinically validated to predict bevacizumab efficacy. Hypertension and VEGF polymorphisms are so far the only biomarkers to show potential, but important questions remain about their use in a clinical setting.
- Another approach to anti-angiogenic therapy is simulataneous targeting of multiple angiogenic pathways rather than selective targeting of the VEGF pathway.
- multitargeted anti-angiogenic agents should more completely inhibit angiogenesis than agents such as bevacizumab and thus may produce greater therapeutic benefit. It has been postulated that in some tumors, angiogenesis may require VEGF only in the early stages of disease but is driven by additional angiogenic pathways as the disease progresses. Therefore, by targeting multiple pathways, it may be possible to counteract compensatory escape mechanisms that could lead to resistance to VEGF inhibition.
- the invention is defined in the claims. Disclosed are methods of using a collection of biomarkers expressed in cancer such that when some or all of the transcripts are under-expressed, they identify a subtype of cancer that has an up-regulation or down-regulation in molecular signaling relating to angiogenesis.
- the collection of biomarkers may be defined by an expression signature, and the expression signature is used to assign a cumulative score to the measured expression values of the collection of biomarkers.
- the invention also provides methods for indicating responsiveness or non-responsiveness to anti-angiogenic agents as well as identifying patients with a good or poor prognosis, using the collection of biomarkers and expression signatures disclosed herein.
- biomarkers and expression signatures may form the basis of a single parameter or multiparametric predictive test that could be delivered using methods known in the art such as microarray, Q-PCR, immunohistochemistry, ELISA or other technologies that can quantify mRNA or protein expression.
- the present disclosure provides an expression signature defining a cancer subtype associated with up-regulation of angiogenesis related biomarkers ("angiogeneis").
- the present disclosure provides an expression signature defining a cancer subtype association with down-regulation of angiogenesis related biomarkers ("non-angiogenesis”).
- the cancer subtypes described herein are common to many types of cancer and are not limited to a single cancer disease type. Accordingly, the expression signatures of the present invention are not limited to a single cancer type.
- the expression signature comprises two or more biomarkers selected from the biomarkers listed in Tables 1A-1C.
- the angiogenesis expression signature comprises two or more biomarkers selected from the biomarkers listed in Tables 2A or 2B.
- the non-angiogenesis expression signature comprises two or more biomarkers listed in Table 2C.
- the angiogenesis expression signature comprises the biomarkers listed in Table 2A or 2B and their corresponding weights as determined using a PLS classifier.
- the non-angiogenesis signature comprises the biomarkers listed in Table 2C and their corresponding weights as determined using a PLS classifier.
- the expression signatures are useful for evaluating a cancer tumor's responsiveness to anti-angiogenic therapeutics.
- the use of the invention to determine a tumor's responsiveness to anti-angiogeneic therapeutics is not limited to a single cancer type.
- the cancer may be ovarian cancer, breast cancer, colon cancer, colorectal cancer, lung cancer, prostate cancer, or glioblastoma.
- the present invention relates to prediction of response to drugs using at least or up to different 10 classifications of response, such as overall survival, progression free survival, radiological response, as defined by RECIST, complete response, partial response, stable disease and serological markers such as, but not limited to, PSA, CEA, CA125, CA15-3 and CA19-9.
- the invention described herein is not limited to any one drug; it can be used to identify responders and non responders to any of a range of drugs currently in use, under development and novel, that directly or indirectly affect or target angiogeneic processes.
- the present invention may be used to evaluate adjuvant or neoadjuvant bevacizumab or dasatanib, either as single agents, or in combination with standard of care therapy.
- the present invention may be used to evaluate Avastin, VEGF-TRAP, treatment in ovarian cancer.
- the expression signatures disclosed herein may be used to determine a patient's clinical prognosis.
- patients identified as having a cancer subtype associated with down-regulation of angiogenesis related biomarkers may exhibit a longer survival rate than a cancer subtype related to up-regulation of angiogenesis related biomarkers.
- the use of the invention to determine an individual's clinical prognosis is not limited to a single cancer type.
- the cancer may be ovarian cancer, colon cancer, colorectal cancer, breast cancer, lung cancer, prostate cancer, or glioblastoma.
- the present invention relates to prediction of clinical prognosis using at least progression free survival. Additional prognostic factors that may be considered are ethnicity and race, age, stage of disease, histology, tumor grade, tumor makers (for example, CA125), site-specific surgical treatment, size of residual disease, and tumor response
- one expression signature may be a non-angiogenesis signature and a second expression signature may be an angiogenesis signature.
- a non-angiogenesis expression signature is used to determine a patient's clinical prognosis and an angiogenesis signature is used to determine a patient's predicted responsiveness to a given class of therapeutic agent or treatment regimen.
- the angiogenesis signature comprises one or more biomarkers from Table 2A or Table 2B
- the non-angiogenesis signature comprises one or more biomarkers from Table 2C.
- the angiogenesis signature comprises the biomarkers in Table 2A or Table 2B
- the non-angiogenesis signature comprises the biomarkers in Table 2A.
- kits for conventional diagnostic uses listed above such as qPCR, microarray, and immunoassays such as immunohistochemistry, ELISA, Western blot and the like.
- kits include appropriate reagents and directions to assay the expression of the genes or gene products and quantify mRNA or protein expression.
- such methods may be used to identify patients that are sensitive to and respond to drugs that inhibit, either directly or indirectly, processes relating to angiogenesis.
- such methods may be used to identify patients that are resistant to or do not respond to drugs that inhibit, either directly or indirectly, processes relating to angiogenesis.
- This invention also relates to guiding effective treatment of patients. Further, methods relating to selection of patient treatment regimens and selecting patients for clinical trials of current, or developmental stage drugs that directly or indirectly affect angiogenesis are provided.
- a biomarker expression level may be determined using RNA obtained from FFPE tissue, fresh frozen tissue or fresh tissue that has been stored in solutions such as RNAlater®.
- marker panel As used herein terms “marker panel,” “expression classifier,” “classifier,” “expression signature,” or “signature” may be used interchangeably.
- a major goal of current research efforts in cancer is to increase the efficacy of perioperative systemic therapy in patients by incorporating molecular parameters into clinical therapeutic decisions.
- Pharmacogenetics/genomics is the study of genetic/genomic factors involved in an individuals' response to a foreign compound or drug. Agents or modulators which have a stimulatory or inhibitory effect on expression of a biomarker of the invention can be administered to individuals to treat (prophylactically or therapeutically) cancer in the patient. It is ideal to also consider the pharmacogenomics of the individual in conjunction with such treatment. Differences in metabolism of therapeutics may possibly lead to severe toxicity or therapeutic failure by altering the relationship between dose and blood concentration of the pharmacologically active drug.
- understanding the pharmacogenomics of an individual permits the selection of effective agents (e.g., drugs) for prophylactic or therapeutic treatments.
- Such pharmacogenomics can further be used to determine appropriate dosages and therapeutic regimens.
- the level of expression of a biomarker of the invention in an individual can be determined to thereby select appropriate agent(s) for therapeutic or prophylactic treatment of the individual.
- the present invention relates to a molecular diagnostic tests useful for diagnosing cancers from different anatomical sites that includes the use of one or more common subtypes related to angiogenesis.
- the invention includes expression signatures that identify a subject as responsive or non-responsive to anti-angiogenic therapeutics and/or having a good or poor clinical prognosis.
- the expression signature is derived by obtaining the expression profiles of samples from a sample set of known pathology and/or clinical outcome.
- the samples may originate from the same sample tissue type or different tissue types.
- an "expression profile" comprises a set of values representing the expression level for each biomarker analyzed from a given sample.
- the expression profiles from the sample set are then analyzed using a mathematical model.
- Different mathematical models may be applied and include, but are not limited to, models from the fields of pattern recognition ( Duda et al. Pattern Classification, 2nd ed., John Wiley, New York 2001 ), machine learning ( Schölkopf et al. Learning with Kernels, MIT Press, Cambridge 2002 , Bishop, Neural Networks for Pattern Recognition, Clarendon Press, Oxford 1995 ), statistics ( Hastie et al. The Elements of Statistical Learning, Springer, New York 2001 ), bioinformatics ( Dudoit et al., 2002, J. Am. Statist. Assoc. 97:77-87 , Tibshirani et al., 2002, Proc.
- the mathematical model identifies one or more biomarkers expressed in the sample set that are most predictive of a given disease phenotype. These one or more biomarkers define an expression signature. Accordingly, an expression signature includes the biomarkers identified as most predictive of a given disease phenotype.
- the mathematical model defines a variable, such as a weight, for each identified biomarker.
- the mathematical model defines a decision function.
- the decision function may further define a threshold score which separates the sample set into two disease phenotypes such as, but not limited to, samples that are responsive and non-responsive to anti-angiogenic therapeutics.
- the decision function and expression signature are defined using a linear classifier.
- the biomarkers defined by the expression signature are isolated and an expression profile of the biomarker(s) determined.
- the new sample biomarker expression profile is analyzed with the same mathematical model used to define the expression signature.
- the mathematical model defines an expression score for the new sample.
- the expression score may be determined by combining the expression values of the biomarkers with corresponding scalar weights using non-linear, algebraic, trigonometric or correlative means to derive a single scalar value.
- the expression score is compared to the threshold score and the sample classified based on whether the expression score is greater than, or equal to, or less than the threshold score.
- a sample expression value greater than the reference expression value indicates a patient will be responsive to an anti-angiogenic therapeutic.
- a sample expression score below the threshold score indicates the patient will not be responsive to an anti-angiogenic therapeutic.
- a sample expression score below the threshold expression score indicates the patient has a cancer typethat is not responsive to an anti-angiogenic therapeutic.
- a sample expression score above the reference expression score indicates the patient has a cancer type that is responsive to an anti-angiogenic therapeutic.
- a sample expression score above the threshold score indicates the patient has a cancer sub-type with a good clinical prognosis.
- a sample expression score below the threshold score indicates a patient with a cancer subtype with a poor clinical prognosis.
- the expression signature is not limited to identifying the same cancer sub-type only in tissues of the same cancer type, but may be used with other cancer types that share the same cancer sub-type.
- the expression signature may be used to identify a similar angiogenesis sub-type in different cancers such as glioblastoma, breast cancer, lung cancer, colon cancer, or prostate cancer.
- One application of the expression signatures disclosed herein is the identification of patients with good and poor prognosis.
- By examining the expression of a collection of the identified biomarkers in a tumor it is possible to determine the likely clinical outcomes of a patient.
- By examining the expression of a collection of biomarkers it is therefore possible to identify those patients in most need of more aggressive therapeutic regimens and likewise eliminate unnecessary therapeutic treatments or those unlikely to significantly improve a patient's clinical outcome.
- a patient may be considered to have a "good prognosis" where, for example, the survival rate associated with the cancer subtype is greater than a survival rate associated with other related cancer subtypes.
- a "good prognosis” indicates at least an increased expected survival time. This may be based upon a classification as responsive to an anti-angiogenic therapeutic agent as described herein. The increased expected survival time may be as compared to classification as non-responsive to the anti-angiogenic therapeutic agent.
- a patient may be considered to have a "poor prognosis” or “bad prognosis” where, for example, the survival rate associated with the cancer subtype is less than the survival rate associated with other related cancer subtypes.
- Another application of the expression signatures disclosed herein is the stratification of response to, and selection of patients for therapeutic drug classes that encompass anti-angiogenic therapies.
- By examining the expression of a collection of the identified biomarkers in a tumor it is possible to determine which therapeutic agent or combination of agents will be most likely to reduce the growth rate of a cancer. It is also possible to determine which therapeutic agent or combination of agents will be the least likely to reduce the growth rate of a cancer.
- By examining the expression of a collection of biomarkers it is therefore possible to eliminate ineffective or inappropriate therapeutic agents.
- these determinations can be made on a patient-by-patient basis or on an agent-by-agent basis.
- the present invention provides a test that can guide therapy selection as well as selecting patient groups for enrichment strategies during clinical trial evaluation of novel therapeutics. For example, when evaluating a putative anti-angiogeneic agent or treatment regime, the expression signatures and methods disclosed herein may be used to select individuals for clinical trials that have cancer subtypes that are responsive to anti-angiogenic agents.
- a cancer is "responsive" to a therapeutic agent if its rate of growth is inhibited as a result of contact with the therapeutic agent, compared to its growth in the absence of contact with the therapeutic agent.
- Growth of a cancer can be measured in a variety of ways. For instance, the size of a tumor or measuring the expression of tumor markers appropriate for that tumor type.
- a cancer is "non-responsive" to a therapeutic agent if its rate of growth is not inhibited, or inhibited to a very low degree, as a result of contact with the therapeutic agent when compared to its growth in the absence of contact with the therapeutic agent.
- growth of a cancer can be measured in a variety of ways, for instance, the size of a tumor or measuring the expression of tumor markers appropriate for that tumor type.
- the quality of being non-responsive to a therapeutic agent is a highly variable one, with different cancers exhibiting different levels of "non-responsiveness" to a given therapeutic agent, under different conditions. Still further, measures of non-responsiveness can be assessed using additional criteria beyond growth size of a tumor such as, but not limited to, patient quality of life, and degree of metastases.
- Another application of the expression signatures disclosed herein is the combined identification of prognosis of a patient along with identification of a predicted responsiveness of the patient to a given therapeutic.
- a non-angiogenesis expression signature defined below is used to identify patients with a good prognosis from those with a poor prognosis, and an angiogenesis expression signature is used to predict the patient's response to a given therapeutic class of drugs.
- the angiogenesis subtype can be identified from a fresh/frozen (FF) or formalin fixed paraffin embedded (FFPE) patient sample.
- the cancer type is ovarian cancer, breast cancer, colon cancer, colorectal cancer, lung cancer, prostate cancer, or glioblastoma.
- the cancer type is a ovarian cancer.
- the cancer type is breast cancer.
- the cancer type is lung cancer.
- the cancer type is colon cancer.
- the cancer type is prostate cancer.
- the cancer type is glioblastoma
- the expression signatures of the present invention are identified by analyzing the expression profiles of certain biomarkers in a patient sample set.
- Biomarkers suitable for use in the present invention include DNA, RNA, and proteins.
- the biomarkers are isolated from a patient sample and their expression levels determined to derive a set of expression profiles for each sample analyzed in the patient sample set.
- the expression signature is an angiogenesis expression signature.
- An angiogenesis expression signature relates to an angiogenesis phenotype obversed in cancer tissues, the phenotype characterized by an up-regulation of biomarkers associated with angiogenesis and vascular development.
- the expression signature is a non-angiogenesis expression signature.
- a non-angiogenesis expression signature relates to a phenotype observed in cancer tissues, the phenotype characterized by a down-regulation of biomarkers associated with angiongenesis and vascular development.
- the expression profile obtained is a genomic or nucleic acid expression profile, where the amount or level of one or more nucleic acids in the sample is determined.
- the sample that is assayed to generate the expression profile employed in the diagnostic or prognostic methods is one that is a nucleic acid sample.
- the nucleic acid sample includes a population of nucleic acids that includes the expression information of the phenotype determinative biomarkers of the cell or tissue being analyzed.
- the nucleic acid may include RNA or DNA nucleic acids, e.g., mRNA, cRNA, cDNA etc., so long as the sample retains the expression information of the host cell or tissue from which it is obtained.
- the sample may be prepared in a number of different ways, as is known in the art, e.g., by mRNA isolation from a cell, where the isolated mRNA is used as isolated, amplified, or employed to prepare cDNA, cRNA, etc., as is known in the field of differential gene expression. Accordingly, determining the level of mRNA in a sample includes preparing cDNA or cRNA from the mRNA and subsequently measuring the cDNA or cRNA.
- the sample is typically prepared from a cell or tissue harvested from a subject in need of treatment, e.g., via biopsy of tissue, using standard protocols, where cell types or tissues from which such nucleic acids may be generated include any tissue in which the expression pattern of the to be determined phenotype exists, including, but not limited to, disease cells or tissue, body fluids, etc.
- the expression profile may be generated from the initial nucleic acid sample using any convenient protocol. While a variety of different manners of generating expression profiles are known, such as those employed in the field of differential gene expression/biomarker analysis, one representative and convenient type of protocol for generating expression profiles is array-based gene expression profile generation protocols. Such applications are hybridization assays in which a nucleic acid that displays "probe" nucleic acids for each of the genes to be assayed/profiled in the profile to be generated is employed. In these assays, a sample of target nucleic acids is first prepared from the initial nucleic acid sample being assayed, where preparation may include labeling of the target nucleic acids with a label, e.g., a member of a signal producing system.
- a label e.g., a member of a signal producing system.
- target nucleic acid sample preparation Following target nucleic acid sample preparation, the sample is contacted with the array under hybridization conditions, whereby complexes are formed between target nucleic acids that are complementary to probe sequences attached to the array surface. The presence of hybridized complexes is then detected, either qualitatively or quantitatively.
- Specific hybridization technology which may be practiced to generate the expression profiles employed in the subject methods includes the technology described in U.S. Pat. Nos.
- an array of "probe" nucleic acids that includes a probe for each of the biomarkers whose expression is being assayed is contacted with target nucleic acids as described above. Contact is carried out under hybridization conditions, e.g., stringent hybridization conditions as described above, and unbound nucleic acid is then removed.
- hybridization conditions e.g., stringent hybridization conditions as described above
- unbound nucleic acid is then removed.
- the resultant pattern of hybridized nucleic acids provides information regarding expression for each of the biomarkers that have been probed, where the expression information is in terms of whether or not the gene is expressed and, typically, at what level, where the expression data, i.e., expression profile, may be both qualitative and quantitative.
- the patient sample set comprises cancer tissue samples, such as archived samples.
- the patient sample set is preferably derived from cancer tissue samples having been characterized by prognosis, likelihood of recurrence, long term survival, clinical outcome, treatment response, diagnosis, cancer classification, or personalized genomics profile.
- cancer includes, but is not limited to, leukemia, brain cancer, prostate cancer, liver cancer, ovarian cancer, stomach cancer, colorectal cancer, throat cancer, breast cancer, skin cancer, melanoma, lung cancer, sarcoma, cervical cancer, testicular cancer, bladder cancer, endocrine cancer, endometrial cancer, esophageal cancer, glioma, lymphoma, neuroblastoma, osteosarcoma, pancreatic cancer, pituitary cancer, renal cancer, and the like.
- colorectal cancer encompasses cancers that may involve cancer in tissues of both the rectum and other portions of the colon as well as cancers that may be individually classified as either colon cancer or rectal cancer.
- the methods described herein refer to cancers that are treated with anti-angiogenic agents, anti-angiogenic targeted therapies, inhibitors of angiogenesis signaling, but not limited to these classes. These cancers also include subclasses and subtypes of these cancers at various stages of pathogenesis.
- the patient sample set comprises ovarian cancer samples.
- the patient sample set comprises breast cancer samples.
- the patient sample set comprises glioblastoma samples.
- Bio sample “sample”, and “test sample” are used interchangeably herein to refer to any material, biological fluid, tissue, or cell obtained or otherwise derived from an individual.
- a blood sample can be fractionated into serum or into fractions containing particular types of blood cells, such as red blood cells or white blood cells (leukocytes).
- a sample can be a combination of samples from an individual, such as a combination of a tissue and fluid sample.
- biological sample also includes materials containing homogenized solid material, such as from a stool sample, a tissue sample, or a tissue biopsy, for example.
- biological sample also includes materials derived from a tissue culture or a cell culture.
- any suitable methods for obtaining a biological sample can be employed; exemplary methods include, e.g., phlebotomy, swab (e.g., buccal swab), and a fine needle aspirate biopsy procedure. Samples can also be collected, e.g., by micro dissection (e.g., laser capture micro dissection (LCM) or laser micro dissection (LMD)), bladder wash, smear (e.g., a PAP smear), or ductal lavage.
- a "biological sample” obtained or derived from an individual includes any such sample that has been processed in any suitable manner after being obtained from the individual, for example, fresh frozen or formalin fixed and/or paraffin embedded.
- the methods of the invention as defined herein begin with an obtained sample and thus do not incorporate the step of obtaining the sample from the patient. The methods are in vitro methods performed on an isolated sample.
- patient includes human and non-human animals.
- the preferred patient for treatment is a human.
- Patient “Patient,” “individual” and “subject” are used interchangeably herein.
- biomarker can refer to a gene, an mRNA, cDNA, an antisense transcript, a miRNA, a polypeptide, a protein, a protein fragment, or any other nucleic acid sequence or polypeptide sequence that indicates either gene expression levels or protein production levels.
- a biomarker indicates or is a sign of an abnormal process, disease or other condition in an individual, that biomarker is generally described as being either over-expressed or under-expressed as compared to an expression level or value of the biomarker that indicates or is a sign of a normal process, an absence of a disease or other condition in an individual.
- Up-regulation “up-regulated”, “over-expression”, “over-expressed”, and any variations thereof are used interchangeably to refer to a value or level of a biomarker in a biological sample that is greater than a value or level (or range of values or levels) of the biomarker that is typically detected in similar biological samples from healthy or normal individuals.
- the terms may also refer to a value or level of a biomarker in a biological sample that is greater than a value or level (or range of values or levels) of the biomarker that may be detected at a different stage of a particular disease.
- Down-regulation Down-regulated
- under-expression under-expressed
- any variations thereof are used interchangeably to refer to a value or level of a biomarker in a biological sample that is less than a value or level (or range of values or levels) of the biomarker that is typically detected in similar biological samples from healthy or normal individuals.
- the terms may also refer to a value or level of a biomarker in a biological sample that is less than a value or level (or range of values or levels) of the biomarker that may be detected at a different stage of a particular disease.
- a biomarker that is either over-expressed or under-expressed can also be referred to as being “differentially expressed” or as having a “differential level” or “differential value” as compared to a "normal” expression level or value of the biomarker that indicates or is a sign of a normal process or an absence of a disease or other condition in an individual.
- "differential expression” of a biomarker can also be referred to as a variation from a "normal” expression level of the biomarker.
- differential biomarker expression and “differential expression” are used interchangeably to refer to a biomarker whose expression is activated to a higher or lower level in a subject suffering from a specific disease, relative to its expression in a normal subject, or relative to its expression in a patient that responds differently to a particular therapy or has a different prognosis.
- the terms also include biomarkers whose expression is activated to a higher or lower level at different stages of the same disease. It is also understood that a differentially expressed biomarker may be either activated or inhibited at the nucleic acid level or protein level, or may be subject to alternative splicing to result in a different polypeptide product.
- Differential biomarker expression may include a comparison of expression between two or more genes or their gene products; or a comparison of the ratios of the expression between two or more genes or their gene products; or even a comparison of two differently processed products of the same gene, which differ between normal subjects and subjects suffering from a disease; or between various stages of the same disease.
- Differential expression includes both quantitative, as well as qualitative, differences in the temporal or cellular expression pattern in a biomarker among, for example, normal and diseased cells, or among cells which have undergone different disease events or disease stages.
- the biomarker is an RNA transcript.
- RNA transcript refers to both coding and non-coding RNA, including messenger RNAs (mRNA), alternatively spliced mRNAs, ribosomal RNA (rRNA), transfer RNA (tRNA), small nuclear RNAs (snRNA), and antisense RNA. Measuring mRNA in a biological sample may be used as a surrogate for detection of the level of the corresponding protein and gene in the biological sample. Thus, any of the biomarkers or biomarker panels described herein can also be detected by detecting the appropriate RNA.
- Methods of biomarker expression profiling include, but are not limited to quantitative PCR, NGS, northern blots, southern blots, microarrays, SAGE, immunoassays (ELISA, EIA, agglutination, nephelometry, turbidimetry, Western blot, immunoprecipitation, immunocytochemistry, flow cytometry, Luminex assay), and mass spectrometry.
- the overall expression data for a given sample may be normalized using methods known to those skilled in the art in order to correct for differing amounts of starting material, varying efficiencies of the extraction and amplification reactions.
- biomarkers useful for distinguishing between cancer types that are responsive and non-responsive to anti-angiogenic therapeutics can be determined by identifying biomarkers exhibiting the highest degree of variability between samples in the patient data set as determined using the expression detection methods and patient sample sets discussed above. Standard statistical methods known in the art for identifying highly variable data points in expression data may be used to identify the highly variable biomarkers. For example, a combined background and variance filter to the patient data set.
- the background filter is based on the selection of probe sets with expression E and expression variance var E above the thresholds defined by background standard deviation ⁇ Bg (from the Expression Console software) and quantile of the standard normal distribution z ⁇ at a specified significance a probe sets were kept if: E > log 2 z a ⁇ Bg ; log 2 var E > 2 log 2 ⁇ Bg ⁇ E ⁇ log 2 log 2 where a defines a significance threshold.
- the significance threshold is 6.3 • 10 -5 .
- the significance threshold may be between 1.0 • 10 -7 to 1.0 • 10 -3 .
- the highly variable biomarkers may be further analyzed to group samples in the patient data set into subtypes or clusters based on similar gene expression profiles.
- biomarkers may be clustered based on how highly correlated the up-regulation or down-regulation of their expression is to one another.
- clustering analysis techniques known in the art may be used.
- hierarchical agglomerative clustering is used to identify the cancer subtypes.
- the biomarkers within each cluster may be further mapped to their corresponding genes and annotated by cross-reference to one or more gene ontology databases containing information on biological activity and biological pathways associated with the gene.
- biomarker in clusters enriched for angiogenesis, vasculature development and immune response general functional terms are grouped into a putative angiogenesis sample group and used for expression signature generation.
- biomarkers in clusters that are up regulated and enriched for angiogeneis, vasculature development and immune response general functional terms are grouped into a putative angiongenesis sample group and used for expression signature generation.
- biomarkers in clusters that are down regulated and enriched for angiogenesis, vasculature development and immune response general functional terms are grouped into a putative angiongenesis sample group and used for expression signature generation. Further details for conducting functional analysis of biomarker clusters is provided in the Examples section below.
- the biomarkers useful in deriving an expression signature are those biomarkers listed in Table 1A, Table 1B, Table 1C, or a combination thereof. These biomarkers are identified as having predictive value to determine a patient response to a therapeutic agent and/or a prognostice value in identifying individuals with a good or poor clinical prognosis.
- their expression correlates with the response, or lack thereof, to an agent, and more specifically, an anti-angiogenic therapeutic agent.
- an agent and more specifically, an anti-angiogenic therapeutic agent.
- the expression of the biomarkers disclosed herein correlated with a patient's overall clinical prognosis.
- a patient's overall clinical prognosis By examinaing the expression of a collection of biomarkers identified in a tumor, it is possible to determine whether the individual has a cancer subtype associated with good clinical prognosis or poor clinical prognosis.
- these determinations can be made on a patient-by-patient basis.
- one of ordinary skill in the art can use predicted prognosis to help select appropriate treatment regimens to treat the underlying disease while eliminating those treatment regimens most likely to produce undesired or medically unwarranted adverse side effects.
- SEQ ID NOs listed in Table 1A, Table 1B, and Table 1C refer to probe set identifiers used to measure the expression levels of the genes on an exemplary transcriptome array.
- Expression signatures have been cross-validated using expression data from different arrays with differnt probe sets as detailed further in the Examples section below. Accordingly, the expression signatures and methods disclosed herein are not limited to expression values measured using the probe sets disclosed herein.
- Table 1A Genes in Clusters of Figure 1 SEQ NO: Orientation Gene Symbol 1 Sense STAT1 2 Sense PDGFC 3 Sense TGFB3 4 Sense RAC2 5 Sense MARCKS 6 Sense ALOX5 7 Sense COL8A1 8 Sense CTSS 9 Sense HAVCR2 10 Sense RAB31 11 Sense KCNAB2 12 Sense THBS1 13 Sense SH3BP4 14 Sense CTGF 15 Sense CTGF 16 Sense VCAN 17 Sense IGKC 18 Sense IGKC 19 Sense IGKC 20 Sense SGK1 21 Sense NFATC1 22 Sense HMHA1 23 Sense FCGR1C /// FCGR1A /// FCGR1B 24 Sense EDA2R 25 Sense COL8A1 26 Sense COL12A1 27 Sense HLA-B 28 Sense HLA-F 29 Sense HLA-C 30 Sense SPP1 31 Sense MYO1F 32 Sense SPARC 33 Sense SPARC 34 Sense UBD ///
- ER group Gene Symbol Orientation 632 ER pos STAT1 Sense (Fully Exonic) 709 ER pos STAT1 Sense (Fully Exonic) 803 ER neg HOXD3 Sense (includes Intronic) 804 ER neg LCP1 Sense (Fully Exonic) 875 ER neg SPON1 Sense (Fully Exonic) 633 ER pos IGF1 Sense (Fully Exonic) 805 ER neg FHL1 Sense (Fully Exonic) 806 ER neg MS4A1 Sense (Fully Exonic) 876 ER neg FN1 Sense (Fully Exonic) 710 ER pos FN1 Sense (Fully Exonic) 634 ER pos HLA-DPA1 Sense (Fully Exonic) 877 ER neg ADAM12 Sense (Fully Exonic) 711 ER pos ITGBL1 Sense (Fully Exonic) 712 ER pos POSTN Sense
- expression signatures comprising the biomarkers in Table 1A, Table 1B, and Table 1C can be generated using the methods provided herein and can comprise between one, and all of the markers set forth in Tables 1A, 1B, 1C and each and every combination in between (e.g., four selected markers, 16 selected markers, 74 selected markers, etc.).
- the expression signature comprises at least 5, 10, 20, 40, 60, 100, 150, 200, or 300 or more markers.
- the predictive biomarker panel comprises no more than 5, 10, 20, 40, 60, 100, 150, 200, 300, 400, 500, 600 or 700 markers.
- the expression signature includes a plurality of markers listed in Table 1A.
- the expression signature includes a plurality of biomarkers listing in Table 1B. In another instance, the expression signature includes a plurality of biomarkers listed in Table 1C. In yet another instance, the expression signature includes a plurality of biomarkers listed in Table 1A, Table 1B, and Table 1C. In some instances the expression signature includes at least about 1%, about 5%, about 10%, about 20%, about 30%, about 40%, about 50%, about 60%, about 70%, about 80%, about 90%, about 95%, about 96%, about 97%, about 98%, or about 99% of the markers listed in Table 1A, Table 1B, Table 1C, or a combination thereof. Selected expression signatures can be assembled from the biomarkers provided using methods described herein and analogous methods known in the art. In one instance, the expression signature contains all 250 genes or gene products in Table 1A. In another exemplary instance, the expression signature contains all 486 genes or gene products in Table 1B. In another instance, the expression signature contains all 343 genes or gene products in Table 1C.
- the following methods may be used to derive expression signatures for distinguishing between subjects that are responsive or non-responsive to anti-angiogenic therapeutics, or as prognostic indicators of certain cancer types, including expression signatures derived from the biomarkers disclosed above.
- the expression signature is derived using a decision tree ( Hastie et al. The Elements of Statistical Learning, Springer, New York 2001 ), a random forest ( Breiman, 2001 Random Forests, Machine Learning 45:5 ), a neural network ( Bishop, Neural Networks for Pattern Recognition, Clarendon Press, Oxford 1995 ), discriminant analysis ( Duda et al.
- Pattern Classification 2nd ed., John Wiley, New York 2001 ), including, but not limited to linear, diagonal linear, quadratic and logistic discriminant analysis, a Prediction Analysis for Microarrays (PAM, ( Tibshirani et al., 2002, Proc. Natl. Acad. Sci. USA 99:6567-6572 )) or a Soft Independent Modeling of Class Analogy analysis. (SIMCA, ( Wold, 1976, Pattern Recogn. 8:127-139 )).
- PAM Prediction Analysis for Microarrays
- SIMCA Soft Independent Modeling of Class Analogy analysis.
- Biomarker expression values may be defined in combination with corresponding scalar weights on the real scale with varying magnitude, which are further combined through linear or non-linear, algebraic, trigonometric or correlative means into a single scalar value via an algebraic, statistical learning, Bayesian, regression, or similar algorithms which together with a mathematically derived decision function on the scalar value provide a predictive model by which expression profiles from samples may be resolved into discrete classes of responder or non-responder, resistant or non-resistant, to a specified drug, drug class, or treatment regimen.
- Such predictive models are developed by learning weights and the decision threshold, optimized for sensitivity, specificity, negative and positive predictive values, hazard ratio or any combination thereof, under cross-validation, bootstrapping or similar sampling techniques, from a set of representative expression profiles from historical patient samples with known drug response and/or resistance.
- the biomarkers are used to form a weighted sum of their signals, where individual weights can be positive or negative.
- the resulting sum (“expression score") is compared with a pre-determined reference point or value. The comparison with the reference point or value may be used to diagnose, or predict a clinical condition or outcome.
- biomarkers included in the classifier provided in Tables 1A, 1B, and Table 1C will carry unequal weights in a classifier for responsiveness or resistance to a therapeutic agent. Therefore, while as few as one sequence may be used to diagnose or predict an outcome such as responsiveness to therapeutic agent, the specificity and sensitivity or diagnosis or prediction accuracy may increase using more sequences.
- weight refers to the relative importance of an item in a statistical calculation.
- the weight of each biomarker in a gene expression classifier may be determined on a data set of patient samples using analytical methods known in the art.
- bias or “offset” refers to a constant term derived using the mean expression of the signatures genes in a training set and is used to mean-center the each gene analyzed in the test dataset.
- the expression signature is defined by a decision function.
- the linear classifier will further define a threshold value that splits the gene expression data space into two disjoint halves.
- Exemplary linear classifiers include but are not limited to partial least squares (PLS), ( Nguyen et al., Bioinformatics 18 (2002) 39-50 ), support vector machines (SVM) (Schölkopf et al., Learning with Kernels, MIT Press, Cambridge 2002), and shrinkage discriminant analysis (SDA) ( Ahdesmäki et al., Annals of applied statistics 4, 503-519 (2010 )).
- PLS partial least squares
- SVM support vector machines
- SDA shrinkage discriminant analysis
- the linear classifier is a PLS linear classifier.
- the decision function is empirically derived on a large set of training samples, for example from patients showing responsiveness or resistance to a therapeutic agent.
- the threshold separates a patient group based on different characteristics such as, but not limited to, responsiveness/non-responsiveness to treatment.
- the interpretation of this quantity, i.e. the cut-off threshold responsiveness or resistance to a therapeutic agent, is derived in the development phase ("training") from a set of patients with known outcome.
- the corresponding weights and the responsiveness/resistance cut-off threshold for the decision score are fixed a priori from training data by methods known to those skilled in the art.
- Partial Least Squares Discriminant Analysis (PLS-DA) is used for determining the weights. ( L. St ⁇ hle, S. Wold, J. Chemom. 1 (1987) 185-196 ; D. V. Nguyen, D.M. Rocke, Bioinformatics 18 (2002) 39-50 ).
- the data space i.e. the set of all possible combinations of biomarker expression values
- the data space is split into two mutually exclusive groups corresponding to different clinical classifications or predictions, for example, one corresponding to responsiveness to a therapeutic agent and the other to non-responsiveness.
- relative over-expression of a certain biomarker can either increase the decision score (positive weight) or reduce it (negative weight) and thus contribute to an overall decision of, for example, responsiveness or resistance to a therapeutic agent.
- the data is transformed nonlinearly before applying a weighted sum as described above.
- This non-linear transformation might include increasing the dimensionality of the data.
- the non-linear transformation and weighted summation might also be performed implicitly, for example, through the use of a kernel function. ( Schölkopf et al. Learning with Kernels, MIT Press, Cambridge 2002 ).
- the patient training set data is derived by isolated RNA from a corresponding cancer tissue sample set and determining expression values by hybridizing the isolated RNA to a microarray.
- the microarray used in deriving the expression signature is a transcriptome array.
- a "transcriptome array" refers to a microarray containing probe sets that are designed to hybridize to sequences that have been verified as expressed in the diseased tissue of interest. Given alternative splicing and variable poly-A tail processing between tissues and biological contexts, it is possible that probes designed against the same gene sequence derived from another tissue source or biological context will not effectively bind to transcripts expressed in the diseased tissue of interest, leading to a loss of potentially relevant biological information.
- the probe set of the transcriptome array is designed to bind within 300 nucleotides of the 3' end of a transcript.
- the microarray used in deriving the gene expression profiles of the present invention is the Almac Ovarian Cancer DSATM microarray (Almac Group, Craigavon, United Kingdom).
- An optimal linear classifier can be selected by evaluating a linear classifier's performance using such diagnostics as "area under the curve” (AUC).
- AUC refers to the area under the curve of a receiver operating characteristic (ROC) curve, both of which are well known in the art.
- ROC receiver operating characteristic
- AUC measures are useful for comparing the accuracy of a classifier across the complete data range. Linear classifiers with a higher AUC have a greater capacity to classify unknowns correctly between two groups of interest (e.g., ovarian cancer samples and normal or control samples).
- ROC curves are useful for plotting the performance of a particular feature (e.g., any of the biomarkers described herein and/or any item of additional biomedical information) in distinguishing between two populations (e.g., individuals responding and not responding to a therapeutic agent).
- the feature data across the entire population e.g., the cases and controls
- the true positive and false positive rates for the data are calculated.
- the true positive rate is determined by counting the number of cases above the value for that feature and then dividing by the total number of cases.
- the false positive rate is determined by counting the number of controls above the value for that feature and then dividing by the total number of controls.
- ROC curves can be generated for a single feature as well as for other single outputs, for example, a combination of two or more features can be mathematically combined (e.g., added, subtracted, multiplied, etc.) to provide a single sum value, and this single sum value can be plotted in a ROC curve. Additionally, any combination of multiple features, in which the combination derives a single output value, can be plotted in a ROC curve. These combinations of features may comprise a test. The ROC curve is the plot of the true positive rate (sensitivity) of a test against the false positive rate (1-specificity) of the test.
- an angiogenesis expression signature is directed to the 25 biomarkers detailed in Table 2A with corresponding ranks, weights and associated bias detailed in the table or alternative rankings, weightings and bias, depending, for example, on the disease setting.
- an angiogenesis expression signature is directed to the 45 biomarkers detailed in Table 2B with corresponding ranks, weights and associated bias detailed in the table or alternative rankings, weightings and bias, depending, for example, on the disease setting.
- a non-angiogeneis expression signature is directed to the 63 biomarkers detailed in Table 2C with corresponding ranks, and weights and associated bias detailed in the table or alternative rankings, and weightings and bias, depending, for example, on the disease setting.
- Tables 2A, 2B and 2C rank the biomarkers in order of absolute decreasing weight, in an example classifier, in the compound decision score function.
- Table 2A 25 Biomarker Signature Rank Gene Symbol Weight Bias 1 CCDC80 0.0584 5.9594 2 INHBA 0.0508 3.8146 3 THBS2 0.0504 3.4342 4 SFRP2 0.0437 4.3293 5 MMP2 0.0367 5.3319 6 PLAU -0.0323 8.3844 7 FAP 0.0300 3.4689 8 FN1 0.0277 10.0610 9 COL8A1 -0.0248 5.1984 10 RAB31 0.0244 5.6121 11 FAM38B 0.0242 5.0883 12 VCAN 0.0230 4.4460 13 GJB2 0.0223 5.8677 14 ITGA5 0.0216 5.4455 15 CRISPLD2 0.0192 6.5088 16 C17orf91 0.0167 6.4830 17 BGN -0.0142 5.5396 18 TIMP3 0.0130 4.6739 19 ALPK2 0.0123 7.37
- an expression signature comprises all or a portion of the following biomarkers: CCDC80, INHBA, THBS2, SFRP2, MMP2, PLAU, FAP, FN1, COL8A1, RAB31, FAM38B, VCAN, GJB2, ITGA5, CRISPLD2, C17, f91, BGN, TIMP3, ALPK2, LUM, NKD2, LOX, MIR1245, LOXL1, and CXCL12.
- an expression signature comprises CCDC80, INHBA, THBS2 and SFRP2 and at least N additional biomarkers selected from the list of biomarkers in Table 2A, wherein N equals 2, 3, 4, 5, 6, 7, 8, 9, 10, 11, 12, 13, 14, 15, 16, 17, 18, 19, 20, or 21.
- the expression signature comprises CCDC80 and at least N additional biomarkers selected from the list of biomarkers in Table 2A, wherein N equals 2, 3, 4, 5, 6, 7, 8, 9, 10, 11, 12, 13, 14, 15, 16, 17, 18, 19, 20, 21, 22, 23, or 24.
- the expression signature comprises INHBA and at least N additional biomarkers selected from the list of biomarkers in Table 2A, wherein N equals 2, 3, 4, 5, 6, 7, 8, 9, 10, 11, 12, 13, 14, 15, 16, 17, 18, 19, 20, 21, 22, 23, or 24.
- the expression signature comprises THBS2 and at least N additional biomarkers selected from the list of biomarkers in Table 2A, wherein N equals 2, 3, 4, 5, 6, 7, 8, 9, 10, 11, 12, 13, 14, 15, 16, 17, 18, 19, 20, 21, 22, 23, or 24.
- the expression signature comprises SFRP2 and at least N additional biomarkers selected from the list of biomarkers in Table 2A, wherein N equals 2, 3, 4, 5, 6, 7, 8, 9, 10, 11, 12, 13, 14, 15, 16, 17, 18, 19, 20, 21, 22, 23, or 24.
- an example expression signatures comprises the biomarkers and the corresponding biomarker weighted values listed in Table 2A.
- an example expression signature consists of the biomarkers and the corresponding biomarker weighted values listed in Table 2A
- the methods disclosed herein comprise conducting an assay on a biological sample from an individual to determine the expression levels of one or more biomarkers in a biomarker panel, the biomarker panel comprising CCDC80, INHBA, THBS2 and SFRP2 and at least N additional biomarkers selected from the list of biomarkers in Table 2A, wherein N equals 1, 2, 3, 4, 5, 6, 7, 8, 9, 10, 11, 12, 13, 14, 15, 16, 17, 18, 19, 20 or 21.
- the methods disclosed herein comprise conducting an assay on a biological sample from an individual to determine the expression levels of one or more biomarkers in a biomarker panel, the biomarker panel comprising CCDC80 and at least N additional biomarkers selected from the list of biomarkers in Table 2A, wherein N equals 1, 2, 3, 4, 5, 6, 7, 8, 9, 10, 11, 12, 13, 14, 15, 16, 17, 18, 29, 20, 21, 22, 23 or 24.
- the methods disclosed herein comprise conducting an assay on a biological sample from an individual to determine the expression levels of one or more biomarkers in a biomarker panel, the biomarker panel comprising INHBA and at least N additional biomarkers selected from the list of biomarkers in Table 2A, wherein N equals 1, 2, 3, 4, 5, 6, 7, 8, 9, 10, 11, 12, 13, 14, 15, 16, 17, 18, 29, 20, 21, 22, 23 or 24.
- the methods disclosed herein comprise conducting an assay on a biological sample from an individual to determine the expression levels of one or more biomarkers in a biomarker panel, the biomarker panel comprising THBS2 and at least N additional biomarkers selected from the list of biomarkers in Table 2A, wherein N equals 1, 2, 3, 4, 5, 6, 7, 8, 9, 10, 11, 12, 13, 14, 15, 16, 17, 18, 29, 20, 21, 22, 23 or 24.
- the methods disclosed herein comprise conducting an assay on a biological sample from an individual to determine the expression levels of one or more biomarkers in a biomarker panel, the biomarker panel comprising SFRP2 and at least N additional biomarkers selected from the list of biomarkers in Table 2A, wherein N equals 1, 2, 3, 4, 5, 6, 7, 8, 9, 10, 11, 12, 13, 14, 15, 16, 17, 18, 29, 20, 21, 22, 23 or 24.
- an expression signature comprises all or a portion of the following biomarkers; TMEM200A, GJB2, MMP13, GFPT2, POSTN, BICC1, CDH11, MRVI1, PMP22, COL11A1, IGFL2, LUM, NTM, BGN, COL3A1, COL10A1, RAB31, ANGPTL2, PLAU, COL8A1, MIR1245, POLD2, NKD2, FZD1, COPZ2, ITGA5, VGLL3, INHBA, MMP14, VCAN, THBS2, RUNX2, TIMP3, SFRP2, COL1A2, COL5A2, SERPINF1, KIF26B, TNFAIP6, MMP2, FN1, ALPK2, CTSK, LOXL1 and FAP.
- an expression signature comprises TMEM200A, GJB2, MMP13 and GFPT2 and at least N additional biomarkers selected from the list of biomarkers in Table 2B, wherein N equals 1, 2, 3, 4, 5, 6, 7, 8, 9, 10, 11, 12, 13, 14, 15, 16, 17, 18, 19, 20, 21, 22, 23, 24, 25, 26, 27, 28, 29, 30, 31, 32, 33, 34,35, 36, 37, 38, 39, 40, or 41.
- an expression signature comprises TMEM200A and at least N additional biomarkers selected from the list of biomarkers in Table 2B, wherein N equals 1, 2, 3, 4, 5, 6, 7, 8, 9, 10, 11, 12, 13, 14, 15, 16, 17, 18, 19, 20, 21, 22, 23, 24, 25, 26, 27, 28, 29, 30, 31, 32, 33, 34,35, 36, 37, 38, 39, 40, 41, 42, 43 or 44.
- an expression signature comprises GJB2 and at least N additional biomarkers selected from the list of biomarkers in Table 2B, wherein N equals 1, 2, 3, 4, 5, 6, 7, 8, 9, 10, 11, 12, 13, 14, 15, 16, 17, 18, 19, 20, 21, 22, 23, 24, 25, 26, 27, 28, 29, 30, 31, 32, 33, 34,35, 36, 37, 38, 39, 40, 41, 42, 43 or 44.
- an expression signature comprises MMP13 and at least N additional biomarkers selected from the list of biomarkers in Table 2B, wherein N equals 1, 2, 3, 4, 5, 6, 7, 8, 9, 10, 11, 12, 13, 14, 15, 16, 17, 18, 19, 20, 21, 22, 23, 24, 25, 26, 27, 28, 29, 30, 31, 32, 33, 34,35, 36, 37, 38, 39, 40, 41, 42, 43 or 44.
- an expression signature comprises GFPT2 and at least N additional biomarkers selected from the list of biomarkers in Table 2B, wherein N equals 1, 2, 3, 4, 5, 6, 7, 8, 9, 10, 11, 12, 13, 14, 15, 16, 17, 18, 19, 20, 21, 22, 23, 24, 25, 26, 27, 28, 29, 30, 31, 32, 33, 34,35, 36, 37, 38, 39, 40, 41, 42, 43 or 44.
- an example expression signature comprises the biomarkers and the corresponding biomarker weighted values listed in Table 2B. In another instance, the expression signature consists of the biomarkers and corresponding biomarker weighted values listed in Table 2B.
- the methods described herein comprise conducting an assay on a biological sample from an individual to determine the expression levels of one or more biomarkers in a biomarker panel, the biomarker panel comprising TMEM200A, GJB2, MMP13 and GFPT2 and at least N additional biomarkers selected from the list of biomarkers in Table 2B, wherein N equals 1, 2, 3, 4, 5, 6, 7, 8, 9, 10, 11, 12, 13, 14, 15, 16, 17, 18, 19, 20, 21, 22, 23, 24, 25, 26, 27, 28, 29, 30, 31, 32, 33, 34,35, 36, 37, 38, 39, 40 or 41.
- the methods described herein comprise conducting an assay on a biological sample from an individual to determine the expression levels of one or more biomarkers in a biomarker panel, the biomarker panel comprising TMEM200A and at least N additional biomarkers selected from the list of biomarkers in Table 2B, wherein N equals 1, 2, 3, 4, 5, 6, 7, 8, 9, 10, 11, 12, 13, 14, 15, 16, 17, 18, 29, 20, 21, 22, 23, 24, 25, 26, 27, 28, 29, 30, 31, 32, 33, 34,35, 36, 37, 38, 39, 40, 41, 42, 43 or 44.
- the methods described herein comprise conducting an assay on a biological sample from an individual to determine the expression levels of one or more biomarkers in a biomarker panel, the biomarker panel comprising GJB2 and at least N additional biomarkers selected from the list of biomarkers in Table 2a, wherein N equals 1. 2, 3, 4, 5, 6, 7, 8, 9, 10, 11, 12, 13, 14, 15, 16, 17, 18, 29, 20, 21, 22, 23, 24, 25, 26, 27, 28, 29, 30, 31, 32, 33, 34,35, 36, 37, 38, 39, 40, 41, 42, 43 or 44.
- the methods described herein comprise conducting an assay on a biological sample from an individual to determine the expression levels of one or more biomarkers in a biomarker panel, the biomarker panel comprising MMP13 and at least N additional biomarkers selected from the list of biomarkers in Table 2B, wherein N equals 1, 2, 3, 4, 5, 6, 7, 8, 9, 10, 11, 12, 13, 14, 15, 16, 17, 18, 29, 20, 21, 22, 23, 24, 25, 26, 27, 28, 29, 30, 31, 32, 33, 34,35, 36, 37, 38, 39, 40, 41, 42, 43 or 44.
- the methods described herein comprise conducting an assay on a biological sample from an individual to determine the expression levels of one or more biomarkers in a biomarker panel, the biomarker panel comprising GFPT2 and at least N additional biomarkers selected from the list of biomarkers in Table 2B, wherein N equals 1, 2, 3, 4, 5, 6, 7, 8, 9, 10, 11, 12, 13, 14, 15, 16, 17, 18, 29, 20, 21, 22, 23, 24, 25, 26, 27, 28, 29, 30, 31, 32, 33, 34,35, 36, 37, 38, 39, 40, 41, 42, 43 or 44.
- an expression signature comprises all of the following biomarkers; IGF2, SOX11, INS, CXCL17, SLC5A1, TMEM45A, CXCR2P1, MFAP2, MATN3, RTP4, COL3A1, CDR1, RARRES3, TNFSF10, NUAK1, SNORD114-14, SRPX, SPARC, GJB1, TIMP3, ISLR, TUBA1A, DEXI, BASP1, PXDN, GBP4, SLC28A3, HLA-DRA, TAP2, ACSL5, CDH11, PSMB9, MMP14, CD74, LOXL1, CIITA, ZNF697, SH3RF2, MIR198, COL1A2, TNFRSF14, COL8A1, C21orf63, TAP1, PDPN, RHOBTB3, BCL11A, HLA-DOB, XAF1, ARHGAP26, POLD2, DPYSL2, COL4A1, ID3, CFB, NID1, FKBP
- an expression signature comprises IGF2, SOX11, INS, and CXCL17 and at least N additional biomarkers selected from the list of biomarkers in Table 2C, wherein N equals 1, 2, 3, 4, 5, 6, 7, 8, 9, 10, 11, 12, 13, 14, 15, 16, 17, 18, 19, 20, 21, 22, 23, 24, 25, 26, 27, 28, 29, 30, 31, 32, 33, 34, 35, 36, 37, 38, 39, 40, 41, 42, 43, 44, 45, 46, 47, 48, 49, 50, 51, 52, 53, 54, 55, 56, 57, 58, or 59.
- an expression signature comprises IGF2 and at least N additional biomarkers selected from the list of biomarkers in Table 2C, wherein N equals 1, 2, 3, 4, 5, 6, 7, 8, 9, 10, 11, 12, 13, 14, 15, 16, 17, 18, 19, 20, 21, 22, 23, 24, 25, 26, 27, 28, 29, 30, 31, 32, 33, 34, 35, 36, 37, 38, 39, 40, 41, 42, 43, 44, 45, 46, 47, 48, 49, 50, 51, 52, 53, 54, 55, 56, 57, 58, 59, 60, 61, or 62.
- an expression signature comprises SOX11 and at least N additional biomarkers selected from the list of biomarkers in Table 2C, wherein N equals 1, 2, 3, 4, 5, 6, 7, 8, 9, 10, 11, 12, 13, 14, 15, 16, 17, 18, 19, 20, 21, 22, 23, 24, 25, 26, 27, 28, 29, 30, 31, 32, 33, 34, 35, 36, 37, 38, 39, 40, 41, 42, 43, 44, 45, 46, 47, 48, 49, 50, 51, 52, 53, 54, 55, 56, 57, 58, 59, 60, 61, or 62.
- an expression signature comprises INS and at least N additional biomarkers selected from the list of biomarkers in Table 2C, wherein N equals 1, 2, 3, 4, 5, 6, 7, 8, 9, 10, 11, 12, 13, 14, 15, 16, 17, 18, 19, 20, 21, 22, 23, 24, 25, 26, 27, 28, 29, 30, 31, 32, 33, 34, 35, 36, 37, 38, 39, 40, 41, 42, 43, 44, 45, 46, 47, 48, 49, 50, 51, 52, 53, 54, 55, 56, 57, 58, 59, 60, 61, or 62.
- an expression signature comprises CXCL17 and at least N additional biomarkers selected from the list of biomarkers in Table 2C, wherein N equals 1, 2, 3, 4, 5, 6, 7, 8, 9, 10, 11, 12, 13, 14, 15, 16, 17, 18, 19, 20, 21, 22, 23, 24, 25, 26, 27, 28, 29, 30, 31, 32, 33, 34, 35, 36, 37, 38, 39, 40, 41, 42, 43, 44, 45, 46, 47, 48, 49, 50, 51, 52, 53, 54, 55, 56, 57, 58, 59, 60, 61, or 62.
- an example expression signature comprises the biomarkers and corresponding biomarker weighted values listed in Table 2C.
- example expression signature consists of the biomarkers and corresponding biomarker weighted values listed in Table 2C.
- the methods of the present invention comprise conducting an assay on a biological sample from an individual to determine the expression levels of one or more biomarkers in a biomarker panel, the biomarker panel comprising all or a portion of the biomarkers listed in Table 2C.
- the methods of the present invention comprise conducting an assay on a biological sample from an individual to determine the expression levels of one or more biomarkers in a biomarker panel, the biomarker panel comprising IGF2, SOX11, INS, and CXCL17 and at least N additional biomarkers selected from the list of biomarkers in Table 2C, wherein N equals 1, 2, 3, 4, 5, 6, 7, 8, 9, 10, 11, 12, 13, 14, 15, 16, 17, 18, 19, 20, 21, 22, 23, 24, 25, 26, 27, 28, 29, 30, 31, 32, 33, 34, 35, 36, 37, 38, 39, 40, 41, 42, 43, 44, 45, 46, 47, 48, 49, 50, 51, 52, 53, 54, 55, 56, 57, 58, or 59.
- the methods of the present invention comprise conducting an assay on a biological sample from an individual to determine the expression levels of one or more biomarkers in a biomarker panel, the biomarker panel comprising IGF2 and at least N additional biomarkers selected from the list of biomarkers in Table 2C, wherein N equals 1, 2, 3, 4, 5, 6, 7, 8, 9, 10, 11, 12, 13, 14, 15, 16, 17, 18, 19, 20, 21, 22, 23, 24, 25, 26, 27, 28, 29, 30, 31, 32, 33, 34, 35, 36, 37, 38, 39, 40, 41, 42, 43, 44, 45, 46, 47, 48, 49, 50, 51, 52, 53, 54, 55, 56, 57, 58, 59, 60, 61, or 62.
- the methods described herein comprise conducting an assay on a biological sample from an individual to determine the expression levels of one or more biomarkers in a biomarker panel, the biomarker panel comprising SOX11 and at least N additional biomarkers selected from the list of biomarkers in Table 2C, wherein N equals 1, 2, 3, 4, 5, 6, 7, 8, 9, 10, 11, 12, 13, 14, 15, 16, 17, 18, 19, 20, 21, 22, 23, 24, 25, 26, 27, 28, 29, 30, 31, 32, 33, 34, 35, 36, 37, 38, 39, 40, 41, 42, 43, 44, 45, 46, 47, 48, 49, 50, 51, 52, 53, 54, 55, 56, 57, 58, 59, 60, 61, or 62.
- the methods described herein comprise conducting an assay on a biological sample from an individual to determine the expression levels of one or more biomarkers in a biomarker panel, the biomarker panel comprising INS and at least N additional biomarkers selected from the list of biomarkers in Table 2C, wherein N equals 1, 2, 3, 4, 5, 6, 7, 8, 9, 10, 11, 12, 13, 14, 15, 16, 17, 18, 19, 20, 21, 22, 23, 24, 25, 26, 27, 28, 29, 30, 31, 32, 33, 34, 35, 36, 37, 38, 39, 40, 41, 42, 43, 44, 45, 46, 47, 48, 49, 50, 51, 52, 53, 54, 55, 56, 57, 58, 59, 60, 61, or 62.
- the methods desribed herein comprise conducting an assay on a biological sample from an individual to determine the expression levels of one or more biomarkers in a biomarker panel, the biomarker panel comprising CXCL17 and at least N additional biomarkers selected from the list of biomarkers in Table 2C, wherein N equals 1, 2, 3, 4, 5, 6, 7, 8, 9, 10, 11, 12, 13, 14, 15, 16, 17, 18, 19, 20, 21, 22, 23, 24, 25, 26, 27, 28, 29, 30, 31, 32, 33, 34, 35, 36, 37, 38, 39, 40, 41, 42, 43, 44, 45, 46, 47, 48, 49, 50, 51, 52, 53, 54, 55, 56, 57, 58, 59, 60, 61, or 62.
- the expression signature comprises all or a portion of the following biomarkers; ALPK2, BGN, COL8A1, FAP, FN1, GJB2, INHBA, ITGA5, LOXL1, LUM, MIR1245, MMP2, NKD2, PLAU, RAB31, SFRP2, THBS2, TIMP3 and VCAN.
- the expression signature comprises ALPK2, BGN, COL8A1, FAP and at least N additional biomarkers selected from FN1, GJB2, INHBA, ITGA5, LOXL1, LUM, MIR1245, MMP2, NKD2, PLAU, RAB31, SFRP2, THBS2, TIMP3 and VCAN, wherein N equals 1, 2, 3, 4, 5, 6, 7, 8, 9, 10, 11, 12, 13, 14 or 15.
- the methods described herein comprise conducting an assay on a biological sample from an individual to determine the expression levels of one or more biomarkers in a biomarker panel, the biomarker panel comprising ALPK2, BGN, COL8A1 and FAP at least N additional biomarkers selected from FN1, GJB2, INHBA, ITGA5, LOXL1, LUM, MIR1245, MMP2, NKD2, PLAU, RAB31, SFRP2, THBS2, TIMP3 and VCAN, wherein N equals 1, 2, 3, 4, 5, 6, 7, 8, 9, 10, 11, 12, 13, 14 or 15.
- the methods described herein comprise conducting an assay on a biological sample from an individual to determine the expression levels of one or more biomarkers in a biomarker panel, the biomarker panel comprising ALPK2 and at least N additional biomarkers selected from the list of biomarkers BGN, COL8A1, FAP, FN1, GJB2, INHBA, ITGA5, LOXL1, LUM, MIR1245, MMP2, NKD2, PLAU, RAB31, SFRP2, THBS2, TIMP3 and VCAN wherein N equals 1, 2, 3, 4, 5, 6, 7, 8, 9, 10, 11, 12, 13, 14 or 15.
- the methods described herein comprise conducting an assay on a biological sample from an individual to determine the expression levels of one or more biomarkers in a biomarker panel, the biomarker panel comprising BGN and at least N additional biomarkers selected from the list of biomarkers ALPK2, COL8A1, FAP, FN1, GJB2, INHBA, ITGA5, LOXL1, LUM, MIR1245, MMP2, NKD2, PLAU, RAB31, SFRP2, THBS2, TIMP3 and VCAN, wherein N equals 1, 2, 3, 4, 5, 6, 7, 8, 9, 10, 11, 12, 13, 14 or 15.
- the methods described herein comprise conducting an assay on a biological sample from an individual to determine the expression levels of one or more biomarkers in a biomarker panel, the biomarker panel comprising COL8A1 and at least N additional biomarkers selected from the list of biomarkers ALPK2, BGN, FAP, FN1, GJB2, INHBA, ITGA5, LOXL1, LUM, MIR1245, MMP2, NKD2, PLAU, RAB31, SFRP2, THBS2, TIMP3 and VCAN, wherein N equals 1, 2, 3, 4, 5, 6, 7, 8, 9, 10, 11, 12, 13, 14 or 15.
- the methods described herein comprise conducting an assay on a biological sample from an individual to determine the expression levels of one or more biomarkers in a biomarker panel, the biomarker panel comprising FAP and at least N additional biomarkers selected from the list of biomarkers ALPK2, BGN, COL8A1, FN1, GJB2, INHBA, ITGA5, LOXL1, LUM, MIR1245, MMP2, NKD2, PLAU, RAB31, SFRP2, THBS2, TIMP3 and VCAN, wherein N equals 1, 2, 3, 4, 5, 6, 7, 8, 9, 10, 11, 12, 13, 14 or 15.
- an expression signature comprises all or a portion of the following biomarkers; GJB2, INHBA, THBS2, SFRP2, PLAU and at least N additional biomarkers from Table 1A-1C, wherein N is 2, 3, 4, 5, 6, 7, 8, 9, 10, 11, 12, 13, 14, 15, 16, 17, 18, 29, 20, 21, 22, 23, 24, 25, 26, 27, 28, 29, 30, 31, 32, 33, 34,35, 36, 37, 38, 39, 40, 41, 42, 43 or 44, 45, 46, 47, 48, 49, 50, 51, 52, 53, 54, 55, 56, 57, 58, 59, 60, 61, 62, 63, 64, 65, 66, 67, 68, 69, or 70.
- an expression signature comprises all GJB2 and at least N additional biomarkers from Table 1A-1C, wherein N is 2, 3, 4, 5, 6, 7, 8, 9, 10, 11, 12, 13, 14, 15, 16, 17, 18, 29, 20, 21, 22, 23, 24, 25, 26, 27, 28, 29, 30, 31, 32, 33, 34,35, 36, 37, 38, 39, 40, 41, 42, 43 or 44, 45, 46, 47, 48, 49, 50, 51, 52, 53, 54, 55, 56, 57, 58, 59, 60, 61, 62, 63, 64, 65, 66, 67, 68, 69, 70, 71, 72, 73, or 74.
- an expression signature comprises all INHBA and at least N additional biomarkers from Table 1A-1C, wherein N is . 2, 3, 4, 5, 6, 7, 8, 9, 10, 11, 12, 13, 14, 15, 16, 17, 18, 29, 20, 21, 22, 23, 24, 25, 26, 27, 28, 29, 30, 31, 32, 33, 34,35, 36, 37, 38, 39, 40, 41, 42, 43 or 44, 45, 46, 47, 48, 49, 50, 51, 52, 53, 54, 55, 56, 57, 58, 59, 60, 61, 62, 63, 64, 65, 66, 67, 68, 69, 70, 71, 72, 73, or 74.
- an expression signature comprises all THBS2 and at least N additional biomarkers from Table 1A-1C, wherein N is 2, 3, 4, 5, 6, 7, 8, 9, 10, 11, 12, 13, 14, 15, 16, 17, 18, 29, 20, 21, 22, 23, 24, 25, 26, 27, 28, 29, 30, 31, 32, 33, 34,35, 36, 37, 38, 39, 40, 41, 42, 43 or 44, 45, 46, 47, 48, 49, 50, 51, 52, 53, 54, 55, 56, 57, 58, 59, 60, 61, 62, 63, 64, 65, 66, 67, 68, 69, 70, 71, 72, 73, or 74.
- an expression signature comprises all SFRP2 wherein N is 2, 3, 4, 5, 6, 7, 8, 9, 10, 11, 12, 13, 14, 15, 16, 17, 18, 29, 20, 21, 22, 23, 24, 25, 26, 27, 28, 29, 30, 31, 32, 33, 34,35, 36, 37, 38, 39, 40, 41, 42, 43 or 44, 45, 46, 47, 48, 49, 50, 51, 52, 53, 54, 55, 56, 57, 58, 59, 60, 61, 62, 63, 64, 65, 66, 67, 68, 69, 70, 71, 72, 73, or 74.
- an expression signature comprises all PLAU and at least N additional biomarkers from Table 1A-1C, wherein N is 2, 3, 4, 5, 6, 7, 8, 9, 10, 11, 12, 13, 14, 15, 16, 17, 18, 29, 20, 21, 22, 23, 24, 25, 26, 27, 28, 29, 30, 31, 32, 33, 34,35, 36, 37, 38, 39, 40, 41, 42, 43 or 44, 45, 46, 47, 48, 49, 50, 51, 52, 53, 54, 55, 56, 57, 58, 59, 60, 61, 62, 63, 64, 65, 66, 67, 68, 69, or 70.
- an expression signature comprises all GJB2, INHBA, THBS2, SFRP2, PLAU and at least about 1%, about 5%, about 10%, about 20%, about 30%, about 40%, about 50%, about 60%, about 70%, about 80%, about 90%, about 95%, or about 99% of the biomarkers listed in Table 1A and Table 1B or a combination thereof.
- the relative expression levels of biomarkers in a cancer tissue are measured to form a test sample expression profile.
- the test sample expression profile is summarized in the form of a compound decision score ("expression score") and compared to a threshold score that is mathematically derived from a training set of patient data.
- the score threshold separates a patient group based on different characteristics such as, but not limited to, responsiveness/non-responsiveness to treatment.
- the patient training set data is preferably derived from cancer tissue samples having been characterized by prognosis, likelihood of recurrence, long term survival, clinical outcome, treatment response, diagnosis, cancer classification, or personalized genomics profile.
- Expression profiles, and corresponding decision scores from patient samples may be correlated with the characteristics of patient samples in the training set that are on the same side of the mathematically derived score decision threshold.
- the threshold of the linear classifier scalar output is optimized to maximize the sum of sensitivity and specificity under cross-validation as observed within the training dataset.
- the overall expression data for a given sample is normalized using methods known to those skilled in the art in order to correct for differing amounts of starting material, varying efficiencies of the extraction and amplification reactions, etc.
- the biomarker expression profile of a patient tissue sample is evaluated by a linear classifier.
- a linear classifier refers to a weighted sum of the individual biomarker intensities into a compound decision score ("decision function"). The decision score is then compared to a pre-defined cut-off score threshold, corresponding to a certain set-point in terms of sensitivity and specificity which indicates if a sample is above the score threshold (decision function positive) or below (decision function negative).
- Using a linear classifier on the normalized data to make a diagnostic or prognostic call effectively means to split the data space, i.e. all possible combinations of expression values for all genes in the classifier, into two disjoint halves by means of a separating hyperplane.
- This split is empirically derived on a large set of training examples, for example from patients showing responsiveness or resistance to a therapeutic agent. Without loss of generality, one can assume a certain fixed set of values for all but one biomarker, which would automatically define a threshold value for this remaining biomarker where the decision would change from, for example, responsiveness or resistance to a therapeutic agent.
- this dynamic threshold would then either indicate resistance (for a biomarker with a negative weight) or responsiveness (for a biomarker with a positive weight) to a therapeutic agent.
- the precise value of this threshold depends on the actual measured expression profile of all other biomarkers within the classifier, but the general indication of certain biomarkers remains fixed, i.e. high values or "relative over-expression" always contributes to either a responsiveness (genes with a positive weight) or resistance (genes with a negative weights). Therefore, in the context of the overall gene expression classifier, relative expression can indicate if either up- or down-regulation of a certain biomarker is indicative of responsiveness or resistance to a therapeutic agent.
- RNA expression profiling include, but are not limited to, microarray, RT-PCT, qPCR, NGS, northern blots, SAGE, mass spectrometry.
- mRNA expression levels are measured by reverse transcription quantitative polymerase chain reaction (RT-PCR followed with qPCR).
- RT-PCR is used to create a cDNA from the mRNA.
- the cDNA may be used in a qPCR assay to produce fluorescence as the DNA amplification process progresses. By comparison to a standard curve, qPCR can produce an absolute measurement such as number of copies of mRNA per cell.
- Northern blots, microarrays, Invader assays, and RT-PCR combined with capillary electrophoresis have all been used to measure expression levels of mRNA in a sample. See Gene Expression Profiling: Methods and Protocols, Richard A. Shimkets, editor, Humana Press, 2004.
- miRNA molecules are small RNAs that are non-coding but may regulate gene expression. Any of the methods suited to the measurement of mRNA expression levels can also be used for the corresponding miRNA. Recently many laboratories have investigated the use of miRNAs as biomarkers for disease. Many diseases involve widespread transcriptional regulation, and it is not surprising that miRNAs might find a role as biomarkers. The connection between miRNA concentrations and disease is often even less clear than the connections between protein levels and disease, yet the value of miRNA biomarkers might be substantial.
- RNA biomarkers have similar requirements, although many potential protein biomarkers are secreted intentionally at the site of pathology and function, during disease, in a paracrine fashion. Many potential protein biomarkers are designed to function outside the cells within which those proteins are synthesized.
- Gene expression may also be evaluated using mass spectrometry methods.
- a variety of configurations of mass spectrometers can be used to detect biomarker values.
- Several types of mass spectrometers are available or can be produced with various configurations.
- a mass spectrometer has the following major components: a sample inlet, an ion source, a mass analyzer, a detector, a vacuum system, and instrument-control system, and a data system. Difference in the sample inlet, ion source, and mass analyzer generally define the type of instrument and its capabilities.
- an inlet can be a capillary-column liquid chromatography source or can be a direct probe or stage such as used in matrix-assisted laser desorption.
- Common ion sources are, for example, electrospray, including nanospray and microspray or matrix-assisted laser desorption.
- Common mass analyzers include a quadrupole mass filter, ion trap mass analyzer and time-of-flight mass analyzer. Additional mass spectrometry methods are well known in the art (see Burlingame et al., Anal. Chem. 70:647 R-716R (1998 ); Kinter and Sherman, New York (2000)).
- Protein biomarkers and biomarker values can be detected and measured by any of the following: electrospray ionization mass spectrometry (ESI-MS), ESI-MS/MS, ESI-MS/(MS)n, matrix-assisted laser desorption ionization time-of-flight mass spectrometry (MALDI-TOF-MS), surface-enhanced laser desorption/ionization time-of-flight mass spectrometry (SELDI-TOF-MS), desorption/ionization on silicon (DIOS), secondary ion mass spectrometry (SIMS), quadrupole time-of-flight (Q-TOF), tandem time-of-flight (TOF/TOF) technology, called ultraflex III TOF/TOF, atmospheric pressure chemical ionization mass spectrometry (APCI-MS), APCI-MS/MS, APCI-(MS).sup.N, atmospheric pressure photoionization mass spectrometry (APPI-MS), APPI-MS
- Labeling methods include but are not limited to isobaric tag for relative and absolute quantitation (iTRAQ) and stable isotope labeling with amino acids in cell culture (SILAC).
- Capture reagents used to selectively enrich samples for candidate biomarker proteins prior to mass spectroscopic analysis include but are not limited to aptamers, antibodies, nucleic acid probes, chimeras, small molecules, an F(ab') 2 fragment, a single chain antibody fragment, an Fv fragment, a single chain Fv fragment, a nucleic acid, a lectin, a ligand-binding receptor, affybodies, nanobodies, ankyrins, domain antibodies, alternative antibody scaffolds (e.g.
- the foregoing assays enable the detection of biomarker values that are useful in methods for predicting responsiveness of a cancer therapeutic agent, where the methods comprise detecting, in a biological sample from an individual, at least N biomarker values that each correspond to a biomarker selected from the group consisting of the biomarkers provided in Tables 1A, 1B, 2A, 2B or Groups I and II, wherein a classification, as described in detail below, using the biomarker values indicates whether the individual will be responsive to a therapeutic agent. While certain of the described predictive biomarkers are useful alone for predicting responsiveness to a therapeutic agent, methods are also described herein for the grouping of multiple subsets of the biomarkers that are each useful as a panel of two or more biomarkers.
- N is at least three biomarkers. It will be appreciated that N can be selected to be any number from any of the above-described ranges, as well as similar, but higher order, ranges.
- biomarker values can be detected and classified individually or they can be detected and classified collectively, as for example in a multiplex assay format.
- the present invention makes use of "oligonucleotide arrays” (also called herein “microarrays”).
- Microarrays can be employed for analyzing the expression of biomarkers in a cell, and especially for measuring the expression of biomarkers of cancer tissues.
- biomarker arrays are produced by hybridizing detectably labeled polynucleotides representing the mRNA transcripts present in a cell (e.g., fluorescently-labeled cDNA synthesized from total cell mRNA or labeled cRNA) to a microarray.
- a microarray is a surface with an ordered array of binding (e.g., hybridization) sites for products of many of the genes in the genome of a cell or organism, preferably most or almost all of the genes.
- Microarrays can be made in a number of ways known in the art. However produced, microarrays share certain characteristics. The arrays are reproducible, allowing multiple copies of a given array to be produced and easily compared with each other.
- the microarrays are small, usually smaller than 5 cm 2 , and they are made from materials that are stable under binding (e.g., nucleic acid hybridization) conditions.
- a given binding site or unique set of binding sites in the microarray will specifically bind the product of a single gene in the cell.
- positionally addressable arrays containing affixed nucleic acids of known sequence at each location are used.
- cDNA or cRNA complementary to the total cellular mRNA when detectably labeled (e.g., with a fluorophore) cDNA or cRNA complementary to the total cellular mRNA is hybridized to a microarray, the site on the array corresponding to a gene (i.e., capable of specifically binding the product of the gene) that is not transcribed in the cell will have little or no signal (e.g., fluorescent signal), and a gene for which the encoded mRNA is prevalent will have a relatively strong signal.
- a gene i.e., capable of specifically binding the product of the gene
- Nucleic acid hybridization and wash conditions are chosen so that the probe "specifically binds" or “specifically hybridizes' to a specific array site, i.e., the probe hybridizes, duplexes or binds to a sequence array site with a complementary nucleic acid sequence but does not hybridize to a site with a non-complementary nucleic acid sequence.
- one polynucleotide sequence is considered complementary to another when, if the shorter of the polynucleotides is less than or equal to 25 bases, there are no mismatches using standard base-pairing rules or, if the shorter of the polynucleotides is longer than 25 bases, there is no more than a 5% mismatch.
- the polynucleotides are perfectly complementary (no mismatches). It can be demonstrated that specific hybridization conditions result in specific hybridization by carrying out a hybridization assay including negative controls using routine experimentation.
- Optimal hybridization conditions will depend on the length (e.g., oligomer vs. polynucleotide greater than 200 bases) and type (e.g., RNA, DNA, PNA) of labeled probe and immobilized polynucleotide or oligonucleotide.
- length e.g., oligomer vs. polynucleotide greater than 200 bases
- type e.g., RNA, DNA, PNA
- hybridization conditions are hybridization in 5xSSC plus 0.2% SDS at 65C for 4 hours followed by washes at 25°C in low stringency wash buffer (1xSSC plus 0.2% SDS) followed by 10 minutes at 25°C in high stringency wash buffer (0.1SSC plus 0.2% SDS) (see Shena et al., Proc. Natl. Acad. Sci. USA, Vol. 93, p. 10614 (1996 )).
- Useful hybridization conditions are also provided in, e.g., Tijessen, Hybridization With Nucleic Acid Probes", Elsevier Science Publishers B.V. (1993 ) and Kricka, "Nonisotopic DNA Probe Techniques", Academic Press, San Diego, Calif. (1992 ).
- Immunoassay methods are based on the reaction of an antibody to its corresponding target or analyte and can detect the analyte in a sample depending on the specific assay format.
- monoclonal antibodies are often used because of their specific epitope recognition.
- Polyclonal antibodies have also been successfully used in various immunoassays because of their increased affinity for the target as compared to monoclonal antibodies
- Immunoassays have been designed for use with a wide range of biological sample matrices
- Immunoassay formats have been designed to provide qualitative, semi-quantitative, and quantitative results.
- Quantitative results may be generated through the use of a standard curve created with known concentrations of the specific analyte to be detected.
- the response or signal from an unknown sample is plotted onto the standard curve, and a quantity or value corresponding to the target in the unknown sample is established.
- ELISA or EIA can be quantitative for the detection of an analyte/biomarker. This method relies on attachment of a label to either the analyte or the antibody and the label component includes, either directly or indirectly, an enzyme. ELISA tests may be formatted for direct, indirect, competitive, or sandwich detection of the analyte. Other methods rely on labels such as, for example, radioisotopes (I 125 ) or fluorescence.
- Additional techniques include, for example, agglutination, nephelometry, turbidimetry, Western blot, immunoprecipitation, immunocytochemistry, immunohistochemistry, flow cytometry, Luminex assay, and others (see ImmunoAssay: A Practical Guide, edited by Brian Law, published by Taylor & Francis, Ltd., 2005 editi on).
- Exemplary assay formats include enzyme-linked immunosorbent assay (ELISA), radioimmunoassay, fluorescent, chemiluminescence, and fluorescence resonance energy transfer (FRET) or time resolved-FRET (TR-FRET) immunoassays.
- ELISA enzyme-linked immunosorbent assay
- FRET fluorescence resonance energy transfer
- TR-FRET time resolved-FRET
- biomarkers include biomarker immunoprecipitation followed by quantitative methods that allow size and peptide level discrimination, such as gel electrophoresis, capillary electrophoresis, planar electrochromatography, and the like.
- Methods of detecting and/or quantifying a detectable label or signal generating material depend on the nature of the label.
- the products of reactions catalyzed by appropriate enzymes can be, without limitation, fluorescent, luminescent, or radioactive or they may absorb visible or ultraviolet light.
- detectors suitable for detecting such detectable labels include, without limitation, x-ray film, radioactivity counters, scintillation counters, spectrophotometers, colorimeters, fluorometers, luminometers, and densitometers.
- Any of the methods for detection can be performed in any format that allows for any suitable preparation, processing, and analysis of the reactions. This can be, for example, in multi-well assay plates (e.g., 96 wells or 384 wells) or using any suitable array or microarray. Stock solutions for various agents can be made manually or robotically, and all subsequent pipetting, diluting, mixing, distribution, washing, incubating, sample readout, data collection and analysis can be done robotically using commercially available analysis software, robotics, and detection instrumentation capable of detecting a detectable label.
- kits can contain reagents, tools, and instructions for determining an appropriate therapy for a cancer patient.
- a kit can include reagents for collecting a tissue sample from a patient, such as by biopsy, and reagents for processing the tissue.
- the kit can also include one or more reagents for performing a gene or gene product expression analysis, such as reagents for performing nucleic acid amplification (e.g RT-PCR, qPCR), sequencing (e.g. next generation sequencing), northern blot, proteomic analysis, or immunohistochemistry to determine expression levels of gene or gene product markers in a sample of a patient.
- nucleic acid amplification e.g RT-PCR, qPCR
- sequencing e.g. next generation sequencing
- northern blot e.g. next generation sequencing
- proteomic analysis e.g. next generation sequencing
- kits for performing RT-PCR, probes for performing northern blot analyses, and/or antibodies for performing proteomic analysis such as Western blot, immunohistochemistry and ELISA analyses can be included in such kits.
- Appropriate buffers for the assays can also be included.
- Detection reagents required for any of these assays can also be included.
- the appropriate reagents and methods are described in further detail below.
- the kits may include suitable primers and/or probes to detect the expression levels of at least one (up to all) of the biomarkers of in Table 2A and/or 2B and/or 2C. Where expression is determined at the protein level the kit may contain binding reagents specific for the proteins of interest.
- the binding reagents may comprise antibodies to include all fragments and derivatives thereof.
- antibody includes all immunoglobulins or immunoglobulin-like molecules with specific binding affinity for the relevant protein (including by way of example and without limitation, IgA, IgD, IgE, IgG and IgM, combinations thereof, and similar molecules produced during an immune response in any vertebrate, for example, in mammals such as humans, goats, rabbits and mice).
- Specific immunoglobulins useful in the various embodiments of the invention include IgG isotypes.
- the antibodies useful in the various embodiments of the invention may be monoclonal or polyclonal in origin, but are typically monoclonal antibodies.
- Antibodies may be human antibodies, non-human antibodies, or humanized versions of non-human antibodies, or chimeric antibodies. Various techniques for antibody humanization are well established and any suitable technique may be employed.
- the term "antibody” also refers to a polypeptide ligand comprising at least a light chain or heavy chain immunoglobulin variable region which specifically recognizes and binds an epitope of an antigen, and it extends to all antibody derivatives and fragments that retain the ability to specifically bind to the relevant protein. These derivatives and fragments may include Fab fragments, F(ab')2 fragments, Fv fragments, single chain antibodies, single domain antibodies, Fc fragments etc.
- antibody encompasses antibodies comprised of both heavy and light chains, but also heavy chain (only) antibodies (which may be derived from various species of cartilaginous fish or camelids).
- the antibodies may be engineered so as to be specific for more than protein, for example bi-specific to permit binding to two different target proteins as identified herein (see Tables 2A, 2B and 2C).
- kits may also contain the specific anti-angiogenic therapeutic agent to be administered in the event that the test predicts responsiveness.
- This agent may be provided in a form, such as a dosage form, that is tailored to the specific treatment.
- the kit may be provided with suitable instructions for administration according to an appropriate treatment regimen.
- kits featured herein can also include an instruction sheet describing how to perform the assays for measuring gene or gene product expression.
- the instruction sheet can also include instructions for how to determine a reference cohort, including how to determine expression levels of gene or gene product markers in the reference cohort and how to assemble the expression data to establish a reference for comparison to a test patient.
- the instruction sheet can also include instructions for assaying gene or gene product expression in a test patient and for comparing the expression level with the expression in the reference cohort to subsequently determine the appropriate chemotherapy for the test patient. Methods for determining the appropriate chemotherapy are described above and can be described in detail in the instruction sheet.
- kits can be descriptive, instructional, marketing or other material that relates to the methods described herein and/or the use of the reagents for the methods described herein.
- the informational material of the kit can contain contact information, e.g., a physical address, email address, website, or telephone number, where a user of the kit can obtain substantive information about performing a gene expression analysis and interpreting the results, particularly as they apply to a human's likelihood of having a positive response to a specific therapeutic agent.
- kits featured herein can also contain software necessary to infer a patient's likelihood of having a positive response to a specific therapeutic agent from the gene product marker expression.
- VEGF pathway-targeted therapeutic agent including multi-targeted pathway inhibitors (VEGF/PDGF/FGF/EGFT/FLT-3/c-KIT), Angiopoietin-TIE2 pathway inhibitors, endogenous angiogenic inhibitors, immunomodulatory Agents.
- VEGF specific inhibitors include, but are not limited to, Bevacizumab (Avastin), Afibercept (VEGF Trap), IMC-1121B (Ramucirumab).
- Multi-targeted pathway inhibitors include, but are not limited to, Imatinib (Gleevec), Sorafenib (Nexavar), Gefitinib (Iressa), Sunitinib (Sutent), Erlotinib, Tivozinib, Cediranib (Recentin), Pazopanib (Votrient), BIBF 1120 (Vargatef), Dovitinib, Semaxanib (Sugen), Axitinib (AG013736), Vandetanib (Zactima), Nilotinib (Tasigna), Dasatinib (Sprycel), Vatalanib, Motesanib, ABT-869, TKI-258.
- Angiopoietin-TIE2 pathway inhibitors include, but are not limited to, AMG-386, PF-4856884 CVX-060, CEP-11981, CE-245677, MEDI-3617, CVX-241, Trastuzumab (Herceptin).
- Endogenous angiogenic inhibitors include, but are not limited to, Thombospondin, Endostatin, Tumstatin, Canstatin, Arrestin, Angiostatin, Vasostatin, Interferon alpha.
- Immunomodulatory Agents include, but are not limited to, Thalidomide and Lenalidomide.
- Example 1 Tissue processing, hierarchical clustering, subtype identification and classifier development
- Exemplary expression signatures were identified from gene expression analysis of a cohort of macrodissected epithelial serous ovarian tumor FFPE tissue samples sourced from the NHS Lothian and University of Edinburgh.
- Bioinformatic analysis was similarly performed on the 277 samples classified as stage III and IV high grade serous ovarian cancer using the updated pathology classification method. This analysis identified the updated serous subgroups detailed in Figure 6 and consequently used to define a 45 gene "angiogenesis” signature (Table 2B) and a 63 gene "non-angiogenesis” signature (Table 2C)
- cDNA complementary deoxyribonucleic acid
- the Almac's Ovarian Cancer DSATM research tool has been optimised for analysis of FFPE tissue samples, enabling the use of valuable archived tissue banks.
- the Almac Ovarian Cancer DSATM research tool is an innovative microarray platform that represents the transcriptome in both normal and cancerous ovarian tissues. Consequently, the Ovarian Cancer DSATM provides a comprehensive representation of the transcriptome within the ovarian disease and tissue setting, not available using generic microarray platforms. Arrays were scanned using the Affymentrix Genechip® Scanner 7G (Affymetrix Inc., Santa Clara, CA).
- Quality Control (QC) of profiled samples was carried out using MAS5 pre-processing algorithm. Different technical aspects were addressed: average noise and background homogeneity, percentage of present call (array quality), signal quality, RNA quality and hybridization quality. Distributions and Median Absolute Deviation of corresponding parameters were analyzed and used to identify possible outliers.
- Almac's Ovarian Cancer DSATM contains probes that primarily target the area within 300 nucleotides from the 3' end. Therefore standard Affymetrix RNA quality measures were adapted - for housekeeping genes intensities of 3' end probe sets with ratios of 3' end probe set intensity to the average background intensity were used in addition to usual 3'/5' ratios. Hybridization controls were checked to ensure that their intensities and present calls conform to the requirements specified by Affymetrix.
- Pre-processing of the raw data generated from expression profiling of the epithelial serous ovarian cancer training set was performed in Expression Console v1.1 with Robust Multi-array Analysis (RMA).
- RMA Robust Multi-array Analysis
- Hierarchical clustering techniques were applied to microarray data from the epithelial serous ovarian tumors analysed using the Ovarian Cancer DSATM (disease specific array) platform.
- Raw expression data was preprocessed using the standard Robust Multichip Algorithm (RMA) procedure.
- RMA Robust Multichip Algorithm
- Two dimensional cluster analysis (tumor, probe set) was performed to establish tumor relationships based on the intrinsic list.
- Hierarchical agglomerative clustering was applied (Pearson correlation - Original analysis - or Euclidean distance - updated analysis - and Ward's linkage).
- Optimal partition number was selected using the GAP index ( Tibshirani et al., 2002, J. R. Stat. Soc., 63:411-423 ). All probe sets available in the cluster subgroups were mapped to genes names.
- probe sets were mapped to genes (Entrez gene ID) and an enrichment analysis was performed. Enrichment significance was calculated based on the hypergeometric function (False Discovery Rate applied ( Benjamini and Hochberg, 1995, J. R. Stat. Soc. 57:289:300 )). Over-representation of biological processes and pathways were analysed for each gene group generated by the hierarchical clustering for the epithelial serous ovarian cancer samples using Almac Diagnostics' proprietary Functional Enrichment Tool (FET). Antisense probe sets were excluded from the analysis. Hypergeometric p-values were assessed for each enriched functional entity class. Functional entity classes with the highest p-values were selected as representative of the group and a general functional category representing these functional entities was assigned to the gene clusters based on significance of representation (i.e. p-value).
- genes in clusters enriched for angiogenesis, vasculature development and immune response general functional terms were grouped into a putative angiogenesis gene group and used for the signature generation.
- the sample clusters presenting high expression for the genes involved in angiogenesis, vasculature development and immune response general functional terms were selected for classification and labeled as 'angiogenesis'. Those not showing high expression for the genes involved in these functional terms were labeled as 'non-angiogenesis'.
- genes in clusters enriched for angiogenesis and vasculature development general functional terms were grouped into a putative angiogenesis gene group and used for the signature generation.
- the sample clusters presenting high expression for the genes involved in angiogenesis and vasculature development general functional terms were selected for classification and labeled as 'angiogenesis'.
- Those not showing high expression for the genes involved in these functional terms were labeled as 'others 'others' ( Figure 6 top label identifying "angiogensis" samples (red) plus “others” (grey)).
- non-angiogenesis classifier To generate a "non-angiogenesis classifier" using the reclassified 265 epithelial serous ovarian tumors the sample clusters presenting low expression for the genes involved in angiogenesis and vasculature development general functional terms were selected for classification and labeled as "non-angiogenesis.” Those not showing low expression fore the genes involved in these functional terms were labeled as 'others' ( Figure6 bottom label identifying "non-angiogenesis” samples plus “others”).
- the angiogenesis classifier was generated at the gene level.
- the following steps outline the procedures that were taken for gene level signature development (each step performed over internal cross validation using 10 repeats of 5-fold cross-validation):
- the criteria used for model selection were AUC and/or hazard ratio (HR) over internal cross-validation and feature elimination.
- HR hazard ratio
- Univariate and multivariate analysis may be carried out in relation to the glioblastoma dataset to assess respectively the association between the angiogenesis subtype classifier and survival, and to determine if the association, if any, was independent to known clinical predictors.
- the p-values for univariate analysis were calculated using logistic regression in MATLAB.
- a likelihood ratio test from logistic regression was used, where the p-values represent the drop in the log-likelihood when comparing the model with the clinical covariates and the predictions to a reduced model with clinical covariates only.
- the likelihood ratio test measures the importance of the gene predictor in modeling survival, and highlights its independence as a predictor relative to the clinical predictors.
- a p-value ⁇ 0.05 was used as the criterion for significance. Furthermore, samples with unknown clinical factors were excluded in this assessment.
- Feature selection resulted in the selection of 1200 probe sets from the original epithelial serous ovarian cancer data set (199 samples) and 1400 PS from the reclassified epithelial serous ovarian cancer data set (265 samples).
- the GAP analysis revealed three sample clusters and three probe set cluster groups within both sample sets ( Figure 1 , Figure 6 ).
- the classification pipeline was used to derive a model using the set of epithelial serous ovarian cancer samples.
- the classification pipeline has been developed in accordance with commonly accepted good practice ( MAQC Consortium, Nat Biotechnol 2010 ). The process will, in parallel: 1) derive gene classification models from empirical data; and 2) assess the classification performance of the models, both under cross-validation. The performance and success of the classifier generation depends on a number of parameters that can be varied, for instance the choice of classification method or probe set filtering.
- AUC Area Under the Receiver Operator Characteristic Curve
- the PLS FFS model was deemed to be the most suitable classifier model. Weights were calculated for each gene using PLS regression, resulting in the final gene classifier models (25-gene classifier model for the original approach, and a 45-gene classifier for samples reclassified reflecting recent changes to standard histology protocols) that may be used for validation on external data sets from different array platforms.
- the gene signature development process was focused upon identification of the ontological processes and pathways relevant to angiogenesis to ensure biological relevance of any signature developed. As such, functional analysis was performed upon both signatures to qualify their relevance to angiogenesis and related processes. The significance processes in FIGURE 3 and FIGURE 8 are related to angiogenesis and vasculature development.
- Example 2 In silico validation of the angiogenesis subtype and angiogenesis classifier models
- AUC Area Under the ROC (Receiver Operator Characteristic) Curve
- the hypothesis is that the AUCs following application within these datasets should be above 0.5 with the lowest confidence interval also above 0.5.
- the 25-gene and 45-gene classifier models were applied to a dataset of 16 prostate cell-lines following treatment with Dasatanib.
- the cell-lines were defined as being either a 'responder' or 'non-responder' based upon cell-proliferation assays.
- the analysis revealed that the 45-gene classifier model is associated with respone to the same compound, with an AUC of 0.9455 (CI 0.7949 - 1.0000) indicating that the 45-gene classifier is also predictive of response to Dasatanib.
- Example 3 Identification of and in silico validation of a "non-angiogenic subgroup of ovarian cancer
- angiogenesis genes in probe set cluster 2 is down regulated in all samples in sample Cluster 1 of hierarchial clustering of 265 samples newly classified as serous ( Figure 6 bottom labelled Blue bar)). These samples in sample cluster 2 have a better prognosis than the rest of the serous samples in samples from cluster 1 and 3 combined together as demonstrated in Figure 10 .
- This phenotype has also been identified in ER+ and ER- breast cancer as can be see the middle sample group in Figure 11A and the second sample group in Figure 11B .
- the classification pipeline was used to derive a model using the set of epithelial serous ovarian cancer samples.
- the methods are analogous to those described above in Example 1.
- the PLS FFS model was deemed to be the most suitable classifier model. Weights were calculated for each gene using PLS regression, resulting in the final gene classifier model (63-gene classifier model) that may be used for validation on external data sets from different array platforms.
- the performance of the 63-gene non-angiogenesis classifier model was validated using hazard ratio (HR) within the original Almac epithelial serous ovarian cancer dataset and one independent dataset.
- the hazard ratio is the ratio of the hazard rates corresponding to the conditions described by two sets of explanatory variables. For example, a treated population may die at twice the rate per unit time as the control population. The hazard ratio would be 2, indicating higher hazard of death from the treatment.
- the non-angiogenesis subtype classifier model is capable of predicting non-response to, and selecting patients that should not be treated with anti-angiogenic cancer therapeutic drug classes, either as single agent or in combination with standard of care therapies, it is expected that the HRs should be below 1.0 with a p-value less than 0.05.
- the International Collaboration on Ovarian Neoplasms 7 (ICON7) trial is a Gynecologic Cancer Intergroup phase 3 trial that assessed the effects of adding bevacizumab, concurrently and as a continuation, to standard chemotherapy with carboplatin and paclitaxel in patients with primary peritoneal carcinoma, fallopian tube carcinoma, and epithelial ovarian carcinoma ( Perren TJ, Swart AM, Pfisterer J, Ledermann JA, Pujade-Lauraine E, Kristensen G, et al. A phase 3 trial of bevacizumab in ovarian cancer. N Engl J Med.
- RNA was extracted from macrodissected FFPE tissue using the High Pure RNA Paraffin Kit (Roche Diagnostics GmbH, Mannheim, Germany). RNA is converted into complementary deoxyribonucleic acid (cDNA), which is subsequently amplified and converted into single-stranded form using the SPIA® technology of the WT-OvationTM FFPE RNA Amplification System V2 (NuGEN Technologies Inc., San Carlos, CA, USA). The amplified single-stranded cDNA is then fragemented and biotin labeled using the FL-OvationTM cDNA Biotin Module V2 (NuGEN Technologies Inc.). The fragmented and labeled cDNA was then hybridized to the Almac Ovarian Cancer DSA, on this the signature was developed. Arrays are scanned using the Affymentrix Genechip® Scanner 7G (Affymetrix Inc., Santa Clara, CA).
- Control UHR and a pooled clinical reference sample are processed in each post RNA extraction batch. QC is be performed at several steps of the process, from RNA Extraction QC to array QC.
- Quality Control (QC) of profiled samples is carried out using the RMA pre-processing algorithm. Different technical aspects are assessed: average noise and background homogeneity, percentage of present call (array quality), signal quality, RNA quality and hybridization quality. Distributions and Median Absolute Deviation of corresponding parameters are analyzed and used to identify possible outliers.
- Almac's Ovarian Cancer DSATM contains probes that primarily target the area within 300 nucleotides from the 3' end. Therefore standard Affymetrix RNA quality measures were adapted - for housekeeping genes intensities of 3' end probe sets with ratios of 3' end probe set intensity to the average background intensity were used in addition to usual 3'/5' ratios. Hybridization controls were checked to ensure that their intensities and present calls conform to the requirements specified by Affymetrix.
- Sample IDs and corresponding signature scores will be sent to the honest broker to evaluate the predictive performance of the Ovarian Immune signature to predict resistance to Avastin in the treatment arm of the study.
- Angiogenesis is central to the process of cancer growth and metastasis and has a role in the progression and prognosis of ovarian cancer.
- VEGF is an important promoter of angiogenesis produced by normal and neoplastic cells.
- Bevacizumab (Avastin, Riche) is a recombinant humanised version of a murine anti-human VEGF monoclonal antibody and has been studied in the management of many tumours.
- the International Collaboration on Ovarian Neoplasms 7 (ICON7) trial is a Gynecologic Cancer Intergroup phase 3 trial that assessed the effects of adding bevacizumab, concurrently and as a continuation, to standard chemotherapy with carboplatin and paclitaxel in patients with primary peritoneal carcinoma, fallopian tube carcinoma, and epithelial ovarian carcinoma ( Perren TJ, Swart AM, Pfisterer J, Ledermann JA, Pujade-Lauraine E, Kristensen G, et al. A phase 3 trial of bevacizumab in ovarian cancer. N Engl J Med.
- HGS patients with the angiogenic subgroup may benefit from anti-angiogenic targeted therapies.
- Access to the ICON7 trial samples was obtained via the MRC, and are being profiled on Ovarian DSAs in order to validate this hypothesis.
- RNA was extracted from macrodissected FFPE tissue using the High Pure RNA Paraffin Kit (Roche Diagnostics GmbH, Mannheim, Germany). RNA is converted into complementary deoxyribonucleic acid (cDNA), which is subsequently amplified and converted into single-stranded form using the SPIA® technology of the WT-OvationTM FFPE RNA Amplification System V2 (NuGEN Technologies Inc., San Carlos, CA, USA). The amplified single-stranded cDNA is then fragemented and biotin labeled using the FL-OvationTM cDNA Biotin Module V2 (NuGEN Technologies Inc.). The fragmented and labeled cDNA was then hybridized to the Almac Ovarian Cancer DSA, on this the signature was developed. Arrays are scanned using the Affymentrix Genechip® Scanner 7G (Affymetrix Inc., Santa Clara, CA).
- Control UHR and a pooled clinical reference sample are processed in each post RNA extraction batch. QC is be performed at several steps of the process, from RNA Extraction QC to array QC.
- Quality Control (QC) of profiled samples is carried out using the RMA pre-processing algorithm. Different technical aspects are assessed: average noise and background homogeneity, percentage of present call (array quality), signal quality, RNA quality and hybridization quality. Distributions and Median Absolute Deviation of corresponding parameters are analyzed and used to identify possible outliers.
- Almac's Ovarian Cancer DSATM contains probes that primarily target the area within 300 nucleotides from the 3' end. Therefore standard Affymetrix RNA quality measures were adapted - for housekeeping genes intensities of 3' end probe sets with ratios of 3' end probe set intensity to the average background intensity were used in addition to usual 3'/5' ratios. Hybridization controls were checked to ensure that their intensities and present calls conform to the requirements specified by Affymetrix.
- RefRMA model to pre-process the data, one sample at a time
- SignatureScore ⁇ i w i ⁇ ge i ⁇ b i + k
- w i is a weight for each gene
- b i is a gene-specific bias (Supplementary Table S5)
- ge i is the observed gene expression level after pre-processing
- k 0.2953 is a constant offset.
- Sample IDs and corresponding signature scores will be sent to the honest broker to evaluate the predictive performance of the pro-angiogenic signature to predict benefit from Avastin in the treatment arm of the study.
- Example 4 Predictive utility of non-angiogenesis signature in colorectal cancer.
- Example 5 Predictive utility of the 25 and 45 angiogenesis gene signatures in colorectal cancer
Landscapes
- Health & Medical Sciences (AREA)
- Life Sciences & Earth Sciences (AREA)
- Engineering & Computer Science (AREA)
- Physics & Mathematics (AREA)
- Medical Informatics (AREA)
- General Health & Medical Sciences (AREA)
- Biophysics (AREA)
- Bioinformatics & Cheminformatics (AREA)
- Biotechnology (AREA)
- Chemical & Material Sciences (AREA)
- Genetics & Genomics (AREA)
- Data Mining & Analysis (AREA)
- Bioinformatics & Computational Biology (AREA)
- Spectroscopy & Molecular Physics (AREA)
- Theoretical Computer Science (AREA)
- Evolutionary Biology (AREA)
- Proteomics, Peptides & Aminoacids (AREA)
- Organic Chemistry (AREA)
- Molecular Biology (AREA)
- Public Health (AREA)
- Bioethics (AREA)
- Evolutionary Computation (AREA)
- Computer Vision & Pattern Recognition (AREA)
- Software Systems (AREA)
- Epidemiology (AREA)
- Artificial Intelligence (AREA)
- Databases & Information Systems (AREA)
- Pathology (AREA)
- Analytical Chemistry (AREA)
- Immunology (AREA)
- Wood Science & Technology (AREA)
- Zoology (AREA)
- Oncology (AREA)
- Microbiology (AREA)
- Hospice & Palliative Care (AREA)
- Biochemistry (AREA)
- General Engineering & Computer Science (AREA)
- Measuring Or Testing Involving Enzymes Or Micro-Organisms (AREA)
- Investigating Or Analysing Biological Materials (AREA)
Description
- The present invention relates to a molecular diagnostic test useful for diagnosing cancers from different anatomical sites that includes the use of a common subtype related to angiogenesis. The invention includes the derivation of a gene classification model from gene expression levels. One application is the stratification of response to and selection of patients for cancer therapeutic drug classes and thus guide patient treatment selection. Another application is the stratification of cancer patients into those that respond and those that do not respond to anti-angiogenic therapeutics. The present invention provides a test that can guide therapy selection as well as selecting patient groups for enrichment strategies during clinical trial evaluation of novel therapeutics. The invention can be used as a prognostic indicator for certain cancers including ovarian cancer, breast cancer, colon, prostate, lung and glioblastoma. The angiogenesis subtype can be identified from fresh/frozen (FF) or formalin fixed paraffin embedded FFPE patient samples.
- The pharmaceutical industry continuously pursues new drug treatment options that are more effective, more specific or have fewer adverse side effects than currently administered drugs. Drug therapy alternatives are constantly being developed because genetic variability within the human population results in substantial differences in the effectiveness of many established drugs. Therefore, although a wide variety of drug therapy options are currently available, more therapies are always needed in the event that a patient fails to respond.
- Traditionally, the treatment paradigm used by physicians has been to prescribe a first-line drug therapy that results in the highest success rate possible for treating a disease. Alternative drug therapies are then prescribed if the first is ineffective. This paradigm is clearly not the best treatment method for certain diseases. For example, in diseases such as cancer, the first treatment is often the most important and offers the best opportunity for successful therapy, so there exists a heightened need to choose an initial drug that will be the most effective against that particular patient's disease.
- Ovarian cancer is the leading cause of death among all gynecological cancers in western countries. This high death rate is due to the diagnosis at an advanced stage in most patients. Epithelial ovarian cancer (EOC) constitutes 90% of ovarian malignancies and is classified into distinct histologic categories including serous, mucinous, endometrioid, clear cell, transitional, mixed, and undifferentiated subtypes. There is increasing evidence that these differed histologies arise from different aetiologies. There have been recent advances in the methodology used to classify epithelial ovarian cancer (McCluggage, W.G. "Morphological subtypes of ovarian carcinoma: a review with emphasis on new developments and pathogenesis," PATHOLOGY 2011 Aug;43(5):420-32). One of the consequences of this is that many tumors that would previously been classified as endometrioid are now being classified as serous.
- The current standard treatment for ovarian cancer is debulking surgery and standard platinum taxane based cytotoxic chemotherapy. However, not all patients respond to this, and of those that do, approximately 70% will experience a recurrence. Specific targeted therapies for ovarian cancer based on histological or molecular classification have not yet reached the marketplace. Similarly for other types of cancer, there is still no accurate way of selecting appropriate cytotoxic chemotherapeutic agents.
- The advent of microarrays and molecular genomics has the potential for a significant impact on the diagnostic capability and prognostic classification of disease, which may aid in the prediction of the response of an individual patient to a defined therapeutic regimen. Microarrays provide for the analysis of large amounts of genetic information, thereby providing a genetic fingerprint of an individual. There is much enthusiasm that this technology will ultimately provide the necessary tools for custom-made drug treatment regimens.
- Currently, healthcare professionals have few mechanisms to help them identify cancer patients who will benefit from chemotherapeutic agents. Identification of the optimal first-line drug has been difficult because methods are not available for accurately predicting which drug treatment would be the most effective for a particular cancer's physiology. This deficiency results in relatively poor single agent response rates and increased cancer morbidity and death. Furthermore, patients often needlessly undergo ineffective, toxic drug therapy.
- Angiogenesis is a key component of neo-vascularisation of tumors and essential to tumorigenesis and metastatsis. As such, it is a key area for therapeutic intervention and has been correlated to poor prognosis and reduced survival. This has promoted the development of a number of agents that target angiogenesis related processes and pathways, including the market leader and first FDA-approved anti-angiogenic, bevacizumab (Avastin), produced by Genentech/Roche.
- Treatment regimens that include bevacizumab have demonstrated broad clinical activity1-10. However, no overall survival (OS) benefit has been shown after the addition of bevacizumab to cytotoxic chemotherapy in most cancers8, 12-13. This suggests that a substantial proportion of tumours are either initially resistant or quickly develop resistance to VEGF blockade (the mechanism of action of bevacizumab). In fact, 21% of ovarian, 10% of renal and 33% of rectal cancer patients show partial regression when receiving bevacizumab monotherapy, suggesting that bevacizumab may be active in small subgroups of patients, but that such incremental benefits do not reach significance in unselected patients. As such, the use of a biomarker of response to bevacizumab would improve assessment of treatment outcomes and thus enable the identification of patient subgroups that would receive the most clinical benefit from bevacizumab treatment. This would be particularly relevant in the case of metastatic breast cancer, where the absence of a clinically beneficial biomarker has undermined the use of bevacizumab. Thus far, no such biomarker has been clinically validated to predict bevacizumab efficacy. Hypertension and VEGF polymorphisms are so far the only biomarkers to show potential, but important questions remain about their use in a clinical setting.
- Another approach to anti-angiogenic therapy is simulataneous targeting of multiple angiogenic pathways rather than selective targeting of the VEGF pathway. Theoretically, multitargeted anti-angiogenic agents should more completely inhibit angiogenesis than agents such as bevacizumab and thus may produce greater therapeutic benefit. It has been postulated that in some tumors, angiogenesis may require VEGF only in the early stages of disease but is driven by additional angiogenic pathways as the disease progresses. Therefore, by targeting multiple pathways, it may be possible to counteract compensatory escape mechanisms that could lead to resistance to VEGF inhibition.
- As for other types of cancer there is still no accurate way of selecting which patients will or will not respond to standard of care with an anti-angiogenic therapeutic or single agent anti-angiogenic therapy.
- What is therefore needed is a molecular diagnostic test that would facilitate the stratification of patients based upon their predicted response to anti-angiogenic therapeutics, either in combination with standard of care or as a single-agent therapeutic. This would allow for the rapid identification of those patients who should receive alternative therapies. Such a molecular diagnostic test should be predictive of therapeutic responsiveness across different cancer types with sufficient accuracy.
US2006/127928 discloses a panel of targeted therapy markers that can be used in assessing a particular subject's sensitivity to various therapeutic agents and cancer treatments. Lu et al (J Natl Cancer Inst. 2001 Dec 19;93(24):1852-7) found that in breast cancer cell models that overexpress HER2/neu, an increased level of IGF-IR signalling appears to interfere with the action of trastuzumab. Italiano et al (Eur J Cancer. 2012 Nov; 48(17): 3215-3222) found that IGF2 was the most highly expressed gene of the IGF pathway in gastrointestinal stromal tumours (GISTs). - The invention is defined in the claims. Disclosed are methods of using a collection of biomarkers expressed in cancer such that when some or all of the transcripts are under-expressed, they identify a subtype of cancer that has an up-regulation or down-regulation in molecular signaling relating to angiogenesis. The collection of biomarkers may be defined by an expression signature, and the expression signature is used to assign a cumulative score to the measured expression values of the collection of biomarkers. The invention also provides methods for indicating responsiveness or non-responsiveness to anti-angiogenic agents as well as identifying patients with a good or poor prognosis, using the collection of biomarkers and expression signatures disclosed herein. In different aspects, the biomarkers and expression signatures may form the basis of a single parameter or multiparametric predictive test that could be delivered using methods known in the art such as microarray, Q-PCR, immunohistochemistry, ELISA or other technologies that can quantify mRNA or protein expression.
- In one example, the present disclosure provides an expression signature defining a cancer subtype associated with up-regulation of angiogenesis related biomarkers ("angiogeneis"). In another example, the present disclosure provides an expression signature defining a cancer subtype association with down-regulation of angiogenesis related biomarkers ("non-angiogenesis"). In addition, the cancer subtypes described herein are common to many types of cancer and are not limited to a single cancer disease type. Accordingly, the expression signatures of the present invention are not limited to a single cancer type. In certaininstances , the expression signature comprises two or more biomarkers selected from the biomarkers listed in Tables 1A-1C. In another instance, the angiogenesis expression signature comprises two or more biomarkers selected from the biomarkers listed in Tables 2A or 2B. In another instance, the non-angiogenesis expression signature comprises two or more biomarkers listed in Table 2C. In another instance, the angiogenesis expression signature comprises the biomarkers listed in Table 2A or 2B and their corresponding weights as determined using a PLS classifier. In another instance, the non-angiogenesis signature comprises the biomarkers listed in Table 2C and their corresponding weights as determined using a PLS classifier.
- In one embodiment of the invention, the expression signatures are useful for evaluating a cancer tumor's responsiveness to anti-angiogenic therapeutics. The use of the invention to determine a tumor's responsiveness to anti-angiogeneic therapeutics is not limited to a single cancer type. In one example embodiment, the cancer may be ovarian cancer, breast cancer, colon cancer, colorectal cancer, lung cancer, prostate cancer, or glioblastoma. The present invention relates to prediction of response to drugs using at least or up to different 10 classifications of response, such as overall survival, progression free survival, radiological response, as defined by RECIST, complete response, partial response, stable disease and serological markers such as, but not limited to, PSA, CEA, CA125, CA15-3 and CA19-9. The invention described herein is not limited to any one drug; it can be used to identify responders and non responders to any of a range of drugs currently in use, under development and novel, that directly or indirectly affect or target angiogeneic processes. In one embodiment, the present invention may be used to evaluate adjuvant or neoadjuvant bevacizumab or dasatanib, either as single agents, or in combination with standard of care therapy. In another embodiment, the present invention may be used to evaluate Avastin, VEGF-TRAP, treatment in ovarian cancer.
- In another embodiment of the invention, the expression signatures disclosed herein may be used to determine a patient's clinical prognosis. For example, patients identified as having a cancer subtype associated with down-regulation of angiogenesis related biomarkers may exhibit a longer survival rate than a cancer subtype related to up-regulation of angiogenesis related biomarkers. The use of the invention to determine an individual's clinical prognosis is not limited to a single cancer type. In one example embodiment, the cancer may be ovarian cancer, colon cancer, colorectal cancer, breast cancer, lung cancer, prostate cancer, or glioblastoma. The present invention relates to prediction of clinical prognosis using at least progression free survival. Additional prognostic factors that may be considered are ethnicity and race, age, stage of disease, histology, tumor grade, tumor makers (for example, CA125), site-specific surgical treatment, size of residual disease, and tumor response
- The predictive and prognostic uses of the expression signatures disclosed herein may be achieved using a single expression signature or multiple expression signatures. For example, one expression signature may be a non-angiogenesis signature and a second expression signature may be an angiogenesis signature. In one example embodiment, a non-angiogenesis expression signature is used to determine a patient's clinical prognosis and an angiogenesis signature is used to determine a patient's predicted responsiveness to a given class of therapeutic agent or treatment regimen. In one instance, the angiogenesis signature comprises one or more biomarkers from Table 2A or Table 2B, and the non-angiogenesis signature comprises one or more biomarkers from Table 2C. In another instance, the angiogenesis signature comprises the biomarkers in Table 2A or Table 2B, and the non-angiogenesis signature comprises the biomarkers in Table 2A.
- The disclosures herein relate to kits for conventional diagnostic uses listed above such as qPCR, microarray, and immunoassays such as immunohistochemistry, ELISA, Western blot and the like. Such kits include appropriate reagents and directions to assay the expression of the genes or gene products and quantify mRNA or protein expression.
- Also disclosed are methods for identifying human tumors with or without the non-angiogenesis phenotype. In certain exemplary embodiments, such methods may be used to identify patients that are sensitive to and respond to drugs that inhibit, either directly or indirectly, processes relating to angiogenesis. In certain other exemplary embodiments, such methods may be used to identify patients that are resistant to or do not respond to drugs that inhibit, either directly or indirectly, processes relating to angiogenesis.
- This invention also relates to guiding effective treatment of patients. Further, methods relating to selection of patient treatment regimens and selecting patients for clinical trials of current, or developmental stage drugs that directly or indirectly affect angiogenesis are provided.
- In addition, methods that accommodate the use of archived formalin fixed paraffin-embedded (FFPE) biopsy material, as well as fresh/frozen (FF) tissue, for assay of all transcripts, and are therefore compatible with the most widely available type of biopsy material, are described herein. A biomarker expression level may be determined using RNA obtained from FFPE tissue, fresh frozen tissue or fresh tissue that has been stored in solutions such as RNAlater®.
-
-
Figure 1 provides a heatmap representing the hierarchical agglomerative clustering analysis of the most variable probe sets across 199 serous samples of the Almac Diagnostics' epithelial ovarian cancer sample set. The functional analysis of the probe set clusters is summarized on the right hand side of the image. The legend across the top of the image indicates the classifier group each sample was assigned to for classifier generation (i.e. Class labels). -
Figures 2A and2B represents the functional analysis results of the angiogenesis probe set cluster in the 199 serous only samples in an epithelial ovarian cancer training set using a functional enrichment analysis.Figure 2A shows a histogram representing the significance of the top 10 enriched Gene Ontology Biological processes. Red bars indicate significance of a process at a p-value of 0.05 after false discovery rate correction.Figure 2B represents the subset of the Gene Ontology Biological processes tree where processes include one or more genes encoded by the probe sets incluster 3. Red coloured processes indicate significance of that process at a p-value of 0.05 after false discovery rate correction. Black coloured processes include one or more genes encoded by the probe sets in angiogenesis probe set cluster, but are not significant. -
Figureure 3 represents the functional enrichment results of the genes within an exemplary 25-gene expression signature that identifies the molecular subtype related to angiogenesis. Red bars indicate significance of a process at a p-value of 0.05 after False Discovery Rate correction. -
Figureure 4 provides Kaplan-Meier curves for recurrence-free survival (time-to-event in weeks) following initial surgical resection from patients with high-grade glioblastoma without prior treatment (Phillips HS, Kharbanda S, Chen R, Forrest WF et al. "Molecular subclasses of high-grade glioma predict prognosis, delineate a pattern of disease progression, and resemble stages in neurogenesis," CANCER CELL 2006 Mar;9(3):157-73. PMID: 16530701; Costa BM, Smith JS, Chen Y, Chen J et al. "Reversing HOXA9 oncogene activation by PI3K inhibition: epigenetic mechanism and prognostic significance in human glioblastoma," CANCER RES 2010 ). -
Figureure 5 provides a diagram of a ROC curve of the classification performance of an exemplary 25-gene classifier model within 16 prostate cell-lines following treatment with Dasatanib. The AUC is approximately 0.84 following application of the classifier model. The 95% confidence limits were determined using 1000 bootstrap iterations (Wang XD, Reeves K, Luo FR, Xu LA et al. "Identification of candidate predictive and surrogate molecular markers for dasatinib in prostate cancer: rationale for patient selection and efficacy monitoring," GENOME BIOL 2007;8(11):R255. PMID: 18047674). -
Figureure 6 provides a heatmap representing the hierarchical agglomerative clustering analysis of the most variable genes across 265 serous samples of an epithelial ovarian cancer sample set reclassified according to updated pathological classification criteria. The functional analysis of the probe set clusters is summarized on the right hand side of the image. The legend across the top of the image indicates the classifier group each sample was assigned to for classifier generation (i.e. Class labels) of both "angiogenesis" and "non-angiogenesis" subtypes. -
Figures 7A and7B represents the functional analysis results of the angiogenesis probe set cluster of the 265 serous only samples in an epithelial ovarian cancer training set using a functional enrichment tool (FET) algorithm.Figure 7A shows a histogram representing the significance of the top 10 enriched Gene Ontology biological processes. Red bars indicate significance of a process at a p-value of 0.05 after False Discovery Rate correction.Figure 7B represents the subset of the Gene Ontology Biological processes tree where processes include one or more genes encoded by the probe sets in cluster 2 (angiogenesis probe set cluster). Red coloured processes indicate significance of that process at a p-value of 0.05 after false discovery rate correction. Black coloured processes include one or more genes encoded by the probe sets in the angiogenesis cluster, but are not significant. -
Figure. 8 represents the functional enrichment results of the genes within an exemplary 45-gene classifier model that identifies the molecular sub-type related to angiogenesis. Red bars indicate significance of a process at a p-value of 0.05 after False Discovery Rate correction. -
Figure 9 provides a diagram of a ROC curve of the classification performance of the 45-gene classifier model within 16 prostate cell-lines following treatment with Dasatanib. The AUC is ∼0.95 following application of the classifier model. The 95% confidence limits were determined using 1000 bootstrap iterations. -
Figure 10 provides Kaplan-Meier curves for progression-free survival (in weeks) for the non-angiogenesis sample group versus the "other" samples not labelled as "non-angiogenesis" sample group in the reclassified ovarian sample set. -
Figures 11A and11B provide heatmaps representing the hierarchical agglomerative clustering analysis of the most variable genes across 51 ER negative samples (Figure 11A ) of a breast cancer sample set and the most variable genes across 56 ER positive samples of a breast cancer sample set (Figure 11B ). The functional analysis of the probe set clusters is summarized on the right hand side of the image for those clusters showing vasculature development/angiogenesis or immune response/IFN signalling. -
Figure 12 provides Kaplan-Meier curves for progression-free survival (in weeks) for the samples identified as "non-angiogenesis" using the example 63 gene "non-angiogenesis" signature, versus the "other" samples not classified as "non-angiogenesis" using the example 63 gene signature, in the 265 reclassified ovarian sample set. -
Figure 13 provides Kaplan-Meier curves for progression-free survival (in weeks) for the samples identified as "non-angiogenesis" using the example 63 gene "non-angiogenesis" signature, versus the "other" samples not classified as "non-angiogenesis" using the example 63 gene signature, in the independent 265 epithelial and serous ovarian sample set. -
Figure 14A and 14B are graphs demonstrating certain classification performance benchmarks of an example non-angiogenesis signature as applied to colorectal cancer samples. -
Figure 15 provides a diagram of a ROC curve of the classification performance of the 45-gene classifier model within 16 prostate cell-lines following treatment with Dasatanib. The AUC is ∼0.95 following application of the classifier model. The 95% confidence limits were determined using 1000 bootstrap iterations (Wang XD, Reeves K, Luo FR, Xu LA et al. "Identification of candidate predictive and surrogate molecular markers for dasatinib in prostate cancer: rationale for patient selection and efficacy monitoring," GENOME BIOL 2007;8(11):R255. PMID: 18047674). -
Figure 16 provides a heatmap representing the hierarchical agglomerative clustering analysis of the most variable probe sets across 199 serous samples of the Almac Diagnostics' epithelial ovarian cancer sample set. The functional analysis of the probe set clusters is summarized on the right hand side of the image. The legend across the top of the image indicates the classifier group each sample was assigned to for classifier generation (i.e. Class labels). -
Figure 17 provides a process flow diagram example Kaplan Meier curves for the use of a non-angiogenesis signature to classify a patient based on prognosis and then an angiogenesis signature to determine responsiveness to a given therapeutic regimen in accordance with example embodiments. -
Figure 18A and B are graphs demonstrating certain classification performance benchmarks of an example 25 angiogenesis signature as applied to colorectal cancer samples. -
Figure 19A and B are graphs demonstrating certain classification performance benchmarks of a 45 gene angiogenesis signature as applied to colorectecal cancer samples. - Unless defined otherwise, technical and scientific terms used herein have the same meaning as commonly understood by one of ordinary skill in the art to which this disclosure belongs. Definitions of common terms in molecular biology may be found in Benjamin Lewin, Genes IX, published by Jones and Bartlet, 2008 (ISBN 0763752223); Kendrew et al. (eds.), The Encyclopedia of Molecular Biology, published by Blackwell Science Ltd., 1994 (ISBN 0632021829); Robert A. Meyers (ed.), Molecular Biology and Biotechnology: a Comprehensive Desk Reference, published by VCH Publishers, Inc., 1995 (ISBN 9780471185710); Singleton et al., Dictionary of Microbiology and Molecular Biology 2nd ed., J. Wiley & Sons (New York, N.Y. 1994), and March, Advanced Organic Chemistry Reactions, Mechanisms and Structure 4th ed., John Wiley & Sons (New York, N.Y. 1992).
- The singular terms "a," "an," and "the" include plural referents unless context clearly indicates otherwise. Similarly, the word "or" is intended to include "and" unless the context clearly indicates otherwise. The term "comprises" means "includes." In case of conflict, the present specification, including explanations of terms, will control.
- As used herein terms "marker panel," "expression classifier," "classifier," "expression signature," or "signature" may be used interchangeably.
- All publications, published patent documents, and patent applications cited in this application are indicative of the level of skill in the art(s) to which the application pertains.
- A major goal of current research efforts in cancer is to increase the efficacy of perioperative systemic therapy in patients by incorporating molecular parameters into clinical therapeutic decisions. Pharmacogenetics/genomics is the study of genetic/genomic factors involved in an individuals' response to a foreign compound or drug. Agents or modulators which have a stimulatory or inhibitory effect on expression of a biomarker of the invention can be administered to individuals to treat (prophylactically or therapeutically) cancer in the patient. It is ideal to also consider the pharmacogenomics of the individual in conjunction with such treatment. Differences in metabolism of therapeutics may possibly lead to severe toxicity or therapeutic failure by altering the relationship between dose and blood concentration of the pharmacologically active drug. Thus, understanding the pharmacogenomics of an individual permits the selection of effective agents (e.g., drugs) for prophylactic or therapeutic treatments. Such pharmacogenomics can further be used to determine appropriate dosages and therapeutic regimens. Accordingly, the level of expression of a biomarker of the invention in an individual can be determined to thereby select appropriate agent(s) for therapeutic or prophylactic treatment of the individual.
- The present invention relates to a molecular diagnostic tests useful for diagnosing cancers from different anatomical sites that includes the use of one or more common subtypes related to angiogenesis. The invention includes expression signatures that identify a subject as responsive or non-responsive to anti-angiogenic therapeutics and/or having a good or poor clinical prognosis. The expression signature is derived by obtaining the expression profiles of samples from a sample set of known pathology and/or clinical outcome. The samples may originate from the same sample tissue type or different tissue types. As used herein an "expression profile" comprises a set of values representing the expression level for each biomarker analyzed from a given sample.
- The expression profiles from the sample set are then analyzed using a mathematical model. Different mathematical models may be applied and include, but are not limited to, models from the fields of pattern recognition (Duda et al. Pattern Classification, 2nd ed., John Wiley, New York 2001), machine learning (Schölkopf et al. Learning with Kernels, MIT Press, Cambridge 2002, Bishop, Neural Networks for Pattern Recognition, Clarendon Press, Oxford 1995), statistics (Hastie et al. The Elements of Statistical Learning, Springer, New York 2001), bioinformatics (Dudoit et al., 2002, J. Am. Statist. Assoc. 97:77-87, Tibshirani et al., 2002, Proc. Natl. Acad. Sci. USA 99:6567-6572) or chemometrics (Vandeginste, et al., Handbook of Chemometrics and Qualimetrics, Part B, Elsevier, Amsterdam 1998). The mathematical model identifies one or more biomarkers expressed in the sample set that are most predictive of a given disease phenotype. These one or more biomarkers define an expression signature. Accordingly, an expression signature includes the biomarkers identified as most predictive of a given disease phenotype. In certain exemplary embodiments, the mathematical model defines a variable, such as a weight, for each identified biomarker. In certain exemplary embodiments, the mathematical model defines a decision function. The decision function may further define a threshold score which separates the sample set into two disease phenotypes such as, but not limited to, samples that are responsive and non-responsive to anti-angiogenic therapeutics. In one exemplary embodiment, the decision function and expression signature are defined using a linear classifier.
- To classify new samples using a defined expression signature, the biomarkers defined by the expression signature are isolated and an expression profile of the biomarker(s) determined. The new sample biomarker expression profile is analyzed with the same mathematical model used to define the expression signature. In certain exemplary embodiments, the mathematical model defines an expression score for the new sample. The expression score may be determined by combining the expression values of the biomarkers with corresponding scalar weights using non-linear, algebraic, trigonometric or correlative means to derive a single scalar value. The expression score is compared to the threshold score and the sample classified based on whether the expression score is greater than, or equal to, or less than the threshold score. In one exemplary embodiment, a sample expression value greater than the reference expression value indicates a patient will be responsive to an anti-angiogenic therapeutic. In another exemplary embodiment, a sample expression score below the threshold score indicates the patient will not be responsive to an anti-angiogenic therapeutic. In another exemplary embodiment, a sample expression score below the threshold expression score indicates the patient has a cancer typethat is not responsive to an anti-angiogenic therapeutic. In another exemplary embodiment, a sample expression score above the reference expression score indicates the patient has a cancer type that is responsive to an anti-angiogenic therapeutic. In another example embodiment, a sample expression score above the threshold score indicates the patient has a cancer sub-type with a good clinical prognosis. In another example embodiment, a sample expression score below the threshold score indicates a patient with a cancer subtype with a poor clinical prognosis. Where an expression signature is derived from a tissue sample set comprising one type of cancer tissue, the expression signature is not limited to identifying the same cancer sub-type only in tissues of the same cancer type, but may be used with other cancer types that share the same cancer sub-type. For example, where an expression signature is derived from ovarian cancer samples, the expression signature may be used to identify a similar angiogenesis sub-type in different cancers such as glioblastoma, breast cancer, lung cancer, colon cancer, or prostate cancer.
- One application of the expression signatures disclosed herein is the identification of patients with good and poor prognosis. By examining the expression of a collection of the identified biomarkers in a tumor, it is possible to determine the likely clinical outcomes of a patient. By examining the expression of a collection of biomarkers, it is therefore possible to identify those patients in most need of more aggressive therapeutic regimens and likewise eliminate unnecessary therapeutic treatments or those unlikely to significantly improve a patient's clinical outcome.
- A patient may be considered to have a "good prognosis" where, for example, the survival rate associated with the cancer subtype is greater than a survival rate associated with other related cancer subtypes. In certain embodiments, a "good prognosis" indicates at least an increased expected survival time. This may be based upon a classification as responsive to an anti-angiogenic therapeutic agent as described herein. The increased expected survival time may be as compared to classification as non-responsive to the anti-angiogenic therapeutic agent.
- A patient may be considered to have a "poor prognosis" or "bad prognosis" where, for example, the survival rate associated with the cancer subtype is less than the survival rate associated with other related cancer subtypes.
- Another application of the expression signatures disclosed herein is the stratification of response to, and selection of patients for therapeutic drug classes that encompass anti-angiogenic therapies. By examining the expression of a collection of the identified biomarkers in a tumor, it is possible to determine which therapeutic agent or combination of agents will be most likely to reduce the growth rate of a cancer. It is also possible to determine which therapeutic agent or combination of agents will be the least likely to reduce the growth rate of a cancer. By examining the expression of a collection of biomarkers, it is therefore possible to eliminate ineffective or inappropriate therapeutic agents. Importantly, in certain embodiments, these determinations can be made on a patient-by-patient basis or on an agent-by-agent basis. Thus, one can determine whether or not a particular therapeutic regimen is likely to benefit a particular patient or type of patient, and/or whether a particular regimen should be continued. The present invention provides a test that can guide therapy selection as well as selecting patient groups for enrichment strategies during clinical trial evaluation of novel therapeutics. For example, when evaluating a putative anti-angiogeneic agent or treatment regime, the expression signatures and methods disclosed herein may be used to select individuals for clinical trials that have cancer subtypes that are responsive to anti-angiogenic agents.
- A cancer is "responsive" to a therapeutic agent if its rate of growth is inhibited as a result of contact with the therapeutic agent, compared to its growth in the absence of contact with the therapeutic agent. Growth of a cancer can be measured in a variety of ways. For instance, the size of a tumor or measuring the expression of tumor markers appropriate for that tumor type.
- A cancer is "non-responsive" to a therapeutic agent if its rate of growth is not inhibited, or inhibited to a very low degree, as a result of contact with the therapeutic agent when compared to its growth in the absence of contact with the therapeutic agent. As stated above, growth of a cancer can be measured in a variety of ways, for instance, the size of a tumor or measuring the expression of tumor markers appropriate for that tumor type. The quality of being non-responsive to a therapeutic agent is a highly variable one, with different cancers exhibiting different levels of "non-responsiveness" to a given therapeutic agent, under different conditions. Still further, measures of non-responsiveness can be assessed using additional criteria beyond growth size of a tumor such as, but not limited to, patient quality of life, and degree of metastases.
- Another application of the expression signatures disclosed herein is the combined identification of prognosis of a patient along with identification of a predicted responsiveness of the patient to a given therapeutic. In certain example embodiments, a non-angiogenesis expression signature defined below is used to identify patients with a good prognosis from those with a poor prognosis, and an angiogenesis expression signature is used to predict the patient's response to a given therapeutic class of drugs.
- The angiogenesis subtype can be identified from a fresh/frozen (FF) or formalin fixed paraffin embedded (FFPE) patient sample. In one exemplary embodiment, the cancer type is ovarian cancer, breast cancer, colon cancer, colorectal cancer, lung cancer, prostate cancer, or glioblastoma. In another exemplary embodiment, the cancer type is a ovarian cancer. In a further exemplary embodiment, the cancer type is breast cancer. In another exemplary embodiment, the cancer type is lung cancer. In another exemplary embodiment, the cancer type is colon cancer. In another exemplary embodiment, the cancer type is prostate cancer. In another exemplary embodiment, the cancer type is glioblastoma
- The expression signatures of the present invention are identified by analyzing the expression profiles of certain biomarkers in a patient sample set. Biomarkers suitable for use in the present invention include DNA, RNA, and proteins. The biomarkers are isolated from a patient sample and their expression levels determined to derive a set of expression profiles for each sample analyzed in the patient sample set. In certain example embodiments the expression signature is an angiogenesis expression signature. An angiogenesis expression signature relates to an angiogenesis phenotype obversed in cancer tissues, the phenotype characterized by an up-regulation of biomarkers associated with angiogenesis and vascular development. In certain other example embodiments, the expression signature is a non-angiogenesis expression signature. A non-angiogenesis expression signature relates to a phenotype observed in cancer tissues, the phenotype characterized by a down-regulation of biomarkers associated with angiongenesis and vascular development.
- In certain embodiments, the expression profile obtained is a genomic or nucleic acid expression profile, where the amount or level of one or more nucleic acids in the sample is determined. In these embodiments, the sample that is assayed to generate the expression profile employed in the diagnostic or prognostic methods is one that is a nucleic acid sample. The nucleic acid sample includes a population of nucleic acids that includes the expression information of the phenotype determinative biomarkers of the cell or tissue being analyzed. In some embodiments, the nucleic acid may include RNA or DNA nucleic acids, e.g., mRNA, cRNA, cDNA etc., so long as the sample retains the expression information of the host cell or tissue from which it is obtained. The sample may be prepared in a number of different ways, as is known in the art, e.g., by mRNA isolation from a cell, where the isolated mRNA is used as isolated, amplified, or employed to prepare cDNA, cRNA, etc., as is known in the field of differential gene expression. Accordingly, determining the level of mRNA in a sample includes preparing cDNA or cRNA from the mRNA and subsequently measuring the cDNA or cRNA. The sample is typically prepared from a cell or tissue harvested from a subject in need of treatment, e.g., via biopsy of tissue, using standard protocols, where cell types or tissues from which such nucleic acids may be generated include any tissue in which the expression pattern of the to be determined phenotype exists, including, but not limited to, disease cells or tissue, body fluids, etc.
- The expression profile may be generated from the initial nucleic acid sample using any convenient protocol. While a variety of different manners of generating expression profiles are known, such as those employed in the field of differential gene expression/biomarker analysis, one representative and convenient type of protocol for generating expression profiles is array-based gene expression profile generation protocols. Such applications are hybridization assays in which a nucleic acid that displays "probe" nucleic acids for each of the genes to be assayed/profiled in the profile to be generated is employed. In these assays, a sample of target nucleic acids is first prepared from the initial nucleic acid sample being assayed, where preparation may include labeling of the target nucleic acids with a label, e.g., a member of a signal producing system. Following target nucleic acid sample preparation, the sample is contacted with the array under hybridization conditions, whereby complexes are formed between target nucleic acids that are complementary to probe sequences attached to the array surface. The presence of hybridized complexes is then detected, either qualitatively or quantitatively. Specific hybridization technology which may be practiced to generate the expression profiles employed in the subject methods includes the technology described in
U.S. Pat. Nos. 5,143,854 ;5,288,644 ;5,324,633 ;5,432,049 ;5,470,710 ;5,492,806 ;5,503,980 ;5,510,270 ;5,525,464 ;5,547,839 ;5,580,732 ;5,661,028 ;5,800,992 ; as well asWO 95/21265 WO 96/31622 WO 97/10365 WO 97/27317 EP 373 203 EP 785 280 - In certain exemplary embodiments, the patient sample set comprises cancer tissue samples, such as archived samples. The patient sample set is preferably derived from cancer tissue samples having been characterized by prognosis, likelihood of recurrence, long term survival, clinical outcome, treatment response, diagnosis, cancer classification, or personalized genomics profile. As used herein cancer includes, but is not limited to, leukemia, brain cancer, prostate cancer, liver cancer, ovarian cancer, stomach cancer, colorectal cancer, throat cancer, breast cancer, skin cancer, melanoma, lung cancer, sarcoma, cervical cancer, testicular cancer, bladder cancer, endocrine cancer, endometrial cancer, esophageal cancer, glioma, lymphoma, neuroblastoma, osteosarcoma, pancreatic cancer, pituitary cancer, renal cancer, and the like. As used herein, colorectal cancer encompasses cancers that may involve cancer in tissues of both the rectum and other portions of the colon as well as cancers that may be individually classified as either colon cancer or rectal cancer. In one embodiment, the methods described herein refer to cancers that are treated with anti-angiogenic agents, anti-angiogenic targeted therapies, inhibitors of angiogenesis signaling, but not limited to these classes. These cancers also include subclasses and subtypes of these cancers at various stages of pathogenesis. In certain exemplary embodiments, the patient sample set comprises ovarian cancer samples. In another exemplary embodiment, the patient sample set comprises breast cancer samples. In yet another exemplary embodiment, the patient sample set comprises glioblastoma samples.
- "Biological sample", "sample", and "test sample" are used interchangeably herein to refer to any material, biological fluid, tissue, or cell obtained or otherwise derived from an individual. This includes blood (including whole blood, leukocytes, peripheral blood mononuclear cells, buffy coat, plasma, and serum), sputum, tears, mucus, nasal washes, nasal aspirate, breath, urine, semen, saliva, meningeal fluid, amniotic fluid, glandular fluid, lymph fluid, nipple aspirate, bronchial aspirate, synovial fluid, joint aspirate, ascites, cells, a cellular extract, and cerebrospinal fluid. This also includes experimentally separated fractions of all of the preceding. For example, a blood sample can be fractionated into serum or into fractions containing particular types of blood cells, such as red blood cells or white blood cells (leukocytes). If desired, a sample can be a combination of samples from an individual, such as a combination of a tissue and fluid sample. The term "biological sample" also includes materials containing homogenized solid material, such as from a stool sample, a tissue sample, or a tissue biopsy, for example. The term "biological sample" also includes materials derived from a tissue culture or a cell culture. Any suitable methods for obtaining a biological sample can be employed; exemplary methods include, e.g., phlebotomy, swab (e.g., buccal swab), and a fine needle aspirate biopsy procedure. Samples can also be collected, e.g., by micro dissection (e.g., laser capture micro dissection (LCM) or laser micro dissection (LMD)), bladder wash, smear (e.g., a PAP smear), or ductal lavage. A "biological sample" obtained or derived from an individual includes any such sample that has been processed in any suitable manner after being obtained from the individual, for example, fresh frozen or formalin fixed and/or paraffin embedded. The methods of the invention as defined herein begin with an obtained sample and thus do not incorporate the step of obtaining the sample from the patient. The methods are in vitro methods performed on an isolated sample.
- As used herein, the term "patient" includes human and non-human animals. The preferred patient for treatment is a human. "Patient," "individual" and "subject" are used interchangeably herein.
- As used herein, the term "biomarker" can refer to a gene, an mRNA, cDNA, an antisense transcript, a miRNA, a polypeptide, a protein, a protein fragment, or any other nucleic acid sequence or polypeptide sequence that indicates either gene expression levels or protein production levels. When a biomarker indicates or is a sign of an abnormal process, disease or other condition in an individual, that biomarker is generally described as being either over-expressed or under-expressed as compared to an expression level or value of the biomarker that indicates or is a sign of a normal process, an absence of a disease or other condition in an individual. "Up-regulation", "up-regulated", "over-expression", "over-expressed", and any variations thereof are used interchangeably to refer to a value or level of a biomarker in a biological sample that is greater than a value or level (or range of values or levels) of the biomarker that is typically detected in similar biological samples from healthy or normal individuals. The terms may also refer to a value or level of a biomarker in a biological sample that is greater than a value or level (or range of values or levels) of the biomarker that may be detected at a different stage of a particular disease.
- "Down-regulation", "down-regulated", "under-expression", "under-expressed", and any variations thereof are used interchangeably to refer to a value or level of a biomarker in a biological sample that is less than a value or level (or range of values or levels) of the biomarker that is typically detected in similar biological samples from healthy or normal individuals. The terms may also refer to a value or level of a biomarker in a biological sample that is less than a value or level (or range of values or levels) of the biomarker that may be detected at a different stage of a particular disease.
- Further, a biomarker that is either over-expressed or under-expressed can also be referred to as being "differentially expressed" or as having a "differential level" or "differential value" as compared to a "normal" expression level or value of the biomarker that indicates or is a sign of a normal process or an absence of a disease or other condition in an individual. Thus, "differential expression" of a biomarker can also be referred to as a variation from a "normal" expression level of the biomarker.
- The terms "differential biomarker expression" and "differential expression" are used interchangeably to refer to a biomarker whose expression is activated to a higher or lower level in a subject suffering from a specific disease, relative to its expression in a normal subject, or relative to its expression in a patient that responds differently to a particular therapy or has a different prognosis. The terms also include biomarkers whose expression is activated to a higher or lower level at different stages of the same disease. It is also understood that a differentially expressed biomarker may be either activated or inhibited at the nucleic acid level or protein level, or may be subject to alternative splicing to result in a different polypeptide product. Such differences may be evidenced by a variety of changes including mRNA levels, miRNA levels, antisense transcript levels, or protein surface expression, secretion or other partitioning of a polypeptide. Differential biomarker expression may include a comparison of expression between two or more genes or their gene products; or a comparison of the ratios of the expression between two or more genes or their gene products; or even a comparison of two differently processed products of the same gene, which differ between normal subjects and subjects suffering from a disease; or between various stages of the same disease. Differential expression includes both quantitative, as well as qualitative, differences in the temporal or cellular expression pattern in a biomarker among, for example, normal and diseased cells, or among cells which have undergone different disease events or disease stages.
- In certain exemplary embodiments, the biomarker is an RNA transcript. As used herein "RNA transcript" refers to both coding and non-coding RNA, including messenger RNAs (mRNA), alternatively spliced mRNAs, ribosomal RNA (rRNA), transfer RNA (tRNA), small nuclear RNAs (snRNA), and antisense RNA. Measuring mRNA in a biological sample may be used as a surrogate for detection of the level of the corresponding protein and gene in the biological sample. Thus, any of the biomarkers or biomarker panels described herein can also be detected by detecting the appropriate RNA. Methods of biomarker expression profiling include, but are not limited to quantitative PCR, NGS, northern blots, southern blots, microarrays, SAGE, immunoassays (ELISA, EIA, agglutination, nephelometry, turbidimetry, Western blot, immunoprecipitation, immunocytochemistry, flow cytometry, Luminex assay), and mass spectrometry. The overall expression data for a given sample may be normalized using methods known to those skilled in the art in order to correct for differing amounts of starting material, varying efficiencies of the extraction and amplification reactions.
- In certain exemplary embodiments, biomarkers useful for distinguishing between cancer types that are responsive and non-responsive to anti-angiogenic therapeutics can be determined by identifying biomarkers exhibiting the highest degree of variability between samples in the patient data set as determined using the expression detection methods and patient sample sets discussed above. Standard statistical methods known in the art for identifying highly variable data points in expression data may be used to identify the highly variable biomarkers. For example, a combined background and variance filter to the patient data set. The background filter is based on the selection of probe sets with expression E and expression variance var E above the thresholds defined by background standard deviation σBg (from the Expression Console software) and quantile of the standard normal distribution zα at a specified significance a probe sets were kept if:


where a defines a significance threshold. In certain exemplary embodiment, the significance threshold is 6.3 • 10-5. In another exemplary embodiment, the significance threshold may be between 1.0 • 10-7 to 1.0 • 10-3. - In certain exemplary embodiments, the highly variable biomarkers may be further analyzed to group samples in the patient data set into subtypes or clusters based on similar gene expression profiles. For examples, biomarkers may be clustered based on how highly correlated the up-regulation or down-regulation of their expression is to one another. Various clustering analysis techniques known in the art may be used. In one exemplary embodiment, hierarchical agglomerative clustering is used to identify the cancer subtypes. To determine the biological relevance of each subtype, the biomarkers within each cluster may be further mapped to their corresponding genes and annotated by cross-reference to one or more gene ontology databases containing information on biological activity and biological pathways associated with the gene. In one exemplary embodiment, biomarker in clusters enriched for angiogenesis, vasculature development and immune response general functional terms are grouped into a putative angiogenesis sample group and used for expression signature generation. In another exemplary embodiment, biomarkers in clusters that are up regulated and enriched for angiogeneis, vasculature development and immune response general functional terms are grouped into a putative angiongenesis sample group and used for expression signature generation. In another exemplary embodiment, biomarkers in clusters that are down regulated and enriched for angiogenesis, vasculature development and immune response general functional terms are grouped into a putative angiongenesis sample group and used for expression signature generation. Further details for conducting functional analysis of biomarker clusters is provided in the Examples section below.
- In one instance, the biomarkers useful in deriving an expression signature are those biomarkers listed in Table 1A, Table 1B, Table 1C, or a combination thereof. These biomarkers are identified as having predictive value to determine a patient response to a therapeutic agent and/or a prognostice value in identifying individuals with a good or poor clinical prognosis.
- In certain example embodiments, their expression correlates with the response, or lack thereof, to an agent, and more specifically, an anti-angiogenic therapeutic agent. By examining the expression of a collection of the identified biomarkers in a tumor, it is possible to determine which therapeutic agent or combination of agents will be most likely to reduce the growth rate of a cancer. By examining a collection of identified biomarkers in a tumor, it is also possible to determine which therapeutic agent or combination of agents will be the least likely to reduce the growth rate of a cancer. By examining the expression of a collection of biomarkers, it is therefore possible to eliminate ineffective or inappropriate therapeutic agents. Importantly, in certain embodiments, these determinations can be made on a patient-by-patient basis or on an agent-by-agent basis. Thus, one can determine whether or not a particular therapeutic regimen is likely to benefit a particular patient or type of patient, and/or whether a particular regimen should be continued.
- In certain other example embodiments, the expression of the biomarkers disclosed herein correlated with a patient's overall clinical prognosis. By examinaing the expression of a collection of biomarkers identified in a tumor, it is possible to determine whether the individual has a cancer subtype associated with good clinical prognosis or poor clinical prognosis. Importantly, in certain embodiments, these determinations can be made on a patient-by-patient basis. Thus, one of ordinary skill in the art can use predicted prognosis to help select appropriate treatment regimens to treat the underlying disease while eliminating those treatment regimens most likely to produce undesired or medically unwarranted adverse side effects.
- The SEQ ID NOs listed in Table 1A, Table 1B, and Table 1C refer to probe set identifiers used to measure the expression levels of the genes on an exemplary transcriptome array. Expression signatures have been cross-validated using expression data from different arrays with differnt probe sets as detailed further in the Examples section below. Accordingly, the expression signatures and methods disclosed herein are not limited to expression values measured using the probe sets disclosed herein.
Table 1A: Genes in Clusters of Figure 1 SEQ NO: Orientation Gene Symbol 1 Sense STAT1 2 Sense PDGFC 3 Sense TGFB3 4 Sense RAC2 5 Sense MARCKS 6 Sense ALOX5 7 Sense COL8A1 8 Sense CTSS 9 Sense HAVCR2 10 Sense RAB31 11 Sense KCNAB2 12 Sense THBS1 13 Sense SH3BP4 14 Sense CTGF 15 Sense CTGF 16 Sense VCAN 17 Sense IGKC 18 Sense IGKC 19 Sense IGKC 20 Sense SGK1 21 Sense NFATC1 22 Sense HMHA1 23 Sense FCGR1C /// FCGR1A /// FCGR1B 24 Sense EDA2R 25 Sense COL8A1 26 Sense COL12A1 27 Sense HLA-B 28 Sense HLA-F 29 Sense HLA-C 30 Sense SPP1 31 Sense MYO1F 32 Sense SPARC 33 Sense SPARC 34 Sense UBD /// GABBR1 35 Sense CCND1 36 Sense COL1A1 37 Sense EGR1 38 Sense EGR1 39 Sense TNFSF10 40 Sense SULF2 41 Sense CERCAM 42 Sense ATF3 43 Sense MIR21 44 Sense BASP1 45 Sense IFIT2 46 Sense SULF1 47 Sense IGLC2 /// IGLC3 48 Sense IGLC2 /// IGLC3 49 Sense (Fully0Exonic) IGLC2 /// IGLC3 50 Sense IGLC2 /// IGLC3 51 Sense IGLC2 /// IGLC3 52 Sense IGLC1 53 Sense IGLC1 54 Sense IGLC2 /// IGLC3 55 Sense ANGPTL2 56 Sense COL5A2 57 Sense IGJ 58 Sense THY1 59 Sense NDN 60 Sense RGS2 61 Sense MEIS3P1 /// MEIS3P2 62 Sense GBP2 63 Sense CSF1R 64 Sense C1R 65 Sense FAT1 66 Sense COL1A1 67 Sense RHOB 68 Sense MMP11 69 Sense GADD45B 70 Sense MMP14 71 Sense MMP14 72 Sense IGHG4 73 Sense DDX60L 74 Sense SPP1 75 Sense ROR2 76 Sense CTSK 77 Sense FCGR2B 78 Sense PTAFR 79 Sense ICAM1 80 Sense HCLS1 81 No Transcript Match - 82 Sense SLFN11 83 No Transcript Match - 84 Sense JAM3 85 Sense TMEM49 86 Sense TMEM49 87 Sense LTBP2 88 Sense IRS1 89 Sense COL5A2 90 Sense C17orf91 91 Sense GPNMB 92 Sense FAM198B 93 Sense MICAL2 94 Sense TMEM2 95 Sense CHST15 96 Sense SECTM1 97 Sense DCN 98 Sense VCAM1 99 Sense TNFAIP3 100 Sense C1QA 101 Sense C1QA 102 Sense FBXO32 103 Sense COL12A1 104 Sense CPE 105 Sense CIITA 106 Sense GAS7 107 Sense COL3A1 108 Sense FN1 109 Sense IFI30 110 Sense ITGB2 111 Sense ELN 112 Sense CMTM3 113 Sense ANTXR1 114 Sense ARHGDIB 115 Sense LAPTM5 116 Sense SOX4 117 Sense IFI44L 118 Sense IL4I1 119 Sense ANTXR2 120 Sense IGLC2 /// IGLC3 121 Sense EPSTI1 122 Sense BIRC3 123 Sense IGLC2 /// IGLC3 124 Sense BST2 125 Sense TNFSF10 126 Sense COL10A1 127 Sense IGLC2 /// IGLC3 128 Sense FBP1 129 Sense RHOBTB3 130 Sense CDK6 131 Sense CD74 132 Sense ISM1 133 Sense C1QC 134 Sense BIN2 135 Sense CSRNP1 136 Sense TYROBP 137 Sense C1QTNF3 138 Sense DCN 139 Sense IGFBP4 140 Sense AOAH 141 Sense SIRPA 142 Sense FOSB 143 Sense CCDC80 144 Sense IGLC1 145 Sense HCST 146 Sense IFI35 147 Sense BIRC3 148 Sense COL3A1 149 Sense IFITM2 150 Sense ZFP36 151 Sense MMP11 152 Sense COL1A2 153 Sense HLA-DPA1 154 Sense TWIST1 155 Sense ZNF154 156 Sense EGR1 157 Sense IGLC2 /// IGLC3 158 Sense TNFSF10 159 Sense IGKC 160 Sense IGHG1 /// IGHG4 161 Sense GBP5 162 Sense COL1A2 163 Sense APOC1 164 No Transcript Match - 165 Sense COL3A1 166 AntiSense PXDN 167 AntiSense EGR1 168 Sense GBP3 169 Sense ISG15 170 Sense --- 171 Sense KIAA0146 172 Sense CMAH 173 Sense APBB2 174 Sense TPM1 175 No Transcript Match --- 176 Sense DMD 177 No Genome Match --- 178 Sense IL10RA 179 Sense --- 180 No Transcript Match --- 181 Sense DUSP1 182 Sense GBP1 183 Sense PARVG 184 Sense MAFF 185 Sense PDGFC 186 Sense MSN 187 Sense RSAD2 188 Sense TPM1 189 Sense EMB 190 Sense C6orf155 191 Sense FOS 192 Sense DEXI 193 Sense RNF19A 194 Sense FBXO32 195 Sense DPYSL3 196 Sense PRICKLE 1 197 AntiSense EGR1 198 AntiSense NRP2 199 Sense B2M 200 AntiSense MIR21 201 Sense MMP2 202 Sense CDR1 203 Sense HLA-B 204 Sense CTGF 205 Sense DCN 206 Sense SOD2 207 Sense FN1 208 Sense COL8A2 209 Sense SGK1 210 Sense TIMP3 211 Sense ACTA2 212 Sense SRGN 213 Sense LOXL1 214 Sense CCR1 215 Sense GBP1 216 Sense CDH11 217 Sense FCGR3A 218 Sense LUM 219 Sense NNMT 220 Sense COL1A2 221 Sense RGS1 222 Sense GJA1 223 Sense SPARCL1 224 Sense DAB2 225 AntiSense CTHRC1 226 Sense RGS16 227 Sense FBLN1 228 Sense SPP1 229 Sense CTSB 230 Sense SPP1 231 Sense SDC1 232 Sense PLAU 233 Sense PDGFRA 234 Sense SERPINF1 235 Sense BGN 236 Sense COL6A3 237 AntiSense C3 238 AntiSense C3 239 AntiSense SPP1 240 AntiSense HLA-DQA1 241 AntiSense GAS 1 242 Sense VCAN 243 AntiSense --- 244 Sense IGHG4 /// IGHG2 /// IGHG1 /// IGHGP 245 Sense IGHG2 246 Sense C3orf26 247 AntiSense ATF3 248 AntiSense ATF3 249 AntiSense SULF1 250 Sense FN1 251 AntiSense CALD1 252 AntiSense CALD1 253 Sense TMEM49 254 Sense TMEM49 255 Sense CHD5 256 AntiSense EGR1 257 AntiSense SNAI2 258 AntiSense ITPRIPL2 259 AntiSense GABBR1 /// UBD 260 AntiSense GABBR1 /// UBD 261 AntiSense TWIST1 262 AntiSense TWIST1 263 AntiSense BATF2 264 AntiSense NFKBIZ 265 Sense C3orf26 266 AntiSense LOXL1 267 Sense --- 268 AntiSense TIMP2 269 AntiSense FN1 270 AntiSense COL1A1 271 AntiSense DCN 272 Sense TREH 273 AntiSense UBE2L6 274 AntiSense APOL1 275 AntiSense BIRC3 276 AntiSense BIRC3 277 Sense LILRB4 278 Sense FGD2 279 Sense TMEM49 280 Sense NCF4 281 Sense COL10A1 282 Sense GAL3ST4 283 Sense HCK 284 Sense TAGLN 285 Sense TWIST1 286 Sense HCLS1 287 Sense LPAR6 288 Sense ITGB2 289 Sense LST1 290 Sense HLA-B 291 Sense C17orf91 292 Sense ZC3H12A 293 Sense KLF10 294 Sense BASP1 295 Sense BASP1 Table 1B: Genes in Clusters of Figure 6 SEQ NO: Orientation Gene Symbol 2 Sense (Fully Exonic) PDGFC 3 Sense (Fully Exonic) TGFB3 4 Sense (Fully Exonic) RAC2 5 Sense (Fully Exonic) MARCKS 6 Sense (Fully Exonic) ALOX5 7 Sense (Fully Exonic) COL8A1 11 Sense (Fully Exonic) KCNAB2 12 Sense (Fully Exonic) THBS1 14 Sense (Fully Exonic) CTGF 15 Sense (Fully Exonic) CTGF 16 Sense (Fully Exonic) VCAN 18 Sense (Fully Exonic) IGKC 19 Sense (Fully Exonic) IGKC 21 Sense (includes Intronic) NFATC1 22 Sense (Fully Exonic) HMHA1 23 Sense (Fully Exonic) FCGR1B 24 Sense (Fully Exonic) EDA2R 25 Sense (Fully Exonic) COL8A1 26 Sense (Fully Exonic) COL12A1 27 Sense (Fully Exonic) HLA-B 28 Sense HLA-F 37 Sense (Fully Exonic) EGR1 40 Sense (Fully Exonic) SULF2 41 Sense (Fully Exonic) CERCAM 42 Sense (Fully Exonic) ATF3 43 Sense (Fully Exonic) MIR21 45 Sense (Fully Exonic) IFIT2 47 Sense (Fully Exonic) IGLC3 48 Sense (Fully Exonic) IGLC3 49 Sense (Fully Exonic) IGLC3 50 Sense (Fully Exonic) IGLC3 51 Sense (Fully Exonic) IGLC3 54 Sense (Fully Exonic) IGLC3 55 Sense (Fully Exonic) ANGPTL2 56 Sense (Fully Exonic) COL5A2 58 Sense (Fully Exonic) THY1 59 Sense (Fully Exonic) NDN 60 Sense (Fully Exonic) RGS2 61 Sense (Fully Exonic) MEIS3P2 62 Sense (Fully Exonic) GBP2 65 Sense (Fully Exonic) FAT1 66 Sense (Fully Exonic) COL1A1 68 Sense (Fully Exonic) MMP11 69 Sense (Fully Exonic) GADD45B 71 Sense (Fully Exonic) MMP14 72 Sense (Fully Exonic) IGHG4 80 Sense (Fully Exonic) HCLS1 83 No Transcript match 84 Sense (Fully Exonic) JAM3 86 Sense (Fully Exonic) TMEM49 87 Sense (Fully Exonic) LTBP2 88 Sense (Fully Exonic) IRS1 90 Sense (Fully Exonic) C17orf91 91 Sense (Fully Exonic) GPNMB 92 Sense (Fully Exonic) FAM198B 95 Sense (Fully Exonic) CHST15 97 Sense (Fully Exonic) DCN 98 Sense (Fully Exonic) VCAM1 105 Sense (Fully Exonic) CIITA 106 Sense (Fully Exonic) GAS7 107 Sense (Fully Exonic) COL3A1 110 Sense (Fully Exonic) ITGB2 111 Sense (Fully Exonic) ELN 112 Sense (Fully Exonic) CMTM3 113 Sense (Fully Exonic) ANTXR1 118 Sense (Fully Exonic) IL4I1 119 Sense (Fully Exonic) ANTXR2 120 Sense (Fully Exonic) IGLC2 /// IGLC3 123 Sense (Fully Exonic) IGLC3 124 Sense (Fully Exonic) BST2 126 Sense (Fully Exonic) COL10A1 127 Sense (Fully Exonic) IGLC3 128 Sense (Fully Exonic) FBP1 129 Sense (Fully Exonic) RHOBTB3 131 Sense (Fully Exonic) CD74 132 Sense (Fully Exonic) ISM1 135 Sense (Fully Exonic) CSRNP1 138 Sense (Fully Exonic) DCN 139 Sense (Fully Exonic) IGFBP4 143 Sense (Fully Exonic) CCDC80 148 Sense (Fully Exonic) COL3A1 150 Sense (Fully Exonic) ZFP36 151 Sense (Fully Exonic) MMP11 152 Sense (Fully Exonic) COL1A2 153 Sense (Fully Exonic) HLA-DPA1 154 Sense (Fully Exonic) TWIST1 155 Sense (Fully Exonic) ZNF154 157 Sense (Fully Exonic) IGLC3 159 Sense (Fully Exonic) IGKC 160 Sense (Fully Exonic) IGHG1 162 Sense (Fully Exonic) COL1A2 163 Sense (Fully Exonic) APOC1 167 AntiSense EGR1 171 Sense (Fully Exonic) KIAA0146 174 Sense (Fully Exonic) TPM1 176 Sense (includes Intronic) DMD 180 No Transcript match 181 Sense (Fully Exonic) DUSP1 182 Sense (Fully Exonic) GBP1 185 Sense (includes Intronic) PDGFC 186 Sense (includes Intronic) MSN 188 Sense (includes Intronic) TPM1 189 Sense (Fully Exonic) EMB 191 Sense (Fully Exonic) FOS 195 Sense (includes Intronic) DPYSL3 197 AntiSense EGR1 198 AntiSense NRP2 201 Sense (Fully Exonic) MMP2 204 Sense (Fully Exonic) CTGF 211 Sense (Fully Exonic) ACTA2 213 Sense (Fully Exonic) LOXL1 216 Sense (Fully Exonic) CDH11 218 Sense (Fully Exonic) LUM 219 Sense (Fully Exonic) NNMT 222 Sense (Fully Exonic) GJA1 225 AntiSense CTHRC1 229 Sense (Fully Exonic) CTSB 232 Sense (Fully Exonic) PLAU 233 Sense (Fully Exonic) PDGFRA 242 Sense (Fully Exonic) VCAN 243 AntiSense -- 244 Sense (Fully Exonic) IGHG4 /// IGHG2 /// IGHG1 ///I GHGP 245 Sense (Fully Exonic) IGHG2 246 Sense (includes Intronic) C3orf26 247 AntiSense ATF3 248 AntiSense ATF3 250 Sense (Fully Exonic) FN1 251 AntiSense CALD1 252 AntiSense CALD1 256 AntiSense EGR1 261 AntiSense TWIST1 262 AntiSense TWIST1 263 AntiSense BATF2 264 AntiSense NFKBIZ 265 Sense (includes Intronic) C3orf26 266 AntiSense LOXL1 267 Sense (includes Intronic) -- 269 AntiSense FN1 270 AntiSense COL1A1 272 Sense (Fully Exonic) TREH 274 AntiSense APOL1 281 Sense (Fully Exonic) COL10A1 282 Sense (Fully Exonic) GAL3ST4 284 Sense (Fully Exonic) TAGLN 285 Sense (Fully Exonic) TWIST1 286 Sense (Fully Exonic) HCLS1 288 Sense (Fully Exonic) ITGB2 290 Sense (Fully Exonic) HLA-B 291 Sense (Fully Exonic) C17orf91 296 Sense (Fully Exonic) FBLIM1 297 Sense (Fully Exonic) COL15A1 298 Sense (Fully Exonic) AQP7P3 299 AntiSense IGFBP5 300 Sense (Fully Exonic) FANK1 301 AntiSense INS 302 Sense (Fully Exonic) COL27A1 303 Sense (Fully Exonic) COL5A1 304 Sense (Fully Exonic) PRICKLE2 305 Sense (Fully Exonic) N/A 306 Sense (Fully Exonic) GXYLT2 307 Sense (includes Intronic) KLF12 308 No Transcript match 309 Sense (Fully Exonic) FBXO32 310 No Transcript match 311 Sense (Fully Exonic) ASAH2B 312 AntiSense PPFIBP1 313 AntiSense XIST 314 Sense (Fully Exonic) IGFBP6 315 Sense (Fully Exonic) ROBO1 316 Sense (Fully Exonic) TPM1 317 AntiSense N/A 318 AntiSense PLEKHG 1 319 Sense (Fully Exonic) NR2F1 320 Sense (Fully Exonic) NPDC1 321 AntiSense INS 322 Sense (Fully Exonic) TRAF5 323 Sense (Fully Exonic) CALD1 324 Sense (includes Intronic) CHRM3 325 Sense (Fully Exonic) AMOTL1 326 Sense (includes Intronic) COL12A1 327 Sense (Fully Exonic) PLXNA4 328 Sense (includes Intronic) TMEM43 329 Sense (includes Intronic) RORA 330 AntiSense INS 331 Sense (Fully Exonic) TSPAN18 332 No Transcript match 333 Sense (Fully Exonic) TNC 334 Sense (Fully Exonic) TYRO3 335 AntiSense EFNA5 336 Sense (Fully Exonic) MYL9 337 Sense (Fully Exonic) MIR198 338 Sense (includes Intronic) N/A 339 Sense (includes Intronic) PLA2R1 340 Sense (Fully Exonic) COL14A1 341 Sense (Fully Exonic) NRP1 342 Sense (Fully Exonic) FSCN1 343 Sense (includes Intronic) PDGFD 344 No Transcript match 345 Sense (includes Intronic) DOCK4 346 Sense (Fully Exonic) TRIM 13 347 Sense (Fully Exonic) IGFBP5 348 Sense (Fully Exonic) C19orf63 349 AntiSense KLF6 350 AntiSense TRIO 351 Sense (Fully Exonic) COL4A1 352 Sense (Fully Exonic) EPDR1 353 Sense (Fully Exonic) FNDC1 354 Sense (Fully Exonic) IL1R1 355 Sense (Fully Exonic) CES4 356 Sense (Fully Exonic) GPR176 357 Sense (includes Intronic) GXYLT2 358 AntiSense WHSC1L1 359 Sense (Fully Exonic) N/A 360 Sense (Fully Exonic) RGN 361 Sense (includes Intronic) CA3 362 Sense (Fully Exonic) TIMP3 363 Sense (Fully Exonic) EFNA5 364 Sense (Fully Exonic) RASGRF2 365 Sense (includes Intronic) RELL1 366 AntiSense ACSS3 367 Sense (Fully Exonic) STMN3 368 Sense (Fully Exonic) N/A 369 AntiSense C7orf29 370 Sense (Fully Exonic) HOXC6 371 Sense (Fully Exonic) KLF8 372 Sense (includes Intronic) SERINC5 373 Sense (Fully Exonic) AKT3 374 Sense (Fully Exonic) TGFB2 375 AntiSense WNT5A 376 No Transcript match 377 No Transcript match 378 AntiSense IGFBP7 379 No Transcript match 380 Sense (includes Intronic) SULT1C4 381 Sense (Fully Exonic) AASS 382 Sense (Fully Exonic) HEPH 383 Sense (Fully Exonic) ADH5 384 Sense (Fully Exonic) TIMP2 385 Sense (Fully Exonic) EMP1 386 Sense (Fully Exonic) CXCL14 387 Sense (Fully Exonic) ZNF548 388 Sense (Fully Exonic) SGCB 389 Sense (includes Intronic) ASH2L 390 Sense (includes Intronic) SERINC5 391 No Genome match 392 Sense (Fully Exonic) TMEM159 393 Sense (includes Intronic) RBMS3 394 Sense (Fully Exonic) TMEM49 395 Sense (includes Intronic) RORA 396 No Transcript match 397 AntiSense ZNF608 398 No Genome match 399 Sense (Fully Exonic) ADAMTS2 400 Sense (Fully Exonic) APCDD1 401 AntiSense GXYLT2 402 Sense (Fully Exonic) XIST 403 Sense (Fully Exonic) MBNL2 404 Sense (Fully Exonic) SHF 405 Sense (includes Intronic) APBB2 406 No Transcript match 407 Sense (Fully Exonic) COL14A1 408 Sense (Fully Exonic) IGFBP5 409 Sense (Fully Exonic) CREB5 410 AntiSense INS 411 Sense (Fully Exonic) BAHCC1 412 Sense (Fully Exonic) RFXAP 413 Sense (Fully Exonic) INS 414 Sense (Fully Exonic) DDR2 415 Sense (Fully Exonic) CA12 416 Sense (Fully Exonic) RHOB 417 Sense (Fully Exonic) N/A 418 Sense (Fully Exonic) SNORD116-4 419 Sense (Fully Exonic) MEG3 420 Sense (Fully Exonic) WNT4 421 Sense (Fully Exonic) FBLN2 422 AntiSense DAAM1 423 No Transcript match 424 Sense (Fully Exonic) CHN1 425 Sense (includes Intronic) APBB2 426 Sense (Fully Exonic) PTRF 427 AntiSense IGF1 428 Sense (Fully Exonic) UST 429 Sense (Fully Exonic) SMARCA1 430 Sense (includes Intronic) N/A 431 Sense (Fully Exonic) IGLC3 432 AntiSense INS 433 Sense (Fully Exonic) KANK4 434 AntiSense IGF1 435 Sense (Fully Exonic) CYP27A1 436 AntiSense EIF2B5 437 No Transcript match 438 Sense (Fully Exonic) SNRNP25 439 Sense (Fully Exonic) SETD7 440 Sense (Fully Exonic) MSX1 441 Sense (Fully Exonic) HOPX 442 Sense (Fully Exonic) NID2 443 Sense (Fully Exonic) IGF1 444 Sense (Fully Exonic) PSD3 445 Sense (Fully Exonic) FGFR1 446 Sense (Fully Exonic) ETV1 447 Sense (Fully Exonic) ZNF655 448 No Genome match 449 AntiSense INS 450 Sense (Fully Exonic) SFRP2 451 Sense (Fully Exonic) SPAG16 452 AntiSense NR2F2 453 Sense (includes Intronic) SYNPO2 454 Sense (Fully Exonic) FAM101B 455 AntiSense IGF2 456 Sense (Fully Exonic) CA3 457 Sense (Fully Exonic) XIST 458 No Transcript match 459 Sense (Fully Exonic) WNT7A 460 Sense (includes Intronic) N/A 461 Sense (Fully Exonic) FGFR1 462 AntiSense FXYD6 463 Sense (Fully Exonic) FGFR1 464 Sense (includes Intronic) IGFBP7 465 Sense (Fully Exonic) TIMP2 466 Sense (Fully Exonic) DUSP1 467 Sense (includes Intronic) SERINC5 468 No Transcript match 469 Sense (Fully Exonic) ABLIM1 470 Sense (Fully Exonic) ARL4A 471 AntiSense SH3TC2 472 AntiSense NR2F2 473 Sense (Fully Exonic) ENG 474 Sense (Fully Exonic) MGP 475 Sense (Fully Exonic) MEG3 476 AntiSense FAM115A 477 Sense (Fully Exonic) EGR1 478 Sense (Fully Exonic) SNORD116-3 479 Sense (Fully Exonic) AEBP1 480 Sense (includes Intronic) SDK1 481 Sense (Fully Exonic) ENC1 482 Sense (Fully Exonic) SNORD116-7 483 Sense (Fully Exonic) N/A 484 Sense (Fully Exonic) APOD 485 AntiSense N/A 486 AntiSense GAS 1 487 Sense (Fully Exonic) VPS36 488 No Transcript match 489 Sense (Fully Exonic) SPHK2 490 Sense (Fully Exonic) SNORD116-8 491 Sense (Fully Exonic) MYO10 492 Sense (Fully Exonic) HOXC6 493 Sense (Fully Exonic) RNF149 494 Sense (Fully Exonic) BTG2 495 Sense (includes Intronic) MAP3K1 496 Sense (Fully Exonic) SNORD116-23 497 Sense (includes Intronic) ACSL4 498 Sense (Fully Exonic) CYP27C1 499 Sense (includes Intronic) COL12A1 500 Sense (Fully Exonic) IGFBP5 501 Sense (Fully Exonic) DUSP4 502 Sense (Fully Exonic) PFKFB3 503 Sense (Fully Exonic) SDC2 504 AntiSense FXYD6 505 Sense (Fully Exonic) COL5A1 506 Sense (Fully Exonic) MARCKS 507 Sense (Fully Exonic) IRS2 508 Sense (Fully Exonic) N/A 509 AntiSense FSCN1 510 Sense (Fully Exonic) FYN 511 Sense (Fully Exonic) IGFBP5 512 Sense (Fully Exonic) NUDT4P1 513 Sense (Fully Exonic) NFKBIZ 514 Sense (Fully Exonic) N/A 515 Sense (Fully Exonic) C7orf41 516 Sense (Fully Exonic) MEG3 517 Sense (Fully Exonic) N/A 518 Sense (Fully Exonic) PLEKHG 1 519 Sense (Fully Exonic) ZNF827 520 Sense (Fully Exonic) ZNF175 521 Sense (Fully Exonic) XIST 522 Sense (includes Intronic) GSN 523 Sense (includes Intronic) RORA 524 Sense (Fully Exonic) CA13 525 AntiSense TMX4 526 Sense (Fully Exonic) KIT 527 Sense (includes Intronic) WDR78 528 Sense (Fully Exonic) ECEL1 529 Sense (Fully Exonic) XIST 530 Sense (Fully Exonic) PROCR 531 Sense (Fully Exonic) C9orf167 532 Sense (Fully Exonic) MUC6 533 Sense (includes Intronic) P4HA2 534 Sense (Fully Exonic) FAM69C 535 Sense (Fully Exonic) NOX4 536 Sense (includes Intronic) N/A 537 No Transcript match 538 Sense (Fully Exonic) SMOX 539 Sense (Fully Exonic) KIAA0922 540 No Transcript match 541 Sense (Fully Exonic) XIST 542 Sense (Fully Exonic) NPAS2 543 Sense (Fully Exonic) NAV1 544 Sense (includes Intronic) N/A 545 Sense (Fully Exonic) HLA-A 546 Sense (Fully Exonic) FAM46C 547 Sense (Fully Exonic) N/A 548 Sense (Fully Exonic) SLAMF7 549 Sense (Fully Exonic) FCER1G 550 Sense (Fully Exonic) C1S 551 Sense (Fully Exonic) NUPR1 552 AntiSense C1QC 553 AntiSense SAT1 554 Sense (Fully Exonic) SOD2 555 Sense (Fully Exonic) IRF1 556 Sense (Fully Exonic) SFN 557 AntiSense LTB 558 Sense (Fully Exonic) ARID5A 559 Sense (Fully Exonic) BST2 560 Sense (Fully Exonic) HLA-F 561 Sense (Fully Exonic) XAF1 562 Sense (Fully Exonic) TCOF1 563 Sense (Fully Exonic) RPL23AP1 564 Sense (Fully Exonic) IL1RN 565 Sense (Fully Exonic) IFIT5 566 Sense (Fully Exonic) B2M 567 AntiSense GBP1 568 Sense (Fully Exonic) HLA-F 569 Sense (Fully Exonic) DGKA 570 Sense (Fully Exonic) XBP1 571 Sense (Fully Exonic) PLCG2 572 Sense (Fully Exonic) FAM46C 573 No Genome match 574 Sense (Fully Exonic) TREM2 575 Sense (Fully Exonic) LGALS9 576 Sense (Fully Exonic) HLA-DPB1 577 AntiSense ODF3B 578 Sense (Fully Exonic) MX1 579 Sense (Fully Exonic) STAT1 580 Sense (Fully Exonic) CTSB 581 Sense (Fully Exonic) FAM26F 582 Sense (includes Intronic) PARP14 583 AntiSense SAT1 584 Sense (Fully Exonic) CTSS 585 No Transcript match 586 Sense (Fully Exonic) CTSB 587 Sense (Fully Exonic) ADAM8 588 Sense (includes Intronic) B2M 589 Sense (Fully Exonic) FLVCR2 590 Sense (Fully Exonic) TYROBP 591 AntiSense SAMD9L 592 Sense (Fully Exonic) SAMD9L 593 Sense (Fully Exonic) SIGLEC1 594 Sense (Fully Exonic) MMP7 595 Sense (Fully Exonic) APOL1 596 Sense (Fully Exonic) CYLD 597 Sense (Fully Exonic) HLA-B 598 Sense (Fully Exonic) SAT1 599 Sense (Fully Exonic) C1QB 600 Sense (Fully Exonic) HLA-DMB 601 Sense (Fully Exonic) NLRC5 602 Sense (Fully Exonic) FAM20A 603 AntiSense N/A 604 Sense (Fully Exonic) STAT1 605 Sense (includes Intronic) STAT1 606 Sense (Fully Exonic) STAT1 607 AntiSense N/A 608 Sense (Fully Exonic) DERL3 609 Sense (Fully Exonic) HLA-F 610 Sense (Fully Exonic) MAFB 611 Sense (Fully Exonic) CD4 612 Sense (Fully Exonic) HLA-A 613 Sense (Fully Exonic) UBE2L6 614 Sense (Fully Exonic) C1QC 615 Sense (Fully Exonic) CD163 616 Sense (Fully Exonic) LRMP 617 Sense (Fully Exonic) C11orf17 618 Sense (Fully Exonic) XAF1 619 Sense (Fully Exonic) GLRX 620 Sense (Fully Exonic) IFIH1 621 Sense (Fully Exonic) CD44 622 Sense (Fully Exonic) LITAF 623 Sense (Fully Exonic) CCDC69 624 Sense (Fully Exonic) GBP5 625 Sense (Fully Exonic) PML 626 Sense (Fully Exonic) SAMD9 627 Sense (Fully Exonic) CBR3 628 Sense (Fully Exonic) RASGRP2 629 Sense (Fully Exonic) FCGR2A 630 Sense (Fully Exonic) BST2 631 Sense (Fully Exonic) HLA-A Table 1C: Angiogenesis and immune response cluster genes of Figs 11A and 11B SEQ No. ER group Gene Symbol Orientation 632 ER pos STAT1 Sense (Fully Exonic) 709 ER pos STAT1 Sense (Fully Exonic) 803 ER neg HOXD3 Sense (includes Intronic) 804 ER neg LCP1 Sense (Fully Exonic) 875 ER neg SPON1 Sense (Fully Exonic) 633 ER pos IGF1 Sense (Fully Exonic) 805 ER neg FHL1 Sense (Fully Exonic) 806 ER neg MS4A1 Sense (Fully Exonic) 876 ER neg FN1 Sense (Fully Exonic) 710 ER pos FN1 Sense (Fully Exonic) 634 ER pos HLA-DPA1 Sense (Fully Exonic) 877 ER neg ADAM12 Sense (Fully Exonic) 711 ER pos ITGBL1 Sense (Fully Exonic) 712 ER pos POSTN Sense (Fully Exonic) 635 ER pos IGKV3-20 /// IGKV3D-20 AntiSense 748 ER neg,ER pos DDX58 Sense (Fully Exonic) 636 ER pos SLAMF7 Sense (Fully Exonic) 878 ER neg AGPAT4 Sense (Fully Exonic) 959 ER neg,ER pos FAM46C Sense (Fully Exonic) 713 ER pos GXYLT2 Sense (includes Intronic) 714 ER pos SNX5 Sense (Fully Exonic) 637 ER pos No Genome match 879 ER neg PRICKLE 1 Sense (Fully Exonic) 922 ER neg,ER pos IL7R Sense (Fully Exonic) 750 ER neg,ER pos CMPK2 Sense (Fully Exonic) 638 ER pos KLHL36 Sense (Fully Exonic) 807 ER neg CD274 Sense (Fully Exonic) 880 ER neg NRP2 AntiSense 924 ER neg,ER pos POSTN Sense (includes Intronic) 639 ER pos CAMK2N1 AntiSense 881 ER neg COL1A2 Sense (Fully Exonic) 715 ER pos N/A AntiSense 716 ER pos No Transcript match 717 ER pos COL12A1 Sense (Fully Exonic) 640 ER pos MIR143 Sense (Fully Exonic) 808 ER neg No Genome match 960 ER neg,ER pos DNM3 AntiSense 718 ER pos BNC2 Sense (includes Intronic) 641 ER pos BCL11B Sense (includes Intronic) 809 ER neg CYBB Sense (Fully Exonic) 882 ER neg COL12A1 Sense (Fully Exonic) 642 ER pos OR2I1P AntiSense 752 ER neg,ER pos EPSTI1 Sense (Fully Exonic) 926 ER neg,ER pos GXYLT2 Sense (Fully Exonic) 643 ER pos SAMD9L Sense (Fully Exonic) 810 ER neg SLC2A3 Sense (Fully Exonic) 927 ER neg,ER pos IGKJ3 /// IGKJ4 Sense (Fully Exonic) 644 ER pos THBS1 Sense (Fully Exonic) 811 ER neg GLUL Sense (Fully Exonic) 812 ER neg No Transcript match 813 ER neg THSD7A Sense (includes Intronic) 928 ER neg,ER pos COL11A1 Sense (Fully Exonic) 645 ER pos No Transcript match 814 ER neg SPP1 AntiSense 815 ER neg TIMP3 Sense (Fully Exonic) 883 ER neg FBN1 Sense (Fully Exonic) 646 ER pos IGFBP5 Sense (Fully Exonic) 816 ER neg IKZF1 Sense (Fully Exonic) 817 ER neg CTGF AntiSense 884 ER neg COL5A2 AntiSense 647 ER pos PALMD Sense (Fully Exonic) 818 ER neg IGKV4-1 Sense (Fully Exonic) 756 ER neg,ER pos N/A Sense (Fully Exonic) 648 ER pos NLRC3 Sense (Fully Exonic) 819 ER neg TNFRSF13B Sense (Fully Exonic) 885 ER neg APOC1 Sense (Fully Exonic) 649 ER pos ELN Sense (Fully Exonic) 757 ER neg,ER pos No Genome match 650 ER pos ELN Sense (Fully Exonic) 758 ER neg,ER pos IGKC Sense (Fully Exonic) 651 ER pos CIITA Sense (Fully Exonic) 788 ER neg,ER pos CCR7 Sense (Fully Exonic) 719 ER pos STAT1 Sense (Fully Exonic) 720 ER pos SDC1 Sense (Fully Exonic) 721 ER pos ISG15 Sense (Fully Exonic) 722 ER pos APOC1 Sense (Fully Exonic) 652 ER pos INS /// IGF2 Sense (Fully Exonic) 820 ER neg LPL Sense (Fully Exonic) 962 ER neg,ER pos IFI27 Sense (Fully Exonic) 723 ER pos CTSK Sense (Fully Exonic) 724 ER pos PLEK Sense (Fully Exonic) 725 ER pos MIR198 Sense (Fully Exonic) 759 ER neg,ER pos IGJ AntiSense 653 ER pos PXDN Sense (Fully Exonic) 790 ER neg,ER pos ENO2 Sense (Fully Exonic) 726 ER pos CILP Sense (Fully Exonic) 726 ER neg,ER pos GBP4 Sense (Fully Exonic) 654 ER pos GBP1 Sense (Fully Exonic) 886 ER neg SULF1 Sense (Fully Exonic) 655 ER pos EFEMP1 Sense (Fully Exonic) 761 ER neg,ER pos MX1 Sense (Fully Exonic) 656 ER pos CD109 Sense (Fully Exonic) 887 ER neg No Transcript match 762 ER neg,ER pos CXCL10 Sense (Fully Exonic) 657 ER pos FYB Sense (Fully Exonic) 791 ER neg,ER pos IFI44 Sense (Fully Exonic) 727 ER pos COL5A1 Sense (Fully Exonic) 658 ER pos TIMP3 Sense (Fully Exonic) 888 ER neg CADM1 AntiSense 659 ER pos STAT1 AntiSense 889 ER neg MXRA5 AntiSense 660 ER pos CCDC152 Sense (Fully Exonic) 821 ER neg MX1 AntiSense 890 ER neg C1QC AntiSense 792 ER neg,ER pos N/A Sense (includes Intronic) 728 ER pos FNDC1 AntiSense 661 ER pos HOXC5 /// HOXC10 AntiSense 822 ER neg GABBR1 /// UBD AntiSense 823 ER neg CYP1B1 AntiSense 824 ER neg SPP1 Sense (Fully Exonic) 824 ER neg,ER pos FYB Sense (Fully Exonic) 662 ER pos No Transcript match 825 ER neg GBP5 Sense (Fully Exonic) 937 ER neg,ER pos IGHA1 Sense (Fully Exonic) 663 ER pos CAMK2N1 Sense (Fully Exonic) 826 ER neg SASH3 Sense (Fully Exonic) 827 ER neg COL14A1 Sense (Fully Exonic) 793, ER neg,ER pos CD79A /// ARHGEF1 Sense (Fully Exonic) 729 ER pos LAIR1 Sense (Fully Exonic) 664 ER pos APOBEC3G Sense (Fully Exonic) 828 ER neg GPX8 Sense (Fully Exonic) 829 ER neg RTP4 Sense (Fully Exonic) 830 ER neg IFIH1 Sense (Fully Exonic) 891 ER neg IFI6 Sense (Fully Exonic) 730 ER pos IFI6 Sense (Fully Exonic) 665 ER pos C1orf113 Sense (Fully Exonic) 831 ER neg FAM26F Sense (Fully Exonic) 832 ER neg PARP9 Sense (Fully Exonic) 833 ER neg ARHGAP9 Sense (Fully Exonic) 765 ER neg,ER pos FNDC1 Sense (Fully Exonic) 666 ER pos C13orf33 Sense (Fully Exonic) 766 ER neg,ER pos GBP5 Sense (Fully Exonic) 667 ER pos VNN2 Sense (Fully Exonic) 892 ER neg RSAD2 Sense (Fully Exonic) 668 ER pos PTPRC Sense (Fully Exonic) 893 ER neg LRRC15 Sense (Fully Exonic) 731 ER pos CTHRC1 Sense (Fully Exonic) 669 ER pos SMARCA1 Sense (Fully Exonic) 894 ER neg STAT1 Sense (Fully Exonic) 767 ER neg,ER pos IGJ Sense (Fully Exonic) 670 ER pos DACT3 Sense (Fully Exonic) 834 ER neg PHLDB2 Sense (Fully Exonic) 967 ER neg,ER pos IL2RG Sense (Fully Exonic) 732 ER pos C1orf162 Sense (Fully Exonic) 768 ER neg,ER pos CECR1 Sense (Fully Exonic) 671 ER pos BTN3A2 /// BTN3A3 Sense (Fully Exonic) 835 ER neg CES1 /// CES4 Sense (Fully Exonic) 836 ER neg TBC1D10C Sense (Fully Exonic) 837 ER neg CCDC80 Sense (Fully Exonic) 895 ER neg GAS7 Sense (Fully Exonic) 672 ER pos LPL Sense (Fully Exonic) 896 ER neg CD163 Sense (Fully Exonic) 795 ER neg,ER pos LYZ Sense (Fully Exonic) 733 ER pos NAPSB Sense (Fully Exonic) 673 ER pos OAS2 Sense (Fully Exonic) 769 ER neg,ER pos ZNF469 Sense (Fully Exonic) 674 ER pos KIF26A Sense (Fully Exonic) 770 ER neg,ER pos IGHG1 /// IGHG2 /// IGHG3 Sense (Fully Exonic) 675 ER pos N/A Sense (Fully Exonic) 838 ER neg DDX60L Sense (Fully Exonic) 839 ER neg SCD5 Sense (Fully Exonic) 840 ER neg ANPEP Sense (Fully Exonic) 841 ER neg FABP4 Sense (Fully Exonic) 771 ER neg,ER pos IL10RA Sense (Fully Exonic) 676 ER pos CXCL10 Sense (Fully Exonic) 897 ER neg APOC1 Sense (Fully Exonic) 677 ER pos APOD Sense (Fully Exonic) 842 ER neg APOD Sense (Fully Exonic) 843 ER neg DST Sense (Fully Exonic) 772 ER neg,ER pos CD2 Sense (Fully Exonic) 678 ER pos CD22 Sense (Fully Exonic) 844 ER neg CD52 Sense (Fully Exonic) 898 ER neg CTSK Sense (Fully Exonic) 773, ER neg,ER pos CCR7 Sense (Fully Exonic) 679 ER pos CTGF Sense (Fully Exonic) 899 ER neg EDN2 Sense (Fully Exonic) 680 ER pos EGR1 Sense (Fully Exonic) 845 ER neg ENO2 Sense (Fully Exonic) 900 ER neg IFI6 Sense (Fully Exonic) 681 ER pos HLA-DOA Sense (Fully Exonic) 846 ER neg TNC Sense (Fully Exonic) 847 ER neg IDO1 Sense (Fully Exonic) 848 ER neg ID1 Sense (Fully Exonic) 901 ER neg IRF1 Sense (Fully Exonic) 774, ER neg,ER pos ITGAL Sense (Fully Exonic) 682 ER pos KRT81 Sense (Fully Exonic) 902 ER neg LUM Sense (Fully Exonic) 734 ER pos MFAP2 Sense (Fully Exonic) 683 ER pos CXCL9 Sense (Fully Exonic) 775, ER neg,ER pos MMP13 Sense (Fully Exonic) 684 ER pos MSX1 Sense (Fully Exonic) 903 ER neg MX1 Sense (Fully Exonic) 685 ER pos TWIST 1 Sense (Fully Exonic) 904 ER neg OAS2 Sense (Fully Exonic) 686 ER pos PIK3CG Sense (Fully Exonic) 905 ER neg PLAU Sense (Fully Exonic) 735 ER pos COL10A1 Sense (Fully Exonic) 687 ER pos PSMB9 Sense (Fully Exonic) 849 ER neg FBP1 Sense (Fully Exonic) 850 ER neg PTN Sense (Fully Exonic) 776 ER neg,ER pos RAC2 Sense (Fully Exonic) 688 ER pos CCL5 Sense (Fully Exonic) 851 ER neg CCL5 Sense (Fully Exonic) 852 ER neg CCL21 Sense (Fully Exonic) 906 ER neg THBS2 Sense (Fully Exonic) 689 ER pos TAP1 Sense (Fully Exonic) 853 ER neg IGFBP5 Sense (Fully Exonic) 854 ER neg IGF2 Sense (Fully Exonic) 855 ER neg SELL Sense (Fully Exonic) 777, ER neg,ER pos GJB2 Sense (Fully Exonic) 690 ER pos F2RL2 Sense (Fully Exonic) 907 ER neg VCAN Sense (Fully Exonic) 691 ER pos ALDH1A3 Sense (Fully Exonic) 856 ER neg EGR3 Sense (Fully Exonic) 796 ER neg,ER pos MMP2 Sense (Fully Exonic) 736 ER pos MMP2 Sense (Fully Exonic) 778 ER neg,ER pos SPOCK1 Sense (Fully Exonic) 797 ER neg,ER pos SPOCK1 Sense (Fully Exonic) 737 ER pos COL1A1 Sense (Fully Exonic) 692 ER pos SPARCL1 Sense (Fully Exonic) 857 ER neg CD3D Sense (Fully Exonic) 798 ER neg,ER pos CD3E Sense (Fully Exonic) 738 ER pos COL3A1 Sense (Fully Exonic) 693 ER pos CXCL14 Sense (Fully Exonic) 908 ER neg ADAMTS4 Sense (Fully Exonic) 779 ER neg,ER pos NCKAP1L Sense (Fully Exonic) 694 ER pos CALCOCO2 Sense (Fully Exonic) 909 ER neg MMP11 Sense (Fully Exonic) 695 ER pos TRIM22 Sense (Fully Exonic) 910 ER neg OAS3 Sense (Fully Exonic) 739 ER pos OAS3 Sense (Fully Exonic) 696 ER pos POU2AF1 Sense (Fully Exonic) 780 ER neg,ER pos GABBR1 /// UBD Sense (Fully Exonic) 697 ER pos FOSB Sense (Fully Exonic) 781 ER neg,ER pos IFI44L Sense (Fully Exonic) 698 ER pos PIM2 Sense (Fully Exonic) 858 ER neg KLRK1 Sense (Fully Exonic) 859 ER neg TAGLN Sense (Fully Exonic) 860 ER neg CD36 Sense (Fully Exonic) 861 ER neg CYP27C1 Sense (Fully Exonic) 862 ER neg PDLIM3 Sense (Fully Exonic) 911 ER neg RNF144A Sense (Fully Exonic) 782 ER neg,ER pos SPOCK2 Sense (Fully Exonic) 699 ER pos FAM19A5 Sense (Fully Exonic) 863 ER neg ABI3BP Sense (Fully Exonic) 912 ER neg TMEM158 Sense (Fully Exonic) 700 ER pos CCDC69 Sense (Fully Exonic) 913 ER neg C1QA Sense (Fully Exonic) 701 ER pos ETV7 Sense (Fully Exonic) 914 ER neg N/A Sense (Fully Exonic) 702 ER pos USP18 Sense (Fully Exonic) 915 ER neg XAF1 Sense (Fully Exonic) 703 ER pos PARP14 Sense (Fully Exonic) 916 ER neg SAMD9 Sense (Fully Exonic) 740 ER pos ASPN Sense (Fully Exonic) 704 ER pos FAM46C Sense (Fully Exonic) 864 ER neg PINX1 Sense (Fully Exonic) 865 ER neg GIMAP4 Sense (Fully Exonic) 866 ER neg N/A Sense (includes Intronic) 917 ER neg COL3A1 Sense (Fully Exonic) 741 ER pos COL1A2 Sense (Fully Exonic) 799 ER neg,ER pos IGHG1 AntiSense 742 ER pos FN1 AntiSense 800 ER neg,ER pos RAC2 Sense (Fully Exonic) 743 ER pos GLRX Sense (Fully Exonic) 744 ER pos BIRC3 AntiSense 783 ER neg,ER pos TAP1 Sense (Fully Exonic) 957 ER neg,ER pos POSTN Sense (Fully Exonic) 705 ER pos THBS1 AntiSense 867 ER neg TNFAIP8 AntiSense 958 ER neg,ER pos N/A Sense (Fully Exonic) 974 ER neg,ER pos IGJ Sense (Fully Exonic) 745 ER pos ADAM12 Sense (Fully Exonic) 706 ER pos COL14A1 Sense (Fully Exonic) 868 ER neg No Transcript match 869 ER neg CD53 Sense (Fully Exonic) 918 ER neg MIR1245 Sense (Fully Exonic) 707 ER pos No Genome match 919 ER neg No Transcript match 708 ER pos TNFSF10 Sense (Fully Exonic) 870 ER neg NLRC5 Sense (Fully Exonic) 871 ER neg WWC2 Sense (includes Intronic) 872 ER neg RORA AntiSense 873 ER neg IGKV4-1 AntiSense 874 ER neg No Genome match 975 ER neg,ER pos MIAT Sense (Fully Exonic) 746 ER pos COL8A1 Sense (Fully Exonic) 747 ER neg,ER pos IFI44 Sense (Fully Exonic) - The following methods may be used to derive expression signatures for distinguishing between subjects that are responsive or non-responsive to anti-angiogenic therapeutics, or as prognostic indicators of certain cancer types, including expression signatures derived from the biomarkers disclosed above. In certain other exemplary embodiments, the expression signature is derived using a decision tree (Hastie et al. The Elements of Statistical Learning, Springer, New York 2001), a random forest (Breiman, 2001 Random Forests, Machine Learning 45:5), a neural network (Bishop, Neural Networks for Pattern Recognition, Clarendon Press, Oxford 1995), discriminant analysis (Duda et al. Pattern Classification, 2nd ed., John Wiley, New York 2001), including, but not limited to linear, diagonal linear, quadratic and logistic discriminant analysis, a Prediction Analysis for Microarrays (PAM, (Tibshirani et al., 2002, Proc. Natl. Acad. Sci. USA 99:6567-6572)) or a Soft Independent Modeling of Class Analogy analysis. (SIMCA, (Wold, 1976, Pattern Recogn. 8:127-139)).
- Biomarker expression values may be defined in combination with corresponding scalar weights on the real scale with varying magnitude, which are further combined through linear or non-linear, algebraic, trigonometric or correlative means into a single scalar value via an algebraic, statistical learning, Bayesian, regression, or similar algorithms which together with a mathematically derived decision function on the scalar value provide a predictive model by which expression profiles from samples may be resolved into discrete classes of responder or non-responder, resistant or non-resistant, to a specified drug, drug class, or treatment regimen. Such predictive models, including biomarker membership, are developed by learning weights and the decision threshold, optimized for sensitivity, specificity, negative and positive predictive values, hazard ratio or any combination thereof, under cross-validation, bootstrapping or similar sampling techniques, from a set of representative expression profiles from historical patient samples with known drug response and/or resistance.
- In one embodiment, the biomarkers are used to form a weighted sum of their signals, where individual weights can be positive or negative. The resulting sum ("expression score") is compared with a pre-determined reference point or value. The comparison with the reference point or value may be used to diagnose, or predict a clinical condition or outcome.
- As described above, one of ordinary skill in the art will appreciate that the biomarkers included in the classifier provided in Tables 1A, 1B, and Table 1C will carry unequal weights in a classifier for responsiveness or resistance to a therapeutic agent. Therefore, while as few as one sequence may be used to diagnose or predict an outcome such as responsiveness to therapeutic agent, the specificity and sensitivity or diagnosis or prediction accuracy may increase using more sequences.
- As used herein, the term "weight" refers to the relative importance of an item in a statistical calculation. The weight of each biomarker in a gene expression classifier may be determined on a data set of patient samples using analytical methods known in the art. As used herein the term "bias" or "offset" refers to a constant term derived using the mean expression of the signatures genes in a training set and is used to mean-center the each gene analyzed in the test dataset.
- In certain exemplary embodiments, the expression signature is defined by a decision function. A decision function is a set of weighted expression values derived using a linear classifier. All linear classifiers define the decision function using the following equation:

- All measurement values, such as the microarray gene expression intensities xi, for a certain sample are collected in a vector x. Each intensity is then multiplied with a corresponding weight wi to obtain the value of the decision function f(x) after adding an offset term b. In deriving the decision function, the linear classifier will further define a threshold value that splits the gene expression data space into two disjoint halves. Exemplary linear classifiers include but are not limited to partial least squares (PLS), (Nguyen et al., Bioinformatics 18 (2002) 39-50), support vector machines (SVM) (Schölkopf et al., Learning with Kernels, MIT Press, Cambridge 2002), and shrinkage discriminant analysis (SDA) (Ahdesmäki et al., Annals of applied )). In one exemplary embodiment, the linear classifier is a PLS linear classifier.
- The decision function is empirically derived on a large set of training samples, for example from patients showing responsiveness or resistance to a therapeutic agent. The threshold separates a patient group based on different characteristics such as, but not limited to, responsiveness/non-responsiveness to treatment. The interpretation of this quantity, i.e. the cut-off threshold responsiveness or resistance to a therapeutic agent, is derived in the development phase ("training") from a set of patients with known outcome. The corresponding weights and the responsiveness/resistance cut-off threshold for the decision score are fixed a priori from training data by methods known to those skilled in the art. In one exemplary embodiment, Partial Least Squares Discriminant Analysis (PLS-DA) is used for determining the weights. (L. Ståhle, S. Wold, J. Chemom. 1 (1987) 185-196; D. V. Nguyen, D.M. Rocke, Bioinformatics 18 (2002) 39-50).
- Effectively, this means that the data space, i.e. the set of all possible combinations of biomarker expression values, is split into two mutually exclusive groups corresponding to different clinical classifications or predictions, for example, one corresponding to responsiveness to a therapeutic agent and the other to non-responsiveness. In the context of the overall classifier, relative over-expression of a certain biomarker can either increase the decision score (positive weight) or reduce it (negative weight) and thus contribute to an overall decision of, for example, responsiveness or resistance to a therapeutic agent.
- In certain exemplary embodiments of the invention, the data is transformed nonlinearly before applying a weighted sum as described above. This non-linear transformation might include increasing the dimensionality of the data. The non-linear transformation and weighted summation might also be performed implicitly, for example, through the use of a kernel function. (Schölkopf et al. Learning with Kernels, MIT Press, Cambridge 2002).
- In certain exemplary embodiments, the patient training set data is derived by isolated RNA from a corresponding cancer tissue sample set and determining expression values by hybridizing the isolated RNA to a microarray. In certain exemplary embodiments, the microarray used in deriving the expression signature is a transcriptome array. As used herein a "transcriptome array" refers to a microarray containing probe sets that are designed to hybridize to sequences that have been verified as expressed in the diseased tissue of interest. Given alternative splicing and variable poly-A tail processing between tissues and biological contexts, it is possible that probes designed against the same gene sequence derived from another tissue source or biological context will not effectively bind to transcripts expressed in the diseased tissue of interest, leading to a loss of potentially relevant biological information. Accordingly, it is beneficial to verify what sequences are expressed in the disease tissue of interest before deriving a microarray probe set. Verification of expressed sequences in a particular disease context may be done, for example, by isolating and sequencing total RNA from a diseased tissue sample set and cross-referencing the isolated sequences with known nucleic acid sequence databases to verify that the probe set on the transcriptome array is designed against the sequences actually expressed in the diseased tissue of interest. Methods for making transcriptome arrays are described in United States Patent Application Publication No.
2006/0134663 . In certain exemplary embodiments, the probe set of the transcriptome array is designed to bind within 300 nucleotides of the 3' end of a transcript. Methods for designing transcriptome arrays with probe sets that bind within 300 nucleotides of the 3' end of target transcripts are disclosed in United States Patent Application Publication No.2009/0082218 . In certain exemplary embodiments, the microarray used in deriving the gene expression profiles of the present invention is the Almac Ovarian Cancer DSA™ microarray (Almac Group, Craigavon, United Kingdom). - An optimal linear classifier can be selected by evaluating a linear classifier's performance using such diagnostics as "area under the curve" (AUC). AUC refers to the area under the curve of a receiver operating characteristic (ROC) curve, both of which are well known in the art. AUC measures are useful for comparing the accuracy of a classifier across the complete data range. Linear classifiers with a higher AUC have a greater capacity to classify unknowns correctly between two groups of interest (e.g., ovarian cancer samples and normal or control samples). ROC curves are useful for plotting the performance of a particular feature (e.g., any of the biomarkers described herein and/or any item of additional biomedical information) in distinguishing between two populations (e.g., individuals responding and not responding to a therapeutic agent). Typically, the feature data across the entire population (e.g., the cases and controls) are sorted in ascending order based on the value of a single feature. Then, for each value for that feature, the true positive and false positive rates for the data are calculated. The true positive rate is determined by counting the number of cases above the value for that feature and then dividing by the total number of cases. The false positive rate is determined by counting the number of controls above the value for that feature and then dividing by the total number of controls. Although this definition refers to scenarios in which a feature is elevated in cases compared to controls, this definition also applies to scenarios in which a feature is lower in cases compared to the controls (in such a scenario, samples below the value for that feature would be counted). ROC curves can be generated for a single feature as well as for other single outputs, for example, a combination of two or more features can be mathematically combined (e.g., added, subtracted, multiplied, etc.) to provide a single sum value, and this single sum value can be plotted in a ROC curve. Additionally, any combination of multiple features, in which the combination derives a single output value, can be plotted in a ROC curve. These combinations of features may comprise a test. The ROC curve is the plot of the true positive rate (sensitivity) of a test against the false positive rate (1-specificity) of the test.
- In one instance an angiogenesis expression signature is directed to the 25 biomarkers detailed in Table 2A with corresponding ranks, weights and associated bias detailed in the table or alternative rankings, weightings and bias, depending, for example, on the disease setting. In another instance, an angiogenesis expression signature is directed to the 45 biomarkers detailed in Table 2B with corresponding ranks, weights and associated bias detailed in the table or alternative rankings, weightings and bias, depending, for example, on the disease setting. In another exemplary embodiment, a non-angiogeneis expression signature is directed to the 63 biomarkers detailed in Table 2C with corresponding ranks, and weights and associated bias detailed in the table or alternative rankings, and weightings and bias, depending, for example, on the disease setting. Tables 2A, 2B and 2C rank the biomarkers in order of absolute decreasing weight, in an example classifier, in the compound decision score function.
Table 2A 25 Biomarker Signature Rank Gene Symbol Weight Bias 1 CCDC80 0.0584 5.9594 2 INHBA 0.0508 3.8146 3 THBS2 0.0504 3.4342 4 SFRP2 0.0437 4.3293 5 MMP2 0.0367 5.3319 6 PLAU -0.0323 8.3844 7 FAP 0.0300 3.4689 8 FN1 0.0277 10.0610 9 COL8A1 -0.0248 5.1984 10 RAB31 0.0244 5.6121 11 FAM38B 0.0242 5.0883 12 VCAN 0.0230 4.4460 13 GJB2 0.0223 5.8677 14 ITGA5 0.0216 5.4455 15 CRISPLD2 0.0192 6.5088 16 C17orf91 0.0167 6.4830 17 BGN -0.0142 5.5396 18 TIMP3 0.0130 4.6739 19 ALPK2 0.0123 7.3709 20 LUM 0.0104 8.3279 21 NKD2 -0.0098 5.4448 22 LOX -0.0082 8.2117 23 MIR1245 0.0059 4.9959 24 LOXL1 0.0052 2.9463 25 CXCL12 0.0048 9.7132 Table 2B 45 Biomarker Signature Rank Gene Symbol Weight Bias 1 TMEM200A 0.0595 3.6813 2 GJB2 0.0560 4.4798 3 MMP13 0.0383 3.7241 4 GFPT2 0.0380 4.8602 5 POSTN -0.0355 4.3599 6 BICC1 0.0304 3.6982 7 CDH11 0.0283 4.9968 8 MRVI1 0.0256 5.0761 9 PMP22 0.0240 5.5645 10 COL11A1 -0.0237 3.5002 11 IGFL2 0.0222 3.3104 12 LUM -0.0220 8.3363 13 NTM -0.0218 4.2302 14 BGN 0.0211 10.1524 15 COL3A1 -0.0210 8.3236 16 COL10A1 0.0197 6.3538 17 RAB31 0.0180 5.3171 18 ANGPTL2 0.0166 5.6396 19 PLAU 0.0166 5.8488 20 COL8A1 0.0164 6.4193 21 MIR1245 0.0153 5.4552 22 POLD2 0.0146 9.3878 23 NKD2 0.0145 7.3717 24 FZD1 0.0143 4.1519 25 COPZ2 0.0139 5.1039 26 ITGA5 0.0136 8.3663 27 VGLL3 0.0125 4.5019 28 INHBA -0.0118 4.6843 29 MMP14 0.0110 10.0841 30 VCAN 0.0100 5.5518 31 THBS2 -0.0087 8.1309 32 RUNX2 0.0083 4.7345 33 TIMP3 0.0081 6.4983 34 SFRP2 -0.0079 5.6017 35 COL1A2 0.0078 6.0100 36 COL5A2 -0.0072 3.5671 37 SERPINF1 0.0068 10.8334 38 KIF26B -0.0052 4.9782 39 TNFAIP6 0.0050 5.3618 40 MMP2 0.0040 5.3622 41 FN1 0.0031 4.9840 42 ALPK2 0.0024 3.5136 43 CTSK 0.0015 5.7322 44 LOXL1 -0.0014 9.5939 45 FAP 0.0000 5.2254 Table 2C 63 Biomarker Signature Rank Gene Symbol Weight Bias 1 IGF2 -0.01737 9.8884 2 SOX11 -0.01457 4.5276 3 INS -0.01409 7.0637 4 CXCL17 0.012568 4.8478 5 SLC5A1 0.012426 4.8920 6 TMEM45A -0.0124 6.1307 7 CXCR2P1 0.011427 3.1478 8 MFAP2 -0.01039 9.0516 9 MATN3 -0.01028 3.7313 10 RTP4 0.010052 4.9852 11 COL3A1 -0.01002 8.4130 12 CDR1 -0.00916 8.1778 13 RARRES3 0.009056 6.8964 14 TNFSF10 0.008876 6.2325 15 NUAK1 -0.0087 6.6771 16 SNORD114-14 -0.00864 5.6385 17 SRPX -0.00862 5.0850 18 SPARC -0.00848 6.0135 19 GJB1 0.008445 5.8142 20 TIMP3 -0.00823 6.5937 21 ISLR -0.0079 8.9876 22 TUBA1A -0.00754 9.6540 23 DEXI 0.007271 5.5913 24 BASP1 -0.00724 8.4396 25 PXDN -0.00724 7.7570 26 GBP4 0.007226 3.1119 27 SLC28A3 0.007201 4.2125 28 HLA-DRA 0.007197 8.3089 29 TAP2 0.007189 4.8464 30 ACSL5 0.007155 6.8703 31 CDH11 -0.00708 4.9925 32 PSMB9 0.006962 4.1122 33 MMP14 -0.00683 10.1689 34 CD74 0.006825 9.2707 35 LOXL1 -0.00676 9.6429 36 CIITA 0.006623 5.5396 37 ZNF697 -0.00658 7.0319 38 SH3RF2 0.006549 5.0029 39 MIR198 -0.00654 5.1935 40 COL1A2 -0.00645 6.0427 41 TNFRSF14 0.006421 9.0366 42 COL8A1 -0.00642 6.4565 43 C21orf63 0.006261 5.9811 44 TAP1 0.006215 8.6458 45 PDPN -0.00612 5.3198 46 RHOBTB3 -0.00597 3.5609 47 BCL11A 0.005943 4.3818 48 HLA-DOB 0.005851 4.6075 49 XAF1 0.005742 7.9229 50 ARHGAP26 0.005632 4.3991 51 POLD2 -0.00558 9.4183 52 DPYSL2 -0.00533 8.3469 53 COL4A1 -0.0052 7.0317 54 ID3 -0.00516 7.5673 55 CFB 0.005077 5.7951 56 NIDI -0.00494 4.7186 57 FKBP7 -0.00489 2.9437 58 TIMP2 -0.00468 7.5253 59 RCBTB1 -0.00458 7.4491 60 ANGPTL2 -0.00448 5.6807 61 ENTPD7 -0.00442 7.3772 62 SHISA4 -0.00403 6.0601 63 HINT1 0.003651 6.0724 - In one instance, an expression signature comprises all or a portion of the following biomarkers: CCDC80, INHBA, THBS2, SFRP2, MMP2, PLAU, FAP, FN1, COL8A1, RAB31, FAM38B, VCAN, GJB2, ITGA5, CRISPLD2, C17, f91, BGN, TIMP3, ALPK2, LUM, NKD2, LOX, MIR1245, LOXL1, and CXCL12.
- In another instance, an expression signature comprises CCDC80, INHBA, THBS2 and SFRP2 and at least N additional biomarkers selected from the list of biomarkers in Table 2A, wherein N equals 2, 3, 4, 5, 6, 7, 8, 9, 10, 11, 12, 13, 14, 15, 16, 17, 18, 19, 20, or 21.
- In another instance, the expression signature comprises CCDC80 and at least N additional biomarkers selected from the list of biomarkers in Table 2A, wherein N equals 2, 3, 4, 5, 6, 7, 8, 9, 10, 11, 12, 13, 14, 15, 16, 17, 18, 19, 20, 21, 22, 23, or 24.
- In another instance, the expression signature comprises INHBA and at least N additional biomarkers selected from the list of biomarkers in Table 2A, wherein N equals 2, 3, 4, 5, 6, 7, 8, 9, 10, 11, 12, 13, 14, 15, 16, 17, 18, 19, 20, 21, 22, 23, or 24.
- In another instance, the expression signature comprises THBS2 and at least N additional biomarkers selected from the list of biomarkers in Table 2A, wherein N equals 2, 3, 4, 5, 6, 7, 8, 9, 10, 11, 12, 13, 14, 15, 16, 17, 18, 19, 20, 21, 22, 23, or 24.
- In another instance, the expression signature comprises SFRP2 and at least N additional biomarkers selected from the list of biomarkers in Table 2A, wherein N equals 2, 3, 4, 5, 6, 7, 8, 9, 10, 11, 12, 13, 14, 15, 16, 17, 18, 19, 20, 21, 22, 23, or 24.
- In another instance, an example expression signatures comprises the biomarkers and the corresponding biomarker weighted values listed in Table 2A. In another exemplary embodiment, an example expression signature consists of the biomarkers and the corresponding biomarker weighted values listed in Table 2A
- In a further instance, the methods disclosed herein comprise conducting an assay on a biological sample from an individual to determine the expression levels of one or more biomarkers in a biomarker panel, the biomarker panel comprising CCDC80, INHBA, THBS2 and SFRP2 and at least N additional biomarkers selected from the list of biomarkers in Table 2A, wherein N equals 1, 2, 3, 4, 5, 6, 7, 8, 9, 10, 11, 12, 13, 14, 15, 16, 17, 18, 19, 20 or 21.
- In a further instance, the methods disclosed herein comprise conducting an assay on a biological sample from an individual to determine the expression levels of one or more biomarkers in a biomarker panel, the biomarker panel comprising CCDC80 and at least N additional biomarkers selected from the list of biomarkers in Table 2A, wherein N equals 1, 2, 3, 4, 5, 6, 7, 8, 9, 10, 11, 12, 13, 14, 15, 16, 17, 18, 29, 20, 21, 22, 23 or 24.
- In a further instance, the methods disclosed hereincomprise conducting an assay on a biological sample from an individual to determine the expression levels of one or more biomarkers in a biomarker panel, the biomarker panel comprising INHBA and at least N additional biomarkers selected from the list of biomarkers in Table 2A, wherein N equals 1, 2, 3, 4, 5, 6, 7, 8, 9, 10, 11, 12, 13, 14, 15, 16, 17, 18, 29, 20, 21, 22, 23 or 24.
- In a further instance, the methods disclosed herein comprise conducting an assay on a biological sample from an individual to determine the expression levels of one or more biomarkers in a biomarker panel, the biomarker panel comprising THBS2 and at least N additional biomarkers selected from the list of biomarkers in Table 2A, wherein N equals 1, 2, 3, 4, 5, 6, 7, 8, 9, 10, 11, 12, 13, 14, 15, 16, 17, 18, 29, 20, 21, 22, 23 or 24.
- In a further instance, the methods disclosed herein comprise conducting an assay on a biological sample from an individual to determine the expression levels of one or more biomarkers in a biomarker panel, the biomarker panel comprising SFRP2 and at least N additional biomarkers selected from the list of biomarkers in Table 2A, wherein N equals 1, 2, 3, 4, 5, 6, 7, 8, 9, 10, 11, 12, 13, 14, 15, 16, 17, 18, 29, 20, 21, 22, 23 or 24.
- In another instance, an expression signature comprises all or a portion of the following biomarkers; TMEM200A, GJB2, MMP13, GFPT2, POSTN, BICC1, CDH11, MRVI1, PMP22, COL11A1, IGFL2, LUM, NTM, BGN, COL3A1, COL10A1, RAB31, ANGPTL2, PLAU, COL8A1, MIR1245, POLD2, NKD2, FZD1, COPZ2, ITGA5, VGLL3, INHBA, MMP14, VCAN, THBS2, RUNX2, TIMP3, SFRP2, COL1A2, COL5A2, SERPINF1, KIF26B, TNFAIP6, MMP2, FN1, ALPK2, CTSK, LOXL1 and FAP.
- In another instance, an expression signature comprises TMEM200A, GJB2, MMP13 and GFPT2 and at least N additional biomarkers selected from the list of biomarkers in Table 2B, wherein N equals 1, 2, 3, 4, 5, 6, 7, 8, 9, 10, 11, 12, 13, 14, 15, 16, 17, 18, 19, 20, 21, 22, 23, 24, 25, 26, 27, 28, 29, 30, 31, 32, 33, 34,35, 36, 37, 38, 39, 40, or 41.
- In another instance, an expression signature comprises TMEM200A and at least N additional biomarkers selected from the list of biomarkers in Table 2B, wherein N equals 1, 2, 3, 4, 5, 6, 7, 8, 9, 10, 11, 12, 13, 14, 15, 16, 17, 18, 19, 20, 21, 22, 23, 24, 25, 26, 27, 28, 29, 30, 31, 32, 33, 34,35, 36, 37, 38, 39, 40, 41, 42, 43 or 44.
- In another instance, an expression signature comprises GJB2 and at least N additional biomarkers selected from the list of biomarkers in Table 2B, wherein N equals 1, 2, 3, 4, 5, 6, 7, 8, 9, 10, 11, 12, 13, 14, 15, 16, 17, 18, 19, 20, 21, 22, 23, 24, 25, 26, 27, 28, 29, 30, 31, 32, 33, 34,35, 36, 37, 38, 39, 40, 41, 42, 43 or 44.
- In another instance, an expression signature comprises MMP13 and at least N additional biomarkers selected from the list of biomarkers in Table 2B, wherein N equals 1, 2, 3, 4, 5, 6, 7, 8, 9, 10, 11, 12, 13, 14, 15, 16, 17, 18, 19, 20, 21, 22, 23, 24, 25, 26, 27, 28, 29, 30, 31, 32, 33, 34,35, 36, 37, 38, 39, 40, 41, 42, 43 or 44.
- In another instance, an expression signature comprises GFPT2 and at least N additional biomarkers selected from the list of biomarkers in Table 2B, wherein N equals 1, 2, 3, 4, 5, 6, 7, 8, 9, 10, 11, 12, 13, 14, 15, 16, 17, 18, 19, 20, 21, 22, 23, 24, 25, 26, 27, 28, 29, 30, 31, 32, 33, 34,35, 36, 37, 38, 39, 40, 41, 42, 43 or 44.
- In another instance, an example expression signature comprises the biomarkers and the corresponding biomarker weighted values listed in Table 2B. In another instance, the expression signature consists of the biomarkers and corresponding biomarker weighted values listed in Table 2B.
- In a further instance, the methods described herein comprise conducting an assay on a biological sample from an individual to determine the expression levels of one or more biomarkers in a biomarker panel, the biomarker panel comprising TMEM200A, GJB2, MMP13 and GFPT2 and at least N additional biomarkers selected from the list of biomarkers in Table 2B, wherein N equals 1, 2, 3, 4, 5, 6, 7, 8, 9, 10, 11, 12, 13, 14, 15, 16, 17, 18, 19, 20, 21, 22, 23, 24, 25, 26, 27, 28, 29, 30, 31, 32, 33, 34,35, 36, 37, 38, 39, 40 or 41.
- In a further instance, the methods described herein comprise conducting an assay on a biological sample from an individual to determine the expression levels of one or more biomarkers in a biomarker panel, the biomarker panel comprising TMEM200A and at least N additional biomarkers selected from the list of biomarkers in Table 2B, wherein N equals 1, 2, 3, 4, 5, 6, 7, 8, 9, 10, 11, 12, 13, 14, 15, 16, 17, 18, 29, 20, 21, 22, 23, 24, 25, 26, 27, 28, 29, 30, 31, 32, 33, 34,35, 36, 37, 38, 39, 40, 41, 42, 43 or 44.
- In a further instance, the methods described herein comprise conducting an assay on a biological sample from an individual to determine the expression levels of one or more biomarkers in a biomarker panel, the biomarker panel comprising GJB2 and at least N additional biomarkers selected from the list of biomarkers in Table 2a, wherein N equals 1. 2, 3, 4, 5, 6, 7, 8, 9, 10, 11, 12, 13, 14, 15, 16, 17, 18, 29, 20, 21, 22, 23, 24, 25, 26, 27, 28, 29, 30, 31, 32, 33, 34,35, 36, 37, 38, 39, 40, 41, 42, 43 or 44.
- In a further instance, the methods described herein comprise conducting an assay on a biological sample from an individual to determine the expression levels of one or more biomarkers in a biomarker panel, the biomarker panel comprising MMP13 and at least N additional biomarkers selected from the list of biomarkers in Table 2B, wherein N equals 1, 2, 3, 4, 5, 6, 7, 8, 9, 10, 11, 12, 13, 14, 15, 16, 17, 18, 29, 20, 21, 22, 23, 24, 25, 26, 27, 28, 29, 30, 31, 32, 33, 34,35, 36, 37, 38, 39, 40, 41, 42, 43 or 44.
- In a further instance, the methods described herein comprise conducting an assay on a biological sample from an individual to determine the expression levels of one or more biomarkers in a biomarker panel, the biomarker panel comprising GFPT2 and at least N additional biomarkers selected from the list of biomarkers in Table 2B, wherein N equals 1, 2, 3, 4, 5, 6, 7, 8, 9, 10, 11, 12, 13, 14, 15, 16, 17, 18, 29, 20, 21, 22, 23, 24, 25, 26, 27, 28, 29, 30, 31, 32, 33, 34,35, 36, 37, 38, 39, 40, 41, 42, 43 or 44.
- In another exemplary embodiment, an expression signature comprises all of the following biomarkers; IGF2, SOX11, INS, CXCL17, SLC5A1, TMEM45A, CXCR2P1, MFAP2, MATN3, RTP4, COL3A1, CDR1, RARRES3, TNFSF10, NUAK1, SNORD114-14, SRPX, SPARC, GJB1, TIMP3, ISLR, TUBA1A, DEXI, BASP1, PXDN, GBP4, SLC28A3, HLA-DRA, TAP2, ACSL5, CDH11, PSMB9, MMP14, CD74, LOXL1, CIITA, ZNF697, SH3RF2, MIR198, COL1A2, TNFRSF14, COL8A1, C21orf63, TAP1, PDPN, RHOBTB3, BCL11A, HLA-DOB, XAF1, ARHGAP26, POLD2, DPYSL2, COL4A1, ID3, CFB, NID1, FKBP7, TIMP2, RCBTB1, ANGPTL2, ENTPD7, SHISA4, and HINT1,
- In another exemplary embodiment, an expression signature comprises IGF2, SOX11, INS, and CXCL17 and at least N additional biomarkers selected from the list of biomarkers in Table 2C, wherein N equals 1, 2, 3, 4, 5, 6, 7, 8, 9, 10, 11, 12, 13, 14, 15, 16, 17, 18, 19, 20, 21, 22, 23, 24, 25, 26, 27, 28, 29, 30, 31, 32, 33, 34, 35, 36, 37, 38, 39, 40, 41, 42, 43, 44, 45, 46, 47, 48, 49, 50, 51, 52, 53, 54, 55, 56, 57, 58, or 59.
- In another exemplary embodiment, an expression signature comprises IGF2 and at least N additional biomarkers selected from the list of biomarkers in Table 2C, wherein N equals 1, 2, 3, 4, 5, 6, 7, 8, 9, 10, 11, 12, 13, 14, 15, 16, 17, 18, 19, 20, 21, 22, 23, 24, 25, 26, 27, 28, 29, 30, 31, 32, 33, 34, 35, 36, 37, 38, 39, 40, 41, 42, 43, 44, 45, 46, 47, 48, 49, 50, 51, 52, 53, 54, 55, 56, 57, 58, 59, 60, 61, or 62.
- In another instance, an expression signature comprises SOX11 and at least N additional biomarkers selected from the list of biomarkers in Table 2C, wherein N equals 1, 2, 3, 4, 5, 6, 7, 8, 9, 10, 11, 12, 13, 14, 15, 16, 17, 18, 19, 20, 21, 22, 23, 24, 25, 26, 27, 28, 29, 30, 31, 32, 33, 34, 35, 36, 37, 38, 39, 40, 41, 42, 43, 44, 45, 46, 47, 48, 49, 50, 51, 52, 53, 54, 55, 56, 57, 58, 59, 60, 61, or 62.
- In another instance, an expression signature comprises INS and at least N additional biomarkers selected from the list of biomarkers in Table 2C, wherein N equals 1, 2, 3, 4, 5, 6, 7, 8, 9, 10, 11, 12, 13, 14, 15, 16, 17, 18, 19, 20, 21, 22, 23, 24, 25, 26, 27, 28, 29, 30, 31, 32, 33, 34, 35, 36, 37, 38, 39, 40, 41, 42, 43, 44, 45, 46, 47, 48, 49, 50, 51, 52, 53, 54, 55, 56, 57, 58, 59, 60, 61, or 62.
- In another instance, an expression signature comprises CXCL17 and at least N additional biomarkers selected from the list of biomarkers in Table 2C, wherein N equals 1, 2, 3, 4, 5, 6, 7, 8, 9, 10, 11, 12, 13, 14, 15, 16, 17, 18, 19, 20, 21, 22, 23, 24, 25, 26, 27, 28, 29, 30, 31, 32, 33, 34, 35, 36, 37, 38, 39, 40, 41, 42, 43, 44, 45, 46, 47, 48, 49, 50, 51, 52, 53, 54, 55, 56, 57, 58, 59, 60, 61, or 62.
- In another exemplary embodiment, an example expression signature comprises the biomarkers and corresponding biomarker weighted values listed in Table 2C. In another exemplary embodiment, and example expression signature consists of the biomarkers and corresponding biomarker weighted values listed in Table 2C.
- In a further aspect, the methods of the present invention comprise conducting an assay on a biological sample from an individual to determine the expression levels of one or more biomarkers in a biomarker panel, the biomarker panel comprising all or a portion of the biomarkers listed in Table 2C.
- In a further aspect, the methods of the present invention comprise conducting an assay on a biological sample from an individual to determine the expression levels of one or more biomarkers in a biomarker panel, the biomarker panel comprising IGF2, SOX11, INS, and CXCL17 and at least N additional biomarkers selected from the list of biomarkers in Table 2C, wherein N equals 1, 2, 3, 4, 5, 6, 7, 8, 9, 10, 11, 12, 13, 14, 15, 16, 17, 18, 19, 20, 21, 22, 23, 24, 25, 26, 27, 28, 29, 30, 31, 32, 33, 34, 35, 36, 37, 38, 39, 40, 41, 42, 43, 44, 45, 46, 47, 48, 49, 50, 51, 52, 53, 54, 55, 56, 57, 58, or 59.
- In a further aspect, the methods of the present invention comprise conducting an assay on a biological sample from an individual to determine the expression levels of one or more biomarkers in a biomarker panel, the biomarker panel comprising IGF2 and at least N additional biomarkers selected from the list of biomarkers in Table 2C, wherein N equals 1, 2, 3, 4, 5, 6, 7, 8, 9, 10, 11, 12, 13, 14, 15, 16, 17, 18, 19, 20, 21, 22, 23, 24, 25, 26, 27, 28, 29, 30, 31, 32, 33, 34, 35, 36, 37, 38, 39, 40, 41, 42, 43, 44, 45, 46, 47, 48, 49, 50, 51, 52, 53, 54, 55, 56, 57, 58, 59, 60, 61, or 62.
- In a further instance, the methods described herein comprise conducting an assay on a biological sample from an individual to determine the expression levels of one or more biomarkers in a biomarker panel, the biomarker panel comprising SOX11 and at least N additional biomarkers selected from the list of biomarkers in Table 2C, wherein N equals 1, 2, 3, 4, 5, 6, 7, 8, 9, 10, 11, 12, 13, 14, 15, 16, 17, 18, 19, 20, 21, 22, 23, 24, 25, 26, 27, 28, 29, 30, 31, 32, 33, 34, 35, 36, 37, 38, 39, 40, 41, 42, 43, 44, 45, 46, 47, 48, 49, 50, 51, 52, 53, 54, 55, 56, 57, 58, 59, 60, 61, or 62.
- In a further instance, the methods described herein comprise conducting an assay on a biological sample from an individual to determine the expression levels of one or more biomarkers in a biomarker panel, the biomarker panel comprising INS and at least N additional biomarkers selected from the list of biomarkers in Table 2C, wherein N equals 1, 2, 3, 4, 5, 6, 7, 8, 9, 10, 11, 12, 13, 14, 15, 16, 17, 18, 19, 20, 21, 22, 23, 24, 25, 26, 27, 28, 29, 30, 31, 32, 33, 34, 35, 36, 37, 38, 39, 40, 41, 42, 43, 44, 45, 46, 47, 48, 49, 50, 51, 52, 53, 54, 55, 56, 57, 58, 59, 60, 61, or 62.
- In a further instance, the methods desribed herein comprise conducting an assay on a biological sample from an individual to determine the expression levels of one or more biomarkers in a biomarker panel, the biomarker panel comprising CXCL17 and at least N additional biomarkers selected from the list of biomarkers in Table 2C, wherein N equals 1, 2, 3, 4, 5, 6, 7, 8, 9, 10, 11, 12, 13, 14, 15, 16, 17, 18, 19, 20, 21, 22, 23, 24, 25, 26, 27, 28, 29, 30, 31, 32, 33, 34, 35, 36, 37, 38, 39, 40, 41, 42, 43, 44, 45, 46, 47, 48, 49, 50, 51, 52, 53, 54, 55, 56, 57, 58, 59, 60, 61, or 62.
- In one instance, the expression signature comprises all or a portion of the following biomarkers; ALPK2, BGN, COL8A1, FAP, FN1, GJB2, INHBA, ITGA5, LOXL1, LUM, MIR1245, MMP2, NKD2, PLAU, RAB31, SFRP2, THBS2, TIMP3 and VCAN.
- In another instance, the expression signature comprises ALPK2, BGN, COL8A1, FAP and at least N additional biomarkers selected from FN1, GJB2, INHBA, ITGA5, LOXL1, LUM, MIR1245, MMP2, NKD2, PLAU, RAB31, SFRP2, THBS2, TIMP3 and VCAN, wherein N equals 1, 2, 3, 4, 5, 6, 7, 8, 9, 10, 11, 12, 13, 14 or 15.
- In a further instance, the methods described herein comprise conducting an assay on a biological sample from an individual to determine the expression levels of one or more biomarkers in a biomarker panel, the biomarker panel comprising ALPK2, BGN, COL8A1 and FAP at least N additional biomarkers selected from FN1, GJB2, INHBA, ITGA5, LOXL1, LUM, MIR1245, MMP2, NKD2, PLAU, RAB31, SFRP2, THBS2, TIMP3 and VCAN, wherein N equals 1, 2, 3, 4, 5, 6, 7, 8, 9, 10, 11, 12, 13, 14 or 15.
- In a further instance, the methods described herein comprise conducting an assay on a biological sample from an individual to determine the expression levels of one or more biomarkers in a biomarker panel, the biomarker panel comprising ALPK2 and at least N additional biomarkers selected from the list of biomarkers BGN, COL8A1, FAP, FN1, GJB2, INHBA, ITGA5, LOXL1, LUM, MIR1245, MMP2, NKD2, PLAU, RAB31, SFRP2, THBS2, TIMP3 and VCAN wherein N equals 1, 2, 3, 4, 5, 6, 7, 8, 9, 10, 11, 12, 13, 14 or 15.
- In a further instance, the methods described herein comprise conducting an assay on a biological sample from an individual to determine the expression levels of one or more biomarkers in a biomarker panel, the biomarker panel comprising BGN and at least N additional biomarkers selected from the list of biomarkers ALPK2, COL8A1, FAP, FN1, GJB2, INHBA, ITGA5, LOXL1, LUM, MIR1245, MMP2, NKD2, PLAU, RAB31, SFRP2, THBS2, TIMP3 and VCAN, wherein N equals 1, 2, 3, 4, 5, 6, 7, 8, 9, 10, 11, 12, 13, 14 or 15.
- In a further instance, the methods described herein comprise conducting an assay on a biological sample from an individual to determine the expression levels of one or more biomarkers in a biomarker panel, the biomarker panel comprising COL8A1 and at least N additional biomarkers selected from the list of biomarkers ALPK2, BGN, FAP, FN1, GJB2, INHBA, ITGA5, LOXL1, LUM, MIR1245, MMP2, NKD2, PLAU, RAB31, SFRP2, THBS2, TIMP3 and VCAN, wherein N equals 1, 2, 3, 4, 5, 6, 7, 8, 9, 10, 11, 12, 13, 14 or 15.
- In a further instance, the methods described herein comprise conducting an assay on a biological sample from an individual to determine the expression levels of one or more biomarkers in a biomarker panel, the biomarker panel comprising FAP and at least N additional biomarkers selected from the list of biomarkers ALPK2, BGN, COL8A1, FN1, GJB2, INHBA, ITGA5, LOXL1, LUM, MIR1245, MMP2, NKD2, PLAU, RAB31, SFRP2, THBS2, TIMP3 and VCAN, wherein N equals 1, 2, 3, 4, 5, 6, 7, 8, 9, 10, 11, 12, 13, 14 or 15.
- In another instance, an expression signature comprises all or a portion of the following biomarkers; GJB2, INHBA, THBS2, SFRP2, PLAU and at least N additional biomarkers from Table 1A-1C, wherein N is 2, 3, 4, 5, 6, 7, 8, 9, 10, 11, 12, 13, 14, 15, 16, 17, 18, 29, 20, 21, 22, 23, 24, 25, 26, 27, 28, 29, 30, 31, 32, 33, 34,35, 36, 37, 38, 39, 40, 41, 42, 43 or 44, 45, 46, 47, 48, 49, 50, 51, 52, 53, 54, 55, 56, 57, 58, 59, 60, 61, 62, 63, 64, 65, 66, 67, 68, 69, or 70.
- In another instance, an expression signature comprises all GJB2 and at least N additional biomarkers from Table 1A-1C, wherein N is 2, 3, 4, 5, 6, 7, 8, 9, 10, 11, 12, 13, 14, 15, 16, 17, 18, 29, 20, 21, 22, 23, 24, 25, 26, 27, 28, 29, 30, 31, 32, 33, 34,35, 36, 37, 38, 39, 40, 41, 42, 43 or 44, 45, 46, 47, 48, 49, 50, 51, 52, 53, 54, 55, 56, 57, 58, 59, 60, 61, 62, 63, 64, 65, 66, 67, 68, 69, 70, 71, 72, 73, or 74.
- In another instance, an expression signature comprises all INHBA and at least N additional biomarkers from Table 1A-1C, wherein N is . 2, 3, 4, 5, 6, 7, 8, 9, 10, 11, 12, 13, 14, 15, 16, 17, 18, 29, 20, 21, 22, 23, 24, 25, 26, 27, 28, 29, 30, 31, 32, 33, 34,35, 36, 37, 38, 39, 40, 41, 42, 43 or 44, 45, 46, 47, 48, 49, 50, 51, 52, 53, 54, 55, 56, 57, 58, 59, 60, 61, 62, 63, 64, 65, 66, 67, 68, 69, 70, 71, 72, 73, or 74.
- In another instance, an expression signature comprises all THBS2 and at least N additional biomarkers from Table 1A-1C, wherein N is 2, 3, 4, 5, 6, 7, 8, 9, 10, 11, 12, 13, 14, 15, 16, 17, 18, 29, 20, 21, 22, 23, 24, 25, 26, 27, 28, 29, 30, 31, 32, 33, 34,35, 36, 37, 38, 39, 40, 41, 42, 43 or 44, 45, 46, 47, 48, 49, 50, 51, 52, 53, 54, 55, 56, 57, 58, 59, 60, 61, 62, 63, 64, 65, 66, 67, 68, 69, 70, 71, 72, 73, or 74.
- In another instance, an expression signature comprises all SFRP2 wherein N is 2, 3, 4, 5, 6, 7, 8, 9, 10, 11, 12, 13, 14, 15, 16, 17, 18, 29, 20, 21, 22, 23, 24, 25, 26, 27, 28, 29, 30, 31, 32, 33, 34,35, 36, 37, 38, 39, 40, 41, 42, 43 or 44, 45, 46, 47, 48, 49, 50, 51, 52, 53, 54, 55, 56, 57, 58, 59, 60, 61, 62, 63, 64, 65, 66, 67, 68, 69, 70, 71, 72, 73, or 74.
- In another instance, an expression signature comprises all PLAU and at least N additional biomarkers from Table 1A-1C, wherein N is 2, 3, 4, 5, 6, 7, 8, 9, 10, 11, 12, 13, 14, 15, 16, 17, 18, 29, 20, 21, 22, 23, 24, 25, 26, 27, 28, 29, 30, 31, 32, 33, 34,35, 36, 37, 38, 39, 40, 41, 42, 43 or 44, 45, 46, 47, 48, 49, 50, 51, 52, 53, 54, 55, 56, 57, 58, 59, 60, 61, 62, 63, 64, 65, 66, 67, 68, 69, or 70.
- In another instance, an expression signature comprises all GJB2, INHBA, THBS2, SFRP2, PLAU and at least about 1%, about 5%, about 10%, about 20%, about 30%, about 40%, about 50%, about 60%, about 70%, about 80%, about 90%, about 95%, or about 99% of the biomarkers listed in Table 1A and Table 1B or a combination thereof.
- To classify new test samples using an expression signature, such as those described above, the relative expression levels of biomarkers in a cancer tissue are measured to form a test sample expression profile. In certain exemplary embodiments, the test sample expression profile is summarized in the form of a compound decision score ("expression score") and compared to a threshold score that is mathematically derived from a training set of patient data. The score threshold separates a patient group based on different characteristics such as, but not limited to, responsiveness/non-responsiveness to treatment. The patient training set data is preferably derived from cancer tissue samples having been characterized by prognosis, likelihood of recurrence, long term survival, clinical outcome, treatment response, diagnosis, cancer classification, or personalized genomics profile. Expression profiles, and corresponding decision scores from patient samples may be correlated with the characteristics of patient samples in the training set that are on the same side of the mathematically derived score decision threshold. The threshold of the linear classifier scalar output is optimized to maximize the sum of sensitivity and specificity under cross-validation as observed within the training dataset.
- The overall expression data for a given sample is normalized using methods known to those skilled in the art in order to correct for differing amounts of starting material, varying efficiencies of the extraction and amplification reactions, etc.
- In one embodiment, the biomarker expression profile of a patient tissue sample is evaluated by a linear classifier. As used herein, a linear classifier refers to a weighted sum of the individual biomarker intensities into a compound decision score ("decision function"). The decision score is then compared to a pre-defined cut-off score threshold, corresponding to a certain set-point in terms of sensitivity and specificity which indicates if a sample is above the score threshold (decision function positive) or below (decision function negative).
- Using a linear classifier on the normalized data to make a diagnostic or prognostic call (e.g. responsiveness or resistance to therapeutic agent) effectively means to split the data space, i.e. all possible combinations of expression values for all genes in the classifier, into two disjoint halves by means of a separating hyperplane. This split is empirically derived on a large set of training examples, for example from patients showing responsiveness or resistance to a therapeutic agent. Without loss of generality, one can assume a certain fixed set of values for all but one biomarker, which would automatically define a threshold value for this remaining biomarker where the decision would change from, for example, responsiveness or resistance to a therapeutic agent. Expression values above this dynamic threshold would then either indicate resistance (for a biomarker with a negative weight) or responsiveness (for a biomarker with a positive weight) to a therapeutic agent. The precise value of this threshold depends on the actual measured expression profile of all other biomarkers within the classifier, but the general indication of certain biomarkers remains fixed, i.e. high values or "relative over-expression" always contributes to either a responsiveness (genes with a positive weight) or resistance (genes with a negative weights). Therefore, in the context of the overall gene expression classifier, relative expression can indicate if either up- or down-regulation of a certain biomarker is indicative of responsiveness or resistance to a therapeutic agent.
- There are a number of suitable methods for measuring expression profiles of test samples depending on the type of biomarker to be assayed. Measuring mRNA in a biological sample may be used as a surrogate for detection of the level of the corresponding protein in the biological sample. Thus, any of the biomarkers or biomarker panels described herein can also be detected by detecting the appropriate RNA. Methods of gene expression profiling include, but are not limited to, microarray, RT-PCT, qPCR, NGS, northern blots, SAGE, mass spectrometry.
- mRNA expression levels are measured by reverse transcription quantitative polymerase chain reaction (RT-PCR followed with qPCR). RT-PCR is used to create a cDNA from the mRNA. The cDNA may be used in a qPCR assay to produce fluorescence as the DNA amplification process progresses. By comparison to a standard curve, qPCR can produce an absolute measurement such as number of copies of mRNA per cell. Northern blots, microarrays, Invader assays, and RT-PCR combined with capillary electrophoresis have all been used to measure expression levels of mRNA in a sample. See Gene Expression Profiling: Methods and Protocols, Richard A. Shimkets, editor, Humana Press, 2004.
- miRNA molecules are small RNAs that are non-coding but may regulate gene expression. Any of the methods suited to the measurement of mRNA expression levels can also be used for the corresponding miRNA. Recently many laboratories have investigated the use of miRNAs as biomarkers for disease. Many diseases involve widespread transcriptional regulation, and it is not surprising that miRNAs might find a role as biomarkers. The connection between miRNA concentrations and disease is often even less clear than the connections between protein levels and disease, yet the value of miRNA biomarkers might be substantial. Of course, as with any RNA expressed differentially during disease, the problems facing the development of an in vitro diagnostic product will include the requirement that the miRNAs survive in the diseased cell and are easily extracted for analysis, or that the miRNAs are released into blood or other matrices where they must survive long enough to be measured. Protein biomarkers have similar requirements, although many potential protein biomarkers are secreted intentionally at the site of pathology and function, during disease, in a paracrine fashion. Many potential protein biomarkers are designed to function outside the cells within which those proteins are synthesized.
- Gene expression may also be evaluated using mass spectrometry methods. A variety of configurations of mass spectrometers can be used to detect biomarker values. Several types of mass spectrometers are available or can be produced with various configurations. In general, a mass spectrometer has the following major components: a sample inlet, an ion source, a mass analyzer, a detector, a vacuum system, and instrument-control system, and a data system. Difference in the sample inlet, ion source, and mass analyzer generally define the type of instrument and its capabilities. For example, an inlet can be a capillary-column liquid chromatography source or can be a direct probe or stage such as used in matrix-assisted laser desorption. Common ion sources are, for example, electrospray, including nanospray and microspray or matrix-assisted laser desorption. Common mass analyzers include a quadrupole mass filter, ion trap mass analyzer and time-of-flight mass analyzer. Additional mass spectrometry methods are well known in the art (see Burlingame et al., Anal. Chem. 70:647 R-716R (1998); Kinter and Sherman, New York (2000)).
- Protein biomarkers and biomarker values can be detected and measured by any of the following: electrospray ionization mass spectrometry (ESI-MS), ESI-MS/MS, ESI-MS/(MS)n, matrix-assisted laser desorption ionization time-of-flight mass spectrometry (MALDI-TOF-MS), surface-enhanced laser desorption/ionization time-of-flight mass spectrometry (SELDI-TOF-MS), desorption/ionization on silicon (DIOS), secondary ion mass spectrometry (SIMS), quadrupole time-of-flight (Q-TOF), tandem time-of-flight (TOF/TOF) technology, called ultraflex III TOF/TOF, atmospheric pressure chemical ionization mass spectrometry (APCI-MS), APCI-MS/MS, APCI-(MS).sup.N, atmospheric pressure photoionization mass spectrometry (APPI-MS), APPI-MS/MS, and APPI-(MS).sup.N, quadrupole mass spectrometry, Fourier transform mass spectrometry (FTMS), quantitative mass spectrometry, and ion trap mass spectrometry.
- Sample preparation strategies are used to label and enrich samples before mass spectroscopic characterization of protein biomarkers and determination biomarker values. Labeling methods include but are not limited to isobaric tag for relative and absolute quantitation (iTRAQ) and stable isotope labeling with amino acids in cell culture (SILAC). Capture reagents used to selectively enrich samples for candidate biomarker proteins prior to mass spectroscopic analysis include but are not limited to aptamers, antibodies, nucleic acid probes, chimeras, small molecules, an F(ab')2 fragment, a single chain antibody fragment, an Fv fragment, a single chain Fv fragment, a nucleic acid, a lectin, a ligand-binding receptor, affybodies, nanobodies, ankyrins, domain antibodies, alternative antibody scaffolds (e.g. diabodies etc) imprinted polymers, avimers, peptidomimetics, peptoids, peptide nucleic acids, threose nucleic acid, a hormone receptor, a cytokine receptor, and synthetic receptors, and modifications and fragments of these.
- The foregoing assays enable the detection of biomarker values that are useful in methods for predicting responsiveness of a cancer therapeutic agent, where the methods comprise detecting, in a biological sample from an individual, at least N biomarker values that each correspond to a biomarker selected from the group consisting of the biomarkers provided in Tables 1A, 1B, 2A, 2B or Groups I and II, wherein a classification, as described in detail below, using the biomarker values indicates whether the individual will be responsive to a therapeutic agent. While certain of the described predictive biomarkers are useful alone for predicting responsiveness to a therapeutic agent, methods are also described herein for the grouping of multiple subsets of the biomarkers that are each useful as a panel of two or more biomarkers. Thus, various instances of the instant application provide combinations comprising N biomarkers, wherein N is at least three biomarkers. It will be appreciated that N can be selected to be any number from any of the above-described ranges, as well as similar, but higher order, ranges. In accordance with any of the methods described herein, biomarker values can be detected and classified individually or they can be detected and classified collectively, as for example in a multiplex assay format.
- In one embodiment, the present invention makes use of "oligonucleotide arrays" (also called herein "microarrays"). Microarrays can be employed for analyzing the expression of biomarkers in a cell, and especially for measuring the expression of biomarkers of cancer tissues.
- In one embodiment, biomarker arrays are produced by hybridizing detectably labeled polynucleotides representing the mRNA transcripts present in a cell (e.g., fluorescently-labeled cDNA synthesized from total cell mRNA or labeled cRNA) to a microarray. A microarray is a surface with an ordered array of binding (e.g., hybridization) sites for products of many of the genes in the genome of a cell or organism, preferably most or almost all of the genes. Microarrays can be made in a number of ways known in the art. However produced, microarrays share certain characteristics. The arrays are reproducible, allowing multiple copies of a given array to be produced and easily compared with each other. Preferably the microarrays are small, usually smaller than 5 cm2, and they are made from materials that are stable under binding (e.g., nucleic acid hybridization) conditions. A given binding site or unique set of binding sites in the microarray will specifically bind the product of a single gene in the cell. In a specific embodiment, positionally addressable arrays containing affixed nucleic acids of known sequence at each location are used.
- It will be appreciated that when cDNA complementary to the RNA of a cell is made and hybridized to a microarray under suitable hybridization conditions, the level of hybridization to the site in the array corresponding to any particular gene will reflect the prevalence in the cell of mRNA transcribed from that gene/biomarker. For example, when detectably labeled (e.g., with a fluorophore) cDNA or cRNA complementary to the total cellular mRNA is hybridized to a microarray, the site on the array corresponding to a gene (i.e., capable of specifically binding the product of the gene) that is not transcribed in the cell will have little or no signal (e.g., fluorescent signal), and a gene for which the encoded mRNA is prevalent will have a relatively strong signal. Nucleic acid hybridization and wash conditions are chosen so that the probe "specifically binds" or "specifically hybridizes' to a specific array site, i.e., the probe hybridizes, duplexes or binds to a sequence array site with a complementary nucleic acid sequence but does not hybridize to a site with a non-complementary nucleic acid sequence. As used herein, one polynucleotide sequence is considered complementary to another when, if the shorter of the polynucleotides is less than or equal to 25 bases, there are no mismatches using standard base-pairing rules or, if the shorter of the polynucleotides is longer than 25 bases, there is no more than a 5% mismatch. Preferably, the polynucleotides are perfectly complementary (no mismatches). It can be demonstrated that specific hybridization conditions result in specific hybridization by carrying out a hybridization assay including negative controls using routine experimentation.
- Optimal hybridization conditions will depend on the length (e.g., oligomer vs. polynucleotide greater than 200 bases) and type (e.g., RNA, DNA, PNA) of labeled probe and immobilized polynucleotide or oligonucleotide. General parameters for specific (i.e., stringent) hybridization conditions for nucleic acids are described in Sambrook et al., supra, and in Ausubel et al., "Current Protocols in Molecular Biology", Greene Publishing and Wiley-interscience, NY (1987). When the cDNA microarrays are used, typical hybridization conditions are hybridization in 5xSSC plus 0.2% SDS at 65C for 4 hours followed by washes at 25°C in low stringency wash buffer (1xSSC plus 0.2% SDS) followed by 10 minutes at 25°C in high stringency wash buffer (0.1SSC plus 0.2% SDS) (see Shena et al., Proc. Natl. Acad. Sci. USA, Vol. 93, p. 10614 (1996)). Useful hybridization conditions are also provided in, e.g., Tijessen, Hybridization With Nucleic Acid Probes", Elsevier Science Publishers B.V. (1993) and Kricka, "Nonisotopic DNA Probe Techniques", Academic Press, San Diego, Calif. (1992).
- Immunoassay methods are based on the reaction of an antibody to its corresponding target or analyte and can detect the analyte in a sample depending on the specific assay format. To improve specificity and sensitivity of an assay method based on immunoreactivity, monoclonal antibodies are often used because of their specific epitope recognition. Polyclonal antibodies have also been successfully used in various immunoassays because of their increased affinity for the target as compared to monoclonal antibodies Immunoassays have been designed for use with a wide range of biological sample matrices Immunoassay formats have been designed to provide qualitative, semi-quantitative, and quantitative results.
- Quantitative results may be generated through the use of a standard curve created with known concentrations of the specific analyte to be detected. The response or signal from an unknown sample is plotted onto the standard curve, and a quantity or value corresponding to the target in the unknown sample is established.
- Numerous immunoassay formats have been designed. ELISA or EIA can be quantitative for the detection of an analyte/biomarker. This method relies on attachment of a label to either the analyte or the antibody and the label component includes, either directly or indirectly, an enzyme. ELISA tests may be formatted for direct, indirect, competitive, or sandwich detection of the analyte. Other methods rely on labels such as, for example, radioisotopes (I125) or fluorescence. Additional techniques include, for example, agglutination, nephelometry, turbidimetry, Western blot, immunoprecipitation, immunocytochemistry, immunohistochemistry, flow cytometry, Luminex assay, and others (see ImmunoAssay: A Practical Guide, edited by Brian Law, published by Taylor & Francis, Ltd., 2005 edition).
- Exemplary assay formats include enzyme-linked immunosorbent assay (ELISA), radioimmunoassay, fluorescent, chemiluminescence, and fluorescence resonance energy transfer (FRET) or time resolved-FRET (TR-FRET) immunoassays. Examples of procedures for detecting biomarkers include biomarker immunoprecipitation followed by quantitative methods that allow size and peptide level discrimination, such as gel electrophoresis, capillary electrophoresis, planar electrochromatography, and the like.
- Methods of detecting and/or quantifying a detectable label or signal generating material depend on the nature of the label. The products of reactions catalyzed by appropriate enzymes (where the detectable label is an enzyme; see above) can be, without limitation, fluorescent, luminescent, or radioactive or they may absorb visible or ultraviolet light. Examples of detectors suitable for detecting such detectable labels include, without limitation, x-ray film, radioactivity counters, scintillation counters, spectrophotometers, colorimeters, fluorometers, luminometers, and densitometers.
- Any of the methods for detection can be performed in any format that allows for any suitable preparation, processing, and analysis of the reactions. This can be, for example, in multi-well assay plates (e.g., 96 wells or 384 wells) or using any suitable array or microarray. Stock solutions for various agents can be made manually or robotically, and all subsequent pipetting, diluting, mixing, distribution, washing, incubating, sample readout, data collection and analysis can be done robotically using commercially available analysis software, robotics, and detection instrumentation capable of detecting a detectable label.
- Reagents, tools, and/or instructions for performing the methods described herein can be provided in a kit. For example, the kit can contain reagents, tools, and instructions for determining an appropriate therapy for a cancer patient. Such a kit can include reagents for collecting a tissue sample from a patient, such as by biopsy, and reagents for processing the tissue. The kit can also include one or more reagents for performing a gene or gene product expression analysis, such as reagents for performing nucleic acid amplification (e.g RT-PCR, qPCR), sequencing (e.g. next generation sequencing), northern blot, proteomic analysis, or immunohistochemistry to determine expression levels of gene or gene product markers in a sample of a patient. For example, primers for performing RT-PCR, probes for performing northern blot analyses, and/or antibodies for performing proteomic analysis such as Western blot, immunohistochemistry and ELISA analyses can be included in such kits. Appropriate buffers for the assays can also be included. Detection reagents required for any of these assays can also be included. The appropriate reagents and methods are described in further detail below. The kits may include suitable primers and/or probes to detect the expression levels of at least one (up to all) of the biomarkers of in Table 2A and/or 2B and/or 2C. Where expression is determined at the protein level the kit may contain binding reagents specific for the proteins of interest. The binding reagents may comprise antibodies to include all fragments and derivatives thereof. In the context of the various embodiments of the present invention the term "antibody" includes all immunoglobulins or immunoglobulin-like molecules with specific binding affinity for the relevant protein (including by way of example and without limitation, IgA, IgD, IgE, IgG and IgM, combinations thereof, and similar molecules produced during an immune response in any vertebrate, for example, in mammals such as humans, goats, rabbits and mice). Specific immunoglobulins useful in the various embodiments of the invention include IgG isotypes. The antibodies useful in the various embodiments of the invention may be monoclonal or polyclonal in origin, but are typically monoclonal antibodies. Antibodies may be human antibodies, non-human antibodies, or humanized versions of non-human antibodies, or chimeric antibodies. Various techniques for antibody humanization are well established and any suitable technique may be employed. The term "antibody" also refers to a polypeptide ligand comprising at least a light chain or heavy chain immunoglobulin variable region which specifically recognizes and binds an epitope of an antigen, and it extends to all antibody derivatives and fragments that retain the ability to specifically bind to the relevant protein. These derivatives and fragments may include Fab fragments, F(ab')2 fragments, Fv fragments, single chain antibodies, single domain antibodies, Fc fragments etc. The term antibody encompasses antibodies comprised of both heavy and light chains, but also heavy chain (only) antibodies (which may be derived from various species of cartilaginous fish or camelids). In specific instances, the antibodies may be engineered so as to be specific for more than protein, for example bi-specific to permit binding to two different target proteins as identified herein (see Tables 2A, 2B and 2C).
- In some instances, the kits may also contain the specific anti-angiogenic therapeutic agent to be administered in the event that the test predicts responsiveness. This agent may be provided in a form, such as a dosage form, that is tailored to the specific treatment. The kit may be provided with suitable instructions for administration according to an appropriate treatment regimen.
- The kits featured herein can also include an instruction sheet describing how to perform the assays for measuring gene or gene product expression. The instruction sheet can also include instructions for how to determine a reference cohort, including how to determine expression levels of gene or gene product markers in the reference cohort and how to assemble the expression data to establish a reference for comparison to a test patient. The instruction sheet can also include instructions for assaying gene or gene product expression in a test patient and for comparing the expression level with the expression in the reference cohort to subsequently determine the appropriate chemotherapy for the test patient. Methods for determining the appropriate chemotherapy are described above and can be described in detail in the instruction sheet.
- Informational material included in the kits can be descriptive, instructional, marketing or other material that relates to the methods described herein and/or the use of the reagents for the methods described herein. For example, the informational material of the kit can contain contact information, e.g., a physical address, email address, website, or telephone number, where a user of the kit can obtain substantive information about performing a gene expression analysis and interpreting the results, particularly as they apply to a human's likelihood of having a positive response to a specific therapeutic agent.
- The kits featured herein can also contain software necessary to infer a patient's likelihood of having a positive response to a specific therapeutic agent from the gene product marker expression.
- As described above, the methods described herein permit the classification of a patient as responsive or non-responsive to a therapeutic agent that targets angiogenic processes and signaling within tumors. Some current such therapeutics used to treat cancer include, but are not limited to, the following agents; VEGF pathway-targeted therapeutic agent, including multi-targeted pathway inhibitors (VEGF/PDGF/FGF/EGFT/FLT-3/c-KIT), Angiopoietin-TIE2 pathway inhibitors, endogenous angiogenic inhibitors, immunomodulatory Agents. VEGF specific inhibitors include, but are not limited to, Bevacizumab (Avastin), Afibercept (VEGF Trap), IMC-1121B (Ramucirumab). Multi-targeted pathway inhibitors include, but are not limited to, Imatinib (Gleevec), Sorafenib (Nexavar), Gefitinib (Iressa), Sunitinib (Sutent), Erlotinib, Tivozinib, Cediranib (Recentin), Pazopanib (Votrient), BIBF 1120 (Vargatef), Dovitinib, Semaxanib (Sugen), Axitinib (AG013736), Vandetanib (Zactima), Nilotinib (Tasigna), Dasatinib (Sprycel), Vatalanib, Motesanib, ABT-869, TKI-258. Angiopoietin-TIE2 pathway inhibitors include, but are not limited to, AMG-386, PF-4856884 CVX-060, CEP-11981, CE-245677, MEDI-3617, CVX-241, Trastuzumab (Herceptin). Endogenous angiogenic inhibitors include, but are not limited to, Thombospondin, Endostatin, Tumstatin, Canstatin, Arrestin, Angiostatin, Vasostatin, Interferon alpha. Immunomodulatory Agents include, but are not limited to, Thalidomide and Lenalidomide.
- For the avoidance of doubt, the scope of the invention is defined by the appended claims.
- This invention is further illustrated by the following examples, which are not to be construed in any way as imposing limitations upon the scope thereof.
- Exemplary expression signatures were identified from gene expression analysis of a cohort of macrodissected epithelial serous ovarian tumor FFPE tissue samples sourced from the NHS Lothian and University of Edinburgh.
- The protocol for histological classification of epithelial ovarian cancer to define serous, endometrioid, clear cell and mucinous histologies has recently been updated. One of the consequences of this is that many tumors that would previously been classified as endometrioid are now being classified as serous. (McCluggage, W.G. "Morphological subtypes of ovarian carcinoma: a review with emphasis on new developments and pathogenesis," PATHOLOGY 2011 Aug;43(5):420-32). Serous samples that were used in this study were among a larger set of epithelial ovarian cancer samples of all histologies that were harvested between 1984 and 2006. Pathology to assign histology status was performed by the pathologists at each of the centers at the time of harvesting. During March and April 2012, 357 of these epithelial ovarian samples were reviewed for histology classification by two independent consultant ovarian cancer pathologists according to the revised protocol. This resulted in a reclassification of several of these samples as indicated Table 3.
Table 3: results of pathology review of 357 epithelial ovarian cancer samples. (Original histological status is presented in rows, and updated histological status is presented in columns) Original/Updated CLEAR CELL ENDOMETRIOID MUCINOUS SEROUS TOT AL CLEAR CELL 19 1 0 5 25 ENDOMETRIOID 2 33 0 38 73 MUCINOUS 0 1 8 1 10 OTHER MIXED 3 5 0 8 16 SEROUS 1 3 1 193 198 SEROUS/ ENDO 0 2 0 25 27 UNCLASSIFIED 0 0 0 4 4 UNDIFFERENTIATED 1 0 0 3 4 TOTAL 26 45 9 277 357 Figure1 ) were identified from 199 samples that were classified as serous according to the original pathologist reports. Bioinformatic analysis was similarly performed on the 277 samples classified as stage III and IV high grade serous ovarian cancer using the updated pathology classification method. This analysis identified the updated serous subgroups detailed inFigure 6 and consequently used to define a 45 gene "angiogenesis" signature (Table 2B) and a 63 gene "non-angiogenesis" signature (Table 2C) - Total RNA was extracted from macrodissected FFPE tissue using the High Pure RNA Paraffin Kit (Roche Diagnostics GmbH, Mannheim, Germany). RNA was converted into complementary deoxyribonucleic acid (cDNA), which was subsequently amplified and converted into single-stranded form using the SPIA® technology of the WT-Ovation™ FFPE RNA Amplification System V2 (NuGEN Technologies Inc., San Carlos, CA, USA). The amplified single-stranded cDNA was then fragemented and biotin labeled using the FL-Ovation™ cDNA Biotin Module V2 (NuGEN Technologies Inc.). The fragmented and labeled cDNA was then hybridized to the Almac Ovarian Cancer DSA™. Almac's Ovarian Cancer DSA™ research tool has been optimised for analysis of FFPE tissue samples, enabling the use of valuable archived tissue banks. The Almac Ovarian Cancer DSA™ research tool is an innovative microarray platform that represents the transcriptome in both normal and cancerous ovarian tissues. Consequently, the Ovarian Cancer DSA™ provides a comprehensive representation of the transcriptome within the ovarian disease and tissue setting, not available using generic microarray platforms. Arrays were scanned using the Affymentrix Genechip® Scanner 7G (Affymetrix Inc., Santa Clara, CA).
- Quality Control (QC) of profiled samples was carried out using MAS5 pre-processing algorithm. Different technical aspects were addressed: average noise and background homogeneity, percentage of present call (array quality), signal quality, RNA quality and hybridization quality. Distributions and Median Absolute Deviation of corresponding parameters were analyzed and used to identify possible outliers.
- Almac's Ovarian Cancer DSA™ contains probes that primarily target the area within 300 nucleotides from the 3' end. Therefore standard Affymetrix RNA quality measures were adapted - for housekeeping genes intensities of 3' end probe sets with ratios of 3' end probe set intensity to the average background intensity were used in addition to usual 3'/5' ratios. Hybridization controls were checked to ensure that their intensities and present calls conform to the requirements specified by Affymetrix.
- Pre-processing of the raw data generated from expression profiling of the epithelial serous ovarian cancer training set was performed in Expression Console v1.1 with Robust Multi-array Analysis (RMA).
- Hierarchical clustering techniques were applied to microarray data from the epithelial serous ovarian tumors analysed using the Ovarian Cancer DSA™ (disease specific array) platform. Raw expression data was preprocessed using the standard Robust Multichip Algorithm (RMA) procedure. Non-biological systematic variance in the data set was identified and removed. Those probe sets whose expression levels varied significantly from tumor to tumor were identified. These probe sets formed the intrinsic list.
- Two dimensional cluster analysis (tumor, probe set) was performed to establish tumor relationships based on the intrinsic list. Hierarchical agglomerative clustering was applied (Pearson correlation - Original analysis - or Euclidean distance - updated analysis - and Ward's linkage). Optimal partition number was selected using the GAP index (Tibshirani et al., 2002, J. R. Stat. Soc., 63:411-423). All probe sets available in the cluster subgroups were mapped to genes names.
- To establish the functional significance of the probe set clusters, probe sets were mapped to genes (Entrez gene ID) and an enrichment analysis was performed. Enrichment significance was calculated based on the hypergeometric function (False Discovery Rate applied (Benjamini and Hochberg, 1995, J. R. Stat. Soc. 57:289:300)). Over-representation of biological processes and pathways were analysed for each gene group generated by the hierarchical clustering for the epithelial serous ovarian cancer samples using Almac Diagnostics' proprietary Functional Enrichment Tool (FET). Antisense probe sets were excluded from the analysis. Hypergeometric p-values were assessed for each enriched functional entity class. Functional entity classes with the highest p-values were selected as representative of the group and a general functional category representing these functional entities was assigned to the gene clusters based on significance of representation (i.e. p-value).
- To generate an angiogenesis classifier using the original 199 epithelial serous ovarian tumors, genes in clusters enriched for angiogenesis, vasculature development and immune response general functional terms were grouped into a putative angiogenesis gene group and used for the signature generation. The sample clusters presenting high expression for the genes involved in angiogenesis, vasculature development and immune response general functional terms were selected for classification and labeled as 'angiogenesis'. Those not showing high expression for the genes involved in these functional terms were labeled as 'non-angiogenesis'.
- To generate an angiogenesis classifier using the reclassified 265 epithelial serous ovarian tumors, genes in clusters enriched for angiogenesis and vasculature development general functional terms were grouped into a putative angiogenesis gene group and used for the signature generation. The sample clusters presenting high expression for the genes involved in angiogenesis and vasculature development general functional terms were selected for classification and labeled as 'angiogenesis'. Those not showing high expression for the genes involved in these functional terms were labeled as 'others 'others' (
Figure 6 top label identifying "angiogensis" samples (red) plus "others" (grey)). - To generate a "non-angiogenesis classifier" using the reclassified 265 epithelial serous ovarian tumors the sample clusters presenting low expression for the genes involved in angiogenesis and vasculature development general functional terms were selected for classification and labeled as "non-angiogenesis." Those not showing low expression fore the genes involved in these functional terms were labeled as 'others' (
Figure6 bottom label identifying "non-angiogenesis" samples plus "others"). - To facilitate validation of the classifier across multiple array platforms, the angiogenesis classifier was generated at the gene level. The following steps outline the procedures that were taken for gene level signature development (each step performed over internal cross validation using 10 repeats of 5-fold cross-validation):
-
- ▪ Pre-processing:
- ∘ RMA background correction.
- ∘ Reference set of genes are those genes (sense probe sets only) unique to the ovarian DSA platform.
- ∘ Gene level summarization was performed in two steps; first probes to probe set summarization was performed by calculating the median expression of the probes in a probe set; secondly, median expression of the (sense only) probe sets mapping to each gene in the reference distribution is calculated, yielding a "gene level" expression matrix.
- ∘ Quantile normalization was performed on the full gene expression data matrix and a reference quantile derived from the training data was used to normalize the test samples within each round of cross validation.
- ▪ Feature selection: Filtering 75% of genes by variance, intensity and correlation to cDNA concentration, followed by either recursive feature elimination (RFE) or filter feature selection (FFS) based on CAT scores.
- ▪ Classification algorithms: Partial Least Squares (PLS), SDA (Shrinkage Discriminate Analysis) and DSDA (Diagonal SDA).
- The criteria used for model selection were AUC and/or hazard ratio (HR) over internal cross-validation and feature elimination. Functional enrichment of the signatures over cross validation using FET based on the gene ontologies, interim validation sets which included two sets of technical replicates for which standard deviation in signature scores for repeated samples was evaluated over cross-validation and feature elimination and an assessment of the independence to clinical and technical factors over cross validation (factors listed in Table 4).
- It should be noted, since the subgroup (i.e. class label) derivation was performed using microarray expression from the same sample cohort that was used for signature development, there was an expected positive bias in any performance estimates based on AUC. This highlights the importance of widening the criteria used for model selection, by including additional metrics such as the hazard ratio, functional enrichment and assessing the independence to clinical and technical factors.
Table 4 List of clinical and technical factors investigated Clinical factors: Technical factors: Sample processing factors: Debulking Hospital Post Amp operator Block age RNA concentration cDNA yield - All datasets were background corrected using RMA. For each validation set, the probe sets that map to the classifier genes were determined, excluding anti-sense probe sets (if applicable). Annotation for Affymetrix Plus 2.0 and U133A arrays are available from the Affymetrix website. The median intensity over all probes mapping to each gene in the classifier was calculated and the quantile normalization model from the training set was applied to normalize the testing samples one at a time, resulting in a gene intensity matrix. The classifier was then applied to this data matrix to produce a classifier score/prediction for each sample.
- Univariate and multivariate analysis may be carried out in relation to the glioblastoma dataset to assess respectively the association between the angiogenesis subtype classifier and survival, and to determine if the association, if any, was independent to known clinical predictors. The p-values for univariate analysis were calculated using logistic regression in MATLAB. For the multivariate analysis we used a likelihood ratio test from logistic regression was used, where the p-values represent the drop in the log-likelihood when comparing the model with the clinical covariates and the predictions to a reduced model with clinical covariates only. The likelihood ratio test measures the importance of the gene predictor in modeling survival, and highlights its independence as a predictor relative to the clinical predictors. In both univariate and multivariate analysis, a p-value < 0.05 was used as the criterion for significance. Furthermore, samples with unknown clinical factors were excluded in this assessment.
- Feature selection resulted in the selection of 1200 probe sets from the original epithelial serous ovarian cancer data set (199 samples) and 1400 PS from the reclassified epithelial serous ovarian cancer data set (265 samples). The GAP analysis revealed three sample clusters and three probe set cluster groups within both sample sets (
Figure 1 ,Figure 6 ). - The classification of samples as 'anigogenesis' or 'non-angiogenesis' was based upon the results of the functional analysis of the epithelial serous ovarian cancer dataset (
Figure 1 Figure 6 ). The objective of this study was to characterize at a transcriptomic level a set of genes that would be capable of determining responsiveness or resistance of a pathogenic cell to anti-angiogenic agents and potentially identify patients who could benefit from anti-angiogenic therapy. With this in mind, those samples within the epithelial serous ovarian cancer datasets that best represented this biology were to be selected and compared to the remaining samples for classifier generation (see next section). It was decided that the samples from the sample angiogenesis cluster within the original epithelial serous ovarian cancer sample set (199 samples) (Figure 1 ) were the most relevant samples for this selection as these samples demonstrated an up-regulation of genes involved in signaling related to angiogenic and immune response processes and pathways as defined by functional analysis (Figure 2A and2B ) It was decided that the samples from sample cluster three within the reclassified epithelial serous ovarian cancer sample set (265 samples) (Figure 6 ) were the most relevant samples for this selection as these samples demonstrated an up-regulation of genes involved in signaling related to angiogenic processes and pathways as defined by functional analysis (Figure 2A and2B ). - It was decided that the samples from
sample cluster 1 within the reclassified epithelial serous ovarian cancer sample set (265 samples) (Figure 6 ) were the most relevant samples for selection to represent the "non-angiogenic" subgroup as these samples demonstrated a down-regulation of genes involved in signaling related to angiogenic processes and pathways as defined by functional analysis (Figure 2A and2B ). - An identical hierarchial clustering approach was applied to 105 breast cancer samples. The dominant biology in Breast cancer is ER status and therefore in order to identify the structure in the biology of the samples this cohort was divided into 2 populations for cluster analysis. We identified angiogenesis and vasculature development subtypes (
Figure 11A and11B ) demonstrating the expositing of an angiogenesis subtype from breast cancer samples. - For ease of reference, the following steps are detailed in reference to expression signatures derived from Table 1A or Table 1B. Following the identification of a class of tumors, that form the putative 'angiogenesis' subgroup, computational classification of these tumors versus all others in the tumor cohort with reference to the functional 'angiogenesis' (angiogenesis, vasculature development, immune response) gene list (Table 1A or Table 1B) was performed to identify a refined gene classification model, which classifies the 'angiogenesis' subtype.
- The classification pipeline was used to derive a model using the set of epithelial serous ovarian cancer samples. The classification pipeline has been developed in accordance with commonly accepted good practice (MAQC Consortium, Nat Biotechnol 2010). The process will, in parallel: 1) derive gene classification models from empirical data; and 2) assess the classification performance of the models, both under cross-validation. The performance and success of the classifier generation depends on a number of parameters that can be varied, for instance the choice of classification method or probe set filtering. Taking this into account, two feature sets were evaluated (i) the full feature list with 75% variance/intensity filtering (with forced inclusion of the angiogenesis gene list, Table 1A) and (ii) the angiogenesis gene list only; and three classification algorithms were evaluated, namely PLS; SDA and DSDA. Two feature elimination methods were adopted: (i) Recursive Feature Elimination (RFE) which is an iterative procedure removing a fraction of the lowest-ranked features at each iteration; stopping when only a minimum number of features remain; (ii) Filter Feature Selection (FFS) which pre-ranks the features based on correlation adjusted t-scores (CAT-scores) (ref) and removes the lowest ranking features at each round of feature elimination. The Area Under the Receiver Operator Characteristic Curve (AUC) was used to assess the classification performance, as this measure is independent of cut-off between groups and prevalence rates in the data. It is also one of the recognized measurements of choice for classification performance. As such, the best number of features for each model was chosen based on the average AUC under cross-validation.
- From the analysis described above, the PLS FFS model was deemed to be the most suitable classifier model. Weights were calculated for each gene using PLS regression, resulting in the final gene classifier models (25-gene classifier model for the original approach, and a 45-gene classifier for samples reclassified reflecting recent changes to standard histology protocols) that may be used for validation on external data sets from different array platforms. The gene signature development process was focused upon identification of the ontological processes and pathways relevant to angiogenesis to ensure biological relevance of any signature developed. As such, functional analysis was performed upon both signatures to qualify their relevance to angiogenesis and related processes. The significance processes in
FIGURE 3 andFIGURE 8 are related to angiogenesis and vasculature development. - The performance of both the 25-gene (original approach) and 45-gene (reclassification approach) angiogenesis classifier models were validated by the Area Under the ROC (Receiver Operator Characteristic) Curve (AUC) within the original Almac epithelial serous ovarian cancer dataset and two independent datasets. The AUC is a statistic calculated on the observed disease scale and is a measure of the efficacy of prediction of a phenotype using a classifier model (Wray et al., ). An AUC of 0.5 is typical of a random classifier, and an AUC of 1.0 would represent perfect separation of classes. Therefore, in order to determine if the angiogenesis subtype classifier model is capable of predicting response to, and selecting patients for anti-angiogenic ovarian cancer therapeutic drug classes either as single agent or in combination with standard of care therapies, the hypothesis is that the AUCs following application within these datasets should be above 0.5 with the lowest confidence interval also above 0.5.
- To assess the predictive power of the 25-gene and 45-gene classifier models, they were applied to a dataset of 16 prostate cell-lines following treatment with Dasatanib. The cell-lines were defined as being either a 'responder' or 'non-responder' based upon cell-proliferation assays. This analysis revealed that the 25-gene classifier model is associated with response to Dasatanib, with an AUC of 0.8364 (CI = 0.5255 - 1.0000), indicating that the 25-gene classifier is predictive of response to Dasatanib. The analysis revealed that the 45-gene classifier model is associated with respone to the same compound, with an AUC of 0.9455 (CI = 0.7949 - 1.0000) indicating that the 45-gene classifier is also predictive of response to Dasatanib.
- The expression of angiogenesis genes in probe set
cluster 2 is down regulated in all samples insample Cluster 1 of hierarchial clustering of 265 samples newly classified as serous (Figure 6 bottom labelled Blue bar)). These samples insample cluster 2 have a better prognosis than the rest of the serous samples in samples fromcluster Figure 10 . This indicated that this group is defined by down regulation of expression of the angiogenesis genes identified in Table 1B. Patients with downregulation of genes involved in angiogeneisis and therefore this subgroup is termed a "non-angiogenesis" group. This phenotype has also been identified in ER+ and ER- breast cancer as can be see the middle sample group inFigure 11A and the second sample group inFigure 11B . - Following the identification of a class of tumors, within the 265 samples newly classified as serous, that form the putative 'non-angiogenesis' subgroup, computational classification of these tumors versus all others in the tumor cohort with reference to the functional 'angiogenesis' (angiogenesis, vasculature development, immune response) gene list (Table 1A or Table 1B) was performed to identify a refined gene classification model, which classifies the 'non-angiogenesis' subtype.
- The classification pipeline was used to derive a model using the set of epithelial serous ovarian cancer samples. The methods are analogous to those described above in Example 1.
- Applying the analysis described in Example 1, the PLS FFS model was deemed to be the most suitable classifier model. Weights were calculated for each gene using PLS regression, resulting in the final gene classifier model (63-gene classifier model) that may be used for validation on external data sets from different array platforms.
- The performance of the 63-gene non-angiogenesis classifier model was validated using hazard ratio (HR) within the original Almac epithelial serous ovarian cancer dataset and one independent dataset. The hazard ratio is the ratio of the hazard rates corresponding to the conditions described by two sets of explanatory variables. For example, a treated population may die at twice the rate per unit time as the control population. The hazard ratio would be 2, indicating higher hazard of death from the treatment. Therefore, in order to determine if the non-angiogenesis subtype classifier model is capable of predicting non-response to, and selecting patients that should not be treated with anti-angiogenic cancer therapeutic drug classes, either as single agent or in combination with standard of care therapies, it is expected that the HRs should be below 1.0 with a p-value less than 0.05.
- To assess the prognostic power of the 63-gene classifier models, it was applied first to the discovery data of 265 epithelial serous ovarian samples and then to a dataset of 275 epithelial serous and endometroid ovarian samples (14). Within both datasets the samples were taken at the time of initial surgical resection from patients without prior therapy.
- This analysis revealed that the 63-gene classifier model was independently associated with prognosis in both ovarian cancer datasets. In the discovery set the non-angiogenesis group was associated with significantly better survival compared to the other samples (
FIGURE 12 ); Hazard Ratio = 0.4842, p = 1.307e-05.). Similarly in the independent microarray dataset the non-angiogenesis group demonstrated significantly better survival compared to the other samples (FIGURE 13 ) Hazard Ratio = 0.62 [0.41-0.95], p = 0.029 and OS (multivariable analysis; HR=0.32 [0.19-0.54], p=0.00001. This validates the fact that the 63-gene classifier is an independent prognostic biomarker of survival in ovarian serous and endometroid cancer samples. - The International Collaboration on Ovarian Neoplasms 7 (ICON7) trial is a Gynecologic
Cancer Intergroup phase 3 trial that assessed the effects of adding bevacizumab, concurrently and as a continuation, to standard chemotherapy with carboplatin and paclitaxel in patients with primary peritoneal carcinoma, fallopian tube carcinoma, and epithelial ovarian carcinoma (Perren TJ, Swart AM, Pfisterer J, Ledermann JA, Pujade-Lauraine E, Kristensen G, et al. A , Aghajanian C, Blank SV, Goff BA, Judson PL, Teneriello MG, Husain A, et al. OCEANS: A randomized, double-blind, placebo-controlled phase III trial of chemotherapy with or without bevacizumab in patients with platinum-sensitive recurrent epithelial ovarian, primary peritoneal, or fallopian tube cancer. Journal of Clinical Oncology. 2012; 30(17): 2039-45). - Patient characteristics, progression-free survival, toxicity, and preliminary overall survival data and a summary of quality-of-life (QoL) data have been reported from ICON7. In the standard chemotherapy group, 696 (91%) of 764 women received 18 weeks of chemotherapy by protocol. In the bevacizumab group, 719 (94%) of 764 women received 18 weeks of chemotherapy and bevacizumab and 472 (62%) continued bevacizumab to protocol completion at 54 weeks. The hazard ratio for progression-free survival with standard chemotherapy and bevacizumab was 0.81 (95
% CI 0·70-0·94, p=0·004). In patients at high risk of progression, defined as International Federation of Gynecology and Obstetrics (FIGO) stage IV disease or stage III disease with greater than 1·0 cm of residual disease after debulking surgery, the hazard ratio for death in the bevacizumab group was 0·64 (95% CI 0·48-0·85; p=0·002). - Access was obtained to the ICON7 trail samples via the Medical Research Council (MRC). An honest broker holds the associated clinical data from the MRC. A randomization strategy for profiling the samples has been performed based on clinical factors. All reagents, arrays, and reference samples were previously tested and passed qualification criteria.
- Total RNA was extracted from macrodissected FFPE tissue using the High Pure RNA Paraffin Kit (Roche Diagnostics GmbH, Mannheim, Germany). RNA is converted into complementary deoxyribonucleic acid (cDNA), which is subsequently amplified and converted into single-stranded form using the SPIA® technology of the WT-Ovation™ FFPE RNA Amplification System V2 (NuGEN Technologies Inc., San Carlos, CA, USA). The amplified single-stranded cDNA is then fragemented and biotin labeled using the FL-Ovation™ cDNA Biotin Module V2 (NuGEN Technologies Inc.). The fragmented and labeled cDNA was then hybridized to the Almac Ovarian Cancer DSA, on this the signature was developed. Arrays are scanned using the Affymentrix Genechip® Scanner 7G (Affymetrix Inc., Santa Clara, CA).
- Control UHR and a pooled clinical reference sample are processed in each post RNA extraction batch. QC is be performed at several steps of the process, from RNA Extraction QC to array QC.
- Quality Control (QC) of profiled samples is carried out using the RMA pre-processing algorithm. Different technical aspects are assessed: average noise and background homogeneity, percentage of present call (array quality), signal quality, RNA quality and hybridization quality. Distributions and Median Absolute Deviation of corresponding parameters are analyzed and used to identify possible outliers.
- Almac's Ovarian Cancer DSA™ contains probes that primarily target the area within 300 nucleotides from the 3' end. Therefore standard Affymetrix RNA quality measures were adapted - for housekeeping genes intensities of 3' end probe sets with ratios of 3' end probe set intensity to the average background intensity were used in addition to usual 3'/5' ratios. Hybridization controls were checked to ensure that their intensities and present calls conform to the requirements specified by Affymetrix.
- Samples that pass QC metrics will be deemed suitable for inclusion in subsequent analysis, and signature scores will be calculated (per sample) using the following:
- Background correction
- RefRMA model to pre-process the data, one sample at a time
- The signature score is calculated as a weighted sum of the expression of the genes in the signature:

- Sample IDs and corresponding signature scores will be sent to the honest broker to evaluate the predictive performance of the Ovarian Immune signature to predict resistance to Avastin in the treatment arm of the study.
- Class labels were assigned to samples based upon expression of the angiogenesis-related genes and a 25 and 45 gene expression signatures were developed to identify the pro-angiogenic molecular subgroup of high grade serous (HGS) carcinoma.
- Angiogenesis is central to the process of cancer growth and metastasis and has a role in the progression and prognosis of ovarian cancer. VEGF is an important promoter of angiogenesis produced by normal and neoplastic cells. Bevacizumab (Avastin, Riche) is a recombinant humanised version of a murine anti-human VEGF monoclonal antibody and has been studied in the management of many tumours. The International Collaboration on Ovarian Neoplasms 7 (ICON7) trial is a Gynecologic
Cancer Intergroup phase 3 trial that assessed the effects of adding bevacizumab, concurrently and as a continuation, to standard chemotherapy with carboplatin and paclitaxel in patients with primary peritoneal carcinoma, fallopian tube carcinoma, and epithelial ovarian carcinoma (Perren TJ, Swart AM, Pfisterer J, Ledermann JA, Pujade-Lauraine E, Kristensen G, et al. A , Aghajanian C, Blank SV, Goff BA, Judson PL, Teneriello MG, Husain A, et al. OCEANS: A randomized, double-blind, placebo-controlled phase III trial of chemotherapy with or without bevacizumab in patients with platinum-sensitive recurrent epithelial ovarian, primary peritoneal, or fallopian tube cancer. Journal of Clinical Oncology. 2012; 30(17): 2039-45). - Patient characteristics, progression-free survival, toxicity, and preliminary overall survival data and a summary of quality-of-life (QoL) data have been reported from ICON7. In the standard chemotherapy group, 696 (91%) of 764 women received 18 weeks of chemotherapy by protocol. In the bevacizumab group, 719 (94%) of 764 women received 18 weeks of chemotherapy and bevacizumab and 472 (62%) continued bevacizumab to protocol completion at 54 weeks. The hazard ratio for progression-free survival with standard chemotherapy and bevacizumab was 0.81 (95
% CI 0·70-0·94, p=0·004). In patients at high risk of progression, defined as International Federation of Gynecology and Obstetrics (FIGO) stage IV disease or stage III disease with greater than 1·0 cm of residual disease after debulking surgery, the hazard ratio for death in the bevacizumab group was 0·64 (95% CI 0·48-0·85; p=0·002). - HGS patients with the angiogenic subgroup may benefit from anti-angiogenic targeted therapies. Access to the ICON7 trial samples was obtained via the MRC, and are being profiled on Ovarian DSAs in order to validate this hypothesis.
- H & E Sections of FFPE material from ICON7 trial samples have been pathology reviewed, marked for tumour content and the tumour material macro dissected.
- An honest broker obtained and holds the associated clinical data from the MRC. They have also performed the randomisation strategy, based on clinical factors, for profiling the samples. All reagents, arrays and reference samples were previously tested and passed qualification criteria.
- Total RNA was extracted from macrodissected FFPE tissue using the High Pure RNA Paraffin Kit (Roche Diagnostics GmbH, Mannheim, Germany). RNA is converted into complementary deoxyribonucleic acid (cDNA), which is subsequently amplified and converted into single-stranded form using the SPIA® technology of the WT-Ovation™ FFPE RNA Amplification System V2 (NuGEN Technologies Inc., San Carlos, CA, USA). The amplified single-stranded cDNA is then fragemented and biotin labeled using the FL-Ovation™ cDNA Biotin Module V2 (NuGEN Technologies Inc.). The fragmented and labeled cDNA was then hybridized to the Almac Ovarian Cancer DSA, on this the signature was developed. Arrays are scanned using the Affymentrix Genechip® Scanner 7G (Affymetrix Inc., Santa Clara, CA).
- Control UHR and a pooled clinical reference sample are processed in each post RNA extraction batch. QC is be performed at several steps of the process, from RNA Extraction QC to array QC.
- Quality Control (QC) of profiled samples is carried out using the RMA pre-processing algorithm. Different technical aspects are assessed: average noise and background homogeneity, percentage of present call (array quality), signal quality, RNA quality and hybridization quality. Distributions and Median Absolute Deviation of corresponding parameters are analyzed and used to identify possible outliers.
- Almac's Ovarian Cancer DSATM contains probes that primarily target the area within 300 nucleotides from the 3' end. Therefore standard Affymetrix RNA quality measures were adapted - for housekeeping genes intensities of 3' end probe sets with ratios of 3' end probe set intensity to the average background intensity were used in addition to usual 3'/5' ratios. Hybridization controls were checked to ensure that their intensities and present calls conform to the requirements specified by Affymetrix.
- Samples that pass QC metrics will be deemed suitable for inclusion in subsequent analysis, and signature scores will be calculated (per sample) using the following:
- RefRMA model to pre-process the data, one sample at a time
- The signature score is calculated as a weighted sum of the expression of the genes in the signature:

- where w i is a weight for each gene, bi is a gene-specific bias (Supplementary Table S5), gei is the observed gene expression level after pre-processing, and k = 0.2953 is a constant offset.
- Sample IDs and corresponding signature scores will be sent to the honest broker to evaluate the predictive performance of the pro-angiogenic signature to predict benefit from Avastin in the treatment arm of the study.
- As a secondary endpoint, analysis of the combined signature approach (see
Figure 17 ) will be evaluated. This approach utilizes the 63 gene signature to identify 2 groups, one with a better survival i.e. the group with reduced activation of angiogeneic processes, and the other with poorer survival. The 45 gene signature will be applied to the group with poorer survival outcome to identify a further 2 groups, one with elevated activation of angiogenic processes and the other with indifferent angiogenic activation. It is hyphothesised that the group identified with elevated angiogenic activity should respond to Avastin in the treatment arm of the study. - A public array data set obtained from the Gene Expression Omninbus database for a cohort of recurrent or metastatic colorectal cancer responders and non-responders to Bevacizumab on
plus 2 arrays (E-GEOD-19862) was obtained and analyzed using the example 63 gene signature of Table 2C. The 63 gene ovarian immune signatures predicts response to bevacizumab with an AUC: 0.86 (0.60-1.00). SeeFigure 14 . - In a public array data set obtained from the Gene Expression Omnibus database from a cohort of recurrent or metastatic colorectal cancer responders and non-responders to Bevacizumab on
plus 2 arrays (E-GEOD-19862), the 25 gene and 45 gene angiogenic signatures both predict response to bevacizumab - seeFigures 18 and19 respectively. -
- 1. Friedman HS, Prados MD, Wen PY, et al. Bevacizumab alone and in combination with irinotecan in recurrent glioblastoma. J Clin Oncol;27:4733-40 (2009).
- 2. Hurwitz H, Fehrenbacher L, Novotny W, et al. Bevacizumab plus irinotecan, fluorouracil, and leucovorin for metastatic colorectal cancer. N Engl J Med;350:2335-42 (2004).
- 3. Rini BI, Halabi S, Rosenberg JE, et al. Bevacizumab plus interferon alfa compared with interferon alfa monotherapy in patients with metastatic renal cell carcinoma: CALGB 90206. J Clin Oncol; 26:5422-8 (2008).
- 4. Sandler A, Gray R, Perry MC, et al. Paclitaxel-carboplatin alone or with bevacizumab for non-small-cell lung cancer. N Engl J Med; 355: 2542-50 (2006).
- 5. Wolmark N, Yothers G, O'Connell MJ, et al. A phase III trial comparing mFOLFOX6 to mFOLFOX6 plus bevacizumab in stage II or III carcinoma of the colon: results of NSABP protocol C-08. J Clin Oncol; 27:LBA4 (2009).
- 6. Yang JC, Haworth L, Sherry RM, et al., A randomized trial of bevacizumab, an anti-vascular endothelial growth factor antibody, for metastatic renal cancer, N Engl J Med 349 427-434 (2003).
- 7. Willett CG, Boucher Y, di Tomaso E, et al., Direct evidence that the VEGF-specific antibody bevacizumab has antivascular effects in human rectal cancer, Nat. Med. 10, 145-147 (2004).
- 8. Miller K, Wang M, Gralow J, et al., Paclitaxel plus bevacizumab versus paclitaxel alone for metastatic breast cancer, N Engl J Med 357 2666-2676 (2007).
- 9. Miller KD, Chap LI , Holmes FA, et al., Randomized phase III trial of capecitabine compared with bevacizumab plus capecitabine in patients with previously treated metastatic breast cancer, J Clin Oncol 23 792-799 (2005).
- 10. O'Shaughnessy J, Miles D, Gray RJ, et al., A meta-analysis of overall survival data from three randomized trials of bevacizumab (BV) and first-line chemotherapy as treatment for patients with metastatic breast cancer (MBC), J Clin Oncol 28 (suppl) (abstr 1005) (2010).
- 11. Reck M, von Pawel J, Zatloukal P, et al., Phase III trial of cisplatin plus gemcitabine with either placebo or bevacizumab as first-line therapy for nonsquamous non-small-cell lung cancer: AVAil, J Clin Oncol 27, 1227-1234 (2009).
- 12. Escudier B, Bellmunt J, Negrier S et al., Phase III trial of bevacizumab plus interferon alfa-2a in patients with metastatic renal cell carcinoma (AVOREN): final analysis of overall survival, J Clin Oncol 28, 2144-2150 (2010)
- 13. Burger RA, Sill MW, Monk BJ, et al. Phase II trial of bevacizumab in persistent or recurrent epithelial ovarian cancer or primary peritoneal cancer: a Gynecologic Oncology Group Study. J Clin Oncol; 20;25(33):5165-71 (2007).
- 14 Tothill RW et al. Novel molecular subtypes of serous and endometrioid ovarian cancer linked to clinical outcome. Clin Cancer Res. 14(16), 5198-208 (2008).
-
- <110> Almac Diagnostics Limited Harkin, Dennis Paul Patterson, Fionnuala Trinder, Claire O'Brien, Eamonn J. Michie, Caroline Gourley, Charlie Hill, Laura A. Keating, Katherine E. O'Donnell, Jude Bylesjo, Max Deharo, Steve Proutski, Vitali Kennedy, Richard Davison, Timothy Winter, Andreas McCavigan, Andrena
- <120> Molecular Diagnostic Test for Cancer
- <130> ADL-0802WP
- <150>
US 61/732,761
<151> 2012-12-03 - <160> 975
- <170> PatentIn version 3.5
- <210> 1
<211> 589
<212> DNA
<213> Homo sapiens - <400> 1

- <210> 2
<211> 235
<212> DNA
<213> Homo sapiens - <400> 2

- <210> 3
<211> 139
<212> DNA
<213> Homo sapiens - <400> 3

- <210> 4
<211> 172
<212> DNA
<213> Homo sapiens - <400> 4

- <210> 5
<211> 217
<212> DNA
<213> Homo sapiens - <400> 5

- <210> 6
<211> 156
<212> DNA
<213> Homo sapiens - <400> 6

- <210> 7
<211> 221
<212> DNA
<213> Homo sapiens - <400> 7

- <210> 8
<211> 145
<212> DNA
<213> Homo sapiens - <400> 8

- <210> 9
<211> 213
<212> DNA
<213> Homo sapiens - <400> 9

- <210> 10
<211> 287
<212> DNA
<213> Homo sapiens - <400> 10

- <210> 11
<211> 231
<212> DNA
<213> Homo sapiens - <400> 11

- <210> 12
<211> 245
<212> DNA
<213> Homo sapiens - <400> 12

- <210> 13
<211> 190
<212> DNA
<213> Homo sapiens - <400> 13

- <210> 14
<211> 115
<212> DNA
<213> Homo sapiens - <400> 14

- <210> 15
<211> 179
<212> DNA
<213> Homo sapiens - <400> 15


- <210> 16
<211> 113
<212> DNA
<213> Homo sapiens - <400> 16

- <210> 17
<211> 59
<212> DNA
<213> Homo sapiens - <400> 17
aaagcagact acgagaaaca caaactctac gcctgcgaag tcacccatca gggcctgag 59 - <210> 18
<211> 92
<212> DNA
<213> Homo sapiens - <400> 18

- <210> 19
<211> 298
<212> DNA
<213> Homo sapiens - <400> 19

- <210> 20
<211> 228
<212> DNA
<213> Homo sapiens - <400> 20


- <210> 21
<211> 86
<212> DNA
<213> Homo sapiens - <400> 21

- <210> 22
<211> 158
<212> DNA
<213> Homo sapiens - <400> 22

- <210> 23
<211> 223
<212> DNA
<213> Homo sapiens - <400> 23

- <210> 24
<211> 262
<212> DNA
<213> Homo sapiens - <400> 24

- <210> 25
<211> 245
<212> DNA
<213> Homo sapiens - <400> 25

- <210> 26
<211> 202
<212> DNA
<213> Homo sapiens - <400> 26

- <210> 27
<211> 132
<212> DNA
<213> Homo sapiens - <400> 27

- <210> 28
<211> 53
<212> DNA
<213> Homo sapiens - <400> 28
aagcaagata tcaatgtagc agaattgcac ttgtgcctca cgaacataca taa 53 - <210> 29
<211> 102
<212> DNA
<213> Homo sapiens - <400> 29

- <210> 30
<211> 162
<212> DNA
<213> Homo sapiens - <400> 30

- <210> 31
<211> 159
<212> DNA
<213> Homo sapiens - <400> 31

- <210> 32
<211> 153
<212> DNA
<213> Homo sapiens - <400> 32

- <210> 33
<211> 114
<212> DNA
<213> Homo sapiens - <400> 33

- <210> 34
<211> 112
<212> DNA
<213> Homo sapiens - <400> 34

- <210> 35
<211> 274
<212> DNA
<213> Homo sapiens - <400> 35

- <210> 36
<211> 189
<212> DNA
<213> Homo sapiens - <400> 36

- <210> 37
<211> 151
<212> DNA
<213> Homo sapiens - <400> 37

- <210> 38
<211> 201
<212> DNA
<213> Homo sapiens - <400> 38

- <210> 39
<211> 138
<212> DNA
<213> Homo sapiens - <400> 39

- <210> 40
<211> 205
<212> DNA
<213> Homo sapiens - <400> 40

- <210> 41
<211> 269
<212> DNA
<213> Homo sapiens - <400> 41

- <210> 42
<211> 169
<212> DNA
<213> Homo sapiens - <400> 42

- <210> 43
<211> 234
<212> DNA
<213> Homo sapiens - <400> 43


- <210> 44
<211> 168
<212> DNA
<213> Homo sapiens - <400> 443

- <210> 45
<211> 232
<212> DNA
<213> Homo sapiens - <400> 45

- <210> 46
<211> 234
<212> DNA
<213> Homo sapiens - <400> 46

- <210> 47
<211> 147
<212> DNA
<213> Homo sapiens - <400> 47

- <210> 48
<211> 149
<212> DNA
<213> Homo sapiens - <400> 48

- <210> 49
<211> 152
<212> DNA
<213> Homo sapiens - <400> 49

- <210> 50
<211> 150
<212> DNA
<213> Homo sapiens - <400> 50

- <210> 51
<211> 151
<212> DNA
<213> Homo sapiens - <400> 51

- <210> 52
<211> 147
<212> DNA
<213> Homo sapiens - <400> 52

- <210> 53
<211> 150
<212> DNA
<213> Homo sapiens - <400> 53

- <210> 54
<211> 254
<212> DNA
<213> Homo sapiens - <400> 54

- <210> 55
<211> 239
<212> DNA
<213> Homo sapiens - <400> 55

- <210> 56
<211> 270
<212> DNA
<213> Homo sapiens - <400> 56

- <210> 57
<211> 147
<212> DNA
<213> Homo sapiens - <400> 57

- <210> 58
<211> 97
<212> DNA
<213> Homo sapiens - <400> 58

- <210> 59
<211> 213
<212> DNA
<213> Homo sapiens - <400> 59

- <210> 60
<211> 151
<212> DNA
<213> Homo sapiens - <400> 60

- <210> 61
<211> 116
<212> DNA
<213> Homo sapiens - <400> 61

- <210> 62
<211> 220
<212> DNA
<213> Homo sapiens - <400> 62

- <210> 63
<211> 262
<212> DNA
<213> Homo sapiens - <400> 63

- <210> 64
<211> 72
<212> DNA
<213> Homo sapiens - <400> 64

- <210> 65
<211> 232
<212> DNA
<213> Homo sapiens - <400> 65

- <210> 66
<211> 53
<212> DNA
<213> Homo sapiens - <400> 66
gaccaggaat tcggcttcga cgttggccct gtctgcttcc tgtaaactcc ctc 53 - <210> 67
<211> 76
<212> DNA
<213> Homo sapiens - <400> 67

- <210> 68
<211> 132
<212> DNA
<213> Homo sapiens - <400> 68

- <210> 69
<211> 287
<212> DNA
<213> Homo sapiens - <400> 69

- <210> 70
<211> 36
<212> DNA
<213> Homo sapiens - <400> 70
tgggggggca gaggcgtctg accccaggaa cctgca 36 - <210> 71
<211> 157
<212> DNA
<213> Homo sapiens - <400> 71


- <210> 72
<211> 212
<212> DNA
<213> Homo sapiens - <400> 72

- <210> 73
<211> 225
<212> DNA
<213> Homo sapiens - <400> 73

- <210> 74
<211> 287
<212> DNA
<213> Homo sapiens - <400> 74

- <210> 75
<211> 276
<212> DNA
<213> Homo sapiens - <400> 75


- <210> 76
<211> 222
<212> DNA
<213> Homo sapiens - <400> 76

- <210> 77
<211> 182
<212> DNA
<213> Homo sapiens - <400> 77

- <210> 78
<211> 212
<212> DNA
<213> Homo sapiens - <400> 78

- <210> 79
<211> 238
<212> DNA
<213> Homo sapiens - <400> 79

- <210> 80
<211> 262
<212> DNA
<213> Homo sapiens - <400> 80
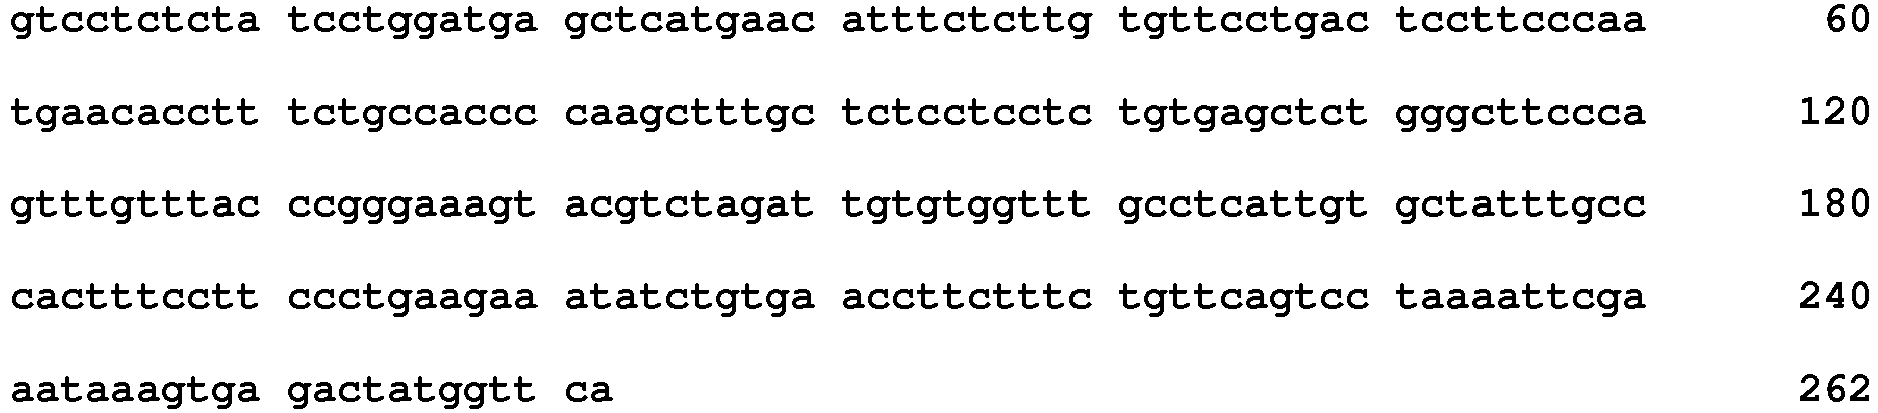
- <210> 81
<211> 129
<212> DNA
<213> Homo sapiens - <400> 81

- <210> 82
<211> 178
<212> DNA
<213> Homo sapiens - <400> 82

- <210> 83
<211> 135
<212> DNA
<213> Homo sapiens - <400> 83

- <210> 84
<211> 235
<212> DNA
<213> Homo sapiens - <400> 84

- <210> 85
<211> 177
<212> DNA
<213> Homo sapiens - <400> 85

- <210> 86
<211> 236
<212> DNA
<213> Homo sapiens - <400> 86

- <210> 87
<211> 243
<212> DNA
<213> Homo sapiens - <400> 87

- <210> 88
<211> 221
<212> DNA
<213> Homo sapiens - <400> 88


- <210> 89
<211> 273
<212> DNA
<213> Homo sapiens - <400> 89

- <210> 90
<211> 225
<212> DNA
<213> Homo sapiens - <400> 90

- <210> 91
<211> 182
<212> DNA
<213> Homo sapiens - <400> 91

- <210> 92
<211> 157
<212> DNA
<213> Homo sapiens - <400> 92


- <210> 93
<211> 201
<212> DNA
<213> Homo sapiens - <400> 93

- <210> 94
<211> 35
<212> DNA
<213> Homo sapiens - <400> 94
atattattgg attatggttc ctgaaggtca ttaaa 35 - <210> 95
<211> 249
<212> DNA
<213> Homo sapiens - <400> 95

- <210> 96
<211> 203
<212> DNA
<213> Homosapiens - <400> 96

- <210> 97
<211> 73
<212> DNA
<213> Homo sapiens - <400> 97

- <210> 98
<211> 123
<212> DNA
<213> Homo sapiens - <400> 98

- <210> 99
<211> 132
<212> DNA
<213> Homo sapiens - <400> 99

- <210> 100
<211> 189
<212> DNA
<213> Homo sapiens - <400> 100

- <210> 101
<211> 265
<212> DNA
<213> Homo sapiens - <400> 101


- <210> 102
<211> 174
<212> DNA
<213> Homo sapiens - <400> 102

- <210> 103
<211> 239
<212> DNA
<213> Homo sapiens - <400> 103

- <210> 104
<211> 110
<212> DNA
<213> Homo sapiens - <400> 104

- <210> 105
<211> 292
<212> DNA
<213> Homo sapiens - <400> 105

- <210> 106
<211> 223
<212> DNA
<213> Homo sapiens - <400> 106

- <210> 107
<211> 275
<212> DNA
<213> Homo sapiens - <400> 107

- <210> 108
<211> 196
<212> DNA
<213> Homo sapiens - <400> 108

- <210> 109
<211> 129
<212> DNA
<213> Homo sapiens - <400> 109

- <210> 110
<211> 296
<212> DNA
<213> Homo sapiens - <400> 110


- <210> 111
<211> 108
<212> DNA
<213> Homo sapiens - <400> 111

- <210> 112
<211> 243
<212> DNA
<213> Homo sapiens - <400> 112

- <210> 113
<211> 52
<212> DNA
<213> Homo sapiens - <400> 113
agtgcaacgt attcaagtcc tcaatatcct gatcataata ccatgctata gg 52 - <210> 114
<211> 294
<212> DNA
<213> Homo sapiens - <400> 114

- <210> 115
<211> 277
<212> DNA
<213> Homo sapiens - <400> 115

- <210> 116
<211> 173
<212> DNA
<213> Homo sapiens - <400> 116

- <210> 117
<211> 217
<212> DNA
<213> Homo sapiens - <400> 117

- <210> 118
<211> 286
<212> DNA
<213> Homo sapiens - <400> 118

- <210> 119
<211> 168
<212> DNA
<213> Homo sapiens - <400> 119

- <210> 120
<211> 150
<212> DNA
<213> Homo sapiens - <400> 120

- <210> 121
<211> 177
<212> DNA
<213> Homo sapiens - <400> 121

- <210> 122
<211> 124
<212> DNA
<213> Homo sapiens - <400> 122

- <210> 123
<211> 64
<212> DNA
<213> Homo sapiens - <400> 123

- <210> 124
<211> 167
<212> DNA
<213> Homo sapiens - <400> 124

- <210> 125
<211> 36
<212> DNA
<213> Homo sapiens - <400> 125
caccactaaa agatcgcagt ttgcctggtg cagtgg 36 - <210> 126
<211> 129
<212> DNA
<213> Homo sapiens - <400> 126

- <210> 127
<211> 150
<212> DNA
<213> Homo sapiens - <400> 127

- <210> 128
<211> 83
<212> DNA
<213> Homo sapiens - <400> 128

- <210> 129
<211> 121
<212> DNA
<213> Homo sapiens - <400> 129

- <210> 130
<211> 257
<212> DNA
<213> Homo sapiens - <400> 130

- <210> 131
<211> 285
<212> DNA
<213> Homo sapiens - <400> 131

- <210> 132
<211> 105
<212> DNA
<213> Homo sapiens - <400> 132

- <210> 133
<211> 205
<212> DNA
<213> Homo sapiens - <400> 133


- <210> 134
<211> 189
<212> DNA
<213> Homo sapiens - <400> 134

- <210> 135
<211> 248
<212> DNA
<213> Homo sapiens - <400> 135

- <210> 136
<211> 99
<212> DNA
<213> Homo sapiens - <400> 136

- <210> 137
<211> 250
<212> DNA
<213> Homo sapiens - <400> 137


- <210> 138
<211> 55
<212> DNA
<213> Homo sapiens - <400> 138
atactggaaa cctaactgca atgtggatgt tttacccaca tgacttatta tgcat 55 - <210> 139
<211> 237
<212> DNA
<213> Homo sapiens - <400> 139

- <210> 140
<211> 216
<212> DNA
<213> Homo sapiens - <400> 140

- <210> 141
<211> 156
<212> DNA
<213> Homo sapiens - <400> 141

- <210> 142
<211> 151
<212> DNA
<213> Homo sapiens - <400> 142


- <210> 143
<211> 151
<212> DNA
<213> Homo sapiens - <400> 143

- <210> 144
<211> 132
<212> DNA
<213> Homo sapiens - <400> 144

- <210> 145
<211> 80
<212> DNA
<213> Homo sapiens - <400> 145

- <210> 146
<211> 94
<212> DNA
<213> Homo sapiens - <400> 146

- <210> 147
<211> 264
<212> DNA
<213> Homo sapiens - <400> 147


- <210> 148
<211> 286
<212> DNA
<213> Homo sapiens - <400> 148

- <210> 149
<211> 42
<212> DNA
<213> Homo sapiens - <400> 149
ccattcctcg ccctgtcccc acagccgagt cctgcatcag cc 42 - <210> 150
<211> 189
<212> DNA
<213> Homo sapiens - <400> 150

- <210> 151
<211> 211
<212> DNA
<213> Homo sapiens - <400> 151

- <210> 152
<211> 211
<212> DNA
<213> Homo sapiens - <400> 152

- <210> 153
<211> 89
<212> DNA
<213> Homo sapiens - <400> 153

- <210> 154
<211> 162
<212> DNA
<213> Homo sapiens - <400> 154

- <210> 155
<211> 86
<212> DNA
<213> Homo sapiens - <400> 155

- <210> 156
<211> 233
<212> DNA
<213> Homo sapiens - <400> 156

- <210> 157
<211> 146
<212> DNA
<213> Homo sapiens - <400> 157

- <210> 158
<211> 265
<212> DNA
<213> Homo sapiens - <400> 158

- <210> 159
<211> 186
<212> DNA
<213> Homo sapiens - <400> 159

- <210> 160
<211> 41
<212> DNA
<213> Homo sapiens - <400> 160
tacaagacca cgcctcccgt gctggactcc gacggctcct t 41 - <210> 161
<211> 45
<212> DNA
<213> Homo sapiens - <400> 161
aacagaaaag aaactgtaga ccttgggaca atcaacattt aaata 45 - <210> 162
<211> 211
<212> DNA
<213> Homo sapiens - <400> 162

- <210> 163
<211> 105
<212> DNA
<213> Homo sapiens - <400> 163

- <210> 164
<211> 175
<212> DNA
<213> Homo sapiens - <400> 164

- <210> 165
<211> 65
<212> DNA
<213> Homo sapiens - <400> 165

- <210> 166
<211> 114
<212> DNA
<213> Homo sapiens - <400> 166

- <210> 167
<211> 100
<212> DNA
<213> Homo sapiens - <400> 167

- <210> 168
<211> 273
<212> DNA
<213> Homo sapiens - <400> 168

- <210> 169
<211> 36
<212> DNA
<213> Homo sapiens - <400> 169
agcaggatca agggccggaa ataaaggctg ttgtaa 36 - <210> 170
<211> 109
<212> DNA
<213> Homo sapiens - <400> 170

- <210> 171
<211> 115
<212> DNA
<213> Homo sapiens - <400> 171

- <210> 172
<211> 175
<212> DNA
<213> Homo sapiens - <400> 172

- <210> 173
<211> 279
<212> DNA
<213> Homo sapiens - <400> 173

- <210> 174
<211> 74
<212> DNA
<213> Homo sapiens - <400> 174

- <210> 175
<211> 48
<212> DNA
<213> Homo sapiens - <400> 175
gccgagatcg tgctagggtg actggagcaa aaccccttca agaaaaga 48 - <210> 176
<211> 164
<212> DNA
<213> Homo sapiens - <400> 176

- <210> 177
<211> 34
<212> DNA
<213> Homo sapiens - <400> 177
attccaggac tttggcgcct tcaccgggag catg 34 - <210> 178
<211> 32
<212> DNA
<213> Homo sapiens - <400> 178
cacaaagctc tgtcaataag tgatacatgt tt 32 - <210> 179
<211> 141
<212> DNA
<213> Homo sapiens - <400> 179

- <210> 180
<211> 211
<212> DNA
<213> Homo sapiens - <400> 180

- <210> 181
<211> 127
<212> DNA
<213> Homo sapiens - <400> 181

- <210> 182
<211> 251
<212> DNA
<213> Homo sapiens - <400> 182


- <210> 183
<211> 248
<212> DNA
<213> Homo sapiens - <400> 183

- <210> 184
<211> 71
<212> DNA
<213> Homo sapiens - <400> 184

- <210> 185
<211> 163
<212> DNA
<213> Homo sapiens - <400> 185

- <210> 186
<211> 258
<212> DNA
<213> Homo sapiens - <220>
<221> misc_feature
<222> (61)..(61)
<223> n is a, c, g, or t - <400> 186


- <210> 187
<211> 89
<212> DNA
<213> Homo sapiens - <400> 187

- <210> 188
<211> 193
<212> DNA
<213> Homo sapiens - <220>
<221> misc_feature
<222> (120)..(125)
<223> n is a, c, g, or t - <220>
<221> misc_feature
<222> (127)..(127)
<223> n is a, c, g, or t - <400> 188

- <210> 189
<211> 173
<212> DNA
<213> Homo sapiens - <400> 189

- <210> 190
<211> 265
<212> DNA
<213> Homo sapiens - <220>
<221> misc_feature
<222> (41)..(41)
<223> n is a, c, g, or t - <400> 190

- <210> 191
<211> 217
<212> DNA
<213> Homo sapiens - <400> 191

- <210> 192
<211> 168
<212> DNA
<213> Homo sapiens - <400> 192

- <210> 193
<211> 115
<212> DNA
<213> Homo sapiens - <400> 193

- <210> 194
<211> 193
<212> DNA
<213> Homo sapiens - <220>
<221> misc_feature
<222> (147)..(147)
<223> n is a, c, g, or t - <220>
<221> misc_feature
<222> (164)..(164)
<223> n is a, c, g, or t - <400> 194

- <210> 195
<211> 233
<212> DNA
<213> Homo sapiens - <220>
<221> misc_feature
<222> (35)..(35)
<223> n is a, c, g, or t - <220>
<221> misc_feature
<222> (53)..(53)
<223> n is a, c, g, or t - <220>
<221> misc_feature
<222> (60)..(60)
<223> n is a, c, g, or t - <400> 195

- <210> 196
<211> 139
<212> DNA
<213> Homo sapiens - <400> 196


- <210> 197
<211> 178
<212> DNA
<213> Homo sapiens - <400> 197

- <210> 198
<211> 163
<212> DNA
<213> Homo sapiens - <400> 198

- <210> 199
<211> 104
<212> DNA
<213> Homo sapiens - <400> 199

- <210> 200
<211> 222
<212> DNA
<213> Homo sapiens - <220>
<221> misc_feature
<222> (93)..(93)
<223> n is a, c, g, or t - <400> 200

- <210> 201
<211> 267
<212> DNA
<213> Homo sapiens - <400> 201
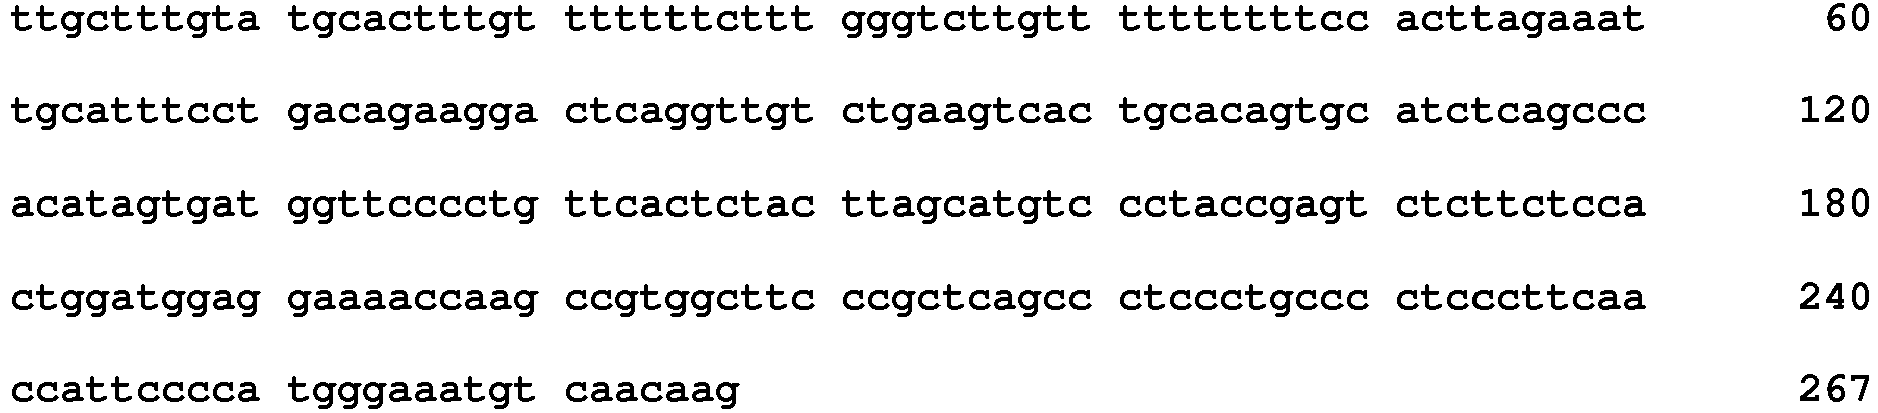
- <210> 202
<211> 108
<212> DNA
<213> Homo sapiens - <400> 202

- <210> 203
<211> 209
<212> DNA
<213> Homo sapiens - <400> 203

- <210> 204
<211> 146
<212> DNA
<213> Homo sapiens - <400> 204

- <210> 205
<211> 48
<212> DNA
<213> Homo sapiens - <400> 205
agtgccaaag gatcttcccc ctgacacaac tctgctagac ctgcaaaa 48 - <210> 206
<211> 150
<212> DNA
<213> Homo sapiens - <400> 206

- <210> 207
<211> 186
<212> DNA
<213> Homo sapiens - <400> 207

- <210> 208
<211> 276
<212> DNA
<213> Homo sapiens - <400> 208

- <210> 209
<211> 158
<212> DNA
<213> Homo sapiens - <400> 209

- <210> 210
<211> 225
<212> DNA
<213> Homo sapiens - <400> 210

- <210> 211
<211> 174
<212> DNA
<213> Homo sapiens - <400> 211

- <210> 212
<211> 168
<212> DNA
<213> Homo sapiens - <400> 212

- <210> 213
<211> 165
<212> DNA
<213> Homo sapiens - <400> 213

- <210> 214
<211> 208
<212> DNA
<213> Homo sapiens - <400> 214

- <210> 215
<211> 245
<212> DNA
<213> Homo sapiens - <400> 215

- <210> 216
<211> 257
<212> DNA
<213> Homo sapiens - <400> 216

- <210> 217
<211> 174
<212> DNA
<213> Homo sapiens - <400> 217

- <210> 218
<211> 191
<212> DNA
<213> Homo sapiens - <400> 218

- <210> 219
<211> 116
<212> DNA
<213> Homo sapiens - <400> 219

- <210> 220
<211> 181
<212> DNA
<213> Homo sapiens - <400> 220

- <210> 221
<211> 248
<212> DNA
<213> Homo sapiens - <400> 221

- <210> 222
<211> 227
<212> DNA
<213> Homo sapiens - <400> 222

- <210> 223
<211> 194
<212> DNA
<213> Homo sapiens - <400> 223

- <210> 224
<211> 217
<212> DNA
<213> Homo sapiens - <400> 224

- <210> 225
<211> 293
<212> DNA
<213> Homo sapiens - <400> 225

- <210> 226
<211> 95
<212> DNA
<213> Homo sapiens - <400> 226

- <210> 227
<211> 210
<212> DNA
<213> Homo sapiens - <400> 227


- <210> 228
<211> 243
<212> DNA
<213> Homo sapiens - <400> 228

- <210> 229
<211> 37
<212> DNA
<213> Homo sapiens - <400> 229
gatgcttaac aaaggttacc ataagccaca aattcat 37 - <210> 230
<211> 264
<212> DNA
<213> Homo sapiens - <400> 230

- <210> 231
<211> 269
<212> DNA
<213> Homo sapiens - <400> 231

- <210> 232
<211> 179
<212> DNA
<213> Homo sapiens - <400> 232

- <210> 233
<211> 220
<212> DNA
<213> Homo sapiens - <400> 233

- <210> 234
<211> 127
<212> DNA
<213> Homo sapiens - <400> 234

- <210> 235
<211> 225
<212> DNA
<213> Homo sapiens - <400> 235

- <210> 236
<211> 41
<212> DNA
<213> Homo sapiens - <400> 236
ttaatctatg tgcaccgttg ggaccaatgc cttaattaaa g 41 - <210> 237
<211> 160
<212> DNA
<213> Homo sapiens - <400> 237

- <210> 238
<211> 179
<212> DNA
<213> Homo sapiens - <400> 238

- <210> 239
<211> 164
<212> DNA
<213> Homo sapiens - <400> 239

- <210> 240
<211> 167
<212> DNA
<213> Homo sapiens - <400> 240

- <210> 241
<211> 183
<212> DNA
<213> Homo sapiens - <400> 241


- <210> 242
<211> 237
<212> DNA
<213> Homo sapiens - <400> 242

- <210> 243
<211> 197
<212> DNA
<213> Homo sapiens - <400> 243

- <210> 244
<211> 131
<212> DNA
<213> Homo sapiens - <400> 244

- <210> 245
<211> 95
<212> DNA
<213> Homo sapiens - <400> 245

- <210> 246
<211> 131
<212> DNA
<213> Homo sapiens - <400> 246

- <210> 247
<211> 38
<212> DNA
<213> Homo sapiens - <400> 247
tttcccccac tgtctggaca ctggtgaatg acattaga 38 - <210> 248
<211> 173
<212> DNA
<213> Homo sapiens - <400> 248

- <210> 249
<211> 298
<212> DNA
<213> Homo sapiens - <400> 249

- <210> 250
<211> 145
<212> DNA
<213> Homo sapiens - <400> 250

- <210> 251
<211> 111
<212> DNA
<213> Homo sapiens - <400> 251

- <210> 252
<211> 137
<212> DNA
<213> Homo sapiens - <400> 252

- <210> 253
<211> 203
<212> DNA
<213> Homo sapiens - <400> 253

- <210> 254
<211> 243
<212> DNA
<213> Homo sapiens - <400> 254

- <210> 255
<211> 292
<212> DNA
<213> Homo sapiens - <400> 255

- <210> 256
<211> 156
<212> DNA
<213> Homo sapiens - <400> 256

- <210> 257
<211> 249
<212> DNA
<213> Homo sapiens - <220>
<221> misc_feature
<222> (142)..(142)
<223> n is a, c, g, or t - <220>
<221> misc_feature
<222> (188)..(188)
<223> n is a, c, g, or t - <400> 257

- <210> 258
<211> 62
<212> DNA
<213> Homo sapiens - <400> 258

- <210> 259
<211> 126
<212> DNA
<213> Homo sapiens - <400> 259

- <210> 260
<211> 149
<212> DNA
<213> Homo sapiens - <400> 260

- <210> 261
<211> 163
<212> DNA
<213> Homo sapiens - <400> 261

- <210> 262
<211> 269
<212> DNA
<213> Homo sapiens - <400> 262

- <210> 263
<211> 105
<212> DNA
<213> Homo sapiens - <400> 263


- <210> 264
<211> 174
<212> DNA
<213> Homo sapiens - <400> 264

- <210> 265
<211> 218
<212> DNA
<213> Homo sapiens - <400> 265

- <210> 266
<211> 103
<212> DNA
<213> Homo sapiens - <400> 266

- <210> 267
<211> 194
<212> DNA
<213> Homo sapiens - <400> 267

- <210> 268
<211> 61
<212> DNA
<213> Homo sapiens - <400> 268

- <210> 269
<211> 268
<212> DNA
<213> Homo sapiens - <400> 269

- <210> 270
<211> 37
<212> DNA
<213> Homo sapiens - <400> 270
tgggctggag ccgcacacgc tctcctccca tgttaaa 37 - <210> 271
<211> 112
<212> DNA
<213> Homo sapiens - <400> 271

- <210> 272
<211> 158
<212> DNA
<213> Homo sapiens - <400> 272

- <210> 273
<211> 75
<212> DNA
<213> Homo sapiens - <400> 273


- <210> 274
<211> 182
<212> DNA
<213> Homo sapiens - <400> 274

- <210> 275
<211> 121
<212> DNA
<213> Homo sapiens - <400> 275

- <210> 276
<211> 177
<212> DNA
<213> Homo sapiens - <400> 276

- <210> 277
<211> 237
<212> DNA
<213> Homo sapiens - <400> 277

- <210> 278
<211> 43
<212> DNA
<213> Homo sapiens - <400> 278
caatggttga gcccctgtca agtgccagtc atgatagtag taa 43 - <210> 279
<211> 198
<212> DNA
<213> Homo sapiens - <400> 279

- <210> 280
<211> 70
<212> DNA
<213> Homo sapiens - <400> 280

- <210> 281
<211> 94
<212> DNA
<213> Homo sapiens - <400> 281

- <210> 282
<211> 165
<212> DNA
<213> Homo sapiens - <400> 282

- <210> 283
<211> 208
<212> DNA
<213> Homo sapiens - <400> 283


- <210> 284
<211> 227
<212> DNA
<213> Homo sapiens - <400> 284

- <210> 285
<211> 57
<212> DNA
<213> Homo sapiens - <400> 285
tattgaggac ccatggtaaa atgcaaatag atccggtgtc taaatgcatt catattt 57 - <210> 286
<211> 135
<212> DNA
<213> Homo sapiens - <400> 286

- <210> 287
<211> 247
<212> DNA
<213> Homo sapiens - <400> 287

- <210> 288
<211> 174
<212> DNA
<213> Homo sapiens - <400> 288

- <210> 289
<211> 126
<212> DNA
<213> Homo sapiens - <400> 289

- <210> 290
<211> 132
<212> DNA
<213> Homo sapiens - <400> 290

- <210> 291
<211> 173
<212> DNA
<213> Homo sapiens - <400> 291

- <210> 292
<211> 274
<212> DNA
<213> Homo sapiens - <400> 292


- <210> 293
<211> 185
<212> DNA
<213> Homo sapiens - <400> 293

- <210> 294
<211> 42
<212> DNA
<213> Homo sapiens - <400> 294
tcatgacgag ttaatgcatg tccgtggttg ggtgcacctg ta 42 - <210> 295
<211> 250
<212> DNA
<213> Homo sapiens - <400> 295

- <210> 296
<211> 247
<212> DNA
<213> Homo sapiens - <400> 296

- <210> 297
<211> 112
<212> DNA
<213> Homo sapiens - <400> 297

- <210> 298
<211> 278
<212> DNA
<213> Homo sapiens - <400> 298

- <210> 299
<211> 137
<212> DNA
<213> Homo sapiens - <400> 299

- <210> 300
<211> 252
<212> DNA
<213> Homo sapiens - <400> 300

- <210> 301
<211> 106
<212> DNA
<213> Homo sapiens - <400> 301

- <210> 302
<211> 294
<212> DNA
<213> Homo sapiens - <400> 302

- <210> 303
<211> 238
<212> DNA
<213> Homo sapiens - <400> 303

- <210> 304
<211> 258
<212> DNA
<213> Homo sapiens - <400> 304

- <210> 305
<211> 85
<212> DNA
<213> Homo sapiens - <400> 305


- <210> 306
<211> 299
<212> DNA
<213> Homo sapiens - <220>
<221> misc_feature
<222> (127)..(127)
<223> n is a, c, g, or t - <220>
<221> misc_feature
<222> (194)..(194)
<223> n is a, c, g, or t - <400> 306

- <210> 307
<211> 229
<212> DNA
<213> Homo sapiens - <400> 307

- <210> 308
<211> 213
<212> DNA
<213> Homo sapiens - <400> 308

- <210> 309
<211> 174
<212> DNA
<213> Homo sapiens - <400> 309

- <210> 310
<211> 32
<212> DNA
<213> Homo sapiens - <400> 310
atggacaatt ctgtacccca ataatcagaa ca 32 - <210> 311
<211> 166
<212> DNA
<213> Homo sapiens - <220>
<221> misc_feature
<222> (101)..(101)
<223> n is a, c, g, or t - <400> 311

- <210> 312
<211> 213
<212> DNA
<213> Homo sapiens - <400> 312

- <210> 313
<211> 225
<212> DNA
<213> Homo sapiens - <400> 313


- <210> 314
<211> 259
<212> DNA
<213> Homo sapiens - <400> 314

- <210> 315
<211> 217
<212> DNA
<213> Homo sapiens - <400> 315

- <210> 316
<211> 243
<212> DNA
<213> Homo sapiens - <400> 316

- <210> 317
<211> 172
<212> DNA
<213> Homo sapiens - <400> 317


- <210> 318
<211> 100
<212> DNA
<213> Homo sapiens - <400> 318

- <210> 319
<211> 32
<212> DNA
<213> Homo sapiens - <400> 319
ttataatgag tgcgatatat gttgtcgagg ct 32 - <210> 320
<211> 210
<212> DNA
<213> Homo sapiens - <400> 320

- <210> 321
<211> 115
<212> DNA
<213> Homo sapiens - <400> 321

- <210> 322
<211> 241
<212> DNA
<213> Homo sapiens - <400> 322


- <210> 323
<211> 148
<212> DNA
<213> Homo sapiens - <220>
<221> misc_feature
<222> (89)..(89)
<223> n is a, c, g, or t - <220>
<221> misc_feature
<222> (91)..(93)
<223> n is a, c, g, or t - <400> 323

- <210> 324
<211> 198
<212> DNA
<213> Homo sapiens - <400> 324

- <210> 325
<211> 269
<212> DNA
<213> Homo sapiens - <400> 325

- <210> 326
<211> 243
<212> DNA
<213> Homo sapiens - <400> 326

- <210> 327
<211> 178
<212> DNA
<213> Homo sapiens - <220>
<221> misc_feature
<222> (84)..(84)
<223> n is a, c, g, or t - <220>
<221> misc_feature
<222> (89)..(89)
<223> n is a, c, g, or t - <220>
<221> misc_feature
<222> (123)..(123)
<223> n is a, c, g, or t - <400> 327

- <210> 328
<211> 238
<212> DNA
<213> Homo sapiens - <400> 328

- <210> 329
<211> 155
<212> DNA
<213> Homo sapiens - <400> 329

- <210> 330
<211> 47
<212> DNA
<213> Homo sapiens - <400> 330
gggatgcata aagtatgagt gccttttagg atgggaattg agatgta 47 - <210> 331
<211> 235
<212> DNA
<213> Homo sapiens - <220>
<221> misc_feature
<222> (157)..(157)
<223> n is a, c, g, or t - <400> 331

- <210> 332
<211> 38
<212> DNA
<213> Homo sapiens - <400> 332
tttggatttg aatccactca gccggtgcac accttaaa 38 - <210> 333
<211> 265
<212> DNA
<213> Homo sapiens - <400> 333

- <210> 334
<211> 56
<212> DNA
<213> Homo sapiens - <400> 334
cacaatctga gcacgctacc aaatctcaaa atatcctaag actaacaaag gcagct 56 - <210> 335
<211> 289
<212> DNA
<213> Homo sapiens - <400> 335

- <210> 336
<211> 212
<212> DNA
<213> Homo sapiens - <400> 336

- <210> 337
<211> 294
<212> DNA
<213> Homo sapiens - <400> 337

- <210> 338
<211> 52
<212> DNA
<213> Homo sapiens - <400> 338
gaggccggtg ccagtgcagg tccttggtgt gctgtgtgcc ggtcccctgg gc 52 - <210> 339
<211> 297
<212> DNA
<213> Homo sapiens - <400> 339
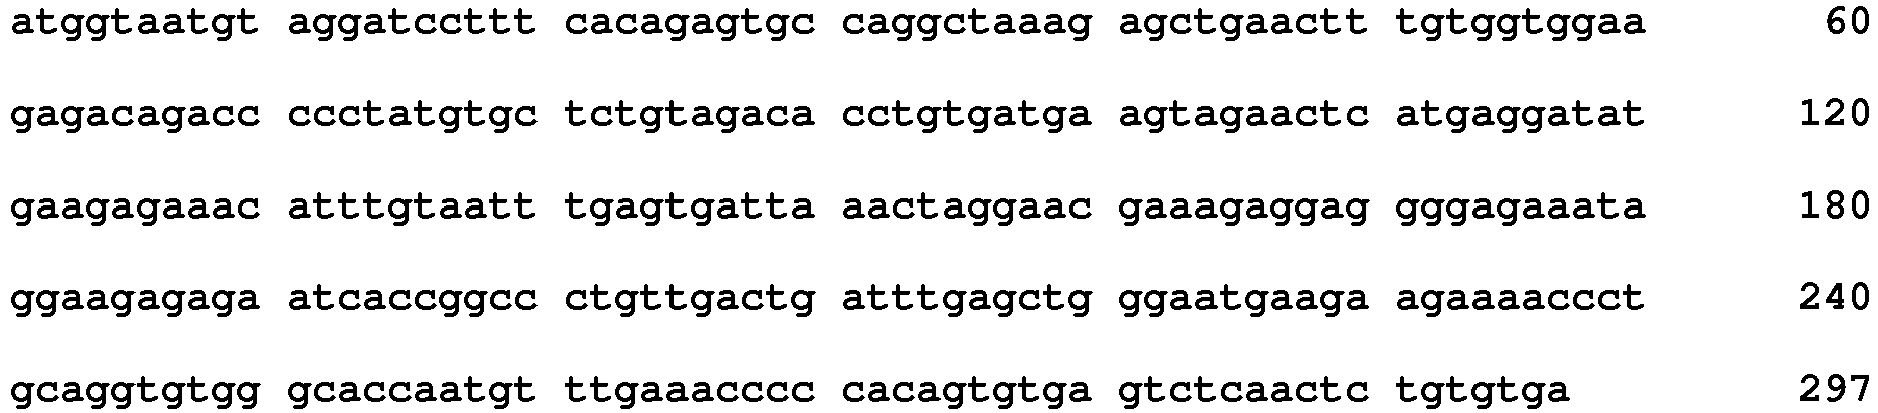
- <210> 340
<211> 223
<212> DNA
<213> Homo sapiens - <400> 340

- <210> 341
<211> 238
<212> DNA
<213> Homo sapiens - <400> 341

- <210> 342
<211> 129
<212> DNA
<213> Homo sapiens - <400> 342


- <210> 343
<211> 277
<212> DNA
<213> Homo sapiens - <400> 343

- <210> 344
<211> 231
<212> DNA
<213> Homo sapiens - <220>
<221> misc_feature
<222> (92)..(92)
<223> n is a, c, g, or t - <220>
<221> misc_feature
<222> (105)..(105)
<223> n is a, c, g, or t - <220>
<221> misc_feature
<222> (160)..(160)
<223> n is a, c, g, or t - <220>
<221> misc_feature
<222> (169)..(170)
<223> n is a, c, g, or t - <220>
<221> misc_feature
<222> (172)..(176)
<223> n is a, c, g, or t - <220>
<221> misc_feature
<222> (178)..(180)
<223> n is a, c, g, or t - <220>
<221> misc_feature
<222> (182)..(182)
<223> n is a, c, g, or t - <220>
<221> misc_feature
<222> (186)..(187)
<223> n is a, c, g, or t - <400> 344

- <210> 345
<211> 262
<212> DNA
<213> Homo sapiens - <400> 345

- <210> 346
<211> 187
<212> DNA
<213> Homo sapiens - <400> 346

- <210> 347
<211> 180
<212> DNA
<213> Homo sapiens - <400> 347

- <210> 348
<211> 55
<212> DNA
<213> Homo sapiens - <400> 348
cagatcgaca cgcagctagc ctcctgcatt gtatggttat aaatagcacc ctagt 55 - <210> 349
<211> 207
<212> DNA
<213> Homo sapiens - <400> 349

- <210> 350
<211> 241
<212> DNA
<213> Homo sapiens - <220>
<221> misc_feature
<222> (93)..(93)
<223> n is a, c, g, or t - <220>
<221> misc_feature
<222> (97)..(97)
<223> n is a, c, g, or t - <400> 350

- <210> 351
<211> 261
<212> DNA
<213> Homo sapiens - <400> 351

- <210> 352
<211> 274
<212> DNA
<213> Homo sapiens - <400> 352

- <210> 353
<211> 179
<212> DNA
<213> Homo sapiens - <400> 353

- <210> 354
<211> 249
<212> DNA
<213> Homo sapiens - <400> 354

- <210> 355
<211> 64
<212> DNA
<213> Homo sapiens - <400> 355

- <210> 356
<211> 57
<212> DNA
<213> Homo sapiens - <400> 356
atgaggcaga atctggttgg gtatgtttct tatatatgtt tgaagcagat ggctgac 57 - <210> 357
<211> 141
<212> DNA
<213> Homo sapiens - <400> 357

- <210> 358
<211> 108
<212> DNA
<213> Homo sapiens - <400> 358

- <210> 359
<211> 158
<212> DNA
<213> Homo sapiens - <400> 359

- <210> 360
<211> 157
<212> DNA
<213> Homo sapiens - <400> 360

- <210> 361
<211> 273
<212> DNA
<213> Homo sapiens - <400> 361


- <210> 362
<211> 257
<212> DNA
<213> Homo sapiens - <400> 362

- <210> 363
<211> 268
<212> DNA
<213> Homo sapiens - <400> 363

- <210> 364
<211> 290
<212> DNA
<213> Homo sapiens - <400> 364

- <210> 365
<211> 205
<212> DNA
<213> Homo sapiens - <400> 365

- <210> 366
<211> 278
<212> DNA
<213> Homo sapiens - <400> 366

- <210> 367
<211> 41
<212> DNA
<213> Homo sapiens - <400> 367
tcctcatggt ggcagcgctc atagcgaaag cctactgtaa t 41 - <210> 368
<211> 133
<212> DNA
<213> Homo sapiens - <400> 368

- <210> 369
<211> 74
<212> DNA
<213> Homo sapiens - <400> 369

- <210> 370
<211> 172
<212> DNA
<213> Homo sapiens - <400> 370

- <210> 371
<211> 258
<212> DNA
<213> Homo sapiens - <400> 371

- <210> 372
<211> 103
<212> DNA
<213> Homo sapiens - <400> 372

- <210> 373
<211> 258
<212> DNA
<213> Homo sapiens - <400> 373

- <210> 374
<211> 252
<212> DNA
<213> Homo sapiens - <400> 374

- <210> 375
<211> 210
<212> DNA
<213> Homo sapiens - <400> 375

- <210> 376
<211> 258
<212> DNA
<213> Homo sapiens - <400> 376

- <210> 377
<211> 218
<212> DNA
<213> Homo sapiens - <400> 377

- <210> 378
<211> 267
<212> DNA
<213> Homo sapiens - <400> 378

- <210> 379
<211> 230
<212> DNA
<213> Homo sapiens - <400> 379

- <210> 380
<211> 196
<212> DNA
<213> Homo sapiens - <400> 380

- <210> 381
<211> 267
<212> DNA
<213> Homo sapiens - <400> 381

- <210> 382
<211> 280
<212> DNA
<213> Homo sapiens - <400> 382

- <210> 383
<211> 72
<212> DNA
<213> Homo sapiens - <400> 383

- <210> 384
<211> 260
<212> DNA
<213> Homo sapiens - <400> 384

- <210> 385
<211> 222
<212> DNA
<213> Homo sapiens - <400> 385

- <210> 386
<211> 216
<212> DNA
<213> Homo sapiens - <400> 386


- <210> 387
<211> 35
<212> DNA
<213> Homo sapiens - <400> 387
ttggatagca gctatcttgt tggatgtgag gtgga 35 - <210> 388
<211> 258
<212> DNA
<213> Homo sapiens - <400> 388

- <210> 389
<211> 275
<212> DNA
<213> Homo sapiens - <220>
<221> misc_feature
<222> (195)..(195)
<223> n is a, c, g, or t - <400> 389

- <210> 390
<211> 281
<212> DNA
<213> Homo sapiens - <400> 390

- <210> 391
<211> 274
<212> DNA
<213> Homo sapiens - <400> 391

- <210> 392
<211> 89
<212> DNA
<213> Homo sapiens - <400> 392

- <210> 393
<211> 72
<212> DNA
<213> Homo sapiens - <400> 393

- <210> 394
<211> 177
<212> DNA
<213> Homo sapiens - <400> 394

- <210> 395
<211> 117
<212> DNA
<213> Homo sapiens - <400> 395

- <210> 396
<211> 164
<212> DNA
<213> Homo sapiens - <400> 396

- <210> 397
<211> 259
<212> DNA
<213> Homo sapiens - <220>
<221> misc_feature
<222> (139)..(139)
<223> n is a, c, g, or t - <400> 397

- <210> 398
<211> 104
<212> DNA
<213> Homo sapiens - <400> 398

- <210> 399
<211> 147
<212> DNA
<213> Homo sapiens - <400> 399

- <210> 400
<211> 208
<212> DNA
<213> Homo sapiens - <400> 400

- <210> 401
<211> 139
<212> DNA
<213> Homo sapiens - <400> 401

- <210> 402
<211> 243
<212> DNA
<213> Homo sapiens - <400> 402

- <210> 403
<211> 298
<212> DNA
<213> Homo sapiens - <400> 403


- <210> 404
<211> 193
<212> DNA
<213> Homo sapiens - <400> 404

- <210> 405
<211> 275
<212> DNA
<213> Homo sapiens - <400> 405

- <210> 406
<211> 143
<212> DNA
<213> Homo sapiens - <400> 406

- <210> 407
<211> 263
<212> DNA
<213> Homo sapiens - <400> 407


- <210> 408
<211> 300
<212> DNA
<213> Homo sapiens - <400> 408

- <210> 409
<211> 238
<212> DNA
<213> Homo sapiens - <400> 409

- <210> 410
<211> 101
<212> DNA
<213> Homo sapiens - <400> 410

- <210> 411
<211> 34
<212> DNA
<213> Homo sapiens - <400> 411
tttatgaaca gcagactcta tgtaaaggca tttt 34 - <210> 412
<211> 168
<212> DNA
<213> Homo sapiens - <400> 412

- <210> 413
<211> 150
<212> DNA
<213> Homo sapiens - <400> 413

- <210> 414
<211> 124
<212> DNA
<213> Homo sapiens - <400> 414

- <210> 415
<211> 93
<212> DNA
<213> Homo sapiens - <400> 415

- <210> 416
<211> 76
<212> DNA
<213> Homo sapiens - <400> 416

- <210> 417
<211> 220
<212> DNA
<213> Homo sapiens - <400> 417


- <210> 418
<211> 98
<212> DNA
<213> Homo sapiens - <400> 418

- <210> 419
<211> 97
<212> DNA
<213> Homo sapiens - <400> 419

- <210> 420
<211> 87
<212> DNA
<213> Homo sapiens - <400> 420

- <210> 421
<211> 36
<212> DNA
<213> Homo sapiens - <400> 421
aaaaaagttc aactagtatg aaagggttat aaagta 36 - <210> 422
<211> 116
<212> DNA
<213> Homo sapiens - <400> 422

- <210> 423
<211> 264
<212> DNA
<213> Homo sapiens - <400> 423

- <210> 424
<211> 119
<212> DNA
<213> Homo sapiens - <400> 424

- <210> 425
<211> 279
<212> DNA
<213> Homo sapiens - <400> 425

- <210> 426
<211> 130
<212> DNA
<213> Homo sapiens - <400> 426

- <210> 427
<211> 262
<212> DNA
<213> Homo sapiens - <400> 427


- <210> 428
<211> 140
<212> DNA
<213> Homo sapiens - <400> 428

- <210> 429
<211> 143
<212> DNA
<213> Homo sapiens - <400> 429

- <210> 430
<211> 151
<212> DNA
<213> Homo sapiens - <400> 430

- <210> 431
<211> 150
<212> DNA
<213> Homo sapiens - <400> 431

- <210> 432
<211> 115
<212> DNA
<213> Homo sapiens - <400> 432

- <210> 433
<211> 223
<212> DNA
<213> Homo sapiens - <400> 433

- <210> 434
<211> 272
<212> DNA
<213> Homo sapiens - <400> 434

- <210> 435
<211> 221
<212> DNA
<213> Homo sapiens - <400> 435

- <210> 436
<211> 183
<212> DNA
<213> Homo sapiens - <400> 436

- <210> 437
<211> 237
<212> DNA
<213> Homo sapiens - <400> 437

- <210> 438
<211> 189
<212> DNA
<213> Homo sapiens - <400> 438

- <210> 439
<211> 246
<212> DNA
<213> Homo sapiens - <400> 439
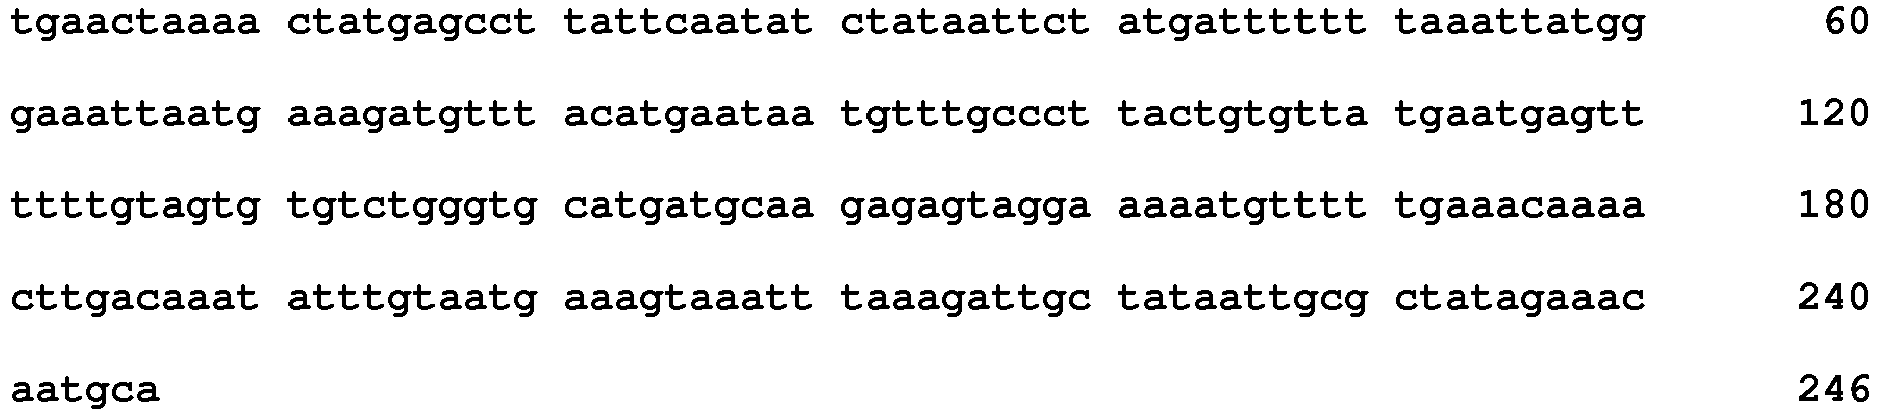
- <210> 440
<211> 65
<212> DNA
<213> Homo sapiens - <400> 440


- <210> 441
<211> 120
<212> DNA
<213> Homo sapiens - <400> 441

- <210> 442
<211> 156
<212> DNA
<213> Homo sapiens - <400> 442

- <210> 443
<211> 169
<212> DNA
<213> Homo sapiens - <400> 443

- <210> 444
<211> 87
<212> DNA
<213> Homo sapiens - <400> 444

- <210> 445
<211> 96
<212> DNA
<213> Homo sapiens - <400> 445

- <210> 446
<211> 269
<212> DNA
<213> Homo sapiens - <400> 446

- <210> 447
<211> 188
<212> DNA
<213> Homo sapiens - <400> 447

- <210> 448
<211> 246
<212> DNA
<213> Homo sapiens - <400> 448

- <210> 449
<211> 217
<212> DNA
<213> Homo sapiens - <400> 449

- <210> 450
<211> 172
<212> DNA
<213> Homo sapiens - <400> 450

- <210> 451
<211> 188
<212> DNA
<213> Homo sapiens - <400> 451

- <210> 452
<211> 242
<212> DNA
<213> Homo sapiens - <400> 452

- <210> 453
<211> 33
<212> DNA
<213> Homo sapiens - <400> 453
gtgagcccat atcgtactgc tgcagtccag cct 33 - <210> 454
<211> 83
<212> DNA
<213> Homo sapiens - <400> 454


- <210> 455
<211> 232
<212> DNA
<213> Homo sapiens - <400> 455

- <210> 456
<211> 275
<212> DNA
<213> Homo sapiens - <400> 456

- <210> 457
<211> 220
<212> DNA
<213> Homo sapiens - <400> 457

- <210> 458
<211> 187
<212> DNA
<213> Homo sapiens - <400> 458

- <210> 459
<211> 176
<212> DNA
<213> Homo sapiens - <400> 459

- <210> 460
<211> 266
<212> DNA
<213> Homo sapiens - <400> 460

- <210> 461
<211> 286
<212> DNA
<213> Homo sapiens - <400> 461

- <210> 462
<211> 278
<212> DNA
<213> Homo sapiens - <220>
<221> misc_feature
<222> (214)..(214)
<223> n is a, c, g, or t - <400> 462


- <210> 463
<211> 122
<212> DNA
<213> Homo sapiens - <400> 463

- <210> 464
<211> 161
<212> DNA
<213> Homo sapiens - <400> 464

- <210> 465
<211> 162
<212> DNA
<213> Homo sapiens - <400> 465

- <210> 466
<211> 114
<212> DNA
<213> Homo sapiens - <400> 466

- <210> 467
<211> 223
<212> DNA
<213> Homo sapiens - <400> 467

- <210> 468
<211> 289
<212> DNA
<213> Homo sapiens - <400> 468

- <210> 469
<211> 36
<212> DNA
<213> Homo sapiens - <400> 469
agcaggatca agggccggaa ataaaggctg ttgtaa 36 - <210> 470
<211> 156
<212> DNA
<213> Homo sapiens - <400> 470

- <210> 471
<211> 298
<212> DNA
<213> Homo sapiens - <400> 471


- <210> 472
<211> 98
<212> DNA
<213> Homo sapiens - <400> 472

- <210> 473
<211> 103
<212> DNA
<213> Homo sapiens - <400> 473

- <210> 474
<211> 191
<212> DNA
<213> Homo sapiens - <400> 474

- <210> 475
<211> 220
<212> DNA
<213> Homo sapiens - <400> 475

- <210> 476
<211> 258
<212> DNA
<213> Homo sapiens - <400> 476


- <210> 477
<211> 233
<212> DNA
<213> Homo sapiens - <400> 477

- <210> 478
<211> 96
<212> DNA
<213> Homo sapiens - <400> 478

- <210> 479
<211> 181
<212> DNA
<213> Homo sapiens - <400> 479

- <210> 480
<211> 135
<212> DNA
<213> Homo sapiens - <400> 480

- <210> 481
<211> 80
<212> DNA
<213> Homo sapiens - <400> 481

- <210> 482
<211> 96
<212> DNA
<213> Homo sapiens - <400> 482

- <210> 483
<211> 290
<212> DNA
<213> Homo sapiens - <400> 483

- <210> 484
<211> 197
<212> DNA
<213> Homo sapiens - <400> 484

- <210> 485
<211> 113
<212> DNA
<213> Homo sapiens - <400> 485


- <210> 486
<211> 183
<212> DNA
<213> Homo sapiens - <400> 486

- <210> 487
<211> 275
<212> DNA
<213> Homo sapiens - <400> 487

- <210> 488
<211> 123
<212> DNA
<213> Homo sapiens - <400> 488

- <210> 489
<211> 99
<212> DNA
<213> Homo sapiens - <400> 489

- <210> 490
<211> 97
<212> DNA
<213> Homo sapiens - <400> 490

- <210> 491
<211> 119
<212> DNA
<213> Homo sapiens - <400> 491

- <210> 492
<211> 121
<212> DNA
<213> Homo sapiens - <400> 492

- <210> 493
<211> 168
<212> DNA
<213> Homo sapiens - <400> 493

- <210> 494
<211> 47
<212> DNA
<213> Homo sapiens - <400> 494
aggataaact tgtgtggtgt agagaagtta aaatcctcac gttgtac 47 - <210> 495
<211> 286
<212> DNA
<213> Homo sapiens - <400> 495


- <210> 496
<211> 94
<212> DNA
<213> Homo sapiens - <400> 496

- <210> 497
<211> 174
<212> DNA
<213> Homo sapiens - <400> 497

- <210> 498
<211> 255
<212> DNA
<213> Homo sapiens - <400> 498

- <210> 499
<211> 137
<212> DNA
<213> Homo sapiens - <400> 499

- <210> 500
<211> 33
<212> DNA
<213> Homo sapiens - <400> 500
aaacgatgat aatctttact ggtgaaaagg atg 33 - <210> 501
<211> 195
<212> DNA
<213> Homo sapiens - <400> 501

- <210> 502
<211> 255
<212> DNA
<213> Homo sapiens - <400> 502

- <210> 503
<211> 217
<212> DNA
<213> Homo sapiens - <400> 503

- <210> 504
<211> 92
<212> DNA
<213> Homo sapiens - <400> 504

- <210> 505
<211> 251
<212> DNA
<213> Homo sapiens - <400> 505

- <210> 506
<211> 261
<212> DNA
<213> Homo sapiens - <400> 506

- <210> 507
<211> 175
<212> DNA
<213> Homo sapiens - <400> 507

- <210> 508
<211> 251
<212> DNA
<213> Homo sapiens - <400> 508


- <210> 509
<211> 237
<212> DNA
<213> Homo sapiens - <400> 509

- <210> 510
<211> 133
<212> DNA
<213> Homo sapiens - <400> 510

- <210> 511
<211> 263
<212> DNA
<213> Homo sapiens - <400> 511

- <210> 512
<211> 48
<212> DNA
<213> Homo sapiens - <400> 512
taggttgtca acaggtacta tttgtcacat aactaacttt cgaggcac 48 - <210> 513
<211> 161
<212> DNA
<213> Homo sapiens - <400> 513

- <210> 514
<211> 286
<212> DNA
<213> Homo sapiens - <400> 514

- <210> 515
<211> 208
<212> DNA
<213> Homo sapiens - <400> 515

- <210> 516
<211> 201
<212> DNA
<213> Homo sapiens - <400> 516

- <210> 517
<211> 119
<212> DNA
<213> Homo sapiens - <220>
<221> misc_feature
<222> (91)..(91)
<223> n is a, c, g, or t - <400> 517

- <210> 518
<211> 36
<212> DNA
<213> Homo sapiens - <400> 518
ataatgaaag ttagtaacgt ccattattta ataaag 36 - <210> 519
<211> 91
<212> DNA
<213> Homo sapiens - <400> 519

- <210> 520
<211> 178
<212> DNA
<213> Homo sapiens - <400> 520

- <210> 521
<211> 242
<212> DNA
<213> Homo sapiens - <400> 521

- <210> 522
<211> 199
<212> DNA
<213> Homo sapiens - <400> 522

- <210> 523
<211> 127
<212> DNA
<213> Homo sapiens - <400> 523

- <210> 524
<211> 46
<212> DNA
<213> Homo sapiens - <400> 524
gacaggggtt ctaattactg tctgtgagag ttactacttt gtaact 46 - <210> 525
<211> 115
<212> DNA
<213> Homo sapiens - <400> 525

- <210> 526
<211> 138
<212> DNA
<213> Homo sapiens - <400> 526

- <210> 527
<211> 269
<212> DNA
<213> Homo sapiens - <400> 527


- <210> 528
<211> 282
<212> DNA
<213> Homo sapiens - <400> 528

- <210> 529
<211> 131
<212> DNA
<213> Homo sapiens - <400> 529

- <210> 530
<211> 183
<212> DNA
<213> Homo sapiens - <400> 530

- <210> 531
<211> 263
<212> DNA
<213> Homo sapiens - <400> 531


- <210> 532
<211> 140
<212> DNA
<213> Homo sapiens - <220>
<221> misc_feature
<222> (71)..(71)
<223> n is a, c, g, or t - <220>
<221> misc_feature
<222> (82)..(82)
<223> n is a, c, g, or t - <220>
<221> misc_feature
<222> (94)..(94)
<223> n is a, c, g, or t - <400> 532

- <210> 533
<211> 134
<212> DNA
<213> Homo sapiens - <400> 533

- <210> 534
<211> 207
<212> DNA
<213> Homo sapiens - <400> 534


- <210> 535
<211> 113
<212> DNA
<213> Homo sapiens - <400> 535

- <210> 536
<211> 66
<212> DNA
<213> Homo sapiens - <400> 536

- <210> 537
<211> 66
<212> DNA
<213> Homo sapiens - <400> 537

- <210> 538
<211> 128
<212> DNA
<213> Homo sapiens - <400> 538

- <210> 539
<211> 49
<212> DNA
<213> Homo sapiens - <400> 539
tgattactag tgtaaactgg ttattgagat agattatgac attggtgga 49 - <210> 540
<211> 209
<212> DNA
<213> Homo sapiens - <400> 540

- <210> 541
<211> 237
<212> DNA
<213> Homo sapiens - <400> 541

- <210> 542
<211> 62
<212> DNA
<213> Homo sapiens - <400> 542

- <210> 543
<211> 277
<212> DNA
<213> Homo sapiens - <400> 543

- <210> 544
<211> 203
<212> DNA
<213> Homo sapiens - <400> 544


- <210> 545
<211> 75
<212> DNA
<213> Homo sapiens - <400> 545

- <210> 546
<211> 248
<212> DNA
<213> Homo sapiens - <400> 546

- <210> 547
<211> 174
<212> DNA
<213> Homo sapiens - <220>
<221> misc_feature
<222> (27)..(27)
<223> n is a, c, g, or t - <220>
<221> misc_feature
<222> (78)..(78)
<223> n is a, c, g, or t - <220>
<221> misc_feature
<222> (96)..(96)
<223> n is a, c, g, or t - <220>
<221> misc_feature
<222> (123)..(123)
<223> n is a, c, g, or t - <400> 547


- <210> 548
<211> 251
<212> DNA
<213> Homo sapiens - <400> 548

- <210> 549
<211> 88
<212> DNA
<213> Homo sapiens - <400> 549

- <210> 550
<211> 284
<212> DNA
<213> Homo sapiens - <400> 550

- <210> 551
<211> 214
<212> DNA
<213> Homo sapiens - <400> 551

- <210> 552
<211> 72
<212> DNA
<213> Homo sapiens - <400> 552

- <210> 553
<211> 180
<212> DNA
<213> Homo sapiens - <400> 553

- <210> 554
<211> 173
<212> DNA
<213> Homo sapiens - <400> 554

- <210> 555
<211> 243
<212> DNA
<213> Homo sapiens - <400> 555

- <210> 556
<211> 201
<212> DNA
<213> Homo sapiens - <400> 556


- <210> 557
<211> 174
<212> DNA
<213> Homo sapiens - <400> 557

- <210> 558
<211> 259
<212> DNA
<213> Homo sapiens - <400> 558

- <210> 559
<211> 60
<212> DNA
<213> Homo sapiens - <400> 559
tttctggggt ctttgagctc caaaaaataa acacttcctt tgagggagag ccccccccca 60 - <210> 560
<211> 159
<212> DNA
<213> Homo sapiens - <400> 560

- <210> 561
<211> 278
<212> DNA
<213> Homo sapiens - <400> 561

- <210> 562
<211> 241
<212> DNA
<213> Homo sapiens - <400> 562

- <210> 563
<211> 283
<212> DNA
<213> Homo sapiens - <400> 563
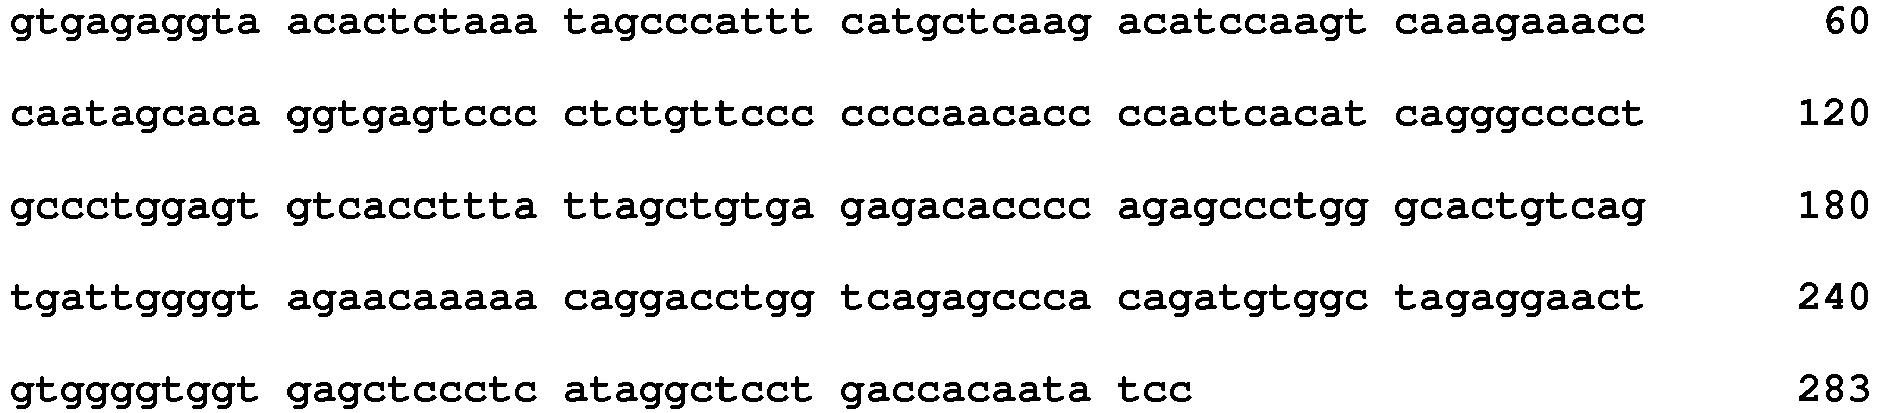
- <210> 564
<211> 186
<212> DNA
<213> Homo sapiens - <400> 564

- <210> 565
<211> 267
<212> DNA
<213> Homo sapiens - <400> 565

- <210> 566
<211> 45
<212> DNA
<213> Homo sapiens - <400> 566
tgcttataca cttacacttt atgcacaaaa tgtagggtta taata 45 - <210> 567
<211> 241
<212> DNA
<213> Homo sapiens - <400> 567
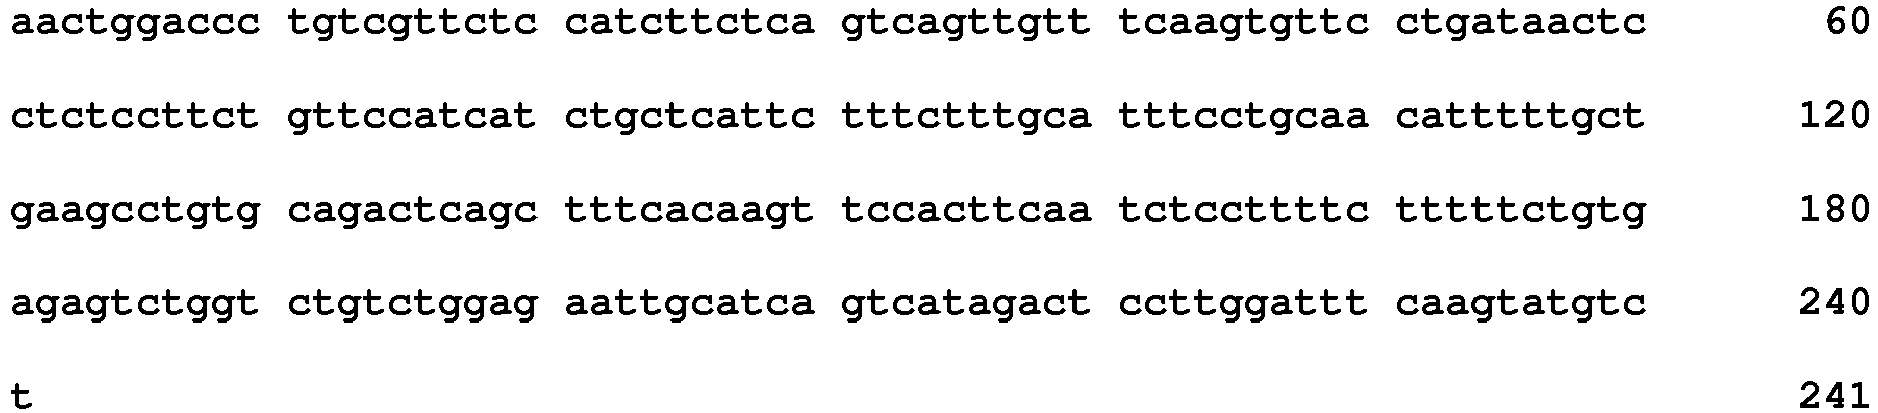
- <210> 568
<211> 159
<212> DNA
<213> Homo sapiens - <400> 568

- <210> 569
<211> 107
<212> DNA
<213> Homo sapiens - <400> 569


- <210> 570
<211> 273
<212> DNA
<213> Homo sapiens - <400> 570

- <210> 571
<211> 228
<212> DNA
<213> Homo sapiens - <400> 571

- <210> 572
<211> 286
<212> DNA
<213> Homo sapiens - <400> 572

- <210> 573
<211> 266
<212> DNA
<213> Homo sapiens - <220>
<221> misc_feature
<222> (214)..(214)
<223> n is a, c, g, or t - <400> 573

- <210> 574
<211> 270
<212> DNA
<213> Homo sapiens - <400> 574

- <210> 575
<211> 227
<212> DNA
<213> Homo sapiens - <400> 575

- <210> 576
<211> 279
<212> DNA
<213> Homo sapiens - <400> 576

- <210> 577
<211> 123
<212> DNA
<213> Homo sapiens - <220>
<221> misc_feature
<222> (52)..(52)
<223> n is a, c, g, or t - <400> 577

- <210> 578
<211> 82
<212> DNA
<213> Homo sapiens - <400> 578

- <210> 579
<211> 151
<212> DNA
<213> Homo sapiens - <400> 579

- <210> 580
<211> 82
<212> DNA
<213> Homo sapiens - <400> 580

- <210> 581
<211> 109
<212> DNA
<213> Homo sapiens - <400> 581

- <210> 582
<211> 118
<212> DNA
<213> Homo sapiens - <400> 582

- <210> 583
<211> 242
<212> DNA
<213> Homo sapiens - <400> 583

- <210> 584
<211> 34
<212> DNA
<213> Homo sapiens - <400> 584
gaaatcattg tgggattgct agctttccct ctta 34 - <210> 585
<211> 272
<212> DNA
<213> Homo sapiens - <400> 585

- <210> 586
<211> 189
<212> DNA
<213> Homo sapiens - <400> 586


- <210> 587
<211> 163
<212> DNA
<213> Homo sapiens - <400> 587

- <210> 588
<211> 296
<212> DNA
<213> Homo sapiens - <220>
<221> misc_feature
<222> (75)..(75)
<223> n is a, c, g, or t - <220>
<221> misc_feature
<222> (262)..(262)
<223> n is a, c, g, or t - <400> 588

- <210> 589
<211> 246
<212> DNA
<213> Homo sapiens - <400> 589

- <210> 590
<211> 121
<212> DNA
<213> Homo sapiens - <400> 590

- <210> 591
<211> 262
<212> DNA
<213> Homo sapiens - <400> 591

- <210> 592
<211> 226
<212> DNA
<213> Homo sapiens - <400> 592

- <210> 593
<211> 272
<212> DNA
<213> Homo sapiens - <400> 593

- <210> 594
<211> 151
<212> DNA
<213> Homo sapiens - <400> 594

- <210> 595
<211> 243
<212> DNA
<213> Homo sapiens - <400> 595

- <210> 596
<211> 82
<212> DNA
<213> Homo sapiens - <400> 596

- <210> 597
<211> 236
<212> DNA
<213> Homo sapiens - <400> 597

- <210> 598
<211> 119
<212> DNA
<213> Homo sapiens - <400> 598


- <210> 599
<211> 264
<212> DNA
<213> Homo sapiens - <400> 599

- <210> 600
<211> 273
<212> DNA
<213> Homo sapiens - <400> 600
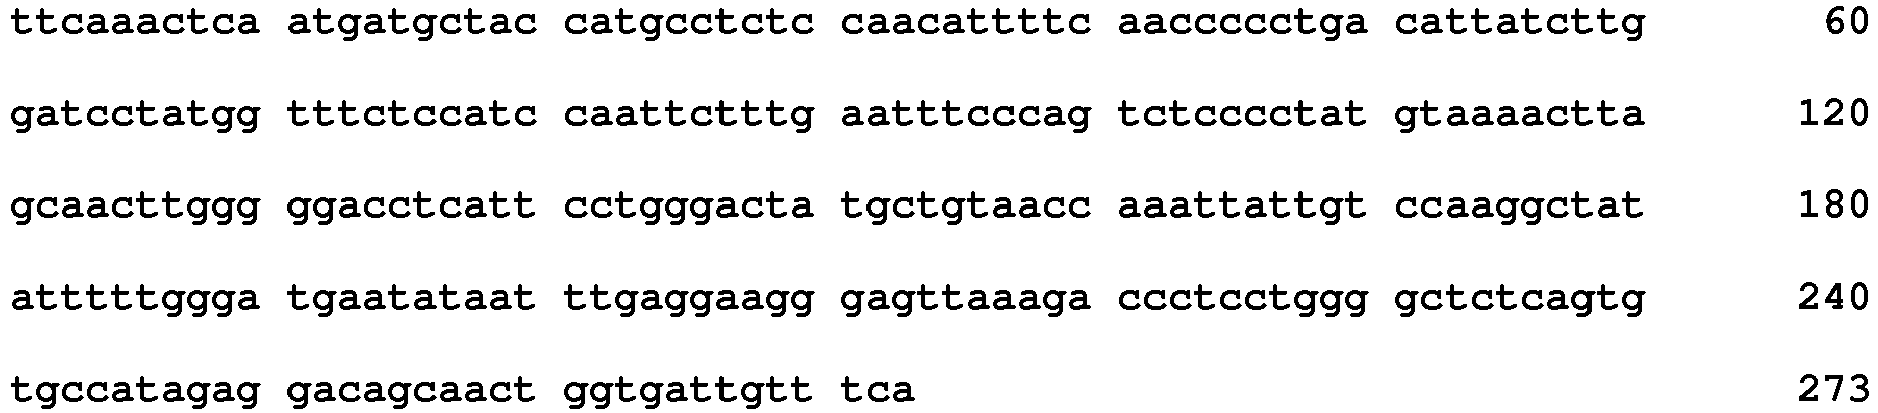
- <210> 601
<211> 275
<212> DNA
<213> Homo sapiens - <400> 601

- <210> 602
<211> 261
<212> DNA
<213> Homo sapiens - <400> 602


- <210> 603
<211> 241
<212> DNA
<213> Homo sapiens - <400> 603

- <210> 604
<211> 107
<212> DNA
<213> Homo sapiens - <400> 604

- <210> 605
<211> 252
<212> DNA
<213> Homo sapiens - <220>
<221> misc_feature
<222> (180)..(182)
<223> n is a, c, g, or t - <400> 605

- <210> 606
<211> 96
<212> DNA
<213> Homo sapiens - <400> 606

- <210> 607
<211> 181
<212> DNA
<213> Homo sapiens - <220>
<221> misc_feature
<222> (43)..(44)
<223> n is a, c, g, or t - <220>
<221> misc_feature
<222> (78)..(79)
<223> n is a, c, g, or t - <220>
<221> misc_feature
<222> (99)..(99)
<223> n is a, c, g, or t - <220>
<221> misc_feature
<222> (110)..(110)
<223> n is a, c, g, or t - <400> 607

- <210> 608
<211> 115
<212> DNA
<213> Homo sapiens - <400> 608

- <210> 609
<211> 53
<212> DNA
<213> Homo sapiens - <400> 609
aagcaagata tcaatgtagc agaattgcac ttgtgcctca cgaacataca taa 53 - <210> 610
<211> 155
<212> DNA
<213> Homo sapiens - <400> 610

- <210> 611
<211> 190
<212> DNA
<213> Homo sapiens - <400> 611

- <210> 612
<211> 63
<212> DNA
<213> Homo sapiens - <400> 612

- <210> 613
<211> 281
<212> DNA
<213> Homo sapiens - <400> 613

- <210> 614
<211> 239
<212> DNA
<213> Homo sapiens - <400> 614

- <210> 615
<211> 196
<212> DNA
<213> Homo sapiens - <400> 615

- <210> 616
<211> 38
<212> DNA
<213> Homo sapiens - <400> 616
agtctgccta tgatctttga atgagctttt taaggaag 38 - <210> 617
<211> 110
<212> DNA
<213> Homo sapiens - <400> 617

- <210> 618
<211> 173
<212> DNA
<213> Homo sapiens - <400> 618

- <210> 619
<211> 82
<212> DNA
<213> Homo sapiens - <400> 619

- <210> 620
<211> 266
<212> DNA
<213> Homo sapiens - <400> 620
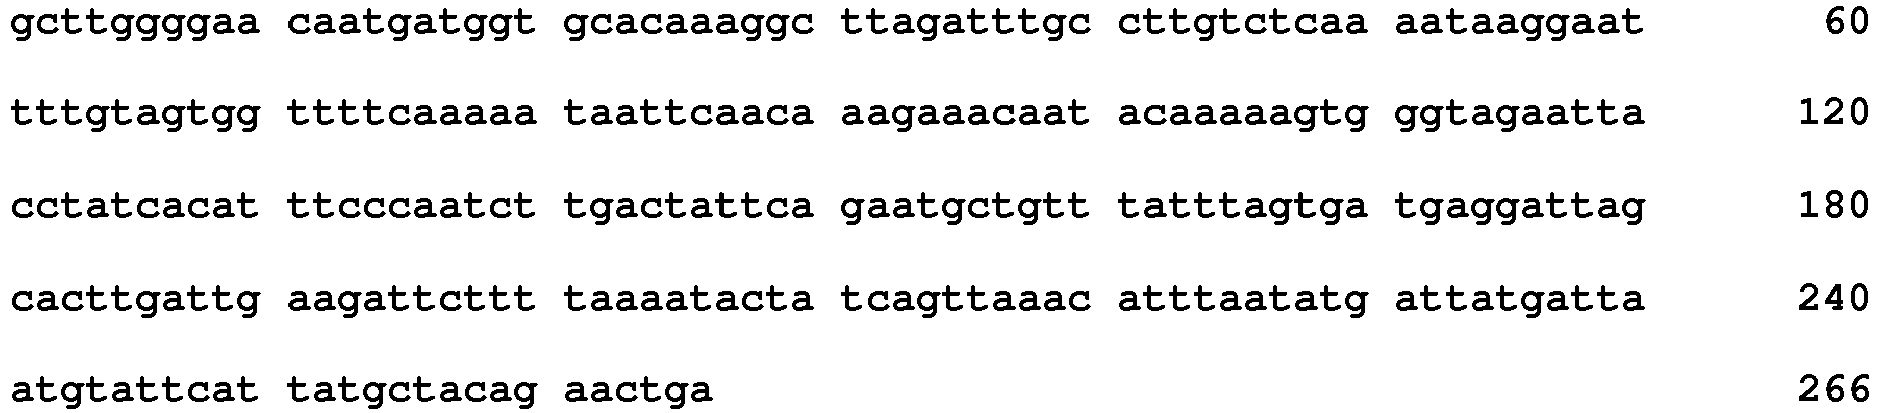
- <210> 621
<211> 115
<212> DNA
<213> Homo sapiens - <400> 621

- <210> 622
<211> 262
<212> DNA
<213> Homo sapiens - <400> 622

- <210> 623
<211> 94
<212> DNA
<213> Homo sapiens - <400> 623

- <210> 624
<211> 114
<212> DNA
<213> Homo sapiens - <400> 624

- <210> 625
<211> 37
<212> DNA
<213> Homo sapiens - <400> 625
cagggactgg ctatcccaag acctggcaga tgtggct 37 - <210> 626
<211> 74
<212> DNA
<213> Homo sapiens - <400> 626

- <210> 627
<211> 201
<212> DNA
<213> Homo sapiens - <400> 627

- <210> 628
<211> 217
<212> DNA
<213> Homo sapiens - <400> 628

- <210> 629
<211> 33
<212> DNA
<213> Homo sapiens - <400> 629
ttctgtgcct cagccgttct tgacatcaag aat 33 - <210> 630
<211> 222
<212> DNA
<213> Homo sapiens - <400> 630

- <210> 631
<211> 278
<212> DNA
<213> Homo sapiens - <400> 631

- <210> 632
<211> 90
<212> DNA
<213> Homo sapiens - <400> 632

- <210> 633
<211> 198
<212> DNA
<213> Homo sapiens - <400> 633

- <210> 634
<211> 243
<212> DNA
<213> Homo sapiens - <400> 634

- <210> 635
<211> 211
<212> DNA
<213> Homo sapiens - <220>
<221> misc_feature
<222> (140)..(140)
<223> n is a, c, g, or t - <400> 635

- <210> 636
<211> 256
<212> DNA
<213> Homo sapiens - <400> 636

- <210> 637
<211> 239
<212> DNA
<213> Homo sapiens - <220>
<221> misc_feature
<222> (138)..(138)
<223> n is a, c, g, or t - <400> 637

- <210> 638
<211> 204
<212> DNA
<213> Homo sapiens - <220>
<221> misc_feature
<222> (63)..(63)
<223> n is a, c, g, or t - <400> 638

- <210> 639
<211> 231
<212> DNA
<213> Homo sapiens - <400> 639

- <210> 640
<211> 237
<212> DNA
<213> Homo sapiens - <400> 640

- <210> 641
<211> 228
<212> DNA
<213> Homo sapiens - <400> 641

- <210> 642
<211> 188
<212> DNA
<213> Homo sapiens - <400> 642

- <210> 643
<211> 259
<212> DNA
<213> Homo sapien - <400> 643
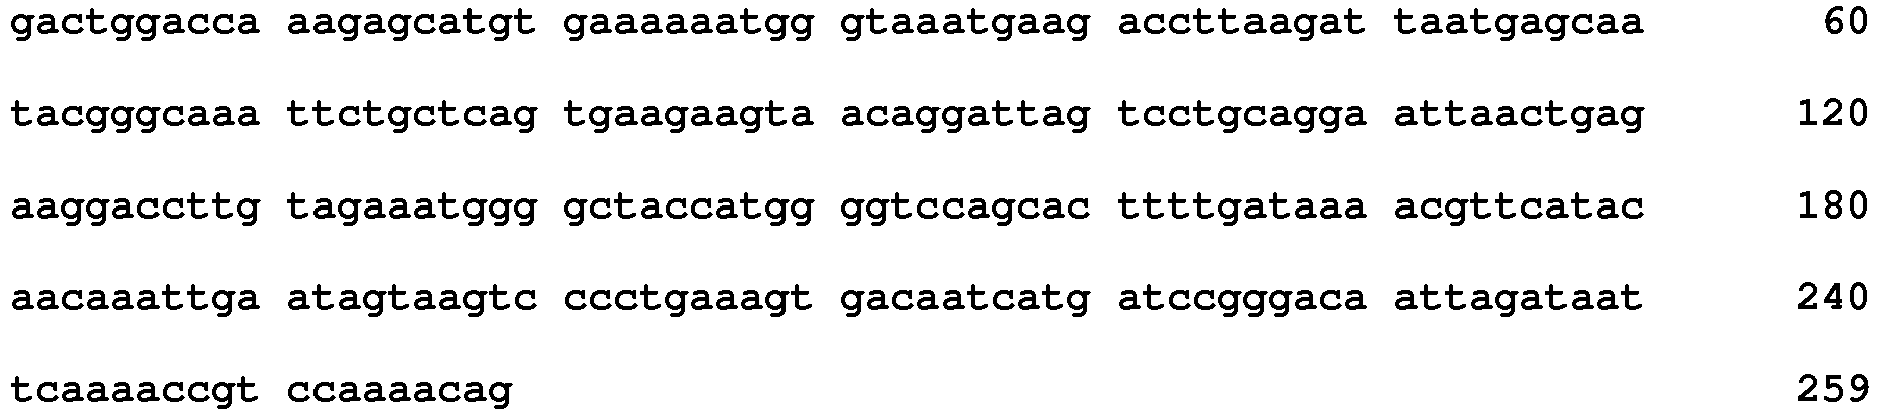
- <210> 644
<211> 242
<212> DNA
<213> Homo sapiens - <400> 644
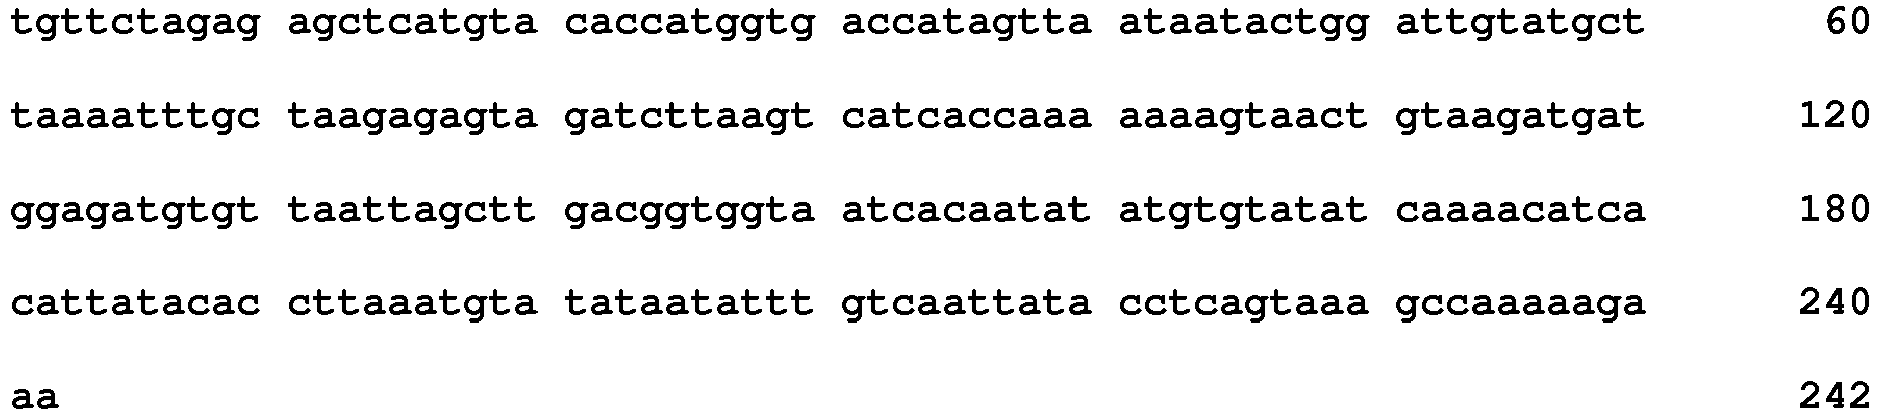
- <210> 645
<211> 205
<212> DNA
<213> Homo sapiens - <400> 645

- <210> 646
<211> 217
<212> DNA
<213> Homo sapiens - <400> 646

- <210> 647
<211> 253
<212> DNA
<213> Homo sapiens - <220>
<221> misc_feature
<222> (208)..(208)
<223> n is a, c, g, or t - <400> 647

- <210> 648
<211> 249
<212> DNA
<213> Homo sapiens - <400> 648


- <210> 649
<211> 185
<212> DNA
<213> Homo sapiens - <400> 649

- <210> 650
<211> 234
<212> DNA
<213> Homo sapiens - <400> 650

- <210> 651
<211> 270
<212> DNA
<213> Homo sapiens - <400> 651

- <210> 652
<211> 37
<212> DNA
<213> Homo sapiens - <400> 652
cccaaattat ccccaattat ccccacacat aaaaaaa 37 - <210> 653
<211> 173
<212> DNA
<213> Homo sapiens - <400> 653

- <210> 654
<211> 236
<212> DNA
<213> Homo sapiens - <400> 654

- <210> 655
<211> 187
<212> DNA
<213> Homo sapiens - <400> 655

- <210> 656
<211> 79
<212> DNA
<213> Homo sapiens - <400> 656

- <210> 657
<211> 94
<212> DNA
<213> Homo sapiens - <400> 657


- <210> 658
<211> 246
<212> DNA
<213> Homo sapiens - <400> 658

- <210> 659
<211> 270
<212> DNA
<213> Homo sapiens - <400> 659
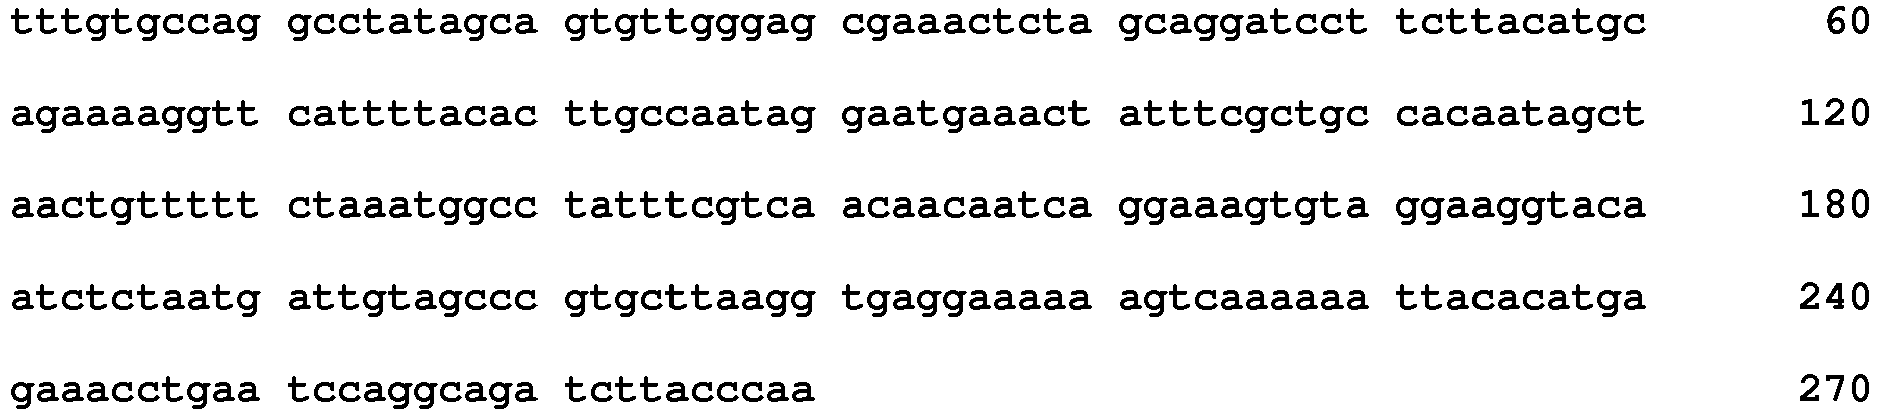
- <210> 660
<211> 195
<212> DNA
<213> Homo sapiens - <400> 660

- <210> 661
<211> 147
<212> DNA
<213> Homo sapiens - <400> 661


- <210> 662
<211> 106
<212> DNA
<213> Homo sapiens - <400> 662

- <210> 663
<211> 268
<212> DNA
<213> Homo sapiens - <400> 663

- <210> 664
<211> 160
<212> DNA
<213> Homo sapiens - <400> 664

- <210> 665
<211> 239
<212> DNA
<213> Homo sapiens - <400> 665

- <210> 666
<211> 259
<212> DNA
<213> Homo sapiens - <400> 666

- <210> 667
<211> 234
<212> DNA
<213> Homo sapiens - <400> 667

- <210> 668
<211> 294
<212> DNA
<213> Homo sapiens - <400> 668

- <210> 669
<211> 265
<212> DNA
<213> Homo sapiens - <400> 669

- <210> 670
<211> 190
<212> DNA
<213> Homo sapiens - <400> 670

- <210> 671
<211> 138
<212> DNA
<213> Homo sapiens - <400> 671

- <210> 672
<211> 257
<212> DNA
<213> Homo sapiens - <400> 672

- <210> 673
<211> 231
<212> DNA
<213> Homo sapiens - <400> 673

- <210> 674
<211> 132
<212> DNA
<213> Homo sapiens - <400> 674

- <210> 675
<211> 283
<212> DNA
<213> Homo sapiens - <400> 675

- <210> 676
<211> 229
<212> DNA
<213> Homo sapiens - <400> 676

- <210> 677
<211> 39
<212> DNA
<213> Homo sapiens - <400> 677
gttgctgacc tgctgtgctc gcagtagatt ccaaaaaaa 39 - <210> 678
<211> 259
<212> DNA
<213> Homo sapiens - <400> 678


- <210> 679
<211> 236
<212> DNA
<213> Homo sapiens - <400> 679

- <210> 680
<211> 280
<212> DNA
<213> Homo sapiens - <400> 680

- <210> 681
<211> 215
<212> DNA
<213> Homo sapiens - <400> 681

- <210> 682
<211> 258
<212> DNA
<213> Homo sapiens - <400> 682


- <210> 683
<211> 248
<212> DNA
<213> Homo sapiens - <400> 683

- <210> 684
<211> 39
<212> DNA
<213> Homo sapiens - <400> 684
ggtaggttga agggacctct ctcttaccag taccagaaa 39 - <210> 685
<211> 72
<212> DNA
<213> Homo sapiens - <400> 685

- <210> 686
<211> 241
<212> DNA
<213> Homo sapiens - <400> 686

- <210> 687
<211> 278
<212> DNA
<213> Homo sapiens - <400> 687

- <210> 688
<211> 244
<212> DNA
<213> Homo sapiens - <400> 688

- <210> 689
<211> 118
<212> DNA
<213> Homo sapiens - <400> 689

- <210> 690
<211> 264
<212> DNA
<213> Homo sapiens - <400> 690
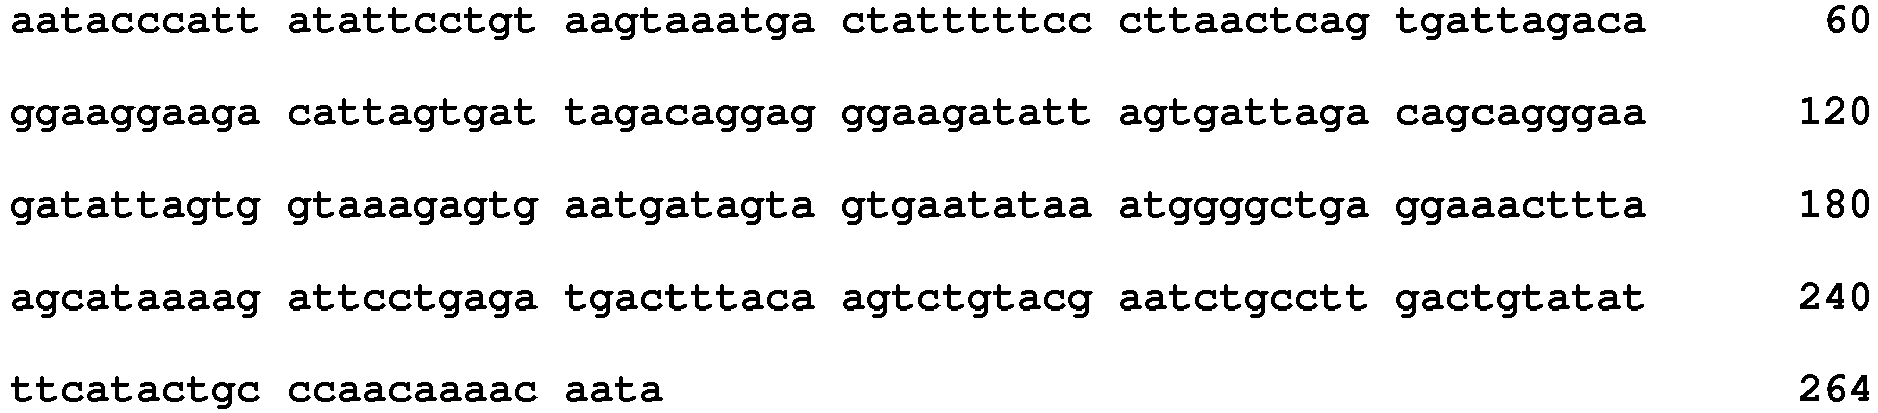
- <210> 691
<211> 270
<212> DNA
<213> Homo sapiens - <400> 691

- <210> 692
<211> 187
<212> DNA
<213> Homo sapiens - <400> 692

- <210> 693
<211> 249
<212> DNA
<213> Homo sapiens - <400> 693
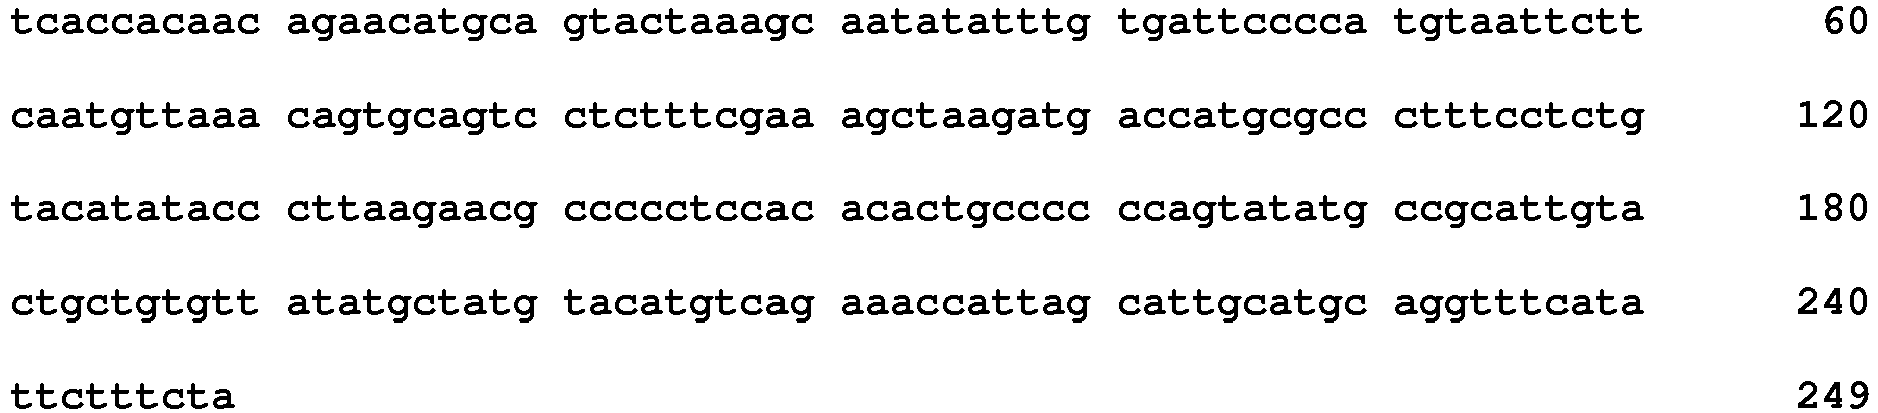
- <210> 694
<211> 199
<212> DNA
<213> Homo sapiens - <400> 694

- <210> 695
<211> 190
<212> DNA
<213> Homo sapiens - <400> 695

- <210> 696
<211> 235
<212> DNA
<213> Homo sapiens - <400> 696

- <210> 697
<211> 243
<212> DNA
<213> Homo sapiens - <400> 697

- <210> 698
<211> 192
<212> DNA
<213> Homo sapiens - <400> 698

- <210> 699
<211> 114
<212> DNA
<213> Homo sapiens - <400> 699

- <210> 700
<211> 123
<212> DNA
<213> Homo sapiens - <400> 700

- <210> 701
<211> 158
<212> DNA
<213> Homo sapiens - <400> 701

- <210> 702
<211> 206
<212> DNA
<213> Homo sapiens - <400> 702

- <210> 703
<211> 252
<212> DNA
<213> Homo sapiens - <400> 703

- <210> 704
<211> 227
<212> DNA
<213> Homo sapiens - <400> 704

- <210> 705
<211> 262
<212> DNA
<213> Homo sapiens - <220>
<221> misc_feature
<222> (77)..(117)
<223> n is a, c, g, or t - <400> 705

- <210> 706
<211> 275
<212> DNA
<213> Homo sapiens - <400> 706

- <210> 707
<211> 81
<212> DNA
<213> Homo sapiens - <400> 707


- <210> 708
<211> 147
<212> DNA
<213> Homo sapiens - <400> 708

- <210> 709
<211> 47
<212> DNA
<213> Homo sapiens - <400> 709
acacagtgct ttccgtggca ctgcatacaa tctgaggcct cctctct 47 - <210> 710
<211> 52
<212> DNA
<213> Homo sapiens - <400> 710
taaatatcca cagtactcac tttttccaaa tgatcctagt aattgcctag aa 52 - <210> 711
<211> 222
<212> DNA
<213> Homo sapiens - <400> 711

- <210> 712
<211> 284
<212> DNA
<213> Homo sapiens - <220>
<221> misc_feature
<222> (33)..(33)
<223> n is a, c, g, or t - <400> 712


- <210> 713
<211> 224
<212> DNA
<213> Homo sapiens - <220>
<221> misc_feature
<222> (144)..(144)
<223> n is a, c, g, or t - <400> 713

- <210> 714
<211> 224
<212> DNA
<213> Homo sapiens - <400> 714

- <210> 715
<211> 194
<212> DNA
<213> Homo sapiens - <400> 715

- <210> 716
<211> 227
<212> DNA
<213> Homo sapiens - <220>
<221> misc_feature
<222> (71)..(72)
<223> n is a, c, g, or t - <220>
<221> misc_feature
<222> (185)..(187)
<223> n is a, c, g, or t - <220>
<221> misc_feature
<222> (189)..(191)
<223> n is a, c, g, or t - <220>
<221> misc_feature
<222> (193)..(195)
<223> n is a, c, g, or t - <220>
<221> misc_feature
<222> (199)..(199)
<223> n is a, c, g, or t - <220>
<221> misc_feature
<222> (201)..(202)
<223> n is a, c, g, or t - <400> 716

- <210> 717
<211> 183
<212> DNA
<213> Homo sapiens - <220>
<221> misc_feature
<222> (126)..(127)
<223> n is a, c, g, or t - <220>
<221> misc_feature
<222> (135)..(135)
<223> n is a, c, g, or t - <220>
<221> misc_feature
<222> (138)..(138)
<223> n is a, c, g, or t - <400> 717

- <210> 718
<211> 288
<212> DNA
<213> Homo sapiens - <400> 718

- <210> 719
<211> 183
<212> DNA
<213> Homo sapiens - <400> 719

- <210> 720
<211> 205
<212> DNA
<213> Homo sapiens - <400> 720

- <210> 721
<211> 189
<212> DNA
<213> Homo sapiens - <400> 721

- <210> 722
<211> 191
<212> DNA
<213> Homo sapiens - <400> 722

- <210> 723
<211> 217
<212> DNA
<213> Homo sapiens - <400> 723

- <210> 724
<211> 233
<212> DNA
<213> Homo sapiens - <400> 724

- <210> 725
<211> 250
<212> DNA
<213> Homo sapiens - <400> 725


- <210> 726
<211> 183
<212> DNA
<213> Homo sapiens - <400> 726

- <210> 727
<211> 77
<212> DNA
<213> Homo sapiens - <400> 727

- <210> 728
<211> 231
<212> DNA
<213> Homo sapiens - <400> 728

- <210> 729
<211> 77
<212> DNA
<213> Homo sapiens - <400> 729

- <210> 730
<211> 269
<212> DNA
<213> Homo sapiens - <400> 730

- <210> 731
<211> 229
<212> DNA
<213> Homo sapiens - <400> 731

- <210> 732
<211> 216
<212> DNA
<213> Homo sapiens - <400> 732

- <210> 733
<211> 165
<212> DNA
<213> Homo sapiens - <400> 733

- <210> 734
<211> 124
<212> DNA
<213> Homo sapiens - <400> 734

- <210> 735
<211> 156
<212> DNA
<213> Homo sapiens - <400> 735

- <210> 736
<211> 276
<212> DNA
<213> Homo sapiens - <400> 736

- <210> 737
<211> 257
<212> DNA
<213> Homo sapiens - <400> 737

- <210> 738
<211> 283
<212> DNA
<213> Homo sapiens - <400> 738


- <210> 739
<211> 254
<212> DNA
<213> Homo sapiens - <400> 739

- <210> 740
<211> 217
<212> DNA
<213> Homo sapiens - <400> 740

- <210> 741
<211> 171
<212> DNA
<213> Homo sapiens - <400> 741

- <210> 742
<211> 289
<212> DNA
<213> Homo sapiens - <400> 742


- <210> 743
<211> 271
<212> DNA
<213> Homo sapiens - <400> 743

- <210> 744
<211> 193
<212> DNA
<213> Homo sapiens - <400> 744

- <210> 745
<211> 206
<212> DNA
<213> Homo sapiens - <400> 745

- <210> 746
<211> 242
<212> DNA
<213> Homo sapiens - <400> 746


- <210> 747
<211> 266
<212> DNA
<213> Homo sapiens - <400> 747

- <210> 748
<211> 202
<212> DNA
<213> Homo sapiens - <400> 748

- <210> 749
<211> 208
<212> DNA
<213> Homo sapiens - <220>
<221> misc_feature
<222> (124)..(124)
<223> n is a, c, g, or t - <400> 749

- <210> 750
<211> 150
<212> DNA
<213> Homo sapiens - <400> 750

- <210> 751
<211> 97
<212> DNA
<213> Homo sapiens - <400> 751

- <210> 752
<211> 237
<212> DNA
<213> Homo sapiens - <400> 752

- <210> 753
<211> 292
<212> DNA
<213> Homo sapiens - <220>
<221> misc_feature
<222> (54)..(55)
<223> n is a, c, g, or t - <400> 753

- <210> 754
<211> 243
<212> DNA
<213> Homo sapiens - <400> 754

- <210> 755
<211> 120
<212> DNA
<213> Homo sapiens - <400> 755

- <210> 756
<211> 185
<212> DNA
<213> Homo sapiens - <400> 756

- <210> 757
<211> 130
<212> DNA
<213> Homo sapiens - <400> 757

- <210> 758
<211> 86
<212> DNA
<213> Homo sapiens - <400> 758


- <210> 759
<211> 264
<212> DNA
<213> Homo sapiens - <400> 759

- <210> 760
<211> 101
<212> DNA
<213> Homo sapiens - <400> 760

- <210> 761
<211> 233
<212> DNA
<213> Homo sapiens - <400> 761

- <210> 762
<211> 256
<212> DNA
<213> Homo sapiens - <400> 762

- <210> 763
<211> 259
<212> DNA
<213> Homo sapiens - <400> 763

- <210> 764
<211> 114
<212> DNA
<213> Homo sapiens - <400> 764

- <210> 765
<211> 265
<212> DNA
<213> Homo sapiens - <400> 765

- <210> 766
<211> 198
<212> DNA
<213> Homo sapiens - <400> 766

- <210> 767
<211> 162
<212> DNA
<213> Homo sapiens - <400> 767

- <210> 768
<211> 256
<212> DNA
<213> Homo sapiens - <400> 768

- <210> 769
<211> 294
<212> DNA
<213> Homo sapiens - <400> 769

- <210> 770
<211> 221
<212> DNA
<213> Homo sapiens - <400> 770

- <210> 771
<211> 239
<212> DNA
<213> Homo sapiens - <400> 771

- <210> 772
<211> 181
<212> DNA
<213> Homo sapiens - <400> 772

- <210> 773
<211> 228
<212> DNA
<213> Homo sapiens - <400> 773

- <210> 774
<211> 136
<212> DNA
<213> Homo sapiens - <400> 774

- <210> 775
<211> 193
<212> DNA
<213> Homo sapiens - <400> 775


- <210> 776
<211> 175
<212> DNA
<213> Homo sapiens - <400> 776

- <210> 777
<211> 183
<212> DNA
<213> Homo sapiens - <400> 777

- <210> 778
<211> 235
<212> DNA
<213> Homo sapiens - <400> 778

- <210> 779
<211> 154
<212> DNA
<213> Homo sapiens - <400> 779

- <210> 780
<211> 280
<212> DNA
<213> Homo sapiens - <400> 780

- <210> 781
<211> 206
<212> DNA
<213> Homo sapiens - <400> 781

- <210> 782
<211> 247
<212> DNA
<213> Homo sapiens - <400> 782

- <210> 783
<211> 190
<212> DNA
<213> Homo sapiens - <400> 783

- <210> 784
<211> 165
<212> DNA
<213> Homo sapiens - <400> 784

- <210> 785
<211> 260
<212> DNA
<213> Homo sapiens - <400> 785

- <210> 786
<211> 197
<212> DNA
<213> Homo sapiens - <400> 786

- <210> 787
<211> 187
<212> DNA
<213> Homo sapiens - <400> 787

- <210> 788
<211> 228
<212> DNA
<213> Homo sapiens - <400> 788

- <210> 789
<211> 213
<212> DNA
<213> Homo sapiens - <400> 789

- <210> 790
<211> 104
<212> DNA
<213> Homo sapiens - <400> 790

- <210> 791
<211> 132
<212> DNA
<213> Homo sapiens - <400> 791

- <210> 792
<211> 281
<212> DNA
<213> Homo sapiens - <400> 792


- <210> 793
<211> 239
<212> DNA
<213> Homo sapiens - <400> 793

- <210> 794
<211> 174
<212> DNA
<213> Homo sapiens - <400> 794

- <210> 795
<211> 270
<212> DNA
<213> Homo sapiens - <400> 795

- <210> 796
<211> 276
<212> DNA
<213> Homo sapiens - <400> 796


- <210> 797
<211> 264
<212> DNA
<213> Homo sapiens - <400> 797

- <210> 798
<211> 275
<212> DNA
<213> Homo sapiens - <400> 798

- <210> 799
<211> 210
<212> DNA
<213> Homo sapiens - <400> 799

- <210> 800
<211> 235
<212> DNA
<213> Homo sapiens - <400> 800


- <210> 801
<211> 162
<212> DNA
<213> Homo sapiens - <400> 801

- <210> 802
<211> 249
<212> DNA
<213> Homo sapiens - <400> 802

- <210> 803
<211> 200
<212> DNA
<213> Homo sapiens - <400> 803

- <210> 804
<211> 150
<212> DNA
<213> Homo sapiens - <400> 804

- <210> 805
<211> 142
<212> DNA
<213> Homo sapiens - <400> 805

- <210> 806
<211> 224
<212> DNA
<213> Homo sapiens - <400> 806

- <210> 807
<211> 176
<212> DNA
<213> Homo sapiens - <400> 807

- <210> 808
<211> 250
<212> DNA
<213> Homo sapiens - <220>
<221> misc_feature
<222> (221)..(221)
<223> n is a, c, g, or t - <400> 808

- <210> 809
<211> 178
<212> DNA
<213> Homo sapiens - <400> 809

- <210> 810
<211> 229
<212> DNA
<213> Homo sapiens - <220>
<221> misc_feature
<222> (48)..(48)
<223> n is a, c, g, or t - <400> 810

- <210> 811
<211> 278
<212> DNA
<213> Homo sapiens - <220>
<221> misc_feature
<222> (204)..(204)
<223> n is a, c, g, or t - <220>
<221> misc_feature
<222> (230)..(230)
<223> n is a, c, g, or t - <220>
<221> misc_feature
<222> (234)..(234)
<223> n is a, c, g, or t - <400> 811


- <210> 812
<211> 243
<212> DNA
<213> Homo sapiens - <400> 812

- <210> 813
<211> 151
<212> DNA
<213> Homo sapiens - <400> 813

- <210> 814
<211> 84
<212> DNA
<213> Homo sapiens - <400> 814

- <210> 815
<211> 252
<212> DNA
<213> Homo sapiens - <400> 815

- <210> 816
<211> 272
<212> DNA
<213> Homo sapiens - <400> 816

- <210> 817
<211> 185
<212> DNA
<213> Homo sapiens - <400> 817

- <210> 818
<211> 256
<212> DNA
<213> Homo sapiens - <400> 818

- <210> 819
<211> 146
<212> DNA
<213> Homo sapiens - <400> 819

- <210> 820
<211> 122
<212> DNA
<213> Homo sapiens - <400> 820

- <210> 821
<211> 225
<212> DNA
<213> Homo sapiens - <400> 821

- <210> 822
<211> 274
<212> DNA
<213> Homo sapiens - <400> 822

- <210> 823
<211> 256
<212> DNA
<213> Homo sapiens - <220>
<221> misc_feature
<222> (201)..(201)
<223> n is a, c, g, or t - <220>
<221> misc_feature
<222> (206)..(206)
<223> n is a, c, g, or t - <220>
<221> misc_feature
<222> (221)..(221)
<223> n is a, c, g, or t - <400> 823

- <210> 824
<211> 143
<212> DNA
<213> Homo sapiens - <400> 824

- <210> 825
<211> 199
<212> DNA
<213> Homo sapiens - <400> 825

- <210> 826
<211> 224
<212> DNA
<213> Homo sapiens - <400> 826

- <210> 827
<211> 263
<212> DNA
<213> Homo sapiens - <400> 827
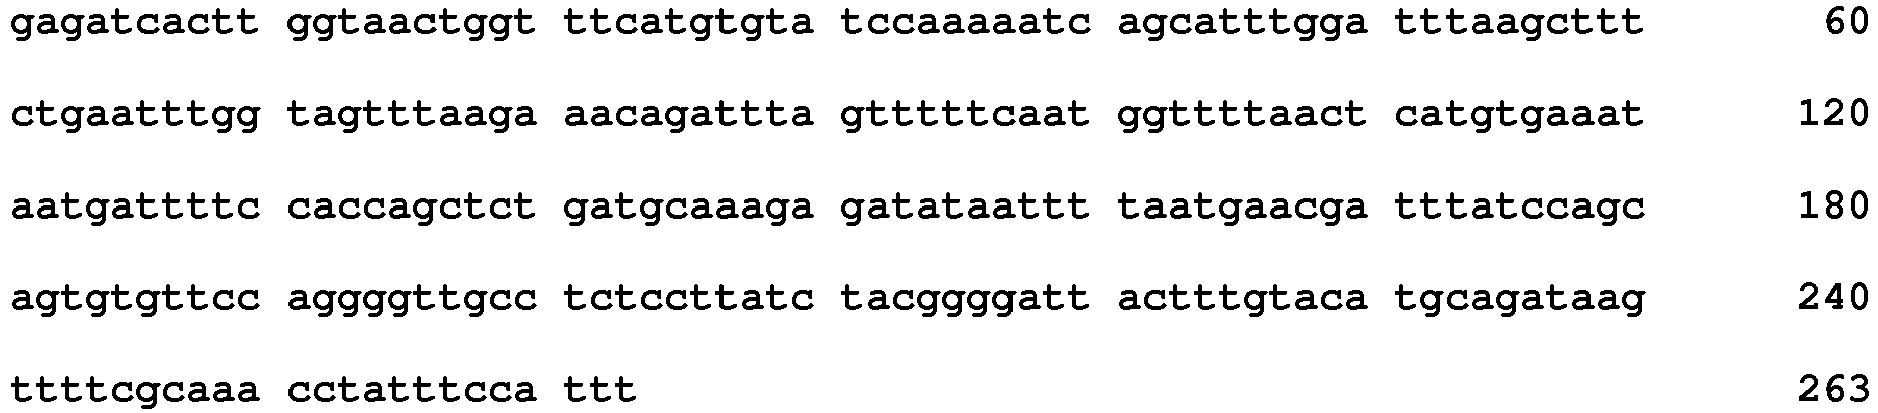
- <210> 828
<211> 252
<212> DNA
<213> Homo sapiens - <400> 828

- <210> 829
<211> 226
<212> DNA
<213> Homo sapiens - <400> 829

- <210> 830
<211> 100
<212> DNA
<213> Homo sapiens - <400> 830

- <210> 831
<211> 239
<212> DNA
<213> Homo sapiens - <400> 831


- <210> 832
<211> 292
<212> DNA
<213> Homo sapiens - <400> 832

- <210> 833
<211> 207
<212> DNA
<213> Homo sapiens - <400> 833

- <210> 834
<211> 183
<212> DNA
<213> Homo sapiens - <400> 834

- <210> 835
<211> 151
<212> DNA
<213> Homo sapiens - <400> 835


- <210> 836
<211> 233
<212> DNA
<213> Homo sapiens - <400> 836

- <210> 837
<211> 211
<212> DNA
<213> Homo sapiens - <400> 837

- <210> 838
<211> 270
<212> DNA
<213> Homo sapiens - <400> 838

- <210> 839
<211> 253
<212> DNA
<213> Homo sapiens - <400> 839


- <210> 840
<211> 194
<212> DNA
<213> Homo sapiens - <400> 840

- <210> 841
<211> 217
<212> DNA
<213> Homo sapiens - <400> 841

- <210> 842
<211> 180
<212> DNA
<213> Homo sapiens - <400> 842

- <210> 843
<211> 262
<212> DNA
<213> Homo sapiens - <400> 843

- <210> 844
<211> 274
<212> DNA
<213> Homo sapiens - <400> 844
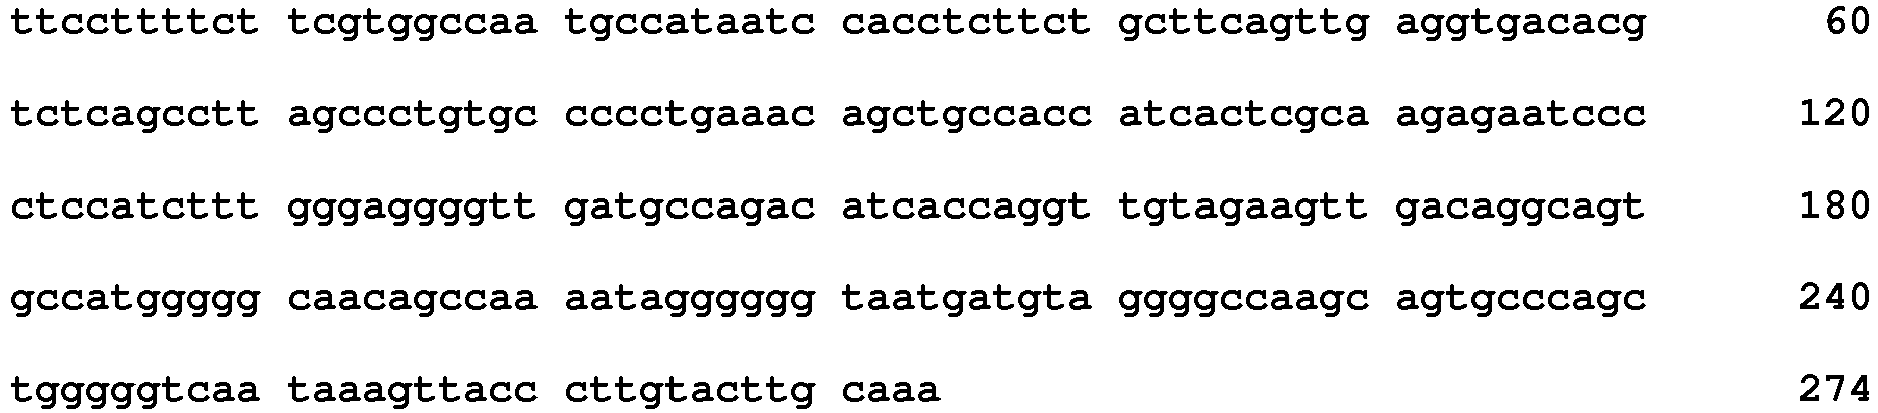
- <210> 845
<211> 289
<212> DNA
<213> Homo sapiens - <400> 845

- <210> 846
<211> 255
<212> DNA
<213> Homo sapiens - <400> 846

- <210> 847
<211> 166
<212> DNA
<213> Homo sapiens - <400> 847

- <210> 848
<211> 198
<212> DNA
<213> Homo sapiens - <400> 848

- <210> 849
<211> 187
<212> DNA
<213> Homo sapiens - <400> 849

- <210> 850
<211> 93
<212> DNA
<213> Homo sapiens - <400> 850

- <210> 851
<211> 257
<212> DNA
<213> Homo sapiens - <400> 851

- <210> 852
<211> 197
<212> DNA
<213> Homo sapiens - <400> 852

- <210> 853
<211> 151
<212> DNA
<213> Homo sapiens - <400> 853

- <210> 854
<211> 273
<212> DNA
<213> Homo sapiens - <400> 854

- <210> 855
<211> 284
<212> DNA
<213> Homo sapiens - <400> 855

- <210> 856
<211> 245
<212> DNA
<213> Homo sapiens - <400> 856
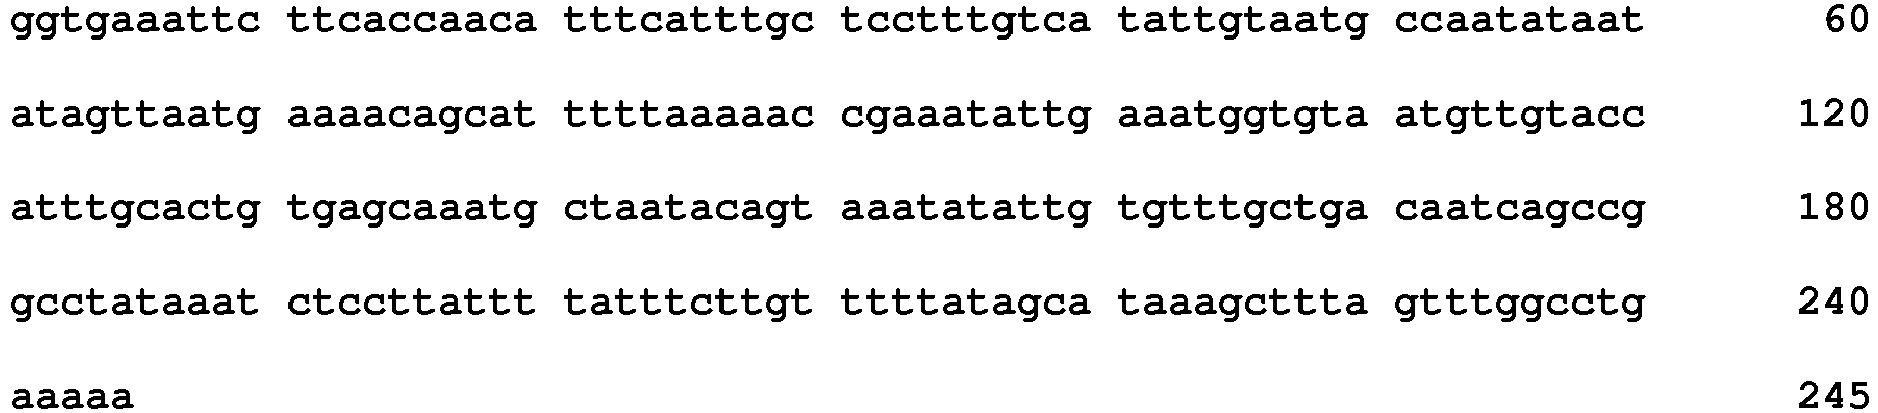
- <210> 857
<211> 268
<212> DNA
<213> Homo sapiens - <400> 857

- <210> 858
<211> 251
<212> DNA
<213> Homo sapiens - <400> 858

- <210> 859
<211> 32
<212> DNA
<213> Homo sapiens - <400> 859
ctcagcccaa cttcttaccc gaaagcatca ct 32 - <210> 860
<211> 268
<212> DNA
<213> Homo sapiens - <400> 860


- <210> 861
<211> 259
<212> DNA
<213> Homo sapiens - <400> 861

- <210> 862
<211> 166
<212> DNA
<213> Homo sapiens - <400> 862

- <210> 863
<211> 158
<212> DNA
<213> Homo sapiens - <400> 863

- <210> 864
<211> 88
<212> DNA
<213> Homo sapiens - <400> 864

- <210> 865
<211> 168
<212> DNA
<213> Homo sapiens - <400> 865

- <210> 866
<211> 237
<212> DNA
<213> Homo sapiens - <400> 866

- <210> 867
<211> 277
<212> DNA
<213> Homo sapiens - <400> 867

- <210> 868
<211> 280
<212> DNA
<213> Homo sapiens - <220>
<221> misc_feature
<222> (55)..(63)
<223> n is a, c, g, or t - <400> 868


- <210> 869
<211> 89
<212> DNA
<213> Homo sapiens - <400> 869

- <210> 870
<211> 274
<212> DNA
<213> Homo sapiens - <400> 870

- <210> 871
<211> 135
<212> DNA
<213> Homo sapiens - <400> 871

- <210> 872
<211> 221
<212> DNA
<213> Homo sapiens - <400> 872

- <210> 873
<211> 245
<212> DNA
<213> Homo sapiens - <400> 873

- <210> 874
<211> 292
<212> DNA
<213> Homo sapiens - <400> 874

- <210> 875
<211> 292
<212> DNA
<213> Homo sapiens - <400> 875

- <210> 876
<211> 90
<212> DNA
<213> Homo sapiens - <400> 876

- <210> 877
<211> 75
<212> DNA
<213> Homo sapiens - <400> 877

- <210> 878
<211> 208
<212> DNA
<213> Homo sapiens - <400> 878

- <210> 879
<211> 148
<212> DNA
<213> Homo sapiens - <400> 879

- <210> 880
<211> 207
<212> DNA
<213> Homo sapiens - <220>
<221> misc_feature
<222> (182)..(182)
<223> n is a, c, g, or t - <400> 880

- <210> 881
<211> 233
<212> DNA
<213> Homo sapiens - <400> 881

- <210> 882
<211> 254
<212> DNA
<213> Homo sapiens - <400> 882

- <210> 883
<211> 244
<212> DNA
<213> Homo sapiens - <400> 883

- <210> 884
<211> 291
<212> DNA
<213> Homo sapiens - <400> 884

- <210> 885
<211> 191
<212> DNA
<213> Homo sapiens - <400> 885

- <210> 886
<211> 238
<212> DNA
<213> Homo sapiens - <220>
<221> misc_feature
<222> (194)..(206)
<223> n is a, c, g, or t - <400> 886

- <210> 887
<211> 188
<212> DNA
<213> Homo sapiens - <400> 887

- <210> 888
<211> 191
<212> DNA
<213> Homo sapiens - <220>
<221> misc_feature
<222> (38)..(51)
<223> n is a, c, g, or t - <400> 888


- <210> 889
<211> 288
<212> DNA
<213> Homo sapiens - <220>
<221> misc_feature
<222> (114)..(145)
<223> n is a, c, g, or t - <220>
<221> misc_feature
<222> (219)..(232)
<223> n is a, c, g, or t - <400> 889

- <210> 890
<211> 189
<212> DNA
<213> Homo sapiens - <400> 890

- <210> 891
<211> 269
<212> DNA
<213> Homo sapiens - <400> 891


- <210> 892
<211> 183
<212> DNA
<213> Homo sapiens - <400> 892

- <210> 893
<211> 187
<212> DNA
<213> Homo sapiens - <400> 893

- <210> 894
<211> 183
<212> DNA
<213> Homo sapiens - <400> 894

- <210> 895
<211> 272
<212> DNA
<213> Homo sapiens - <400> 895


- <210> 896
<211> 224
<212> DNA
<213> Homo sapiens - <400> 896

- <210> 897
<211> 191
<212> DNA
<213> Homo sapiens - <400> 897

- <210> 898
<211> 217
<212> DNA
<213> Homo sapiens - <400> 898

- <210> 899
<211> 174
<212> DNA
<213> Homo sapiens - <400> 899

- <210> 900
<211> 269
<212> DNA
<213> Homo sapiens - <400> 900

- <210> 901
<211> 231
<212> DNA
<213> Homo sapiens - <400> 901

- <210> 902
<211> 186
<212> DNA
<213> Homo sapiens - <400> 902

- <210> 903
<211> 159
<212> DNA
<213> Homo sapiens - <400> 903

- <210> 904
<211> 295
<212> DNA
<213> Homo sapiens - <400> 904
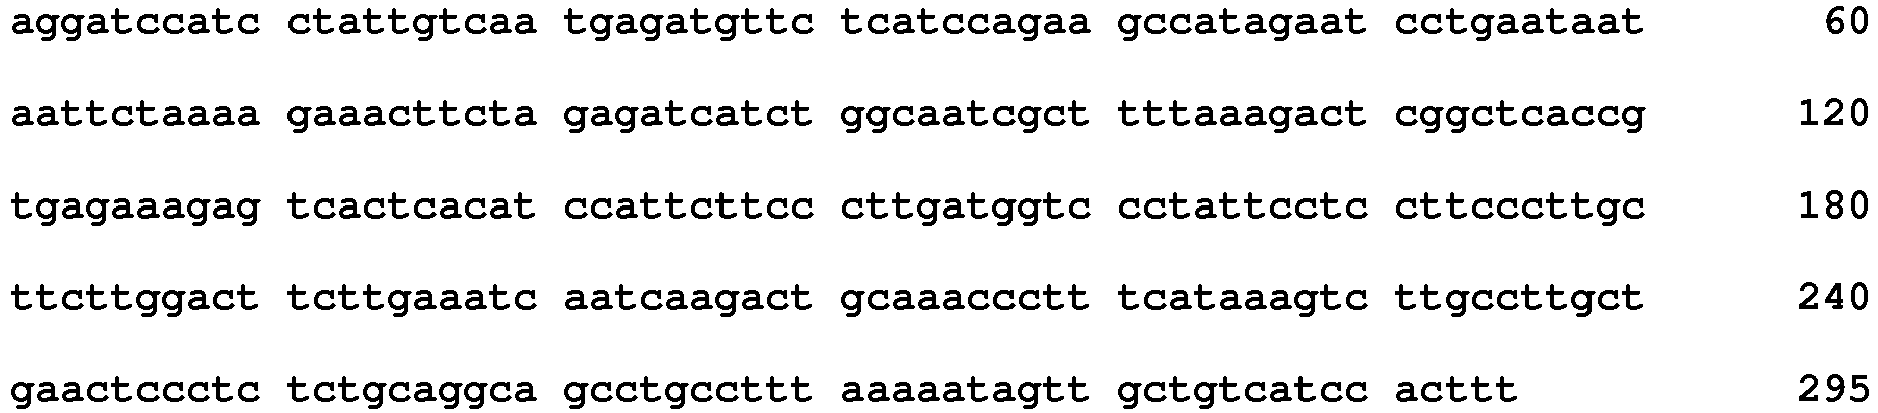
- <210> 905
<211> 175
<212> DNA
<213> Homo sapiens - <400> 905

- <210> 906
<211> 228
<212> DNA
<213> Homo sapiens - <400> 906

- <210> 907
<211> 293
<212> DNA
<213> Homo sapiens - <400> 907
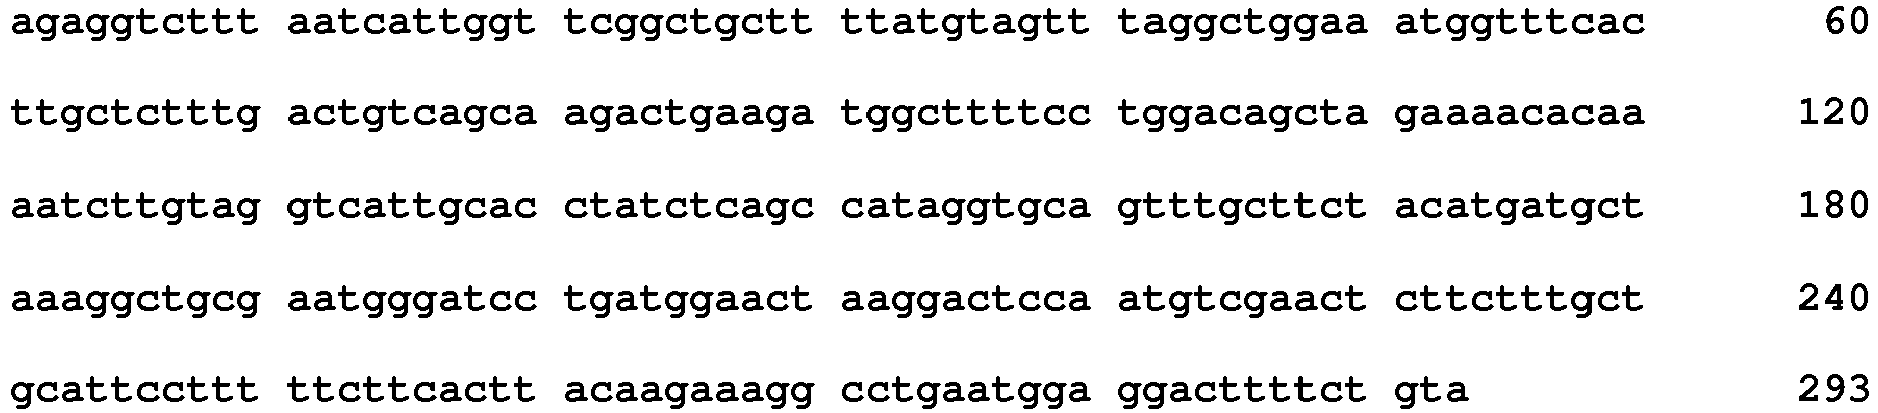
- <210> 908
<211> 137
<212> DNA
<213> Homo sapiens - <400> 908

- <210> 909
<211> 267
<212> DNA
<213> Homo sapiens - <400> 909

- <210> 910
<211> 254
<212> DNA
<213> Homo sapiens - <400> 910

- <210> 911
<211> 162
<212> DNA
<213> Homo sapiens - <400> 911

- <210> 912
<211> 254
<212> DNA
<213> Homo sapiens - <400> 912


- <210> 913
<211> 83
<212> DNA
<213> Homo sapiens - <400> 913

- <210> 914
<211> 296
<212> DNA
<213> Homo sapiens - <400> 914

- <210> 915
<211> 244
<212> DNA
<213> Homo sapiens - <400> 915

- <210> 916
<211> 253
<212> DNA
<213> Homo sapiens - <400> 916


- <210> 917
<211> 74
<212> DNA
<213> Homo sapiens - <400> 917

- <210> 918
<211> 294
<212> DNA
<213> Homo sapiens - <400> 918
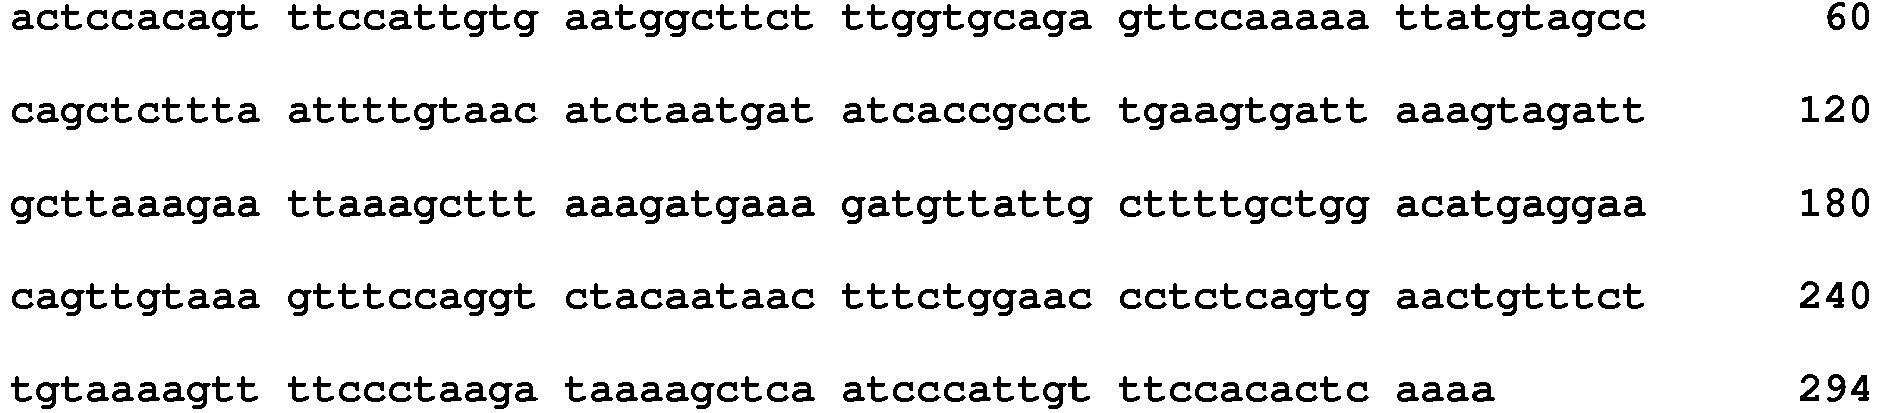
- <210> 919
<211> 153
<212> DNA
<213> Homo sapiens - <400> 919

- <210> 920
<211> 266
<212> DNA
<213> Homo sapiens - <400> 920

- <210> 921
<211> 202
<212> DNA
<213> Homo sapiens - <400> 921

- <210> 922
<211> 208
<212> DNA
<213> Homo sapiens - <220>
<221> misc_feature
<222> (124)..(124)
<223> n is a, c, g, or t - <400> 922

- <210> 923
<211> 150
<212> DNA
<213> Homo sapiens - <400> 923

- <210> 924
<211> 97
<212> DNA
<213> Homo sapiens - <400> 924

- <210> 925
<211> 237
<212> DNA
<213> Homo sapiens - <400> 925

- <210> 926
<211> 292
<212> DNA
<213> Homo sapiens - <220>
<221> misc_feature
<222> (54)..(55)
<223> n is a, c, g, or t - <400> 926

- <210> 927
<211> 243
<212> DNA
<213> Homo sapiens - <400> 927

- <210> 928
<211> 120
<212> DNA
<213> Homo sapiens - <400> 928

- <210> 929
<211> 185
<212> DNA
<213> Homo sapiens - <400> 929

- <210> 930
<211> 130
<212> DNA
<213> Homo sapiens - <400> 930

- <210> 931
<211> 86
<212> DNA
<213> Homo sapiens - <400> 931

- <210> 932
<211> 264
<212> DNA
<213> Homo sapiens - <400> 932
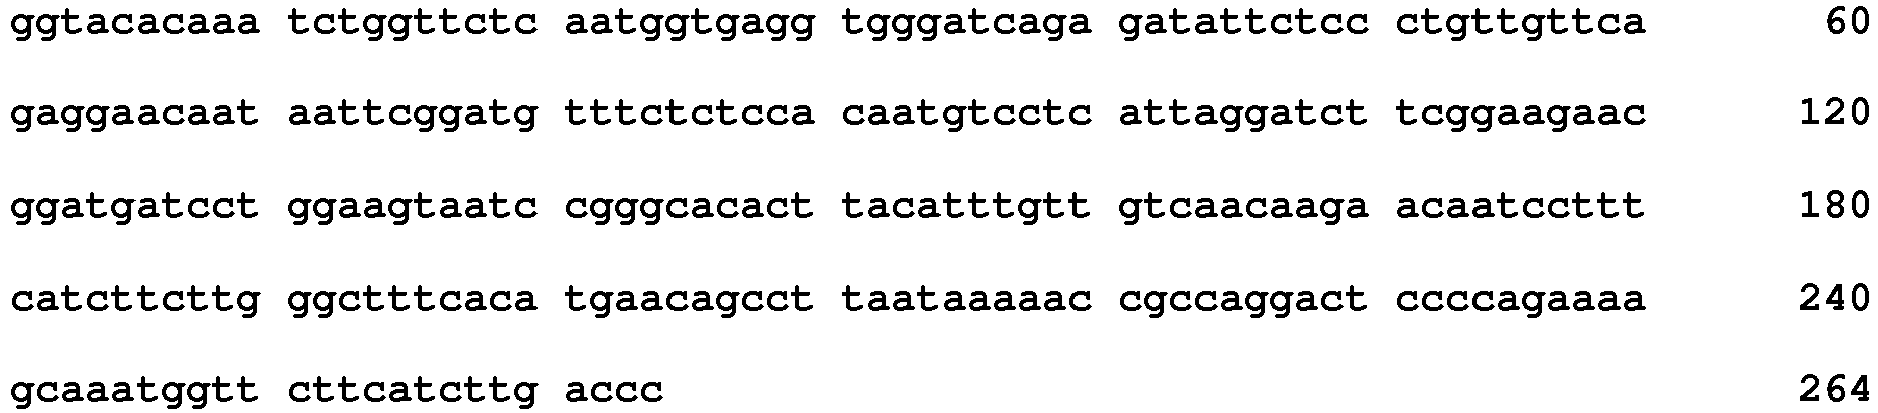
- <210> 933
<211> 101
<212> DNA
<213> Homo sapiens - <400> 933

- <210> 934
<211> 233
<212> DNA
<213> Homo sapiens - <400> 934

- <210> 935
<211> 256
<212> DNA
<213> Homo sapiens - <400> 935

- <210> 936
<211> 259
<212> DNA
<213> Homo sapiens - <400> 936

- <210> 937
<211> 114
<212> DNA
<213> Homo sapiens - <400> 937


- <210> 938
<211> 265
<212> DNA
<213> Homo sapiens - <400> 938

- <210> 939
<211> 198
<212> DNA
<213> Homo sapiens - <400> 939

- <210> 940
<211> 162
<212> DNA
<213> Homo sapiens - <400> 940

- <210> 941
<211> 256
<212> DNA
<213> Homo sapiens - <400> 941

- <210> 942
<211> 294
<212> DNA
<213> Homo sapiens - <400> 942
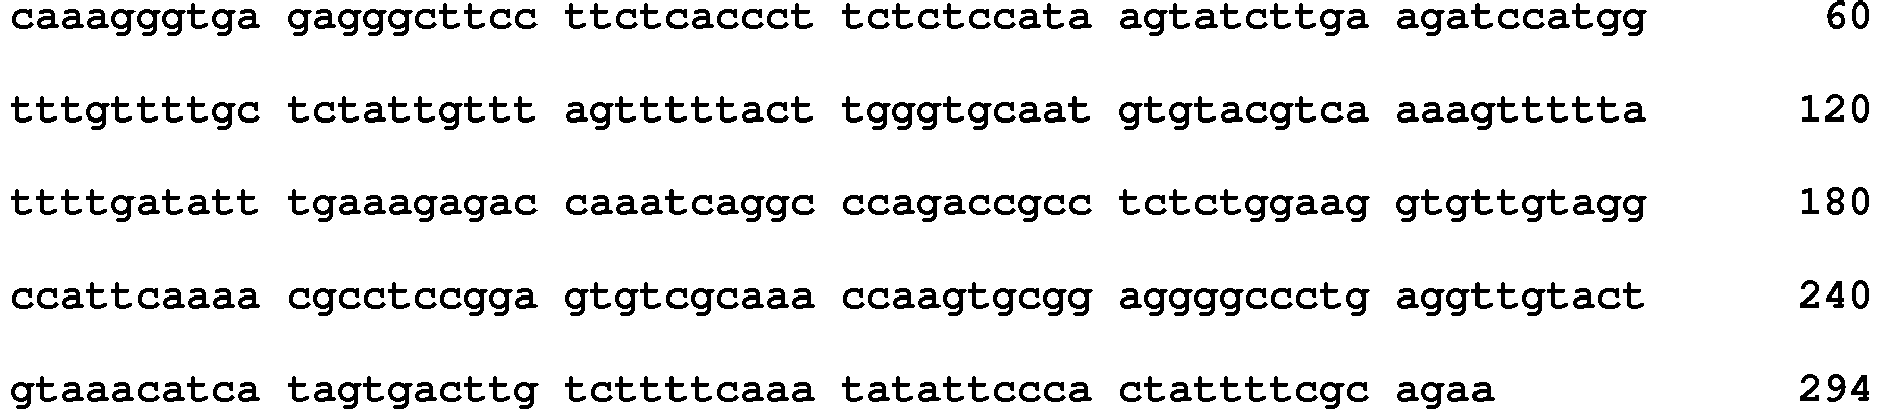
- <210> 943
<211> 221
<212> DNA
<213> Homo sapiens - <400> 943

- <210> 944
<211> 239
<212> DNA
<213> Homo sapiens - <400> 944

- <210> 945
<211> 181
<212> DNA
<213> Homo sapiens - <400> 945

- <210> 946
<211> 228
<212> DNA
<213> Homo sapiens - <400> 946

- <210> 947
<211> 136
<212> DNA
<213> Homo sapiens - <400> 947

- <210> 948
<211> 193
<212> DNA
<213> Homo sapiens - <400> 948

- <210> 949
<211> 175
<212> DNA
<213> Homo sapiens - <400> 949

- <210> 950
<211> 183
<212> DNA
<213> Homo sapiens - <400> 950

- <210> 951
<211> 235
<212> DNA
<213> Homo sapiens - <400> 951

- <210> 952
<211> 154
<212> DNA
<213> Homo sapiens - <400> 952

- <210> 953
<211> 280
<212> DNA
<213> Homo sapiens - <400> 953

- <210> 954
<211> 206
<212> DNA
<213> Homo sapiens - <400> 954


- <210> 955
<211> 247
<212> DNA
<213> Homo sapiens - <400> 955

- <210> 956
<211> 190
<212> DNA
<213> Homo sapiens - <400> 956

- <210> 957
<211> 165
<212> DNA
<213> Homo sapiens - <400> 957

- <210> 958
<211> 260
<212> DNA
<213> Homo sapiens - <400> 958


- <210> 959
<211> 197
<212> DNA
<213> Homo sapiens - <400> 959

- <210> 960
<211> 187
<212> DNA
<213> Homo sapiens - <400> 960

- <210> 961
<211> 228
<212> DNA
<213> Homo sapiens - <400> 961

- <210> 962
<211> 213
<212> DNA
<213> Homo sapiens - <400> 962

- <210> 963
<211> 104
<212> DNA
<213> Homo sapiens - <400> 963

- <210> 964
<211> 132
<212> DNA
<213> Homo sapiens - <400> 964

- <210> 965
<211> 281
<212> DNA
<213> Homo sapiens - <400> 965

- <210> 966
<211> 239
<212> DNA
<213> Homo sapiens - <400> 966

- <210> 967
<211> 174
<212> DNA
<213> Homo sapiens - <400> 967

- <210> 968
<211> 270
<212> DNA
<213> Homo sapiens - <400> 968

- <210> 969
<211> 276
<212> DNA
<213> Homo sapiens - <400> 969

- <210> 970
<211> 264
<212> DNA
<213> Homo sapiens - <400> 970

- <210> 971
<211> 275
<212> DNA
<213> Homo sapiens - <400> 971

- <210> 972
<211> 210
<212> DNA
<213> Homo sapiens - <400> 972

- <210> 973
<211> 235
<212> DNA
<213> Homo sapiens - <400> 973

- <210> 974
<211> 162
<212> DNA
<213> Homo sapiens - <400> 974

- <210> 975
<211> 249
<212> DNA
<213> Homo sapiens - <400> 975


Claims (15)
- A method for predicting a subject's responsiveness to an anti-angiogenic therapeutic agent comprising:measuring expression levels of a biomarker panel from a test cancer tissue sample obtained from a subject, wherein the biomarker panel comprises:a) IGF2 and at least one or more additional biomarkers selected from Table 2C,
wherein the one additional biomarker is not C21orf63, ISLR, MIR198, SLC5A1 or SNORD114-14 ; orb) IGF2 and at least two or more additional biomarkers selected from Table 2C;
wherein the biomarker panel does not consist of the 631 biomarkers shown in Table 1B of WO 2012/167278;determining a sample expression score for the biomarker panel;comparing the sample expression score to a threshold score; andclassifying the subject as responsive or non-responsive to the anti-angiogenic therapeutic agent based on whether the sample expression score is above or below the threshold expression score. - An anti-angiogenic therapeutic agent for use in a method of treating cancer in a subject, wherein the subject is selected for treatment by:measuring expression levels of a biomarker panel from a test cancer tissue sample obtained from the subject, wherein the biomarker panel comprises:a) IGF2 and at least one or more additional biomarkers selected from Table 2C,
wherein the one additional biomarker is not C21orf63, ISLR, MIR198, SLC5A1 or SNORD114-14 ; orb) IGF2 and at least two or more additional biomarkers selected from Table 2C;
wherein the biomarker panel does not consist of the 631 biomarkers shown in Table 1B of WO 2012/167278;determining a sample expression score for the biomarker panel;comparing the sample expression score to a threshold score; andwherein if the sample expression score is below the threshold score the subject is selected for treatment. - An anti-angiogenic therapeutic agent for use in a method of treating cancer in a subject, wherein the subject displays a sample expression score below a threshold score based on the expression levels of a biomarker panel from a test cancer tissue sample obtained from the subject, wherein the biomarker panel comprises:a) IGF2 and at least one or more additional biomarkers selected from Table 2C,wherein the one additional biomarker is not C21 orf63, ISLR, MIR198, SLC5A1 or SNORD114-14 ; orb) IGF2 and at least two or more additional biomarkers selected from Table 2C; wherein the biomarker panel does not consist of the 631 biomarkers shown in Table 1B of WO 2012/167278.
- A method for selecting whether to administer an anti-angiogenic therapeutic agent to a subject, comprising:measuring expression levels of a biomarker panel from a test cancer tissue sample obtained from the subject, wherein the biomarker panel comprises:a) IGF2 and at least one or more additional biomarkers selected from Table 2C,wherein the one additional biomarker is not C21 orf63, ISLR, MIR198, SLC5A1 or SNORD114-14 ; orb) IGF2 and at least two or more additional biomarkers selected from Table 2C;
wherein the biomarker panel does not consist of the 631 biomarkers shown in Table 1B of WO 2012/167278;determining a sample expression score for the biomarker panel;comparing the sample expression score to a threshold score; andwherein:(i) if the sample expression score is above the threshold score the subject is not selected for administration of an anti-angiogenic therapeutic agent; or(ii) if the sample expression score is below the threshold score the subject is selected for administration of an anti-angiogenic therapeutic agent. - The method of claims 1 or 4 or the anti-angiogenic therapeutic agent for use in a method of treating cancer according to claims 2 or 3, wherein:(a) the biomarker panel further comprises one or more of SOX11, INS, CXCL17, SLC5A1, TMEM45A, CXCR2P1, MFAP2, MATN3, or RTP4;or(b) the biomarker panel comprises the biomarkers listed in Table 2C.
- The method of any one of claims 1, 4 or 5 or the anti-angiogenic therapeutic agent for use in a method of treating cancer according to any one of claims 2, 3 or 5, wherein the sample expression score is determined by measuring an expression level for each biomarker and multiplying it by a corresponding weight, wherein an expression signature defines the weight for each biomarker, optionally wherein:
the expression signature is derived by a method comprising:isolating total RNA from a sample set of cancer tissue;hybridizing the isolated total RNA to a microarray to obtain a sample expression data set;selecting those probes on the microarray with a variability above a defined significance threshold to form a preliminary biomarker set;generating clusters of biomarkers within the preliminary biomarker set having a similar expression profile using a clustering algorithm;identifying the biological processes or biological pathways for each cluster of biomarkers;selecting the cluster corresponding to the biological process or biological pathway of interest; anddefining an expression signature by analyzing the expression levels of the biomarkers in the selected cluster in a the sample set of cancer tissue using a supervised or unsupervised training algorithm, optionally wherein the expression signature is defined using a PLS classifier, a SVM classifier, a SDA classifier, or a DSDA classifier. - The method of any one of claims 1, 4, 5 or 6 or the anti-angiogenic therapeutic agent for use in a method of treating cancer according to any one of claims 2, 3, 5 or 6, wherein the expression level of each biomarker in the biomarker panel is measured using a microarray, quantitative PCR, or an immunoassay.
- The method of any one of claims 1, 4, 5, 6 or 7 or the anti-angiogenic therapeutic agent for use in a method of treating cancer according to any one of claims 2, 3, 5, 6 or 7, wherein the cancer is ovarian cancer, prostate, breast cancer, colon cancer, or colorectal cancer.
- The method of any one of claims 1, 4, 5, 6, 7 or 8 or the anti-angiogenic therapeutic agent for use in a method of treating cancer according to any one of claims 2, 3, 5, 6, 7 or 8, wherein the anti-angiogenic therapeutic agent is a VEGF-pathway-targeted therapeutic agent, an angiopoietin-TIE2 pathway inhibitor, an endogenous angiogenic inhibitor, or an immunomodulatory agent, optionally wherein:(i) the VEGF pathway-targeted therapeutic agents include Bevacizumab (Avastin), Afibercept (VEGF Trap), IMC-1121B (Ramucirumab), Imatinib (Gleevec), Sorafenib (Nexavar), Gefitinib (Iressa), Sunitinib (Sutent), Erlotinib, Tivozinib, Cediranib (Recentin), Pazopanib (Votrient), BIBF 1120 (Vargatef), Dovitinib, Semaxanib (Sugen), Axitinib (AG013736), Vandetanib (Zactima), Nilotinib (Tasigna), Dasatinib (Sprycel), Vatalanib, Motesanib, ABT-869, TKI-258 or a combination thereof; or(ii) the angiopoietin-TIE2 pathway inhibitor includes AMG-386, PF-4856884 CVX-060, CEP-11981, CE-245677, MEDI-3617, CVX-241, Trastuzumab (Herceptin) or a combination thereof; or(iii) the endogenous angiogenic inhibitors include Thombospondin, Endostatin, Tumstatin, Canstatin, Arrestin, Angiostatin, Vasostatin, Interferon alpha or a combination thereof; or(iv) the immunomodulatory agents include thalidomide and lenalidomide.
- The method of any one of claims 1, 4, 5, 6, 7, 8 or 9 or the anti-angiogenic therapeutic agent for use in a method of treating cancer according to any one of claims 2, 3, 5, 6, 7, 8 or 9 further comprising determining the subject's prognosis, wherein a classification as responsive to the anti-angiogenic therapeutic agent indicates a good prognosis, the good prognosis indicating at least an increased expected survival time as compared to a classification as non-responsive to the anti-angiogenic therapeutic agent.
- A method for predicting subject responsiveness to anti-angiogenic therapeutic agents and providing treatment prognosis, the method comprising:
measuring expression levels of a first biomarker panel from a test sample of cancer tissue obtained from a subject with cancer, wherein the biomarker panel comprises:a) IGF2 and at least one or more additional biomarkers selected from Table 2C, wherein the one additional biomarker is not C21 orf63, ISLR, MIR198, SLC5A1 or SNORD114-14 ; orb) IGF2 and at least two or more additional biomarkers selected from Table 2C;determining a first sample expression score for the first biomarker panel;comparing the first sample expression score to a first threshold score classifying the subject as having a good prognosis or bad prognosis based on whether the first sample expression score is above or below the first threshold score, wherein a good prognosis indicates at least an increased expected survival time as compared to a bad prognosis and wherein, in the event of a bad prognosis;measuring expression levels of a second biomarker panel from the test sample of diseased tissue obtained from the subject, wherein the second biomarker panel comprises one or more biomarkers selected from Table 2A or Table 2B;determining a second sample expression score for the second biomarker panel; comparing the second sample expression score to a second threshold score; and classifying the subject as responsive or non-responsive to an anti-angiogenic therapeutic agent based on whether the second sample expression score is above or below the second threshold expression score. - The method of claim 11, wherein:(a) the first biomarker panel comprises one or more of IGF2, SOX11, INS, CXCL17, SLC5A1, TMEM45A, CXCR2P1, MFAP2, MATN3, or RTP4, and the second biomarker panel comprises one or more of CCDC80, INHBA, THBS2, SFRP2, MMP2, PLAU, FAP, FN1, COL8A1, and RAB31; or(b) the first biomarker panel comprises one or more of IGF2, SOX11, INS, CXCL17, SLC5A1, TMEM45A, CXCR2P1, MFAP2, MATN3, or RTP4, and the second biomarker panel comprises one or more of TMEM200A, GJB2, MMP13, GFPT2, POSTN, BICC1, CDH11, MRVI1, PMP22, and COL11A1; or(c) the first biomarker panel consists of the biomarkers in Table 2C, and the second biomarker panel consists of the biomarkers in Table 2A or 2B; and/or(d) the expression level of each biomarker in the biomarker panel is measured using a microarray, quantitative PCR, or an immunoassay.
- A method for identifying a cancer that is responsive to an anti-angiogenic therapeutic in a subject, the method comprising;
measuring expression levels of a biomarker panel from a test tissue sample which is, or is suspected of being, cancerous obtained from a subject having or suspected of having a cancer that is responsive to an anti-angiogenic therapeutic, wherein the biomarker panel comprises:a) IGF2 and at least one or more additional biomarkers selected from Table 2C, wherein the one additional biomarker is not C21 orf63, ISLR, MIR198, SLC5A1 or SNORD114-14 ; orb) IGF2 and at least two or more additional biomarkers selected from Table 2C; wherein the biomarker panel does not consist of the 631 biomarkers shown in Table 1B of WO 2012/167278;determining a sample expression score for the biomarker panel;
comparing the sample expression score to a threshold score; wherein the cancer that is responsive to an anti-angiogenic therapeutic is identified based on whether the sample expression score is above or below the threshold expression score. - The method of claim 13, wherein:(a) the biomarker panel further comprises one or more of SOX11, INS, CXCL17, SLC5A1, TMEM45A, CXCR2P1, MFAP2, MATN3, or RTP4; or(b) the biomarker panel comprises the biomarkers listed in Table 2C.
- The method of any one of claims 13 or 14, wherein:(a) the sample expression score is determined by measuring an expression level for each biomarker and multiplying it by a corresponding weight, wherein an expression signature defines the weight for each biomarker, optionally wherein the expression signature is defined using a PLS classifier, a SVM classifier, a SDA classifier, or a DSDA classifier; and/or(b) the cancer is ovarian cancer, glioblastoma, breast cancer, prostate cancer, colorectal cancer or colon cancer; and/or(c) the expression level of each biomarker in the biomarker panel is measured using a microarray, quantitative PCR, or an immunoassay.
Applications Claiming Priority (2)
| Application Number | Priority Date | Filing Date | Title |
|---|---|---|---|
| US201261732761P | 2012-12-03 | 2012-12-03 | |
| PCT/GB2013/053202 WO2014087156A1 (en) | 2012-12-03 | 2013-12-03 | Molecular diagnostic test for cancer |
Publications (2)
| Publication Number | Publication Date |
|---|---|
| EP2925885A1 EP2925885A1 (en) | 2015-10-07 |
| EP2925885B1 true EP2925885B1 (en) | 2020-02-05 |
Family
ID=49780086
Family Applications (1)
| Application Number | Title | Priority Date | Filing Date |
|---|---|---|---|
| EP13808178.1A Active EP2925885B1 (en) | 2012-12-03 | 2013-12-03 | Molecular diagnostic test for cancer |
Country Status (12)
| Country | Link |
|---|---|
| US (1) | US11091809B2 (en) |
| EP (1) | EP2925885B1 (en) |
| JP (1) | JP2015536667A (en) |
| KR (1) | KR20150090246A (en) |
| CN (1) | CN105102631A (en) |
| AU (1) | AU2013353839A1 (en) |
| CA (1) | CA2893033A1 (en) |
| HK (1) | HK1214633A1 (en) |
| IL (1) | IL239196A0 (en) |
| MX (1) | MX2015006955A (en) |
| SG (1) | SG11201504023SA (en) |
| WO (1) | WO2014087156A1 (en) |
Families Citing this family (39)
| Publication number | Priority date | Publication date | Assignee | Title |
|---|---|---|---|---|
| SG10201604497UA (en) | 2011-06-02 | 2016-07-28 | Almac Diagnostics Ltd | Molecular Diagnostic Test For Cancer |
| CA2893033A1 (en) | 2012-12-03 | 2014-06-12 | Almac Diagnostics Limited | Molecular diagnostic test for cancer |
| US10456470B2 (en) | 2013-08-30 | 2019-10-29 | Genentech, Inc. | Diagnostic methods and compositions for treatment of glioblastoma |
| US10617755B2 (en) | 2013-08-30 | 2020-04-14 | Genentech, Inc. | Combination therapy for the treatment of glioblastoma |
| GB201409479D0 (en) * | 2014-05-28 | 2014-07-09 | Almac Diagnostics Ltd | Molecular diagnostic test for cancer |
| GB201409476D0 (en) * | 2014-05-28 | 2014-07-09 | Almac Diagnostics Ltd | Molecular subtype for use in prognosis |
| GB201409478D0 (en) * | 2014-05-28 | 2014-07-09 | Almac Diagnostics Ltd | Pro-angiogenic signature |
| JP2017523776A (en) * | 2014-07-14 | 2017-08-24 | ジェネンテック, インコーポレイテッド | Glioblastoma diagnosis method and therapeutic composition thereof |
| CN104212440B (en) * | 2014-09-03 | 2016-03-30 | 无锡艾德美特生物科技有限公司 | One class quinazoline ditosylate salt fluorescent probe and Synthesis and applications thereof |
| HK1243141A1 (en) * | 2014-12-23 | 2018-07-06 | 豪夫迈.罗氏有限公司 | Compositions and methods for treating and diagnosing chemotherapy-resistant cancers |
| ES2824574T3 (en) * | 2016-01-25 | 2021-05-12 | Sanofi Sa | Method of predicting the outcome of aflibercept treatment in a patient suspected of having cancer by measuring the level of a plasma biomarker |
| JP2019515670A (en) * | 2016-04-15 | 2019-06-13 | ジェネンテック, インコーポレイテッド | Methods for monitoring and treating cancer |
| AU2017268234A1 (en) * | 2016-05-17 | 2018-12-13 | Genentech, Inc. | Stromal gene signatures for diagnosis and use in immunotherapy |
| WO2018124153A1 (en) | 2016-12-28 | 2018-07-05 | 公益財団法人がん研究会 | Biomarker for predicting therapeutic effect of anti-vegfr-2 antibody drug, screening method, and screening kit |
| CA3052670A1 (en) | 2017-03-01 | 2018-09-07 | Genentech, Inc. | Diagnostic and therapeutic methods for cancer |
| US11322226B2 (en) * | 2017-06-13 | 2022-05-03 | Bostongene Corporation | Systems and methods for generating, visualizing and classifying molecular functional profiles |
| US10636512B2 (en) * | 2017-07-14 | 2020-04-28 | Cofactor Genomics, Inc. | Immuno-oncology applications using next generation sequencing |
| AU2018301704A1 (en) * | 2017-07-14 | 2020-03-05 | Cofactor Genomics, Inc. | Immuno-oncology applications using next generation sequencing |
| CN107621545B (en) * | 2017-07-26 | 2019-10-11 | 东南大学 | Novel use of BICC1 protein for psychiatric disease diagnosis |
| WO2019074920A1 (en) * | 2017-10-10 | 2019-04-18 | Oncocyte Corporation | Methods and compositions for detection and diagnosis of breast cancer |
| DE112018006190T5 (en) * | 2017-12-04 | 2020-08-20 | Nantomics, Llc | SUBTYPING OF TNBC AND METHODS |
| CN108524937B (en) * | 2018-05-11 | 2020-05-05 | 中南大学湘雅三医院 | Application of MRVI1-AS1 AS target site in preparation of drugs for treating nasopharyngeal carcinoma paclitaxel chemotherapy sensitization |
| CN112996444B (en) * | 2018-08-31 | 2024-07-26 | 西诺医疗器械股份有限公司 | Method and system for determining cancer molecular subtypes based on ultrasound and/or photoacoustic (OA/US) features |
| CN109585011A (en) * | 2018-10-26 | 2019-04-05 | 朱海燕 | The Illnesses Diagnoses method and machine readable storage medium of chest pain patients |
| SG11202111824UA (en) * | 2019-04-30 | 2021-11-29 | Larimar Therapeutics Inc | Frataxin-sensitive markers for determining effectiveness of frataxin replacement therapy |
| CN110358827A (en) * | 2019-07-09 | 2019-10-22 | 中国人民解放军第四军医大学 | Application of VMP1 gene in pathological diagnosis of glioblastoma and preparation of its kit |
| WO2021034091A1 (en) * | 2019-08-19 | 2021-02-25 | 재단법인 아산사회복지재단 | Method for diagnosing glioblastoma |
| IT201900023946A1 (en) * | 2019-12-13 | 2021-06-13 | Complexdata S R L | Method for determining a long-term survival prognosis of breast cancer patients, based on algorithms that model biological networks |
| CN111105843B (en) * | 2019-12-31 | 2023-07-21 | 杭州纽安津生物科技有限公司 | HLAI type molecule and polypeptide affinity prediction method |
| CN111735949B (en) * | 2020-07-17 | 2023-07-21 | 北京信诺卫康科技有限公司 | Combination of Wnt7a and CA125 as biomarkers and kits for early ovarian cancer |
| CN112266961B (en) * | 2020-10-29 | 2023-05-12 | 中山大学附属第六医院 | Application of TSG-6 gene in predicting colorectal cancer metastasis and prognosis |
| CN112592397B (en) * | 2020-12-31 | 2022-08-30 | 上海市胸科医院 | CCDC 80-derived polypeptide and application thereof |
| CN113035298B (en) * | 2021-04-02 | 2023-06-20 | 南京信息工程大学 | A drug clinical trial design method for recursively generating large-order row-limited coverage arrays |
| KR102897399B1 (en) * | 2021-04-12 | 2025-12-08 | 연세대학교 산학협력단 | A Novel Biomarker for Diagnosing Breast Cancer |
| WO2022241264A2 (en) * | 2021-05-13 | 2022-11-17 | Arizona Board Of Regents On Behalf Of The University Of Arizona | Method of targeted multi-panel approach and tiered a.i. use for differential diagnosis and prognosis |
| CN116243003B (en) * | 2023-02-20 | 2025-12-09 | 东莞市滨海湾中心医院(东莞市太平人民医院、东莞市第五人民医院) | Use of SMOX in the preparation of a colorectal cancer diagnostic or prognostic product |
| CN116482367A (en) * | 2023-05-04 | 2023-07-25 | 中国中医科学院望京医院(中国中医科学院骨伤科研究所) | A colorectal cancer detection method combining mSEPT9 detection and biomarkers |
| CN116519954B (en) * | 2023-06-28 | 2023-10-27 | 杭州广科安德生物科技有限公司 | Colorectal cancer detection model construction method, colorectal cancer detection model construction system and biomarker |
| CN117089621B (en) * | 2023-09-28 | 2024-06-25 | 上海爱谱蒂康生物科技有限公司 | Biomarker combinations and their use in predicting colorectal cancer efficacy |
Citations (2)
| Publication number | Priority date | Publication date | Assignee | Title |
|---|---|---|---|---|
| US20100279892A1 (en) * | 2007-12-07 | 2010-11-04 | Mcweeney Shannon K | Methods to determine if a subject will respond to a bcr-abl inhibitor |
| WO2012054284A2 (en) * | 2010-10-20 | 2012-04-26 | University Of Tennessee Research Foundation | Interferon gene signature and methods of use thereof |
Family Cites Families (65)
| Publication number | Priority date | Publication date | Assignee | Title |
|---|---|---|---|---|
| US5525464A (en) | 1987-04-01 | 1996-06-11 | Hyseq, Inc. | Method of sequencing by hybridization of oligonucleotide probes |
| US5202231A (en) | 1987-04-01 | 1993-04-13 | Drmanac Radoje T | Method of sequencing of genomes by hybridization of oligonucleotide probes |
| GB8810400D0 (en) | 1988-05-03 | 1988-06-08 | Southern E | Analysing polynucleotide sequences |
| US5547839A (en) | 1989-06-07 | 1996-08-20 | Affymax Technologies N.V. | Sequencing of surface immobilized polymers utilizing microflourescence detection |
| US5143854A (en) | 1989-06-07 | 1992-09-01 | Affymax Technologies N.V. | Large scale photolithographic solid phase synthesis of polypeptides and receptor binding screening thereof |
| US5800992A (en) | 1989-06-07 | 1998-09-01 | Fodor; Stephen P.A. | Method of detecting nucleic acids |
| US6040138A (en) | 1995-09-15 | 2000-03-21 | Affymetrix, Inc. | Expression monitoring by hybridization to high density oligonucleotide arrays |
| EP0430881A3 (en) | 1989-11-29 | 1991-10-23 | Ciba-Geigy Ag | Photochromic compounds, process for their preparation and their use |
| US5288644A (en) | 1990-04-04 | 1994-02-22 | The Rockefeller University | Instrument and method for the sequencing of genome |
| US5324633A (en) | 1991-11-22 | 1994-06-28 | Affymax Technologies N.V. | Method and apparatus for measuring binding affinity |
| DE69322266T2 (en) | 1992-04-03 | 1999-06-02 | Perkin-Elmer Corp., Foster City, Calif. | SAMPLES COMPOSITION AND METHOD |
| US5503980A (en) | 1992-11-06 | 1996-04-02 | Trustees Of Boston University | Positional sequencing by hybridization |
| US5858659A (en) | 1995-11-29 | 1999-01-12 | Affymetrix, Inc. | Polymorphism detection |
| US5470710A (en) | 1993-10-22 | 1995-11-28 | University Of Utah | Automated hybridization/imaging device for fluorescent multiplex DNA sequencing |
| GB9401833D0 (en) | 1994-02-01 | 1994-03-30 | Isis Innovation | Method for discovering ligands |
| US6946442B2 (en) | 1994-11-30 | 2005-09-20 | Asif Syed Ahmed | Method of hastening cervical ripening |
| GB9507238D0 (en) | 1995-04-07 | 1995-05-31 | Isis Innovation | Detecting dna sequence variations |
| US5661028A (en) | 1995-09-29 | 1997-08-26 | Lockheed Martin Energy Systems, Inc. | Large scale DNA microsequencing device |
| JP2002515738A (en) | 1996-01-23 | 2002-05-28 | アフィメトリックス,インコーポレイティド | Nucleic acid analysis |
| US6680175B2 (en) | 1998-05-05 | 2004-01-20 | Adherex Technologies, Inc. | Methods for diagnosing and evaluating cancer |
| WO2004005883A2 (en) | 2002-07-02 | 2004-01-15 | The Johns Hopkins University | Secreted and cytoplasmic tumor endothelial markers |
| US6998234B2 (en) | 2000-11-03 | 2006-02-14 | Oncotech, Inc. | Methods for cancer prognosis and diagnosis relating to tumor vascular endothelial cells |
| US20030215424A1 (en) | 2002-05-15 | 2003-11-20 | Seul Kyung Hwan | Method of modulating angiogenesis |
| NZ621449A (en) | 2003-05-30 | 2015-07-31 | Genentech Inc | Treatment with anti-vegf antibodies |
| WO2004108896A2 (en) * | 2003-06-03 | 2004-12-16 | The Board Of Trustees Of The University Of Arkansas | Gene expression profiling of uterine serous papillary carcinomas and ovarian serous papillary tumors |
| US7700280B2 (en) | 2003-12-31 | 2010-04-20 | The Penn State Research Foundation | Methods for assessing cisplatin resistance, disease progression, and treatment efficacy in ovarian cancer |
| US20080113874A1 (en) | 2004-01-23 | 2008-05-15 | The Regents Of The University Of Colorado | Gefitinib sensitivity-related gene expression and products and methods related thereto |
| US7871769B2 (en) | 2004-04-09 | 2011-01-18 | Genomic Health, Inc. | Gene expression markers for predicting response to chemotherapy |
| WO2005103281A2 (en) * | 2004-04-26 | 2005-11-03 | Children's Medical Center Corporation | Platelet biomarkers for the detection of disease |
| WO2005113801A2 (en) | 2004-05-14 | 2005-12-01 | Ludwig Institute For Cancer Research | Identification and characterization of a subset of glioblastomas sensitive to treatment with imatinib |
| US20080286771A1 (en) | 2004-07-23 | 2008-11-20 | Kevin Hudson | Method of Predicting the Responsiveness of a Tumour to Erbb Receptor Drugs |
| US20060134663A1 (en) | 2004-11-03 | 2006-06-22 | Paul Harkin | Transcriptome microarray technology and methods of using the same |
| US7862995B2 (en) * | 2004-12-10 | 2011-01-04 | Targeted Molecular Diagnostics | Methods and materials for predicting responsiveness to treatment with dual tyrosine kinase inhibitor |
| ATE477495T1 (en) | 2005-03-16 | 2010-08-15 | Osi Pharm Inc | BIOLOGICAL MARKERS PREDICTIVE OF CANCER RESPONSIVENESS TO EPIDERMAL GROWTH FACTOR RECEPTOR KINASE INHIBITORS |
| US20080305962A1 (en) | 2005-07-29 | 2008-12-11 | Ralph Markus Wirtz | Methods and Kits for the Prediction of Therapeutic Success, Recurrence Free and Overall Survival in Cancer Therapies |
| CA2623125A1 (en) | 2005-09-20 | 2007-03-29 | Osi Pharmaceuticals, Inc. | Biological markers predictive of anti-cancer response to insulin-like growth factor-1 receptor kinase inhibitors |
| US8445198B2 (en) | 2005-12-01 | 2013-05-21 | Medical Prognosis Institute | Methods, kits and devices for identifying biomarkers of treatment response and use thereof to predict treatment efficacy |
| WO2007067500A2 (en) | 2005-12-05 | 2007-06-14 | Genomic Health, Inc. | Predictors of patient response to treatment with egfr inhibitors |
| US7919261B2 (en) | 2005-12-05 | 2011-04-05 | Merck Sharp & Dohme Corp. | Methods for predicting treatment response based on the expression profiles of protein and transcription biomarkers |
| EP1987360B1 (en) | 2006-01-27 | 2012-03-07 | Tripath Imaging, Inc. | Methods for identifying patients with an increased likelihood of having ovarian cancer and compositions therefor |
| EP2010916A2 (en) | 2006-04-13 | 2009-01-07 | Oncomethylome Sciences SA | Novel tumour suppressor |
| US8768629B2 (en) | 2009-02-11 | 2014-07-01 | Caris Mpi, Inc. | Molecular profiling of tumors |
| EP2074226A2 (en) | 2006-09-19 | 2009-07-01 | Novartis AG | Biomarkers of target modulation, efficacy, diagnosis and/or prognosis for raf inhibitors |
| NZ582941A (en) | 2007-08-13 | 2012-05-25 | Almac Diagnostics Ltd | A 3' -based sequencing approach for microarray manufacture |
| WO2009042814A1 (en) | 2007-09-25 | 2009-04-02 | Minerva Biotechnologies Corp. | Early diagnosis and treatment of drug resistance in muc1-positive cancer |
| NZ562237A (en) | 2007-10-05 | 2011-02-25 | Pacific Edge Biotechnology Ltd | Proliferation signature and prognosis for gastrointestinal cancer |
| BRPI0817158A2 (en) * | 2007-11-09 | 2015-04-14 | Genentech Inc | "Method to Identify a Kidney Cancer Patient, Kit, Methods and Compound Set" |
| US8507656B2 (en) * | 2008-01-28 | 2013-08-13 | Medimmune Limited | Stabilized angiopoietin-2 antibodies and uses thereof |
| US8114593B2 (en) | 2008-03-12 | 2012-02-14 | University Of Medicine And Dentistry Of New Jersey | Cancer biomarker genes and gene products and methods for using the same |
| WO2009149297A1 (en) | 2008-06-04 | 2009-12-10 | The Arizona Board Regents, On Behalf Of The University Of Arizona | Diffuse large b-cell lymphoma markers and uses therefor |
| CA2726811C (en) | 2008-06-06 | 2019-11-26 | The United States Of America, As Represented By The Secretary, Dept. Of Health And Human Services | Survival predictor for diffuse large b cell lymphoma |
| KR20110052627A (en) | 2008-07-16 | 2011-05-18 | 다나-파버 캔서 인스티튜트 인크. | Signature and PC Determinants Related to Prostate Cancer and Methods of Use thereof |
| EP2321651B1 (en) | 2008-07-23 | 2017-08-23 | F. Hoffmann-La Roche AG | Identification of subjects being susceptible to anti-angiogenesis therapy |
| CA2747937C (en) | 2008-12-23 | 2019-02-26 | Merck Patent Gmbh | Biomarkers for inhibitors with anti-angiogenic activity |
| WO2010088688A2 (en) | 2009-02-02 | 2010-08-05 | Biotheranostics, Inc. | Diagnosis of in situ and invasive breast cancer |
| SG175832A1 (en) * | 2009-05-01 | 2011-12-29 | Genomic Health Inc | Gene expression profile algorithm and test for likelihood of recurrence of colorectal cancer and response to chemotherapy |
| US7615353B1 (en) * | 2009-07-06 | 2009-11-10 | Aveo Pharmaceuticals, Inc. | Tivozanib response prediction |
| MX2012002909A (en) * | 2009-09-17 | 2012-04-19 | Hoffmann La Roche | METHODS AND COMPOSITIONS FOR USE IN DIAGNOSIS OF PATIENTS WITH CANCER. |
| EA201390370A1 (en) * | 2010-09-15 | 2013-07-30 | Олмак Дайэгностикс Лимитед | MOLECULAR DIAGNOSTIC TEST FOR DETERMINATION OF ONCOLOGICAL DISEASE |
| WO2012052757A1 (en) | 2010-10-20 | 2012-04-26 | Astrazeneca Ab | Tumour phenotype patient selection method |
| EP2659005A4 (en) | 2010-12-28 | 2016-08-24 | Caris Mpi Inc | MOLECULAR PROFILING FOR CANCER |
| SG10201604497UA (en) * | 2011-06-02 | 2016-07-28 | Almac Diagnostics Ltd | Molecular Diagnostic Test For Cancer |
| AU2013207778B2 (en) | 2012-01-13 | 2017-10-12 | Genentech, Inc. | Biological markers for identifying patients for treatment with VEGF antagonists |
| EP2667193A1 (en) | 2012-05-23 | 2013-11-27 | Université d'Aix-Marseille | MMP2 as a predictive biomarker of response to antiangiogenic therapy and survival after therapy in cancer patients |
| CA2893033A1 (en) | 2012-12-03 | 2014-06-12 | Almac Diagnostics Limited | Molecular diagnostic test for cancer |
-
2013
- 2013-12-03 CA CA2893033A patent/CA2893033A1/en not_active Abandoned
- 2013-12-03 HK HK16102633.1A patent/HK1214633A1/en unknown
- 2013-12-03 CN CN201380071098.3A patent/CN105102631A/en active Pending
- 2013-12-03 AU AU2013353839A patent/AU2013353839A1/en not_active Abandoned
- 2013-12-03 JP JP2015544542A patent/JP2015536667A/en active Pending
- 2013-12-03 KR KR1020157017703A patent/KR20150090246A/en not_active Withdrawn
- 2013-12-03 EP EP13808178.1A patent/EP2925885B1/en active Active
- 2013-12-03 WO PCT/GB2013/053202 patent/WO2014087156A1/en not_active Ceased
- 2013-12-03 MX MX2015006955A patent/MX2015006955A/en unknown
- 2013-12-03 SG SG11201504023SA patent/SG11201504023SA/en unknown
- 2013-12-03 US US14/649,421 patent/US11091809B2/en not_active Expired - Fee Related
-
2015
- 2015-06-03 IL IL239196A patent/IL239196A0/en unknown
Patent Citations (2)
| Publication number | Priority date | Publication date | Assignee | Title |
|---|---|---|---|---|
| US20100279892A1 (en) * | 2007-12-07 | 2010-11-04 | Mcweeney Shannon K | Methods to determine if a subject will respond to a bcr-abl inhibitor |
| WO2012054284A2 (en) * | 2010-10-20 | 2012-04-26 | University Of Tennessee Research Foundation | Interferon gene signature and methods of use thereof |
Non-Patent Citations (2)
| Title |
|---|
| DIRK HOSE ET AL: "Induction of angiogenesis by normal and malignant plasma cells", BLOOD, vol. 114, no. 1, 18 March 2009 (2009-03-18), pages 128 - 143, XP055360848, DOI: 10.1182/blood-2008- * |
| YANG LIU ET AL: "Vascular gene expression patterns are conserved in primary and metastatic brain tumors", JOURNAL OF NEURO-ONCOLOGY, KLUWER ACADEMIC PUBLISHERS, BO, vol. 99, no. 1, 9 January 2010 (2010-01-09), pages 13 - 24, XP019827153, ISSN: 1573-7373 * |
Also Published As
| Publication number | Publication date |
|---|---|
| CA2893033A1 (en) | 2014-06-12 |
| EP2925885A1 (en) | 2015-10-07 |
| JP2015536667A (en) | 2015-12-24 |
| US11091809B2 (en) | 2021-08-17 |
| MX2015006955A (en) | 2016-01-25 |
| US20160002732A1 (en) | 2016-01-07 |
| SG11201504023SA (en) | 2015-06-29 |
| AU2013353839A1 (en) | 2015-06-18 |
| CN105102631A (en) | 2015-11-25 |
| IL239196A0 (en) | 2015-07-30 |
| WO2014087156A1 (en) | 2014-06-12 |
| KR20150090246A (en) | 2015-08-05 |
| HK1214633A1 (en) | 2016-07-29 |
Similar Documents
| Publication | Publication Date | Title |
|---|---|---|
| US11091809B2 (en) | Molecular diagnostic test for cancer | |
| EP2715348B1 (en) | Molecular diagnostic test for cancer | |
| US10280468B2 (en) | Molecular diagnostic test for predicting response to anti-angiogenic drugs and prognosis of cancer | |
| EP3325653B1 (en) | Gene signature for immune therapies in cancer | |
| US10378066B2 (en) | Molecular diagnostic test for cancer | |
| AU2012261820A1 (en) | Molecular diagnostic test for cancer | |
| AU2014316824A1 (en) | Molecular diagnostic test for lung cancer | |
| US20160222460A1 (en) | Molecular diagnostic test for oesophageal cancer | |
| US20170088902A1 (en) | Expression profiling for cancers treated with anti-angiogenic therapy |
Legal Events
| Date | Code | Title | Description |
|---|---|---|---|
| PUAI | Public reference made under article 153(3) epc to a published international application that has entered the european phase |
Free format text: ORIGINAL CODE: 0009012 |
|
| 17P | Request for examination filed |
Effective date: 20150603 |
|
| AK | Designated contracting states |
Kind code of ref document: A1 Designated state(s): AL AT BE BG CH CY CZ DE DK EE ES FI FR GB GR HR HU IE IS IT LI LT LU LV MC MK MT NL NO PL PT RO RS SE SI SK SM TR |
|
| AX | Request for extension of the european patent |
Extension state: BA ME |
|
| RIN1 | Information on inventor provided before grant (corrected) |
Inventor name: KENNEDY, RICHARD Inventor name: DEHARO, STEVE Inventor name: KEATING, KATHERINE E Inventor name: PATTERSON, FIONNUALA Inventor name: MCCAVIGAN, ANDRENA Inventor name: DAVISON, TIMOTHY Inventor name: O'DONNELL, JUDE Inventor name: TRINDER, CLAIRE Inventor name: WINTER, ANDREAS Inventor name: O'BRIEN, EAMONN J Inventor name: BYLESJO, MAX Inventor name: HARKIN, DENNIS PAUL Inventor name: GOURLEY, CHARLIE Inventor name: HILL, LAURA A Inventor name: PROUTSKI, VITALI Inventor name: MICHIE, CAROLINE |
|
| RIN1 | Information on inventor provided before grant (corrected) |
Inventor name: HARKIN, DENNIS PAUL Inventor name: DEHARO, STEVE Inventor name: DAVISON, TIMOTHY Inventor name: MICHIE, CAROLINE Inventor name: KEATING, KATHERINE E Inventor name: GOURLEY, CHARLIE Inventor name: WINTER, ANDREAS Inventor name: PATTERSON, FIONNUALA Inventor name: O'DONNELL, JUDE Inventor name: KENNEDY, RICHARD Inventor name: TRINDER, CLAIRE Inventor name: PROUTSKI, VITALI Inventor name: HILL, LAURA A Inventor name: O'BRIEN, EAMONN J Inventor name: BYLESJO, MAX Inventor name: MCCAVIGAN, ANDRENA |
|
| REG | Reference to a national code |
Ref country code: HK Ref legal event code: DE Ref document number: 1214633 Country of ref document: HK |
|
| 17Q | First examination report despatched |
Effective date: 20160822 |
|
| STAA | Information on the status of an ep patent application or granted ep patent |
Free format text: STATUS: EXAMINATION IS IN PROGRESS |
|
| REG | Reference to a national code |
Ref country code: DE Ref legal event code: R079 Ref document number: 602013065510 Country of ref document: DE Free format text: PREVIOUS MAIN CLASS: C12Q0001680000 Ipc: C12Q0001688600 |
|
| GRAP | Despatch of communication of intention to grant a patent |
Free format text: ORIGINAL CODE: EPIDOSNIGR1 |
|
| STAA | Information on the status of an ep patent application or granted ep patent |
Free format text: STATUS: GRANT OF PATENT IS INTENDED |
|
| RAP1 | Party data changed (applicant data changed or rights of an application transferred) |
Owner name: ALMAC DIAGNOSTIC SERVICES LIMITED |
|
| RIC1 | Information provided on ipc code assigned before grant |
Ipc: C12Q 1/6886 20180101AFI20190201BHEP |
|
| INTG | Intention to grant announced |
Effective date: 20190226 |
|
| GRAJ | Information related to disapproval of communication of intention to grant by the applicant or resumption of examination proceedings by the epo deleted |
Free format text: ORIGINAL CODE: EPIDOSDIGR1 |
|
| STAA | Information on the status of an ep patent application or granted ep patent |
Free format text: STATUS: EXAMINATION IS IN PROGRESS |
|
| GRAP | Despatch of communication of intention to grant a patent |
Free format text: ORIGINAL CODE: EPIDOSNIGR1 |
|
| STAA | Information on the status of an ep patent application or granted ep patent |
Free format text: STATUS: GRANT OF PATENT IS INTENDED |
|
| INTC | Intention to grant announced (deleted) | ||
| INTG | Intention to grant announced |
Effective date: 20190723 |
|
| GRAS | Grant fee paid |
Free format text: ORIGINAL CODE: EPIDOSNIGR3 |
|
| GRAA | (expected) grant |
Free format text: ORIGINAL CODE: 0009210 |
|
| STAA | Information on the status of an ep patent application or granted ep patent |
Free format text: STATUS: THE PATENT HAS BEEN GRANTED |
|
| AK | Designated contracting states |
Kind code of ref document: B1 Designated state(s): AL AT BE BG CH CY CZ DE DK EE ES FI FR GB GR HR HU IE IS IT LI LT LU LV MC MK MT NL NO PL PT RO RS SE SI SK SM TR |
|
| AX | Request for extension of the european patent |
Extension state: BA ME |
|
| REG | Reference to a national code |
Ref country code: GB Ref legal event code: FG4D |
|
| REG | Reference to a national code |
Ref country code: AT Ref legal event code: REF Ref document number: 1229938 Country of ref document: AT Kind code of ref document: T Effective date: 20200215 |
|
| REG | Reference to a national code |
Ref country code: DE Ref legal event code: R096 Ref document number: 602013065510 Country of ref document: DE |
|
| REG | Reference to a national code |
Ref country code: IE Ref legal event code: FG4D |
|
| REG | Reference to a national code |
Ref country code: CH Ref legal event code: EP |
|
| REG | Reference to a national code |
Ref country code: NL Ref legal event code: MP Effective date: 20200205 |
|
| PG25 | Lapsed in a contracting state [announced via postgrant information from national office to epo] |
Ref country code: NO Free format text: LAPSE BECAUSE OF FAILURE TO SUBMIT A TRANSLATION OF THE DESCRIPTION OR TO PAY THE FEE WITHIN THE PRESCRIBED TIME-LIMIT Effective date: 20200505 Ref country code: PT Free format text: LAPSE BECAUSE OF FAILURE TO SUBMIT A TRANSLATION OF THE DESCRIPTION OR TO PAY THE FEE WITHIN THE PRESCRIBED TIME-LIMIT Effective date: 20200628 Ref country code: FI Free format text: LAPSE BECAUSE OF FAILURE TO SUBMIT A TRANSLATION OF THE DESCRIPTION OR TO PAY THE FEE WITHIN THE PRESCRIBED TIME-LIMIT Effective date: 20200205 Ref country code: RS Free format text: LAPSE BECAUSE OF FAILURE TO SUBMIT A TRANSLATION OF THE DESCRIPTION OR TO PAY THE FEE WITHIN THE PRESCRIBED TIME-LIMIT Effective date: 20200205 |
|
| REG | Reference to a national code |
Ref country code: LT Ref legal event code: MG4D |
|
| PG25 | Lapsed in a contracting state [announced via postgrant information from national office to epo] |
Ref country code: HR Free format text: LAPSE BECAUSE OF FAILURE TO SUBMIT A TRANSLATION OF THE DESCRIPTION OR TO PAY THE FEE WITHIN THE PRESCRIBED TIME-LIMIT Effective date: 20200205 Ref country code: IS Free format text: LAPSE BECAUSE OF FAILURE TO SUBMIT A TRANSLATION OF THE DESCRIPTION OR TO PAY THE FEE WITHIN THE PRESCRIBED TIME-LIMIT Effective date: 20200605 Ref country code: GR Free format text: LAPSE BECAUSE OF FAILURE TO SUBMIT A TRANSLATION OF THE DESCRIPTION OR TO PAY THE FEE WITHIN THE PRESCRIBED TIME-LIMIT Effective date: 20200506 Ref country code: BG Free format text: LAPSE BECAUSE OF FAILURE TO SUBMIT A TRANSLATION OF THE DESCRIPTION OR TO PAY THE FEE WITHIN THE PRESCRIBED TIME-LIMIT Effective date: 20200505 Ref country code: LV Free format text: LAPSE BECAUSE OF FAILURE TO SUBMIT A TRANSLATION OF THE DESCRIPTION OR TO PAY THE FEE WITHIN THE PRESCRIBED TIME-LIMIT Effective date: 20200205 Ref country code: SE Free format text: LAPSE BECAUSE OF FAILURE TO SUBMIT A TRANSLATION OF THE DESCRIPTION OR TO PAY THE FEE WITHIN THE PRESCRIBED TIME-LIMIT Effective date: 20200205 |
|
| PG25 | Lapsed in a contracting state [announced via postgrant information from national office to epo] |
Ref country code: NL Free format text: LAPSE BECAUSE OF FAILURE TO SUBMIT A TRANSLATION OF THE DESCRIPTION OR TO PAY THE FEE WITHIN THE PRESCRIBED TIME-LIMIT Effective date: 20200205 |
|
| PG25 | Lapsed in a contracting state [announced via postgrant information from national office to epo] |
Ref country code: RO Free format text: LAPSE BECAUSE OF FAILURE TO SUBMIT A TRANSLATION OF THE DESCRIPTION OR TO PAY THE FEE WITHIN THE PRESCRIBED TIME-LIMIT Effective date: 20200205 Ref country code: CZ Free format text: LAPSE BECAUSE OF FAILURE TO SUBMIT A TRANSLATION OF THE DESCRIPTION OR TO PAY THE FEE WITHIN THE PRESCRIBED TIME-LIMIT Effective date: 20200205 Ref country code: ES Free format text: LAPSE BECAUSE OF FAILURE TO SUBMIT A TRANSLATION OF THE DESCRIPTION OR TO PAY THE FEE WITHIN THE PRESCRIBED TIME-LIMIT Effective date: 20200205 Ref country code: SK Free format text: LAPSE BECAUSE OF FAILURE TO SUBMIT A TRANSLATION OF THE DESCRIPTION OR TO PAY THE FEE WITHIN THE PRESCRIBED TIME-LIMIT Effective date: 20200205 Ref country code: DK Free format text: LAPSE BECAUSE OF FAILURE TO SUBMIT A TRANSLATION OF THE DESCRIPTION OR TO PAY THE FEE WITHIN THE PRESCRIBED TIME-LIMIT Effective date: 20200205 Ref country code: LT Free format text: LAPSE BECAUSE OF FAILURE TO SUBMIT A TRANSLATION OF THE DESCRIPTION OR TO PAY THE FEE WITHIN THE PRESCRIBED TIME-LIMIT Effective date: 20200205 Ref country code: EE Free format text: LAPSE BECAUSE OF FAILURE TO SUBMIT A TRANSLATION OF THE DESCRIPTION OR TO PAY THE FEE WITHIN THE PRESCRIBED TIME-LIMIT Effective date: 20200205 Ref country code: SM Free format text: LAPSE BECAUSE OF FAILURE TO SUBMIT A TRANSLATION OF THE DESCRIPTION OR TO PAY THE FEE WITHIN THE PRESCRIBED TIME-LIMIT Effective date: 20200205 |
|
| REG | Reference to a national code |
Ref country code: DE Ref legal event code: R097 Ref document number: 602013065510 Country of ref document: DE |
|
| REG | Reference to a national code |
Ref country code: AT Ref legal event code: MK05 Ref document number: 1229938 Country of ref document: AT Kind code of ref document: T Effective date: 20200205 |
|
| PLBE | No opposition filed within time limit |
Free format text: ORIGINAL CODE: 0009261 |
|
| STAA | Information on the status of an ep patent application or granted ep patent |
Free format text: STATUS: NO OPPOSITION FILED WITHIN TIME LIMIT |
|
| 26N | No opposition filed |
Effective date: 20201106 |
|
| PG25 | Lapsed in a contracting state [announced via postgrant information from national office to epo] |
Ref country code: AT Free format text: LAPSE BECAUSE OF FAILURE TO SUBMIT A TRANSLATION OF THE DESCRIPTION OR TO PAY THE FEE WITHIN THE PRESCRIBED TIME-LIMIT Effective date: 20200205 Ref country code: IT Free format text: LAPSE BECAUSE OF FAILURE TO SUBMIT A TRANSLATION OF THE DESCRIPTION OR TO PAY THE FEE WITHIN THE PRESCRIBED TIME-LIMIT Effective date: 20200205 |
|
| PG25 | Lapsed in a contracting state [announced via postgrant information from national office to epo] |
Ref country code: PL Free format text: LAPSE BECAUSE OF FAILURE TO SUBMIT A TRANSLATION OF THE DESCRIPTION OR TO PAY THE FEE WITHIN THE PRESCRIBED TIME-LIMIT Effective date: 20200205 Ref country code: SI Free format text: LAPSE BECAUSE OF FAILURE TO SUBMIT A TRANSLATION OF THE DESCRIPTION OR TO PAY THE FEE WITHIN THE PRESCRIBED TIME-LIMIT Effective date: 20200205 |
|
| REG | Reference to a national code |
Ref country code: CH Ref legal event code: PL |
|
| PG25 | Lapsed in a contracting state [announced via postgrant information from national office to epo] |
Ref country code: MC Free format text: LAPSE BECAUSE OF FAILURE TO SUBMIT A TRANSLATION OF THE DESCRIPTION OR TO PAY THE FEE WITHIN THE PRESCRIBED TIME-LIMIT Effective date: 20200205 |
|
| REG | Reference to a national code |
Ref country code: BE Ref legal event code: MM Effective date: 20201231 |
|
| PG25 | Lapsed in a contracting state [announced via postgrant information from national office to epo] |
Ref country code: IE Free format text: LAPSE BECAUSE OF NON-PAYMENT OF DUE FEES Effective date: 20201203 Ref country code: LU Free format text: LAPSE BECAUSE OF NON-PAYMENT OF DUE FEES Effective date: 20201203 |
|
| PG25 | Lapsed in a contracting state [announced via postgrant information from national office to epo] |
Ref country code: LI Free format text: LAPSE BECAUSE OF NON-PAYMENT OF DUE FEES Effective date: 20201231 Ref country code: CH Free format text: LAPSE BECAUSE OF NON-PAYMENT OF DUE FEES Effective date: 20201231 |
|
| PG25 | Lapsed in a contracting state [announced via postgrant information from national office to epo] |
Ref country code: TR Free format text: LAPSE BECAUSE OF FAILURE TO SUBMIT A TRANSLATION OF THE DESCRIPTION OR TO PAY THE FEE WITHIN THE PRESCRIBED TIME-LIMIT Effective date: 20200205 Ref country code: MT Free format text: LAPSE BECAUSE OF FAILURE TO SUBMIT A TRANSLATION OF THE DESCRIPTION OR TO PAY THE FEE WITHIN THE PRESCRIBED TIME-LIMIT Effective date: 20200205 Ref country code: CY Free format text: LAPSE BECAUSE OF FAILURE TO SUBMIT A TRANSLATION OF THE DESCRIPTION OR TO PAY THE FEE WITHIN THE PRESCRIBED TIME-LIMIT Effective date: 20200205 |
|
| PG25 | Lapsed in a contracting state [announced via postgrant information from national office to epo] |
Ref country code: MK Free format text: LAPSE BECAUSE OF FAILURE TO SUBMIT A TRANSLATION OF THE DESCRIPTION OR TO PAY THE FEE WITHIN THE PRESCRIBED TIME-LIMIT Effective date: 20200205 Ref country code: AL Free format text: LAPSE BECAUSE OF FAILURE TO SUBMIT A TRANSLATION OF THE DESCRIPTION OR TO PAY THE FEE WITHIN THE PRESCRIBED TIME-LIMIT Effective date: 20200205 |
|
| REG | Reference to a national code |
Ref country code: HK Ref legal event code: WD Ref document number: 1214633 Country of ref document: HK |
|
| PG25 | Lapsed in a contracting state [announced via postgrant information from national office to epo] |
Ref country code: BE Free format text: LAPSE BECAUSE OF NON-PAYMENT OF DUE FEES Effective date: 20201231 |
|
| PGFP | Annual fee paid to national office [announced via postgrant information from national office to epo] |
Ref country code: GB Payment date: 20221219 Year of fee payment: 10 Ref country code: FR Payment date: 20221214 Year of fee payment: 10 Ref country code: DE Payment date: 20221219 Year of fee payment: 10 |
|
| REG | Reference to a national code |
Ref country code: DE Ref legal event code: R119 Ref document number: 602013065510 Country of ref document: DE |
|
| GBPC | Gb: european patent ceased through non-payment of renewal fee |
Effective date: 20231203 |
|
| PG25 | Lapsed in a contracting state [announced via postgrant information from national office to epo] |
Ref country code: DE Free format text: LAPSE BECAUSE OF NON-PAYMENT OF DUE FEES Effective date: 20240702 |
|
| PG25 | Lapsed in a contracting state [announced via postgrant information from national office to epo] |
Ref country code: GB Free format text: LAPSE BECAUSE OF NON-PAYMENT OF DUE FEES Effective date: 20231203 |
|
| PG25 | Lapsed in a contracting state [announced via postgrant information from national office to epo] |
Ref country code: FR Free format text: LAPSE BECAUSE OF NON-PAYMENT OF DUE FEES Effective date: 20231231 |
|
| PG25 | Lapsed in a contracting state [announced via postgrant information from national office to epo] |
Ref country code: GB Free format text: LAPSE BECAUSE OF NON-PAYMENT OF DUE FEES Effective date: 20231203 Ref country code: FR Free format text: LAPSE BECAUSE OF NON-PAYMENT OF DUE FEES Effective date: 20231231 Ref country code: DE Free format text: LAPSE BECAUSE OF NON-PAYMENT OF DUE FEES Effective date: 20240702 |