EP2925226B1 - Method and apparatus for estimating the fall risk of a user - Google Patents
Method and apparatus for estimating the fall risk of a user Download PDFInfo
- Publication number
- EP2925226B1 EP2925226B1 EP13821173.5A EP13821173A EP2925226B1 EP 2925226 B1 EP2925226 B1 EP 2925226B1 EP 13821173 A EP13821173 A EP 13821173A EP 2925226 B1 EP2925226 B1 EP 2925226B1
- Authority
- EP
- European Patent Office
- Prior art keywords
- acceleration
- user
- measurements
- sit
- fall risk
- Prior art date
- Legal status (The legal status is an assumption and is not a legal conclusion. Google has not performed a legal analysis and makes no representation as to the accuracy of the status listed.)
- Active
Links
- 238000000034 method Methods 0.000 title claims description 41
- 230000001133 acceleration Effects 0.000 claims description 213
- 238000012546 transfer Methods 0.000 claims description 130
- 238000005259 measurement Methods 0.000 claims description 92
- 230000005484 gravity Effects 0.000 claims description 38
- 238000012545 processing Methods 0.000 claims description 23
- 230000008569 process Effects 0.000 claims description 9
- 238000004590 computer program Methods 0.000 claims description 7
- 230000008859 change Effects 0.000 description 15
- 238000004422 calculation algorithm Methods 0.000 description 14
- 230000006870 function Effects 0.000 description 7
- 238000006243 chemical reaction Methods 0.000 description 6
- 238000001914 filtration Methods 0.000 description 5
- 230000003287 optical effect Effects 0.000 description 5
- 238000007781 pre-processing Methods 0.000 description 4
- 238000005070 sampling Methods 0.000 description 4
- 230000008901 benefit Effects 0.000 description 3
- 238000001514 detection method Methods 0.000 description 3
- 230000000694 effects Effects 0.000 description 3
- 239000003550 marker Substances 0.000 description 3
- 238000012544 monitoring process Methods 0.000 description 3
- 230000002265 prevention Effects 0.000 description 3
- 238000012502 risk assessment Methods 0.000 description 3
- 230000001419 dependent effect Effects 0.000 description 2
- 238000010586 diagram Methods 0.000 description 2
- 238000000605 extraction Methods 0.000 description 2
- 210000001624 hip Anatomy 0.000 description 2
- 230000010354 integration Effects 0.000 description 2
- 210000004197 pelvis Anatomy 0.000 description 2
- 230000035945 sensitivity Effects 0.000 description 2
- 210000001562 sternum Anatomy 0.000 description 2
- 238000012549 training Methods 0.000 description 2
- 238000012935 Averaging Methods 0.000 description 1
- 238000000540 analysis of variance Methods 0.000 description 1
- 238000009530 blood pressure measurement Methods 0.000 description 1
- 238000004364 calculation method Methods 0.000 description 1
- 230000003111 delayed effect Effects 0.000 description 1
- 238000006073 displacement reaction Methods 0.000 description 1
- 238000011156 evaluation Methods 0.000 description 1
- 238000002474 experimental method Methods 0.000 description 1
- 230000036541 health Effects 0.000 description 1
- 230000007774 longterm Effects 0.000 description 1
- 238000011002 quantification Methods 0.000 description 1
- 230000009467 reduction Effects 0.000 description 1
- 230000004044 response Effects 0.000 description 1
- 230000011218 segmentation Effects 0.000 description 1
- 239000007787 solid Substances 0.000 description 1
- 238000012360 testing method Methods 0.000 description 1
- 230000007704 transition Effects 0.000 description 1
Images


Classifications
-
- A—HUMAN NECESSITIES
- A61—MEDICAL OR VETERINARY SCIENCE; HYGIENE
- A61B—DIAGNOSIS; SURGERY; IDENTIFICATION
- A61B5/00—Measuring for diagnostic purposes; Identification of persons
- A61B5/103—Detecting, measuring or recording devices for testing the shape, pattern, colour, size or movement of the body or parts thereof, for diagnostic purposes
- A61B5/11—Measuring movement of the entire body or parts thereof, e.g. head or hand tremor, mobility of a limb
- A61B5/1116—Determining posture transitions
- A61B5/1117—Fall detection
-
- A—HUMAN NECESSITIES
- A61—MEDICAL OR VETERINARY SCIENCE; HYGIENE
- A61B—DIAGNOSIS; SURGERY; IDENTIFICATION
- A61B5/00—Measuring for diagnostic purposes; Identification of persons
-
- A—HUMAN NECESSITIES
- A61—MEDICAL OR VETERINARY SCIENCE; HYGIENE
- A61B—DIAGNOSIS; SURGERY; IDENTIFICATION
- A61B5/00—Measuring for diagnostic purposes; Identification of persons
- A61B5/103—Detecting, measuring or recording devices for testing the shape, pattern, colour, size or movement of the body or parts thereof, for diagnostic purposes
- A61B5/11—Measuring movement of the entire body or parts thereof, e.g. head or hand tremor, mobility of a limb
-
- A—HUMAN NECESSITIES
- A61—MEDICAL OR VETERINARY SCIENCE; HYGIENE
- A61B—DIAGNOSIS; SURGERY; IDENTIFICATION
- A61B5/00—Measuring for diagnostic purposes; Identification of persons
- A61B5/68—Arrangements of detecting, measuring or recording means, e.g. sensors, in relation to patient
- A61B5/6801—Arrangements of detecting, measuring or recording means, e.g. sensors, in relation to patient specially adapted to be attached to or worn on the body surface
-
- A—HUMAN NECESSITIES
- A61—MEDICAL OR VETERINARY SCIENCE; HYGIENE
- A61B—DIAGNOSIS; SURGERY; IDENTIFICATION
- A61B5/00—Measuring for diagnostic purposes; Identification of persons
- A61B5/72—Signal processing specially adapted for physiological signals or for diagnostic purposes
- A61B5/7235—Details of waveform analysis
- A61B5/7246—Details of waveform analysis using correlation, e.g. template matching or determination of similarity
-
- A—HUMAN NECESSITIES
- A61—MEDICAL OR VETERINARY SCIENCE; HYGIENE
- A61B—DIAGNOSIS; SURGERY; IDENTIFICATION
- A61B5/00—Measuring for diagnostic purposes; Identification of persons
- A61B5/72—Signal processing specially adapted for physiological signals or for diagnostic purposes
- A61B5/7271—Specific aspects of physiological measurement analysis
- A61B5/7275—Determining trends in physiological measurement data; Predicting development of a medical condition based on physiological measurements, e.g. determining a risk factor
-
- G—PHYSICS
- G16—INFORMATION AND COMMUNICATION TECHNOLOGY [ICT] SPECIALLY ADAPTED FOR SPECIFIC APPLICATION FIELDS
- G16H—HEALTHCARE INFORMATICS, i.e. INFORMATION AND COMMUNICATION TECHNOLOGY [ICT] SPECIALLY ADAPTED FOR THE HANDLING OR PROCESSING OF MEDICAL OR HEALTHCARE DATA
- G16H50/00—ICT specially adapted for medical diagnosis, medical simulation or medical data mining; ICT specially adapted for detecting, monitoring or modelling epidemics or pandemics
- G16H50/30—ICT specially adapted for medical diagnosis, medical simulation or medical data mining; ICT specially adapted for detecting, monitoring or modelling epidemics or pandemics for calculating health indices; for individual health risk assessment
-
- A—HUMAN NECESSITIES
- A61—MEDICAL OR VETERINARY SCIENCE; HYGIENE
- A61B—DIAGNOSIS; SURGERY; IDENTIFICATION
- A61B2560/00—Constructional details of operational features of apparatus; Accessories for medical measuring apparatus
- A61B2560/02—Operational features
- A61B2560/0242—Operational features adapted to measure environmental factors, e.g. temperature, pollution
- A61B2560/0247—Operational features adapted to measure environmental factors, e.g. temperature, pollution for compensation or correction of the measured physiological value
- A61B2560/0257—Operational features adapted to measure environmental factors, e.g. temperature, pollution for compensation or correction of the measured physiological value using atmospheric pressure
-
- A—HUMAN NECESSITIES
- A61—MEDICAL OR VETERINARY SCIENCE; HYGIENE
- A61B—DIAGNOSIS; SURGERY; IDENTIFICATION
- A61B2562/00—Details of sensors; Constructional details of sensor housings or probes; Accessories for sensors
- A61B2562/02—Details of sensors specially adapted for in-vivo measurements
- A61B2562/0219—Inertial sensors, e.g. accelerometers, gyroscopes, tilt switches
Definitions
- the invention relates to a method and apparatus that estimates the fall risk of a user based on an analysis of a sit-to-stand transfer movement by the user.
- Falls are one of the greatest health risk factors for elderly people. About one third of older people above the age of 65 fall at least once a year.
- clinical measurement systems such as those including a force plate and an optical marker system
- the force plate provides the vertical ground reaction force
- the optical marker system provides a measure of displacement in three dimensions. The combination of both measurements is used to quantify the power during a sit-to-stand transfer.
- Fall risk assessment in the home environment is usually carried out by a telephone interview or by self-reporting from the user themselves, but these assessments are not particularly reliable.
- this problem is less critical, since the start and end times can be determined through observation of the user as they perform the STS. Analysis of the signal can be performed with assistance from these observations. Also, the acceleration signal around the STS transfer is less noisy as it would be in a daily life situation. This also helps the delineation as well as reducing the influence of errors in the delineation. Outside of the clinical setting (e.g. in daily life), this observation is absent, and delineation is a problem. In addition, the acceleration signal will be more noisy. It is possible for the user to manually indicate the start and/or end of the transfer, for example by pressing a button at the onset or end of the STS, but this means that the system is not unobtrusive.
- the variations of the sit-to-stand transfer include a normal speed transfer (NormSTS), a normal speed transfer in which the user does not use their arms (NormSTSwithoutArms), a faster transfer (FastSTS), and transfers that occur as part of a fast and normal speed timed-up-and-go (TUG) test, where the user has to stand up, walk and return to the sitting position (labeled STSinFastTUG and STSinNormTUG respectively).
- NormalSTS normal speed transfer
- NormalSTSwithoutArms a normal speed transfer in which the user does not use their arms
- FastSTS faster transfer
- TMG fast and normal speed timed-up-and-go
- the graphs in Figure 2 illustrate that peak vertical acceleration exhibits the same sensitivity to fall risk as peak power.
- the left hand side of Figure 2(a) shows an analysis of the variance of the peak vertical acceleration values (scaled for gravity) that are found for healthy (i.e. low fall risk) users
- the right hand side shows an analysis of the variance of the peak vertical acceleration values (scaled for gravity) that are found for frail (i.e. high fall risk) users.
- Figure 2(b) shows the corresponding analysis of variance for peak power, and thus it can be seen that peak vertical acceleration during a sit-to-stand transfer provides similar information on the fall risk of the user as peak power.
- the invention exploits the finding that the peak vertical acceleration during a sit-to-stand transfer provides a useful measure of the fall risk of the user.
- the identified peak vertical acceleration is scaled using an estimate of gravity obtained from the measurements of the acceleration of the user and the scaled peak vertical acceleration is used to estimate the fall risk for the user.
- Calibration errors in the sensor measurements can introduce errors into the peak vertical acceleration and thus the assessment of fall risk. Therefore, scaling the peak vertical acceleration in this way means that the calibration errors can be removed from the sensor measurements.
- the method further comprises the steps of estimating acceleration due to gravity from the measurements of the acceleration of the user; and subtracting the estimated acceleration due to gravity from the identified peak vertical acceleration to give a scaled peak vertical acceleration.
- the method further comprises the steps of estimating acceleration due to gravity from the measurements of the acceleration of the user; and subtracting the estimated acceleration due to gravity from the measurements of the acceleration of the user to give scaled measurements of the acceleration of the user; wherein the step of identifying the peak vertical acceleration of the user during the sit-to-stand transfer comprises identifying the peak vertical acceleration of the user from the scaled measurements of the acceleration.
- the estimate of gravity is obtained from the measurements of acceleration by averaging a plurality of the measurements of acceleration occurring in a time period before the start of the sit-to-stand transfer to give the estimate of gravity.
- the estimate of gravity is obtained from the measurements of acceleration in a time period before the start of the sit-to-stand transfer only if the standard deviation, variance or range of the plurality of measurements of acceleration occurring in the time period is less than a threshold value.
- the scaled peak vertical acceleration is normalized using the estimate of gravity, and the normalized scaled peak vertical acceleration is used to estimate the fall risk for the user.
- the measurements of the acceleration of the user are obtained using one or more accelerometers attached to or worn by the user.
- the measurements of the acceleration of the user are obtained using a force plate that measures the forces generated by the user during movement.
- the method comprises performing the step of identifying for a plurality of sit-to-stand transfers, and wherein the step of estimating the fall risk comprises determining the fall risk from an average of the peak vertical accelerations identified for the plurality of sit-to-stand transfers.
- the step of estimating the fall risk comprises determining the fall risk from the average of the peak vertical accelerations identified for the plurality of sit-to-stand transfers and an indication of the number of times that the user performed the sit-to-stand transfer in a specified time period.
- Some embodiments further comprise the step of comparing the estimated fall risk to one or more previously estimated fall risks to determine a fall risk trend for the user.
- the computer program product is further configured to cause the computer or processor to scale the identified peak vertical acceleration using an estimate of gravity obtained from the measurements of the acceleration of the user, and to use the scaled peak vertical acceleration to estimate the fall risk for the user.
- an apparatus for estimating a fall risk for a user according to claim 9.
- the processing unit is configured to scale the identified peak vertical acceleration using an estimate of gravity obtained from the measurements of the acceleration of the user and to use the scaled peak vertical acceleration to estimate the fall risk for the user.
- processing unit is further configured to execute any of the above-described method steps.
- a device that is configured to be worn by a user, the device comprising an accelerometer that measures the acceleration acting on the device in three dimensions; and an apparatus as described above, wherein the processing unit is configured to process the measurements of the acceleration from the accelerometer.
- a system that comprises a device that is configured to be worn by a user, the device comprising an accelerometer that measures the acceleration acting on the device in three-dimensions; and a base unit that is configured to communicate with the device, and that comprises an apparatus as described above, wherein the processing unit is configured to process the measurements of the acceleration from the accelerometer.
- a system that comprises a force plate; and a base unit that comprises an apparatus as described above, wherein the processing unit is configured to receive measurements of forces from the force plate and to process the measurements of forces to determine measurements of the acceleration.
- the graph in Figure 3 shows the vertical acceleration during a typical sit-to-stand motion (which has been scaled to exclude acceleration due to gravity).
- the user starts from rest (i.e. the measured acceleration in the vertical direction due to motion of the user is approximately 0) and the user begins to move at time t s .
- the acceleration measured at this time is denoted Acc vert_s .
- the user's hip leaves the means of support (i.e. chair) at time t ho ('ho' represents hip off), and the acceleration at this time is denoted Acc vert_ho .
- the acceleration in the vertical direction then increases to a peak (the peak reaction) denoted Acc vert_pr at time t pr .
- the peak reaction is followed by the lowest reaction which is a negative acceleration denoted Acc vert_lr occurring at time t lr .
- the end of the movement occurs at time t e , with the acceleration denoted Acc vert_e .
- step 101 it is determined whether the user has performed a sit-to-stand transfer. This step may be performed in a number of different ways, depending on the way in which the movements of the user are being monitored.
- step 101 may comprise receiving an indication (for example resulting from a button press) from a clinician who is observing the user while they perform the transfer or from the user when they perform a transfer, or it may comprise analyzing signals from an optical marker system or analyzing the forces measured by the force plate in order to determine if the user has performed a transfer.
- the user may be wearing or carrying a device that contains one or more movement sensors, such as an accelerometer, and the signals from this or these sensors can be processed to determine if the user has performed a transfer.
- movement sensors such as an accelerometer
- the method then proceeds to identify the peak vertical acceleration generated by the user in completing the sit-to-stand transfer (step 103).
- This peak vertical acceleration will correspond generally to the peak labeled "peak reaction” in Figure 3 , and is the largest upward acceleration that occurs during the sit-to-stand transfer.
- a signal representing the vertical acceleration can be determined from the force measurements by dividing the measured forces by the mass of the user.
- the acceleration in the vertical direction can be estimated from the signal from the three-dimensional accelerometer.
- the vertical acceleration can be estimated as the norm of the three-dimensional acceleration measurements.
- a portion of the vertical acceleration signal around the identified sit-to-stand transfer is selected for analysis (i.e. the portion between the identified start and end times of the sit-to-stand transfer), and the peak vertical acceleration identified as the largest maximum in the portion of the vertical acceleration signal corresponding to the sit-to-stand transfer.
- step 105 the peak vertical acceleration is used to estimate a fall risk for the user.
- the peak vertical acceleration value e.g. fall_risk ⁇ 1/peak_vertical_acceleration
- a fall risk may be generated in step 105 from an average of the peak vertical acceleration generated by the user over a plurality of sit-to-stand transfers.
- the average of the peak vertical acceleration may be obtained from a number of sit-to-stand transfers performed in a single monitoring session or from sit-to-stand transfers performed over a number of different days.
- the fall risk determined in step 105 can be compared to previously-determined fall risks to identify a trend in the performance of the sit-to-stand transfer by the user.
- a decrease in the peak vertical acceleration (or average peak vertical acceleration) indicates an increase in the fall risk of the user, and vice versa.
- the number of times that the user performs a sit-to-stand transfer in a given time period can also be recorded and used in conjunction with the peak vertical acceleration to provide the indication of fall risk.
- the peak vertical acceleration is less sensitive to the accurate detection of the start and end points of the sit-to-stand transfer, which makes it more robust and reliable for fall risk assessment than power.
- the estimation of peak vertical acceleration requires less computational effort than estimating the power (which involves integration of acceleration signals).
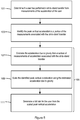
- FIG. 5 A method of determining a fall risk according to another embodiment is shown in Figure 5 .
- the first two steps are the same as in Figure 4 . That is, it is determined if a user has performed a sit-to-stand transfer (step 101) and if so, the peak vertical acceleration during the transfer is identified (step 103).
- step 107 an estimate of the acceleration due to gravity is estimated from the vertical acceleration signal, and in step 109 this estimate is used to scale the identified peak vertical acceleration to give a scaled peak vertical acceleration.
- the peak vertical acceleration is preferably scaled by subtracting the estimate of gravity from the peak vertical acceleration.
- the scaled peak vertical acceleration is then used to determine the fall risk for the user (step 111).
- the estimate of the gravitational acceleration is derived from the measurements of vertical acceleration from the sensor (e.g. accelerometer), the estimate will also be subject to the sensor calibration error, and scaling the peak vertical acceleration with this estimate will largely remove the calibration error.
- the sensor e.g. accelerometer
- steps 101, 103, 107 and 109 do not have to be performed in the order shown in Figure 5 .
- the estimate of gravity can be used to scale all of the vertical acceleration measurements, with the peak vertical acceleration being identified from the scaled vertical acceleration measurements.
- the estimate of acceleration due to gravity is derived in step 107 by taking the average (e.g.) mean value of the vertical acceleration over a plurality of vertical acceleration samples in a predetermined period prior to the indicated start of the sit-to-stand transfer.
- the predetermined period should generally correspond to a period of time in which the user is sitting on the chair, and therefore the vertical acceleration should be dominated by acceleration due to gravity.
- the predetermined period can be any suitable length, for example, 3 seconds.
- the vertical acceleration in the predetermined period likely results from gravity only by determining if the standard deviation of the vertical acceleration in the predetermined period is lower than a threshold.
- the threshold can be 0.1, but it will be appreciated that other values can be used. It will also be appreciated that measures other than the standard deviation can be used to determine if the vertical acceleration in the predetermined period likely result from gravity only, such as the variance of the vertical acceleration or the range. If it is lower than the threshold, the average of the vertical acceleration values can be determined and used as the estimate of acceleration due to gravity. In the example of Figure 3 , the average value of the vertical acceleration from sample index 100 to 250 (where the sit-to-stand transfer starts) is used as the estimate of acceleration due to gravity for scaling the peak vertical acceleration of the transfer.
- the acceleration measurements can be continuously or regularly monitored for the occurrence of a predetermined period as described above (i.e. where the standard deviation is below the threshold), and if such a period occurs, a new value for the estimate of gravitational acceleration can be determined using the samples in that period.
- Figure 6 illustrates an apparatus 2 for use in determining a fall risk for a user according to an embodiment of the invention.
- the invention provides an apparatus in the form of a sensor unit 2 that is to be worn by a user.
- the sensor unit 2 can be provided in the form of a pendant with a neck cord for placement around the user's neck.
- the sensor unit 2 can be configured to be worn at or on a different part of the user's body, such as the trunk, pelvis or sternum, and will comprise a suitable arrangement for attaching the sensor unit 2 to that part of the body (for example a belt or a strap if the unit 2 is attached to the pelvis or sternum).
- the sensor unit 2 is used to measure the movement of the user and can be used to process the measurements to determine when the user has executed a change in posture from a sitting posture to a standing posture and the peak vertical acceleration that occurs during this movement.
- the sensor unit 2 can also be used to determine the fall risk for the user 4 from the determined peak vertical acceleration.
- some or all of the processing of the measurements, determination of the peak vertical acceleration and the indication of the fall risk can be performed in a base unit that is separate to the sensor unit 2 worn by the user (not shown in Figure 6 ).
- the sensor unit 2 can transmit the movement measurements or information on the identified transfers to the base unit using a wired or wireless connection.
- the sensor unit 2 comprises an accelerometer 4 that measures acceleration along three orthogonal axes (and that outputs respective signals indicating the acceleration along each of the axes) and an optional sensor 6 that measures the altitude or height of the sensor unit 2 above the ground (or more particularly that measures changes in the altitude or height of the sensor unit 2 above the ground, or enables those changes to be measured).
- the sensor 6 for measuring the altitude or height of the sensor unit 2 can comprise, for example, an altimeter or air pressure sensor, although those skilled in the art will be aware of other types of sensors that can be used.
- the measurements from the accelerometer 4 can be processed to determine the height of the sensor unit 2 above the ground, or to determine the change in height of the sensor unit 2.
- the signals output by the accelerometer 4 and sensor 6 are provided to a processing unit 8 for analysis.
- the sensor unit 2 also comprises a memory 10 and optionally also a transmitter or transceiver circuitry 12.
- the memory 10 is used for storing measurements from the accelerometer 4 and sensor 6, and for storing the results of the analysis by the processor 8.
- the transmitter or transceiver circuitry 12 can be used for transmitting the measurements or the results of the analysis to a remote (base) unit or a computer where they can be viewed or studied by the user or a healthcare provider.
- the accelerometer 4 is a micro-electromechanical system (MEMS) accelerometer.
- MEMS micro-electromechanical system
- the acceleration experienced by the accelerometer 4 can be sampled at a rate of 50 Hz, although it will be appreciated that many other sampling frequencies can be used.
- sensor 6 is an air pressure sensor or altimeter
- the measurements of the height of the sensor unit 2 above the ground can be sampled at a frequency of around 1.8 Hz, although again it will be appreciated that other sampling frequencies can be used.
- the sensor 6 may output signals indicative of the height above the ground (or sea level in the case of an air pressure sensor), in which case the time series of height measurements can be analyzed by the processing unit 8 to determine the change in height from one measurement sample to the next (or over a predetermined number of measurement samples).
- the sensor 6 can directly output an indication of the change in height of the sensor unit 2 from the previous or an earlier specified measurement sample.
- the measurements collected by the accelerometer 4 and sensor 6 can be analyzed by the processing unit 8 in the sensor device 2 to determine when a user has performed a sit-to-stand transfer, the peak vertical acceleration experienced by the user when executing the sit-to-stand transfer, and a fall risk for the user from the peak vertical acceleration.
- the measurements from the accelerometer 4 and sensor 6 could be transmitted to a base unit via the transmitter/transceiver circuitry 12, with the base unit analyzing the measurements to determine the occurrence of sit-to-stand transfer.
- the processing can be performed in (near) real-time or the measurements from the accelerometer 4 and the sensor 6 can be stored in the memory 10 or the base unit for future processing (i.e. offline).
- the apparatus 2 may be configured to use or include a force plate to measure the vertical forces exerted by the user when performing the sit-to-stand transfer.
- the processing unit 8 can be configured to process the force plate measurements and determine the vertical acceleration of the user in the sit-to-stand transfer.
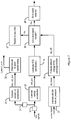
- Figure 7 shows an exemplary algorithm for detecting a sit-to-stand transfer and for determining the timing of the transfer.
- the algorithm takes as an input the three-dimensional acceleration signal measured by the accelerometer 4 (which comprises a separate signal for each of the three axes of the accelerometer 4) and an air pressure measurement from air pressure sensor 6.
- the initial part of the algorithm is a pre-processing stage in which the accelerometer and pressure sensor signals are processed for use in the subsequent analysis stages of the algorithm.
- the 3D acceleration signals from the accelerometer 4 are low-pass filtered (block 19) to remove noise which could affect the accuracy of the subsequent processing.
- a Butterworth low-pass filter with a cut-off frequency of 2 Hz is applied to the signals from each of the three axes of the accelerometer 4.
- filter characteristics such as a Chebyshev low-pass filter or other types of filter known to those skilled in the art. It will also be appreciated that the cut-off frequency of 2 Hz could be varied dependent on the particular characteristics of the noise from the accelerometer 4.
- the orientation of the sensor unit 2 relative to the fixed reference frame (such as the Earth) in which the user moves can change (particularly where the sensor unit 2 is in the form of a pendant), it is necessary to process the measurements from the accelerometer 4 to determine the vertical component of acceleration experienced by the sensor unit 2 (and therefore user) during the movement.
- the low-pass filtered 3D acceleration signals are input to block 20 that estimates the vertical acceleration.
- the vertical acceleration is denoted vert acc.
- the vertical component of acceleration is estimated from measurements of acceleration acting on an accelerometer, the accelerometer having an arbitrary orientation relative to the fixed reference frame, by (i) examining the signals from the accelerometer to identify the axis of the accelerometer having the highest component of acceleration, (ii) determining the orientation of the accelerometer by determining the angle between the acceleration acting on the accelerometer (this acceleration being assumed to be generally due to gravity) and the axis with the highest component of acceleration and (iii) using the estimated orientation of the accelerometer to determine the acceleration in the vertical direction from the measurements of acceleration.
- the sensor unit 2 can include a gyroscope for providing a signal indicating the orientation of the sensor unit 2, and this signal can be used to derive the vertical component of acceleration.
- Figure 8(a) shows an exemplary signal representing the vertical acceleration obtained from measurements by a sensor unit 2 of a user performing a sit-to-stand transfer, walking for 3 meters and then sitting back down, which was repeated three times. It can be seen in Figure 8(a) that there are three separate areas of activity represented in the signal.
- a high pass filter 21 is applied to each of the low-pass filtered 3D acceleration signals in order to remove the DC component.
- a Butterworth high-pass filter with a cut-off frequency of 0.5 Hz is used to remove the D.C. component in the acceleration signals.
- another filter for example a Chebyshev high-pass filter or other types of filter known to those skilled in the art could be used.
- a different cut-off frequency to 0.5 Hz could be chosen.
- the variation of the acceleration is estimated in block 22.
- the standard deviation of each of the three components of the 3D acceleration signal is computed for a time t over a window of predetermined length (for example, one second, although it will be appreciated that another appropriately sized window could be used) and the maximum standard deviation out of the three axes is identified.
- the maximum standard deviation at time t is denoted max_std_acc and is given by equation 1 below.
- Figure 8(d) shows the standard deviation calculated for each of the three axes of acceleration.
- line 40 corresponds to the x-axis accelerometer signal
- line 42 corresponds to the y-axis accelerometer signal
- line 44 corresponds to the z-axis accelerometer signal.
- a third pre-processing stage 23 estimates the altitude of the sensor unit 2 from the measurements from the air pressure sensor 6.
- the input to this stage 23 is the raw air pressure signal p t from the air pressure sensor 6.
- the air pressure can be sampled at a rate of 1.8 Hz (or in any case at a much lower sampling rate than the acceleration signals). Therefore, the air pressure signal p t is firstly upsampled to match the sampling rate (e.g. 50 Hz) of the acceleration signals (the upsampled pressure signal is denoted p t ').
- the altitude at time t (denoted alt_t) can then be estimated from the air pressure sensor measurements using equation 2 below :
- alt _ t 44330 ⁇ 1 ⁇ p t ′ / 101325 0.19
- Equation (2) is derived from the air pressure to altitude conversion function shown in equation (3):
- alt _ t T 0 L 1 ⁇ p p 0 RL gM
- Gravitational acceleration at Earth's surface 9.80665 ms -2 M Molar mass of dry air 0.0289644 kg mol -1 R Universal gas constant 8.31447 J mol -1 K -1
- the resulting altitude signal is then smoothed, preferably with a median filter having a predetermined length, for example of around 3 seconds.
- the filter is applied to the time series of estimated altitudes, resulting in a smoothed altitude signal alt_meas which is output from the altitude estimation stage 23, as shown in Figure 8(c) .
- the y-axis represents altitude in meters relative to sea level.
- processing stage 23 may be adapted or omitted as appropriate.
- the first stage 24 identifies the candidate movements in the vert acc signal.
- block 24 matches the vert acc signal to a predetermined pattern representing the vertical acceleration that is expected to occur during a sit-to-stand transfer.
- the first stage 24 of the feature extraction applies a matched filter having an impulse response that approximates the vertical acceleration experienced during a sit-to-stand transfer to the vertical acceleration signal (vert_acc) output from the vertical acceleration estimation block 20.
- the output of the matched filter is a set of coefficients that indicate the match of the measurements to the pattern. Each coefficient represents the match of a number of consecutive measurement samples (covering a time period of the same length as the predetermined pattern) to the predetermined pattern. The higher the coefficient, the better the match of the measurements to the pattern (and therefore the greater the chance that a sit-to-stand transfer has occurred).
- the filtered signal is denoted vert_acc matfilt and is shown in Figure 8(b) .
- the matched filter used in block 24 can be as shown in Figure 9 , which has been optimized to detect a sit-to-stand transfer.
- the matched filter shown in Figure 9 excludes gravity (9.8ms -2 )
- the first curve 50 shows a typical vertical acceleration pattern of a sit-to-stand transfer.
- the second curve 51 shows an applied matched filter characteristic that approximates the first curve 50. It will be appreciated that the matched filter characteristic may be expressed using many different functions, but in this implementation, the matched filter characteristic is given by equation 4 below.
- This characteristic is a combination of two sinc functions with scale parameters defined in p.
- p is a parameter vector with six elements: A 1 A 2 W 1 W 2 t 1 t 2
- Each entry in p defines a different scale parameter.
- a 1 and A 2 are amplitude scale parameters, which define the peak deviation of the two sinc waves respectively.
- the parameters W 1 and W 2 are frequency scale parameters, which define the frequency of the two sinc waves.
- the parameters t 1 and t 2 are phase scale parameters, which define the position of the sinc waves.
- the values of the six elements in the parameter vector p are set to tune the function of the matched filter to the sit-to-stand transfer characteristic 50 in Figure 7 .
- the values of the elements of the parameter vector p can be provided by many known curve-fitting methods.
- the desired parameters could be calculated by applying a nonlinear least-squares regression algorithm, however many other types of fitting algorithms are well known in the art and could be applied.
- the nonlinear least-squares regression algorithm generates different parameter combinations corresponding to different functions.
- the generated functions are then fitted to the data set of desired patterns according to a least-squared error criterion. When the function yields a minimum value of least square error among the combination of parameters, an optimized fit has been found.
- the filtered signal is processed to identify movements that may correspond to a sit-to-stand transfer by the user.
- the processing consists of firstly identifying any peak having a magnitude in a predetermined range in the vert_acc_matfilt signal.
- peaks whose magnitudes are in the range of 110 to 200 are identified.
- this part of the processing can alternatively comprise identifying any peak having a magnitude above a threshold value in the vert_acc_matfilt signal.
- the threshold can correspond to the lower bound for the predetermined range described above.
- this classification may result in a higher false positive identification rate than the range implementation described above.
- the algorithm For each identified peak, the algorithm attempts to identify respective local minima occurring within a predetermined time period before and after the identified peak in the vert_acc_matfilt signal. In the exemplary signal shown in Figure 8(b) , the algorithm looks for local minima within a period of 2 seconds before and after the identified peak. If no local minima are identified for a particular peak, that peak of the vert acc matfilt signal is not considered to correspond to a sit-to-stand transfer.
- a candidate movement corresponding to a sit-to-stand transfer is identified as a peak having the required local minima and at which the difference between the magnitude of the peak and the magnitude of the local minimum before the peak is less than a first threshold value, the difference between the magnitude of the peak and the local minimum after the peak is less than a second threshold value, and the magnitude of the local minimum after the peak is less than the magnitude of the local minimum before the peak.
- the magnitude requirements applied to the local minima can be relaxed, with the algorithm simply identifying the peak, the magnitude of the peak, and the presence of local minima before and after the peak.
- the first threshold is 25 and the second threshold is 200. It will be appreciated that the values chosen for the first and second thresholds are tuned to an experimental dataset, and different threshold values could be used.
- Candidate sit-to-stand transfers are identified as actual sit-to-stand transfers when they occur at the same time as a change in the height of the sensor unit 2 that is within a predetermined range.
- block 25 determines the change in height or altitude that has occurred during each candidate sit-to-stand transfer.
- block 25 receives a copy of the vert_acc_matfilt signal and indications of which parts of the signal correspond to candidate sit-to-stand transfers from the matched filtering block 24.
- Block 25 also receives the estimated altitude measurement signal, alt_meas, from estimation block 23.
- a candidate sit-to-stand transfer found in the output from the matched filter 24 consists of three key samples. These are the peak, the local minimum before the peak ( min_1 ), and the local minimum after the peak ( min_2 ). These samples are marked for one of the candidate sit-to-stand transfers in Figure 8(b) . In order to estimate the altitude change over the correct time period, it is necessary to identify the right samples in the altitude measurement signal.
- this threshold should be g 2 ; however in practice, different values might be provided by the training dataset due to slight inaccuracies in the accelerometer, for example. In one implementation, this threshold is 98.
- the altitude change of the candidate sit-to-stand transfer is then estimated as the difference between the altitudes at samples s1 and s2.
- the altitude change of the candidate sit-to-stand transfer can be estimated as the difference between the mean of the altitude measurement over a time window starting at the second local minimum, and the mean of the altitude measurement over a time window ending at the first local minimum.
- These time windows can be one second, although it will be appreciated that windows of other lengths can be used.
- the mean value of the altitude data one second before the start and one second after the candidate transfer is evaluated.
- a sit-to-stand transfer has occurred, a lower altitude should be observed before the transfer (when the user is in the sitting position) than the altitude observed after the transfer (when the user is in the standing position).
- the output of the candidate sit-to-stand transfer identification block 24 and the altitude change block 25 are provided to a decision block 26 which determines whether any of the candidates are sit-to-stand transfers.
- a change in altitude or height within a predetermined range is deemed to be a sit-to-stand transfer.
- the change in height should be an increase in height (by definition of a sit-to-stand transfer), and the predetermined range can be, for example, between 0.1 and 0.75 meters. In some cases the upper bound can be omitted at the expense of a greater false positive detection rate.
- step 103 of identifying the peak vertical acceleration makes use of estimated timing information of detected sit-to-stand transfers (for example estimated start and end times) for detected sit-to-stand transfers.
- a block 30 determines the timing of the sit-to-stand transfer and receives inputs from the block 22 which estimates the variation of the acceleration and the vertical acceleration profile after matched filtering, vert acc matfilt.
- s1 and s2 are used to identify the start and end of the sit-to-stand transfer for the purposes of identifying the peak vertical acceleration.
- the matched filter introduces a delay which is related to the number of filter taps. This delay causes the candidate sit-to-stand transfer to be delayed with respect to the actual onset of the sit-to-stand transfer in the vert_acc_matfilt signal. Therefore, in some implementations, the output of block 22 that estimates the variation in acceleration, max_std_acc can be used to determine the actual onset of a sit-to-stand transfer.
- the most adjacent sample in the signal max_std_acc before s1 whose value is smaller than a threshold is identified.
- This threshold determines where the onset of the actual sit-to-stand transfer (denoted t_start) is found.
- the threshold may be 0.35, but it will be understood that different threshold values smaller than 1 may be used, with the specific value being selected, in part, based on the size of the computing window being applied to the signal.
- the largest local minimum of the estimate of the vertical acceleration (vert_acc) between s1 and s2 (in other words, the lowest value of vert acc between s1 and s2) is found.
- the solid black bars in Figure 8(b) and corresponding circles in Figure 8(a) indicate t_start and t_end for each actual sit-to-stand transfer.
- the values for t_start and t_end for each detected sit-to-stand transfer are output by block 30 and used to determine the subset of samples that are analyzed to determine the peak vertical acceleration.
- a computer program may be stored/distributed on a suitable medium, such as an optical storage medium or a solid-state medium supplied together with or as part of other hardware, but may also be distributed in other forms, such as via the Internet or other wired or wireless telecommunication systems. Any reference signs in the claims should not be construed as limiting the scope.
Landscapes
- Health & Medical Sciences (AREA)
- Life Sciences & Earth Sciences (AREA)
- Engineering & Computer Science (AREA)
- Public Health (AREA)
- Medical Informatics (AREA)
- General Health & Medical Sciences (AREA)
- Biomedical Technology (AREA)
- Pathology (AREA)
- Molecular Biology (AREA)
- Veterinary Medicine (AREA)
- Heart & Thoracic Surgery (AREA)
- Physics & Mathematics (AREA)
- Biophysics (AREA)
- Surgery (AREA)
- Animal Behavior & Ethology (AREA)
- Physiology (AREA)
- Dentistry (AREA)
- Oral & Maxillofacial Surgery (AREA)
- Artificial Intelligence (AREA)
- Computer Vision & Pattern Recognition (AREA)
- Psychiatry (AREA)
- Signal Processing (AREA)
- Data Mining & Analysis (AREA)
- Databases & Information Systems (AREA)
- Epidemiology (AREA)
- Primary Health Care (AREA)
- Measurement Of The Respiration, Hearing Ability, Form, And Blood Characteristics Of Living Organisms (AREA)
Description
- The invention relates to a method and apparatus that estimates the fall risk of a user based on an analysis of a sit-to-stand transfer movement by the user.
- Falls are one of the greatest health risk factors for elderly people. About one third of older people above the age of 65 fall at least once a year.
- Many of these falls could be avoided by early identification of fall risk and the application of effective and targeted fall prevention programs.
- Fall prevention trials based on strength and balance training (SBT) have shown that the risk of falling for elderly people can be reduced. Balance performance measures can be used as early indicators of fall risk, and also to measure the progress of fall prevention programs. The 'sit-to-stand' (STS) transfer has been identified as one important movement which can be used as a balance performance measure and thus a measure of fall risk. In daily life, a person performs the STS transfer many times a day.
- Conventionally, clinical measurement systems (such as those including a force plate and an optical marker system) are used to provide an accurate quantification of power during a sit-to-stand transfer. In these measurement systems, the force plate provides the vertical ground reaction force and the optical marker system provides a measure of displacement in three dimensions. The combination of both measurements is used to quantify the power during a sit-to-stand transfer.
- These measurement systems have several drawbacks. Firstly, they are clinical equipment, which requires the user to attend a clinic. Preparing for and performing measurements is labor intensive (particularly if optical markers need to be attached to specific parts of the body). In addition, they only provide a snapshot of the user's balance performance, where, owing to the clinical setting, the user commonly performs above their average capability. Finally, the measurement systems involve a procedure which is quite cumbersome for the user.
- Fall risk assessment in the home environment is usually carried out by a telephone interview or by self-reporting from the user themselves, but these assessments are not particularly reliable.
- However, recent advances in on-body sensors have improved home-based fall risk assessment application/tools. The power of sit-to-stand transfers can be derived using an on-body sensing platform that includes accelerometers. One such system is described in
WO 2010/035187 . - Experiments have shown that the power exercised during a STS as measured with an accelerometer correlates with that measured using a force plate in the standard clinical assessment. However, a disadvantage of that method is that it requires a good delineation of the start and end times of the STS transfer, since these times affect the outcome of the computation. In particular the start time will affect the maximal power that is identified, since it has an effect on the integration that has to be applied to the accelerometer signal in order to derive power.
- In a clinical or laboratory setting, this problem is less critical, since the start and end times can be determined through observation of the user as they perform the STS. Analysis of the signal can be performed with assistance from these observations. Also, the acceleration signal around the STS transfer is less noisy as it would be in a daily life situation. This also helps the delineation as well as reducing the influence of errors in the delineation. Outside of the clinical setting (e.g. in daily life), this observation is absent, and delineation is a problem. In addition, the acceleration signal will be more noisy. It is possible for the user to manually indicate the start and/or end of the transfer, for example by pressing a button at the onset or end of the STS, but this means that the system is not unobtrusive.
- Some other background information can be found in
US 8,206,325 , the paper "A body-fixed-sensor-based analysis of power during sit-to-stand movements" by Zijlstra, Wiebren et al.,WO 02/28282 - Therefore, there is a need for an improved method and apparatus for estimating a fall risk through the analysis of a sit-to-stand transfer.
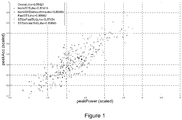
- It has been found that there is a high linear correlation between the peak vertical acceleration that occurs during a sit-to-stand transfer and the peak power generated by the user during the transfer. This correlation is shown in
Figure 1 which plots the peak power during a sit-to-stand transfer against the peak vertical acceleration for several variations of the sit-to-stand movement for a number of different users. In this figure, both the acceleration and power have been scaled and normalized with respect to gravity. The variations of the sit-to-stand transfer include a normal speed transfer (NormSTS), a normal speed transfer in which the user does not use their arms (NormSTSwithoutArms), a faster transfer (FastSTS), and transfers that occur as part of a fast and normal speed timed-up-and-go (TUG) test, where the user has to stand up, walk and return to the sitting position (labeled STSinFastTUG and STSinNormTUG respectively). - The graphs in
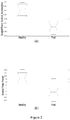
Figure 2 illustrate that peak vertical acceleration exhibits the same sensitivity to fall risk as peak power. In particular, the left hand side ofFigure 2(a) shows an analysis of the variance of the peak vertical acceleration values (scaled for gravity) that are found for healthy (i.e. low fall risk) users, and the right hand side shows an analysis of the variance of the peak vertical acceleration values (scaled for gravity) that are found for frail (i.e. high fall risk) users.Figure 2(b) shows the corresponding analysis of variance for peak power, and thus it can be seen that peak vertical acceleration during a sit-to-stand transfer provides similar information on the fall risk of the user as peak power. - Thus, the invention exploits the finding that the peak vertical acceleration during a sit-to-stand transfer provides a useful measure of the fall risk of the user. In particular, according to a first aspect of the invention, there is provided a method of estimating the fall risk of a user according to
claim 1. - The identified peak vertical acceleration is scaled using an estimate of gravity obtained from the measurements of the acceleration of the user and the scaled peak vertical acceleration is used to estimate the fall risk for the user. Calibration errors in the sensor measurements can introduce errors into the peak vertical acceleration and thus the assessment of fall risk. Therefore, scaling the peak vertical acceleration in this way means that the calibration errors can be removed from the sensor measurements.
- In a preferred embodiment, the method further comprises the steps of estimating acceleration due to gravity from the measurements of the acceleration of the user; and subtracting the estimated acceleration due to gravity from the identified peak vertical acceleration to give a scaled peak vertical acceleration.
- In an alternative embodiment, the method further comprises the steps of estimating acceleration due to gravity from the measurements of the acceleration of the user; and subtracting the estimated acceleration due to gravity from the measurements of the acceleration of the user to give scaled measurements of the acceleration of the user; wherein the step of identifying the peak vertical acceleration of the user during the sit-to-stand transfer comprises identifying the peak vertical acceleration of the user from the scaled measurements of the acceleration.
- Preferably, the estimate of gravity is obtained from the measurements of acceleration by averaging a plurality of the measurements of acceleration occurring in a time period before the start of the sit-to-stand transfer to give the estimate of gravity.
- The estimate of gravity is obtained from the measurements of acceleration in a time period before the start of the sit-to-stand transfer only if the standard deviation, variance or range of the plurality of measurements of acceleration occurring in the time period is less than a threshold value.
- In some embodiments, the scaled peak vertical acceleration is normalized using the estimate of gravity, and the normalized scaled peak vertical acceleration is used to estimate the fall risk for the user.
- In preferred implementations, the measurements of the acceleration of the user are obtained using one or more accelerometers attached to or worn by the user.
- In alternative implementations, the measurements of the acceleration of the user are obtained using a force plate that measures the forces generated by the user during movement.
- In some embodiments, the method comprises performing the step of identifying for a plurality of sit-to-stand transfers, and wherein the step of estimating the fall risk comprises determining the fall risk from an average of the peak vertical accelerations identified for the plurality of sit-to-stand transfers.
- In some embodiments, the step of estimating the fall risk comprises determining the fall risk from the average of the peak vertical accelerations identified for the plurality of sit-to-stand transfers and an indication of the number of times that the user performed the sit-to-stand transfer in a specified time period.
- Some embodiments further comprise the step of comparing the estimated fall risk to one or more previously estimated fall risks to determine a fall risk trend for the user.
- According to a second aspect of the invention, there is provided a computer program product according to
claim 8. - The computer program product is further configured to cause the computer or processor to scale the identified peak vertical acceleration using an estimate of gravity obtained from the measurements of the acceleration of the user, and to use the scaled peak vertical acceleration to estimate the fall risk for the user.
- Various other embodiments of the computer program product are also contemplated in which the computer program code is further configured to cause a computer or processor to perform any of the above-described methods.
- According to a third aspect of the invention, there is provided an apparatus for estimating a fall risk for a user according to claim 9.
- The processing unit is configured to scale the identified peak vertical acceleration using an estimate of gravity obtained from the measurements of the acceleration of the user and to use the scaled peak vertical acceleration to estimate the fall risk for the user.
- Various other embodiments of the apparatus are also contemplated in which the processing unit is further configured to execute any of the above-described method steps.
- According to a fourth aspect of the invention, there is provided a device that is configured to be worn by a user, the device comprising an accelerometer that measures the acceleration acting on the device in three dimensions; and an apparatus as described above, wherein the processing unit is configured to process the measurements of the acceleration from the accelerometer.
- According to a fifth aspect of the invention, there is provided a system that comprises a device that is configured to be worn by a user, the device comprising an accelerometer that measures the acceleration acting on the device in three-dimensions; and a base unit that is configured to communicate with the device, and that comprises an apparatus as described above, wherein the processing unit is configured to process the measurements of the acceleration from the accelerometer.
- According to a sixth aspect of the invention, there is provided a system that comprises a force plate; and a base unit that comprises an apparatus as described above, wherein the processing unit is configured to receive measurements of forces from the force plate and to process the measurements of forces to determine measurements of the acceleration.
- The invention is defined by
independent claims - For a better understanding of the invention, and to show more clearly how it may be carried into effect, reference will now be made, by way of example only, to the accompanying drawings, in which:
-
Fig. 1 is graph illustrating the correlation between peak vertical acceleration and peak power in a sit-to-stand transfer; -
Fig. 2 illustrates the sensitivity of peak vertical acceleration and peak power to fall risk; -
Fig. 3 is a graph illustrating an example of the variation in vertical acceleration during a sit-to-stand transfer; -
Fig. 4 is a flow chart illustrating a method of determining a fall risk according to an embodiment; -
Fig. 5 is a flow chart illustrating a method of determining a fall risk according to an another embodiment; -
Fig. 6 is a block diagram of an apparatus according to an embodiment of the invention; -
Fig. 7 is a block diagram illustrating an algorithm for detecting a sit-to-stand transfer in measurements of the vertical acceleration of the user; -
Fig. 8 shows the input signals to the algorithm and the signals obtained during some of the processing steps; and -
Fig. 9 illustrates an exemplary matched filter which has been optimized for use in detecting a sit-to-stand transfer. - The graph in
Figure 3 shows the vertical acceleration during a typical sit-to-stand motion (which has been scaled to exclude acceleration due to gravity). The user starts from rest (i.e. the measured acceleration in the vertical direction due to motion of the user is approximately 0) and the user begins to move at time ts. The acceleration measured at this time is denoted Accvert_s. There is typically a small minimum in the acceleration profile just after the user starts to move and before they rise off their chair. Subsequently, the user's hip leaves the means of support (i.e. chair) at time tho ('ho' represents hip off), and the acceleration at this time is denoted Accvert_ho. The acceleration in the vertical direction then increases to a peak (the peak reaction) denoted Accvert_pr at time tpr. The peak reaction is followed by the lowest reaction which is a negative acceleration denoted Accvert_lr occurring at time tlr. The end of the movement occurs at time te, with the acceleration denoted Accvert_e. - The flow chart in
Figure 4 illustrates a method of determining a fall risk for a user according to an embodiment. Instep 101, it is determined whether the user has performed a sit-to-stand transfer. This step may be performed in a number of different ways, depending on the way in which the movements of the user are being monitored. - In some embodiments, the user may be performing a sit-to-stand transfer while located on a force plate that measures the forces generated by the user as they execute the transfer. In this case, step 101 may comprise receiving an indication (for example resulting from a button press) from a clinician who is observing the user while they perform the transfer or from the user when they perform a transfer, or it may comprise analyzing signals from an optical marker system or analyzing the forces measured by the force plate in order to determine if the user has performed a transfer.
- In other embodiments, the user may be wearing or carrying a device that contains one or more movement sensors, such as an accelerometer, and the signals from this or these sensors can be processed to determine if the user has performed a transfer. In these embodiments, it may also be possible for the user to manually provide an indication that they have started and/or completed a transfer (for example by pressing a button on the device).
- If it is determined that the user has performed a sit-to-stand transfer, the method then proceeds to identify the peak vertical acceleration generated by the user in completing the sit-to-stand transfer (step 103). This peak vertical acceleration will correspond generally to the peak labeled "peak reaction" in
Figure 3 , and is the largest upward acceleration that occurs during the sit-to-stand transfer. - Where the movements of the user are being monitored using a force plate, a signal representing the vertical acceleration can be determined from the force measurements by dividing the measured forces by the mass of the user. Otherwise, where the movements of the user are monitored using an accelerometer, the acceleration in the vertical direction can be estimated from the signal from the three-dimensional accelerometer. In some embodiments, the vertical acceleration can be estimated as the norm of the three-dimensional acceleration measurements.
- Thus, following the determination in
step 101 that a sit-to-stand transfer has occurred (the determination also providing an indication of the time at which the transfer occurred, for example in terms of the start and end times of the transfer), a portion of the vertical acceleration signal around the identified sit-to-stand transfer is selected for analysis (i.e. the portion between the identified start and end times of the sit-to-stand transfer), and the peak vertical acceleration identified as the largest maximum in the portion of the vertical acceleration signal corresponding to the sit-to-stand transfer. - Once the peak vertical acceleration has been determined in
step 103, the method proceeds to step 105 in which the peak vertical acceleration is used to estimate a fall risk for the user. In general, as shown inFigure 2(a) , those at a higher risk of falling produce lower peak vertical acceleration values than those at a lower risk of falling. Thus, in some embodiments, the fall risk can be inversely proportional to the peak vertical acceleration value (e.g. fall_risk α 1/peak_vertical_acceleration) - In some embodiments, a fall risk may be generated in
step 105 from an average of the peak vertical acceleration generated by the user over a plurality of sit-to-stand transfers. The average of the peak vertical acceleration may be obtained from a number of sit-to-stand transfers performed in a single monitoring session or from sit-to-stand transfers performed over a number of different days. - In some embodiments, the fall risk determined in
step 105 can be compared to previously-determined fall risks to identify a trend in the performance of the sit-to-stand transfer by the user. Thus, a decrease in the peak vertical acceleration (or average peak vertical acceleration) indicates an increase in the fall risk of the user, and vice versa. - In some embodiments, the number of times that the user performs a sit-to-stand transfer in a given time period (for example a day) can also be recorded and used in conjunction with the peak vertical acceleration to provide the indication of fall risk.
- Using the peak vertical acceleration as the parameter for estimating fall risk has a number of advantages over the use of power or peak power. Firstly, the peak vertical acceleration is less sensitive to the accurate detection of the start and end points of the sit-to-stand transfer, which makes it more robust and reliable for fall risk assessment than power. In addition, the estimation of peak vertical acceleration requires less computational effort than estimating the power (which involves integration of acceleration signals). These advantages make the monitoring of peak vertical acceleration suitable for implementing long-term fall risk monitoring applications, for example using on-body sensors.
- A method of determining a fall risk according to another embodiment is shown in
Figure 5 . In this method, the first two steps are the same as inFigure 4 . That is, it is determined if a user has performed a sit-to-stand transfer (step 101) and if so, the peak vertical acceleration during the transfer is identified (step 103). - In this embodiment, it is recognized that, particularly (but not exclusively) for on-body-sensor-based implementations of the invention, calibration errors in the sensor measurements can introduce errors into the assessment of fall risk.
- Therefore, these calibration errors are accounted for by scaling the peak vertical acceleration using an estimate of gravitational acceleration that is derived from the measurements of vertical acceleration around the time that the sit-to-stand transfer is performed.
- In particular, in
step 107, an estimate of the acceleration due to gravity is estimated from the vertical acceleration signal, and instep 109 this estimate is used to scale the identified peak vertical acceleration to give a scaled peak vertical acceleration. The peak vertical acceleration is preferably scaled by subtracting the estimate of gravity from the peak vertical acceleration. The scaled peak vertical acceleration is then used to determine the fall risk for the user (step 111). - As the estimate of the gravitational acceleration is derived from the measurements of vertical acceleration from the sensor (e.g. accelerometer), the estimate will also be subject to the sensor calibration error, and scaling the peak vertical acceleration with this estimate will largely remove the calibration error.
- It will be appreciated that
steps Figure 5 . For example, it is possible to determine and periodically update an estimate of the acceleration due to gravity for use when a sit-to-stand transfer is subsequently detected, and then apply this to a peak vertical acceleration when this is identified instep 103. Alternatively, the estimate of gravity can be used to scale all of the vertical acceleration measurements, with the peak vertical acceleration being identified from the scaled vertical acceleration measurements. - In some embodiments, the estimate of acceleration due to gravity is derived in
step 107 by taking the average (e.g.) mean value of the vertical acceleration over a plurality of vertical acceleration samples in a predetermined period prior to the indicated start of the sit-to-stand transfer. The predetermined period should generally correspond to a period of time in which the user is sitting on the chair, and therefore the vertical acceleration should be dominated by acceleration due to gravity. The predetermined period can be any suitable length, for example, 3 seconds. - According to the invention , it can be confirmed that the vertical acceleration in the predetermined period likely results from gravity only by determining if the standard deviation of the vertical acceleration in the predetermined period is lower than a threshold. In some embodiments, the threshold can be 0.1, but it will be appreciated that other values can be used. It will also be appreciated that measures other than the standard deviation can be used to determine if the vertical acceleration in the predetermined period likely result from gravity only, such as the variance of the vertical acceleration or the range. If it is lower than the threshold, the average of the vertical acceleration values can be determined and used as the estimate of acceleration due to gravity. In the example of
Figure 3 , the average value of the vertical acceleration fromsample index 100 to 250 (where the sit-to-stand transfer starts) is used as the estimate of acceleration due to gravity for scaling the peak vertical acceleration of the transfer. - In embodiments where an estimate of the acceleration due to gravity is determined and periodically updated, the acceleration measurements can be continuously or regularly monitored for the occurrence of a predetermined period as described above (i.e. where the standard deviation is below the threshold), and if such a period occurs, a new value for the estimate of gravitational acceleration can be determined using the samples in that period.
-
Figure 6 illustrates anapparatus 2 for use in determining a fall risk for a user according to an embodiment of the invention. In this embodiment, the invention provides an apparatus in the form of asensor unit 2 that is to be worn by a user. Thesensor unit 2 can be provided in the form of a pendant with a neck cord for placement around the user's neck. Alternatively, thesensor unit 2 can be configured to be worn at or on a different part of the user's body, such as the trunk, pelvis or sternum, and will comprise a suitable arrangement for attaching thesensor unit 2 to that part of the body (for example a belt or a strap if theunit 2 is attached to the pelvis or sternum). - The
sensor unit 2 is used to measure the movement of the user and can be used to process the measurements to determine when the user has executed a change in posture from a sitting posture to a standing posture and the peak vertical acceleration that occurs during this movement. Thesensor unit 2 can also be used to determine the fall risk for theuser 4 from the determined peak vertical acceleration. - In alternative implementations, some or all of the processing of the measurements, determination of the peak vertical acceleration and the indication of the fall risk can be performed in a base unit that is separate to the
sensor unit 2 worn by the user (not shown inFigure 6 ). In this case, thesensor unit 2 can transmit the movement measurements or information on the identified transfers to the base unit using a wired or wireless connection. - In the illustrated embodiment, the
sensor unit 2 comprises anaccelerometer 4 that measures acceleration along three orthogonal axes (and that outputs respective signals indicating the acceleration along each of the axes) and anoptional sensor 6 that measures the altitude or height of thesensor unit 2 above the ground (or more particularly that measures changes in the altitude or height of thesensor unit 2 above the ground, or enables those changes to be measured). Thesensor 6 for measuring the altitude or height of thesensor unit 2 can comprise, for example, an altimeter or air pressure sensor, although those skilled in the art will be aware of other types of sensors that can be used. In some embodiments, the measurements from theaccelerometer 4 can be processed to determine the height of thesensor unit 2 above the ground, or to determine the change in height of thesensor unit 2. The signals output by theaccelerometer 4 and sensor 6 (where present) are provided to aprocessing unit 8 for analysis. - The
sensor unit 2 also comprises amemory 10 and optionally also a transmitter ortransceiver circuitry 12. Thememory 10 is used for storing measurements from theaccelerometer 4 andsensor 6, and for storing the results of the analysis by theprocessor 8. The transmitter ortransceiver circuitry 12 can be used for transmitting the measurements or the results of the analysis to a remote (base) unit or a computer where they can be viewed or studied by the user or a healthcare provider. - In some embodiments, the
accelerometer 4 is a micro-electromechanical system (MEMS) accelerometer. The acceleration experienced by theaccelerometer 4 can be sampled at a rate of 50 Hz, although it will be appreciated that many other sampling frequencies can be used. Wheresensor 6 is an air pressure sensor or altimeter, the measurements of the height of thesensor unit 2 above the ground can be sampled at a frequency of around 1.8 Hz, although again it will be appreciated that other sampling frequencies can be used. - Depending on the particular type of sensor used for the
sensor 6 for measuring height, thesensor 6 may output signals indicative of the height above the ground (or sea level in the case of an air pressure sensor), in which case the time series of height measurements can be analyzed by theprocessing unit 8 to determine the change in height from one measurement sample to the next (or over a predetermined number of measurement samples). Alternatively, thesensor 6 can directly output an indication of the change in height of thesensor unit 2 from the previous or an earlier specified measurement sample. - As noted above, in some embodiments, the measurements collected by the
accelerometer 4 andsensor 6 can be analyzed by theprocessing unit 8 in thesensor device 2 to determine when a user has performed a sit-to-stand transfer, the peak vertical acceleration experienced by the user when executing the sit-to-stand transfer, and a fall risk for the user from the peak vertical acceleration. Alternatively, the measurements from theaccelerometer 4 andsensor 6 could be transmitted to a base unit via the transmitter/transceiver circuitry 12, with the base unit analyzing the measurements to determine the occurrence of sit-to-stand transfer. In either case, the processing can be performed in (near) real-time or the measurements from theaccelerometer 4 and thesensor 6 can be stored in thememory 10 or the base unit for future processing (i.e. offline). - It will be appreciated that in alternative implementations of the invention, rather than being provided in the form of an on-body device that comprises an
accelerometer 4 andsensor 6, theapparatus 2 may be configured to use or include a force plate to measure the vertical forces exerted by the user when performing the sit-to-stand transfer. In that case, theprocessing unit 8 can be configured to process the force plate measurements and determine the vertical acceleration of the user in the sit-to-stand transfer. - Detection of a sit-to-stand transfer in measurements of acceleration An exemplary algorithm for processing accelerometer measurements to detect a sit-to-stand transfer is described below with reference to
Figures 7 ,8 and 9 . This technique has been described in International patent application no.PCT/IB2012/053083 which was filed on 19 June 2012 -
Figure 7 shows an exemplary algorithm for detecting a sit-to-stand transfer and for determining the timing of the transfer. The algorithm takes as an input the three-dimensional acceleration signal measured by the accelerometer 4 (which comprises a separate signal for each of the three axes of the accelerometer 4) and an air pressure measurement fromair pressure sensor 6. - The initial part of the algorithm, represented by
blocks accelerometer 4 are low-pass filtered (block 19) to remove noise which could affect the accuracy of the subsequent processing. In one embodiment, a Butterworth low-pass filter with a cut-off frequency of 2 Hz is applied to the signals from each of the three axes of theaccelerometer 4. Alternatively, it would be possible to apply different filter characteristics such as a Chebyshev low-pass filter or other types of filter known to those skilled in the art. It will also be appreciated that the cut-off frequency of 2 Hz could be varied dependent on the particular characteristics of the noise from theaccelerometer 4. - As the orientation of the
sensor unit 2 relative to the fixed reference frame (such as the Earth) in which the user moves can change (particularly where thesensor unit 2 is in the form of a pendant), it is necessary to process the measurements from theaccelerometer 4 to determine the vertical component of acceleration experienced by the sensor unit 2 (and therefore user) during the movement. - Therefore, the low-pass filtered 3D acceleration signals are input to block 20 that estimates the vertical acceleration. The vertical acceleration is denoted vert acc.
- One technique for estimating the vertical component of acceleration from a 3D accelerometer signal having an arbitrary orientation is described in
WO 2010/035191 . Briefly, according to that technique, the vertical component of acceleration is estimated from measurements of acceleration acting on an accelerometer, the accelerometer having an arbitrary orientation relative to the fixed reference frame, by (i) examining the signals from the accelerometer to identify the axis of the accelerometer having the highest component of acceleration, (ii) determining the orientation of the accelerometer by determining the angle between the acceleration acting on the accelerometer (this acceleration being assumed to be generally due to gravity) and the axis with the highest component of acceleration and (iii) using the estimated orientation of the accelerometer to determine the acceleration in the vertical direction from the measurements of acceleration. - Those skilled in the art will be aware of other techniques for estimating the vertical component of acceleration from the measurements from a 3D accelerometer. For example, the
sensor unit 2 can include a gyroscope for providing a signal indicating the orientation of thesensor unit 2, and this signal can be used to derive the vertical component of acceleration. -
Figure 8(a) shows an exemplary signal representing the vertical acceleration obtained from measurements by asensor unit 2 of a user performing a sit-to-stand transfer, walking for 3 meters and then sitting back down, which was repeated three times. It can be seen inFigure 8(a) that there are three separate areas of activity represented in the signal. - Another stage of the pre-processing concerns the calculation of an estimate of the variation of acceleration. Firstly, a
high pass filter 21 is applied to each of the low-pass filtered 3D acceleration signals in order to remove the DC component. In one embodiment, a Butterworth high-pass filter with a cut-off frequency of 0.5 Hz is used to remove the D.C. component in the acceleration signals. It will be appreciated that another filter , for example a Chebyshev high-pass filter or other types of filter known to those skilled in the art could be used. It will also be appreciated that a different cut-off frequency to 0.5 Hz could be chosen. - After high-pass filtering, the variation of the acceleration is estimated in
block 22. In a preferred embodiment, the standard deviation of each of the three components of the 3D acceleration signal is computed for a time t over a window of predetermined length (for example, one second, although it will be appreciated that another appropriately sized window could be used) and the maximum standard deviation out of the three axes is identified. The maximum standard deviation at time t is denoted max_std_acc and is given byequation 1 below.
-
Figure 8(d) shows the standard deviation calculated for each of the three axes of acceleration. InFigure 8(d) ,line 40 corresponds to the x-axis accelerometer signal,line 42 corresponds to the y-axis accelerometer signal, andline 44 corresponds to the z-axis accelerometer signal. - A
third pre-processing stage 23 estimates the altitude of thesensor unit 2 from the measurements from theair pressure sensor 6. As indicated above, the input to thisstage 23 is the raw air pressure signal pt from theair pressure sensor 6. As mentioned previously, the air pressure can be sampled at a rate of 1.8 Hz (or in any case at a much lower sampling rate than the acceleration signals). Therefore, the air pressure signal pt is firstly upsampled to match the sampling rate (e.g. 50 Hz) of the acceleration signals (the upsampled pressure signal is denoted pt'). The altitude at time t (denoted alt_t) can then be estimated from the air pressure sensormeasurements using equation 2 below :

Symbol Quantity Typical Value alt_t Altitude in meters p Air pressure p 0 Standard atmospheric pressure at sea level 101325 kPa L Temperature lapse rate 0.0065 Km-1 T 0 Standard temperature at sea level 288.15 K g Gravitational acceleration at Earth's surface 9.80665 ms-2 M Molar mass of dry air 0.0289644 kg mol-1 R Universal gas constant 8.31447 J mol-1 K-1 - The resulting altitude signal is then smoothed, preferably with a median filter having a predetermined length, for example of around 3 seconds. The filter is applied to the time series of estimated altitudes, resulting in a smoothed altitude signal alt_meas which is output from the
altitude estimation stage 23, as shown inFigure 8(c) . InFigure 8(c) , the y-axis represents altitude in meters relative to sea level. - It will be appreciated that in alternative embodiments of the invention where a different type of altitude, height or change in height sensor is used, processing
stage 23 may be adapted or omitted as appropriate. - Following the pre-processing of the input signals, various features are extracted in order to determine if a sit-to-stand transfer has occurred, and if so, the power of the user in performing the sit-to-stand transfer.
- Two main stages of feature extraction are required in order to determine if a sit-to-stand transfer has occurred. The
first stage 24 identifies the candidate movements in the vert acc signal. In particular, block 24 matches the vert acc signal to a predetermined pattern representing the vertical acceleration that is expected to occur during a sit-to-stand transfer. - In some implementations, the
first stage 24 of the feature extraction applies a matched filter having an impulse response that approximates the vertical acceleration experienced during a sit-to-stand transfer to the vertical acceleration signal (vert_acc) output from the verticalacceleration estimation block 20. The output of the matched filter is a set of coefficients that indicate the match of the measurements to the pattern. Each coefficient represents the match of a number of consecutive measurement samples (covering a time period of the same length as the predetermined pattern) to the predetermined pattern. The higher the coefficient, the better the match of the measurements to the pattern (and therefore the greater the chance that a sit-to-stand transfer has occurred). The filtered signal is denoted vert_acc matfilt and is shown inFigure 8(b) . - In some implementations, the matched filter used in
block 24 can be as shown inFigure 9 , which has been optimized to detect a sit-to-stand transfer. The matched filter shown inFigure 9 excludes gravity (9.8ms-2) Thefirst curve 50 shows a typical vertical acceleration pattern of a sit-to-stand transfer. Thesecond curve 51 shows an applied matched filter characteristic that approximates thefirst curve 50. It will be appreciated that the matched filter characteristic may be expressed using many different functions, but in this implementation, the matched filter characteristic is given byequation 4 below.
- This characteristic is a combination of two sinc functions with scale parameters defined in p. p is a parameter vector with six elements:

- Each entry in p defines a different scale parameter. A1 and A2 are amplitude scale parameters, which define the peak deviation of the two sinc waves respectively. The parameters W1 and W2 are frequency scale parameters, which define the frequency of the two sinc waves. The parameters t1 and t2 are phase scale parameters, which define the position of the sinc waves. The values of the six elements in the parameter vector p are set to tune the function of the matched filter to the sit-to-stand transfer characteristic 50 in
Figure 7 . - It will be appreciated that the values of the elements of the parameter vector p can be provided by many known curve-fitting methods. In one case, the desired parameters could be calculated by applying a nonlinear least-squares regression algorithm, however many other types of fitting algorithms are well known in the art and could be applied. The nonlinear least-squares regression algorithm generates different parameter combinations corresponding to different functions. The generated functions are then fitted to the data set of desired patterns according to a least-squared error criterion. When the function yields a minimum value of least square error among the combination of parameters, an optimized fit has been found.
- After matched filtering, the filtered signal is processed to identify movements that may correspond to a sit-to-stand transfer by the user. The processing consists of firstly identifying any peak having a magnitude in a predetermined range in the vert_acc_matfilt signal. In the exemplary signal shown in
Figure 8(d) , peaks whose magnitudes are in the range of 110 to 200 are identified. It will be appreciated that this part of the processing can alternatively comprise identifying any peak having a magnitude above a threshold value in the vert_acc_matfilt signal. In this case, the threshold can correspond to the lower bound for the predetermined range described above. However, this classification may result in a higher false positive identification rate than the range implementation described above. - For each identified peak, the algorithm attempts to identify respective local minima occurring within a predetermined time period before and after the identified peak in the vert_acc_matfilt signal. In the exemplary signal shown in
Figure 8(b) , the algorithm looks for local minima within a period of 2 seconds before and after the identified peak. If no local minima are identified for a particular peak, that peak of the vert acc matfilt signal is not considered to correspond to a sit-to-stand transfer. - Finally, a candidate movement corresponding to a sit-to-stand transfer is identified as a peak having the required local minima and at which the difference between the magnitude of the peak and the magnitude of the local minimum before the peak is less than a first threshold value, the difference between the magnitude of the peak and the local minimum after the peak is less than a second threshold value, and the magnitude of the local minimum after the peak is less than the magnitude of the local minimum before the peak.
- In simplified implementations, the magnitude requirements applied to the local minima can be relaxed, with the algorithm simply identifying the peak, the magnitude of the peak, and the presence of local minima before and after the peak.
- In the exemplary signal shown in
Figure 8(b) , the first threshold is 25 and the second threshold is 200. It will be appreciated that the values chosen for the first and second thresholds are tuned to an experimental dataset, and different threshold values could be used. - It can be seen in
Figure 8(b) that four possible movements have been highlighted as candidate sit-to-stand transfers, occurring roughly at times 1.65, 1.69, 1.78 and 1.87. - Candidate sit-to-stand transfers are identified as actual sit-to-stand transfers when they occur at the same time as a change in the height of the
sensor unit 2 that is within a predetermined range. Thus, block 25 determines the change in height or altitude that has occurred during each candidate sit-to-stand transfer. In order forblock 25 to evaluate the altitude change of a candidate sit-to-stand transfer identified in the matchedfiltering block 24, block 25 receives a copy of the vert_acc_matfilt signal and indications of which parts of the signal correspond to candidate sit-to-stand transfers from the matchedfiltering block 24.Block 25 also receives the estimated altitude measurement signal, alt_meas, fromestimation block 23. - A candidate sit-to-stand transfer found in the output from the matched
filter 24 consists of three key samples. These are the peak, the local minimum before the peak (min_1), and the local minimum after the peak (min_2). These samples are marked for one of the candidate sit-to-stand transfers inFigure 8(b) . In order to estimate the altitude change over the correct time period, it is necessary to identify the right samples in the altitude measurement signal. - Firstly, the nearest sample (s1) before the local minimum before the peak (min_1) whose value is larger than a threshold is found. Secondly, the nearest sample (s2) after the local minimum after the peak (min_2) whose value is larger than a threshold is found. It will be appreciated that theoretically, this threshold should be g 2; however in practice, different values might be provided by the training dataset due to slight inaccuracies in the accelerometer, for example. In one implementation, this threshold is 98.
- The altitude change of the candidate sit-to-stand transfer is then estimated as the difference between the altitudes at samples s1 and s2.
- Since there may be small fluctuations in the altitude measurement (due to noise), the altitude change of the candidate sit-to-stand transfer can be estimated as the difference between the mean of the altitude measurement over a time window starting at the second local minimum, and the mean of the altitude measurement over a time window ending at the first local minimum. These time windows can be one second, although it will be appreciated that windows of other lengths can be used. In equation form, this can be expressed as

- The output of the candidate sit-to-stand
transfer identification block 24 and thealtitude change block 25 are provided to adecision block 26 which determines whether any of the candidates are sit-to-stand transfers. In particular, any candidate movement occurring at the same time a change in altitude or height within a predetermined range is deemed to be a sit-to-stand transfer. The change in height should be an increase in height (by definition of a sit-to-stand transfer), and the predetermined range can be, for example, between 0.1 and 0.75 meters. In some cases the upper bound can be omitted at the expense of a greater false positive detection rate. - It can be seen in
Figure 8 that of the four candidate movements highlighted inFigure 8(b) , the last three occur at the same time as an increase in height that is in the range 0.1 to 0.75. Thus, the candidate movements at times 1.69, 1.78 and 1.87 are deemed to correspond to sit-to-stand transfers. The candidate movement at time 1.65 coincides with a reduction in the measured height and is therefore discarded. The algorithm then repeats for a new set of input data (represented byblock 27 inFigure 7 ). - As described above, step 103 of identifying the peak vertical acceleration makes use of estimated timing information of detected sit-to-stand transfers (for example estimated start and end times) for detected sit-to-stand transfers.
- Therefore, a
block 30 determines the timing of the sit-to-stand transfer and receives inputs from theblock 22 which estimates the variation of the acceleration and the vertical acceleration profile after matched filtering, vert acc matfilt. - In a simple embodiment, s1 and s2 are used to identify the start and end of the sit-to-stand transfer for the purposes of identifying the peak vertical acceleration.
- However, as will be known to those skilled in the art, the matched filter introduces a delay which is related to the number of filter taps. This delay causes the candidate sit-to-stand transfer to be delayed with respect to the actual onset of the sit-to-stand transfer in the vert_acc_matfilt signal. Therefore, in some implementations, the output of
block 22 that estimates the variation in acceleration, max_std_acc can be used to determine the actual onset of a sit-to-stand transfer. - Firstly, the most adjacent sample in the signal max_std_acc before s1 whose value is smaller than a threshold is identified. This threshold determines where the onset of the actual sit-to-stand transfer (denoted t_start) is found. In an exemplary case the threshold may be 0.35, but it will be understood that different threshold values smaller than 1 may be used, with the specific value being selected, in part, based on the size of the computing window being applied to the signal. Then, the largest local minimum of the estimate of the vertical acceleration (vert_acc) between s1 and s2 (in other words, the lowest value of vert acc between s1 and s2) is found. The most adjacent sample after the largest local minimum of the estimate of the vertical acceleration, whose value is larger than a threshold value, which in a particular implementation is based on gravity (i.e. 9.8 ms-2), is defined as the end of the actual sit-to-stand transfer (t_end). The solid black bars in
Figure 8(b) and corresponding circles inFigure 8(a) indicate t_start and t_end for each actual sit-to-stand transfer. The values for t_start and t_end for each detected sit-to-stand transfer are output byblock 30 and used to determine the subset of samples that are analyzed to determine the peak vertical acceleration. - There is therefore provided a method and apparatus that can estimate a fall risk for a user through analysis of a sit-to-stand transfer, and in particular through the estimation of the peak vertical acceleration generated by the user in performing a sit-to-stand transfer.
- Variations to the disclosed embodiments can be understood and effected by those skilled in the art in practicing the claimed invention, from a study of the drawings, the disclosure and the appended claims. In the claims, the word "comprising" does not exclude other elements or steps, and the indefinite article "a" or "an" does not exclude a plurality. A single processor or other unit may fulfill the functions of several items recited in the claims. The mere fact that certain measures are recited in mutually different dependent claims does not indicate that a combination of these measures cannot be used to advantage. A computer program may be stored/distributed on a suitable medium, such as an optical storage medium or a solid-state medium supplied together with or as part of other hardware, but may also be distributed in other forms, such as via the Internet or other wired or wireless telecommunication systems. Any reference signs in the claims should not be construed as limiting the scope.
Claims (12)
- A method of estimating the fall risk of a user, the method being implemented by a computer, processor or processing unit, comprising:analyzing (101) measurements of the acceleration of the user to determine if the user has performed a sit-to-stand transfer;only if a standard deviation, variance or range of a plurality of measurements of acceleration occurring in a time period before the start of the sit-to-stand transfer is less than a threshold value, obtaining (107) an estimate of gravity as an average of the plurality of the measurements of acceleration occurring in the time period;identifying (103, 109) the peak vertical acceleration of the user during the sit-to-stand transfer from the measurements of the acceleration of the user, wherein the identified peak vertical acceleration is scaled using the estimate of gravity obtained from the measurements of the acceleration of the user in the time period; andestimating (111) a fall risk for the user from the scaled peak vertical acceleration.
- A method as claimed in claim 1, further comprising the step of:- subtracting the estimate of gravity from the identified peak vertical acceleration to give the scaled peak vertical acceleration.
- A method as claimed in claim 1, further comprising the steps of:- subtracting the estimate of gravity from the measurements of the acceleration of the user to give scaled measurements of the acceleration of the user;wherein the step of identifying (103, 109) the peak vertical acceleration of the user during the sit-to-stand transfer comprises identifying the peak vertical acceleration of the user from the scaled measurements of the acceleration.
- A method as claimed in any of claims 1 to 3, wherein the scaled peak vertical acceleration is normalized using the estimate of gravity, and the normalized scaled peak vertical acceleration is used to estimate the fall risk for the user.
- A method as claimed in any preceding claim, comprising performing the step of identifying for a plurality of sit-to-stand transfers, and wherein the step of estimating the fall risk comprises determining the fall risk from an average of the peak vertical accelerations identified for the plurality of sit-to-stand transfers.
- A method as claimed in claim 5, wherein the step of estimating (111) the fall risk comprises determining the fall risk from the average of the peak vertical accelerations identified for the plurality of sit-to-stand transfers and an indication of the number of times that the user performed the sit-to-stand transfer in a specified time period.
- A method as claimed in any preceding claim, further comprising the step of:- comparing the estimated fall risk to one or more previously estimated fall risks to determine a fall risk trend for the user.
- A computer program product, comprising computer program code that, when executed on a computer or processor, causes the computer or processor to determine a fall risk for a user by:- analyzing measurements of the acceleration of the user to determine if the user has performed a sit-to-stand transfer;- only if a standard deviation, variance or range of a plurality of measurements of acceleration occurring in a time period before the start of the sit-to-stand transfer is less than a threshold value, obtaining an estimate of gravity as an average of the plurality of the measurements of acceleration occurring in the time period;- identifying the peak vertical acceleration of the user during the sit-to-stand transfer from the measurements of the acceleration of the user, wherein the identified peak vertical acceleration is scaled using the estimate of gravity obtained from the measurements of the acceleration of the user in the time period; and- estimating a fall risk for the user from the scaled peak vertical acceleration.
- An apparatus (2) for estimating a fall risk for a user, the apparatus (2) comprising:- a processing unit (8) configured to:- analyze measurements of the acceleration of the user to determine if the user has performed a sit-to-stand transfer;- obtain an estimate of gravity as an average of a plurality of the measurements of acceleration occurring in a time period before the start of the sit-to-stand transfer only if a standard deviation, variance or range of the plurality of measurements of acceleration occurring in the time period is less than a threshold value;- identify the peak vertical acceleration of the user during the sit-to-stand transfer from the measurements of the acceleration of the user, wherein the identified peak vertical acceleration is scaled using the estimate of gravity obtained from the measurements of the acceleration of the user in the time period; and- estimate a fall risk for the user from the scaled peak vertical acceleration.
- A device (2) that is configured to be worn by a user, the device (2) comprising:- an accelerometer (4) that measures the acceleration acting on the device (2) in three dimensions; and- an apparatus (2) as claimed in claim 9, wherein the processing unit (8) is configured to process the measurements of the acceleration from the accelerometer (4).
- A system, comprising:- a device (2) that is configured to be worn by a user, the device (2) comprising an accelerometer (4) that measures the acceleration acting on the device (2) in three-dimensions; and- a base unit that is configured to communicate with the device (2), and that comprises an apparatus (2) as claimed in claim 9, wherein the processing unit is configured to process the measurements of the acceleration from the accelerometer (4).
- A system, comprising:- a force plate; and- a base unit that comprises an apparatus as claimed in claim 9, wherein the processing unit is configured to receive measurements of forces from the force plate and to process the measurements of forces to determine measurements of the acceleration.
Applications Claiming Priority (2)
| Application Number | Priority Date | Filing Date | Title |
|---|---|---|---|
| US201261731599P | 2012-11-30 | 2012-11-30 | |
| PCT/IB2013/060371 WO2014083490A1 (en) | 2012-11-30 | 2013-11-25 | Method and apparatus for estimating the fall risk of a user |
Publications (2)
| Publication Number | Publication Date |
|---|---|
| EP2925226A1 EP2925226A1 (en) | 2015-10-07 |
| EP2925226B1 true EP2925226B1 (en) | 2021-10-27 |
Family
ID=49956270
Family Applications (1)
| Application Number | Title | Priority Date | Filing Date |
|---|---|---|---|
| EP13821173.5A Active EP2925226B1 (en) | 2012-11-30 | 2013-11-25 | Method and apparatus for estimating the fall risk of a user |
Country Status (8)
| Country | Link |
|---|---|
| US (1) | US11020023B2 (en) |
| EP (1) | EP2925226B1 (en) |
| JP (1) | JP6253660B2 (en) |
| CN (1) | CN104822320B (en) |
| BR (1) | BR112015012301A2 (en) |
| CA (1) | CA2892698C (en) |
| RU (1) | RU2681362C2 (en) |
| WO (1) | WO2014083490A1 (en) |
Families Citing this family (22)
| Publication number | Priority date | Publication date | Assignee | Title |
|---|---|---|---|---|
| CN105530865B (en) * | 2013-09-11 | 2022-05-24 | 皇家飞利浦有限公司 | Fall detection system and method |
| EP3193714B1 (en) * | 2014-09-15 | 2024-05-22 | Attenti Electronic Monitoring Ltd. | Impairment detection with environmental considerations |
| KR20170056635A (en) | 2014-09-15 | 2017-05-23 | 쓰리엠 이노베이티브 프로퍼티즈 캄파니 | Impairment detection |
| KR102574554B1 (en) | 2015-06-12 | 2023-09-06 | 쓰리엠 이노베이티브 프로퍼티즈 캄파니 | Liquid coating method and apparatus using a deformable metal roll |
| US10952686B2 (en) * | 2016-08-02 | 2021-03-23 | Medtronic, Inc. | Mobile application to prompt physical action to measure physiologic response in implantable device |
| US20190282128A1 (en) * | 2016-08-09 | 2019-09-19 | Koninklijke Philips N.V. | Processing apparatus and method for determining an ambulation motion of a subject |
| KR102022942B1 (en) * | 2018-05-10 | 2019-09-19 | 주식회사 비플렉스 | The Method of predicting IVLR(instantaneous vertical loading rate) and apparatus for quantifying risk of gait injury using it |
| US10578639B2 (en) * | 2017-08-28 | 2020-03-03 | Otis Elevator Company | Hybrid altimeter for measuring vertical velocity |
| US11013416B2 (en) * | 2018-01-26 | 2021-05-25 | Bose Corporation | Measuring respiration with an in-ear accelerometer |
| US11504071B2 (en) | 2018-04-10 | 2022-11-22 | Hill-Rom Services, Inc. | Patient risk assessment based on data from multiple sources in a healthcare facility |
| US11908581B2 (en) | 2018-04-10 | 2024-02-20 | Hill-Rom Services, Inc. | Patient risk assessment based on data from multiple sources in a healthcare facility |
| WO2020002566A1 (en) * | 2018-06-29 | 2020-01-02 | Koninklijke Philips N.V. | System and method that optimizes physical activity recommendations based on risks of falls |
| CN108887978B (en) * | 2018-07-20 | 2021-04-06 | 深圳中云创新技术有限公司 | Sitting posture detection system |
| CN210246858U (en) | 2018-09-12 | 2020-04-03 | 意法半导体股份有限公司 | System for recognizing a gesture for bringing a mobile electronic device to a user's ear and mobile electronic device |
| CN110216675B (en) * | 2019-06-20 | 2021-04-06 | 北京猎户星空科技有限公司 | Control method and device of intelligent robot, intelligent robot and computer equipment |
| EP3757958A1 (en) | 2019-06-25 | 2020-12-30 | Koninklijke Philips N.V. | Evaluating movement of a subject |
| EP3757957A1 (en) * | 2019-06-25 | 2020-12-30 | Koninklijke Philips N.V. | Evaluating movement of a subject |
| US11717186B2 (en) * | 2019-08-27 | 2023-08-08 | Medtronic, Inc. | Body stability measurement |
| US11602313B2 (en) | 2020-07-28 | 2023-03-14 | Medtronic, Inc. | Determining a fall risk responsive to detecting body position movements |
| ES2932839A1 (en) * | 2021-06-16 | 2023-01-26 | Univ Leon | SYSTEM AND METHOD FOR ASSESSING DYNAMIC BALANCE AND THE RISK OF FALLS DURING WALKING IN ADULTS AND SENIORS (Machine-translation by Google Translate, not legally binding) |
| US20240192783A1 (en) * | 2022-12-13 | 2024-06-13 | Stmicroelectronics S.R.L. | System and method for automatic recognition of the gesture of bringing an electronic device to the ear |
| CN118021294B (en) * | 2024-04-11 | 2024-07-05 | 四川省铁路建设有限公司 | Fall detection method and system based on multiple sensors |
Family Cites Families (22)
| Publication number | Priority date | Publication date | Assignee | Title |
|---|---|---|---|---|
| US6703939B2 (en) * | 1999-09-15 | 2004-03-09 | Ilife Solutions, Inc. | System and method for detecting motion of a body |
| EP1195139A1 (en) | 2000-10-05 | 2002-04-10 | Ecole Polytechnique Féderale de Lausanne (EPFL) | Body movement monitoring system and method |
| AU2003201616A1 (en) * | 2002-02-07 | 2003-09-02 | Ecole Polytechnique Federale De Lausanne (Epfl) | Body movement monitoring device |
| AU2006279800B2 (en) * | 2005-08-12 | 2012-03-29 | Tcms Transparent Beauty Llc | System and method for medical monitoring and treatment through cosmetic monitoring and treatment |
| JP2008173249A (en) * | 2007-01-17 | 2008-07-31 | Matsushita Electric Works Ltd | Activity monitor |
| US7634379B2 (en) * | 2007-05-18 | 2009-12-15 | Ultimate Balance, Inc. | Newtonian physical activity monitor |
| US9295412B2 (en) * | 2007-08-15 | 2016-03-29 | Integrity Tracking, Llc | Wearable health monitoring device and methods for step detection |
| US8206325B1 (en) * | 2007-10-12 | 2012-06-26 | Biosensics, L.L.C. | Ambulatory system for measuring and monitoring physical activity and risk of falling and for automatic fall detection |
| EP2274734B1 (en) * | 2008-05-12 | 2012-07-11 | Koninklijke Philips Electronics N.V. | Displacement measurement in a fall detection system |
| US8773269B2 (en) * | 2008-06-27 | 2014-07-08 | Neal T. RICHARDSON | Autonomous fall monitor |
| US9704369B2 (en) * | 2008-06-27 | 2017-07-11 | Barron Associates, Inc. | Autonomous fall monitor using an altimeter with opposed sensing ports |
| CN102159920A (en) | 2008-09-23 | 2011-08-17 | 皇家飞利浦电子股份有限公司 | Methods for processing measurements from accelerometer |
| WO2010035187A1 (en) * | 2008-09-23 | 2010-04-01 | Koninklijke Philips Electronics N.V. | Power measurement method and apparatus |
| ES2381712T3 (en) | 2008-10-16 | 2012-05-30 | Koninklijke Philips Electronics N.V. | Fall detection system |
| BR112012012229A2 (en) * | 2009-11-25 | 2017-12-26 | Koninl Philips Electronics Nv | fall detector for use in a user's fall detection method for estimating a vertical velocity and / or vertical displacement of an object comprising an accelerometer, method for use in a fall detection user's use of a fall detector comprising an accelerometer and computer program product |
| US20120119904A1 (en) * | 2010-10-19 | 2012-05-17 | Orthocare Innovations Llc | Fall risk assessment device and method |
| RU2629795C2 (en) * | 2011-04-29 | 2017-09-04 | Конинклейке Филипс Н.В. | Device for use in fall detector or fall detection system and management method for such device |
| US9933452B2 (en) | 2011-06-28 | 2018-04-03 | Koninklijke Philips N.V. | Sit-to-stand transfer detection |
| RU122009U1 (en) | 2011-09-14 | 2012-11-20 | Общество С Ограниченной Ответственностью "Биомедтехника" | STABILOMETER SIMULATOR |
| US20130303860A1 (en) * | 2011-11-21 | 2013-11-14 | Robert Bender | Systems and methods for use in fall risk assessment |
| US10327671B2 (en) * | 2014-02-17 | 2019-06-25 | Hong Kong Baptist University | Algorithms for gait measurement with 3-axes accelerometer/gyro in mobile devices |
| EP3302247B1 (en) * | 2015-05-29 | 2023-07-19 | Nike Innovate C.V. | Activity monitoring device with assessment of exercise intensity for calculating the anaerobic capacity of a user |
-
2013
- 2013-11-25 JP JP2015544584A patent/JP6253660B2/en not_active Expired - Fee Related
- 2013-11-25 US US14/648,266 patent/US11020023B2/en active Active
- 2013-11-25 CN CN201380062502.0A patent/CN104822320B/en not_active Expired - Fee Related
- 2013-11-25 BR BR112015012301A patent/BR112015012301A2/en not_active Application Discontinuation
- 2013-11-25 WO PCT/IB2013/060371 patent/WO2014083490A1/en active Application Filing
- 2013-11-25 CA CA2892698A patent/CA2892698C/en active Active
- 2013-11-25 EP EP13821173.5A patent/EP2925226B1/en active Active
- 2013-11-25 RU RU2015125704A patent/RU2681362C2/en active
Non-Patent Citations (1)
| Title |
|---|
| None * |
Also Published As
| Publication number | Publication date |
|---|---|
| BR112015012301A2 (en) | 2020-04-22 |
| CA2892698A1 (en) | 2014-06-05 |
| US11020023B2 (en) | 2021-06-01 |
| CN104822320A (en) | 2015-08-05 |
| JP2016501593A (en) | 2016-01-21 |
| WO2014083490A1 (en) | 2014-06-05 |
| CA2892698C (en) | 2022-08-30 |
| RU2015125704A (en) | 2017-01-11 |
| RU2681362C2 (en) | 2019-03-06 |
| JP6253660B2 (en) | 2017-12-27 |
| US20150313552A1 (en) | 2015-11-05 |
| EP2925226A1 (en) | 2015-10-07 |
| CN104822320B (en) | 2019-06-11 |
Similar Documents
| Publication | Publication Date | Title |
|---|---|---|
| EP2925226B1 (en) | Method and apparatus for estimating the fall risk of a user | |
| EP2925213B1 (en) | Method and apparatus for identifying transitions between sitting and standing postures | |
| US9933452B2 (en) | Sit-to-stand transfer detection | |
| US10512423B2 (en) | Determining energy expenditure of a user | |
| JP6795980B2 (en) | A method of processing acceleration measurements to identify a step by a user and a corresponding computer program, and a device that processes acceleration measurements to identify a step by a user and a device comprising such a device. | |
| JP5874130B2 (en) | System and method for detecting human gait | |
| WO2014083465A1 (en) | Detecting changes in position of a device in a horizontal or vertical direction | |
| EP2341821A1 (en) | Power measurement method and apparatus | |
| KR20170123519A (en) | Method and Apparatus for detecting smoking behavior based on acceleration sensor | |
| US9989360B2 (en) | Method for estimating elevation changes traveled by a user | |
| KR101174729B1 (en) | Ubiquitous healthcare system and multi-functional shoes having the same | |
| Lee et al. | Repeatability of the accelerometric-based method to detect step events for hemiparetic stroke patients |
Legal Events
| Date | Code | Title | Description |
|---|---|---|---|
| PUAI | Public reference made under article 153(3) epc to a published international application that has entered the european phase |
Free format text: ORIGINAL CODE: 0009012 |
|
| 17P | Request for examination filed |
Effective date: 20150630 |
|
| AK | Designated contracting states |
Kind code of ref document: A1 Designated state(s): AL AT BE BG CH CY CZ DE DK EE ES FI FR GB GR HR HU IE IS IT LI LT LU LV MC MK MT NL NO PL PT RO RS SE SI SK SM TR |
|
| AX | Request for extension of the european patent |
Extension state: BA ME |
|
| DAX | Request for extension of the european patent (deleted) | ||
| RAP1 | Party data changed (applicant data changed or rights of an application transferred) |
Owner name: KONINKLIJKE PHILIPS N.V. |
|
| STAA | Information on the status of an ep patent application or granted ep patent |
Free format text: STATUS: EXAMINATION IS IN PROGRESS |
|
| 17Q | First examination report despatched |
Effective date: 20200520 |
|
| STAA | Information on the status of an ep patent application or granted ep patent |
Free format text: STATUS: EXAMINATION IS IN PROGRESS |
|
| GRAP | Despatch of communication of intention to grant a patent |
Free format text: ORIGINAL CODE: EPIDOSNIGR1 |
|
| STAA | Information on the status of an ep patent application or granted ep patent |
Free format text: STATUS: GRANT OF PATENT IS INTENDED |
|
| INTG | Intention to grant announced |
Effective date: 20210407 |
|
| GRAS | Grant fee paid |
Free format text: ORIGINAL CODE: EPIDOSNIGR3 |
|
| GRAA | (expected) grant |
Free format text: ORIGINAL CODE: 0009210 |
|
| STAA | Information on the status of an ep patent application or granted ep patent |
Free format text: STATUS: THE PATENT HAS BEEN GRANTED |
|
| RAP1 | Party data changed (applicant data changed or rights of an application transferred) |
Owner name: LIFELINE SYSTEMS COMPANY |
|
| AK | Designated contracting states |
Kind code of ref document: B1 Designated state(s): AL AT BE BG CH CY CZ DE DK EE ES FI FR GB GR HR HU IE IS IT LI LT LU LV MC MK MT NL NO PL PT RO RS SE SI SK SM TR |
|
| REG | Reference to a national code |
Ref country code: GB Ref legal event code: FG4D |
|
| REG | Reference to a national code |
Ref country code: CH Ref legal event code: EP |
|
| REG | Reference to a national code |
Ref country code: AT Ref legal event code: REF Ref document number: 1441103 Country of ref document: AT Kind code of ref document: T Effective date: 20211115 |
|
| REG | Reference to a national code |
Ref country code: DE Ref legal event code: R096 Ref document number: 602013079826 Country of ref document: DE |
|
| REG | Reference to a national code |
Ref country code: IE Ref legal event code: FG4D |
|
| PGFP | Annual fee paid to national office [announced via postgrant information from national office to epo] |
Ref country code: GB Payment date: 20211028 Year of fee payment: 9 Ref country code: FR Payment date: 20211109 Year of fee payment: 9 Ref country code: DE Payment date: 20211027 Year of fee payment: 9 |
|
| REG | Reference to a national code |
Ref country code: LT Ref legal event code: MG9D |
|
| REG | Reference to a national code |
Ref country code: NL Ref legal event code: MP Effective date: 20211027 |
|
| REG | Reference to a national code |
Ref country code: AT Ref legal event code: MK05 Ref document number: 1441103 Country of ref document: AT Kind code of ref document: T Effective date: 20211027 |
|
| PG25 | Lapsed in a contracting state [announced via postgrant information from national office to epo] |
Ref country code: RS Free format text: LAPSE BECAUSE OF FAILURE TO SUBMIT A TRANSLATION OF THE DESCRIPTION OR TO PAY THE FEE WITHIN THE PRESCRIBED TIME-LIMIT Effective date: 20211027 Ref country code: LT Free format text: LAPSE BECAUSE OF FAILURE TO SUBMIT A TRANSLATION OF THE DESCRIPTION OR TO PAY THE FEE WITHIN THE PRESCRIBED TIME-LIMIT Effective date: 20211027 Ref country code: FI Free format text: LAPSE BECAUSE OF FAILURE TO SUBMIT A TRANSLATION OF THE DESCRIPTION OR TO PAY THE FEE WITHIN THE PRESCRIBED TIME-LIMIT Effective date: 20211027 Ref country code: BG Free format text: LAPSE BECAUSE OF FAILURE TO SUBMIT A TRANSLATION OF THE DESCRIPTION OR TO PAY THE FEE WITHIN THE PRESCRIBED TIME-LIMIT Effective date: 20220127 Ref country code: AT Free format text: LAPSE BECAUSE OF FAILURE TO SUBMIT A TRANSLATION OF THE DESCRIPTION OR TO PAY THE FEE WITHIN THE PRESCRIBED TIME-LIMIT Effective date: 20211027 |
|
| PG25 | Lapsed in a contracting state [announced via postgrant information from national office to epo] |
Ref country code: IS Free format text: LAPSE BECAUSE OF FAILURE TO SUBMIT A TRANSLATION OF THE DESCRIPTION OR TO PAY THE FEE WITHIN THE PRESCRIBED TIME-LIMIT Effective date: 20220227 Ref country code: SE Free format text: LAPSE BECAUSE OF FAILURE TO SUBMIT A TRANSLATION OF THE DESCRIPTION OR TO PAY THE FEE WITHIN THE PRESCRIBED TIME-LIMIT Effective date: 20211027 Ref country code: PT Free format text: LAPSE BECAUSE OF FAILURE TO SUBMIT A TRANSLATION OF THE DESCRIPTION OR TO PAY THE FEE WITHIN THE PRESCRIBED TIME-LIMIT Effective date: 20220228 Ref country code: PL Free format text: LAPSE BECAUSE OF FAILURE TO SUBMIT A TRANSLATION OF THE DESCRIPTION OR TO PAY THE FEE WITHIN THE PRESCRIBED TIME-LIMIT Effective date: 20211027 Ref country code: NO Free format text: LAPSE BECAUSE OF FAILURE TO SUBMIT A TRANSLATION OF THE DESCRIPTION OR TO PAY THE FEE WITHIN THE PRESCRIBED TIME-LIMIT Effective date: 20220127 Ref country code: NL Free format text: LAPSE BECAUSE OF FAILURE TO SUBMIT A TRANSLATION OF THE DESCRIPTION OR TO PAY THE FEE WITHIN THE PRESCRIBED TIME-LIMIT Effective date: 20211027 Ref country code: LV Free format text: LAPSE BECAUSE OF FAILURE TO SUBMIT A TRANSLATION OF THE DESCRIPTION OR TO PAY THE FEE WITHIN THE PRESCRIBED TIME-LIMIT Effective date: 20211027 Ref country code: HR Free format text: LAPSE BECAUSE OF FAILURE TO SUBMIT A TRANSLATION OF THE DESCRIPTION OR TO PAY THE FEE WITHIN THE PRESCRIBED TIME-LIMIT Effective date: 20211027 Ref country code: GR Free format text: LAPSE BECAUSE OF FAILURE TO SUBMIT A TRANSLATION OF THE DESCRIPTION OR TO PAY THE FEE WITHIN THE PRESCRIBED TIME-LIMIT Effective date: 20220128 Ref country code: ES Free format text: LAPSE BECAUSE OF FAILURE TO SUBMIT A TRANSLATION OF THE DESCRIPTION OR TO PAY THE FEE WITHIN THE PRESCRIBED TIME-LIMIT Effective date: 20211027 |
|
| REG | Reference to a national code |
Ref country code: CH Ref legal event code: PL |
|
| REG | Reference to a national code |
Ref country code: DE Ref legal event code: R097 Ref document number: 602013079826 Country of ref document: DE |
|
| PG25 | Lapsed in a contracting state [announced via postgrant information from national office to epo] |
Ref country code: SM Free format text: LAPSE BECAUSE OF FAILURE TO SUBMIT A TRANSLATION OF THE DESCRIPTION OR TO PAY THE FEE WITHIN THE PRESCRIBED TIME-LIMIT Effective date: 20211027 Ref country code: SK Free format text: LAPSE BECAUSE OF FAILURE TO SUBMIT A TRANSLATION OF THE DESCRIPTION OR TO PAY THE FEE WITHIN THE PRESCRIBED TIME-LIMIT Effective date: 20211027 Ref country code: RO Free format text: LAPSE BECAUSE OF FAILURE TO SUBMIT A TRANSLATION OF THE DESCRIPTION OR TO PAY THE FEE WITHIN THE PRESCRIBED TIME-LIMIT Effective date: 20211027 Ref country code: MC Free format text: LAPSE BECAUSE OF FAILURE TO SUBMIT A TRANSLATION OF THE DESCRIPTION OR TO PAY THE FEE WITHIN THE PRESCRIBED TIME-LIMIT Effective date: 20211027 Ref country code: LU Free format text: LAPSE BECAUSE OF NON-PAYMENT OF DUE FEES Effective date: 20211125 Ref country code: EE Free format text: LAPSE BECAUSE OF FAILURE TO SUBMIT A TRANSLATION OF THE DESCRIPTION OR TO PAY THE FEE WITHIN THE PRESCRIBED TIME-LIMIT Effective date: 20211027 Ref country code: DK Free format text: LAPSE BECAUSE OF FAILURE TO SUBMIT A TRANSLATION OF THE DESCRIPTION OR TO PAY THE FEE WITHIN THE PRESCRIBED TIME-LIMIT Effective date: 20211027 Ref country code: CZ Free format text: LAPSE BECAUSE OF FAILURE TO SUBMIT A TRANSLATION OF THE DESCRIPTION OR TO PAY THE FEE WITHIN THE PRESCRIBED TIME-LIMIT Effective date: 20211027 Ref country code: BE Free format text: LAPSE BECAUSE OF NON-PAYMENT OF DUE FEES Effective date: 20211130 |
|
| REG | Reference to a national code |
Ref country code: BE Ref legal event code: MM Effective date: 20211130 |
|
| PG25 | Lapsed in a contracting state [announced via postgrant information from national office to epo] |
Ref country code: LI Free format text: LAPSE BECAUSE OF NON-PAYMENT OF DUE FEES Effective date: 20211130 Ref country code: CH Free format text: LAPSE BECAUSE OF NON-PAYMENT OF DUE FEES Effective date: 20211130 |
|
| PLBE | No opposition filed within time limit |
Free format text: ORIGINAL CODE: 0009261 |
|
| STAA | Information on the status of an ep patent application or granted ep patent |
Free format text: STATUS: NO OPPOSITION FILED WITHIN TIME LIMIT |
|
| 26N | No opposition filed |
Effective date: 20220728 |
|
| PG25 | Lapsed in a contracting state [announced via postgrant information from national office to epo] |
Ref country code: IE Free format text: LAPSE BECAUSE OF NON-PAYMENT OF DUE FEES Effective date: 20211125 Ref country code: AL Free format text: LAPSE BECAUSE OF FAILURE TO SUBMIT A TRANSLATION OF THE DESCRIPTION OR TO PAY THE FEE WITHIN THE PRESCRIBED TIME-LIMIT Effective date: 20211027 |
|
| PG25 | Lapsed in a contracting state [announced via postgrant information from national office to epo] |
Ref country code: SI Free format text: LAPSE BECAUSE OF FAILURE TO SUBMIT A TRANSLATION OF THE DESCRIPTION OR TO PAY THE FEE WITHIN THE PRESCRIBED TIME-LIMIT Effective date: 20211027 |
|
| PG25 | Lapsed in a contracting state [announced via postgrant information from national office to epo] |
Ref country code: IT Free format text: LAPSE BECAUSE OF FAILURE TO SUBMIT A TRANSLATION OF THE DESCRIPTION OR TO PAY THE FEE WITHIN THE PRESCRIBED TIME-LIMIT Effective date: 20211027 Ref country code: HU Free format text: LAPSE BECAUSE OF FAILURE TO SUBMIT A TRANSLATION OF THE DESCRIPTION OR TO PAY THE FEE WITHIN THE PRESCRIBED TIME-LIMIT; INVALID AB INITIO Effective date: 20131125 |
|
| REG | Reference to a national code |
Ref country code: DE Ref legal event code: R119 Ref document number: 602013079826 Country of ref document: DE |
|
| PG25 | Lapsed in a contracting state [announced via postgrant information from national office to epo] |
Ref country code: CY Free format text: LAPSE BECAUSE OF FAILURE TO SUBMIT A TRANSLATION OF THE DESCRIPTION OR TO PAY THE FEE WITHIN THE PRESCRIBED TIME-LIMIT Effective date: 20211027 |
|
| GBPC | Gb: european patent ceased through non-payment of renewal fee |
Effective date: 20221125 |
|
| PG25 | Lapsed in a contracting state [announced via postgrant information from national office to epo] |
Ref country code: GB Free format text: LAPSE BECAUSE OF NON-PAYMENT OF DUE FEES Effective date: 20221125 Ref country code: DE Free format text: LAPSE BECAUSE OF NON-PAYMENT OF DUE FEES Effective date: 20230601 |
|
| PG25 | Lapsed in a contracting state [announced via postgrant information from national office to epo] |
Ref country code: FR Free format text: LAPSE BECAUSE OF NON-PAYMENT OF DUE FEES Effective date: 20221130 |
|
| PG25 | Lapsed in a contracting state [announced via postgrant information from national office to epo] |
Ref country code: MK Free format text: LAPSE BECAUSE OF FAILURE TO SUBMIT A TRANSLATION OF THE DESCRIPTION OR TO PAY THE FEE WITHIN THE PRESCRIBED TIME-LIMIT Effective date: 20211027 |
|
| PG25 | Lapsed in a contracting state [announced via postgrant information from national office to epo] |
Ref country code: MT Free format text: LAPSE BECAUSE OF FAILURE TO SUBMIT A TRANSLATION OF THE DESCRIPTION OR TO PAY THE FEE WITHIN THE PRESCRIBED TIME-LIMIT Effective date: 20211027 |