EP2912475B1 - Method for detecting turbulence conditions, using the interaction of a laser beam with a thin photochromic film, and device for implementing said method - Google Patents
Method for detecting turbulence conditions, using the interaction of a laser beam with a thin photochromic film, and device for implementing said method Download PDFInfo
- Publication number
- EP2912475B1 EP2912475B1 EP13779888.0A EP13779888A EP2912475B1 EP 2912475 B1 EP2912475 B1 EP 2912475B1 EP 13779888 A EP13779888 A EP 13779888A EP 2912475 B1 EP2912475 B1 EP 2912475B1
- Authority
- EP
- European Patent Office
- Prior art keywords
- images
- turbulence
- environment
- assessing
- parameters
- Prior art date
- Legal status (The legal status is an assumption and is not a legal conclusion. Google has not performed a legal analysis and makes no representation as to the accuracy of the status listed.)
- Not-in-force
Links
- 238000000034 method Methods 0.000 title claims description 31
- 230000003993 interaction Effects 0.000 title 1
- 238000012545 processing Methods 0.000 claims description 17
- 238000004458 analytical method Methods 0.000 claims description 14
- 238000005259 measurement Methods 0.000 claims description 14
- 229910052704 radon Inorganic materials 0.000 claims description 9
- SYUHGPGVQRZVTB-UHFFFAOYSA-N radon atom Chemical compound [Rn] SYUHGPGVQRZVTB-UHFFFAOYSA-N 0.000 claims description 9
- DMLAVOWQYNRWNQ-UHFFFAOYSA-N azobenzene Chemical compound C1=CC=CC=C1N=NC1=CC=CC=C1 DMLAVOWQYNRWNQ-UHFFFAOYSA-N 0.000 claims description 8
- 238000001228 spectrum Methods 0.000 claims description 7
- ZYGHJZDHTFUPRJ-UHFFFAOYSA-N coumarin Chemical compound C1=CC=C2OC(=O)C=CC2=C1 ZYGHJZDHTFUPRJ-UHFFFAOYSA-N 0.000 claims description 6
- 230000001902 propagating effect Effects 0.000 claims description 6
- 238000005286 illumination Methods 0.000 claims description 5
- 230000001186 cumulative effect Effects 0.000 claims description 4
- 230000001419 dependent effect Effects 0.000 claims description 4
- 238000000386 microscopy Methods 0.000 claims description 3
- 239000011368 organic material Substances 0.000 claims description 3
- 238000005192 partition Methods 0.000 claims description 3
- 230000001131 transforming effect Effects 0.000 claims description 2
- 229960000956 coumarin Drugs 0.000 claims 2
- 235000001671 coumarin Nutrition 0.000 claims 2
- 238000012935 Averaging Methods 0.000 claims 1
- 239000010408 film Substances 0.000 description 23
- 239000000463 material Substances 0.000 description 16
- 230000000694 effects Effects 0.000 description 10
- 230000003287 optical effect Effects 0.000 description 7
- 230000010287 polarization Effects 0.000 description 6
- 238000004364 calculation method Methods 0.000 description 5
- 230000008569 process Effects 0.000 description 5
- 239000003570 air Substances 0.000 description 4
- 238000004891 communication Methods 0.000 description 4
- 238000006073 displacement reaction Methods 0.000 description 4
- 238000003384 imaging method Methods 0.000 description 4
- 239000010409 thin film Substances 0.000 description 4
- 238000012876 topography Methods 0.000 description 4
- 239000000178 monomer Substances 0.000 description 3
- GOLORTLGFDVFDW-UHFFFAOYSA-N 3-(1h-benzimidazol-2-yl)-7-(diethylamino)chromen-2-one Chemical compound C1=CC=C2NC(C3=CC4=CC=C(C=C4OC3=O)N(CC)CC)=NC2=C1 GOLORTLGFDVFDW-UHFFFAOYSA-N 0.000 description 2
- CERQOIWHTDAKMF-UHFFFAOYSA-M Methacrylate Chemical compound CC(=C)C([O-])=O CERQOIWHTDAKMF-UHFFFAOYSA-M 0.000 description 2
- ZVQOOHYFBIDMTQ-UHFFFAOYSA-N [methyl(oxido){1-[6-(trifluoromethyl)pyridin-3-yl]ethyl}-lambda(6)-sulfanylidene]cyanamide Chemical compound N#CN=S(C)(=O)C(C)C1=CC=C(C(F)(F)F)N=C1 ZVQOOHYFBIDMTQ-UHFFFAOYSA-N 0.000 description 2
- 238000002835 absorbance Methods 0.000 description 2
- 230000008901 benefit Effects 0.000 description 2
- 238000010276 construction Methods 0.000 description 2
- 238000001514 detection method Methods 0.000 description 2
- 238000002474 experimental method Methods 0.000 description 2
- 238000010438 heat treatment Methods 0.000 description 2
- 238000012986 modification Methods 0.000 description 2
- 230000004048 modification Effects 0.000 description 2
- 230000007704 transition Effects 0.000 description 2
- 239000013598 vector Substances 0.000 description 2
- GOXQRTZXKQZDDN-UHFFFAOYSA-N 2-Ethylhexyl acrylate Chemical compound CCCCC(CC)COC(=O)C=C GOXQRTZXKQZDDN-UHFFFAOYSA-N 0.000 description 1
- 241000861223 Issus Species 0.000 description 1
- 241001080024 Telles Species 0.000 description 1
- 238000010521 absorption reaction Methods 0.000 description 1
- 125000006852 aliphatic spacer Chemical group 0.000 description 1
- 239000012080 ambient air Substances 0.000 description 1
- 230000003321 amplification Effects 0.000 description 1
- 238000013459 approach Methods 0.000 description 1
- 238000004630 atomic force microscopy Methods 0.000 description 1
- 230000005540 biological transmission Effects 0.000 description 1
- 230000015572 biosynthetic process Effects 0.000 description 1
- 230000015556 catabolic process Effects 0.000 description 1
- 230000008859 change Effects 0.000 description 1
- 238000007697 cis-trans-isomerization reaction Methods 0.000 description 1
- 230000001427 coherent effect Effects 0.000 description 1
- 229920001577 copolymer Polymers 0.000 description 1
- 230000007423 decrease Effects 0.000 description 1
- 230000003247 decreasing effect Effects 0.000 description 1
- 238000006731 degradation reaction Methods 0.000 description 1
- 230000010259 detection of temperature stimulus Effects 0.000 description 1
- 238000011161 development Methods 0.000 description 1
- 238000009792 diffusion process Methods 0.000 description 1
- 230000005672 electromagnetic field Effects 0.000 description 1
- 238000011156 evaluation Methods 0.000 description 1
- -1 heterocyclic sulfonamide compounds Chemical class 0.000 description 1
- 229920001519 homopolymer Polymers 0.000 description 1
- 230000010354 integration Effects 0.000 description 1
- 238000006317 isomerization reaction Methods 0.000 description 1
- 230000031700 light absorption Effects 0.000 description 1
- 238000004599 local-density approximation Methods 0.000 description 1
- 230000007774 longterm Effects 0.000 description 1
- 125000005395 methacrylic acid group Chemical group 0.000 description 1
- 238000012544 monitoring process Methods 0.000 description 1
- 125000004433 nitrogen atom Chemical group N* 0.000 description 1
- 238000003199 nucleic acid amplification method Methods 0.000 description 1
- 230000000737 periodic effect Effects 0.000 description 1
- 125000001997 phenyl group Chemical group [H]C1=C([H])C([H])=C(*)C([H])=C1[H] 0.000 description 1
- 238000007699 photoisomerization reaction Methods 0.000 description 1
- 229920000642 polymer Polymers 0.000 description 1
- 229920006254 polymer film Polymers 0.000 description 1
- 230000002441 reversible effect Effects 0.000 description 1
- 239000007787 solid Substances 0.000 description 1
- 238000004528 spin coating Methods 0.000 description 1
- 229940124530 sulfonamide Drugs 0.000 description 1
- 238000003786 synthesis reaction Methods 0.000 description 1
- 230000002123 temporal effect Effects 0.000 description 1
- 230000009466 transformation Effects 0.000 description 1
Images


Classifications
-
- G—PHYSICS
- G01—MEASURING; TESTING
- G01P—MEASURING LINEAR OR ANGULAR SPEED, ACCELERATION, DECELERATION, OR SHOCK; INDICATING PRESENCE, ABSENCE, OR DIRECTION, OF MOVEMENT
- G01P5/00—Measuring speed of fluids, e.g. of air stream; Measuring speed of bodies relative to fluids, e.g. of ship, of aircraft
- G01P5/001—Full-field flow measurement, e.g. determining flow velocity and direction in a whole region at the same time, flow visualisation
-
- G—PHYSICS
- G01—MEASURING; TESTING
- G01P—MEASURING LINEAR OR ANGULAR SPEED, ACCELERATION, DECELERATION, OR SHOCK; INDICATING PRESENCE, ABSENCE, OR DIRECTION, OF MOVEMENT
- G01P5/00—Measuring speed of fluids, e.g. of air stream; Measuring speed of bodies relative to fluids, e.g. of ship, of aircraft
- G01P5/26—Measuring speed of fluids, e.g. of air stream; Measuring speed of bodies relative to fluids, e.g. of ship, of aircraft by measuring the direct influence of the streaming fluid on the properties of a detecting optical wave
-
- G06T3/10—
Definitions
- the field of the invention is that of methods for detecting the turbulence of a medium, exploiting the disturbances generated on the propagation of a laser beam and that of compact devices implementing such a method.
- This type of process can also be used to measure turbulence rates (more or less strong in a given environment) than to measure the effects of turbulence on the propagation of a laser beam.
- the turbulence analysis can find many applications, via compact and discrete means, especially in the field of the environment, detection of temperature rise, air movement in a city for example.
- One of the methods is to simultaneously make differential measurements of arrival angles and intensity fluctuations of the laser beam from a reference using a CCD camera since the measurements of spatial fluctuations are very sensitive to the wavelength of the path traveled by the laser beam ( A. Consortini et al., Optics Communications, 216, 19-23, (2003) )). This fluctuation depends cubically on the length of the optical path traveled.
- the tilt of the wavefront is analyzed using polynomial techniques from a shark-hartmann analysis method ( AV Sergryev et al., Appl. Opt., 50 (20), 3519-3528, (2011) )) and requires a complex and expensive laser wavefront analysis system. Fluctuations in the angle of arrival or tilt of the wavefront are used to measure the characteristic parameters of atmospheric turbulence.
- the structure parameter of the refractive index or C n 2 is a measure of the strength of the optical turbulence along the propagation path of the laser beam. In free-space laser propagation the measurement of angular arrival fluctuations is a basic step in the study of atmospheric turbulence.
- the subject of the present application is an easy method of implementation, opening the way to devices for evaluating the turbulence of a medium, which may notably be related to ambient air heating phenomena. , easy to implement and can be deployed massively.
- the method comprises a step of acquiring diffraction images of the laser beam by the created surface grating, said images having diffraction spots whose characteristics are dependent on the turbulence parameters.
- the device for evaluating the turbulence parameters of a medium comprises a set of measurement units, said measurement units being connected to said reception and processing device.
- Another subject of the invention is the use of the device for evaluating the turbulence parameters of an ambient medium according to one of the invention, for making measurements of air movements, for example in an urban environment.
- the invention will be described in the context of an azobenzene film, but may equally well use other types of photochromic organic materials.
- the effect used in the present invention corresponds to a holographic recording in which the fringes build themselves during the process of molecular self-organization and print a long-term statistical average of the effect of the turbulent medium. on laser propagation.
- Organic holographic materials have the advantage over their inorganic counterparts of being structurally versatile, easily fabricated and inexpensive.
- This type of photochromic material such as an azopolymeric material, is capable of self-organizing on the surface under the effect of the light of a laser to produce a pattern in the form of a diffraction grating, for simultaneously measuring several characteristics of said turbulence.
- the molecules of azobenzene have been studied for more than half a century for their particular optical properties and, even today, new phenomena related to their photoisomerization are discovered. Among these phenomena, the deformation of photo-induced material in photochromic materials containing these molecules is undoubtedly one of the most remarkable. Successive cycles of isomerization of the molecule may result in material displacement over distances of several hundred nanometers.
- the molecules of the azobenzene family are characterized by two benzene rings linked by a double bond between two nitrogen atoms. They can exist in two isomeric forms: the trans (or E) form and the cis (or Z) form. The transition from the trans form to the cis form is excited by absorption of a photon and the reverse transition from the cis form to the trans form can be either optically excited or thermally activated.
- This effect can be observed on a polymer thin film containing azobenzenes capable of making a topographic network on the surface of the film after exposure by an interference structure created by two laser beams.
- this surface structure can also be achieved with a single laser beam by self-organization of the azo molecules where the direction of the grating vector of the grating depends on the polarization of the laser beam.
- the surface networks can then be erased by using a laser beam with a circular polarization or by heat treatment.
- the Applicant has validated the concept of the present invention by performing ambient turbulence conditions and recording the images of the surface grating created by a laser beam after propagation of said beam in the ambient environment disturbed by the turbulence created, in order to highlight the correlation between the turbulences and the structural modifications made at the surface of the film of organic photochromic material.
- the parameters of the turbulent medium necessary for the evaluation of the present invention were first evaluated.
- the turbulence produced is representative of atmospheric turbulence under real conditions.
- the air flow generated presents velocities v modified by a grid having steps of different widths, said speeds being between 12.5 m / s and 7.6 m / s.
- the intensities and the angles of arrival of the beam F 1 were evaluated in two successive stages.
- the samples of the polymer films are made from a synthesis of a novel azobenzene-derived chromophoric monomer containing heterocyclic sulfonamide compounds.
- the methacrylate monomer contains aliphatic spacers of different lengths between the methacrylic and chromophoric groups.
- the monomers in question are polymerized to obtain homopolymers and copolymerized with 2-methylacrylate and 2-ethylhexyl acrylate to obtain copolymers containing several percentages of chromophoric units.
- the thin films are prepared by spin coating from a solution diluted with THF and a concentration of 50 mg / ml.
- the thickness of the film measured with a dektak-6M profiler is 1 ⁇ m.
- the laser beam is first made parallel by an afocal system of two lenses (Kepler).
- the diameter of the beam is 5.1 mm.
- a diaphragm makes it possible to choose the central region of the wavefront and to generate a quasi-plane wave with a diameter of 3.1 mm.
- the diameter of the diaphragm is chosen to select a region of the laser beam as the best compromise between a region of the plane wavefront and an intensity signal allowing a reasonable value of the signal-to-noise ratio.
- the laser beam passes into the turbulent medium over a distance of 1 m and is fed onto the azopolymer thin film 2 of the present invention with a power between 100 and 300 mW / cm 2 .
- An optical system makes it possible to collect the intensity of the diffraction order and to control over time the unfolding of the holographic inscription.
- the diffraction intensity reaches saturation, the laser beam is cut off and the surface of the thin film on which the process is inscribed is characterized by imaging, several types of imaging may be employed.
- the Figures 2a and 2b relate respectively to the gratings inscribed in the photochromic material film and to the diffraction images taken by the CCD camera and comprising spots given by the diffraction order, for the four turbulence conditions T1, T2, T3 and T4.
- the spacing of the spots gives the spatial frequency of the self-organized network present on the surface of the sample.
- the evolution of this diffraction pattern follows a power law in time until saturation of the phenomenon and depends on the power of the laser beam.
- the change in the propagation conditions of the laser beam induces additional spatial frequencies disturbing the regularity of the pitch of the beam. These additional frequencies are identified by the appearance of intensities outside the two spots.
- the spatial information on the direction of the additional spatial frequency wave vectors is given by their X and Y coordinates with respect to the two spots and by the intensities surface. An important surface characterizes a significant diffusion of the spatial frequencies and thus a greater turbulence.
- the figure 2a shows in particular that turbulence creates sub-structures with steps of As sub-networks of 400 ⁇ 30 nm.
- the polarization variation induced by the turbulence is measured by the horizontal direction of the two diffraction spots.
- the laser beam has a linear and horizontal polarization represented by the two diffraction spots on a horizontal plane.
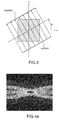
- the diffraction images can be analyzed by the Radon transform, the effective calculation of the discrete Radon transform involving numerically interpolations of the image to be processed, in order to estimate it in a rotating reference, as illustrated in FIG. figure 3 .
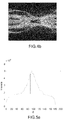
- the representations of the intensity as a function of the angle ⁇ as illustrated in figure 5a and 5b show the presence of a central peak representing the projection of the 2 spots given by the diffraction of the beam on the network without turbulence.
- the peaks outside the central peak represent the contributions of the additional spatial frequencies provided by the movement of the laser beam disturbed by the turbulence.
- the inscribed network is characterized by atomic force microscopy in contact mode.
- the figure 6a gives the topography of the film surface after registration by the laser for the four examples of turbulence conditions T1, T2, T3 and T4.
- the surface self-organizes under the effect of the laser to create a diffraction grating.
- Topographies obtained for different turbulence conditions are considered as random Gaussian surfaces.
- the observed structures are first processed by an algorithm of the present invention to recognize, quantify and analyze the turbulence-modified surface sub-areas.
- Fractal and multifractal analysis techniques are then used to recover the scale invariance properties of all disturbed sub-zones applicable to the measurement of the turbulence effect on a laser beam.
- the image is first and foremost integrated.
- a Gaussian low-pass filter is used to attenuate the high spatial frequencies.
- the average filter each points with its neighbors. It has the effect of suppressing high frequencies and increasing the low frequency signal.
- the filter makes it possible to reduce the contrast of the zones where there is no network and makes it possible to mark the zones where the network has disappeared because of the perturbation on the laser which creates the network by the turbulence.
- This operation amounts to drawing the contours of these Gaussian surfaces by thresholding the height of the topography with a fixed spacing ⁇ between the height of the successive contours to obtain that the sub-zones do not contain periodic structures, as illustrated in FIG. figure 6b .
- the threshold is determined by the empirical value I Avg / 6 where I moy is the average value of the roughness of the surface.
- Contour drawings consist of non-intersecting, closed lines in the plane that connect the points of equal heights. In this way, for each configuration of random surfaces given by the different turbid media, a configuration of a set of contours is assigned.
- the image is divided into boxes of equal length s.
- a line of least squares is used to adjust the box to the data (representing the trend in the box).
- the x and y coordinates of the line segments are calculated.
- Fluctuation trends are removed from the image by subtracting the local trend.
- the effective value of the fluctuations of the image are then calculated.
- the calculation is repeated for all the lengths of the boxes to characterize the local fluctuations according to the size of the boxes.
- the figure 7 illustrates the evolution of the coefficient ⁇ (q) as a function of the number q for the different turbulences T1, T2, T3 and T4. Curves that are not linear reflect a mutltifractal behavior.
- h (q) describes the scale behavior of boxes with large fluctuations.
- h (q) describes the scale behavior of segments with small fluctuations.
- T1 turbulence induces little scale behavior for small fluctuations. The trend is reversed for other turbulence conditions.
- the width of the spectra f ( ⁇ ) measures the level of multifractality of the signal. The larger the width, the more the signal is multifractal.
- the figure 8 illustrates these spectra for the different turbulences T1, T2, T3 and T4.
- C n The value of C n can be evaluated according to the maximum of f ( ⁇ ).
- the widths are very different depending on the turbulence and can be seen that with high turbulence the signal contains more multifractal fluctuations.
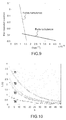
- the figure 9 thus illustrates the case of low turbulence and the case of strong turbulence.
- the method of the present invention also makes it possible to calculate the gap that evaluates the homogeneity of the distribution of the light intensities and thus to know how the object fills the space.
- lacunarity makes it possible to measure the distribution of holes in the image: if it contains large contrasts (on the scale), then the lacunarity of the image will be high. Conversely, if the image is homogeneous, then its gap will be small.
- Lacunarity is measured using a sliding box algorithm.
- the algorithm uses a box of size s x s with its width placed in the upper left corner of the image. The number of pixels of the signal in the box is counted.
- the box is dragged one pixel to the right and the number of pixels in the box is counted so on. The process is repeated until the box reaches the lower right corner of the image.
- N (s) ( ⁇ -s + 1) 2 .
- the width s of the box is chosen so that the numerical value is equal to 2, 4, 8, ..., /.
- Lacunarity L (s) for a box size is defined by: N (s). Q 2 / Q 1 2
- p (i, ⁇ ) is the number of pixels of the signal in the ith box and i is between 1 and N (s).
- a low value of b gives a hyperbole with a broad concavity (strong concavity).
- a low value of b describes an object with a large distribution of empty gaps.
- the figure 10 shows the calculation of the gaps calculated from the contrasting images where the contours corresponding to the threshold of contar images ( Figure 6c ).
- the calculation shows the different textures of the images for different turbulence conditions.
- the values obtained on the examples of structures shown in figure 6a gives for the value of the coefficient of parabola b as a function of C n : b Cn 2.61 9.4110 -13 8.62 1.47.10 -12 10.94 3.77.10 -12 19.11 4.12.10 -12
- the curvature of the hyperbola becomes stronger as the turbulence decreases involving a larger gap between the dark areas of the images of the Figure 6c .
- the beam fluctuates spatially and loses its coherence reducing the structured areas on the azopolymer film. These unstructured areas represent the integration over time of all spatial fluctuations.
- the method of the present invention can be implemented in a unit 10 comprising a laser source 20, a support 30 covered with a film of photochromic material 31 and a CCD camera type detector 40. This unit is connected to a device treatment 50.
- the device may comprise a set of units 10, 11,..., 1 N connected to a central processing device 60 and making it possible to collect different turbulence information in different locations via the center. treatment 60.
Description
Le domaine de l'invention est celui des procédés permettant de déceler les turbulences d'un milieu, exploitant les perturbations générées sur la propagation d'un faisceau laser et celui des dispositifs compacts mettant en oeuvre un tel procédé.The field of the invention is that of methods for detecting the turbulence of a medium, exploiting the disturbances generated on the propagation of a laser beam and that of compact devices implementing such a method.
Ce type de procédé peut aussi bien être exploité pour mesurer des taux de turbulence (plus ou moins forte dans un environnement donné) que pour mesurer les effets de turbulence sur la propagation d'un faisceau laser.This type of process can also be used to measure turbulence rates (more or less strong in a given environment) than to measure the effects of turbulence on the propagation of a laser beam.
En effet, l'analyse de turbulence peut trouver de nombreuses applications, via des moyens compacts et discrets, notamment dans le domaine de l'environnement, de détection d'élévations de températures, de mouvements d'air dans une ville par exemple.Indeed, the turbulence analysis can find many applications, via compact and discrete means, especially in the field of the environment, detection of temperature rise, air movement in a city for example.
Il peut également être très intéressant de mesurer les modifications engendrées sur la propagation d'un faisceau laser en raison de turbulences ambiantes. La propagation de faisceaux laser à travers un milieu turbulent est notamment d'une grande importance dans des applications telles que les communications optiques en espace libre (mer, champ de bataille, ...), la détection de cibles, l'imagerie et la détection à longue distance. Dans beaucoup de ces applications, les lasers avec leurs propriétés de cohérence du champ électromagnétique sont utilisés.It can also be very interesting to measure the changes generated on the propagation of a laser beam due to ambient turbulence. The propagation of laser beams through a turbulent medium is particularly of great importance in applications such as open space optical communications (sea, battlefield, ...), target detection, imaging and communication. long-range detection. In many of these applications, lasers with their electromagnetic field coherence properties are used.
Les champs cohérents qui se propagent dans des milieux aléatoires tels que la turbulence atmosphérique, sont sujets à des distorsions et scintillations spatiales et temporelles aléatoires des intensités optiques qui peuvent entraîner une dégradation considérable dans la performance du système. Ces scintillations dues à des changements rapides et continus de températures et de pression proches de la surface du sol y sont plus sévères et plus prononcées et induisent des distorsions de la structure de phase du champ d'onde par la turbulence entraînant l'onde à interférer avec elle-même.Coherent fields that propagate in random environments such as atmospheric turbulence, are subject to random spatial and temporal distortions and scintillations of optical intensities that can cause considerable degradation in system performance. These scintillations due to rapid and continuous changes of temperature and pressure near the surface of the ground are more severe and more pronounced and induce distortions of the phase structure of the wave field by the turbulence causing the wave to interfere. with herself.
Ces changements dans les données et paramètres du faisceau apportent des limitations fondamentales dans le développement des systèmes optiques de communication en espace libre. Un des effets significatifs de la turbulence atmosphérique est la fluctuation de la direction de la propagation du front d'onde référencé comme la fluctuation de l'angle d'arrivée ou le tilt du front d'onde. Cet angle est mesuré par différentes méthodes.These changes in the data and parameters of the beam bring fundamental limitations in the development of optical communication systems in free space. One of the significant effects of atmospheric turbulence is the fluctuation of the direction of propagation of the wavefront referenced as the fluctuation of the angle of arrival or the tilt of the wavefront. This angle is measured by different methods.
Une des méthodes consiste à faire simultanément des mesures différentielles des angles d'arrivée et des fluctuations d'intensité du faisceau laser à partir d'une référence en utilisant une caméra CCD puisque les mesures de fluctuations spatiales sont très sensibles à la longueur d'onde du trajet parcouru par le faisceau laser (
D'autres méthodes consistent à utiliser une structuration du faisceau laser soit avec des franges d'interférence et en analysant leur visibilité dans le cas d'un type d'anémométrie laser Doppler (
Dans les deux cas les méthodes sont difficiles à mettre en oeuvre puisqu'il faut créer les interférences pour l'anémométrie doppler ou bien installer deux réseaux d'amplitude et s'assurer de leur stabilité initiale pour la technique Moiré. Le tilt du front d'onde est lui analysé en utilisant des techniques polynomiales à partir d'une méthode d'analyse de type shark-hartmann (
Dans ce contexte, la présente demande a pour objet un procédé facile de mise en oeuvre, ouvrant la voie à des dispositifs d'évaluation de la turbulence d'un milieu, pouvant notamment être lié à des phénomènes d'échauffement de l'air ambiant, faciles de mise en oeuvre et pouvant être déployés massivement.In this context, the subject of the present application is an easy method of implementation, opening the way to devices for evaluating the turbulence of a medium, which may notably be related to ambient air heating phenomena. , easy to implement and can be deployed massively.
Plus précisément, la présente invention a pour objet un procédé d'évaluation de paramètres de turbulence d'un milieu caractérisé en ce qu'il comprend les étapes suivantes :
- l'illumination par un faisceau laser se propageant dans ledit milieu, d'un film de matériau organique photochromique pouvant comprendre des molécules d'azobenzène, ou de spyropyrane, ou de stylbène, ou de coumarine, ou de fulgide, ladite illumination créant un réseau de surface dans ledit film comportant des striures dont les déformations sont fonction des paramètres de turbulence ;
- une étape d'acquisition d'images comportant des zones élémentaires de structurations liées auxdites striures, plus ou moins réduites et représentatives des paramètres de turbulence dudit milieu ;
- une étape de traitement desdites images permettant d'évaluer les paramètres de turbulence dudit milieu.
- the illumination by a laser beam propagating in said medium, a film of organic photochromic material which may comprise molecules of azobenzene, or of spyropyran, or of stylbene, or coumarin, or fulgid, said illumination creating a network surface in said film having striations whose deformations are a function of the turbulence parameters;
- an image acquisition step comprising elementary zones of structure related to said striations, more or less reduced and representative of the turbulence parameters of said medium;
- a step of processing said images making it possible to evaluate the turbulence parameters of said medium.
Selon une variante de l'invention, le procédé comprend une étape d'acquisition d'images de diffraction du faisceau laser par le réseau de surface créé, lesdites images présentant des spots de diffraction dont les caractéristiques sont dépendantes des paramètres de turbulence.According to a variant of the invention, the method comprises a step of acquiring diffraction images of the laser beam by the created surface grating, said images having diffraction spots whose characteristics are dependent on the turbulence parameters.
Selon une variante de l'invention, l'étape de traitement desdites images comprend :
- une opération de transformée de Radon desdites images de manière à générer des images dérivées par calcul d'images dans un repère en rotation générant depuis des zones de diffraction appartenant auxdites images, un ensemble de pics appartenant aux images dérivées,
- une comparaison dudit ensemble de pics avec un ensemble de pics de référence de conditions de turbulence, de manière à estimer le niveau de turbulence dudit milieu.
- a Radon transform operation of said images so as to generate images derived by calculating images in a rotation mark generating from diffraction zones belonging to said images a set of peaks belonging to the derived images,
- a comparison of said set of peaks with a set of reference peaks of turbulence conditions, so as to estimate the turbulence level of said medium.
Selon une variante de l'invention, le procédé comprend :
- une étape d'acquisition d'images réalisée par microscopie AFM ;
- une étape de traitement desdites images permettant de reconnaître, quantifier et analyser les zones élémentaires formées en surface dépendantes, des paramètres de turbulence et permettant d'obtenir des images dérivées ;
- une étape d'analyse desdites images dérivées par analyse fractale ou multifractale, sur l'ensemble desdites zones élémentaires permettant de définir des propriétés d'invariance d'échelle et de déterminer les informations de turbulence dudit milieu.
- an image acquisition step performed by AFM microscopy;
- a step of processing said images making it possible to recognize, quantify and analyze the elementary zones formed on the dependent surface, of the turbulence parameters and making it possible to obtain derived images;
- a step of analyzing said images derived by fractal or multifractal analysis, on all of said elementary zones making it possible to define scale invariance properties and to determine the turbulence information of said medium.
Selon une variante de l'invention, l'étape de traitement desdites images comprend les opérations suivantes :
- l'utilisation d'un filtre gaussien, moyennant chacun des points d'acquisition avec des points voisins et générant des images filtrées;
- la construction d'un ensemble d'images dérivées par traitement desdites images filtrées, pouvant être opérée par la transformation desdites images filtrées en images filtrées binaires, puis marquage des zones exemptes de striures, de manière à augmenter le contraste entre lesdites zones élémentaires.
- the use of a Gaussian filter, with each of the acquisition points with neighboring points and generating filtered images;
- constructing a set of derived images by processing said filtered images, which can be operated by transforming said filtered images into binary filtered images, and then marking the streak-free areas so as to increase the contrast between said elementary areas.
Selon une variante de l'invention, l'étape d'analyse fractale ou multifractale comprend les étapes suivantes :
- la division de ladite image selon deux dimensions x et y, en segments N/s, définissant une partition en boîtes, N étant une dimension de l'image et le calcul de deux sommes cumulatives X(i) et Y(i) définissant un signal, telles que :

- l'estimation dans chacune des boîtes, d'une surface définie par deux fonctions polynômiales (pv(i), qv(i)) selon les deux dimensions x et y, permettant d'approximer ledit signal et permettant de définir :
- o une tendance dans chacune des boîtes et
- o les variations par rapport à ladite tendance de manière à définir les paramètres Xs(i) = X(i) - pv(i) et Ys(i) = Y(i) - qv(i)
- le calcul d'une fonction de fluctuation dépouillée desdites tendances définie par l'équation :


- o une loi de puissance entre la fonction Fq(s) et la taille (s) des boîtes et
- o l'exposant d'échelle multifractale r(q) et τ (q) = qh(q) - 1;
- la détermination d'une fonction de singularité α(q) = dτ(q) /dq et d'un spectre multifractal : f(α) = q(α).α - s[q(α)] présentant une valeur maximale f(α)max ;
- la comparaison de la valeur f(α)max avec une table de calibration référençant des valeurs f(α)max St avec des indices de réfraction Cn et permettant de relier l'indice de réfraction Cn avec un paramètre de turbulence de référence.
- dividing said image into two dimensions x and y, into N / s segments, defining a partition in boxes, N being a dimension of the image and calculating two cumulative sums X (i) and Y (i) defining a signal, such as:
- estimating in each of the boxes, a surface defined by two polynomial functions (p v (i), q v (i)) according to the two dimensions x and y, making it possible to approximate said signal and making it possible to define:
- o a trend in each box and
- o variations with respect to said trend so as to define the parameters X s (i) = X (i) - p v (i) and Y s (i) = Y (i) - q v (i)
- calculating a stray function stripped of said trends defined by the equation:
- o a power law between the function Fq (s) and the size (s) of the boxes and
- o the exponent of multifractal scale r (q) and τ (q) = q h (q) - 1;
- the determination of a singularity function α (q) = dτ (q) / dq and a multifractal spectrum: f (α) = q (α) .α-s [q (α)] having a maximum value f (α) max ;
- comparing the value f (α) max with a calibration table referencing values f (α) max St with refractive indices Cn and making it possible to connect the refractive index Cn with a reference turbulence parameter.
L'invention a aussi pour objet un dispositif d'évaluation des paramètres de turbulence d'un milieu, caractérisé en ce qu'il comprend :
- une unité de mesure comportant :
- o un film de matériau organique photochromique pouvant comprendre des molécules d'azobenzène, ou de spyropyrane, ou de stylbène, ou de coumarine, ou de fulgide ;
- o une source laser émettant un faisceau laser se propageant dans ledit milieu et interagissant avec ledit film de manière à créer un réseau de surface comportant des striures dont les déformations sont fonction des paramètres de turbulence ;
- o un détecteur permettant l'acquisition d'images comportant des zones élémentaires de structurations liées auxdites striures, plus ou moins réduites et représentatives des paramètres de turbulence dudit milieu et générant des signaux relatifs auxdites images ;
- un dispositif de réception et de traitement desdits signaux délivrant des informations d'évaluation des paramètres de turbulence dudit milieu.
- a unit of measurement comprising:
- a film of organic photochromic material that may comprise molecules of azobenzene, or of spyropyran, or of stylbene, or coumarin, or fulgide;
- a laser source emitting a laser beam propagating in said medium and interacting with said film in order to create a surface network comprising striations whose deformations are a function of the turbulence parameters;
- a detector for acquiring images comprising elementary zones of structures related to said striations, more or less reduced and representative of the turbulence parameters of said medium and generating signals relating to said images;
- a device for receiving and processing said signals delivering information for evaluating the turbulence parameters of said medium.
Selon une variante de l'invention, le dispositif d'évaluation des paramètres de turbulence d'un milieu comprend un ensemble d'unités de mesure, lesdites unités de mesure étant en liaison avec ledit dispositif de réception et de traitement.According to a variant of the invention, the device for evaluating the turbulence parameters of a medium comprises a set of measurement units, said measurement units being connected to said reception and processing device.
L'invention a encore pour objet l'utilisation du dispositif d'évaluation des paramètres de turbulence d'un milieu ambiant selon l'une d'invention, pour réaliser des mesures de mouvements d'air, par exemple en milieu urbain.Another subject of the invention is the use of the device for evaluating the turbulence parameters of an ambient medium according to one of the invention, for making measurements of air movements, for example in an urban environment.
L'invention sera mieux comprise et d'autres avantages apparaîtront à la lecture de la description qui va suivre donnée à titre non limitatif et grâce aux figures annexées parmi lesquelles :
- la
figure 1 illustre un exemple de dispositif permettant de valider le concept de la présente invention ; - les
figures 2a et 2b illustrent des réseaux inscrits dans un film de matériau photochrome et les différentes images correspondantes de diffraction prises par une caméra CCD ; - la
figure 3 illustre le principe de la transformée de Radon d'une image d'un réseau de diffraction inscrit dans un film de matériau photochromique ; - les
figures 4a et4b illustrent les images résultantes de la transformée de Radon de deux exemples d'images illustrées enfigure 2a ; - les
figures 5a et5b illustrent les pics d'intensité issus du traitement des images illustrées enfigure 4a et4b et représentatifs du degré de turbulence du milieu analysé ; - les
figures 6a, 6b et 6c illustrent respectivement des images prises par microscopie AFM d'un réseau de surface inscrit dans un film de matériau photochromique, les mêmes images filtrées présentant des zones définies par des contours, puis les mêmes images comportant ces zones, après marquage des intérieurs desdites zones. - la
figure 7 illustre l'évolution de l'exposant de multifractalité en fonction du paramètre q pour différentes conditions de turbulence ; - la
figure 8 illustre le spectre de multifractalité f(α) appelé spectre de singularités pour différentes conditions de turbulence ; - la
figure 9 illustre l'évolution des positions maximales f(α)max en fonction d'indice de réfraction Cn ; - la
figure 10 illustre l'évolution de la fonction de lacunarité pour différentes conditions de turbulence ; - la
figure 11 illustre un premier exemple de dispositif utilisant le procédé de l'invention ; - la
figure 12 illustre un second exemple de dispositif utilisant le procédé de l'invention.
- the
figure 1 illustrates an exemplary device for validating the concept of the present invention; - the
Figures 2a and 2b illustrate networks inscribed in a film of photochromic material and the different corresponding diffraction images taken by a CCD camera; - the
figure 3 illustrates the principle of the Radon transform of an image of a diffraction grating inscribed in a film of photochromic material; - the
Figures 4a and4b illustrate the resulting images of the Radon transform of two examples of images illustrated infigure 2a ; - the
figures 5a and5b illustrate the peaks of intensity resulting from the processing of images illustrated infigure 4a and4b and representative of the degree of turbulence of the analyzed medium; - the
Figures 6a, 6b and 6c respectively illustrate images taken by AFM microscopy of a surface network inscribed in a film of photochromic material, the same filtered images having areas defined by contours, then the same images comprising these areas, after marking the interiors of said areas. - the
figure 7 illustrates the evolution of the multifractal exponent as a function of the q parameter for different turbulence conditions; - the
figure 8 illustrates the spectrum of multifractality f (α) called spectrum of singularities for different turbulence conditions; - the
figure 9 illustrates the evolution of the maximum positions f (α) max as a function of refractive index Cn; - the
figure 10 illustrates the evolution of the gap function for different turbulence conditions; - the
figure 11 illustrates a first example of a device using the method of the invention; - the
figure 12 illustrates a second example of a device using the method of the invention.
L'invention va être décrite dans le cadre d'un film d'azobenzène, mais peut tout aussi bien utiliser d'autres types de matériaux organiques photochromiques. L'effet utilisé dans la présente invention, correspond à un enregistrement holographique dans lequel les franges se construisent d'elles-mêmes durant le processus d'auto-organisation moléculaire et impriment une moyenne statistique sur le long terme de l'effet du milieu turbulent sur la propagation laser. Les matériaux holographiques organiques ont l'avantage par rapport à leurs équivalents inorganiques d'être structurellement polyvalents, facilement fabricables et peu coûteux.The invention will be described in the context of an azobenzene film, but may equally well use other types of photochromic organic materials. The effect used in the present invention corresponds to a holographic recording in which the fringes build themselves during the process of molecular self-organization and print a long-term statistical average of the effect of the turbulent medium. on laser propagation. Organic holographic materials have the advantage over their inorganic counterparts of being structurally versatile, easily fabricated and inexpensive.
Ce type de matériau photochromique, tel un matériau azopolymère, est capable de s'auto-organiser en surface sous l'effet de la lumière d'un laser pour produire une structuration sous forme d'un réseau de diffraction, permettant de mesurer simultanément plusieurs caractéristiques de ladite turbulence.This type of photochromic material, such as an azopolymeric material, is capable of self-organizing on the surface under the effect of the light of a laser to produce a pattern in the form of a diffraction grating, for simultaneously measuring several characteristics of said turbulence.
Les molécules d'azobenzène sont étudiées depuis plus d'un demi-siècle pour leurs propriétés optiques particulières et, encore de nos jours, des phénomènes nouveaux liés à leur photoisomérisation sont découverts. Parmi ces phénomènes, la déformation de matière photo-induite dans les matériaux photochromiques contenant ces molécules est sans doute l'un des plus remarquables. Des cycles successifs d'isomérisation de la molécule, peut résulter un déplacement de matière, sur des distances de plusieurs centaines de nanomètres. Les molécules de la famille des azobenzènes sont caractérisées par deux cycles benzéniques liés par une double liaison entre deux atomes d'azote. Elles peuvent exister sous deux formes isomères : la forme trans (ou E) et la forme cis (ou Z). La transition de la forme trans vers la forme cis est excitée par absorption d'un photon et la transition inverse de la forme cis vers la forme trans peut être soit excitée optiquement soit activée thermiquement.The molecules of azobenzene have been studied for more than half a century for their particular optical properties and, even today, new phenomena related to their photoisomerization are discovered. Among these phenomena, the deformation of photo-induced material in photochromic materials containing these molecules is undoubtedly one of the most remarkable. Successive cycles of isomerization of the molecule may result in material displacement over distances of several hundred nanometers. The molecules of the azobenzene family are characterized by two benzene rings linked by a double bond between two nitrogen atoms. They can exist in two isomeric forms: the trans (or E) form and the cis (or Z) form. The transition from the trans form to the cis form is excited by absorption of a photon and the reverse transition from the cis form to the trans form can be either optically excited or thermally activated.
Il a par ailleurs été montré que les molécules azo du matériau photoisomérisent en répétant des isomérisations trans-cis-trans induites par l'absorption de la lumière, de l'orientation moléculaire consécutive se faisant perpendiculairement à la direction de la polarisation de la lumière.It has also been shown that the azo molecules of the material photoisomerate by repeating trans-cis-trans isomerizations induced by the absorption of light, the subsequent molecular orientation being perpendicular to the direction of the polarization of light.
Cet effet peut être observé sur un film mince en polymère contenant des azobenzènes capables de fabriquer un réseau topographique sur la surface du film après exposition par une structure d'interférences créée par deux faisceaux laser.This effect can be observed on a polymer thin film containing azobenzenes capable of making a topographic network on the surface of the film after exposure by an interference structure created by two laser beams.
Cependant le Demandeur est parti du principe que cette structuration en surface peut se réaliser aussi avec un seul faisceau laser par auto-organisation des molécules azo où la direction du vecteur d'onde du réseau dépend de la polarisation du faisceau laser.However, the Applicant has assumed that this surface structure can also be achieved with a single laser beam by self-organization of the azo molecules where the direction of the grating vector of the grating depends on the polarization of the laser beam.
Les réseaux de surface peuvent ensuite être effacés par utilisation d'un faisceau laser avec une polarisation circulaire ou par traitement thermique.The surface networks can then be erased by using a laser beam with a circular polarization or by heat treatment.
Le Demandeur a validé le concept de la présente invention en réalisant des conditions de turbulences en milieu ambiant et en enregistrant les images du réseau de surface créé par un faisceau laser après propagation dudit faisceau dans le milieu ambiant perturbé par les turbulences créées, et ce afin de mettre en évidence la corrélation entre les turbulences et les modifications de structurations réalisées au niveau de la surface du film de matériau organique photochromique.The Applicant has validated the concept of the present invention by performing ambient turbulence conditions and recording the images of the surface grating created by a laser beam after propagation of said beam in the ambient environment disturbed by the turbulence created, in order to highlight the correlation between the turbulences and the structural modifications made at the surface of the film of organic photochromic material.
Les paramètres du milieu turbulent nécessaire à l'évaluation de la présente invention ont d'abord été évalués. La turbulence produite est représentative d'une turbulence atmosphérique en conditions réelles. Le montage expérimental illustré en
Le flux d'air généré présente des vitesses v modifiées par une grille ayant des pas de largeurs différentes, lesdites vitesses étant comprises entre 12.5 m/s et 7.6 m/s.The air flow generated presents velocities v modified by a grid having steps of different widths, said speeds being between 12.5 m / s and 7.6 m / s.
Les intensités et les angles d'arrivée du faisceau F1 ont été évalués en deux étapes successives.The intensities and the angles of arrival of the beam F 1 were evaluated in two successive stages.
On utilise pour cela une caméra CCD 3, pour mesurer l'intensité totale de la distribution de lumière détectée et les coordonnées x et y du centre du faisceau, après passage en transmission du film de matériau photochromique 2. La surface du détecteur est de 8.4 mm x 6.2 mm. Les images peuvent être enregistrées et traitées via une unité 4.
- 1) Les angles d'arrivée sont obtenus en mesurant les déplacements latéraux du faisceau sur la caméra par comparaison avec un faisceau de référence sans turbulence. Les angles sont comptés entre un diaphragme et une position du faisceau sur la caméra. La distance entre le diaphragme et la caméra est une zone de propagation non turbulente et est suffisante pour une bonne résolution de la mesure de déplacement.
Les valeurs des angles d'arrivée sont données par :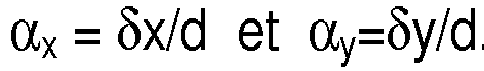
Le Demandeur a mesuré l'angle d'arrivée pour différentes conditions de turbulence.
On se place dans la limite d'approximation de l'optique géométrique pour L « /o 2/λ où /o est l'échelle intérieure de la turbulence et λ la longueur d'onde du faisceau laser.
La valeur efficace des fluctuations de l'angle d'arrivée est donnée par :
L. C. Andrews, 'Field guide to Atmospheric Optics', SPIE press book, (2004 - 2) Les fluctuations d'intensité du faisceau sont mesurées au cours du temps avec une photodiode et sont définies par :


- 1) The angles of arrival are obtained by measuring the lateral displacements of the beam on the camera compared to a reference beam without turbulence. Angles are counted between a diaphragm and a beam position on the camera. The distance between the diaphragm and the camera is a non-turbulent propagation zone and is sufficient for a good resolution of the displacement measurement.
The values of the angles of arrival are given by:
The Applicant measured the angle of arrival for different turbulence conditions.
We place ourselves within the approximation limit of geometrical optics for L "/ o 2 / λ where / o is the internal scale of the turbulence and λ is the wavelength of the laser beam.
The effective value of the fluctuations of the angle of arrival is given by:LC Andrews, 'Field Guide to Atmospheric Optics', SPIE Press Book, (2004 - 2) Beam intensity fluctuations are measured over time with a photodiode and are defined by:
Les échantillons des films en polymère sont faits à partir d'une synthèse d'un nouveau monomère chromophorique dérivé d'azobenzène contenant des composés sulfonamide hétérocyclique. Le monomère de type methacrylate contient des espaceurs aliphatiques de différentes longueurs entre les groupes méthacrycliques et chromophoriques. Les monomères en question sont polymérisés pour obtenir des homopolymères et copolymérisés avec du 2-methylacrylate et du 2-ethylhexyl acrylate pour obtenir des copolymères contenant plusieurs pourcentages d'unités chromophoriques.The samples of the polymer films are made from a synthesis of a novel azobenzene-derived chromophoric monomer containing heterocyclic sulfonamide compounds. The methacrylate monomer contains aliphatic spacers of different lengths between the methacrylic and chromophoric groups. The monomers in question are polymerized to obtain homopolymers and copolymerized with 2-methylacrylate and 2-ethylhexyl acrylate to obtain copolymers containing several percentages of chromophoric units.
Les films minces sont préparés par dépôt à la tournette à partir d'une solution diluée avec du THF et une concentration de 50 mg/ml. L'épaisseur du film mesurée avec un profileur dektak-6M est de 1 µm.The thin films are prepared by spin coating from a solution diluted with THF and a concentration of 50 mg / ml. The thickness of the film measured with a dektak-6M profiler is 1 μm.
L'absorbance maximale à λ = 488 nm est de 1.9. L'absorbance à la longueur d'onde d'expérience λ = 476 nm est de 1.6.The maximum absorbance at λ = 488 nm is 1.9. The absorbance at the experiment wavelength λ = 476 nm is 1.6.
Le faisceau laser est d'abord rendu parallèle par un système afocal de deux lentilles (Kepler). Le diamètre du faisceau est de 5.1 mm. Un diaphragme permet de choisir la région centrale du front d'onde et de générer une onde quasi-plane de diamètre 3.1 mm. Le diamètre du diaphragme est choisi pour sélectionner une région du faisceau laser comme le meilleur compromis entre une région du front d'onde plane et un signal d'intensité permettant une valeur raisonnable du ratio signal sur bruit.The laser beam is first made parallel by an afocal system of two lenses (Kepler). The diameter of the beam is 5.1 mm. A diaphragm makes it possible to choose the central region of the wavefront and to generate a quasi-plane wave with a diameter of 3.1 mm. The diameter of the diaphragm is chosen to select a region of the laser beam as the best compromise between a region of the plane wavefront and an intensity signal allowing a reasonable value of the signal-to-noise ratio.
Le faisceau laser passe dans le milieu turbulent sur une distance de 1 m et est envoyé sur le film mince d'azopolymère 2, de la présente invention avec une puissance entre 100 et 300 mW/cm2.The laser beam passes into the turbulent medium over a distance of 1 m and is fed onto the azopolymer
Un système optique permet de collecter l'intensité de l'ordre de diffraction et de contrôler dans le temps le déroulement de l'inscription holographique. Lorsque l'intensité de diffraction arrive à saturation, le faisceau laser est coupé et la surface du film mince sur lequel le processus est inscrit est caractérisé par imagerie, plusieurs types d'imagerie pouvant être employés.An optical system makes it possible to collect the intensity of the diffraction order and to control over time the unfolding of the holographic inscription. When the diffraction intensity reaches saturation, the laser beam is cut off and the surface of the thin film on which the process is inscribed is characterized by imaging, several types of imaging may be employed.
Les expériences ont été menées pour quatre exemples de conditions de turbulence croissante T1, T2, T3 et T4, générant des topographies de surface différentes, mais dans lesquelles, la surface s'autoorganise sous l'effet du laser pour créer un réseau de diffraction.The experiments were conducted for four examples of increasing turbulence conditions T1, T2, T3 and T4, generating different surface topographies, but in which the surface self-organizes under the effect of the laser to create a diffraction grating.
On observe avec une caméra de type CCD, la diffraction de la structure auto-organisée créée en surface et obtenue par le faisceau lui-même. Elle permet de suivre au cours du temps la construction de la structure en surface. Pour un faisceau se propageant sans turbulence le réseau forme un alignement régulier de striures à la surface avec un pas du réseau A = 2λ/sinθ où θ = 90° pour une incidence du faisceau de 90°.With a CCD camera, the diffraction of the self-organized structure created on the surface and obtained by the beam itself is observed. It allows to follow over time the construction of the surface structure. For a beam propagating without turbulence, the grating forms a regular alignment of striations on the surface with a pitch of the grating A = 2λ / sinθ where θ = 90 ° for a beam angle of 90 °.
Les
L'écartement des spots donne la fréquence spatiale du réseau auto-organisé présent sur la surface de l'échantillon. L'évolution de cette figure de diffraction suit une loi de puissance dans le temps jusqu'à saturation du phénomène et dépend de la puissance du faisceau laser. Le changement des conditions de propagation du faisceau laser induit des fréquences spatiales additionnelles perturbant la régularité du pas du faisceau. Ces fréquences additionnelles se repèrent par l'apparition d'intensités en dehors des deux spots. L'information spatiale sur la direction des vecteurs d'onde des fréquences spatiales additionnelles est donnée par leurs coordonnées X et Y par rapport aux deux spots et par la surface des intensités. Une surface importante caractérise une diffusion importante des fréquences spatiales et donc une plus grande turbulence.The spacing of the spots gives the spatial frequency of the self-organized network present on the surface of the sample. The evolution of this diffraction pattern follows a power law in time until saturation of the phenomenon and depends on the power of the laser beam. The change in the propagation conditions of the laser beam induces additional spatial frequencies disturbing the regularity of the pitch of the beam. These additional frequencies are identified by the appearance of intensities outside the two spots. The spatial information on the direction of the additional spatial frequency wave vectors is given by their X and Y coordinates with respect to the two spots and by the intensities surface. An important surface characterizes a significant diffusion of the spatial frequencies and thus a greater turbulence.
Avec la modification du milieu de propagation des fréquences additionnelles se créent au centre et en dehors des deux spots correspondant au réseau auto-organisé de référence. Ces fréquences spatiales sont plus basses impliquant une variation de la surface sur de grande distance et correspondent à la création de larges structures. L'apparition de fréquences sur le profil des intensités de diffraction en dehors des deux spots implique la création de sous-réseaux aux fréquences plus grandes que le réseau principal.With the modification of the propagation medium additional frequencies are created in the center and outside the two spots corresponding to the self-organized reference network. These spatial frequencies are lower involving a variation of the surface over a long distance and correspond to the creation of large structures. The appearance of frequencies on the profile of the diffraction intensities outside the two spots implies the creation of sub-networks at frequencies greater than the main network.
La
En monitorant la diffraction créée, on peut suivre l'évolution des sous-réseaux créés ainsi que des zones non-uniformes qui apparaissent.By monitoring the diffraction created, we can follow the evolution of the subnetworks created as well as non-uniform areas that appear.
La variation de polarisation induite par la turbulence est mesurée par la direction horizontale des deux spots de diffraction. Le faisceau laser a une polarisation linéaire et horizontale représentée par les deux spots de diffraction sur un plan horizontal.The polarization variation induced by the turbulence is measured by the horizontal direction of the two diffraction spots. The laser beam has a linear and horizontal polarization represented by the two diffraction spots on a horizontal plane.
Par exemple, la composante linéaire de polarisation change d'un angle θ = 7.1 ° pour l'exemple de la turbulence T4.For example, the linear polarization component changes by an angle θ = 7.1 ° for the example of turbulence T4.
Avantageusement, les images de diffraction peuvent être analysées par la transformée de Radon, le calcul effectif de la transformée de Radon discrète impliquant numériquement des interpolations de l'image à traiter, afin de l'estimer dans un repère en rotation, comme illustré en
Pour cela, on calcule la projection de l'image le long d'angles donnés. Le résultat est la somme des intensités des pixels dans chaque direction, c'est-à-dire l'intégrale de chacune des lignes. On obtient une nouvelle image R(ρ,θ) et on fait une coupe pour t = 0°. On obtient par exemple les images dérivées des
Les représentations de l'intensité en fonction de l'angle θ telles qu'illustrées en
On caractérise le réseau inscrit par microscopie à force atomique en mode contact. La
Pour une faible condition de turbulence, la surface présente un réseau auto-organisé dont le pas du réseau A = 800 ± 30 nm est perturbé par les fluctuations aléatoires de l'angle d'arrivée du faisceau. Le pas du réseau donné par la théorie de la diffraction du second ordre correspond à la condition d'angle du faisceau incident A = 2λ/ sinθ.For a weak turbulence condition, the surface presents a self-organized network whose pitch of the grating A = 800 ± 30 nm is disturbed by the random fluctuations of the angle of arrival of the beam. The grating pitch given by the second order diffraction theory corresponds to the angle condition of the incident beam A = 2λ / sinθ.
On remarque que certaines zones de la structure en surface ont une structuration réduite. On considère les topographies obtenues pour différentes conditions de turbulence comme des surfaces gaussiennes aléatoires.It is noted that some areas of the surface structure have a reduced structure. Topographies obtained for different turbulence conditions are considered as random Gaussian surfaces.
Les structurations observées sont d'abord traitées par un algorithme de la présente invention pour reconnaître, quantifier et analyser les sous-zones en surface modifiées par la turbulence.The observed structures are first processed by an algorithm of the present invention to recognize, quantify and analyze the turbulence-modified surface sub-areas.
On applique ensuite des techniques d'analyse fractales et multifractales pour retrouver les propriétés d'invariance d'échelles sur l'ensemble des sous-zones perturbées applicables à la mesure de l'effet de turbulence sur un faisceau laser.Fractal and multifractal analysis techniques are then used to recover the scale invariance properties of all disturbed sub-zones applicable to the measurement of the turbulence effect on a laser beam.
Ces techniques permettent d'avoir une description précise de la complexité des sous-zones désorganisées.These techniques make it possible to have a precise description of the complexity of the disorganized sub-zones.
Plus précisément, l'image est en premier lieu intégrée. On utilise pour cela un filtre passe-bas gaussien qui a pour but d'atténuer les hautes fréquences spatiales. Le filtre moyenne chacun des points avec ses voisins. Il a pour effet de supprimer les hautes fréquences et d'augmenter le signal de basse fréquence. Dans le cas présent, le filtre permet de réduire le contraste des zones où il y a absence de réseau et permet de marquer les zones où le réseau a disparu à cause de la perturbation sur le laser qui crée le réseau par la turbulence.More precisely, the image is first and foremost integrated. For this purpose, a Gaussian low-pass filter is used to attenuate the high spatial frequencies. The average filter each points with its neighbors. It has the effect of suppressing high frequencies and increasing the low frequency signal. In the present case, the filter makes it possible to reduce the contrast of the zones where there is no network and makes it possible to mark the zones where the network has disappeared because of the perturbation on the laser which creates the network by the turbulence.
Cette opération revient à dessiner les contours de ces surfaces gaussiennes en seuillant la hauteur de la topographie avec un espacement fixe Δ entre la hauteur des contours successifs pour obtenir que les sous-zones ne contenant pas de structurations périodiques, comme illustré en ![]()
![]()
Ces contours sont ensuite remplis, comme illustré en
A partir de l'image comportant des zones définis par des contours (tels qu'illustrés en
L'image est divisée en boîtes d'égales longueurs s. Dans chacune de ces boîtes de longueur s, une ligne de moindres carrés est utilisée pour ajuster la boîte aux données (représentant la tendance dans la boîte).The image is divided into boxes of equal length s. In each of these boxes of length s, a line of least squares is used to adjust the box to the data (representing the trend in the box).
Les coordonnées x et y des segments de lignes sont calculés.The x and y coordinates of the line segments are calculated.
Les tendances des fluctuations sont supprimées de l'image en soustrayant la tendance locale.Fluctuation trends are removed from the image by subtracting the local trend.
La valeur efficace des fluctuations de l'image sont alors calculées. Le calcul est répété pour toutes les longueurs des boîtes pour caractériser les fluctuations locales en fonction de la taille des boîtes.The effective value of the fluctuations of the image are then calculated. The calculation is repeated for all the lengths of the boxes to characterize the local fluctuations according to the size of the boxes.
Plus précisément, la première étape consiste à diviser les profils en x et y de l'image en Ns=[N/s] segments disjoints respectivement et calculer la somme cumulative X(i) et Y(i) telle que : ![]()
![]()
Dans chaque segment de dimension s, on approxime (« fit ») les séries du signal intégré en utilisant une fonction polynomiale pv(i) pour {xi} et qv(i) pour {yi}.In each segment of dimension s, we "fit" the series of the integrated signal by using a polynomial function p v (i) for {x i } and q v (i) for {y i }.
On calcule la fonction de fluctuation dépouillée des tendances en soustrayant la tendance locale dans chaque boîte et on calcule la fluctuation du moment de la racine qième : 

Une relation de loi de puissance entre la fonction Fq(s) et la taille de la boîte s indique la présence d'échelle. On obtient de cette manière les exposants de Hurst généralisés : τ (q). Ils sont liés aux différents niveaux d'amplification des petites fluctuations dans les données.A power law relationship between the function F q (s) and the size of the box s indicates the presence of scale. In this way we obtain the generalized Hurst exponents: τ (q). They are related to different levels of amplification of small fluctuations in the data.
La dépendance de τ (q) est une fonction monotone décroissance de q pour un signal stationnaire et reflète de façon simple le fait que les faibles fluctuations surviennent plus souvent dans le signal que les plus grosses. ![]()
![]()
La
Pour les variations positives de q, h(q) décrit le comportement d'échelle des boîtes avec de larges fluctuations.For positive variations of q, h (q) describes the scale behavior of boxes with large fluctuations.
Pour une forte turbulence la présente invention permet de constater un exposant d'échelle important pour les larges fluctuations. Au contraire pour les valeurs de q négatives, h(q) décrit le comportement d'échelle des segments avec de petites fluctuations.For high turbulence, the present invention makes it possible to observe a large scale exponent for large fluctuations. On the contrary, for negative q values, h (q) describes the scale behavior of segments with small fluctuations.
On voit que la turbulence T1 induit peu de comportement d'échelle pour les faibles fluctuations. La tendance est inversée pour les autres conditions de turbulence.It can be seen that T1 turbulence induces little scale behavior for small fluctuations. The trend is reversed for other turbulence conditions.
On remarque qu'en réduisant la turbulence (turbulence T4), le signal devient de plus en plus monofractal.Note that by reducing turbulence (turbulence T4), the signal becomes more and more monofractal.
On peut utiliser la fonction des singularités obtenue par une transformée de Legendre : ![]()
![]()
On peut aussi utiliser un spectre de multifractalité : ![]()
![]()
Cette dernière approche donne une représentation utile de la multifractalité.This last approach gives a useful representation of multifractality.
La largeur des spectres f(α) mesure le niveau de multifractalité du signal. Plus la largeur est importante plus le signal est multifractal. La
Le maximum de la fonction f(α) en fonction de α est tracé en
La valeur de Cn peut être évaluée en fonction du maximum de f(α).The value of C n can be evaluated according to the maximum of f (α).
La largeur de f(α) à f = 0.9, caractérise le nombre de singularités multifractales c'est-à-dire que le signal a de multiples lois d'échelles et est fortement perturbé. Les largeurs sont très différentes en fonction de la turbulence et permettent de voir qu'avec une turbulence élevée le signal contient plus de fluctuations multifractales.The width of f (α) at f = 0.9, characterizes the number of multifractal singularities that is to say that the signal has multiple scales laws and is strongly disturbed. The widths are very different depending on the turbulence and can be seen that with high turbulence the signal contains more multifractal fluctuations.
Cette dernière mesure caractérise l'évolution des sous-structures en surface de l'azopolymère qui deviennent moins régulière avec l'augmentation de la turbulence. La valeur de f(α) est liée à Cn par la relation
- maxHdff = -0.8.Cn +0.8 pour une faible turbulence et
- maxHdff = -0.23 .Cn +0.26 pour une forte turbulence.
- avec f(α)max = maxHdff.
- maxHdff = -0.8.C n +0.8 for low turbulence and
- maxHdff = -0.23 .C n +0.26 for strong turbulence.
- with f (α) max = maxHdff.
La
Le procédé de la présente invention permet également de calculer la lacunarité qui évalue l'homogénéité de la répartition des intensités lumineuses et donc de savoir comment l'objet rempli l'espace.The method of the present invention also makes it possible to calculate the gap that evaluates the homogeneity of the distribution of the light intensities and thus to know how the object fills the space.
L'étude de la lacunarité permet de mesurer la distribution de trous dans l'image : si celle- ci comporte de grands contrastes (à l'échelle), alors la lacunarité de l'image sera élevée. A l'inverse, si l'image est homogène, alors sa lacunarité sera faible.The study of lacunarity makes it possible to measure the distribution of holes in the image: if it contains large contrasts (on the scale), then the lacunarity of the image will be high. Conversely, if the image is homogeneous, then its gap will be small.
La lacunarité est mesurée en utilisant un algorithme de boîte glissante.Lacunarity is measured using a sliding box algorithm.
L'algorithme utilise une boîte de taille s x s avec s sa largeur placée au coin supérieur gauche de l'image. Le nombre de pixels du signal dans la boîte est compté.The algorithm uses a box of size s x s with its width placed in the upper left corner of the image. The number of pixels of the signal in the box is counted.
La boîte est glissée d'un pixel sur la droite et le nombre de pixels dans la boîte est compté ainsi de suite. Le processus est répété jusqu'à ce que la boîte atteigne le coin inférieur droit de l'image.The box is dragged one pixel to the right and the number of pixels in the box is counted so on. The process is repeated until the box reaches the lower right corner of the image.
Si λ est la taille de l'image le nombre de boîtes de largeur s estIf λ is the size of the image, the number of boxes of width s is
N(s) = (λ-s+l)2. La largeur s de la boîte est choisie de telle sorte que la valeur numérique est égale à 2, 4, 8, ..., /.N (s) = (λ-s + 1) 2 . The width s of the box is chosen so that the numerical value is equal to 2, 4, 8, ..., /.
Pour chaque boîte de largeur s, les deux quantités suivantes sont mesurées : la somme du nombre de pixels du signal dans chaque boîte
Q1 = ∑i p (i, s) et la somme quadratique Q1 = ∑i p (i, s) 2 For each box of width s, the following two quantities are measured: the sum of the number of pixels of the signal in each box
Q 1 = Σi p (i, s) and the quadratic sum Q 1 = Σi p (i, s) 2
La lacunarité L(s) pour une taille de boîte est définie par :
N(s). Q2/Q1 2 Lacunarity L (s) for a box size is defined by:
N (s). Q 2 / Q 1 2
p(i, λ) est le nombre de pixels du signal dans la iieme boîte et i est compris entre 1 et N(s).p (i, λ) is the number of pixels of the signal in the ith box and i is between 1 and N (s).
La fonction de lacunarité est évaluée à partir des mesures de la
- L(s)= b/sa + c, où b est relatif à la concavité de l'hyperbole.
- L (s) = b / s a + c, where b is relative to the concavity of the hyperbola.
Une faible valeur de b donne une hyperbole avec une large concavité (forte concavité). Une faible valeur de b décrit un objet avec une forte distribution d'interstices vides.A low value of b gives a hyperbole with a broad concavity (strong concavity). A low value of b describes an object with a large distribution of empty gaps.
La
La courbure de l'hyperbole devient de plus en plus forte au fur et à mesure que la turbulence diminue impliquant un plus grand espace entre les zones foncées des images de la
Selon un premier exemple de dispositif représenté en
Selon un second exemple de l'invention, le dispositif peut comprendre un ensemble d'unités 10, 11,..., 1 N reliées à un dispositif de traitement central 60 et permettant de collecter différentes informations de turbulences en différents endroits via le centre de traitement 60.According to a second example of the invention, the device may comprise a set of
Claims (9)
- A method for assessing turbulence parameters of an environment comprising the following steps:- illuminating, by a laser beam propagating inside said environment, a film of photochromic organic material that can comprise azobenzene or spyropyrane or stylbene or coumarin or fulgide molecules, said illumination creating a surface grating in said film that comprises scores, the deformations of which are a function of the turbulence parameters;- a step of acquiting images comprising more or less reduced elementary areas of structures linked to said scores and representing turbulence parameters of said environment;- a step of processing said images that allows the turbulence parameters of said environment to be assessed.
- The method for assessing turbulence parameters according to claim 1, characterised in that it comprises a step of acquiring diffraction images of the laser beam via the created surface grating, said images having diffraction spots, the characteristics of which are dependent on the turbulence parameters.
- The method for assessing turbulence parameters according to claim 2, characterised in that the step of processing said images comprises:- a Radon transform operation of said images so as to generate derived images by computing images in a rotating reference frame generating, from diffraction areas belonging to said images, a set of peaks belonging to the derived images;- comparing said set of peaks with a set of reference peaks of turbulence conditions, so as to estimate the level of turbulence of said environment.
- The method for assessing turbulence parameters according to claim 1, characterised in that it comprises:- a step of acquiring images taken by AFM microscopy;- a step of processing said images that allows the elementary areas formed on the surface and being dependent on the turbulence parameters to be recognised, quantified and analysed, and that allows derived images to be obtained;- a step of analysing said derived images by fractal or multifractal analysis over all of said elementary areas, allowing scale invariance properties to be defined and the turbulence information of said environment to be determined.
- The method for assessing turbulence parameters according to claim 4, characterised in that the step of processing said images comprises the following operations:- using a Gaussian filter, averaging each of the acquisition points with neighbouring points and generating filtered images;- constructing a set of derived images by processing said filtered images, which can be carried out by transforming said filtered images into binary filtered images, then marking areas that are devoid of scores, so as to increase the contrast between said elementary areas.
- The method for assessing turbulence parameters according to claim 5, characterised in that the step of fractal or multifractal analysis comprises the following steps:- dividing said image along two dimensions x and y into segments N/s, defining a box partition, with N being a dimension of the image, and computing two cumulative sums X(i) and Y(i) defining a signal, such that:
 - estimating, in each of the boxes, a surface defined by two polynomial functions (pv(i), qv(i)) in the two dimensions, allowing said signal to be approximated and allowing a trend to be defined in each of the boxes and the variations to be defined relative to said trend, so as to define the following parameters: Xs(i) = X(i) - pv(i) and Ys(i) = Y(i) - qv(i);- computing a fluctuation function devoid of said trends defined by the following equation:
 - determining a singularity function α(q) = d τ(q)/dq and a multifractal spectrum: f(α) = q(α). α - s[q(α)] having a maximum value f(α)max;- comparing the value f(α)max with a calibration table referencing values f(α)max st with refraction indices Cn and allowing the refraction index Cn to be linked to a reference turbulence parameter.
 - A device for assessing turbulence parameters of an environment comprising:- a measurement unit comprising:∘ a film of photochromic organic material that can comprise azobenzene or spyropyrane or stylbene or coumarin or fulgide molecules;∘ a laser source emitting a laser beam propagating inside said environment and interacting with said film so as to create a surface grating comprising scores, the deformations of which are a function of the turbulence parameters;∘ a detector allowing images to be acquired that comprise more or less reduced elementary areas of structures linked to said scores and representing turbulence parameters of said environment and generating signals relating to said images;- a device for receiving and processing said signals delivering information for assessing turbulence parameters of said environment.
- A device for assessing turbulence parameters of an environment according to claim 7, characterised in that it comprises a set of measurement units, said measurement units being linked to said receiving and processing device.
- The use of the device for assessing turbulence parameters of an ambient environment according to any one of claims 7 or 8 for currying out measurements of air movements, in an urban environment, for example.
Applications Claiming Priority (2)
| Application Number | Priority Date | Filing Date | Title |
|---|---|---|---|
| FR1260113A FR2997189B1 (en) | 2012-10-24 | 2012-10-24 | METHOD FOR DETECTION OF TURBULENCE CONDITIONS USING THE INTERACTION OF A LASER BEAM WITH A PHOTOCHROMIC THIN FILM AND DEVICE IMPLEMENTING SAID METHOD |
| PCT/EP2013/072186 WO2014064159A1 (en) | 2012-10-24 | 2013-10-23 | Method for detecting turbulence conditions, using the interaction of a laser beam with a thin photochromic film, and device for implementing said method |
Publications (2)
| Publication Number | Publication Date |
|---|---|
| EP2912475A1 EP2912475A1 (en) | 2015-09-02 |
| EP2912475B1 true EP2912475B1 (en) | 2016-09-07 |
Family
ID=47989072
Family Applications (1)
| Application Number | Title | Priority Date | Filing Date |
|---|---|---|---|
| EP13779888.0A Not-in-force EP2912475B1 (en) | 2012-10-24 | 2013-10-23 | Method for detecting turbulence conditions, using the interaction of a laser beam with a thin photochromic film, and device for implementing said method |
Country Status (8)
| Country | Link |
|---|---|
| US (1) | US9684011B2 (en) |
| EP (1) | EP2912475B1 (en) |
| CN (1) | CN104871008B (en) |
| BR (1) | BR112015009212A2 (en) |
| DK (1) | DK2912475T3 (en) |
| ES (1) | ES2611172T3 (en) |
| FR (1) | FR2997189B1 (en) |
| WO (1) | WO2014064159A1 (en) |
Families Citing this family (6)
| Publication number | Priority date | Publication date | Assignee | Title |
|---|---|---|---|---|
| US9228785B2 (en) | 2010-05-04 | 2016-01-05 | Alexander Poltorak | Fractal heat transfer device |
| US11530985B2 (en) * | 2015-08-19 | 2022-12-20 | Nanoscope Technologies, LLC | Cancer diagnosis by refractive index multifractality |
| US10830545B2 (en) | 2016-07-12 | 2020-11-10 | Fractal Heatsink Technologies, LLC | System and method for maintaining efficiency of a heat sink |
| US10733708B2 (en) | 2018-09-24 | 2020-08-04 | United States Of America As Represented By Secretary Of The Navy | Method for estimating turbulence using turbulence parameter as a focus parameter |
| US10929962B2 (en) | 2019-06-19 | 2021-02-23 | United States Of America As Represented By The Secretary Of The Navy | Imposing a priori knowledge to estimate turbulence |
| CN111765929B (en) * | 2020-06-22 | 2021-10-15 | 中国科学院西安光学精密机械研究所 | Filling pipeline flow image measuring method and device |
Family Cites Families (2)
| Publication number | Priority date | Publication date | Assignee | Title |
|---|---|---|---|---|
| US7241569B2 (en) * | 1993-01-18 | 2007-07-10 | Olympus Corporation | Method and a device for the evaluation of biopolymer fitness |
| US7268937B1 (en) * | 2005-05-27 | 2007-09-11 | United States Of America As Represented By The Secretary Of The Air Force | Holographic wavefront sensor |
-
2012
- 2012-10-24 FR FR1260113A patent/FR2997189B1/en active Active
-
2013
- 2013-10-23 WO PCT/EP2013/072186 patent/WO2014064159A1/en active Application Filing
- 2013-10-23 ES ES13779888.0T patent/ES2611172T3/en active Active
- 2013-10-23 DK DK13779888.0T patent/DK2912475T3/en active
- 2013-10-23 CN CN201380067659.2A patent/CN104871008B/en not_active Expired - Fee Related
- 2013-10-23 BR BR112015009212A patent/BR112015009212A2/en active Search and Examination
- 2013-10-23 EP EP13779888.0A patent/EP2912475B1/en not_active Not-in-force
- 2013-10-23 US US14/438,116 patent/US9684011B2/en active Active
Also Published As
| Publication number | Publication date |
|---|---|
| FR2997189A1 (en) | 2014-04-25 |
| DK2912475T3 (en) | 2017-01-02 |
| BR112015009212A2 (en) | 2017-07-04 |
| EP2912475A1 (en) | 2015-09-02 |
| CN104871008B (en) | 2017-09-29 |
| CN104871008A (en) | 2015-08-26 |
| US9684011B2 (en) | 2017-06-20 |
| FR2997189B1 (en) | 2015-01-02 |
| US20150293140A1 (en) | 2015-10-15 |
| WO2014064159A1 (en) | 2014-05-01 |
| ES2611172T3 (en) | 2017-05-05 |
Similar Documents
| Publication | Publication Date | Title |
|---|---|---|
| EP2912475B1 (en) | Method for detecting turbulence conditions, using the interaction of a laser beam with a thin photochromic film, and device for implementing said method | |
| EP3343201B1 (en) | Method and device for counting and characterising particles in a moving fluid | |
| US9947118B2 (en) | Non-interferometric phase measurement | |
| EP3274694B1 (en) | Method for determining the state of a cell | |
| Sprigg et al. | Super-resolution imaging using the spatial-frequency filtered intensity fluctuation correlation | |
| FR2880472A1 (en) | METHOD AND SYSTEM FOR DIFFUSOMETRY | |
| León-Rodríguez et al. | High topographical accuracy by optical shot noise reduction in digital holographic microscopy | |
| Kim et al. | Effect of particle number density in in-line digital holographic particle velocimetry | |
| Yu et al. | Phase coherent noise reduction in digital holographic microscopy based on adaptive total variation | |
| Xue et al. | Detection of microplastics based on spatial heterodyne Raman spectroscopy | |
| EP1157261A2 (en) | Method and device for analysing a highly dynamic wavefront | |
| CN103473742A (en) | Novel method for suppressing noise in reflective off-axis digital holographic reconstructive image | |
| WO2021037935A1 (en) | Method and device for the optical characterisation of particles | |
| Yao et al. | Measurement error analysis of Brillouin lidar system using F–P etalon and ICCD | |
| Denisov et al. | Method for certification monitoring of surface inhomogeneities of optics based on frequency analysis of the surface profile | |
| FR2825150A1 (en) | DEVICE FOR CHARACTERIZING OPTICAL NETWORKS AND METHOD FOR MANUFACTURING OPTICAL NETWORKS WITH A PRESET SPATIAL FREQUENCY | |
| Liu et al. | Quantitative evaluation of optical properties for defective 2D metamaterials based on diffraction imaging | |
| Wang et al. | SNR Enhancement for BOTDR With Spatial-Adaptive Image Denoising Method | |
| FR3100335A1 (en) | Method and device for optical characterization of particles | |
| FR3076618A1 (en) | METHOD AND SYSTEM FOR OPTICALLY INSPECTING A SUBSTRATE | |
| EP3617646B1 (en) | Method for measuring the line roughness of an array of lines by x-ray diffraction | |
| Ma et al. | Development of Digital Holographic Microscopy on an All-Optical Phase Shifter | |
| FR3100332A1 (en) | Method and device for optical characterization of particles | |
| Fu et al. | Uncertainty elimination in 2D shape reconstruction of irregular particles in Interferometric particle imaging | |
| Stoykova et al. | Compressed dynamic speckle sensing |
Legal Events
| Date | Code | Title | Description |
|---|---|---|---|
| PUAI | Public reference made under article 153(3) epc to a published international application that has entered the european phase |
Free format text: ORIGINAL CODE: 0009012 |
|
| 17P | Request for examination filed |
Effective date: 20150420 |
|
| AK | Designated contracting states |
Kind code of ref document: A1 Designated state(s): AL AT BE BG CH CY CZ DE DK EE ES FI FR GB GR HR HU IE IS IT LI LT LU LV MC MK MT NL NO PL PT RO RS SE SI SK SM TR |
|
| AX | Request for extension of the european patent |
Extension state: BA ME |
|
| DAX | Request for extension of the european patent (deleted) | ||
| RIC1 | Information provided on ipc code assigned before grant |
Ipc: G01P 5/00 20060101AFI20160203BHEP Ipc: G03H 1/00 20060101ALI20160203BHEP Ipc: G01P 5/26 20060101ALI20160203BHEP Ipc: G06T 3/00 20060101ALI20160203BHEP |
|
| GRAP | Despatch of communication of intention to grant a patent |
Free format text: ORIGINAL CODE: EPIDOSNIGR1 |
|
| RIN1 | Information on inventor provided before grant (corrected) |
Inventor name: BARILLE, REGIS |
|
| INTG | Intention to grant announced |
Effective date: 20160323 |
|
| RAP1 | Party data changed (applicant data changed or rights of an application transferred) |
Owner name: UNIVERSITE D'ANGERS Owner name: CENTRE NATIONAL DE LA RECHERCHE SCIENTIFIQUE Owner name: WROCLAW UNIVERSITY OF TECHNOLOGY |
|
| GRAS | Grant fee paid |
Free format text: ORIGINAL CODE: EPIDOSNIGR3 |
|
| GRAA | (expected) grant |
Free format text: ORIGINAL CODE: 0009210 |
|
| AK | Designated contracting states |
Kind code of ref document: B1 Designated state(s): AL AT BE BG CH CY CZ DE DK EE ES FI FR GB GR HR HU IE IS IT LI LT LU LV MC MK MT NL NO PL PT RO RS SE SI SK SM TR |
|
| REG | Reference to a national code |
Ref country code: GB Ref legal event code: FG4D Free format text: NOT ENGLISH |
|
| REG | Reference to a national code |
Ref country code: CH Ref legal event code: EP |
|
| REG | Reference to a national code |
Ref country code: IE Ref legal event code: FG4D Free format text: LANGUAGE OF EP DOCUMENT: FRENCH |
|
| REG | Reference to a national code |
Ref country code: AT Ref legal event code: REF Ref document number: 827327 Country of ref document: AT Kind code of ref document: T Effective date: 20161015 |
|
| REG | Reference to a national code |
Ref country code: DE Ref legal event code: R096 Ref document number: 602013011215 Country of ref document: DE |
|
| REG | Reference to a national code |
Ref country code: FR Ref legal event code: PLFP Year of fee payment: 4 |
|
| REG | Reference to a national code |
Ref country code: SE Ref legal event code: TRGR |
|
| REG | Reference to a national code |
Ref country code: DK Ref legal event code: T3 Effective date: 20161220 |
|
| REG | Reference to a national code |
Ref country code: LT Ref legal event code: MG4D |
|
| REG | Reference to a national code |
Ref country code: NL Ref legal event code: MP Effective date: 20160907 |
|
| PG25 | Lapsed in a contracting state [announced via postgrant information from national office to epo] |
Ref country code: NO Free format text: LAPSE BECAUSE OF FAILURE TO SUBMIT A TRANSLATION OF THE DESCRIPTION OR TO PAY THE FEE WITHIN THE PRESCRIBED TIME-LIMIT Effective date: 20161207 Ref country code: RS Free format text: LAPSE BECAUSE OF FAILURE TO SUBMIT A TRANSLATION OF THE DESCRIPTION OR TO PAY THE FEE WITHIN THE PRESCRIBED TIME-LIMIT Effective date: 20160907 Ref country code: HR Free format text: LAPSE BECAUSE OF FAILURE TO SUBMIT A TRANSLATION OF THE DESCRIPTION OR TO PAY THE FEE WITHIN THE PRESCRIBED TIME-LIMIT Effective date: 20160907 Ref country code: FI Free format text: LAPSE BECAUSE OF FAILURE TO SUBMIT A TRANSLATION OF THE DESCRIPTION OR TO PAY THE FEE WITHIN THE PRESCRIBED TIME-LIMIT Effective date: 20160907 Ref country code: LT Free format text: LAPSE BECAUSE OF FAILURE TO SUBMIT A TRANSLATION OF THE DESCRIPTION OR TO PAY THE FEE WITHIN THE PRESCRIBED TIME-LIMIT Effective date: 20160907 |
|
| REG | Reference to a national code |
Ref country code: AT Ref legal event code: MK05 Ref document number: 827327 Country of ref document: AT Kind code of ref document: T Effective date: 20160907 |
|
| PG25 | Lapsed in a contracting state [announced via postgrant information from national office to epo] |
Ref country code: BE Free format text: LAPSE BECAUSE OF NON-PAYMENT OF DUE FEES Effective date: 20161031 Ref country code: NL Free format text: LAPSE BECAUSE OF FAILURE TO SUBMIT A TRANSLATION OF THE DESCRIPTION OR TO PAY THE FEE WITHIN THE PRESCRIBED TIME-LIMIT Effective date: 20160907 Ref country code: GR Free format text: LAPSE BECAUSE OF FAILURE TO SUBMIT A TRANSLATION OF THE DESCRIPTION OR TO PAY THE FEE WITHIN THE PRESCRIBED TIME-LIMIT Effective date: 20161208 Ref country code: LV Free format text: LAPSE BECAUSE OF FAILURE TO SUBMIT A TRANSLATION OF THE DESCRIPTION OR TO PAY THE FEE WITHIN THE PRESCRIBED TIME-LIMIT Effective date: 20160907 |
|
| PG25 | Lapsed in a contracting state [announced via postgrant information from national office to epo] |
Ref country code: EE Free format text: LAPSE BECAUSE OF FAILURE TO SUBMIT A TRANSLATION OF THE DESCRIPTION OR TO PAY THE FEE WITHIN THE PRESCRIBED TIME-LIMIT Effective date: 20160907 Ref country code: RO Free format text: LAPSE BECAUSE OF FAILURE TO SUBMIT A TRANSLATION OF THE DESCRIPTION OR TO PAY THE FEE WITHIN THE PRESCRIBED TIME-LIMIT Effective date: 20160907 |
|
| REG | Reference to a national code |
Ref country code: ES Ref legal event code: FG2A Ref document number: 2611172 Country of ref document: ES Kind code of ref document: T3 Effective date: 20170505 |
|
| PG25 | Lapsed in a contracting state [announced via postgrant information from national office to epo] |
Ref country code: AT Free format text: LAPSE BECAUSE OF FAILURE TO SUBMIT A TRANSLATION OF THE DESCRIPTION OR TO PAY THE FEE WITHIN THE PRESCRIBED TIME-LIMIT Effective date: 20160907 Ref country code: IS Free format text: LAPSE BECAUSE OF FAILURE TO SUBMIT A TRANSLATION OF THE DESCRIPTION OR TO PAY THE FEE WITHIN THE PRESCRIBED TIME-LIMIT Effective date: 20170107 Ref country code: SM Free format text: LAPSE BECAUSE OF FAILURE TO SUBMIT A TRANSLATION OF THE DESCRIPTION OR TO PAY THE FEE WITHIN THE PRESCRIBED TIME-LIMIT Effective date: 20160907 Ref country code: PT Free format text: LAPSE BECAUSE OF FAILURE TO SUBMIT A TRANSLATION OF THE DESCRIPTION OR TO PAY THE FEE WITHIN THE PRESCRIBED TIME-LIMIT Effective date: 20170109 Ref country code: PL Free format text: LAPSE BECAUSE OF FAILURE TO SUBMIT A TRANSLATION OF THE DESCRIPTION OR TO PAY THE FEE WITHIN THE PRESCRIBED TIME-LIMIT Effective date: 20160907 Ref country code: CZ Free format text: LAPSE BECAUSE OF FAILURE TO SUBMIT A TRANSLATION OF THE DESCRIPTION OR TO PAY THE FEE WITHIN THE PRESCRIBED TIME-LIMIT Effective date: 20160907 Ref country code: BG Free format text: LAPSE BECAUSE OF FAILURE TO SUBMIT A TRANSLATION OF THE DESCRIPTION OR TO PAY THE FEE WITHIN THE PRESCRIBED TIME-LIMIT Effective date: 20161207 Ref country code: SK Free format text: LAPSE BECAUSE OF FAILURE TO SUBMIT A TRANSLATION OF THE DESCRIPTION OR TO PAY THE FEE WITHIN THE PRESCRIBED TIME-LIMIT Effective date: 20160907 |
|
| REG | Reference to a national code |
Ref country code: CH Ref legal event code: PL |
|
| REG | Reference to a national code |
Ref country code: DE Ref legal event code: R097 Ref document number: 602013011215 Country of ref document: DE |
|
| PLBE | No opposition filed within time limit |
Free format text: ORIGINAL CODE: 0009261 |
|
| STAA | Information on the status of an ep patent application or granted ep patent |
Free format text: STATUS: NO OPPOSITION FILED WITHIN TIME LIMIT |
|
| REG | Reference to a national code |
Ref country code: IE Ref legal event code: MM4A |
|
| PG25 | Lapsed in a contracting state [announced via postgrant information from national office to epo] |
Ref country code: CH Free format text: LAPSE BECAUSE OF NON-PAYMENT OF DUE FEES Effective date: 20161031 Ref country code: LI Free format text: LAPSE BECAUSE OF NON-PAYMENT OF DUE FEES Effective date: 20161031 |
|
| 26N | No opposition filed |
Effective date: 20170608 |
|
| PG25 | Lapsed in a contracting state [announced via postgrant information from national office to epo] |
Ref country code: SI Free format text: LAPSE BECAUSE OF FAILURE TO SUBMIT A TRANSLATION OF THE DESCRIPTION OR TO PAY THE FEE WITHIN THE PRESCRIBED TIME-LIMIT Effective date: 20160907 Ref country code: LU Free format text: LAPSE BECAUSE OF NON-PAYMENT OF DUE FEES Effective date: 20161023 |
|
| REG | Reference to a national code |
Ref country code: FR Ref legal event code: PLFP Year of fee payment: 5 |
|
| PG25 | Lapsed in a contracting state [announced via postgrant information from national office to epo] |
Ref country code: IE Free format text: LAPSE BECAUSE OF NON-PAYMENT OF DUE FEES Effective date: 20161023 |
|
| REG | Reference to a national code |
Ref country code: BE Ref legal event code: MM Effective date: 20161031 |
|
| PG25 | Lapsed in a contracting state [announced via postgrant information from national office to epo] |
Ref country code: HU Free format text: LAPSE BECAUSE OF FAILURE TO SUBMIT A TRANSLATION OF THE DESCRIPTION OR TO PAY THE FEE WITHIN THE PRESCRIBED TIME-LIMIT; INVALID AB INITIO Effective date: 20131023 |
|
| PG25 | Lapsed in a contracting state [announced via postgrant information from national office to epo] |
Ref country code: MK Free format text: LAPSE BECAUSE OF FAILURE TO SUBMIT A TRANSLATION OF THE DESCRIPTION OR TO PAY THE FEE WITHIN THE PRESCRIBED TIME-LIMIT Effective date: 20160907 Ref country code: MT Free format text: LAPSE BECAUSE OF FAILURE TO SUBMIT A TRANSLATION OF THE DESCRIPTION OR TO PAY THE FEE WITHIN THE PRESCRIBED TIME-LIMIT Effective date: 20160907 Ref country code: MC Free format text: LAPSE BECAUSE OF FAILURE TO SUBMIT A TRANSLATION OF THE DESCRIPTION OR TO PAY THE FEE WITHIN THE PRESCRIBED TIME-LIMIT Effective date: 20160907 Ref country code: CY Free format text: LAPSE BECAUSE OF FAILURE TO SUBMIT A TRANSLATION OF THE DESCRIPTION OR TO PAY THE FEE WITHIN THE PRESCRIBED TIME-LIMIT Effective date: 20160907 |
|
| REG | Reference to a national code |
Ref country code: FR Ref legal event code: PLFP Year of fee payment: 6 |
|
| PG25 | Lapsed in a contracting state [announced via postgrant information from national office to epo] |
Ref country code: AL Free format text: LAPSE BECAUSE OF FAILURE TO SUBMIT A TRANSLATION OF THE DESCRIPTION OR TO PAY THE FEE WITHIN THE PRESCRIBED TIME-LIMIT Effective date: 20160907 Ref country code: TR Free format text: LAPSE BECAUSE OF FAILURE TO SUBMIT A TRANSLATION OF THE DESCRIPTION OR TO PAY THE FEE WITHIN THE PRESCRIBED TIME-LIMIT Effective date: 20160907 |
|
| PGFP | Annual fee paid to national office [announced via postgrant information from national office to epo] |
Ref country code: DK Payment date: 20200922 Year of fee payment: 8 |
|
| PGFP | Annual fee paid to national office [announced via postgrant information from national office to epo] |
Ref country code: DE Payment date: 20201009 Year of fee payment: 8 Ref country code: IT Payment date: 20201009 Year of fee payment: 8 Ref country code: ES Payment date: 20201103 Year of fee payment: 8 Ref country code: FR Payment date: 20201030 Year of fee payment: 8 Ref country code: GB Payment date: 20201015 Year of fee payment: 8 Ref country code: SE Payment date: 20201013 Year of fee payment: 8 |
|
| REG | Reference to a national code |
Ref country code: DE Ref legal event code: R119 Ref document number: 602013011215 Country of ref document: DE |
|
| REG | Reference to a national code |
Ref country code: DK Ref legal event code: EBP Effective date: 20211031 |
|
| REG | Reference to a national code |
Ref country code: SE Ref legal event code: EUG |
|
| GBPC | Gb: european patent ceased through non-payment of renewal fee |
Effective date: 20211023 |
|
| PG25 | Lapsed in a contracting state [announced via postgrant information from national office to epo] |
Ref country code: SE Free format text: LAPSE BECAUSE OF NON-PAYMENT OF DUE FEES Effective date: 20211024 Ref country code: GB Free format text: LAPSE BECAUSE OF NON-PAYMENT OF DUE FEES Effective date: 20211023 Ref country code: DE Free format text: LAPSE BECAUSE OF NON-PAYMENT OF DUE FEES Effective date: 20220503 |
|
| PG25 | Lapsed in a contracting state [announced via postgrant information from national office to epo] |
Ref country code: FR Free format text: LAPSE BECAUSE OF NON-PAYMENT OF DUE FEES Effective date: 20211031 |
|
| PG25 | Lapsed in a contracting state [announced via postgrant information from national office to epo] |
Ref country code: IT Free format text: LAPSE BECAUSE OF NON-PAYMENT OF DUE FEES Effective date: 20211023 Ref country code: DK Free format text: LAPSE BECAUSE OF NON-PAYMENT OF DUE FEES Effective date: 20211031 |
|
| REG | Reference to a national code |
Ref country code: ES Ref legal event code: FD2A Effective date: 20230217 |
|
| PG25 | Lapsed in a contracting state [announced via postgrant information from national office to epo] |
Ref country code: ES Free format text: LAPSE BECAUSE OF NON-PAYMENT OF DUE FEES Effective date: 20211024 |