EP2908913B1 - Molecular signatures of ovarian cancer - Google Patents
Molecular signatures of ovarian cancer Download PDFInfo
- Publication number
- EP2908913B1 EP2908913B1 EP13848075.1A EP13848075A EP2908913B1 EP 2908913 B1 EP2908913 B1 EP 2908913B1 EP 13848075 A EP13848075 A EP 13848075A EP 2908913 B1 EP2908913 B1 EP 2908913B1
- Authority
- EP
- European Patent Office
- Prior art keywords
- cancer
- cells
- signature
- genes
- ovarian cancer
- Prior art date
- Legal status (The legal status is an assumption and is not a legal conclusion. Google has not performed a legal analysis and makes no representation as to the accuracy of the status listed.)
- Active
Links
Images













Classifications
-
- C—CHEMISTRY; METALLURGY
- C12—BIOCHEMISTRY; BEER; SPIRITS; WINE; VINEGAR; MICROBIOLOGY; ENZYMOLOGY; MUTATION OR GENETIC ENGINEERING
- C12Q—MEASURING OR TESTING PROCESSES INVOLVING ENZYMES, NUCLEIC ACIDS OR MICROORGANISMS; COMPOSITIONS OR TEST PAPERS THEREFOR; PROCESSES OF PREPARING SUCH COMPOSITIONS; CONDITION-RESPONSIVE CONTROL IN MICROBIOLOGICAL OR ENZYMOLOGICAL PROCESSES
- C12Q1/00—Measuring or testing processes involving enzymes, nucleic acids or microorganisms; Compositions therefor; Processes of preparing such compositions
- C12Q1/68—Measuring or testing processes involving enzymes, nucleic acids or microorganisms; Compositions therefor; Processes of preparing such compositions involving nucleic acids
- C12Q1/6876—Nucleic acid products used in the analysis of nucleic acids, e.g. primers or probes
- C12Q1/6883—Nucleic acid products used in the analysis of nucleic acids, e.g. primers or probes for diseases caused by alterations of genetic material
- C12Q1/6886—Nucleic acid products used in the analysis of nucleic acids, e.g. primers or probes for diseases caused by alterations of genetic material for cancer
-
- A—HUMAN NECESSITIES
- A61—MEDICAL OR VETERINARY SCIENCE; HYGIENE
- A61P—SPECIFIC THERAPEUTIC ACTIVITY OF CHEMICAL COMPOUNDS OR MEDICINAL PREPARATIONS
- A61P35/00—Antineoplastic agents
-
- C—CHEMISTRY; METALLURGY
- C12—BIOCHEMISTRY; BEER; SPIRITS; WINE; VINEGAR; MICROBIOLOGY; ENZYMOLOGY; MUTATION OR GENETIC ENGINEERING
- C12N—MICROORGANISMS OR ENZYMES; COMPOSITIONS THEREOF; PROPAGATING, PRESERVING, OR MAINTAINING MICROORGANISMS; MUTATION OR GENETIC ENGINEERING; CULTURE MEDIA
- C12N15/00—Mutation or genetic engineering; DNA or RNA concerning genetic engineering, vectors, e.g. plasmids, or their isolation, preparation or purification; Use of hosts therefor
- C12N15/09—Recombinant DNA-technology
- C12N15/11—DNA or RNA fragments; Modified forms thereof; Non-coding nucleic acids having a biological activity
- C12N15/113—Non-coding nucleic acids modulating the expression of genes, e.g. antisense oligonucleotides; Antisense DNA or RNA; Triplex- forming oligonucleotides; Catalytic nucleic acids, e.g. ribozymes; Nucleic acids used in co-suppression or gene silencing
-
- G—PHYSICS
- G01—MEASURING; TESTING
- G01N—INVESTIGATING OR ANALYSING MATERIALS BY DETERMINING THEIR CHEMICAL OR PHYSICAL PROPERTIES
- G01N33/00—Investigating or analysing materials by specific methods not covered by groups G01N1/00 - G01N31/00
- G01N33/48—Biological material, e.g. blood, urine; Haemocytometers
- G01N33/50—Chemical analysis of biological material, e.g. blood, urine; Testing involving biospecific ligand binding methods; Immunological testing
- G01N33/53—Immunoassay; Biospecific binding assay; Materials therefor
- G01N33/575—Immunoassay; Biospecific binding assay; Materials therefor for cancer
- G01N33/57545—Immunoassay; Biospecific binding assay; Materials therefor for cancer of the ovaries
-
- C—CHEMISTRY; METALLURGY
- C12—BIOCHEMISTRY; BEER; SPIRITS; WINE; VINEGAR; MICROBIOLOGY; ENZYMOLOGY; MUTATION OR GENETIC ENGINEERING
- C12N—MICROORGANISMS OR ENZYMES; COMPOSITIONS THEREOF; PROPAGATING, PRESERVING, OR MAINTAINING MICROORGANISMS; MUTATION OR GENETIC ENGINEERING; CULTURE MEDIA
- C12N2310/00—Structure or type of the nucleic acid
- C12N2310/10—Type of nucleic acid
- C12N2310/14—Type of nucleic acid interfering nucleic acids [NA]
-
- C—CHEMISTRY; METALLURGY
- C12—BIOCHEMISTRY; BEER; SPIRITS; WINE; VINEGAR; MICROBIOLOGY; ENZYMOLOGY; MUTATION OR GENETIC ENGINEERING
- C12N—MICROORGANISMS OR ENZYMES; COMPOSITIONS THEREOF; PROPAGATING, PRESERVING, OR MAINTAINING MICROORGANISMS; MUTATION OR GENETIC ENGINEERING; CULTURE MEDIA
- C12N2310/00—Structure or type of the nucleic acid
- C12N2310/50—Physical structure
- C12N2310/53—Physical structure partially self-complementary or closed
- C12N2310/531—Stem-loop; Hairpin
-
- C—CHEMISTRY; METALLURGY
- C12—BIOCHEMISTRY; BEER; SPIRITS; WINE; VINEGAR; MICROBIOLOGY; ENZYMOLOGY; MUTATION OR GENETIC ENGINEERING
- C12Q—MEASURING OR TESTING PROCESSES INVOLVING ENZYMES, NUCLEIC ACIDS OR MICROORGANISMS; COMPOSITIONS OR TEST PAPERS THEREFOR; PROCESSES OF PREPARING SUCH COMPOSITIONS; CONDITION-RESPONSIVE CONTROL IN MICROBIOLOGICAL OR ENZYMOLOGICAL PROCESSES
- C12Q2600/00—Oligonucleotides characterized by their use
- C12Q2600/112—Disease subtyping, staging or classification
-
- C—CHEMISTRY; METALLURGY
- C12—BIOCHEMISTRY; BEER; SPIRITS; WINE; VINEGAR; MICROBIOLOGY; ENZYMOLOGY; MUTATION OR GENETIC ENGINEERING
- C12Q—MEASURING OR TESTING PROCESSES INVOLVING ENZYMES, NUCLEIC ACIDS OR MICROORGANISMS; COMPOSITIONS OR TEST PAPERS THEREFOR; PROCESSES OF PREPARING SUCH COMPOSITIONS; CONDITION-RESPONSIVE CONTROL IN MICROBIOLOGICAL OR ENZYMOLOGICAL PROCESSES
- C12Q2600/00—Oligonucleotides characterized by their use
- C12Q2600/118—Prognosis of disease development
-
- C—CHEMISTRY; METALLURGY
- C12—BIOCHEMISTRY; BEER; SPIRITS; WINE; VINEGAR; MICROBIOLOGY; ENZYMOLOGY; MUTATION OR GENETIC ENGINEERING
- C12Q—MEASURING OR TESTING PROCESSES INVOLVING ENZYMES, NUCLEIC ACIDS OR MICROORGANISMS; COMPOSITIONS OR TEST PAPERS THEREFOR; PROCESSES OF PREPARING SUCH COMPOSITIONS; CONDITION-RESPONSIVE CONTROL IN MICROBIOLOGICAL OR ENZYMOLOGICAL PROCESSES
- C12Q2600/00—Oligonucleotides characterized by their use
- C12Q2600/158—Expression markers
-
- C—CHEMISTRY; METALLURGY
- C12—BIOCHEMISTRY; BEER; SPIRITS; WINE; VINEGAR; MICROBIOLOGY; ENZYMOLOGY; MUTATION OR GENETIC ENGINEERING
- C12Q—MEASURING OR TESTING PROCESSES INVOLVING ENZYMES, NUCLEIC ACIDS OR MICROORGANISMS; COMPOSITIONS OR TEST PAPERS THEREFOR; PROCESSES OF PREPARING SUCH COMPOSITIONS; CONDITION-RESPONSIVE CONTROL IN MICROBIOLOGICAL OR ENZYMOLOGICAL PROCESSES
- C12Q2600/00—Oligonucleotides characterized by their use
- C12Q2600/16—Primer sets for multiplex assays
Definitions
- This invention relates to genetic pathways involved in ovarian cancer growth; including, molecular signatures associated with identifying molecular subtypes of gynecological diseases and/or conditions, such as ovarian cancer.
- molecular signatures have wide application for classification of patent populations, prognosis, diagnosis and treatment of gynecological diseases and/or conditions, such as ovarian cancer.
- Ovarian cancer is the leading cause of gynecologic cancer deaths in the United States. Despite similarities in initial disease presentation, the existence of molecular subtypes of ovarian cancer is suggested by clinical outcomes displaying a broad range of survival end points. For example, some patients develop a chronic-type disease that can be maintained on chemotherapy for more than five years. Others are intrinsically resistant to chemotherapy or initially respond to chemotherapy, but then rapidly become resistant to the treatment and subsequently have low response rates to other second-line agents. Strategic approaches customized for treating these different patient groups is lacking, as ovarian cancer therapy is implemented on a watch-and-wait basis.
- CSCs cancer stem cells
- WO2004/022778 relates to methods of diagnosis and prognosis of ovarian cancer using sets of specific gene panels.
- Article entitled " Multi-cancer computational analysis reveals invasion-associated variant of desmoplastic reaction involving INHBA, THBS2 and COL11A1" by Hoon Kim et. at. relates to identifying data from multiple cancers using a novel computational method identifying sets of genes whose coordinated over expression indicates the presence of a particular phenotype in high stage cancer.
- Described herein are gene signatures providing prognostic, diagnostic, treatment and molecular subtype classifications of ovarian cancers. Biostatistical methods are applied across a variety of studies encompassing a wide array of laboratory and clinical variables, thereby leading to generation of ovarian cancer disease signatures (OCDSs) that account for molecular heterogeneity present in gynecological cancers. Statistical analysis across multiple independent data sets allows generation of a preliminary ovarian cancer fixed signature (OCFS), a comprehensive definition of the core programming of disease development. Also described herein is a specific biochemical definition of an ovarian cancer stem cell identified via an (OCSC) signature.
- OCFS preliminary ovarian cancer fixed signature
- a specific biochemical definition of an ovarian cancer stem cell identified via an (OCSC) signature are also described herein.
- ovarian cancer cell lines including ovarian cancer stem cell lines (OCSC), and selectively labeled animal models provides in vitro and in vivo models for applying the aforementioned signatures to develop clinical applications, such personalized treatment strategies focused on molecular subtypes of gynecological cancers.
- OCSC ovarian cancer stem cell lines
- Described herein is a method of determining a prognosis of cancer in an individual, including determining the presence or absence of a high level of expression in the individual relative to a normal baseline standard for a single prognostic panel of the following markers, ACTA2, ADAM12, AEBP1, COL11A1, COL3A1, COL5A1, COL6A2, CYR61, DCN, FN1, GREM1, LOX, LUM, POSTN, SNAI2, SPARC, TAGLN, THBS2, TIMP3, VCAN, and/or VIM, and prognosing a case of cancer if the individual demonstrates the presence of a high level of expression relative to a normal baseline standard of at least one of the markers.
- markers ACTA2, ADAM12, AEBP1, COL11A1, COL3A1, COL5A1, COL6A2, CYR61, DCN, FN1, GREM1, LOX, LUM, POSTN, SNAI2, SPARC,
- the individual demonstrates the presence of a high level of expression relative to a normal baseline standard of at least two, three, four, or five of the markers. In other embodiments, the individual demonstrates the presence of a high level of expression relative to a normal baseline standard of at least six, seven, eight, nine, ten or more of the markers.
- the cancer is ovarian cancer.
- the prognosis provides a therapeutic selection for the prognosed individual, selected from the group consisting of: chemotherapy, radiotherapy, surgery, and combinations thereof.
- the markers are AEBP1, COL11A1, COL5A1, COL6A2, LOX, POSTN, SNAI2, THBS2, TIMP3, and VCAN
- Also described herein is a method of determining a diagnosis of cancer in an individual suspected of having cancer, including: obtaining sample from an individual suspected of having cancer; determining the presence or absence of a high level of expression in the individual relative to a normal baseline standard for a single diagnostic panel including the following markers ACTA2, ADAM12, AEBP1, COL11A1, COL3A1, COL5A1, COL6A2, CYR61, DCN, FN1, GREM1, LOX, LUM, POSTN, SNAI2, SPARC, TAGLN, THBS2, TIMP3, VCAN, and/or VIM, and diagnosing a case of cancer if the individual demonstrates the presence of a high level of expression relative to a normal baseline standard of at least one of the markers.
- the individual demonstrates the presence of a high level of expression relative to a normal baseline standard of at least two, three, four, or five of the markers. In other embodiments, the individual demonstrates the presence of a high level of expression relative to a normal baseline standard of at least six, seven, eight, nine, ten or more of the markers.
- the cancer is ovarian cancer.
- the diagnosis provides a molecular subtype classification for the diagnosed case of cancer in the individual.
- the markers are AEBP1, COL11A1, COL5A1, COL6A2, LOX, POSTN, SNAI2, THBS2, TIMP3, and VCAN
- a method of modulating a tumor phenotype in an individual including providing a quantity of an agent capable of modulating cancer stem cell (CSC) function, and administering the quantity of the agent to an individual, wherein modulation of CSC function results in modulation of a tumor phenotype in the individual.
- the individual has cancer.
- the cancer is ovarian cancer.
- the agent is a small molecule, nucleic acid, anti-sense oligonucleotide, aptamer, protein, peptide and/or antibody.
- the protein is collagenase.
- the antibody is specific for CD24, CD44, CD117, CD133 or ALDH1. In other embodiments, the antibody modulates TGF- ⁇ pathway activity.
- compositions including an isolated population of cancer stem cells (CSCs) obtained from an individual afflicted with cancer.
- the cancer is ovarian cancer.
- the composition is a cultured cell line.
- the isolated cells include cancer stem cells (CSCs) and non-CSCs
- adding a detectable reagent that preferentially binds to CSCs to the isolated cells measuring a quantity of detectable reagent bound to the isolated cells and applying a ratio to the quantity, wherein application of the ratio to the quantity indicates the proportion of the isolated cells that are CSCs.
- the detectable reagent is an antibody specific for CD24, CD44, CD117, CD133 or ALDH1.
- the quantity of detectable reagent comprises flow cytometry, immunohistochemistry, immunocytochemistry, or enzyme-linked immunoassay (ELISA).
- an assay for determining the subtype of a gynecological cancer including determining the presence or absence of a high level of expression in the individual relative to a normal baseline standard for a single prognostic panel comprising the following markers, ACTA2, ADAM12, AEBP1, COL11A1, COL3A1, COL5A1, COL6A2, CYR61, DCN, FN1, GREM1, LOX, LUM, POSTN, SNAI2, SPARC, TAGLN, THBS2, TIMP3, VCAN, and/or VIM, and determining the subtype of the gynecological cancer a case of cancer if the individual demonstrates the presence of a high level of expression relative to a normal baseline standard of at least one of the markers.
- the gynecological cancer is ovarian cancer.
- the ovarian cancer is characterized by elevated stromal or epithenlial-to-mesechymal transition activity.
- the markers are AEBP1, COL11A1, COL5A1, COL6A2, LOX, POSTN, SNAI2, THBS2, TIMP3, and VCAN.
- determining the subtype of the gynecological cancer indicates a therapeutic treatment.
- therapeutic treatment is immunotherapy.
- the therapeutic treatment is anti-fibrotic.
- the therapeutic treatment modulates TGF- ⁇ pathway activity.
- ovarian cancer patients are diagnosed at a late stage when the cancer has metastasized throughout the peritoneal cavity.
- Standard clinical management involves surgical tumor debulking followed by administration of platinum- and taxane-based chemotherapy.
- Patients with advanced ovarian cancer display a broad range of survival end points, despite the similarities in initial disease presentation (e.g., late-stage), histopathology (e.g., high-grade, serous ovarian cancer) and treatment (e.g., surgery followed by platinum- and taxane-based chemotherapy).
- initial disease presentation e.g., late-stage
- histopathology e.g., high-grade, serous ovarian cancer
- treatment e.g., surgery followed by platinum- and taxane-based chemotherapy.
- some patients develop a chronic-type disease and can live with ovarian cancer (despite intermittent chemotherapy treatments) for 5, 10 or more years.
- Others have tumors that are intrinsically resistant to chemotherapy or initially respond to chemotherapy but then rapidly recur due to regrowth of resistant disease and
- CSCs cancer stem cells
- stroma stroma cells
- ovarian cancer stem cell ovarian cancer stem cell
- OCSC ovarian cancer stem cell
- the existence and role of CSCs in the ovarian cancer context is not well-understood.
- tumors display morphological, phenotypical, and biochemical heterogeneity, different cells may possess only some or many hallmarks of a posited OCSC, yet fail to be a bona fide OCSC.
- Application of the described techniques can lead to positive identification of OCSCs and compilation of a precise, biochemical definition via an OCSC signature. Generation of such a signature contributes further in diagnostic and prognostic techniques would further benefit from early stage detection of OCSCs, as these cells are understood to be key actors in neoplastic tumor formation.
- solid tumors are now understood to be complex "organs” comprised of not only malignant cells, such as OCSCs, but also non-malignant cells, described under the umbrella term, "stroma".
- malignant cells such as OCSCs
- stroma non-malignant cells
- Most outcome-predicting gene signatures originate in cancer cells.
- stromal cells are active contributors to tumor progression and that large amounts of tumor stroma are also associated with poor clinical outcome in multiple solid tumors.
- This dynamic bi-directional interaction between the malignant cells and "stroma” is not well understood, but recent studies have suggested “stroma” can modify the neoplastic properties of tumor cells and that tumor cells re-program the "stroma” to generate a unique microenvironment that is crucial for cancer survival, homeostasis, progression, and metastasis.
- Described herein is the development of gene signatures providing prognostic, diagnostic, treatment methods and molecular subtype classifications of ovarian cancers.
- Biostatistical methods are applied to link molecular, laboratory, and clinical data obtained from a variety of studies encompassing a wide array of laboratory and clinical variables.
- Each of these studies provides ovarian cancer disease signatures (OCDSs) that account for molecular heterogeneity present in gynecological cancers.
- OCFS ovarian cancer disease signature
- robust statistical analysis across these multiple independent data sets allows further optimization for generating an ovarian cancer fixed signature (OCFS).
- OCFS ovarian cancer fixed signature
- generation of an OCFS helps to define the core programming of disease development.
- ovarian cancer stem cell via an (OCSC) signature Described further herein is a specific biochemical definition of an ovarian cancer stem cell via an (OCSC) signature.
- OCSC ovarian cancer stem cell lines
- selectively labeled animal models provides in vitro and in vivo models for developing clinical applications, such as guided personalized treatment decisions.
- the various identified gene signatures such as OCFS is correlated with ovarian cancer progression and poor outcome.
- the OCFS signature has strong predictive value, biological relevance, and translational potential. Future studies are warranted to optimize the gene signature for its predictive power and develop a quantitative assay that is appropriate for use in the clinical setting.
- Using the validated gene signature to identify patients who are unlikely to respond to standard treatment will provide opportunities to deliver individualized therapies that target the underlying mechanism of the poor outcome signature genes.
- a better understanding of how collagen remodeling contributes to ovarian cancer progression and metastasis could reveal the "Achilles heel" of these tumors and thus have a major impact on the development of improved therapies for advanced ovarian cancer.
- the present invention includes a method of determining a prognosis of cancer in an individual includes, determining the presence or absence of a high level of expression in the individual relative to a normal baseline standard for a prognostic panel including the following markers:AEBP1, COL11A1, COL5A1, COL6A2, LOX, POSTN, SNAI2, THBS2, TIMP3 and VCAN and prognosing a case of cancer if the individual demonstrates the presence of a high level of expression relative to a normal baseline standard of the markers in the prognostic panel.
- the cancer is ovarian cancer.
- the prognosis provides a therapeutic selection for the prognosed individual, selected from the group consisting of: chemotherapy, radiotherapy, surgery, and/or combinations thereof.
- the markers are associated with the presence of ovarian cancer stem cells (OCSCs). In other embodiments, the markers are associated with poor survival. In other embodiments, the markers are associated with poor prognosis. In other embodiments, the markers are associated with late-stage ovarian cancer, high-grade, or serious ovarian cancer.
- OCSCs ovarian cancer stem cells
- the prognostic panel includes the markers listed in Table 1.
- Table 1. Representative Ovarian Cancer Stem Cell (OCSC) Genes ABCD2 CNN1 FAM55C IL7R OGN SPARC YWHAB ACTA2 COL11A1 FGF1 KATNA1 OLFML3 SPOCK2 ZFHX4 ACTG2 COL1A2 FGFR2 KSR1 PCMT1 SPP1 ZNF804A ADAM 12 COL3A1 FLNC LAMA4 PDGFRA SV2A ALDH1A1 COL6A1 FN1 LAMB1 PHLDB2 TAGLN ALDH1A2 COLEC12 FNTA LOX PI3 TFPI2 AMACR CTGF FXYD5 LOXL1 PIEZO2 TGFB2 ANGPT1 CYBRD1 GADD45B LRRC17 PPIC TGFBI ANGPTL2 CYR61 GAS1 LUM PPP3CA THBS1 ANGPTL4 DCLK1
- the single prognostic panel includes the markers listed in Table 2.
- Table 2. Representative Periostin (POSTN)-Coexpressing Genes ACTA2 CNN1 EPAS1 IL6 MMP11 RAI14 THBD ACTC1 COL10A1 EPYC IL7R MMP19 RASAL3 THBS1 ACTG2 COL11A1 ETV1 INHBA MMP1 RASSF2 THBS2 ACTR2 COL12A1 FAM26E ITGA1 MOXD1 RCAN1 TIMP3 ADAM 12 COL1A2 FAP ITGA5 MPP1 RGS16 TMEM89 AEBP1 COL1A1 FBLN1 ITGA11 MS4A4A SCHIP1 TMEM158 AK5 COL3A1 FBLN2 ITGB1 MXRA5 SDC1 TMEM217 ALDH1A3 COL4A2 FBN1 ITGBL 1 NCF2 SEC13 TMEM45A ANGPTL2 COL5A1
- the single prognostic panel includes the markers listed in Table 3.
- Table 3. Representative Genes Associated with Poor Survival
- ADAM 12 CILP CYR61 FBLN2 INHBA PDLIM3 SNAI2 ADH1B COL10A1 DIO2 FGF1 ITGBL1 PDPN SPON2 ADIPOQ COL11A1 DPT FMO1 LOX PIEZO2 SULF1 AEBP1 COL1A1 DUSP1 FOSB LPPR4 PLAU TDO2 ASPN COL5A1 DUSP5 GLT8D2 MATN3 POSTN THBS2 ATF3 COL5A2 ECM1 GREM1 MFAP5 PPBP TIMP3 C1QTNF3 COL5A3 EDNRA GUCY1A3 MMP11 PRKG1 VCAM1 C7orf10 COL6A2 EGR1 HAS2 MN1 PRRX1 VCAN CALB2 COMP EGR2 HBA1/HBA2 NR4A1 PTG
- the single prognostic panel includes the markers listed in Table 4 or 4a.
- Table 4. - Representative Genes Associated with Poor Prognosis ABCA8 COL6A3 FOSB LMOD1 POSTN TIMP3 ACTA2 CXCL12 HBA1/HBA2 LOX PTGIS TMEM47 ADH1B CYP1B1 HBB LUM RARRES1 TMEM158 AEBP1 DCN HEPH MAL RGS2 TUBB2A ALDH1A1 DUSP1 ID1 NBL1 RHOB UBD ALDH1A2 EDNRA IGF2 NR2F2 SEMA3C VCAN CAV1 EFEMP 1 IGFBP3 NR4A2 SERPINE1 VIM CDH11 EGR1 IGFBP4 OLFML3 SERPINF1 ZEB1 COL11A1 FBLN1 IGFBP5 OSR2 SNAI2 COL3A1 FBN1 ISLR PDGFRA SPARC COL5A1 FN1 ITM
- the method of determining a prognosis of cancer in an individual includes, determining the presence or absence of a high level of expression in the individual relative to a normal baseline standard for a prognostic panel including the markers listed in Table 4a.
- the cancer is ovarian cancer.
- the prognosis provides a therapeutic selection for the prognosed individual, selected from the group consisting of: chemotherapy, radiotherapy, surgery, and/or combinations thereof. The markers are associated with poor prognosis.
- described herein is a method of determining a diagnosis of cancer in an individual suspected of having cancer, including obtaining sample from an individual suspected of having cancer, determining the presence or absence of a high level of expression in the individual relative to a normal baseline standard for a single diagnostic panel, and diagnosing a case of cancer if the individual demonstrates the presence of a high level of expression relative to a normal baseline standard of the markers listed in Table 4a.
- the isolated cells include cancer stem cells (CSCs) and non-CSCs
- adding a detectable reagent that preferentially binds to CSCs to the isolated cells measuring a quantity of detectable reagent bound to the isolated cells, applying a ratio to the quantity, wherein application of the ratio to the quantity indicates the proportion of the isolated cells that are CSCs.
- the detectable reagent is an antibody specific for CD24, CD44, CD117, CD133 or ALDH1.
- the quantity of detectable reagent comprises flow cytometry, immunohistochemistry, immunocytochemistry, or enzyme-linked immunoassay (ELISA).
- compositions including an enriched population of cancer stem cells (CSCs) obtained from an individual afflicted with cancer, wherein the CSCs express a higher level of at least one CSC marker when compared to non-CSCs, and wherein the CSCs are capable of self-renewal and differentiation.
- the least one CSC marker includes one or more markers listed in Table 1.
- the cancer is a gynecological cancer.
- the cancer is ovarian cancer.
- the composition is a cultured cell line.
- described herein is a composition including an isolated population of cancer stem cells (CSCs) obtained from an individual afflicted with cancer.
- the cancer is ovarian cancer.
- the composition is a cultured cell line.
- a method of modulating a tumor phenotype in an individual including providing a quantity of an agent capable of modulating cancer stem cell (CSC) function, and administering the quantity of the agent to an individual, wherein modulation of CSC function results in modulation of a tumor phenotype in the individual.
- the individual has cancer.
- the cancer is ovarian cancer.
- the agent is a small molecule, nucleic acid, protein, peptide and/or antibody.
- the protein is collagenase.
- the small molecule is Salinomycin, Etoposide, Abamectin, Nigericin, Resveratrol, MS-275, Ciclopirox, Quinostatin, Alsterpaullone, Azacitidine, Bepridil, Fluspirilene, Cortisone, Etoposide, Loperamide, Ikarugamycin, Pyrvinium, Irinotecan, Phenoxybenzamine, Solanine Nicergoline, Monobenzone, Ellipticine, Norcyclobenzaprine, Tobramycin, Gossypol, Ethambutol, Daunorubicin, Methotrexate, Dextromethorphan, Thiostrepton, Propylthiouracil, Clotrimazole, Amiodarone, Thioguanosine, Rimexolone, Tranylcypromine, Ginkgolide A, GW-8510, Hycanthone, Rolitetracycline, Dipyridamole, Perphenazine, Beta-
- the nucleic acid is a small interefering RNA (siRNA) or short hairpin RNA (shRNA).
- siRNA or shRNA is cognate to fibroblast growth factor 1 (FGF1), fibronectin (FN1), or L1CAM.
- FGF1 fibroblast growth factor 1
- FN1 fibronectin
- L1CAM fibroblast growth factor 1
- the antibody is specific for ABCC5, CD24, CD44, CD117, CD133 or ALDH1.
- the agent is capable of modulating the rate of epithelial-to-mesenchymal transition (EMT).
- modulating a tumor phenotype includes treating an individual afflicted with cancer.
- a method of modulating a tumor phenotype in an individual including providing a quantity of an agent capable of modulating TGF-beta pathways, and administering the quantity of the agent to an individual, wherein modulation of TGF-beta pathways results in modulation of a tumor phenotype in the individual.
- the individual has cancer.
- the cancer is ovarian cancer.
- the agent is a small molecule, nucleic acid, protein, peptide and/or antibody.
- the agent is a ligand traps, antisense oligonucleotide (ASO), small molecule receptor kinase inhibitor, or peptide aptamer.
- ligand traps can also include anti-ligand neutralizing antibodies and soluble decoy receptor proteins incorporating the ectodomains from either T ⁇ RII or ⁇ RIII/betaglycan protein, such as TGF- ⁇ monoclonal antibody, 1D11, or decoy receptor proteins such as recombinant Fc-fusion proteins with the soluble ectodomain of either T ⁇ RII (T ⁇ RII-Fc) or the type III receptor, betaglycan.
- ASOs include nucleotides capable of reducing the bioavailability of active TGF- ⁇ ligands such as AP12009 (Trabedersen).
- small molecule receptor kinase inhibitors include small molecule inhibitor of T ⁇ RI, SB-431542, T ⁇ RI/ALK5 kinase inhibitor, Ki26894, T ⁇ RI inhibitor SD-208, dual inhibitor of T ⁇ RI/II, LY2109761, or inhibitors selective for the kinase domain of the type 1 TGF- ⁇ receptor, LY2157299.
- other therapeutics targeting related pathways such as EGFR (erlotinib), ABL/PDGFR/KIT (imatinib), and VEGFR/RAF/PDGFR (sorafenib), may be used in combination with a TGF-beta related therapeutic.
- the agent targetings intracellular TGF- ⁇ signaling molecules such as Smads.
- aptamers are small peptide molecules containing a target-binding and a scaffolding domain that stabilizes and interferes with the function of the targets, and can be designed specifically against Smas such as Smad2 or Smad3, the Trx-SARA aptamer is one such example.
- the nucleic acid is a small interefering RNA (siRNA) or short hairpin RNA (shRNA).
- the siRNA or shRNA is cognate to ACTA2, ADAM12, COL11A1, COL3A1, COL5A1, COL6A2, CYR61, DCN, FN1, GREM1, LOX, POSTN, SNAI2, SPARC, TAGLN, TIMP3, VCAN or VIM.
- the siRNA or shRNA is cognate to AEBP1, COL11A1, COL5A1, COL6A2, LOX, POSTN, SNAI2, THBS2, TIMP3, or VCAN.
- the siRNA or shRNA is cognate to COL11A1, LOX, POSTN, THBS2, or VCAN.
- a method including providing isolated cells obtained from an individual afflicted with cancer, wherein the isolated cells include cancer stem cells (CSCs) and non-CSCs, adding a detectable reagent that preferentially binds to CSCs to the isolated cells, measuring a quantity of detectable reagent bound to the isolated cells, applying a ratio to the quantity, wherein application of the ratio to the quantity indicates the proportion of the isolated cells that are CSCs.
- the detectable reagent is an antibody specific for ABCC5, CD24, CD44, CD117, CD133 or ALDH1.
- the quantity of detectable reagent comprises flow cytometry, immunohistochemistry, immunocytochemistry, or enzyme-linked immunoassay (ELISA).
- Ovarian cancer stem cells generally include
- CSCs cancer stem cells
- OCSC bona fide ovarian cancer stem cells
- tumors display morphological, phenotypical, and biochemical heterogeneity, it is understood that different cells may possess only some or many hallmarks of a posited OCSC, yet fail to be a bona fide OCSC.
- Several leading OCSC candidates include, for example, cells expressing markers CD24, CD44, CD117, CD133 and ALDH1.
- CD133/ALDH1 double markers have been shown most reliable to enrich for OCSC candidates, as further described via morphologhical and functional characteristics, such as spheroid formation, cisplatin resistance, clinical outcome, and perhaps most importantly, tumor formation with as few as 30 cells (i.e., high tumor seeding potential).
- OCSC candidates may display some or many characteristics of a bona fide OCSC, there is yet no positive determination of which particular cells drawn from heterogeneous populations within tumors display all of the "stemness" characteristics of a bona fide OCSC.
- Endpoint studies demonstrating capture of bona fide OCSC could be shown experimentally by isolation of a cell capable of recapitulating the generation of a continuously growing tumor.
- serial transplantation in animal models provides a functional assay for the two CSC hallmarks, self-renewal and differentiation.
- these endpoint functional studies fail to provide a molecular snapshot of the biochemical actors responsible for giving CSCs, including OCSCs, their unique properties. Therefore, an OCSC signature provides two important uses. The first is a specific, biochemical definition of a bona fide OCSC, which currently does not exist. The second includes applications for prognostic and diagnostic use, as a type of ovarian cancer disease signature (OCDS).
- OCDS ovarian cancer disease signature
- OCSC ovarian cancer stem cell
- an OCSC provides a precise biochemical definition of a specific cell type for identification
- application of an OCSC in a prognostic or diagnostic context appears to find further utility as capable of classifying molecular subtypes of cancer.
- ovarian cancer like other cancers, is a multi-etiological disease, and variations in tumor cell origin, tissue compartment development, and/or other factors leads to the manifestation of disease subtypes.
- Tumor samples may include higher or lower numbers of OCSCs, as demonstrated by detection of an OCSC signature, and this variation may prove to be highly informative of clinical outcomes (e.g., chemoresistance, survival).
- an OCSC may be considered as a type of OCDS, as capable of prognostic and diagnostic applications.
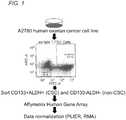
- OCSC signature In order to identify an OCSC core transcriptional program (OCSC signature), the inventors isolated OCSC candidates and non-CSCs using ALDH1 and CD133/ALDH1 from A2780 human ovarian cancer cell line. As OCSCs are a rare and evanescent cell population, the A2780 cell line provides the greatest number OCSC candidates (1%) for analysis. The inventors then analyzed the CD133+ALDH1+ OCSC candidates using Affymetrix Human Gene Array, normalized the data with two independent algorithms, and compared their expression profiling to each other as well as to public array databases (OncoMine, Stanford Microarray database, Gene Expression Omnibus) ( Fig.1 ). List of OCSC genes constituting a preliminary signature are shown in Table 1.
- Fig.2A Molecular phenotyping of human ovarian cancer stem cells unravels the mechanisms for repair and chemoresistance. Cell Cycle. 8(1):158-66 .
- Baba et al. (2009) Epigenetic regulation of CD133 and tumorigenicity of CD133+ ovarian cancer cells. Oncogene. 28(2):209-18 .
- OCSC candidates e.g., CD133+ALDH1+ or CD44+ and CD133+
- these "stemness” genes could be used to identify bona fide OCSCs.
- core transcriptional programming as tied to "stemness” characteristics relate to genes involved in pluripotency (e.g., transcription factors), self-renewal and differentiation (e.g., growth factors, epithelial-mesenchymal transition), surface antigens (e.g., adhesion markers, migration factors, matrix production), and metabolic regulators.
- the preliminary identification of an OCSC signature predicted candidate genes for potential therapeutic intervention and poor patient survival in public databases. Further validation of our preliminary OCSC signature using patient samples, in vitro cell culture, and statistical analysis are applied to determine prognostic and therapeutic power of an OCSC signature.
- establishment of a comprehensive, global OCSC signature provides a series of biomarkers, wherein expression levels of one, some or all of the genetic markers, as a transcript or protein level, may be used to prognose a range of clinical outcomes for a patient, such as chemoresistance or survival.
- an OCSC signature provides a definitive biochemical approach to positively identifying the proportion of cells in a tumor sample that can be confirmed as bona fide OCSCs. This focus on the percentage of cell populations within a tumor samples, is critical as higher numbers are CSCs are generally understood to be indicators for poor prognostic outcomes (e.g., chemoresistance, increased tumor-sphere-forming ability, neoplastic regrowth).
- the genetic markers may serve as useful diagnostic tools to provide molecular subtype classifications of a gynecological cancer, such as ovarian cancer. This is of particular importance in the context of cancer, given the multi-etiological nature of these diseases.
- a comprehensive OCSC signature allows targeted therapeutic intervention focused on OCSC eradication and/or retardation.
- current chemotherapeutic agents target the bulk population of cancer cells, and tumor regression may be observed.
- reducing bulk cancer cells that play a smaller role in tumor recurrence and chemoresistance may explain why tumor regression does not necessarily translate into increased patient survival.
- reduction of bulk cancer cell populations has been shown in certain contexts to enrich CSC populations, thereby positively the most noxious cells, OCSCs, that are responsible for poor clinical outcomes.
- therapeutic approaches rely on chemical compounds (e.g., small molecule inhibitors) that selectively target OCSCs, thereby retarding CSC viability, spheroid formation, and/or limiting chemoresistance.
- OCSC candidates As described, a variety of OCSC candidates have been described, which may possess some or all of the features of bona fide OCSCs.
- ovarian cancer like other cancers, is a multi-etiological disease, variations in tumor cell origin, tissue compartment development, and/or other factors leads to the manifestation of disease subtypes, these subtypes exhibiting variations in clinical outcomes (e.g., chemoresistance, survival). Therefore, one may establish a preliminary OCSC signature, as obtained from cell lines, or clinical samples. Such preliminary OCSC signatures require further validation across a wider and more diverse array of cell lines and samples. This establishes those features consistently found across OCSC signatures from variable sources, thereby leading to establishment of a comprehensive, global OCSC signature.
- This comprehensive, global OCSC signature minimizes variation attributable to the cell source, thereby providing a biochemical definition of core transcriptional machinery responsible for providing the "stemness" characteristics of OCSCs, and one of that is agnostic to the originating source material.
- OCSC global OCSC signature
- isolating OCSC candidates from surgical specimens and other ovarian cancer cell lines (Table 6). Further comparison with existing studies on OCSC candidates can also prove to be informative. An example of a meta-analysis conducted across existing studies is shown (Table 7).
- RNA can be extracted, and expression of OCSC biomarkers can be measured by Affymetrix Human Gene Array or quantitative real-time PCR. Non-CSCs isolated from each sample serve as controls to identify those genes uniquely upregulated in OCSCs. Table 6.
- OCSC Markers to be Used to Isolate OCSC Candidates CSC marker Sample Expected CSC % CD133+*ALDH1+ Solid tumors, ascites 0.1 % CD133+ Solid tumors, ascites 1-20 % CD133+ OVCAR8 cell line** 40 % *ALDH1+ OVCAR8 cell line 1.9 % *ALDH1+ HEY1 cell line** 6.5 % * ALDH1 activity is determined by ALDEFLUOR kit (Stem cell technologies, Inc). **CD133+ALDH1+ population exists under ⁇ 0.03% in these cell lines. Table 7. Meta-Analysis of Cancer Stem Cell Microarray Data Comparison CSC v.
- establishing the predictive power of an OCSC signature can be determined by utilizing high-throughput qRT-PCR of the validated OCSC biomarkers in patient samples.
- One example includes the ABI Open Array® Real-time PCR system, wherein custom-designed array plates containing validated TaqMan ® Real-time probes for 50 ovarian CSC identified biomarkers in duplicate are applied to patient samples.
- Various endogenous controls ACTB, GAPDH, 18s rRNA, GUSB, PPIA, TBP, RPLP0, RPL4 are used for each plate for the normalization of all plates and samples.
- OCSC biomarkers Some examples of validation of preliminary OCSC biomarkers are shown in Fig. 4 .
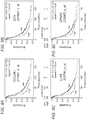
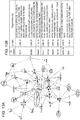
- Enhanced expression of OCSC biomarkers is confirmed, as drawn from CD133+ALDH+ ovarian cancer stem cells (OCSCs) candidates, and CD133-ALDH- non-OCSC cells. It is clearly observed that OCSC biomarkers are highly expressed in OCSC when compared to non-OCSC cells. This includes the example OCSC signature "hub" genes, aldehyde dehydrogenase 1 family member a2 (ALDH1A2), fibroblast growth factor 1 (FGF1), and thrombospondin (THBS1).
- ALDH1A2 aldehyde dehydrogenase 1 family member a2
- FGF1 fibroblast growth factor 1
- THBS1 thrombospondin
- the expression data obtained from the qRT-PCR arrays are then matched to each patient clinical data.
- clinical features for analysis include FIGO stage, tumor grade, chemotherapy resistance, and survival.
- OCSC biomarkers such as ALDH1A2, ANGPTL4, COL1A2, COL3A1, COL6A1, EFEMP1, HOXA10, LUM, SPP1, TGFB2, THBS1, and TMEM47 also serve as effective predictors of poor overall survival outcomes as shown in Fig. 11 .
- an OCSC signature is analyzed using Connectivity Map (http://www.broadinstitute.org/cmap/) public database, which predicts candidate drugs modulating expression of a specific gene signature.
- Connectivity Map http://www.broadinstitute.org/cmap/
- Connectivity Map pattern-matching of the query (e.g. OCSC gene signature) with a reference collection of gene expression profiles from cultured human cells treated with bioactive small molecules.
- Another example is the Ingenuity Pathway Analysis application described above. Application of Connectivity Map or Ingenuity Analysis with the ovarian CSC signature allows identification of compounds that repress, modulate, or alter targets associated with the OCSC signature.
- TGF-beta 1 and 2 are associated with OCSC signature and are effective predictors of poor survival.
- TGF-beta is known to be an important signaling pathway involved in stem cell development, including regulation of epithelial to mesenchymal transition, aberrant TGF-beta regulation may be a key mechanism underlying the role of OCSC in tumor formation and disease progression.
- application of the Ingenuity Pathway Analysis demonstrates that several OCSC signature biomarkers are regulated by TGF-beta pathway proteins.
- OCSC biomarkers include ACTA2, ADAM12, COL11A1, COL3A1, COL5A1, COL6A2, CYR61, DCN, FN1, GREM1, LOX, POSTN, SNAI2, SPARC, TAGLN, TIMP3, VCAN, and/or VIM.
- Upstream TGF-beta patheway regulators are listed in Table 8, along with their corresponding OCSC biomarkers. Each of these biomarkers could serve as targets of therapies that inhibit aberrant TGF pathway function, demonstrating the utility of a OCSC in developing personalized therapeutic strategies. Table 8.
- OCSC signature allows identification of not only individual targets that interact in a biochemical network, but specific "hub” genes that may amplify and enhance the role of many complementary targets involved OCSC survival. Without being bound by any particular theory, it is believed that repression, modulation, or alteration of these specific "hub” genes may prove to be more effective in dismantling the biochemical machinery underlying cancer pathogenesis, in contrast to disruption of individual targets involved in the growth and development of cancer.
- fibroblastic growth factor-1 FGF1
- fibronectin FN1
- Fig.2D fibronectin
- Ovarian cancer stem cells are rare cells, perhaps accounting for less than 1% of the total cell population in a clinical sample or cultured cell lines. Most ovarian cancer patients have bulky tumors and/or extensive metastatic spread at the time of diagnosis, and can provide a large volume of tumor and ascites from a single patient. Enriching for OCSC candidates can be performed by first pooling OCSC candidate using single markers (e.g., CD133 or ALDH1), to isolate more abundant populations for analysis. A second approach can be to induce greater numbers of ovarian CSC population by adding BMP2 to cell lines.
- single markers e.g., CD133 or ALDH1
- Identifying metabolites specific to CSCs is accomplished through comprehensive, high-throughput metabolic profiling of OCSCs and non-CSCs.
- ALDH1+CD133+ OCSC candidates and ALDH1-CD133- cell populations are isolated from both surgical specimens and A2780 human ovarian cancer cell line. After sorting, cells are harvested and frozen at -80°C. Metabolites are extracted from frozen cell pellets and analyzed by GC/MS and LC/MS platforms. Metabolites will be identified by comparison to library entries of purified standards or recurrent unknown entities. Welch's two-sample t-tests are used to identify metabolites that differ significantly between OCSCs and non-CSCs. Significantly altered metabolites will be put into the context of biochemical pathways after statistical analysis and data curation.
- Initial integration of metabolome and transcriptome data is provided by first applying the preliminary expression profiling data establishing an OCSC signature via microarray, as well as qRT-PCR data obtained from the validated OCSC global signature to develop a mechanistic model of signaling in OCSCs.
- OCSC signature via microarray
- qRT-PCR data obtained from the validated OCSC global signature
- enrichment of isolated OCSCs can be performed by pooling sorted cell populations from multiple surgical samples, inducing ovarian CSC population by adding BMP2 to cell lines, or using single markers (e.g., CD133 or ALDH1) to isolate more abundant populations of OCSC candidates including OCSCs.
- single markers e.g., CD133 or ALDH1
- OCSC candidates may display some variation in metabolic properties
- application of additional stem cell markers, such as CD44 to isolate OCSCs allows further comparison of the levels of several key metabolites and transcripts to those in ALDH1+CD133+ cell populations.
- Solid tumors are now understood to be complex "organs" comprised of not only malignant cells, such as OCSCs, but also non-malignant cells, thus, while OCSCs clearly play an important role in cancer disease progression, it is of paramount interest to identify the relative contribution of OCSCs in the overall context of tumor formation. For example, the relationship amongst OCSC and surrounding stromal cells is not totally understood. Better understanding processes would aid understanding of tumor formation events, as the roles for these cell types in tumor progression and metastasis are not well defined.
- stroma Various non-malignant cell types are typically lumped together as tumor “stroma”, and include fibroblasts, resident epithelial cells, immune cells, endothelial cells, pericytes, myofibroblasts and various mesenchymal stem cell types (MSCs) from recruited from bone marrow, fat, and connective tissues.
- MSCs mesenchymal stem cell types
- Fig. 5 Primary cell lines (C lines) were generated by isolating ovarian surface epithelial cells from p53-/- mice and introducing various combinations of c-myc, K-ras, and Akt oncogenes in vitro ( Fig. 5A ). Primary cell lines were then intraperitoneally injected into nude mice. To establish corresponding metastatic cell lines (T lines), tumor nodules were then isolated from the intestinal lining ( Fig. 5B,5C ).
- RFP red fluorescent protein
- MSCs human immortalized mesenchymal stem cells
- stromal cells derived from the normal ovary and mouse adipocytes
- GFP green fluorescent protein
- fibroblasts for example, distinguishing between upregulated genes in malignant cells or instead, are the result of cells recruited by the tumor, such as fibroblasts, pericytes, immune cells, and bone marrow or fat MSCs
- human ovarian cancer cell line SKOV3-GFP are used for intraperitoneal injection.
- Application of human- and mouse-specific PCR primers for selected genes that overlap between the human and mouse i.e. COL11A1, CXCL12, and POSTN
- COL11A1, CXCL12, and POSTN allows determination of whether the signature in the tumor is of human or mouse origin.
- biomarkers originating from human cancer cells would result in PCR products with human primers but not mouse primers.
- biomarkers originating in mouse cells recruited to the tumor would lead to an increase in PCR products with mouse primers, but not human primers.
- stromal cells Another helpful insight on the contribution of stromal cells is provided by three different types of RFP-labeled stromal cell lines of human origin: human MSCs, fibroblasts, and stromal cells from the normal ovary ( Fig. 6 ). Each of these cell lines can be co-injected with the C11-GFP mouse ovarian cancer cell line into mice for the development of carcinomatosis.
- the presence of RFP-labeled stromal cells within the tumors will be determined by immunofluorescent visualization of frozen tumor sections and by fluorescence cell sorting.
- the expression levels of the biomarkers will be determined using human- and mouse-specific PCR primers as described above.
- stromal cells enhance tumor growth in xenografts, this approach identifies specific contributions of certain stromal cell types to tumor formation.
- FACS fluorescence cell sorting
- RNA isolation for expression profiling using qRT-PCR.or human- and mouse-specific microarrays. This approach identifies altered gene expression patterns that are involved in lineage-specific differentiation, and can further identify the specific contribution of differentiated adipocytes, osteocytes and chondrocytes to tumor formation. Further, co-injection with ovarian cancer cells further answers the question of whether the presence of cancer cells affects differentiation status (i.e. over-representation of genes involved in de-differentiation).
- Ovarian cancer disease signature molecular subgroups, patient prognosis and survival
- OCSC ovarian cancer disease signature
- OCDS OCDS along different experimental designs allows one to capture the breadth of molecular heterogeneity of gynecological cancers, particularly as cancer is a multi-etiological disease likely to arise from a variety of biological factors.
- An example of this data is provided by analysis of The Cancer Genome Atlast (TCGA) dataset, which includes ovarian serous cystadenocarcinoma. Analysis of this data by Orsulic et al. identified a 86 OCDS biomarker signature presented in Table 3, as associated with poor survivial.
- a second example includes identification of individual genes that correlated with prognosis, such as the identification of genes associated with suboptimally debulked tumor, using the data set by Bonome et al. Bonome et al., (2008) A gene signature predicting for survival in suboptimally debulked patients with ovarian cancer. Cancer Res,68:5478-86 . Prognostic classification of this data, such as poor patient response to therapeutic treatment, identified a 68 OCDS biomarker signature, as analyzed by Cui et al. and shown in Table 4.
- Variation in experimental design is likely to best capture the molecular heterogeneity of the disease, and aid the understanding the cellular context of the poor-prognosis gene signature and disassembling the gene signature network.
- the OCDS provided by each study outperforms the predictive power of individual genes.
- Ovarian cancer fixed signature (OCFS)
- OCDS ovarian cancer disease signatures
- Table 1 ovarian cancer disease signature
- Table 2 ovarian cancer disease signatures
- three expression studies provided OCDS focused on gene clustering associated with: 1) poor survival (Orsulic et al .), 2) poor prognosis (Cui et al .), and 3) periostin (POSTN) co-expressing genes (Karlan et al .)
- POSTN periostin
- a composite of OCDS biomarkers helps identify the overlapping biomarkers which mayidentify core programming as associated with ovarian cancer, while eliminating outliers.
- OCFS ovarian cancer fixed signature
- OCFS ovarian cancer fixed signature
- the application of different data sets and different approaches to OCDS identification revealed preliminary OCFS indicating poor-prognosis, as substantially overlapping between the four studies ( Fig. 7A ). It is notable that one gene (COL11A1) is present in all four signatures, while 21 genes listed in Fig. 7B are present in at least three of the four poor prognosis OCDS.
- a 21-gene OCFS representing candidates present in three of four studies provides an preliminary "fixed signature" for further refinement.
- These 21 genes include ACTA2, ADAM12, AEBP1, COL11A1, COL3A1, COL5A1, COL6A2, CYR61, DCN, FN1, GREM1, LOX, LUM, POSTN, SNAI2, SPARC, TAGLN, THBS2, TIMP3, VCAN, VIM.
- a 101-gene OCFS represents candidates present in two of four studies, thereby allowing one to encompass heterogeneity of molecular subtypes.
- 101-genes include ACTA2, ACTG2, ADAM12, ADH1B, AEBP1, ALDH1A1, ALDH1A2, ANGPTL2, ASPN, C1QTNF3, CALD1, CAV1, CD36, CD248, CNN1, COL10A1, COL11A1, COL1A2, COL1A1, COL3A1, COL5A1, COL5A2, COL6A2, COLEC12, COMP, CTSK, CXCL14, CXCL12, CYP1B1, CYR61, DCN, DOCK11, DUSP1, ECM1, EDNRA, EFEMP1, EGR1, ELL2, EPYC, FAP, FBLN1, FBLN2, FBN1, FGF1, FN1, FOSB, GPNMB, GREM1, GUCY1A3, HBB, HOXA7, IGFBP5, IL6, IL7R, INHBA, ITGBL1, LAMA4, LAMB1, LOX, LOXL1, LUM, MAL
- any new prognostic assay will depend on whether it provides therapeutically relevant information that is superior to the well-validated clinical variables.
- the objective of our statistical analysis is to correlate progression-free survival (PFS) with gene expression to estimate if a gene expression signature can provide prognostic information beyond the existing standard in clinical practice. Optimization and validation of the 21-gene OCFSwill be done in Three Phases as described below.
- Ovarian cancer fixed signature (OCFS) derivation Ovarian cancer fixed signature
- OCFS ovarian cancer fixed signature
- SPC Supervised Principal Components regression
- Ovarian cancer fixed signature (OCFS) validation Ovarian cancer fixed signature validation.
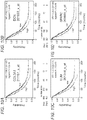
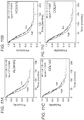
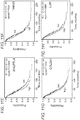
- Additional examples of analyzing publicly available datasets for signature validation demonstrates the capability of individual biomarkers to predict specific clinical outcomes. For example, analysis across multiple data sets identified several biomarkers,that served as strong predictors of specific clinical outcomes. As shown in Fig. 9 , high expression of COL3A1, DCN, LUM, SPARC, VCAN, COL11A1, COL5A1 and POSTN were individually predictive of poor progression-free survival when highly expressed, as shown by analysis across multiple data sets encompassing a total of 1,107 patients. Likewise, as shown in Fig.
- biomarkers 10 other clinical parameters, such as poor overall survival, were effectively predicted by high expression of individual biomarkers, COL3A1, DCN, LUM, SPARC, TIMP3, and VCAM, as shown by analysis across multiple datasets encompassing 1,339 patients.
- Combination of biomarkers, as shown in Fig. 10H and 10I demonstrates the enhanced predictive power of using a panel of biomarkers, wherein high expression is highly predictive of overall survival.
- the 21-gene signature was not enriched when the primary cell lines were compared to the primary cell lines or when the metastatic cell lines were compared to the metastatic cell lines (i.e. comparison of 3 myc+Kras vs. 3 Akt+myc cell lines).
- the presence of the 21-gene signature in mouse primary vs. metastatic cell lines indicates that a process similar to human ovarian cancer progression occurs in the mouse model.
- this mouse model can be used to study the cellular context of the biomarkers.
- TCGA high-grade, advanced-stage, primary serous ovarian carcinoma samples
- GSE26712 dataset
- Karlan dataset
- the Inventors evaluated the potential predictive value of the 10-gene signature in the three discovery datasets and one independent validation dataset by comparing survival in patient groups with 'high' and 'low' expression of the 10 genes.
- IPA Ingenuity Pathway Analysis
- the Inventors treated the human ovarian stromal cell line TRS3 and the ovarian cancer cell line OVCAR3 with TGF ⁇ 1 and measured mRNA expression of the 10 poor outcome genes before and after TGF ⁇ 1 treatment.
- OCFS genes are enriched during ovarian cancer progression by using another method of mRNA detection (qPCR) in an independent patient cohort that included 8 normal ovaries, 30 primary serous ovarian tumors, and 29 metastatic serous ovarian tumors from the Women's Cancer Program Biorepository ( Fig. 21 ).
- Inventors conducted an unbiased global identification of genes that are differentially expressed between primary tumors and metastases using nine matched pairs of primary ovarian tumors and omental metastases (GSE30587 dataset).
- the top 20 gene probes that exhibited increased expression in metastases are ranked according to statistical significance in Fig 3B .
- This analysis showed a marked overlap between our poor prognosis signature genes and genes that are enriched in metastases ( Fig. 14B ).
- One of our signature genes, COL11A1 was identified as the most statistically significant differentially expressed gene in the nine matched pairs of primary and metastatic tumor samples ( Fig. 14B ).
- Fig. 14C shows COL11A1 mRNA expression values in matched pairs of primary ovarian tumors and omental metastases in the nine matched tumor pairs.
- COL11A1 is a marker of tumor progression
- the Inventors relied on in situ hybridization in 10 patients with "triplet" samples (primary ovarian cancer, concurrent metastasis, and recurrent/persistent metastasis) and eight additional patients with matched primary ovarian cancer and recurrent/persistent metastatic tumor.
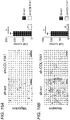
- COL11A1 expression increased in the recurrent/persistent metastasis compared to the matched primary ovarian tumor ( Fig. 15A ,B and Fig. 21 ).
- COL11A1 exhibited the lowest levels in primary ovarian cancer samples, medium levels in concurrent metastases, and highest levels in recurrent/persistent metastases ( Fig. 15A ).
- Representative in situ hybridization images for Patient 1 are shown in Fig. 15B .
- serial sections from primary ovary, concurrent metastatic, and recurrent/persistent metastatic tumors were stained for the COL11A1 protein using immunohistochemistry.
- COL11A1 protein levels and pattern of expression in these serial sections were consistent with COL11A1 RNA levels and pattern of expression ( Fig. 15B ); however, in situ hybridization provided a higher-resolution signal at a cellular level.
- COL11A1 expression was predominantly confined to stromal cells although rare clusters of positive epithelial cells were observed in some tumors ( Fig. 15C ).
- COL11A1 was specifically expressed in the intra/peri-tumoral stromal cells while stromal cells >1 mm from the epithelial tumor cells were always negative ( Fig. 15D and Fig. 22 ).
- COL11A1 has a functional role in tumor progression
- a mouse tumor xenograft model with A2780 human ovarian cancer cells was used. Despite their epithelial morphology, these cells exhibit a mesenchymal-like expression profile, including low levels of E-cadherin and high levels of N-cadherin proteins (Ruby Huang, Cancer Science Institute of Singapore, personal communication).
- A2780 cells have relatively high levels of endogenous COL11A1 and thus may represent the small subset of COL11A1-expressing epithelial tumor cells that the Inventors observed in patient tumors ( Fig. 15C ).
- COL11A1 expression in A2780 cells was silenced using shRNA lentiviral particles.
- the OCFS 10-gene signature is robust in its ability to predict poor survival as demonstrated in two large validation datasets consisting of 260 ovarian cancer patient samples and 1,058 pooled ovarian cancer patient samples.
- individual genes or groups of genes from the OCFS 10- gene signature including COL11A1, POSTN, SNAI2, THBS2 and TIMP3, have also been associated with poor survival in other solid tumors including breast, colorectal, lung, oral, and head and neck carcinomas as well as melanoma, suggesting that expression of this signature is not specific to ovarian cancer but might characterize aggressive behavior across cancer types.
- OCFS 10-gene signature Another major strength of the OCFS 10-gene signature is its clear biological relevance to cancer progression.
- Previously identified gene signatures in ovarian cancer consist of genes that are involved in many diverse biological processes, making it difficult to assess their biological relevance or functional role in cancer progression.
- All 10 of the OCFS signature genes are present in the 351-gene signature that was identified as upregulated in invasive ductal carcinoma (IDC) when compared to noninvasive ductal carcinoma in situ (DCIS), supporting the important role of these genes in early local invasion.
- IDC invasive ductal carcinoma
- DCIS noninvasive ductal carcinoma in situ
- the Inventors further showed that the 10 signature genes are highly enriched in metastases and that knockdown of one of these genes, COL11A1, results in reduced cell migration, invasion, and tumor progression, suggesting that collagen remodeling could be important in ovarian cancer progression and metastasis.
- the higher expression of 10 genes in metastasis does not appear to be due to a higher stroma-to-t
- tumor samples from the TCGA dataset were selected to have >70% tumor cells.
- the Inventors did not observe different expression levels of the epithelial marker, EPCAM, and the stromal marker, vimentin, in metastatic tumors compared to primary tumors ( Fig. 14A ), indicating that the stroma-to-tumor ratio is not significantly different between samples of primary tumors and metastases.
- in situ hybridization results showed that regardless of the overall amount of stroma in tumor sections, COL11A1 expression was confined to intra-/peri-tumoral stromal cells and rare foci of tumor epithelial cells, while stromal cells that were >1 mm from epithelial tumor cells were completely negative ( Fig. 15B-D ).
- COL11A1 is a specific marker of carcinoma-associated fibroblasts (CAFs) and possibly cancer cells that are undergoing EMT.
- CAFs carcinoma-associated fibroblasts
- Collagen-rich stroma is thought to maintain tissue architecture and, under normal conditions, serve as a barrier to epithelial cell migration. However, when modified by cancer cells, collagen-rich stroma can promote tumor progression. Enhanced collagen deposition and cross-linking has been shown to increase breast cancer risk. Increased levels of LOX, an enzyme responsible for collagen cross-link formation, result in increased collagen stiffness. POSTN also promotes collagen cross-linking by interacting with BMP-1 to enhance the proteolytic activity of LOX, which results in the reorganization of loose connective tissue into linear tracks of fibers that promote chemotaxis of tumor cells). Furthermore, increased collagen deposition and remodeling increases interstitial pressure, thereby severely compromising the efficacy of drug delivery. Of particular interest, an increase in collagen expression and remodeling has been associated with cisplatin resistance in ovarian cancer, suggesting that cisplatin resistance might be one of the factors contributing to poor survival.
- the clinically-relevant strength of the OCFS 10-gene signature is that it can be not only used as a biomarker to identify patients with poor outcome but also as a guide to individualize their therapy.
- POSTN an extracellular matrix protein that is highly expressed in late-stage ovarian cance, is thought to play a role in metastatic colonization by forming a niche for cancer stem cells.
- Treatment with a POSTN-neutralizing antibody led to a significant decrease in ovarian tumor growth and metastasis in a mouse model.
- inhibiting LOX by treatment with ⁇ -aminopropionitrile, neutralizing antibodies, or RNA interference inhibited tumor metastasis in xenograft and transgenic mouse models.
- the COL11A1 knockdown result suggests that targeting collagen might be an effective approach to preventing ovarian cancer progression and metastasis.
- CMPs collagen mimetic peptides
- MMP matrix metalloproteinase
- TGF ⁇ 1 signaling activity was reported in patients with metastatic ovarian cancer and the antibody against TGF ⁇ was shown to be effective in suppressing metastasis in a preclinical model of ovarian cancer.
- TGF ⁇ 1 inhibitors in phase I/II clinical trials. It will be important to test the effectiveness of these agents as inhibitors of ovarian cancer progression and metastasis as single agents or in combination with chemotherapy.
- OCFS 10-gene signature assay will effectively enhance physicians' abilities to identify patients with a high likelihood of recurrence.
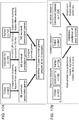
- Fig. 8A shows the triage map of current clinical practice and the point of care at which our gene signature test will be of clinical value.
- a Nanostring assay can be developed for the detection and quantification of the gene signature transcripts. This system is favored for accurate detection of transcripts in paraffin samples without relying on cDNA synthesis or PCR amplification. Assay development paraffin blocks from patients linked to a detailed correlative database with clinical variables, including recurrences. Cox regression of the log hazard ratio on a covariate with a standard deviation of 1.5 based on a sample of 100 observations achieves 85%, and 95%, power at a 0.05 significance level to detect a regression coefficient (log hazard ratio) equal to 0.2 and 0.25 respectively. Sample size can adjusted for an anticipated event rate of 80%.
- Model performance can be assess with (1) calibration measures to study the agreement between the observed outcome frequencies and predicted probabilities, (2) discrimination (classification) measures to distinguish subjects with different outcomes at each time cutoff point, and (3) prediction accuracy.
- Model calibration will be studied with a calibration curve in which observed frequencies are plotted against predicted probabilities. Ideally, if the observed frequencies and predicted probabilities agree over the whole range of probabilities, the plot will show a 45 degree line with an intercept of 0 and slope of 1. Therefore, Chi-square distribution with 2 degrees of freedom will be used to test the null hypothesis that the intercept is 0 and the slope is 1. Additionally, one can also use the Hosmer-Lemeshow (H-L) goodness-of-fit test for calibration validation. Both equal sizes and equal prediction-intervals will be used to group the patients into subgroups.
- H-L Hosmer-Lemeshow
- Cox regression based risk model Especially for the Cox regression based risk model, one can categorize patients into subgroups based on their distribution of relative risk with the Kaplan-Meier method and calculate the goodness-of-fit for calibration validation.
- AUC c-statistics
- F-measure will be computed to evaluate the prediction ability of the risk models given a cutoff time.
- the Global AUC summary (GAUCS) will also be used to estimate the performance of Cox regression based risk models.
- the OCFS 10-gene signature is enriched in metastatic ovarian cancer.
- the Inventors evaluated the expression levels of the 10-gene signature in Fig. 12A in primary and metastatic serous ovarian tumors.
- the GSE12172 dataset which includes 74 high-grade serous primary ovarian tumors and 16 unpaired metastatic tumors, higher expression levels of the 10 genes were observed in the metastatic tumors. This observation was further validated using qPCR in an independent patient cohort that included 8 normal, 30 primary, and 29 unpaired metastatic serous ovarian cancer samples from our biorepository.
- OCFS 10 signature genes were not expressed in normal ovaries, but their expression was enriched in primary tumors and even further enriched in metastases. Importantly, this indicates that during tumor progression, the cell population expressing the signature genes is enriched or the process resulting in the expression of the signature genes is intensified.
- the signature genes are expressed in both MSCs and CSCs.
- the Inventors searched the tissue/cell-specific transcripts in the TranscriptoNet database, which consists of >500 normal tissues and cell types that were isolated from >50 different organs by microdissection (i.e. epithelial cell of the endometrium) or by FACS using specific cell markers (i.e. 27 distinct blood cell types). Since the signature genes are highly co-regulated, the presence or absence of the signature was immediately apparent.
- the signature was present in only 3 normal cell types: undifferentiated pre-adipocytes (but not differentiated pre-adipocytes) from visceral, subcutaneous and omental fat; cardiomyocytes; and bone marrow MSCs.
- the common denominator to the 3 cell types is that they are all MSCs.
- OCSC OCDS
- OCFS signatures 1) as derived from epithelial cancer cells that de-differentiate into CSCs as derived from MSCs that are actively recruited to the tumor from fat and/or bone marrow or from local fibroblasts that de-differentiate into MSC 2) as derived process-specific mechanism, such as any cell undergoing de-differentiation or trans-differentiation into CSCs or MSCs will express the signature genes.
- process-specific mechanism such as any cell undergoing de-differentiation or trans-differentiation into CSCs or MSCs will express the signature genes.
- COL11A1 To identify the cell-of-origin for one of the signature genes, one can focus on COL11A1 as this gene is not expressed in most normal tissues but its expression is highly elevated in most cancer types in comparison to their respective normal tissue.
- the ratio of COL11A1-positive to COL11A1-negative cells also increased in metastatic vs. primary tumors.
- metastatic tumors contained more COL11A1-expressing cells, although it is unclear if these cells were recruited to the tumor or represented resident cells that converted into a COL11A1-expressing phenotype.
- COL11A1 is expressed in the stromal, rather than the epithelial, component of the tumor, however, the Inventors cannot exclude the possibility that the stromal cells are derived from epithelial cells through EMT.
- COL11A1 is expressed in stromal cells in close proximity ( ⁇ 1mm) to malignant epithelial cells while distant stromal cells and stromal cells encapsulating the tumor were negative, which is consistent with the idea that the COL11A1-expressing stromal cells are derived locally rather than recruited from distant sites.
- a helpful determination the cell-of-origin can rely on a cell tracking system, such as labeled human cancer cell lines as a source of malignant cancer cells and a mouse host as a source of stromal cells.
- a cell tracking system such as labeled human cancer cell lines as a source of malignant cancer cells and a mouse host as a source of stromal cells.
- a previously generated a mouse model by the Inventors in which defined genetic alterations can be introduced into ovarian surface epithelial cells can be applied for such studies.
- When such cells are implanted under the ovarian bursa, they give rise to primary ovarian tumors as well as metastatic nodules embedded into the peritoneal serosal surfaces, such as the peritoneal wall, intestinal lining, and omentum ( Fig. 23B ).
- Expression profiling revealed that many of the signature genes were enriched in the mouse metastatic tumors, with COL11A1 and POSTN showing the highest fold increase in metastatic vs. primary ovarian tumors ( Fig. 23B ). This is significant because COL11A1 and POSTN are among the genes that exhibit the highest fold increase in human metastatic vs. primary tumors, indicating that a process similar to human ovarian cancer metastatic progression occurs in the mouse model. As a result, this mouse model can be used to study the cellular context of the signature genes.
- the cell-of-origin for the signature transcripts may not be obvious as the majority of the signature genes encode secreted extracellular matrix proteins.
- Research groups who have identified similar collagen-remodeling gene sets as predictors of poor outcome in breast cancer have attempted to determine their cell-of-origin using laser capture of tumor epithelial and stromal cells but have reached contradictory conclusions.
- OCSC OCSC
- OCDS OCFS signatures
- multiple tumor types including breast, colon, and lung cancer
- multiple metastatic locations including local invasion in breast cancer and metastatic dissemination to various intraperitoneal organs in ovarian cancer
- Such signatures can be either specific to a certain cell type that is present in diverse tumor types (i.e. recruited macrophages or MSCs) or to a common biological process that occurs in diverse cell types (i.e. de-differentiation of cancer cells into CSCs or trans-differentiation of fibroblasts into myofibroblasts or MSCs).
- MSC macrophages
- de-differentiation of cancer cells into CSCs or trans-differentiation of fibroblasts into myofibroblasts or MSCs To accurately define the therapeutic target, it is important to identify the cellular context of the poor-prognosis signature gene expression.
- he signature genes are expressed in a specific cell type derived from either malignant cancer cells or host stromal cells. This can be determined using labeled cells of human and mouse origin in a mouse model of metastatic ovarian cancer progression.
- a key question is whether various signatures are derived from malignant cancer cells or host stromal cells. Many of the genes in the signature are known inducers of EMT and their expression in cancer cells may make these cells indistinguishable from non-tumor mesenchymal cells.
- Red fluorescence protein (RFP)-labeled OVCAR3 cells will be compacted using a hanging-drop technique and implanted under the ovarian bursa of nude mice.
- mice When the mice develop carcinomatosis, primary ovarian tumors and metastatic tumors will be harvested for 1) fluorescence activated cell sorting (FACS), 2) immunofluorescence (IF), and 3) qPCR.
- FACS fluorescence activated cell sorting
- IF immunofluorescence
- IF immunofluorescence
- POSTN BioVendor, RD172045100
- qPCR analysis will be used to determine the mRNA levels of COL11A1 and POSTN in RFP+ and RFP- cells of the primary and metastatic tumors.
- human- and mouse-specific PCR primers will provide a second layer of assurance that the signature genes are derived from human or mouse cells.
- Levels of COL11A1 and POSTN can be elevated in human and mouse metastatic vs. primary tumors. If the signature originates from human cancer cells, enrichment in the relative number of RFP+ cells expressing COL11A1 and POSTN in IF analysis and/or an increase of COL11A1 and POSTN expression levels (with human but not mouse PCR primers) in metastatic vs. primary RFP+ cells would be observed. If the signature originates from mouse host cells, enrichment in the relative number of RFP- cells expressing COL11A1 and POSTN by IF and/or an increase of COL11A1 and POSTN in metastatic vs. primary RFP- cells by qPCR (with mouse but not human primers) would be observed.
- COL11A1 and POSTN are elevated in both human RFP+ and mouse RFP- fractions, it is suggested that both human cancer cells and mouse nonmalignant cells upregulate the expression of COL11A1 and POSTN during the process of metastasis.
- cancer cells can generate CSCs through EMT.
- Patient outcome and drug resistance have also been linked to the properties of CSCs.
- the signature is enriched in patients with poor prognosis because their tumors contain more CSCs.
- COL11A1 and POSTN are among the top upregulated genes in OVCAR3 cell spheroids, which are enriched for CSCs.
- OVCAR3 xenografts To determine whether COL11A1 and POSTN are specifically overexpressed in the CSC population in OVCAR3 xenografts, one can isolate RFP+/ALDH1+ and RFP+/ALDH- tumor cells and compare expression of COL11A1 and POSTN in the two cell populations by qPCR and IF.
- signatures as arising from carcinoma-associated stroma may be of bone marrow origin or adipose tissue.
- Bone marrow from male C57BL6 mice expressing GFP under the ubiquitin promoter mice can be isolated and transplanted into lethally-irradiated female C57BL6 mice expressing RFP under the chicken albumin promoter. Successful engraftment can be determined after 4 weeks by >95% GFP expression in the peripheral blood and bone marrow (and death of control mice without bone marrow transplants).
- mice can be orthotopically implanted with syngeneic C57BL6 p53-/-;HA-myc;H-ras mouse ovarian cancer cells, which the Inventors recently generated and tested in mice.
- Primary and metastatic tumors typically form 4-5 weeks after implantation of hanging drop-compacted cells into female C57BL6 mice.
- the primary and metastatic tumors are then isolated and analyzed by FACS for the proportion of the cancer cells (HA+), recruited non-bone marrow cells (RFP+), and recruited bone marrow cells (GFP+).
- HA+ cancer cells
- RFP+ recruited non-bone marrow cells
- GFP+ bone marrow cells
- expression of COL11A1 and POSTN in metastatic tumors in the GFP+ cells indicates the bone marrow/adipose tissue origin of the signature while increased expression in the RFP+ cells will indicate that the signature originates in mouse cells other than the bone marrow/adipose tissue ( Fig. 24 ).
- An increase in both GFP+ and RFP+ cell populations indicates that both bone marrow/adipose tissue- and non-bone marrow/adipose tissue-derived cells contribute to the signature gene expression. If the signature genes are solely derived from non-cancer cells, there will be no increase in the signature genes in HA+ cells.
- COL11A1 Based on the described results, the Inventors have successfully targeted COL11A1 for reduction of tumor metastasis.
- One common feature of the signature genes is their extracellular matrix localization and involvement in collagen remodeling, suggesting that collagen remodeling might be a common biological process that contributes to cancer progression and poor overall survival.
- the Inventors selected COL11A1 because this gene is highly expressed in most solid tumors but, importantly, not expressed in most normal tissues.
- COL11A1 expression was silenced using shRNA in the A2780 human ovarian cancer cell line, which has high levels of endogenous COL11A1. Knockdown of COL11A1 did not affect cell proliferation ( Fig. 25A ), however, it resulted in significantly decreased cell migration and invasion in vitro ( Fig. 25B ).
- the Inventors injected nude mice with scrambled shRNA (sh-scr) A2780 cells or COL11A1-specific shRNA (sh-COL11A1) A2780 cells. After 14 days, the mice injected with sh-scr A2780 cells developed large disseminated tumors while the mice with sh-COL11A1 A2780 cells developed small focal tumors ( Fig. 25C , D ). This result suggests that targeting collagen might be an effective approach to preventing ovarian cancer invasion and metastasis.
- TGF ⁇ plays a crucial role in almost every aspect of tumor progression and metastasis.
- increased TGF ⁇ 1 signaling activity was reported in metastatic ovarian tumors in comparison to matched primary ovarian tumors and the antibody against TGF ⁇ was shown to be effective in suppressing metastasis in preclinical models of ovarian cancer.
- TGF ⁇ inhibitors in phase I/II clinical trials. It will be important to test the effectiveness of these agents as inhibitors of ovarian cancer progression and metastasis as single agents or in combination with chemotherapy.
- the Inventors applied Ingenuity Pathway Analysis to the 61 signature genes in Fig. 12A and identified TGF ⁇ 1, TGF ⁇ 2, TGF ⁇ 3, SMAD3, and SMAD7 as top transcription factors regulating expression of the signature genes.
- TGF ⁇ 1 TGF ⁇ 2, TGF ⁇ 3, SMAD3, and SMAD7 as top transcription factors regulating expression of the signature genes.
- the Inventors treated the human ovarian cancer cell line OVCAR3 (exhibits low endogenous levels of the signature genes) with TGF ⁇ 1 and measured mRNA expression of the genes before and after TGF ⁇ 1 treatment.
- the 10 OCFS genes showed slightly different induction times in the presence of TGF ⁇ 1.
- TGF ⁇ inhibitor TGF ⁇ inhibitor
- 1D11 TGF ⁇ neutralizing antibody
- TGF ⁇ signaling is completely impaired in stromal cells, such as mice with a conditional knockout of the TGF ⁇ type II receptor.
- TGF ⁇ signaling is completely impaired in stromal cells
- mice with a conditional knockout of the TGF ⁇ type II receptor One can have inject the described syngeneic mouse ovarian cancer cells i.p. into Tgfbr2 KO mice.
- preliminary results indicate that growth of ovarian cancer is inhibited upon knockout of the TGF ⁇ type II receptor in mouse stromal cells. Additional experiments can be done to verify this result and determine the effect of the stromal TGF ⁇ type II receptor knockout on the proportion of CSCs and recruitment of stromal cells to the tumor.
- TGF ⁇ signaling Both pro- and anti-tumorigenic activities have been documented for TGF ⁇ signaling in different cancer types, based on the observed increase of TGF ⁇ 1 signaling in metastatic ovarian cancer, the suppression of metastasis upon TGF ⁇ 1 inhibition in mouse models of ovarian cancer, and our observation that TGF ⁇ induces expression of the signature genes, one anticipates that inhibition of TGF ⁇ signaling by pharmacologic (A83-01), biologic (1D11) or genetic (Tgfbr2 KO mice) means will have a negative effect on the expression of the signature genes with the resultant loss of a nurturing environment for CSCs and an increased chemosensitivity to cisplatin.
- pharmacologic A83-01
- biologic (1D11) or genetic Tgfbr2 KO mice
- collagen-rich stroma maintains tissue architecture and serves as a barrier to epithelial cell migration, it can turn into a collaborator of cancer progression when modified by malignant cancer cells.
- enhanced collagen deposition and cross-linking is associated with mammographic density, which is one of the greatest risk factors for breast cancer.
- collagen I is enriched and aligned at the stromal border in breast tumors and changes in collagen I organization are associated with poor prognosis in breast cancer.
- a rodent model with increased collagen deposition due to altered collagen degradation exhibited increased mammary tumor formation and progression to metastasis.
- POSTN also promotes collagen cross-linking by interacting with BMP-1 to enhance the proteolytic activity of LOX. This results in the reorganization of loose connective tissue into linear tracks of fibers that serve as highways to promote chemotaxis of tumor cells. Indeed, breast cancer studies using live imaging have demonstrated that cancer cells migrate on collagen fibers in areas enriched in collagen. Collagen stiffness has also been shown to regulate stem cell differentiation and EMT.
- collagen deposition and remodeling increases interstitial pressure, which severely compromises the efficacy of drug delivery.
- remodeling of the ECM through overexpression of COL6A3 in tumor cells was shown to contribute to cisplatin resistance in ovarian cancer.
- the reduction in collagen stiffness can repress the malignant behavior of mammary epithelial cells and administration of collagenase increased the uptake and distribution of monoclonal antibodies in a mouse model of osteosarcoma.
- collagen degradation may be an effective approach to targeting the gene signature network. It remains to be determined whether ECM stiffness in cancer may be restored to normal and how such a restoration may benefit treatment prognosis.
- miRNA micro RNA
- the miRNA-29 family specifically miR-29b, was recently shown to inhibit tumor metastasis by targeting a network of collagen-remodeling genes.
- miRNAs have not yet been fully adapted for use in the clinic, significant progress has been made in improving the specificity of delivery.
- Fig. 8A shows an exemplary triage map of current clinical practice and the point of care at which various OCSC, OCDS, and OCFS signatures provide specific clinical guidance value.
- qRT-PCR quantitative real-time PCR
- microarrays are not cost-effective for use in the clinic.
- a variety of qRT-PCR platforms can be utilized for detection and quantification of OCSC, OCDS, and OCFS transcripts derived from ovarian cancer samples. This includes ABI TaqMan® OpenArray® Real-Time PCR ( Fig. 8B ). In each instance, it may be highly desirable to design arrays such that custom-selected probes for each gene in the signature are represented in quadruplicates measurements, thereby eliminating outlier measurements and potential false-positive amplifications.
- a variety of housekeeping genes such as GUSB, PPIA, TBP, RPLP0, RPL4, 18S, ACTB, and GAPDH, each provide baseline expression transcripts measurements that provide assay normalization. Examples of normalization measurements include delta cycle-threshold measurements.
- qRT-PCR is performed on 112 patient samples that previously used for microarray analysis in one of the three discovery data sets used for identification of periostin (POSTN)-coexpressing genes.
- This particular data set includes a correlative clinical database with approximately 300 clinical variables, including patient history, symptoms, treatment, other cancer history, surgeries, recurrences and survival status.
- RNA will be extracted from both frozen and paraffin-embedded primary ovarian cancer samples and reverse transcribed to obtain cDNA.
- Phase 1 After normalization, the expression of various OCSC, OCDS, and OCFS biomarkers are further correlated with clinical outcomes, including progression-free survival (PFS) and overall survival (OS). From Phase 1, the Inventors expect to have approximately 10 genes that are optimized for the prediction of clinical outcomes.
- the methods described in Phase 1 will be employed to derive a gene signature for each time to event endpoint, PFS and OS.
- Model validation will be performed using each of the methods described in Phase 2 by randomly splitting the set of 112 patient samples into a 2/3 training set and a 1/3 validation set.
- the high levels of statistical robustness may limit the maximum number of genes that are highly correlated with overall survival that overlap when using any of the four statistical methods described in Phase 1 is less than 8. In such instances, one can identify the largest subset of genes whose expressions are available and common to at least three studies and use that particular set for identifying the signature.
- biomarkers including COL11A1, LOX, POSTN, THBS2, and VCAN
- the inventors have validated in pre-clinical models two of the biomarkers, CXCL12 and periostin (POSTN), as suitable targets for ovarian cancer treatment. These results demonstrate that OCSC, OCDS, and OCFS biomarkers are not only predictors of poor survival but also play important roles in tumor progression and thus could be used as therapeutic targets.
- ovarian cancer To test the effectiveness of targeting individual biomarkers in a mouse model of ovarian cancer, one can identify genes that are significant in ovarian cancer progression, functional assays are necessary. Such assays should identify if the candidate genes are sufficient and required for tumor maintenance and progression and, thus, could be used for targeted therapy. One can functionally characterize the contribution of selected genes to ovarian cancer pathogenesis using a genetically relevant mouse model. Also, one can test inhibitors and small molecules specific for candidate signature network genes for their effectiveness to reduce cancer progression and increase chemosensitivity to cisplatin.
- EMT epithelial-mesenchymal transition
- a similar approach may rely on antibodies, nucleic acids, pepttides and/or proteins, or other biologics to severely defect OCSC function.
- small interfering RNA (siRNA) or short-hairpin RNA (shRNA) knockdown of FGF1 and FN1 gene expression transcript could achieve these effects.
- Another example includes targeting of other adhesion markers, such as L1CAM.
- an OCSC-specific antibody could be applied, which targets antigens that could be uniquely, or highly expressed in OCSCs. Examples include antibodies specific for chemoresistance mediator, ABCC5, or surface markers, CD24, CD44, CD117, CD133 or ALDH.
- collagen-rich stroma maintains tissue architecture and serves as a barrier to epithelial cell migration, it can turn into a collaborator of cancer progression when modified by malignant cancer cells.
- enhanced collagen deposition and cross-linking is associated with mammographic density, which is one of the greatest risk factors for breast cancer.
- mammographic density which is one of the greatest risk factors for breast cancer.
- collagen deposition contributes to cancer formation, as an animal model with increased collagen deposition due to altered collagen degradation exhibit increased mammary tumor formation and progression to metastasis.
- collagen deposition increased levels of LOX, an enzyme responsible for collagen cross-link formation, results in increased collagen stiffness.
- POSTN also promotes collagen cross-linking by interacting with BMP-1 to enhance the proteolytic activity of LOX. This results in the reorganization of loose connective tissue into linear tracks of fibers that serve as highways to promote chemotaxis of tumor cells. Indeed, breast cancer studies using live imaging have demonstrated that cancer cells migrate on collagen fibers in areas enriched in collagen. Collagen stiffness has also been shown to regulate stem cell differentiation, although the molecular mechanisms of how collagen composition regulates decisions between stem cell expansion and differentiation are not well understood. Furthermore, increased collagen deposition and remodeling increases interstitial pressure, which severely compromises the efficacy of drug delivery.
- collagen stiffness can repress the malignant behavior of mammary epithelial cells, and administration of collagenase increased the uptake and distribution of monoclonal antibodies in a mouse model of osteosarcoma.
- collagen degradation by may be an effective approach to targeting the gene signature network. Therefore, one can test the effectiveness of collagenase in reducing ovarian cancer growth and/or increasing sensitivity to chemotherapy.
- Collagenase clostridium histolyticum XIAFLEX
- XIAFLEX can be used for intraperitoneal injections because this drug has been approved by the FDA for Dupuytren contracture (clinicaltrials.gov; NCT00528606) and is commercially available.
- biomarkers will be effective in reducing tumor growth and/or increasing sensitivity to cisplatin. If the main mechanism by which the biomarkers contribute to tumor progression is collagen deposition and cross-linking, loosening the collagen matrix with collagenase may be the most effective way to inhibit the entire network of biomarkers.
- TGF- ⁇ signaling antagonist agents There are many TGF- ⁇ signaling antagonist agents under development at both the pre-clinical and clinical stages.
- Some major classes of TGF- ⁇ inhibitors include ligand traps, antisense oligonucleotides (ASO), small molecule receptor kinase inhibitors, and peptide aptamers.
- Ligand traps serve as a sink for the excess TGF- ⁇ produced by tumor cells and fibroblasts during cancer progression, which increases with aggressiveness and tumor stage.
- Ligand traps can also include anti-ligand neutralizing antibodies and soluble decoy receptor proteins that incorporate the ectodomains from either T ⁇ KII or ⁇ RIII/betaglycan protein.
- Neutralizing antibodies have been raised against individual ligands or may be designed to block all three isomers.
- One example includes a pan-neutralizing anti-mouse TGF- ⁇ monoclonal antibody, 1D11.
- decoy receptor proteins include recombinant Fc-fusion proteins containing the soluble ectodomain of either T ⁇ RII (T ⁇ RII-Fc) or the type III receptor, betaglycan.
- ASOs can also be used to reduce the bioavailability of active TGF- ⁇ ligands in the local tumor microenvironment by blocking TGF- ⁇ synthesis.
- ASOs are single-stranded polynucleotide molecules, 13-25 nucleotide in length, that hybridize to complementary RNA, inhibiting mRNA function, and preventing protein synthesis through accelerated mRNA degradation by RNase H.
- One example includes AP12009 (Trabedersen).
- Another therapeutic strategy is to block T ⁇ RI activity through the use of small molecule receptor kinase inhibitors that act via ATP-competitive inhibition of the kinase catalytic activity of the receptor.
- small molecule inhibitor of T ⁇ RI SB-431542, T ⁇ RI/ALK5 kinase inhibitor, Ki26894, T ⁇ RI inhibitor SD-208, dual inhibitor of T ⁇ RI/II, LY2109761, or inhibitors selective for the kinase domain of the type 1 TGF- ⁇ receptor, LY2157299.
- EGFR erlotinib
- ABL/PDGFR/KIT imatinib
- VEGFR/RAF/PDGFR sorafenib
- peptide aptamers are small peptide molecules containing a target-binding and a scaffolding domain that stabilize and interfere with the function of the target. Aptamers may therefore be designed specifically against Smad2 versus Smad3, and against multimeric transcriptional complexes containing Smads and other transcription factors, transcriptional co-activators, or co-repressors.
- the Trx-SARA aptamer is and has been reported to reduce the levels of Smad2/3
Landscapes
- Health & Medical Sciences (AREA)
- Life Sciences & Earth Sciences (AREA)
- Chemical & Material Sciences (AREA)
- Engineering & Computer Science (AREA)
- Organic Chemistry (AREA)
- Genetics & Genomics (AREA)
- Immunology (AREA)
- Wood Science & Technology (AREA)
- Zoology (AREA)
- Proteomics, Peptides & Aminoacids (AREA)
- Molecular Biology (AREA)
- Biotechnology (AREA)
- Biomedical Technology (AREA)
- Pathology (AREA)
- Analytical Chemistry (AREA)
- General Health & Medical Sciences (AREA)
- Bioinformatics & Cheminformatics (AREA)
- General Engineering & Computer Science (AREA)
- Physics & Mathematics (AREA)
- Microbiology (AREA)
- Biochemistry (AREA)
- Biophysics (AREA)
- Oncology (AREA)
- Hospice & Palliative Care (AREA)
- Medicinal Chemistry (AREA)
- Urology & Nephrology (AREA)
- Hematology (AREA)
- Plant Pathology (AREA)
- General Chemical & Material Sciences (AREA)
- Pharmacology & Pharmacy (AREA)
- Animal Behavior & Ethology (AREA)
- Public Health (AREA)
- Veterinary Medicine (AREA)
- Cell Biology (AREA)
- Nuclear Medicine, Radiotherapy & Molecular Imaging (AREA)
- Chemical Kinetics & Catalysis (AREA)
- Food Science & Technology (AREA)
- General Physics & Mathematics (AREA)
- Measuring Or Testing Involving Enzymes Or Micro-Organisms (AREA)
- Investigating Or Analysing Biological Materials (AREA)
Description
- This invention relates to genetic pathways involved in ovarian cancer growth; including, molecular signatures associated with identifying molecular subtypes of gynecological diseases and/or conditions, such as ovarian cancer. Such molecular signatures have wide application for classification of patent populations, prognosis, diagnosis and treatment of gynecological diseases and/or conditions, such as ovarian cancer.
- The following description includes information that may be useful in understanding the present invention.
- Ovarian cancer is the leading cause of gynecologic cancer deaths in the United States. Despite similarities in initial disease presentation, the existence of molecular subtypes of ovarian cancer is suggested by clinical outcomes displaying a broad range of survival end points. For example, some patients develop a chronic-type disease that can be maintained on chemotherapy for more than five years. Others are intrinsically resistant to chemotherapy or initially respond to chemotherapy, but then rapidly become resistant to the treatment and subsequently have low response rates to other second-line agents. Strategic approaches customized for treating these different patient groups is lacking, as ovarian cancer therapy is implemented on a watch-and-wait basis. No diagnostic tool exists that distinguishes among these patient groups, such as identifying those patients responsive to chemotherapy, others that develop preliminary or long-term chemoresistance, or those likely to experience relapse of disease. Consequently, there is a critical need for 1) prognostic and/or diagnostic classifiers that can reliably distinguish among molecular subtypes of gynecological cancer such as ovarian cancer; and 2) novel treatment therapies accounting for these differences in molecular subtypes.
- The development of effective prognostic, diagnostic and treatment strategies must account for molecular abnormalities motivating the underlying pathophysiology of the disease. Thus, an initial step for developing such tools first requires identification and classification of specific molecular abnormalities associated with particular disease conditions. These biomarkers can be readily applied for early detection, and prognostication, which can guide development of personalized therapies. Reliable tests that identify patient molecular subtypes not only improves clinical management options, but also provides early warning indicators to enroll high risk patients in increasingly available clinical trials and the latest personalized treatment strategies.
- Moreover, detection of disease subtypes at the molecular level allows one to take advantage of recent discoveries in cancer research, which would ordinarily fall outside the detection capabilities of traditional clinical assessments. For example, recent studies have highlighted the importance of cancer stem cells (CSCs) in tumor formation and chemoresistance. These CSCs possess the hallmark "stemness" capacity for self-renewal and the proliferative ability to drive continued expansion, along with the differentiation capacity for neoplastic formation. It is notable that CSCs could represent less than 1% of the overall cell population in a tumor, yet provide crucial biochemical machinery powering the rapid growth and development of malignant cells in tumors. The existence of such rare and transient cell populations thus requires development of detection and classification approaches at the molecular level.
- Articles entitled "Ovarian cancer stem cells and inflammation" by Gil Mor et. al . and "Ovarian cancer stem cells markers: Prognostic and therapeutic implications" by Daniela Burgos-Ojeda et. al., both relate to human ovarian cancer stem cells and their characteristics and genetic profile.
-
WO2004/022778 relates to methods of diagnosis and prognosis of ovarian cancer using sets of specific gene panels. - Article entitled "Multi-cancer computational analysis reveals invasion-associated variant of desmoplastic reaction involving INHBA, THBS2 and COL11A1" by Hoon Kim et. at. relates to identifying data from multiple cancers using a novel computational method identifying sets of genes whose coordinated over expression indicates the presence of a particular phenotype in high stage cancer.
- Described herein are gene signatures providing prognostic, diagnostic, treatment and molecular subtype classifications of ovarian cancers. Biostatistical methods are applied across a variety of studies encompassing a wide array of laboratory and clinical variables, thereby leading to generation of ovarian cancer disease signatures (OCDSs) that account for molecular heterogeneity present in gynecological cancers. Statistical analysis across multiple independent data sets allows generation of a preliminary ovarian cancer fixed signature (OCFS), a comprehensive definition of the core programming of disease development. Also described herein is a specific biochemical definition of an ovarian cancer stem cell identified via an (OCSC) signature. Finally, the development of ovarian cancer cell lines, including ovarian cancer stem cell lines (OCSC), and selectively labeled animal models provides in vitro and in vivo models for applying the aforementioned signatures to develop clinical applications, such personalized treatment strategies focused on molecular subtypes of gynecological cancers.
- Described herein is a method of determining a prognosis of cancer in an individual, including determining the presence or absence of a high level of expression in the individual relative to a normal baseline standard for a single prognostic panel of the following markers, ACTA2, ADAM12, AEBP1, COL11A1, COL3A1, COL5A1, COL6A2, CYR61, DCN, FN1, GREM1, LOX, LUM, POSTN, SNAI2, SPARC, TAGLN, THBS2, TIMP3, VCAN, and/or VIM, and prognosing a case of cancer if the individual demonstrates the presence of a high level of expression relative to a normal baseline standard of at least one of the markers. In other embodiments, the individual demonstrates the presence of a high level of expression relative to a normal baseline standard of at least two, three, four, or five of the markers. In other embodiments, the individual demonstrates the presence of a high level of expression relative to a normal baseline standard of at least six, seven, eight, nine, ten or more of the markers. In other embodiments, the cancer is ovarian cancer. In other embodiments, the prognosis provides a therapeutic selection for the prognosed individual, selected from the group consisting of: chemotherapy, radiotherapy, surgery, and combinations thereof. In other embodiments, the markers are AEBP1, COL11A1, COL5A1, COL6A2, LOX, POSTN, SNAI2, THBS2, TIMP3, and VCAN
- Also described herein is a method of determining a diagnosis of cancer in an individual suspected of having cancer, including: obtaining sample from an individual suspected of having cancer; determining the presence or absence of a high level of expression in the individual relative to a normal baseline standard for a single diagnostic panel including the following markers ACTA2, ADAM12, AEBP1, COL11A1, COL3A1, COL5A1, COL6A2, CYR61, DCN, FN1, GREM1, LOX, LUM, POSTN, SNAI2, SPARC, TAGLN, THBS2, TIMP3, VCAN, and/or VIM, and diagnosing a case of cancer if the individual demonstrates the presence of a high level of expression relative to a normal baseline standard of at least one of the markers. In other embodiments, the individual demonstrates the presence of a high level of expression relative to a normal baseline standard of at least two, three, four, or five of the markers. In other embodiments, the individual demonstrates the presence of a high level of expression relative to a normal baseline standard of at least six, seven, eight, nine, ten or more of the markers. In other embodiments, the cancer is ovarian cancer. In other embodiments, the diagnosis provides a molecular subtype classification for the diagnosed case of cancer in the individual. In other embodiments, the markers are AEBP1, COL11A1, COL5A1, COL6A2, LOX, POSTN, SNAI2, THBS2, TIMP3, and VCAN
- Further described herein is a method of modulating a tumor phenotype in an individual, including providing a quantity of an agent capable of modulating cancer stem cell (CSC) function, and administering the quantity of the agent to an individual, wherein modulation of CSC function results in modulation of a tumor phenotype in the individual. In other embodiments, the individual has cancer. In other embodiments, the cancer is ovarian cancer. In other embodiments, the agent is a small molecule, nucleic acid, anti-sense oligonucleotide, aptamer, protein, peptide and/or antibody. In other embodiments, the protein is collagenase. In other embodiments, the antibody is specific for CD24, CD44, CD117, CD133 or ALDH1. In other embodiments, the antibody modulates TGF-β pathway activity.
- Also described herein is a composition including an isolated population of cancer stem cells (CSCs) obtained from an individual afflicted with cancer. In other embodiments, the cancer is ovarian cancer. In other embodiments, the composition is a cultured cell line.
- Further described herein is a method, including providing isolated cells obtained from an individual afflicted with cancer, wherein the isolated cells include cancer stem cells (CSCs) and non-CSCs, adding a detectable reagent that preferentially binds to CSCs to the isolated cells,measuring a quantity of detectable reagent bound to the isolated cells and applying a ratio to the quantity, wherein application of the ratio to the quantity indicates the proportion of the isolated cells that are CSCs. In other embodiments, the detectable reagent is an antibody specific for CD24, CD44, CD117, CD133 or ALDH1. In other embodiments, the quantity of detectable reagent comprises flow cytometry, immunohistochemistry, immunocytochemistry, or enzyme-linked immunoassay (ELISA).
- Further described herein is an assay for determining the subtype of a gynecological cancer, including determining the presence or absence of a high level of expression in the individual relative to a normal baseline standard for a single prognostic panel comprising the following markers, ACTA2, ADAM12, AEBP1, COL11A1, COL3A1, COL5A1, COL6A2, CYR61, DCN, FN1, GREM1, LOX, LUM, POSTN, SNAI2, SPARC, TAGLN, THBS2, TIMP3, VCAN, and/or VIM, and determining the subtype of the gynecological cancer a case of cancer if the individual demonstrates the presence of a high level of expression relative to a normal baseline standard of at least one of the markers. In other embodiments, the gynecological cancer is ovarian cancer. In other embodiments, the ovarian cancer is characterized by elevated stromal or epithenlial-to-mesechymal transition activity. In other embodiments, the markers are AEBP1, COL11A1, COL5A1, COL6A2, LOX, POSTN, SNAI2, THBS2, TIMP3, and VCAN. In other embodiments, determining the subtype of the gynecological cancer indicates a therapeutic treatment. In other embodiments, therapeutic treatment is immunotherapy. In other embodiments, the therapeutic treatment is anti-fibrotic. In other embodiments, the therapeutic treatment modulates TGF-β pathway activity.
-
-
Figure 1 . Schematic diagram for the isolation and microarray analysis of human ovarian cancer stem cells -
Figure 2 . Establishment of preliminary ovarian cancer stem cell (OCSC) signature. (A) Genes commonly expressed in OCSCs isolated from different markers. (B) Network analysis of OCSC biomarkers. (C) Example of a preliminary OCSC signature. (D) Annotated network analysis showing "hub" genes such as fibroblast growth factor (FGF1), fibronectin (FN1), tgf-beta 1 (TGFB1), tgf-beta 2 (TGFB2), thrombospondin 1 (THBS1), and filamin C (GLNC) as involved in "stemness" (E) Poor patient survival predicted by OCSC biomarkers (red) in The Cancer Genome Atlast (TCGA) dataset. -
Figure 3 . Candidate ovarian cancer stem cell (OCSC) biomarkers to predict clinical outcome. In different examples, OCSC biomarkers, when highly expressed (red) are demonstrated to reduce overall survival in patients when compared to low expression (black) in patients. This includes examples such as OCSC biomarkers: (A) Secreted protein acidic and rich in cysteine (SPARC) (B)Aldehyde dehydrogenase 1 family member a2 (ALDH1A2) and (C) Desmocolin 2 (DSC2). Overall survival time (in months) is shown as drawn from 921 patient samples. -
Figure 4 . Validation of preliminary ovarian cancer stem cell (OCSC) biomarkers to predict clinical outcome. Amongst 50 preliminary OCSC biomarkers, validation is performed using quantitative real-time PCR (qRT-PCR). Enhanced expression of OCSC biomarkers is confirmed, as drawn from CD133+ALDH+ OCSC candidates, and CD133-ALDH- non-OCSC cells. It is clearly observed that OCSC biomarkers are highly expressed in OCSC when compared to non-OCSC cells. This includes the example OCSC signature "hub" genes, ALDH1A2, FGF1, and THBS1. Additional confirmation is provided from clinical samples obtained from over 120 patients to establish a comprehensive OCSC signature. -
Figure 5 . Derivation of primary and metastatic mouse ovarian cancer cell lines. (A) Diagram for the derivation of 7 primary and 7 metastatic cell lines that contain various combinations of genetic alterations in p53, c-myc, K-ras and Akt. (B) Implantation of primary transformed cell lines results in intraperitoneal carcinomatosis. Each metastatic tumor cell line was derived from a single tumor nodule. (C) H&E staining of an intraperitoneal tumor nodule. (D) Genes expressed more than 10-fold in metastatic vs. primary mouse ovarian cancer cell lines. biomarkersare highlighted in yellow. -
Figure 6 . Various cell lines can be specifically labeled to evaluate roles of cancer cells and stroma in tumor formation. Examples are shown, including (A) RFP-labeled stromal mesenchymal (MSCs), and (B) GFP-labeled ovarian cancer. -
Figure 7 . Ovarian cancer disease signatures, ovarian cancer fixed signatures. (A) Gene overlap among 4 independently-derived ovarian cancer disease signatures (OCDS) that are associated with poor survival in patients with high-grade, late-stage, serous ovarian carcinoma. (B) List of genes that overlap between at least 3 of the 4 prognosis signatures - a preliminary ovarian cancer fixed signature (OCFS). (C) Overall survival based on periostin (POSTN)-correlated OCDS signature. -
Figure 8 . Clinical applications for ovarian cancer signatures. (A) Ovarian cancer diagnostic triage map. A gene signature will impact clinical practice by enabling physicians to identify patients who are unlikely to benefit from standard treatment and triage them to clinical trials or individualized therapy. (B) TaqMan® OpenArray® Real-Time PCR design for the quantification of transcripts derived from ovarian cancer samples. Each signature gene will be represented in quadruplicates with duplicate probes at different physical positions on the array. -
Figure 9 . Individual genes that can effectively predict poor progression-free survival (PFS). Kaplan-Meier plots demonstrate that several biomarkers are associated with poor progression-free survival outcomes when highly expressed. These includes: (A) COL3A1 (B) DCN (C) LUM (D) SPARC (E) TIMP3 (F) VCAN (G) COL11A1 (H) COL5A1 and (I) POSTN. K-M Plotter was used to determine progression-free survival across 8 datasets listed in (J) for a total analysis across 1,107 patients. There were no restrictions based on stage, histology, grade, and treatment. -
Figure 10 . Individual and combinations of genes can effectively predict poor overall survival (OS). Kaplan-Meier plots demonstrate that several biomarkers are associated with poor overall survival outcomes when highly expressed. This includes: (A) COL3A1 (B) DCN (C) LUM (D) SPARC (E) TIMP3 (F) VCAM. K-M Plotter was used to determine progression-free survival across 8 datasets listed in (G) for a total analysis across 1,339 patients. There were no restrictions based on stage, histology, grade, and treatment. Combinations of genes can also effectively predict poor overall survival, as shown in (H) using the combinations of genes listed in (I). -
Figure 11 . Ovarian cancer stem cell (OCSC) genes predict poor overall survival. Kaplan-Meier plots demonstrate that biomarkers associated with ovarian cancer stem cells are also effective predictors of poor overall survival (OS). This includes (A) ALDH1A2 (B) HOXA10 (C) COL1A2 (D) COL3A1 (E) ANGPTL4 (F) THBS1 (G) COL6A1 (H) LUM (I) SPP1 (J) EFEMP1 (K) TGFB2 and (L) TGFB1. -
Figure 12 . Identification and validation of the 10-gene signature associated with poor overall survival. (A) Venn diagram of poor outcome gene signatures identified from three microarray datasets (TCGA, GSE26712, and Karlan). The number of overlapping genes is indicated and arrows point to the corresponding lists of overlapping genes. The 10 genes present in all three signatures are listed at the top. (B) Validation of the predictive value of the 10-gene signature from three discovery datasets (TCGA, GSE26712, and Karlan) and (C) one independent validation dataset (Tothill). Kaplan-Meier curves, log-rank P values and hazard ratios (HR) are shown to compare overall survival between two patient groups with 'high' (indicated by the red line) and 'low' (indicated by the black line) expression of the 10-gene signature. The cutoff for the risk index is the median of the continuous risk factor. 0.95 LCL, the 95% lower confidence limit interval for the median time; UCL, upper confidence limit. -
Figure 13 . Regulation of the poor outcome signature genes by TGFβ signaling. (A) Ingenuity Pathway Analysis of the 61 genes present in at least two of the three discovery signatures of poor outcome. Genes that are present in all three discovery signatures are circled in red. (B) Top upstream regulators of the 61 poor outcome genes. (C) Induction of the 10 poor outcome signature genes by TGFβ1 in the ovarian stromal cell line TRS3 and the ovarian cancer cell line OVCAR3. Cells were treated with TGFβ1 (10 ng/ml) for 48 hours (TRS3) or 1-3 hours (OVCAR3) with or without pre-treatment with the TGFβ1 receptor inhibitor, A83-01. Shown is the relative fold change of the mRNA levels compared to untreated control cells. Data are presented as the mean +/- SEM in triplicate samples. * indicates P<0.05. Data are representative of at least three independent experiments. -
Figure 14 . Enrichment of the 10-gene signature in metastatic ovarian cancer. (A) Oncomine mRNA expression analysis of the 10 poor outcome genes in three public ovarian cancer microarray datasets. Expression of the poor outcome genes are shown in primary (P) and metastatic (M) ovarian tumor samples using whisker plots with log2 median-centered intensity. EPCAM and VIM were used as markers of the relative content of epithelial and stromal cells, respectively. (B) List of genes enriched in metastases compared to primary tumors in the GSE30587 microarray dataset, which consists of nine matched pairs of primary and metastatic tumors. Genes that overlap with the 10-gene signature are highlighted in yellow. Genes that are present in at least two of the three poor prognosis signatures are indicated in bold letters. (C) COL11A1 mRNA expression in nine matched primary and metastatic ovarian tumor samples in the GSE30587 microarray dataset. -
Figure 15 . Increase in COL11A1 expression during ovarian cancer progression. (A) Quantification of COL11A1 in situ hybridization signal in matched triplets of primary ovarian cancer, concurrent metastasis, and recurrent/persistent metastasis from 10 patients. H score = % positive stromal cells x intensity (0, 1+, 2+, 3+) under 10X objective. Each point represents the H score in a single field. Nine intratumoral fields were scored in each sample except for two samples in which only three fields were scored due to a minimal amount of tumor tissue. Data are presented as the mean +/- SEM. *P<0.05; **P<0.005; ***P<0.0005; ****P<0.0001. (B) Representative COL11A1 in situ hybridization and COL11A1 immunohistochemistry in serial sections of samples fromPatient 1. (C) Detection of a positive focal COL11A1 in situ hybridization signal in cells exhibiting stromal (S) and epithelial (E) morphology. (D) Representative image of COL11A1 distribution in intra- and peri-tumoral areas. tE, tumor epithelium; iS, intratumoral stroma; pS, peritumoral stroma; dS, distant stroma; F, fat. Hematoxylin counterstain. Size bar is 100 µm in all panels. -
Figure 16 . COL11A1 knockdown results in decreased cell migration, invasion, and tumor progression. (A) Migration and (B) invasion assays of A2780 cells with scrambled shRNA (shscr) or shRNA specific to COL11A1 (sh-COL11A1). Shown are representative images of migrated cells after 24 hours and invasive cells after 48 hours. Size bar, 25 µm. The bar graph shows the quantification of migrated cells in four different fields at 10X magnification and invasive cells in four different fields at 4X magnification. Data are presented as the mean +/- standard deviation. *P<0.05. (C) Photograph of nude mice with tumors that formed 14 days after intraperitoneal injection of A2780 cells transduced with scrambled shRNA control (sh-scr; 5 mice) or shRNA specific to COL11A1 (sh-COL11A1; 5 mice). White arrowheads indicate large tumor nodules. (D) Quantification of wet tumor weight after resection of tumor nodules from 20 mice in the replication experiment of intraperitoneal injection of A2780 cells transduced with sh-scr (10 mice) or sh-COL11A1 (10 mice). Each dot indicate an individual mouse. Data are presented as the mean +/- SEM, *P=0.02. -
Figure 17 . A schematic diagram of the methods, datasets and patient samples used to identify and characterize the 10 genes associated with poor survival in ovarian cancer. (A) Identification of the 10-gene signature. (B) Validation of the 10-gene signature in predicting poor overall survival. -
Figure 18 . Correlogram of the 10 poor outcome signature genes. The main diagonal shows the gene name. At the horizontal and vertical intersection of each gene, the Pearson correlation coefficient (center, in black) and the associated P value (top right corner, in red) are shown. -
Figure 19 . Validation of the 10-gene signature in a dataset composed of 10 individual datasets. The Kaplan-Meier Plotter (http://kmplot.com/) was used to validate the predictive power of the 10-gene signature in a combined microarray of 10 datasets shown on the right. Affymetrix probe IDs of the 10 genes, including 201792_at (AEBP1), 204320_at (COL11A), 203325_s_at (COL5A1), 213290_at (COL6A2), 215446_s_at (LOX), 210809_s_at (POSTN), 213139_at (SNAI2), 203083_at (THBS2), 201147_s_at (TIMP3), 204619_s_at (VCAN), were uploaded to the website program. The mean expression of all 10 genes was analyzed for overall survival of patients with serous histology (n=1,058). Patient samples were randomly split by upper tertile. The Kaplan-Meier plot shows the overall survival in two patient groups with 'high' (red) and 'low' (black) expression of the 10-gene signature. -
Figure 20 . ABI Open Array Real-time PCR of 9 poor outcome signature genes (COL6A2 was not available on the array) in normal (N, n=8), primary (P, n=30), and metastatic (M, n=29) ovarian cancer samples. Each dot represents an individual patient sample. Bars indicate the mean +/- SEM. * indicates statistical significance (P<0.05). -
Figure 21 . Increase in COL11A1 expression in recurrent tumors in comparison to primary ovarian tumors. Quantification of the COL11A1 in situ hybridization signal in matched pairs of primary ovarian cancer and recurrent/persistent metastasis from eight patients. H score = % positive stromal cells x intensity (0, 1+, 2+, 3+) under 10X objective. Each point represents the H score in a single field. Nine intratumoral fields were scored in each sample except for two samples in which fewer fields were scored due to minimal amount of tumor tissue. Data are presented as the mean +/- SEM. -
Figure 22 . Confinement of COL11A1 expression to intra- and peri-tumoral stroma. Representative low magnification image of COL11A1 in situ hybridization in a metastatic tumor nodule. Four different fields of the tumor nodule are shown at a higher magnification. Dotted lines demarcate tumor epithelium (E) and peritumoral stroma (S). N denotes a necrotic area. The counter stain is hematoxylin. Size bars, 1 mm (center image) and 100 µm (peripheral images). -
Figure 23 . Knockdown of COL11A1 in the A2780 ovarian cancer cell line. (A) Real-time PCR of COL11A1 in A2780 cells transduced with scrambled control shRNA (sh-scr) and A2780 cells transduced with five different shRNAs targeting COL11A1 (sh1-sh5). (B) Arrows point to primary ovarian tumors. Circles point to metastatic tumor nodules. Top genes enriched in metastatic vs. primary tumors. (C) Western blot analysis of COL11A1 protein expression. The membrane was exposed for different lengths of time to visualize the molecular marker and the COL11A1 band. GAPDH was used as a loading control. Thirty micrograms of cell lysates were loaded onto a mini-PROTEAN TGX gradient gel (4-20%). Protein was transferred to a 0.2 µm PVDF nitrocellulose membrane, which was incubated in blocking buffer for 1 hour and then incubated with primary antibodies against COL11A1 (Abcam ab64883; 1:500 dilution) and GAPDH (Fitzgerald 10R-G109A; 1:5000 dilution) for 1 hour at room temperature. Membranes were incubated with secondary antibodies (goat anti-rabbit IRDye 800 for COL11A1 and goat anti-mouse IRDye 680 for GAPDH; 1:5000 dilution) for 1 hour at room temperature. The signal was analyzed by the Li-Cor Odyssey system. -
Figure 24 . Graphic overview of various cellular actor responsible for ovarian cancer signature generation. -
Figure 25 . COL11A1 knockdown results in decreased in vitro cell migration and invasion and attenuated in vivo tumor progression. (A) Proliferation of A2780 cells transduced with scrambled shRNA control (sh-scr) or shRNA specific to COL11A1 (sh-COL11A1). Data are presented as average +/-SD. RLU, Relative Luminescent Units. (B) Migration and invasion assays of A2780 cells with sh-scr or sh-COL11A1. Shown are representative images of migrated cells after 24 hours and invasive cells after 48 hours. Size bar, 25 µm. The bar graph shows the quantification of migrated cells in 4 different fields at 10X magnification and invasive cells in 4 different fields at 4X magnification. Data are presented as the mean +/-SD. *P<0.0001. (C, D) Tumor formation innude mice 14 days after intraperitoneal injection of A2780 cells with sh-scr or sh-COL11A1. The arrows points to tumor implants in the visceral fat (f). -
Figure. 26 . Induction of the 10 poor outcome signature genes by TGFβ1. OVCAR3 (OV3) cells were treated with 10ng/ml TGFβ1 (B1) for either 1 hour or 3 hours with (OV3+B1+A) or without (OV3+B1) pre-treatment with the TGFβ inhibitor, A83-01. - Unless defined otherwise, technical and scientific terms used herein have the same meaning as commonly understood by one of ordinary skill in the art to which this invention belongs. Singleton et al., Dictionary of Microbiology and Molecular Biology 4th ed., J. Wiley & Sons (New York, NY 2012); March, Advanced Organic Chemistry Reactions, Mechanisms and Structure 5th ed., J. Wiley & Sons (New York, NY 2001); and Sambrook and Russel, Molecular Cloning: A Laboratory Manual 3rd ed., Cold Spring Harbor Laboratory Press (Cold Spring Harbor, NY 2001); provide one skilled in the art with a general guide to many of the terms used in the present application.
- For purposes of the present invention, the following terms are defined below.
- As used in the description herein and throughout the claims that follow, the meaning of "a," "an," and "the" includes plural reference unless the context clearly dictates otherwise. Also, as used in the description herein, the meaning of "in" includes "in" and "on" unless the context clearly dictates otherwise.
- Most ovarian cancer patients are diagnosed at a late stage when the cancer has metastasized throughout the peritoneal cavity. Standard clinical management involves surgical tumor debulking followed by administration of platinum- and taxane-based chemotherapy. Patients with advanced ovarian cancer display a broad range of survival end points, despite the similarities in initial disease presentation (e.g., late-stage), histopathology (e.g., high-grade, serous ovarian cancer) and treatment (e.g., surgery followed by platinum- and taxane-based chemotherapy). For example, some patients develop a chronic-type disease and can live with ovarian cancer (despite intermittent chemotherapy treatments) for 5, 10 or more years. Others have tumors that are intrinsically resistant to chemotherapy or initially respond to chemotherapy but then rapidly recur due to regrowth of resistant disease and subsequently have low response rates to other second, third or Nth-line agents.
- Currently, ovarian cancer surveillance and subsequent therapies are implemented on a "watch-and-wait" basis. Immunoassay detection of cancer-antigen CA125 can identify pre-clinical recurrence, but chemotherapy interventions prior to symptoms do not translate into improved overall survival. Moreover, CA125 has also been known to lead to a number of false positive in asymptomatic women, thereby highlighting the drawbacks of single biomarker detection via immunoassay. Thus, a quantitative, molecular-based approach incorporating several biomarkers is likely to provide more effective prognostic and diagnostic tools, with the further advantage of classifying patients with molecular subtypes of gynecological cancer. This includes the advantage of identifying those high-risk patients who have a greater likelihood of relapse at the completion of first line therapy. This would aid earlier inclusion into clinical trials or personalized treatment strategies that could improve overall survival rates. Consequently, there is a critical need for 1) prognostic and/or diagnostic classifiers that can reliably distinguish among molecular subtypes of gynecological cancer such as ovarian cancer; and 2) novel treatment therapies accounting for these differences in molecular subtypes.
- In addition, the development of molecular-based approaches allows development of clinical strategies focused on totally new paradigms in cancer research. This includes focusing on cancer stem cells ("CSCs"), and "stroma" cells in tumor formation. Recent discoveries have highlighted the importance of CSCs in tumor formation and disease development. As described, most patients are diagnosed at a late stage, with standard clinical management initially focused on tumor debulking. While conventional therapies may provide effects via repression, modulation, or alteration of bulk tumor cell growth and development, therapeutic intervention focused on CSCs may provide a more effective two-pronged attack against cancer development. For example, identification of a CSC signature allows targeting of noxious CSCs, which may presently evade treatment strategies focused on tumor debulking. Further, modulation, repression, or alteration of the CSC signature or its related metabolic network, dismantles the biological machinery powering tumor formation and development. Although a variety of potential ovarian cancer stem cell (OCSC) candidates have been presented, the existence and role of CSCs in the ovarian cancer context is not well-understood. As tumors display morphological, phenotypical, and biochemical heterogeneity, different cells may possess only some or many hallmarks of a posited OCSC, yet fail to be a bona fide OCSC. Application of the described techniques can lead to positive identification of OCSCs and compilation of a precise, biochemical definition via an OCSC signature. Generation of such a signature contributes further in diagnostic and prognostic techniques would further benefit from early stage detection of OCSCs, as these cells are understood to be key actors in neoplastic tumor formation.
- Further, solid tumors are now understood to be complex "organs" comprised of not only malignant cells, such as OCSCs, but also non-malignant cells, described under the umbrella term, "stroma". Most outcome-predicting gene signatures originate in cancer cells. However, it is becoming increasingly clear stromal cells are active contributors to tumor progression and that large amounts of tumor stroma are also associated with poor clinical outcome in multiple solid tumors. This dynamic bi-directional interaction between the malignant cells and "stroma" is not well understood, but recent studies have suggested "stroma" can modify the neoplastic properties of tumor cells and that tumor cells re-program the "stroma" to generate a unique microenvironment that is crucial for cancer survival, homeostasis, progression, and metastasis. Although many aspects of this complex microenvironment have been revealed in recent years, a better understanding of the molecular components that facilitate the communication in this complex microenvironment is aided by the earlier described signature-based approach for identifying the presence and absence of particular cell types. Identifying the cellular context of the poor prognosis signature will help focus on the correct cell type for the future development of assays to predict outcome in ovarian cancer patients and may provide a basis for future biologic or immune therapeutic targets.
- Described herein is the development of gene signatures providing prognostic, diagnostic, treatment methods and molecular subtype classifications of ovarian cancers. Biostatistical methods are applied to link molecular, laboratory, and clinical data obtained from a variety of studies encompassing a wide array of laboratory and clinical variables. Each of these studies provides ovarian cancer disease signatures (OCDSs) that account for molecular heterogeneity present in gynecological cancers. Further, robust statistical analysis across these multiple independent data sets allows further optimization for generating an ovarian cancer fixed signature (OCFS). As OCFS is platform-independent, generation of an OCFS helps to define the core programming of disease development. Described further herein is a specific biochemical definition of an ovarian cancer stem cell via an (OCSC) signature. Finally, the development of ovarian cancer cell lines, including ovarian cancer stem cell lines (OCSC), and selectively labeled animal models provides in vitro and in vivo models for developing clinical applications, such as guided personalized treatment decisions.
- As further described herein, the various identified gene signatures, such as OCFS is correlated with ovarian cancer progression and poor outcome. The OCFS signature has strong predictive value, biological relevance, and translational potential. Future studies are warranted to optimize the gene signature for its predictive power and develop a quantitative assay that is appropriate for use in the clinical setting. Using the validated gene signature to identify patients who are unlikely to respond to standard treatment will provide opportunities to deliver individualized therapies that target the underlying mechanism of the poor outcome signature genes. Furthermore, a better understanding of how collagen remodeling contributes to ovarian cancer progression and metastasis could reveal the "Achilles heel" of these tumors and thus have a major impact on the development of improved therapies for advanced ovarian cancer.
- As described herein, the present invention includes a method of determining a prognosis of cancer in an individual includes, determining the presence or absence of a high level of expression in the individual relative to a normal baseline standard for a prognostic panel including the following markers:AEBP1, COL11A1, COL5A1, COL6A2, LOX, POSTN, SNAI2, THBS2, TIMP3 and VCAN and prognosing a case of cancer if the individual demonstrates the presence of a high level of expression relative to a normal baseline standard of the markers in the prognostic panel. The cancer is ovarian cancer. In another embodiment, the prognosis provides a therapeutic selection for the prognosed individual, selected from the group consisting of: chemotherapy, radiotherapy, surgery, and/or combinations thereof.
- In other embodiments, the markers are associated with the presence of ovarian cancer stem cells (OCSCs). In other embodiments, the markers are associated with poor survival. In other embodiments, the markers are associated with poor prognosis. In other embodiments, the markers are associated with late-stage ovarian cancer, high-grade, or serious ovarian cancer.
- In certain embodiments, the prognostic panel includes the markers listed in Table 1.
Table 1. Representative Ovarian Cancer Stem Cell (OCSC) Genes ABCD2 CNN1 FAM55C IL7R OGN SPARC YWHAB ACTA2 COL11A1 FGF1 KATNA1 OLFML3 SPOCK2 ZFHX4 ACTG2 COL1A2 FGFR2 KSR1 PCMT1 SPP1 ZNF804A ADAM 12 COL3A1 FLNC LAMA4 PDGFRA SV2A ALDH1A1 COL6A1 FN1 LAMB1 PHLDB2 TAGLN ALDH1A2 COLEC12 FNTA LOX PI3 TFPI2 AMACR CTGF FXYD5 LOXL1 PIEZO2 TGFB2 ANGPT1 CYBRD1 GADD45B LRRC17 PPIC TGFBI ANGPTL2 CYR61 GAS1 LUM PPP3CA THBS1 ANGPTL4 DCLK1 GPNMB MAL PRKCDBP TIMP2 ANP32A DCN GREM1 MMP2 PXDN TMEM47 APBA2 DDX46 GSTM3 MMP1 RAD52 TNC AXL DNAJC9 HAND2 MSLN RIN2 TPM1 BCHE DOCK11 HOXA7 MSR1 RND3 TRHDE BIN1 DSC2 HOXA9 MTSS1 RNFT2 TRO CALD1 DSC3 HOXA10 NBL1 S100A8 TSHR CAV1 ECM1 HS3ST3A1 NLK SAR1B TWIST1 CCL2 EFEMP1 HSPA2 NNMT SERPINE1 TXNDC9 CD36 ELL2 IGFBP5 NR2F2 SFRP2 VGLL3 CD302 ELOVL4 IGFBP6 NR3C1 SLC25A15 VIM CDKN1A EMP1 IL6 NUAK1 SNX3 XRCC4 - In certain embodiments, the single prognostic panel includes the markers listed in Table 2.
Table 2. - Representative Periostin (POSTN)-Coexpressing Genes ACTA2 CNN1 EPAS1 IL6 MMP11 RAI14 THBD ACTC1 COL10A1 EPYC IL7R MMP19 RASAL3 THBS1 ACTG2 COL11A1 ETV1 INHBA MMP1 RASSF2 THBS2 ACTR2 COL12A1 FAM26E ITGA1 MOXD1 RCAN1 TIMP3 ADAM 12 COL1A2 FAP ITGA5 MPP1 RGS16 TMEM89 AEBP1 COL1A1 FBLN1 ITGA11 MS4A4A SCHIP1 TMEM158 AK5 COL3A1 FBLN2 ITGB1 MXRA5 SDC1 TMEM217 ALDH1A3 COL4A2 FBN1 ITGBL 1 NCF2 SEC13 TMEM45A ANGPTL2 COL5A1 FCGR2B KCNE4 NNMT SERPINF1 TNC AQP1 COL5A2 FGF7 KIF26B NTM SERPINH1 TNFAIP6 ARHGAP30 COL6A2 FKBP14 LAMA4 NUAK1 SFRP2 TPM2 ASPN COL8A2 FN1 LAMB1 P4HA2 SFRP4 TPM1 BATF3 COLEC12 FSTL1 LAPTM5 PALLD SH3PXD2A TUBB6 BATF COMP FTL LCP1 PDGFRB SKAP2 TUBB2A BMP2 COPZ2 GALNT1 LEPRE1 PDLIM3 SLC20A1 UNC5B C13orf33 CRHR1 GEM LGI2 PDPN SNAI2 VCAM1 C1QTNF3 CTHRC1 GFPT2 LILRB3 PHLDB2 SPARC VCAN C5orf62 CTSB GJB2 LIMA1 PLAU SPHK1 VIM CALD1 CTSK GLRX LOX PLOD2 SPON2 VSIG4 CCDC80 CXCL14 GPNMB LOXL1 PMP22 SPP1 WIPI1 CCR7 CYP1B1 GPR32 LOXL2 POSTN SRGN CD14 CYR61 GREM1 LUM PPAP2A SUCNR1 CD53 DCN GUCY1A3 MAFB PPIC SULF1 CD163 DLC1 HAAO MARCKS PTGIR SYTL2 CD248 DOCK11 HCK METRNL PTPRC TAGLN CD44 DPYSL3 HOXA7 MICAL2 PTRF TD02 CFD EDIL3 HSD17B6 MIR22HG RAB31 TGFB3 CHST11 ELL2 HTRA3 MMP9 RAB7L1 TGFBI - In certain embodiments, the single prognostic panel includes the markers listed in Table 3.
Table 3. - Representative Genes Associated with Poor Survival ADAM 12 CILP CYR61 FBLN2 INHBA PDLIM3 SNAI2 ADH1B COL10A1 DIO2 FGF1 ITGBL1 PDPN SPON2 ADIPOQ COL11A1 DPT FMO1 LOX PIEZO2 SULF1 AEBP1 COL1A1 DUSP1 FOSB LPPR4 PLAU TDO2 ASPN COL5A1 DUSP5 GLT8D2 MATN3 POSTN THBS2 ATF3 COL5A2 ECM1 GREM1 MFAP5 PPBP TIMP3 C1QTNF3 COL5A3 EDNRA GUCY1A3 MMP11 PRKG1 VCAM1 C7orf10 COL6A2 EGR1 HAS2 MN1 PRRX1 VCAN CALB2 COMP EGR2 HBA1/HBA2 NR4A1 PTGIS CCRL1 CRISPLD2 EGR3 HBB NR4A3 PTPRD CD36 CTSK EPYC HBG2 NTM RGS4 CD248 CXCL14 FABP4 IGF1 ODZ3 SCG2 CH25H CXCL12 FAP IGHG1 OMD SFRP4 - In certain embodiments, the single prognostic panel includes the markers listed in Table 4 or 4a.
Table 4. - Representative Genes Associated with Poor Prognosis ABCA8 COL6A3 FOSB LMOD1 POSTN TIMP3 ACTA2 CXCL12 HBA1/HBA2 LOX PTGIS TMEM47 ADH1B CYP1B1 HBB LUM RARRES1 TMEM158 AEBP1 DCN HEPH MAL RGS2 TUBB2A ALDH1A1 DUSP1 ID1 NBL1 RHOB UBD ALDH1A2 EDNRA IGF2 NR2F2 SEMA3C VCAN CAV1 EFEMP 1 IGFBP3 NR4A2 SERPINE1 VIM CDH11 EGR1 IGFBP4 OLFML3 SERPINF1 ZEB1 COL11A1 FBLN1 IGFBP5 OSR2 SNAI2 COL3A1 FBN1 ISLR PDGFRA SPARC COL5A1 FN1 ITM2A PEG3 TAGLN COL6A2 FOS KLF2 PLS3 THBS2 Table 4a - Representative Genes in an Ovarian Cancer Fixed Signature AEBP1 POSTN COL11A1 SNAI2 COL5A1 THBS2 COL6A2 TIMP3 LOX VCAN - In the present invention, the method of determining a prognosis of cancer in an individual includes, determining the presence or absence of a high level of expression in the individual relative to a normal baseline standard for a prognostic panel including the markers listed in Table 4a. The cancer is ovarian cancer. In another embodiment, the prognosis provides a therapeutic selection for the prognosed individual, selected from the group consisting of: chemotherapy, radiotherapy, surgery, and/or combinations thereof. The markers are associated with poor prognosis.
- In another aspect, described herein is a method of determining a diagnosis of cancer in an individual suspected of having cancer, including obtaining sample from an individual suspected of having cancer, determining the presence or absence of a high level of expression in the individual relative to a normal baseline standard for a single diagnostic panel, and diagnosing a case of cancer if the individual demonstrates the presence of a high level of expression relative to a normal baseline standard of the markers listed in Table 4a.
- Separately described herein is a method, including providing isolated cells obtained from an individual afflicted with cancer, wherein the isolated cells include cancer stem cells (CSCs) and non-CSCs, adding a detectable reagent that preferentially binds to CSCs to the isolated cells, measuring a quantity of detectable reagent bound to the isolated cells, applying a ratio to the quantity, wherein application of the ratio to the quantity indicates the proportion of the isolated cells that are CSCs. In another embodiment, the detectable reagent is an antibody specific for CD24, CD44, CD117, CD133 or ALDH1. In another embodiment, the quantity of detectable reagent comprises flow cytometry, immunohistochemistry, immunocytochemistry, or enzyme-linked immunoassay (ELISA).
- Separately described herein is a composition including an enriched population of cancer stem cells (CSCs) obtained from an individual afflicted with cancer, wherein the CSCs express a higher level of at least one CSC marker when compared to non-CSCs, and wherein the CSCs are capable of self-renewal and differentiation. In another embodiment, the least one CSC marker includes one or more markers listed in Table 1. In another embodiment, the cancer is a gynecological cancer. In another embodiment, the cancer is ovarian cancer. In another embodiment, the composition is a cultured cell line. In another aspect, described herein is a composition including an isolated population of cancer stem cells (CSCs) obtained from an individual afflicted with cancer. In another embodiment, the cancer is ovarian cancer. In another embodiment, the composition is a cultured cell line.
- Separately described herein is a method of modulating a tumor phenotype in an individual, including providing a quantity of an agent capable of modulating cancer stem cell (CSC) function, and administering the quantity of the agent to an individual, wherein modulation of CSC function results in modulation of a tumor phenotype in the individual. In another embodiment, the individual has cancer. In another embodiment, the cancer is ovarian cancer. In another embodiment, the agent is a small molecule, nucleic acid, protein, peptide and/or antibody. In one embodiment, the protein is collagenase. In another embodiment, the small molecule is Salinomycin, Etoposide, Abamectin, Nigericin, Resveratrol, MS-275, Ciclopirox, Quinostatin, Alsterpaullone, Azacitidine, Bepridil, Fluspirilene, Cortisone, Etoposide, Loperamide, Ikarugamycin, Pyrvinium, Irinotecan, Phenoxybenzamine, Solanine Nicergoline, Monobenzone, Ellipticine, Norcyclobenzaprine, Tobramycin, Gossypol, Ethambutol, Daunorubicin, Methotrexate, Dextromethorphan, Thiostrepton, Propylthiouracil, Clotrimazole, Amiodarone, Thioguanosine, Rimexolone, Tranylcypromine, Ginkgolide A, GW-8510, Hycanthone, Rolitetracycline, Dipyridamole, Perphenazine, Beta-escin, Hexamethonium bromide, Vorinostat, Trifluoperazine, Prochlorperazine, 15-delta prostaglandin J2, Thioridazine, Trichostatin A, Fluphenazine, LY-294002, (Acetato)(2,3,5,6-tetramethylphenyl)mercury, beta. -D-arabinofuranosyl-5 -fluorocytosine, beta. -D-ribofuranoside thymine-1 2-deoxy, -beta.-Pyrazomycin, 9-N(N0-bis-chloroethyl-N0-1,2-diamino ethyl) 2-methoxy acridine dihydrochloride, 9-N-(N0-chloroethyl-N0-1,6-diaminohexyl) 2-methoxyacridine, dihydrochloride, 9-N(N0-chloroethyl-N0-methyl-1,4-diaminobutyl) 2-methoxy acridine dihydrochloride, Aclarlubicin HCl, Acridine Orange, Albacarcin M, Albacarcin V, Anhydro-arabinosyl-5-fluoro-cytosine hydrochloride, Arabinosyl cytosine palmitate, Combretastatin A4, Ellipticine, Ellipticine N-oxide, Ellipticine, 6-(3-aminopropyl)-, dihydrochloride, Ellipticine, 6-3-aminopropyl)-9-methoxy-, dihydrochloride, Ellipticine, 9-chloro-, Ellipticine, 9-dimethyl amino-ethoxy-, Ellipticine, 9-hydroxy-, hydrochloride, Ellipticine, 9-methyl-, Illudin M, Kidamycin, Labriformin, Landomycin A, Lycobetaine chloride, Megaphone acetate, N,N-Dibenzyldaunorubicin hydrochloride, Neriifolin, Nybomycin acetate, Predorine, Sanguilutine pseudobase, Scilliglaucosidin, Scutellaprostin D, or Metformin. In another embodiment, the nucleic acid is a small interefering RNA (siRNA) or short hairpin RNA (shRNA). In another embodiment, the siRNA or shRNA is cognate to fibroblast growth factor 1 (FGF1), fibronectin (FN1), or L1CAM. In another embodiment, the antibody is specific for ABCC5, CD24, CD44, CD117, CD133 or ALDH1. In another embodiment, the agent is capable of modulating the rate of epithelial-to-mesenchymal transition (EMT). In another embodiment, modulating a tumor phenotype includes treating an individual afflicted with cancer.
In another aspect, described herein is a method of modulating a tumor phenotype in an individual, including providing a quantity of an agent capable of modulating TGF-beta pathways, and administering the quantity of the agent to an individual, wherein modulation of TGF-beta pathways results in modulation of a tumor phenotype in the individual. In another embodiment, the individual has cancer. In another embodiment, the cancer is ovarian cancer. In another embodiment, the agent is a small molecule, nucleic acid, protein, peptide and/or antibody. In various embodiments, the agent is a ligand traps, antisense oligonucleotide (ASO), small molecule receptor kinase inhibitor, or peptide aptamer. In various embodiments, ligand traps can also include anti-ligand neutralizing antibodies and soluble decoy receptor proteins incorporating the ectodomains from either TβRII or βRIII/betaglycan protein, such as TGF-β monoclonal antibody, 1D11, or decoy receptor proteins such as recombinant Fc-fusion proteins with the soluble ectodomain of either TβRII (TβRII-Fc) or the type III receptor, betaglycan. In various embodiments, ASOs include nucleotides capable of reducing the bioavailability of active TGF-β ligands such as AP12009 (Trabedersen). In other embodiments, small molecule receptor kinase inhibitors include small molecule inhibitor of TβRI, SB-431542, TβRI/ALK5 kinase inhibitor, Ki26894, TβRI inhibitor SD-208, dual inhibitor of TβRI/II, LY2109761, or inhibitors selective for the kinase domain of thetype 1 TGF-β receptor, LY2157299. In other embodiments, other therapeutics targeting related pathways such as EGFR (erlotinib), ABL/PDGFR/KIT (imatinib), and VEGFR/RAF/PDGFR (sorafenib), may be used in combination with a TGF-beta related therapeutic. In other embodiments, the agent targetings intracellular TGF-β signaling molecules, such as Smads. For example, aptamers are small peptide molecules containing a target-binding and a scaffolding domain that stabilizes and interferes with the function of the targets, and can be designed specifically against Smas such as Smad2 or Smad3, the Trx-SARA aptamer is one such example. - In various embodiments is capable of modulating the expression or function of ACTA2, ADAM12, COL11A1, COL3A1, COL5A1, COL6A2, CYR61, DCN, FN1, GREM1, LOX, POSTN, SNAI2, SPARC, TAGLN, TIMP3, VCAN, and/or VIM. In another embodiment, the nucleic acid is a small interefering RNA (siRNA) or short hairpin RNA (shRNA). In another embodiment, the siRNA or shRNA is cognate to ACTA2, ADAM12, COL11A1, COL3A1, COL5A1, COL6A2, CYR61, DCN, FN1, GREM1, LOX, POSTN, SNAI2, SPARC, TAGLN, TIMP3, VCAN or VIM. In another embodiment, the siRNA or shRNA is cognate to AEBP1, COL11A1, COL5A1, COL6A2, LOX, POSTN, SNAI2, THBS2, TIMP3, or VCAN. In another embodiment, the siRNA or shRNA is cognate to COL11A1, LOX, POSTN, THBS2, or VCAN.
- In another aspect, described herein is a method, including providing isolated cells obtained from an individual afflicted with cancer, wherein the isolated cells include cancer stem cells (CSCs) and non-CSCs, adding a detectable reagent that preferentially binds to CSCs to the isolated cells, measuring a quantity of detectable reagent bound to the isolated cells, applying a ratio to the quantity, wherein application of the ratio to the quantity indicates the proportion of the isolated cells that are CSCs. In another embodiment, the detectable reagent is an antibody specific for ABCC5, CD24, CD44, CD117, CD133 or ALDH1. In another embodiment, the quantity of detectable reagent comprises flow cytometry, immunohistochemistry, immunocytochemistry, or enzyme-linked immunoassay (ELISA).
- The following examples are provided to better illustrate the claimed invention and are not to be interpreted as limiting the scope of the subject matter. To the extent that specific materials are mentioned, it is merely for purposes of illustration and is not intended to limit the invention.
- As described, preliminary studies of cancer stem cells ("CSCs) in the context of ovarian cancer have focused on certain types of cells that appear to be display some or all "stemness" characteristics of CSCs. These are good candidates for bona fide ovarian cancer stem cells ("OCSC"). However, as tumors display morphological, phenotypical, and biochemical heterogeneity, it is understood that different cells may possess only some or many hallmarks of a posited OCSC, yet fail to be a bona fide OCSC. Several leading OCSC candidates include, for example, cells expressing markers CD24, CD44, CD117, CD133 and ALDH1. Among them, CD133/ALDH1 double markers have been shown most reliable to enrich for OCSC candidates, as further described via morphologhical and functional characteristics, such as spheroid formation, cisplatin resistance, clinical outcome, and perhaps most importantly, tumor formation with as few as 30 cells (i.e., high tumor seeding potential).
- However, while OCSC candidates may display some or many characteristics of a bona fide OCSC, there is yet no positive determination of which particular cells drawn from heterogeneous populations within tumors display all of the "stemness" characteristics of a bona fide OCSC. Endpoint studies demonstrating capture of bona fide OCSC could be shown experimentally by isolation of a cell capable of recapitulating the generation of a continuously growing tumor. In another example, serial transplantation in animal models provides a functional assay for the two CSC hallmarks, self-renewal and differentiation. However, these endpoint functional studies fail to provide a molecular snapshot of the biochemical actors responsible for giving CSCs, including OCSCs, their unique properties. Therefore, an OCSC signature provides two important uses. The first is a specific, biochemical definition of a bona fide OCSC, which currently does not exist. The second includes applications for prognostic and diagnostic use, as a type of ovarian cancer disease signature (OCDS).
- The lack of a specific definition for what constitutes a bona fide OCSC is readily understood when considering the lack of a comprehensive study characterizing a core transcriptional program as well as metabolic pathways which OCSCs rely for their survival. Identification of such a critical pathway(s) allows to selective identification and targeting of OCSCs, ultimately improving patients' clinical outcome, through effective prognosis and/or diagnosis of disease subtypes featuring varying populations of OCSC cell numbers, and focused therapy targeting the major culprit, OCSCs, responsible for rapid tumor formation and growth. Toward this goal, the inventors have established a preliminary OCSC signature, which upon validation as a comprehensive global OCSC signature, at the transcript and protein level, provides diagnostic, prognostic and therapeutic guidance to selectively target OCSCs.
- Moreover, while an OCSC provides a precise biochemical definition of a specific cell type for identification, application of an OCSC in a prognostic or diagnostic context appears to find further utility as capable of classifying molecular subtypes of cancer. For example, ovarian cancer, like other cancers, is a multi-etiological disease, and variations in tumor cell origin, tissue compartment development, and/or other factors leads to the manifestation of disease subtypes. Tumor samples may include higher or lower numbers of OCSCs, as demonstrated by detection of an OCSC signature, and this variation may prove to be highly informative of clinical outcomes (e.g., chemoresistance, survival). In this regard, an OCSC may be considered as a type of OCDS, as capable of prognostic and diagnostic applications.
- In order to identify an OCSC core transcriptional program (OCSC signature), the inventors isolated OCSC candidates and non-CSCs using ALDH1 and CD133/ALDH1 from A2780 human ovarian cancer cell line. As OCSCs are a rare and evanescent cell population, the A2780 cell line provides the greatest number OCSC candidates (1%) for analysis. The inventors then analyzed the CD133+ALDH1+ OCSC candidates using Affymetrix Human Gene Array, normalized the data with two independent algorithms, and compared their expression profiling to each other as well as to public array databases (OncoMine, Stanford Microarray database, Gene Expression Omnibus) (
Fig.1 ). List of OCSC genes constituting a preliminary signature are shown in Table 1. - In spite of the limited availability of OCSC candidate profiling data, the inventors' expression profiling data (
Fig.2A ) indeed showed some overlapping genes with published array data of other OCSC candidates (Fig.2C ), isolated with CD44 and CD133 from patient samples and cell lines. Alvero et al. (2009) Molecular phenotyping of human ovarian cancer stem cells unravels the mechanisms for repair and chemoresistance. Cell Cycle. 8(1):158-66. Baba et al. (2009) Epigenetic regulation of CD133 and tumorigenicity of CD133+ ovarian cancer cells. Oncogene. 28(2):209-18. - These results support the notion that OCSC candidates (e.g., CD133+ALDH1+ or CD44+ and CD133+) might express a common set of genes to maintain pluripotency and survival, wherein these "stemness" genes could be used to identify bona fide OCSCs. Generally speaking, core transcriptional programming as tied to "stemness" characteristics relate to genes involved in pluripotency (e.g., transcription factors), self-renewal and differentiation (e.g., growth factors, epithelial-mesenchymal transition), surface antigens (e.g., adhesion markers, migration factors, matrix production), and metabolic regulators.
- Further analysis, focus on expression level, patient survival, and implication in CSC biology. This integrative analysis resulted in a preliminary OCSC gene signature. Importantly, Gene Ontology analysis of this OCSC signature showed these genes to be mainly involved in the regulation of cell proliferation, cell adhesion, and metabolic processes (Table 5). Remarkably, the Ingenuity Pathway Analysis showed that OCSC genes were connected to each other and there were some highly connected nodes ("hubs") such as fibroblast growth factor 1(FGF1) and fibronectin 1(FN1) (
Fig. 2B ,2D ), which might be novel therapeutic targets for OCSCs.Table 5. Gene Ontology (GO) Analysis of Ovarian Cancer Stem Cells Biomarkers Go Term % P value Genes Regulation of cell proliferation 31.42857 6.07E-06 IGF1R, ALDH1A2, CAV1 PTRPM, SERPINE1, CDK6, SPARCH, GPNMB, FGF1, THBS1, TGFB2 Response to organic substance 25.71429 1.65E-04 IF1R, ALDH1A2, CAV1, HSPA2, CD44, HSPB1, THBS1, SPP1, TGFB2 Cell motion 22.85714 7.95E-05 PTPRM, NPY, CD44, MET, HSPB1, THBS1, TGFB2, FN1 Cell adhesion 22.85714 8.52E-04 PTRPM, CD44, TGFB1, DSC2, GPNMB, THBS1, SPP1, FN1 Response to extracellular stimulus 20 9.06E-06 ALDH1A2, CAV1, NPY, CD44, AXL, SPP1, MEST Negative regulation of cell proliferation 20 1.45E-04 ALDH1A2, CAV1, PTPRM, CDK6, GPNMB, THBS1, TGFB2 Phosphorous metabolic process 20 0.021256 IGS1R, PTPRM, MET, AXL, CDK6, THBS1, TGFB2 Phosphate metabolic process 20 0.021256 IGS1R, PTPRM, MET, AXL, CDK6, THBS1, TGFB2 Intracelluar signaling cascade 20 0.062315 IGF1R, ALDH1A2, CAV1, NPY, MET, FF1, THBS1 Regulation of cell adhesion 17.14286 17.14286 TGFB1, CDK6, FGF1, THBS1, SPP1, TGFB2 - Interestingly, application of the OCSC as a type of OCSD for prognostic applications indicates that, some biomarkers highly expressed in OCSCs predicted significantly poor patient survival (
Fig.2E ), when used in a clinical study dataset (The Cancer Genome Atlas, TCGA dataset,Fig. 2 ). The inventors further confirmed that OCSC biomarkers, when highly expressed are demonstrated to reduce overall survival in patients when compared to low expression in patients. Specific examples shown include: secreted protein acidic and rich in cysteine (SPARC) (Fig.3A ),aldehyde dehydrogenase 1 family member a2 (ALDH1A2) (Fig.3B ), and desmocolin 2 (DSC2) (Fig.3C ). These results suggest that an OCSC can be applied for prognostic and/or diagnostic use as an OCDS, and demonstrate the advantages of a signature-based detection approach. - As proof-of-concept, the preliminary identification of an OCSC signature predicted candidate genes for potential therapeutic intervention and poor patient survival in public databases. Further validation of our preliminary OCSC signature using patient samples, in vitro cell culture, and statistical analysis are applied to determine prognostic and therapeutic power of an OCSC signature.
- In one example, establishment of a comprehensive, global OCSC signature provides a series of biomarkers, wherein expression levels of one, some or all of the genetic markers, as a transcript or protein level, may be used to prognose a range of clinical outcomes for a patient, such as chemoresistance or survival. Further, an OCSC signature provides a definitive biochemical approach to positively identifying the proportion of cells in a tumor sample that can be confirmed as bona fide OCSCs. This focus on the percentage of cell populations within a tumor samples, is critical as higher numbers are CSCs are generally understood to be indicators for poor prognostic outcomes (e.g., chemoresistance, increased tumor-sphere-forming ability, neoplastic regrowth). In another example, the genetic markers may serve as useful diagnostic tools to provide molecular subtype classifications of a gynecological cancer, such as ovarian cancer. This is of particular importance in the context of cancer, given the multi-etiological nature of these diseases.
- Moreover, beyond prognostic and diagnostic applications, a comprehensive OCSC signature allows targeted therapeutic intervention focused on OCSC eradication and/or retardation. For example, current chemotherapeutic agents target the bulk population of cancer cells, and tumor regression may be observed. However, reducing bulk cancer cells that play a smaller role in tumor recurrence and chemoresistance may explain why tumor regression does not necessarily translate into increased patient survival. Worse yet, reduction of bulk cancer cell populations has been shown in certain contexts to enrich CSC populations, thereby positively the most noxious cells, OCSCs, that are responsible for poor clinical outcomes. In different examples, therapeutic approaches rely on chemical compounds (e.g., small molecule inhibitors) that selectively target OCSCs, thereby retarding CSC viability, spheroid formation, and/or limiting chemoresistance.
- As described, a variety of OCSC candidates have been described, which may possess some or all of the features of bona fide OCSCs. As ovarian cancer, like other cancers, is a multi-etiological disease, variations in tumor cell origin, tissue compartment development, and/or other factors leads to the manifestation of disease subtypes, these subtypes exhibiting variations in clinical outcomes (e.g., chemoresistance, survival). Therefore, one may establish a preliminary OCSC signature, as obtained from cell lines, or clinical samples. Such preliminary OCSC signatures require further validation across a wider and more diverse array of cell lines and samples. This establishes those features consistently found across OCSC signatures from variable sources, thereby leading to establishment of a comprehensive, global OCSC signature. This comprehensive, global OCSC signature minimizes variation attributable to the cell source, thereby providing a biochemical definition of core transcriptional machinery responsible for providing the "stemness" characteristics of OCSCs, and one of that is agnostic to the originating source material.
- Validation of a global OCSC signature is established by isolating OCSC candidates from surgical specimens and other ovarian cancer cell lines (Table 6). Further comparison with existing studies on OCSC candidates can also prove to be informative. An example of a meta-analysis conducted across existing studies is shown (Table 7). In either type of analytical sample, RNA can be extracted, and expression of OCSC biomarkers can be measured by Affymetrix Human Gene Array or quantitative real-time PCR. Non-CSCs isolated from each sample serve as controls to identify those genes uniquely upregulated in OCSCs.
Table 6. OCSC Markers to be Used to Isolate OCSC Candidates CSC marker Sample Expected CSC % CD133+*ALDH1+ Solid tumors, ascites 0.1 % CD133+ Solid tumors, ascites 1-20 % CD133+ OVCAR8 cell line** 40 % *ALDH1+ OVCAR8 cell line 1.9 % *ALDH1+ HEY1 cell line** 6.5 % * ALDH1 activity is determined by ALDEFLUOR kit (Stem cell technologies, Inc).
**CD133+ALDH1+ population exists under <0.03% in these cell lines.Table 7. Meta-Analysis of Cancer Stem Cell Microarray Data Comparison CSC v. non-CSC Microarray Data Source Microarray Platform Ref A2780 CD133+*ALDH1+v. CD133-ALDH- raw .CEL file Affymetrix GeneChip Human Gene 1.0 ST Array Cheon Patient CD44+ v. CD44- Suppl. Table Alvero et al., 2009 A2780CD133+v.CD133- Suppl. Table Affiymetrix GeneChip Human U133A 2.0 Array Baba et al., 2009 Patient Side Population v. Major Population GSE33874 Affiymetrix GeneChip Human U133A Plus 2.0 Array Vathipadiekal et al., 2012 OVCAR3 spheroid-derived cells v. OVCAR3 GSE28799 Affiymetrix GeneChip Human U133A Plus 2.0 Array Wang et al., 2012 SKOV3 sphere v. SKOV3 Suppl. Table Agilent Whole Human Genome 4 x 44K microarray Ma et al., 2010 Cisplatin-resistant A2780 v. A2780 GSE28648 Affiymetrix GeneChip Human U133A Plus 2.0 Array Zeller et al., 2012 Cisplatin-resistant A2780 v. A2780 GSE15709 Affiymetrix GeneChip Human U133A Plus 2.0 Array Li et al., 2009 IGROV1 Side Population v. non-SP GSE25191 Affiymetrix GeneChip Human U133A Plus 2.0 Array Rizzo et al., 2011 * Normalization was performed within individual study and across the studies.
* Genes which were differentially expressed in CSC were selected (top 200, bottom 200 genes) based on Significance Analysis of Microarray (SAM) method to determine fold change and statistical significance.
* CSC up genes that were common in > 2 studies were analyzed by the KM plot to identify individual gene that can predict poor OS and PFS. - As one example, establishing the predictive power of an OCSC signature can be determined by utilizing high-throughput qRT-PCR of the validated OCSC biomarkers in patient samples. One example includes the ABI Open Array® Real-time PCR system, wherein custom-designed array plates containing validated TaqMan ® Real-time probes for 50 ovarian CSC identified biomarkers in duplicate are applied to patient samples. Various endogenous controls (ACTB, GAPDH, 18s rRNA, GUSB, PPIA, TBP, RPLP0, RPL4) are used for each plate for the normalization of all plates and samples.
- Some examples of validation of preliminary OCSC biomarkers are shown in
Fig. 4 . Enhanced expression of OCSC biomarkers is confirmed, as drawn from CD133+ALDH+ ovarian cancer stem cells (OCSCs) candidates, and CD133-ALDH- non-OCSC cells. It is clearly observed that OCSC biomarkers are highly expressed in OCSC when compared to non-OCSC cells. This includes the example OCSC signature "hub" genes,aldehyde dehydrogenase 1 family member a2 (ALDH1A2), fibroblast growth factor 1 (FGF1), and thrombospondin (THBS1). - The expression data obtained from the qRT-PCR arrays are then matched to each patient clinical data. Examples of clinical features for analysis include FIGO stage, tumor grade, chemotherapy resistance, and survival. Two separate, but complementary statistical approaches allow one to determine the degree of association between features of an ovarian CSC signature, as tied to clinical features. Beer et al. (2002) Gene-expression profiles predict survival of patients with lung adenocarcinoma. Nat Med. 8(8):816-24. Under the first statistical approach, a number of patient samples (e.g., n=120) are randomly assigned to equivalent training and testing sets consisting of equal numbers of early stage (I+II) and late stage (III+IV) tumors to validate a novel risk-index function. The high number of patient samples allows for a robust determination of expression analysis as correlated with clinical features. Under the second statistical approach, a 'leave-one-out' cross-validation procedure can robustly confirm which genes are associated with survival, as assessed by Kaplan-Meier survival plots and log-rank tests. Beer et al. (2002). Application of these statistical approaches identifies the predictive power of a combined panel of genes. Examples of several OCSC biomarkers, such as ALDH1A2, ANGPTL4, COL1A2, COL3A1, COL6A1, EFEMP1, HOXA10, LUM, SPP1, TGFB2, THBS1, and TMEM47 also serve as effective predictors of poor overall survival outcomes as shown in
Fig. 11 . These results support the notion that OCSC signature provides not only a specific biochemical definition of OCSCs, but can also serve as a predictor of clinical outcome. - Establishing and validating an OCSC signature allows one to predict drugs that specifically target OCSCs and limit the noxious effects tied to their rapid proliferation and growth. In one example of this approach, an OCSC signature is analyzed using Connectivity Map (http://www.broadinstitute.org/cmap/) public database, which predicts candidate drugs modulating expression of a specific gene signature. Using Connectivity Map, pattern-matching of the query (e.g. OCSC gene signature) with a reference collection of gene expression profiles from cultured human cells treated with bioactive small molecules. Another example is the Ingenuity Pathway Analysis application described above. Application of Connectivity Map or Ingenuity Analysis with the ovarian CSC signature allows identification of compounds that repress, modulate, or alter targets associated with the OCSC signature. Commercially available chemical compounds, or existing compound libraries may be tested for efficacy in cell lines known to contain a population of OCSCs, such as A2780, HEY1, and OVCA8. In addition, the effect of those compounds on CSC viability (% of CD133+ALDH1+, CD133+, ALDH1+ cells by flow cytometry), spheroid formation, and chemoresistance (cisplatin IC50) is measured as parameters for identifying compound efficacy.
- For example, as shown in
Fig. 11K and 11L , TGF-beta Table 8. OCSC Regulated by TGF-β pathway Upstream Regulator Molecule Type P-Value of Overlap # of Signature Genes Target Molecules in the Signature TGFB1 growth factor 1.99E-18 18/21 ACTA2, ADAM12, COL11A1, COLA3A1, COL5A1, COL6A2, CYR61, DCN, FN1, GREM1, LOX, POSTN, SNAI2, SPARCH, TAGLN, TIMP3, VCAN, VIM ERBB2 kinase 5.60E-16 13/21 ACTA2, ADAM12, COL3A1, COL5A1, COL6A2, FN1, TAGLN, TIMP3, VCAN, VIM TGFB3 growth factor 3.45 E-15 8/21 ACTA2, ADAM12, COL11A1, COL5A1, CYR61, FN1, TAGLN, TIMP3 EDN1 cytokine 1.24 E-10 7/21 ACTA2, ADAM12, COL5A1, FN1, TIMP3, VCAN, VIM FGF2 growth factor 2.11 E-10 8/21 ACTA2, CYR61, DCN, FN1, GREM1, LOX, SPARC, VIM RUNX2 transcription regulator 4.08 E-10 6/21 ACTA2, COLA11A1, FN1, LUM, SNAI2, TAGLN LAMC1 other 9.71E-10 4/21 ACTA2, FN1, SNAI2, VIM SPARC other 1.32E-09 4/21 FN1, SNAI2, SPARC, VIM SMAD7 transcription regulator 1.39E-09 6/21 ACTA2, COL3A1, DCN, FN1, TAGLN, TIMP3 BMP4 growth factor 1.63E-09 6/21 ACTA2, CYR61, GREM1, POSTN, SPARC, TAGLN - An important focus of the technology is that identification of an OCSC signature allows identification of not only individual targets that interact in a biochemical network, but specific "hub" genes that may amplify and enhance the role of many complementary targets involved OCSC survival. Without being bound by any particular theory, it is believed that repression, modulation, or alteration of these specific "hub" genes may prove to be more effective in dismantling the biochemical machinery underlying cancer pathogenesis, in contrast to disruption of individual targets involved in the growth and development of cancer.
- Network analysis of ovarian CSC biomarkers indicates fibroblastic growth factor-1 (FGF1) and fibronectin (FN1) as preliminary candidates for "hub" genes (
Fig.2D ). Confirmation of FGF1 and FN1 as essential factors for ovarian CSC survival can be shown by knockdown of FGF1 and FN1 in human ovarian cancer cell lines (A2780, HEY1, OVCAR8) using MISSION shRNA lentiviral particles (Sigma Aldrich). The impact of effective FGF1 and/or FN1 knockdown on CSC viability (% of CD133+ALDH1+, CD133+, ALDH+ cells by flow cytometry), spheroid formation, and chemoresistance (cisplatin IC50), demonstrates the importance of these "hub" genes in OCSC development, survival, and drug resistance. In complementary studies, knockdown of multiple genes may be used to display enhanced phenotypes OCSCs. These studies can be further supplemented by gain-of-function approaches, wherein the gene of interest is engineered into healthy cells of a relevant tissue type, thereby helping to reveal the phenotype of individual genes. - Ovarian cancer stem cells are rare cells, perhaps accounting for less than 1% of the total cell population in a clinical sample or cultured cell lines. Most ovarian cancer patients have bulky tumors and/or extensive metastatic spread at the time of diagnosis, and can provide a large volume of tumor and ascites from a single patient. Enriching for OCSC candidates can be performed by first pooling OCSC candidate using single markers (e.g., CD133 or ALDH1), to isolate more abundant populations for analysis. A second approach can be to induce greater numbers of ovarian CSC population by adding BMP2 to cell lines.
- Initial data shaping a preliminary OCSC signature gene demonstrates enrichment in biochemical pathways related to regulation of cell proliferation, cell adhesion, and metabolic processes (Table 5). Study of the aforementioned "hub" genes, such as FGF1 and FN1, clearly suggest key factors as related to cell proliferation and cell adhesion.
- In addition, no comprehensive study has focused on metabolites and metabolic pathways essential for ovarian CSC survival. A key focus of the present technology is establishing metabolic profiling of OCSCs, then integrating metabolome and transcriptome data for identification of key metabolic pathways in OCSCs. As metabolisis of a key feature of cancer growth and development, "hub" genes related to these processes provides therapeutic targets for repression, modulation, and/or alteration, thereby providing effective tools for targeting those biochemical targets unique to OCSCs and/or which may play a critical role in spurring cancer growth and/or pathogenesis. Disruption of OCSC growth, development and functional in the context of cancer pathogenesis is expected to be magnified by targeting "hub" genes.
- For example, current chemotherapeutic agents have been largely selected for their ability to reduce the bulk population of cancer cells rather than the rare CSCs that may drive tumor recurrence and chemoresistance. This may explain why tumor regression does not necessarily translate into increased patient survival. Additionally, reduction of bulk cancer cell populations has been shown in certain contexts to enrich CSC populations, thereby enriching and selecting for these most noxious cells which may be responsible for rapid cancer disease progression. Furthermore, integrative studies using an OCSC signature model with metabolic profiling, as described further below, might reveal critical genes and pathways for ovarian CSC survival for the development of novel classes of therapeutics. More effective cancer therapies will emerge when CSC-targeted therapies are combined to conventional treatments directed at tumor bulk populations.
- Identifying metabolites specific to CSCs is accomplished through comprehensive, high-throughput metabolic profiling of OCSCs and non-CSCs. For this, ALDH1+CD133+ OCSC candidates and ALDH1-CD133- cell populations are isolated from both surgical specimens and A2780 human ovarian cancer cell line. After sorting, cells are harvested and frozen at -80°C. Metabolites are extracted from frozen cell pellets and analyzed by GC/MS and LC/MS platforms. Metabolites will be identified by comparison to library entries of purified standards or recurrent unknown entities. Welch's two-sample t-tests are used to identify metabolites that differ significantly between OCSCs and non-CSCs. Significantly altered metabolites will be put into the context of biochemical pathways after statistical analysis and data curation.
- Initial integration of metabolome and transcriptome data is provided by first applying the preliminary expression profiling data establishing an OCSC signature via microarray, as well as qRT-PCR data obtained from the validated OCSC global signature to develop a mechanistic model of signaling in OCSCs. There is a particular focus on differentially expressed metabolic enzymes that display a clear connection with differential quantities of metabolites identified in the metabolic profiling. A significant emphasis is on those metabolomic pathways with high translational potential, such as those pathways already targeted by existing drugs capable of inhibiting the selected pathway.
- A set of comprehensive metabolic characteristics of CSCs have not been described for any cancer type. Thus, these results provide the first and most comprehensive map of metabolic pathways in at least one types of cancer stem cell, OCSCs. If OCSCS share core transcriptional and metabolomics characteristics as other types of cancer stem cells from other cancers, it is likely that OCSCs will exhibit enhanced dependence on oxidative phosphorylation, aberrant glycine metabolism, altered fatty acid metabolism and glycolysis, and high PFKFB4 expression. In addition, OCSCs may uniquely utilization a subset of key metabolites and metabolic enzymes. Such features would provide novel therapeutic targets in ovarian cancer.
- As described, enrichment of isolated OCSCs can be performed by pooling sorted cell populations from multiple surgical samples, inducing ovarian CSC population by adding BMP2 to cell lines, or using single markers (e.g., CD133 or ALDH1) to isolate more abundant populations of OCSC candidates including OCSCs.
- As OCSC candidates may display some variation in metabolic properties, application of additional stem cell markers, such as CD44 to isolate OCSCs, allows further comparison of the levels of several key metabolites and transcripts to those in ALDH1+CD133+ cell populations.
- Solid tumors are now understood to be complex "organs" comprised of not only malignant cells, such as OCSCs, but also non-malignant cells, thus, while OCSCs clearly play an important role in cancer disease progression, it is of paramount interest to identify the relative contribution of OCSCs in the overall context of tumor formation. For example, the relationship amongst OCSC and surrounding stromal cells is not totally understood. Better understanding processes would aid understanding of tumor formation events, as the roles for these cell types in tumor progression and metastasis are not well defined. Various non-malignant cell types are typically lumped together as tumor "stroma", and include fibroblasts, resident epithelial cells, immune cells, endothelial cells, pericytes, myofibroblasts and various mesenchymal stem cell types (MSCs) from recruited from bone marrow, fat, and connective tissues. Within this context, it is presently unknown if tumor formation is driven by: 1) recruitment of mesenchymal stem cells (MSCs) to the tumor from bone marrow or fat, or if 2) cancer cells induce de-differentiation of stromal cells into MSCs. Moreover, as the above described OCSC signature suggests aberrant expression of genes involved in epithelial-mesenchymal transitions (EMT) (Table 5), it is of further interest to understand the role of stromal cells in tumor formation, and the interrelation with appearance and generation of OCSC populations.
- The above observations are extended to animal models to explore in vivo mechanisms of tumorigenesis and cancer development. In different approaches, the inventors generated primary and metastatic mouse ovarian cancer cell lines (
Fig. 5 ). Primary cell lines (C lines) were generated by isolating ovarian surface epithelial cells from p53-/- mice and introducing various combinations of c-myc, K-ras, and Akt oncogenes in vitro (Fig. 5A ). Primary cell lines were then intraperitoneally injected into nude mice. To establish corresponding metastatic cell lines (T lines), tumor nodules were then isolated from the intestinal lining (Fig. 5B,5C ). - Comparing the expression profiles of 7 metastatic vs. 7 primary cell lines shows that 510 genes are consistently expressed more than 2-fold in the metastatic cell lines in comparison to the primary cell lines (T lines vs. C lines in
Fig. 5A ). Importantly, this gene expression comparison highlight COL11A1, CXC112, POSTN as among the genes that are expressed more than 10-fold in the metastatic ovarian cancer cell lines (Fig. 5D ). - One approach for unraveling the contributing cell types in tumor formation relies on combining a mouse model of ovarian cancer with labeled stromal and ovarian cancer cell lines of human and mouse origin. Using stable gene expression, one can generate several red fluorescent protein (RFP)-labeled stromal cell lines of human and mouse origin, including human immortalized mesenchymal stem cells (MSCs), transformed foreskin fibroblasts, stromal cells derived from the normal ovary, and mouse adipocytes (
Fig. 6 ). Additionally, several ovarian cancer cell lines of human and mouse origin were labeled with green fluorescent protein (GFP) (Fig. 6 ). Dual labeling of stromal cells via RFP and MSCs with GFP can therefore distinguish between the cell types, and provides a basis for identifying the cellular context of the signature genes. - For example, distinguishing between upregulated genes in malignant cells or instead, are the result of cells recruited by the tumor, such as fibroblasts, pericytes, immune cells, and bone marrow or fat MSCs, one can rely upon the above describe mouse model for generation of the mouse primary and metastatic ovarian cancer cell lines (
Fig. 5 ) except that human ovarian cancer cell line SKOV3-GFP are used for intraperitoneal injection. Application of human- and mouse-specific PCR primers for selected genes that overlap between the human and mouse (i.e. COL11A1, CXCL12, and POSTN) allows determination of whether the signature in the tumor is of human or mouse origin. For example, those biomarkers originating from human cancer cells, would result in PCR products with human primers but not mouse primers. Conversely, biomarkers originating in mouse cells recruited to the tumor, would lead to an increase in PCR products with mouse primers, but not human primers. - Most outcome-predicting gene signatures originate in cancer cells, such as the described OCSC signature. However, as described, it is becoming increasingly clear stromal cells are active contributors to tumor progression and that large amounts of tumor stroma are also associated with poor clinical outcome in multiple solid tumors. However, as described, the interactions and signals between cancer cells and stromal cells are still poorly understood. Identifying the cellular context of the poor prognosis signature will help focus on the correct cell type for the future development of assays to predict outcome in ovarian cancer patients and may provide a basis for future biologic or immune therapeutic targets.
- Another helpful insight on the contribution of stromal cells is provided by three different types of RFP-labeled stromal cell lines of human origin: human MSCs, fibroblasts, and stromal cells from the normal ovary (
Fig. 6 ). Each of these cell lines can be co-injected with the C11-GFP mouse ovarian cancer cell line into mice for the development of carcinomatosis. The presence of RFP-labeled stromal cells within the tumors will be determined by immunofluorescent visualization of frozen tumor sections and by fluorescence cell sorting. The expression levels of the biomarkers will be determined using human- and mouse-specific PCR primers as described above. As it is known that stromal cells enhance tumor growth in xenografts, this approach identifies specific contributions of certain stromal cell types to tumor formation. - In addition to RNA analysis, fluorescence cell sorting (FACS) can be used to separate human and mouse cells before RNA isolation for expression profiling using qRT-PCR.or human- and mouse-specific microarrays. This approach identifies altered gene expression patterns that are involved in lineage-specific differentiation, and can further identify the specific contribution of differentiated adipocytes, osteocytes and chondrocytes to tumor formation. Further, co-injection with ovarian cancer cells further answers the question of whether the presence of cancer cells affects differentiation status (i.e. over-representation of genes involved in de-differentiation).
- As described, the identification of a biochemical definition of OCSCs allows detection of the absence, presence, and population numbers of this cell type in patient samples. Aggressive tumors may contain cells of origin from a proliferative compartment and exhibit higher numbers of OCSC cells, whereas, a less aggressive tumor from more mature compartment may exhibit lower numbers of CSC cells. In this regard, the overall population numbers of OCSCs in the cancer tumors of an individual may ultimately prove to be suggestive of different cancer sub-type classifications. As shown by preliminary data applying the OCSC as a predictor of clinical outcome, this demonstrates the OCSC signature is capable of serving as a prognostic and diagnostic tool (
Fig. 3 and11 ). In this regard, OCSC serves as a type of ovarian cancer disease signature (OCDS) for classifying molecular subtypes of cancer disease. - Generation of OCDS along different experimental designs allows one to capture the breadth of molecular heterogeneity of gynecological cancers, particularly as cancer is a multi-etiological disease likely to arise from a variety of biological factors. As a different example, one can assess late-stage, high-grade, papillary serous ovarian adenocarcinomas classified into molecular subgroups that correlate with patient survival. An example of this data is provided by analysis of The Cancer Genome Atlast (TCGA) dataset, which includes ovarian serous cystadenocarcinoma. Analysis of this data by Orsulic et al. identified a 86 OCDS biomarker signature presented in Table 3, as associated with poor survivial. A second example includes identification of individual genes that correlated with prognosis, such as the identification of genes associated with suboptimally debulked tumor, using the data set by Bonome et al. Bonome et al., (2008) A gene signature predicting for survival in suboptimally debulked patients with ovarian cancer. Cancer Res,68:5478-86. Prognostic classification of this data, such as poor patient response to therapeutic treatment, identified a 68 OCDS biomarker signature, as analyzed by Cui et al. and shown in Table 4.
- Further examples include studying genes co-expressed with periostin (POSTN) in in vitro ovarian cancer cells, as provided by Karlan et al. Periostin has been found to be overexpressed in a variety of human malignancies, and plays a critical role in both ovarian tumor angiogenesis and metastasis. This analysis yielded a 188 OCDS biomarker signature, as shown in Table 2.
- In each case, in vivo samples, animal models and/or in vitro cell lines can identify those genes that can serve as predictive biomarkers of poor prognosis, such as suboptional debulking, chemo resistance and poor survival rate, and potentially effective therapeutic targets. Each of these study approaches provides an OCDS, as shown in Tables 1-4, for further analysis and refinement.
- Variation in experimental design is likely to best capture the molecular heterogeneity of the disease, and aid the understanding the cellular context of the poor-prognosis gene signature and disassembling the gene signature network. The OCDS provided by each study outperforms the predictive power of individual genes.
- Four different approaches to OCDS identification were pursued, with examples of ovarian cancer disease signatures (OCDS) presented in Tables 2-4. In addition to the aforementioned OCSC signature (Table 1), three expression studies provided OCDS focused on gene clustering associated with: 1) poor survival (Orsulic et al.), 2) poor prognosis (Cui et al.), and 3) periostin (POSTN) co-expressing genes (Karlan et al.) As described, differences amongst the study designs allow one to encompass heterogeneity in ovarian cancer disease. These differences may provide vital clues in molecular subtyping of cancers, wherein clinical approaches may be adjusted to most effectively retard disease progression or render treatment.
- A composite of OCDS biomarkers helps identify the overlapping biomarkers which mayidentify core programming as associated with ovarian cancer, while eliminating outliers. In this regard, it is critical to establish ovarian cancer fixed signature (OCFS) as associated with core programming, and as a composite analysis of the various OCDS described herein. Importantly, the application of different data sets and different approaches to OCDS identification, revealed preliminary OCFS indicating poor-prognosis, as substantially overlapping between the four studies (
Fig. 7A ). It is notable that one gene (COL11A1) is present in all four signatures, while 21 genes listed inFig. 7B are present in at least three of the four poor prognosis OCDS. - A 21-gene OCFS representing candidates present in three of four studies provides an preliminary "fixed signature" for further refinement. These 21 genes include ACTA2, ADAM12, AEBP1, COL11A1, COL3A1, COL5A1, COL6A2, CYR61, DCN, FN1, GREM1, LOX, LUM, POSTN, SNAI2, SPARC, TAGLN, THBS2, TIMP3, VCAN, VIM. As useful for characterizing molecular subtyping across cancers, a 101-gene OCFS represents candidates present in two of four studies, thereby allowing one to encompass heterogeneity of molecular subtypes. These 101-genes include ACTA2, ACTG2, ADAM12, ADH1B, AEBP1, ALDH1A1, ALDH1A2, ANGPTL2, ASPN, C1QTNF3, CALD1, CAV1, CD36, CD248, CNN1, COL10A1, COL11A1, COL1A2, COL1A1, COL3A1, COL5A1, COL5A2, COL6A2, COLEC12, COMP, CTSK, CXCL14, CXCL12, CYP1B1, CYR61, DCN, DOCK11, DUSP1, ECM1, EDNRA, EFEMP1, EGR1, ELL2, EPYC, FAP, FBLN1, FBLN2, FBN1, FGF1, FN1, FOSB, GPNMB, GREM1, GUCY1A3, HBB, HOXA7, IGFBP5, IL6, IL7R, INHBA, ITGBL1, LAMA4, LAMB1, LOX, LOXL1, LUM, MAL, MMP11, MMP1, NBL1, NNMT, NR2F2, NTM, NUAK1, OLFML3, PDGFRA, PDLIM3, PDPN, PHLDB2, PIEZO2, PLAU, POSTN, PPIC, PTGIS, SERPINE1, SERPINF1, SFRP2, SFRP4, SNAI2, SPARC, SPON2, SPP1, SULF1, TAGLN, TDO2, TGFBI, THBS1, THBS2, TIMP3, TMEM47, TMEM158, TNC, TPM1, TUBB2A, VCAM1, VCAN, and VIM.
- The clinical utility of any new prognostic assay will depend on whether it provides therapeutically relevant information that is superior to the well-validated clinical variables. To date, four clinical variables, age, stage, residual tumor status after cytoreductive surgery, and levels of caner-antigen CA125, have been validated as prognostic factors in ovarian cancer. The objective of our statistical analysis is to correlate progression-free survival (PFS) with gene expression to estimate if a gene expression signature can provide prognostic information beyond the existing standard in clinical practice. Optimization and validation of the 21-gene OCFSwill be done in Three Phases as described below.
- Genes identified across multiple OCDS identified a preliminary 2 genes forming a preliminary ovarian cancer fixed signature (OCFS), that most strongly correlated with overall survival. Refinement of a final OCFS relies upon iterative statistical approaches, which in further combination with additional clinical data sets, provides a robust signature composed of genes correlated with patient survival outcomes across different studies. In particular, as these 21 preliminary OCFS genes originate from 4 expression profile studies that used different platforms, a median rank score method for cross-platform normalization can be performed in order to make the expression values comparable.
- One example of statistical methods for generating an OCFS, is the lasso method for the Cox model. This method is well-suited for preliminary analysis since this method cannot identify more than n genes, where n is the total number of patients. Further refinement can be provided by method of Supervised Principal Components regression (SPC), as a screening method to identifying a subset of genes strongly predictive of survival.
- In addition, further stringency can be provided by application of Cox Univariate Shrinkage (CUS) approach, or Bayesian Model Average (BMA) algorithm. These methods are designed to identify genes that are highly correlated with the time to event of interest as they are entered in the Cox proportional hazards model. Bayesian Information Criteria (BIC) will be used to select the number of genes in the final model where the lowest point on the BIC curve corresponds to the best choice of covariates. Existing statistical R-packages will be used for these methods. In many instances, application of these various stringency tests is likely to result in signatures of 8 to 15 genes across the above described statistical methods, leading to establishment of a final OCFS.
- Further stringency and confirmation of the predictive power of the OCFS requires validation, with additional data sets. In particular, publicly-available data sets yet to be used for signature discovery. The Bild and Tothill data sets are selected as containing large number of samples from patients diagnosed with high-grade, late-stage, serous ovarian carcinoma. Bild, et al., (2006) Oncogenic pathway signatures in human cancers as a guide to targeted therapies. Nature 439:353-7. Tothill et al., (2008) Novel molecular subtypes of serous and endometrioid ovarian cancer linked to clinical outcome. Clin Cancer Res, 14:5198-208. Based on the excellent predictive power of some of the OCDS biomarkers (i.e. Kaplan-Meier plot for the POSTN gene signature is shown in
Fig. 7C ), a candidate OCFS can be optimized in satisfaction of the required performance criteria to identify patients who will relapse within a year after initial treatment. - Additional examples of analyzing publicly available datasets for signature validation demonstrates the capability of individual biomarkers to predict specific clinical outcomes. For example, analysis across multiple data sets identified several biomarkers,that served as strong predictors of specific clinical outcomes. As shown in
Fig. 9 , high expression of COL3A1, DCN, LUM, SPARC, VCAN, COL11A1, COL5A1 and POSTN were individually predictive of poor progression-free survival when highly expressed, as shown by analysis across multiple data sets encompassing a total of 1,107 patients. Likewise, as shown inFig. 10 , other clinical parameters, such as poor overall survival, were effectively predicted by high expression of individual biomarkers, COL3A1, DCN, LUM, SPARC, TIMP3, and VCAM, as shown by analysis across multiple datasets encompassing 1,339 patients. Combination of biomarkers, as shown inFig. 10H and 10I , demonstrates the enhanced predictive power of using a panel of biomarkers, wherein high expression is highly predictive of overall survival. - Further validation can be provided by in vitro testing of the signature biomarkers, using the selectively labeled animal model, the 21-gene signature was not enriched when the primary cell lines were compared to the primary cell lines or when the metastatic cell lines were compared to the metastatic cell lines (i.e. comparison of 3 myc+Kras vs. 3 Akt+myc cell lines). The presence of the 21-gene signature in mouse primary vs. metastatic cell lines indicates that a process similar to human ovarian cancer progression occurs in the mouse model. Thus, this mouse model can be used to study the cellular context of the biomarkers.
- As described, the Inventors analyzed three large microarray datasets that primarily included high-grade, advanced-stage, primary serous ovarian carcinoma samples: TCGA (n=403) (5), the GSE26712 dataset (N=185) (6), and the Karlan dataset (n= 122; GSE51088). Comparison of the three resultant gene signatures of poor survival identified 61 genes were present in at least two of the three signatures (19 genes in TCGA and GSE26712; 38 genes in TCGA and Karlan; and 24 genes in GSE26712 and Karlan) and that 10 of these 61 genes were present in all three datasets (
Fig. 12A ). - Interestingly, the 10 genes forming a candidate OCFS - AEBP1, COL11A1, COL5A1, COL6A2, LOX, POSTN, SNAI2, THBS2, TIMP3, VCAN (listed in Table 4a), are known to be localized in the extracellular matrix and are involved in cell adhesion and collagen remodeling. Pearson correlation showed that expression of the 10 genes is highly correlated (
Fig. 18 ), suggesting their involvement in similar biological processes. The identification of 10 collagen-remodeling genes as a poor outcome gene OCFS suggests that collagen-remodeling might be a common biological process that contributes to poor overall survival among patients with serous ovarian carcinoma. - As the 10 signature genes were selected based on overlap among the three survival signatures rather than on predictive efficiency, the Inventors evaluated the potential predictive value of the 10-gene signature in the three discovery datasets and one independent validation dataset by comparing survival in patient groups with 'high' and 'low' expression of the 10 genes. In each of the 3 discovery datasets, the patient group with 'high' expression of the 10-gene signature had poor overall survival: TCGA (log-rank P=0.00559; HR=0.64 [0.47, 0.88]), GSE26712 (log-rank P=0.0007; HR=0.54 [0.38, 0.78]), and Karlan (log-rank P=0.022; HR=0.6244 [0.42, 0.94]) (
Fig.12B ). - For validation, the Inventors used the Tothill dataset (GSE9891) since it comprised a large number of serous ovarian cancer samples (n=260) with well-defined clinical outcome data. In this validation dataset, the 10-gene signature predicted poor overall survival with statistical significance (log-rank P<0.0001; HR=0.41 [0.27, 0.61]) (
Fig. 12C ). Similar results were obtained after adjusting for cancer stage (not shown). The 10 gene-signature also predicted poor overall survival with statistical significance (log-rank P=2.2E-05; HR=1.46 [1.22, 1.74]) when applied to a large combined ovarian cancer dataset (n=1,058) consisting of 10 publicly available datasets (Fig. 19 ). These results validate the 10-gene OCFS as a predictor of poor overall survival. - Ingenuity Pathway Analysis (IPA) using the 61 poor outcome signature genes that were present in at least two of the three initial discovery datasets (
Fig. 12A ) confirmed that many of these genes form a network centered around TGFβ and collagens (Fig. 13A ). Identification of upstream regulators by IPA also indicated TGFβ1 as the top molecule regulating expression of the 61-gene poor outcome signature (Fig. 2B ). In addition to TGFβ1, other members of the TGFβ signaling pathway (TGFβ2, TGFβ3, SMAD3, and SMAD7) were also identified as top transcription factors regulating expression of the 61 poor outcome genes (Fig. 13B ). These results all suggest that the TGFβsignaling pathway may be the main upstream regulator of these genes. - To validate the predicted regulation of the poor outcome genes by TGFβ1, the Inventors treated the human ovarian stromal cell line TRS3 and the ovarian cancer cell line OVCAR3 with TGFβ1 and measured mRNA expression of the 10 poor outcome genes before and after TGFβ1 treatment.
- Importantly, The Inventors included the ovarian stromal cell line since many of our poor outcome genes are thought to be expressed in stromal cells. Most of the 10 genes were found to be induced by TGFβ1 in both ovarian stromal and cancer cell lines (
Fig. 13C ). To further validate that this induction was mediated by TGFβ1 signaling, the Inventors measured expression of the 10 genes in cells pre-treated with the TGFβ1 receptor inhibitor A83-01 before adding TGFβ1. The Inventors found that the TGFβ1-induced expression of the 10 genes was abrogated by A83-01 (Fig. 13C ). - To identify the underlying biological mechanism that could explain the observed association of poor survival with high expression of the collagen-remodeling OCFS genes, the Inventors evaluated the expression of the 10 signature genes in primary and metastatic serous ovarian tumors in three Oncomine datasets that contained primary ovarian tumors (P) and metastatic tumors (M): Anglesio (P=74, M=16), Bittner (P=166, M=75), and Tothill (P=189, M=54). Markedly higher expression levels of the 10 genes were observed in the metastatic tumors in all three datasets (
Fig. 14A ). The minimal difference in the expression of the epithelial marker, EPCAM, and the stromal marker, vimentin, in primary and metastatic tumors (Fig. 14A ) indicates that the epithelium-to-stroma ratio is not significantly different between samples. - Further validation that the OCFS genes are enriched during ovarian cancer progression by using another method of mRNA detection (qPCR) in an independent patient cohort that included 8 normal ovaries, 30 primary serous ovarian tumors, and 29 metastatic serous ovarian tumors from the Women's Cancer Program Biorepository (
Fig. 21 ). - Next, the Inventors conducted an unbiased global identification of genes that are differentially expressed between primary tumors and metastases using nine matched pairs of primary ovarian tumors and omental metastases (GSE30587 dataset). The top 20 gene probes that exhibited increased expression in metastases are ranked according to statistical significance in
Fig 3B . This analysis showed a marked overlap between our poor prognosis signature genes and genes that are enriched in metastases (Fig. 14B ). One of our signature genes, COL11A1, was identified as the most statistically significant differentially expressed gene in the nine matched pairs of primary and metastatic tumor samples (Fig. 14B). Fig. 14C shows COL11A1 mRNA expression values in matched pairs of primary ovarian tumors and omental metastases in the nine matched tumor pairs. - To test whether COL11A1 is a marker of tumor progression, the Inventors relied on in situ hybridization in 10 patients with "triplet" samples (primary ovarian cancer, concurrent metastasis, and recurrent/persistent metastasis) and eight additional patients with matched primary ovarian cancer and recurrent/persistent metastatic tumor.
- Importantly, in each of the 18 patients, COL11A1 expression increased in the recurrent/persistent metastasis compared to the matched primary ovarian tumor (
Fig. 15A ,B andFig. 21 ). In the 10 patients with "triplet" samples, COL11A1 exhibited the lowest levels in primary ovarian cancer samples, medium levels in concurrent metastases, and highest levels in recurrent/persistent metastases (Fig. 15A ). Representative in situ hybridization images forPatient 1 are shown inFig. 15B . To correlate RNA and protein expression, serial sections from primary ovary, concurrent metastatic, and recurrent/persistent metastatic tumors were stained for the COL11A1 protein using immunohistochemistry. The COL11A1 protein levels and pattern of expression in these serial sections were consistent with COL11A1 RNA levels and pattern of expression (Fig. 15B ); however, in situ hybridization provided a higher-resolution signal at a cellular level. COL11A1 expression was predominantly confined to stromal cells although rare clusters of positive epithelial cells were observed in some tumors (Fig. 15C ). Interestingly, COL11A1 was specifically expressed in the intra/peri-tumoral stromal cells while stromal cells >1 mm from the epithelial tumor cells were always negative (Fig. 15D andFig. 22 ). - To determine whether COL11A1 has a functional role in tumor progression, a mouse tumor xenograft model with A2780 human ovarian cancer cells was used. Despite their epithelial morphology, these cells exhibit a mesenchymal-like expression profile, including low levels of E-cadherin and high levels of N-cadherin proteins (Ruby Huang, Cancer Science Institute of Singapore, personal communication). A2780 cells have relatively high levels of endogenous COL11A1 and thus may represent the small subset of COL11A1-expressing epithelial tumor cells that the Inventors observed in patient tumors (
Fig. 15C ). COL11A1 expression in A2780 cells was silenced using shRNA lentiviral particles. Effective silencing of COL11A1 was confirmed by real-time PCR and Western blotting (Fig. 23 ). COL11A1 knockdown resulted in decreased cell migration and invasion (Fig. 16A ,B). To assess the effect of COL11A1 on tumor progression in vivo, the Inventors intraperitoneally injected nude mice with 107 sh-scr A2780 cells or sh-COL11A1 A2780 cells. The experiment was first conducted with 5 mice per group (Fig. 16C ) and then replicated with 10 mice per group (Fig. 16D ). In both sets of experiments, tumor growth was significantly reduced in mice injected with sh-COL11A1 A2780 cells compared to the mice injected with sh-scr A2780 cells (Fig. 16C ,D). - Expression profile data have been used extensively in efforts to develop gene signatures that relate to clinical outcomes in ovarian cancer. A key advantage of the 10-gene OCFS signature is that gene selections as based on overlap among three individual signatures of poor outcome, each of which had been derived using entirely different patient populations and statistical methods for microarray analyses. Thus, this signature should be independent of technical variations associated with microarray analyses and should be associated with poor survival in diverse patient populations. Indeed, these 10 genes are highly enriched in patient subgroups with the worst clinical outcome in published datasets, including the discovery and validation datasets used in this study. For example, among patient subgroups identified in the original ovarian TCGA study, our 10 signature genes exhibit the highest expression in the mesenchymal subgroup, which has the worst survival in that dataset. Furthermore, genes involved in 'cell adhesion', 'TGFβbinding', and 'epithelial mesenchymal transition' were significantly upregulated in
subtype 2, similar to our observation. In the study by Tothill et al., theOCFS 10 genes are most highly enriched in the C1 subtype, which has the worst survival in that dataset. - The OCFS 10-gene signature is robust in its ability to predict poor survival as demonstrated in two large validation datasets consisting of 260 ovarian cancer patient samples and 1,058 pooled ovarian cancer patient samples. Interestingly, individual genes or groups of genes from the OCFS 10- gene signature, including COL11A1, POSTN, SNAI2, THBS2 and TIMP3, have also been associated with poor survival in other solid tumors including breast, colorectal, lung, oral, and head and neck carcinomas as well as melanoma, suggesting that expression of this signature is not specific to ovarian cancer but might characterize aggressive behavior across cancer types.
- Another major strength of the OCFS 10-gene signature is its clear biological relevance to cancer progression. Previously identified gene signatures in ovarian cancer consist of genes that are involved in many diverse biological processes, making it difficult to assess their biological relevance or functional role in cancer progression. All 10 of the OCFS signature genes are present in the 351-gene signature that was identified as upregulated in invasive ductal carcinoma (IDC) when compared to noninvasive ductal carcinoma in situ (DCIS), supporting the important role of these genes in early local invasion. The Inventors further showed that the 10 signature genes are highly enriched in metastases and that knockdown of one of these genes, COL11A1, results in reduced cell migration, invasion, and tumor progression, suggesting that collagen remodeling could be important in ovarian cancer progression and metastasis. The higher expression of 10 genes in metastasis does not appear to be due to a higher stroma-to-tumor ratio in metastatic tumors for several reasons.
- First, tumor samples from the TCGA dataset were selected to have >70% tumor cells. Second, the Inventors did not observe different expression levels of the epithelial marker, EPCAM, and the stromal marker, vimentin, in metastatic tumors compared to primary tumors (
Fig. 14A ), indicating that the stroma-to-tumor ratio is not significantly different between samples of primary tumors and metastases. Third, in situ hybridization results showed that regardless of the overall amount of stroma in tumor sections, COL11A1 expression was confined to intra-/peri-tumoral stromal cells and rare foci of tumor epithelial cells, while stromal cells that were >1 mm from epithelial tumor cells were completely negative (Fig. 15B-D ). This indicates that COL11A1 is a specific marker of carcinoma-associated fibroblasts (CAFs) and possibly cancer cells that are undergoing EMT. The in situ hybridization analysis of COL11A1 in matched triplets of primary ovarian cancer, concurrent metastasis, and recurrent/persistent metastasis,demonstrated a marked increase in COL11A1 during cancer progression in all patients (Fig. 15A ), indicating that COL11A1 could serve as a marker of cancer progression. - Collagen-rich stroma is thought to maintain tissue architecture and, under normal conditions, serve as a barrier to epithelial cell migration. However, when modified by cancer cells, collagen-rich stroma can promote tumor progression. Enhanced collagen deposition and cross-linking has been shown to increase breast cancer risk. Increased levels of LOX, an enzyme responsible for collagen cross-link formation, result in increased collagen stiffness. POSTN also promotes collagen cross-linking by interacting with BMP-1 to enhance the proteolytic activity of LOX, which results in the reorganization of loose connective tissue into linear tracks of fibers that promote chemotaxis of tumor cells). Furthermore, increased collagen deposition and remodeling increases interstitial pressure, thereby severely compromising the efficacy of drug delivery. Of particular interest, an increase in collagen expression and remodeling has been associated with cisplatin resistance in ovarian cancer, suggesting that cisplatin resistance might be one of the factors contributing to poor survival.
- Finally, the clinically-relevant strength of the OCFS 10-gene signature is that it can be not only used as a biomarker to identify patients with poor outcome but also as a guide to individualize their therapy. In fact, several of the
OCFS 10 signature genes have been validated as promising therapeutic targets in mouse models. POSTN, an extracellular matrix protein that is highly expressed in late-stage ovarian cance, is thought to play a role in metastatic colonization by forming a niche for cancer stem cells. Treatment with a POSTN-neutralizing antibody led to a significant decrease in ovarian tumor growth and metastasis in a mouse model. Similarly, inhibiting LOX by treatment with β-aminopropionitrile, neutralizing antibodies, or RNA interference inhibited tumor metastasis in xenograft and transgenic mouse models. - The COL11A1 knockdown result suggests that targeting collagen might be an effective approach to preventing ovarian cancer progression and metastasis. A recent study of collagen mimetic peptides (CMPs), 2-3 kDa small peptides that bind to type I collagen, showed that they can specifically bind to tumors with high matrix metalloproteinase (MMP) activity in xenograft models. This is a promising approach to treating tumors associated with excessive collagen remodeling and high MMP activity. Furthermore, the Inventors showed that collagen-remodeling genes are regulated by TGFβ1, suggesting that targeting TGFβ1 signaling might be an efficient way to impede metastatic progression. High TGFβ1 signaling activity was reported in patients with metastatic ovarian cancer and the antibody against TGFβ was shown to be effective in suppressing metastasis in a preclinical model of ovarian cancer. Currently, there are several TGFβ1 inhibitors in phase I/II clinical trials. It will be important to test the effectiveness of these agents as inhibitors of ovarian cancer progression and metastasis as single agents or in combination with chemotherapy.
- The described OCFS 10-gene signature assay will effectively enhance physicians' abilities to identify patients with a high likelihood of recurrence.
Fig. 8A shows the triage map of current clinical practice and the point of care at which our gene signature test will be of clinical value. - A Nanostring assay can be developed for the detection and quantification of the gene signature transcripts. This system is favored for accurate detection of transcripts in paraffin samples without relying on cDNA synthesis or PCR amplification. Assay development paraffin blocks from patients linked to a detailed correlative database with clinical variables, including recurrences. Cox regression of the log hazard ratio on a covariate with a standard deviation of 1.5 based on a sample of 100 observations achieves 85%, and 95%, power at a 0.05 significance level to detect a regression coefficient (log hazard ratio) equal to 0.2 and 0.25 respectively. Sample size can adjusted for an anticipated event rate of 80%.
- This prediction power will probably be larger than estimated since the model is constructed with a panel of gene signatures instead of a single covariate. After normalization, the expression of the signature genes will be correlated with outcomes. Risk prediction models with known parameters will be validated with this clinical assay. Model performance can be assess with (1) calibration measures to study the agreement between the observed outcome frequencies and predicted probabilities, (2) discrimination (classification) measures to distinguish subjects with different outcomes at each time cutoff point, and (3) prediction accuracy.
- Model calibration will be studied with a calibration curve in which observed frequencies are plotted against predicted probabilities. Ideally, if the observed frequencies and predicted probabilities agree over the whole range of probabilities, the plot will show a 45 degree line with an intercept of 0 and slope of 1. Therefore, Chi-square distribution with 2 degrees of freedom will be used to test the null hypothesis that the intercept is 0 and the slope is 1. Additionally, one can also use the Hosmer-Lemeshow (H-L) goodness-of-fit test for calibration validation. Both equal sizes and equal prediction-intervals will be used to group the patients into subgroups. Especially for the Cox regression based risk model, one can categorize patients into subgroups based on their distribution of relative risk with the Kaplan-Meier method and calculate the goodness-of-fit for calibration validation. One constructs a ROC curve to compare the performance of candidate models by varying the cutoff points of combined risk scores. Standard performance measures such as AUC (c-statistics), partial AUC within a certain specificity range, and F-measure will be computed to evaluate the prediction ability of the risk models given a cutoff time. The Global AUC summary (GAUCS) will also be used to estimate the performance of Cox regression based risk models.
- As described, the OCFS 10-gene signature is enriched in metastatic ovarian cancer. To identify the underlying biological mechanism that could explain the observed association of poor survival with high expression of the signature genes, the Inventors evaluated the expression levels of the 10-gene signature in
Fig. 12A in primary and metastatic serous ovarian tumors. In the GSE12172 dataset, which includes 74 high-grade serous primary ovarian tumors and 16 unpaired metastatic tumors, higher expression levels of the 10 genes were observed in the metastatic tumors. This observation was further validated using qPCR in an independent patient cohort that included 8 normal, 30 primary, and 29 unpaired metastatic serous ovarian cancer samples from our biorepository. Most of theOCFS 10 signature genes were not expressed in normal ovaries, but their expression was enriched in primary tumors and even further enriched in metastases. Importantly, this indicates that during tumor progression, the cell population expressing the signature genes is enriched or the process resulting in the expression of the signature genes is intensified. - Further, the signature genes are expressed in both MSCs and CSCs. To identify a specific cell type that is characterized by the presence of the signature, the Inventors searched the tissue/cell-specific transcripts in the TranscriptoNet database, which consists of >500 normal tissues and cell types that were isolated from >50 different organs by microdissection (i.e. epithelial cell of the endometrium) or by FACS using specific cell markers (i.e. 27 distinct blood cell types). Since the signature genes are highly co-regulated, the presence or absence of the signature was immediately apparent. Remarkably, the signature was present in only 3 normal cell types: undifferentiated pre-adipocytes (but not differentiated pre-adipocytes) from visceral, subcutaneous and omental fat; cardiomyocytes; and bone marrow MSCs. The common denominator to the 3 cell types is that they are all MSCs. In the entire database, there was no epithelial cell type with significant expression of the signature genes.
- However, in studies of ovarian CSCs, the Inventors observed enrichment of the gene signature in the ALDH+/CD133+ CSC subpopulation of an epithelial A2780 ovarian cancer cell line, while others have shown enrichment of the signature genes in cisplatin-resistant A2780 cells, supporting the hypothesis that the signature genes are expressed in a specialized subpopulation of malignant cancer cells. Taking all of these pieces of data into account, there are 3 possible mechanisms accounting for the overlap between OCSC, OCDS, and OCFS signatures: 1) as derived from epithelial cancer cells that de-differentiate into CSCs as derived from MSCs that are actively recruited to the tumor from fat and/or bone marrow or from local fibroblasts that de-differentiate into MSC 2) as derived process-specific mechanism, such as any cell undergoing de-differentiation or trans-differentiation into CSCs or MSCs will express the signature genes. These various scenarios accounting for poor outcomes associated with the signature as related to ovarian cancers with a higher proportion of CSCs are more aggressive and chemoresistant. In addition, a high proportion of desmoplastic stroma in ovarian carcinoma is associated with worse prognosis, and poor differentiation and EMT are associated with ovarian cancer aggressiveness.
- To identify the cell-of-origin for one of the signature genes, one can focus on COL11A1 as this gene is not expressed in most normal tissues but its expression is highly elevated in most cancer types in comparison to their respective normal tissue. In situ hybridization for COL11A1 in 8 primary and 8 matched metastatic tumors (5 synchronous and 3 metachronous recurrent metastases) indicates that in both the primary and metastatic tumors, the majority of the signal was detected in a subset of stromal cells while the epithelial cells expressed low or undetectable levels of COL11A1. The ratio of COL11A1-positive to COL11A1-negative cells also increased in metastatic vs. primary tumors. Thus, metastatic tumors contained more COL11A1-expressing cells, although it is unclear if these cells were recruited to the tumor or represented resident cells that converted into a COL11A1-expressing phenotype.
- Because most of the COL11A1 signal are detected in cells with stromal morphology, the intuitive conclusion is that COL11A1 is expressed in the stromal, rather than the epithelial, component of the tumor, however, the Inventors cannot exclude the possibility that the stromal cells are derived from epithelial cells through EMT. One can observe that COL11A1 is expressed in stromal cells in close proximity (<1mm) to malignant epithelial cells while distant stromal cells and stromal cells encapsulating the tumor were negative, which is consistent with the idea that the COL11A1-expressing stromal cells are derived locally rather than recruited from distant sites. Interestingly, in several tumors, the Inventors observed areas in which both epithelial and stromal cells were positive for COL11A1 (
Fig. 15 ). This may represent EMT although this would be difficult to prove as there are no effective markers of EMT in situ. - In conclusion, in situ hybridization in human samples alone cannot mechanisms for signature generation outlined above. A helpful determination the cell-of-origin, can rely on a cell tracking system, such as labeled human cancer cell lines as a source of malignant cancer cells and a mouse host as a source of stromal cells. A previously generated a mouse model by the Inventors in which defined genetic alterations can be introduced into ovarian surface epithelial cells can be applied for such studies. When such cells are implanted under the ovarian bursa, they give rise to primary ovarian tumors as well as metastatic nodules embedded into the peritoneal serosal surfaces, such as the peritoneal wall, intestinal lining, and omentum (
Fig. 23B ). Expression profiling revealed that many of the signature genes were enriched in the mouse metastatic tumors, with COL11A1 and POSTN showing the highest fold increase in metastatic vs. primary ovarian tumors (Fig. 23B ). This is significant because COL11A1 and POSTN are among the genes that exhibit the highest fold increase in human metastatic vs. primary tumors, indicating that a process similar to human ovarian cancer metastatic progression occurs in the mouse model. As a result, this mouse model can be used to study the cellular context of the signature genes. - The cell-of-origin for the signature transcripts may not be obvious as the majority of the signature genes encode secreted extracellular matrix proteins. Research groups who have identified similar collagen-remodeling gene sets as predictors of poor outcome in breast cancer have attempted to determine their cell-of-origin using laser capture of tumor epithelial and stromal cells but have reached contradictory conclusions.
- As gene signatures such as the OCSC, OCDS, and OCFS signatures can be associated with poor outcome in multiple tumor types, including breast, colon, and lung cancer, and multiple metastatic locations, including local invasion in breast cancer and metastatic dissemination to various intraperitoneal organs in ovarian cancer, one can conclude that such signature may not be cancer type-specific nor metastasis site-specific. Such signatures can be either specific to a certain cell type that is present in diverse tumor types (i.e. recruited macrophages or MSCs) or to a common biological process that occurs in diverse cell types (i.e. de-differentiation of cancer cells into CSCs or trans-differentiation of fibroblasts into myofibroblasts or MSCs). To accurately define the therapeutic target, it is important to identify the cellular context of the poor-prognosis signature gene expression.
- One hypothesis is that he signature genes are expressed in a specific cell type derived from either malignant cancer cells or host stromal cells. This can be determined using labeled cells of human and mouse origin in a mouse model of metastatic ovarian cancer progression.
- Given the potential cell-of-origin questions raised above, a key question is whether various signatures are derived from malignant cancer cells or host stromal cells. Many of the genes in the signature are known inducers of EMT and their expression in cancer cells may make these cells indistinguishable from non-tumor mesenchymal cells. One can use human OVCAR3 cells because of the low endogenous expression of the signature genes, which can be induced by recombinant TGFB1 (
Fig. 25 ). Red fluorescence protein (RFP)-labeled OVCAR3 cells will be compacted using a hanging-drop technique and implanted under the ovarian bursa of nude mice. When the mice develop carcinomatosis, primary ovarian tumors and metastatic tumors will be harvested for 1) fluorescence activated cell sorting (FACS), 2) immunofluorescence (IF), and 3) qPCR. The ratio of RFP+ and RFP- cells in primary and metastatic tumors will be determined by IF and FACS. IF with antibodies against COL11A1 (provided by OncoMatrix as DMTX invaScan kit for detection of invasive tumors 98) and POSTN (BioVendor, RD172045100) will be used to determine whether COL11A1 and POSTN are expressed in RFP+ or RFP- cells. qPCR analysis will be used to determine the mRNA levels of COL11A1 and POSTN in RFP+ and RFP- cells of the primary and metastatic tumors. In addition to RFP labeling, human- and mouse-specific PCR primers will provide a second layer of assurance that the signature genes are derived from human or mouse cells. - Levels of COL11A1 and POSTN can be elevated in human and mouse metastatic vs. primary tumors. If the signature originates from human cancer cells, enrichment in the relative number of RFP+ cells expressing COL11A1 and POSTN in IF analysis and/or an increase of COL11A1 and POSTN expression levels (with human but not mouse PCR primers) in metastatic vs. primary RFP+ cells would be observed. If the signature originates from mouse host cells, enrichment in the relative number of RFP- cells expressing COL11A1 and POSTN by IF and/or an increase of COL11A1 and POSTN in metastatic vs. primary RFP- cells by qPCR (with mouse but not human primers) would be observed. If COL11A1 and POSTN are elevated in both human RFP+ and mouse RFP- fractions, it is suggested that both human cancer cells and mouse nonmalignant cells upregulate the expression of COL11A1 and POSTN during the process of metastasis.
- It has been shown that cancer cells can generate CSCs through EMT. Patient outcome and drug resistance have also been linked to the properties of CSCs. Thus, it is possible that the signature is enriched in patients with poor prognosis because their tumors contain more CSCs.
- As it is shown that many of the signature genes are enriched in the CSC population of A2780 cells, the Inventors further confirmed that COL11A1 and POSTN are among the top upregulated genes in OVCAR3 cell spheroids, which are enriched for CSCs. To determine whether COL11A1 and POSTN are specifically overexpressed in the CSC population in OVCAR3 xenografts, one can isolate RFP+/ALDH1+ and RFP+/ALDH- tumor cells and compare expression of COL11A1 and POSTN in the two cell populations by qPCR and IF.
- Based on the enrichment of COL11A1 and POSTN in OVCAR3 spheroids, one can anticipate enrichment of these genes in the RFP+/ALDH1+ tumor cell population. Analysis via qRT-PCR of additional signature genes or unbiased expression profiling of CSCs and non-CSCs in primary and metastatic tumors to better characterize these tumor populations. RFP+ selection will assure that the tumor cell populations are of human origin and not derived from the mouse cells.
- Further, signatures as arising from carcinoma-associated stroma may be of bone marrow origin or adipose tissue. Bone marrow from male C57BL6 mice expressing GFP under the ubiquitin promoter mice can be isolated and transplanted into lethally-irradiated female C57BL6 mice expressing RFP under the chicken albumin promoter. Successful engraftment can be determined after 4 weeks by >95% GFP expression in the peripheral blood and bone marrow (and death of control mice without bone marrow transplants). The GFP-bone marrow-engrafted mice can be orthotopically implanted with syngeneic C57BL6 p53-/-;HA-myc;H-ras mouse ovarian cancer cells, which the Inventors recently generated and tested in mice.
- Primary and metastatic tumors typically form 4-5 weeks after implantation of hanging drop-compacted cells into female C57BL6 mice. The primary and metastatic tumors are then isolated and analyzed by FACS for the proportion of the cancer cells (HA+), recruited non-bone marrow cells (RFP+), and recruited bone marrow cells (GFP+). Based on the literature in other tumor models, one anticipates that the contribution of cells to the metastatic tumors will be ∼70% HA+, ∼20% RFP+ and ∼10% GFP+. Levels of COL11A1 and POSTN will be determined in each cell fraction by qPCR and IF. Similar experiments will be conducted with adipose tissue implants from ubiquitin-GFP C57BL6 mice into chicken albumin-RFP C57BL6 mice. In this case, one can take the endogenous adipose (RFP+) tissue into account.
- Using the described approach, expression of COL11A1 and POSTN in metastatic tumors in the GFP+ cells indicates the bone marrow/adipose tissue origin of the signature while increased expression in the RFP+ cells will indicate that the signature originates in mouse cells other than the bone marrow/adipose tissue (
Fig. 24 ). An increase in both GFP+ and RFP+ cell populations indicates that both bone marrow/adipose tissue- and non-bone marrow/adipose tissue-derived cells contribute to the signature gene expression. If the signature genes are solely derived from non-cancer cells, there will be no increase in the signature genes in HA+ cells. - Current chemotherapeutic agents have been largely selected for their ability to destroy rapidly dividing cancer cells rather than the tumor infrastructure that protects the rare specialized cells that drive tumor recurrence and chemoresistance. This might explain why tumor regression does not necessarily translate into increased patient survival. The poor prognosis signature genes that the Inventors identified belong to a molecular network that is required to maintain the structure of the tumor. A better understanding of the components of this underlying structure that drives ovarian cancer progression could reveal the vulnerabilities of the tumor and thus have a major impact on the development of improved therapies for advanced ovarian cancer. Such pre-clinical studies are an important step towards clinical trials in patients with ovarian cancer.
- Based on the described results, the Inventors have successfully targeted COL11A1 for reduction of tumor metastasis. One common feature of the signature genes is their extracellular matrix localization and involvement in collagen remodeling, suggesting that collagen remodeling might be a common biological process that contributes to cancer progression and poor overall survival. To test this hypothesis, the Inventors selected COL11A1 because this gene is highly expressed in most solid tumors but, importantly, not expressed in most normal tissues. COL11A1 expression was silenced using shRNA in the A2780 human ovarian cancer cell line, which has high levels of endogenous COL11A1. Knockdown of COL11A1 did not affect cell proliferation (
Fig. 25A ), however, it resulted in significantly decreased cell migration and invasion in vitro (Fig. 25B ). To assess the effect of COL11A1 on tumor progression in vivo, the Inventors injected nude mice with scrambled shRNA (sh-scr) A2780 cells or COL11A1-specific shRNA (sh-COL11A1) A2780 cells. After 14 days, the mice injected with sh-scr A2780 cells developed large disseminated tumors while the mice with sh-COL11A1 A2780 cells developed small focal tumors (Fig. 25C , D). This result suggests that targeting collagen might be an effective approach to preventing ovarian cancer invasion and metastasis. - TGFβ plays a crucial role in almost every aspect of tumor progression and metastasis. In ovarian cancer, increased TGFβ1 signaling activity was reported in metastatic ovarian tumors in comparison to matched primary ovarian tumors and the antibody against TGFβ was shown to be effective in suppressing metastasis in preclinical models of ovarian cancer. Currently, there are several TGFβ inhibitors in phase I/II clinical trials. It will be important to test the effectiveness of these agents as inhibitors of ovarian cancer progression and metastasis as single agents or in combination with chemotherapy.
- To learn more about the possible upstream regulators of the signature genes, the Inventors applied Ingenuity Pathway Analysis to the 61 signature genes in
Fig. 12A and identified TGFβ1, TGFβ2, TGFβ3, SMAD3, and SMAD7 as top transcription factors regulating expression of the signature genes. For validation of the predicted regulation of the signature genes by TGFβ1, the Inventors treated the human ovarian cancer cell line OVCAR3 (exhibits low endogenous levels of the signature genes) with TGFβ1 and measured mRNA expression of the genes before and after TGFβ1 treatment. The 10 OCFS genes showed slightly different induction times in the presence of TGFβ1. Expression of COL5A1 and SNAI2 was markedly induced after 1 hour of treatment with TGFβ1 whereas expression of the remaining 8 genes was induced after 3 hours of treatment with TGFβ1 (Fig. 11 ). The Inventors then measured expression of the 10 genes in cells pre-treated with the TGFβ1 inhibitor, A83-01, and showed that the TGFβ1 induction was abrogated in cells pre-treated with the inhibitor (Fig. 26 ), further validating that this induction was truly mediated by TGFβ1 signaling. - One may further evaluate the efficacy of A83-01 (TGFβ inhibitor) and 1D11 (TGFβ neutralizing antibody) in mouse models as described in
Aim 2. Since these agents have already been shown to reduce tumor growth in mouse xenografts, special emphasis will be placed on evaluating the effect of TGFβ blockade on cisplatin chemosensitivity and tumor composition, such as the proportion of CSCs and the recruitment of various cell types. - An alternative way to test the role of TGFβ in ovarian cancer progression is to use transgenic mouse models in which TGFβ signaling is completely impaired in stromal cells, such as mice with a conditional knockout of the TGFβ type II receptor. One can have inject the described syngeneic mouse ovarian cancer cells i.p. into Tgfbr2 KO mice. Consistent with the proposed role of TGFβ in ovarian cancer progression, but in contrast to previous observations of a tumor-promoting role for the Tgfbr2 knockout in prostate and breast cancer, preliminary results indicate that growth of ovarian cancer is inhibited upon knockout of the TGFβ type II receptor in mouse stromal cells. Additional experiments can be done to verify this result and determine the effect of the stromal TGFβ type II receptor knockout on the proportion of CSCs and recruitment of stromal cells to the tumor.
- Both pro- and anti-tumorigenic activities have been documented for TGFβ signaling in different cancer types, based on the observed increase of TGFβ1 signaling in metastatic ovarian cancer, the suppression of metastasis upon TGFβ1 inhibition in mouse models of ovarian cancer, and our observation that TGFβ induces expression of the signature genes, one anticipates that inhibition of TGFβ signaling by pharmacologic (A83-01), biologic (1D11) or genetic (Tgfbr2 KO mice) means will have a negative effect on the expression of the signature genes with the resultant loss of a nurturing environment for CSCs and an increased chemosensitivity to cisplatin.
- Although under normal physiological conditions collagen-rich stroma maintains tissue architecture and serves as a barrier to epithelial cell migration, it can turn into a collaborator of cancer progression when modified by malignant cancer cells. Specifically, enhanced collagen deposition and cross-linking is associated with mammographic density, which is one of the greatest risk factors for breast cancer. For example, collagen I is enriched and aligned at the stromal border in breast tumors and changes in collagen I organization are associated with poor prognosis in breast cancer. In support of the idea that increased collagen deposition and cross-linking contributes to cancer formation, a rodent model with increased collagen deposition due to altered collagen degradation exhibited increased mammary tumor formation and progression to metastasis. In addition to collagen deposition, increased levels of LOX, an enzyme responsible for collagen cross-link formation, results in increased collagen stiffness. POSTN also promotes collagen cross-linking by interacting with BMP-1 to enhance the proteolytic activity of LOX. This results in the reorganization of loose connective tissue into linear tracks of fibers that serve as highways to promote chemotaxis of tumor cells. Indeed, breast cancer studies using live imaging have demonstrated that cancer cells migrate on collagen fibers in areas enriched in collagen. Collagen stiffness has also been shown to regulate stem cell differentiation and EMT.
- Additionally, increased collagen deposition and remodeling increases interstitial pressure, which severely compromises the efficacy of drug delivery. For example, remodeling of the ECM through overexpression of COL6A3 in tumor cells was shown to contribute to cisplatin resistance in ovarian cancer. In contrast, the reduction in collagen stiffness can repress the malignant behavior of mammary epithelial cells and administration of collagenase increased the uptake and distribution of monoclonal antibodies in a mouse model of osteosarcoma. Thus, collagen degradation may be an effective approach to targeting the gene signature network. It remains to be determined whether ECM stiffness in cancer may be restored to normal and how such a restoration may benefit treatment prognosis.
- One can test the effectiveness of collagenase in reducing ovarian cancer growth and/or increasing chemosensitivity to cisplatin. The first assessments of efficacy will be done in subcutaneous (s.c.) xenografts of A2780 human ovarian cancer cells (exhibit high expression levels of the signature genes) by direct intratumoral injection of collagenase. Collagenase clostridium histolyticum (XIAFLEX) will be used because this drug has been approved by the FDA for Dupuytren contracture (clinicaltrials.gov; NCT00528606) and is commercially available. Tumors will be disaggregated and analyzed for the presence of CSCs by FACS and immunostaining of tumor sections as described in
Aim 2. Depending on the results of the treatment of s.c. tumors, the Inventors will optimize concentration of XIAFLEX for i.p. treatment to facilitate translation to i.p. therapy in ovarian cancer patients. - Another approach to targeting a network of specific genes is through micro RNA (miRNA). The miRNA-29 family, specifically miR-29b, was recently shown to inhibit tumor metastasis by targeting a network of collagen-remodeling genes. One can test the effectiveness of miR-29b in reducing tumor metastasis and/or the proportion of CSCs in our model. While miRNAs have not yet been fully adapted for use in the clinic, significant progress has been made in improving the specificity of delivery. One can also test the effectiveness of siRNA against the collagen-specific chaperone protein gp46 encapsulated in vitamin A-coupled liposomes, which was shown to be effective in resolving fibrosis in preclinical models of liver and pancreatic fibrosis.
- The utility of deriving OCSC, OCDS, and OCFS signatures is to enhance physicians' abilities to identify patients with a high likelihood of recurrence, thereby improving therapeutic outcomes. For example,
Fig. 8A shows an exemplary triage map of current clinical practice and the point of care at which various OCSC, OCDS, and OCFS signatures provide specific clinical guidance value. - Clinical application of OCSC, OCDS, and OCFS signatures requires development of accurate qRT-PCR (quantitative real-time PCR) based assay, as microarrays are not cost-effective for use in the clinic. A variety of qRT-PCR platforms can be utilized for detection and quantification of OCSC, OCDS, and OCFS transcripts derived from ovarian cancer samples. This includes ABI TaqMan® OpenArray® Real-Time PCR (
Fig. 8B ). In each instance, it may be highly desirable to design arrays such that custom-selected probes for each gene in the signature are represented in quadruplicates measurements, thereby eliminating outlier measurements and potential false-positive amplifications. A variety of housekeeping genes, such as GUSB, PPIA, TBP, RPLP0, RPL4, 18S, ACTB, and GAPDH, each provide baseline expression transcripts measurements that provide assay normalization. Examples of normalization measurements include delta cycle-threshold measurements. - To test the accuracy and precision of the designed assay, qRT-PCR is performed on 112 patient samples that previously used for microarray analysis in one of the three discovery data sets used for identification of periostin (POSTN)-coexpressing genes. This particular data set includes a correlative clinical database with approximately 300 clinical variables, including patient history, symptoms, treatment, other cancer history, surgeries, recurrences and survival status. RNA will be extracted from both frozen and paraffin-embedded primary ovarian cancer samples and reverse transcribed to obtain cDNA.
- After normalization, the expression of various OCSC, OCDS, and OCFS biomarkers are further correlated with clinical outcomes, including progression-free survival (PFS) and overall survival (OS). From
Phase 1, the Inventors expect to have approximately 10 genes that are optimized for the prediction of clinical outcomes. The methods described inPhase 1 will be employed to derive a gene signature for each time to event endpoint, PFS and OS. Model validation will be performed using each of the methods described inPhase 2 by randomly splitting the set of 112 patient samples into a 2/3 training set and a 1/3 validation set. - In certain instances, the high levels of statistical robustness may limit the maximum number of genes that are highly correlated with overall survival that overlap when using any of the four statistical methods described in
Phase 1 is less than 8. In such instances, one can identify the largest subset of genes whose expressions are available and common to at least three studies and use that particular set for identifying the signature. - Many of the biomarkers, including COL11A1, LOX, POSTN, THBS2, and VCAN, have been associated with poor prognosis and metastatic progression in various cancer types and some of these genes have been tested as therapeutic targets in pre-clinical models. Other examples include biomarkers COL3A1, DCN, LUM, SPARC, VCAN, COL11A1, COL5A1 and POSTN in
Fig. 9 or COL3A1, DCN, LUM, SPARC, TIMP3, and VCAM inFig. 10 . The inventors have validated in pre-clinical models two of the biomarkers, CXCL12 and periostin (POSTN), as suitable targets for ovarian cancer treatment. These results demonstrate that OCSC, OCDS, and OCFS biomarkers are not only predictors of poor survival but also play important roles in tumor progression and thus could be used as therapeutic targets. - To test the effectiveness of targeting individual biomarkers in a mouse model of ovarian cancer, one can identify genes that are significant in ovarian cancer progression, functional assays are necessary. Such assays should identify if the candidate genes are sufficient and required for tumor maintenance and progression and, thus, could be used for targeted therapy. One can functionally characterize the contribution of selected genes to ovarian cancer pathogenesis using a genetically relevant mouse model. Also, one can test inhibitors and small molecules specific for candidate signature network genes for their effectiveness to reduce cancer progression and increase chemosensitivity to cisplatin.
- For example, the enrichment of OCSCs has been reported as correlated with increased epithelial-mesenchymal transition (EMT), and small molecules inhibiting EMT provides a mechanism for selective targeting. Curiously, it is presently unknown if tumor formation is driven by: 1) recruitment of mesenchymal stem cells (MSCs) to the tumor from bone marrow or fat, or if 2) cancer cells induce de-differentiation of stromal cells into MSCs. As the above described OCSC signature suggests aberrant expression of genes involved in epithelial-mesenchymal transitions (EMT) or TGF-beta, it is of further interest to understand the role of stromal cells, MSCs in tumor formation, and the interrelation with appearance and generation of OCSC populations. Improved understanding of these processes could allow selective targeting of these pathways. In different examples, compounds targeting EMT function include salinomycin, etoposide, abamectin, nigericin, or metformin.
- In other examples, a similar approach may rely on antibodies, nucleic acids, pepttides and/or proteins, or other biologics to severely defect OCSC function. For example, small interfering RNA (siRNA) or short-hairpin RNA (shRNA) knockdown of FGF1 and FN1 gene expression transcript could achieve these effects. Another example includes targeting of other adhesion markers, such as L1CAM. In different examples, an OCSC-specific antibody could be applied, which targets antigens that could be uniquely, or highly expressed in OCSCs. Examples include antibodies specific for chemoresistance mediator, ABCC5, or surface markers, CD24, CD44, CD117, CD133 or ALDH.
- As another example, one can test the effectiveness of collagenase in a mouse model of ovarian cancer. Although under normal physiological conditions, collagen-rich stroma maintains tissue architecture and serves as a barrier to epithelial cell migration, it can turn into a collaborator of cancer progression when modified by malignant cancer cells. Specifically, enhanced collagen deposition and cross-linking is associated with mammographic density, which is one of the greatest risk factors for breast cancer. For example, it is suggested that collagen deposition contributes to cancer formation, as an animal model with increased collagen deposition due to altered collagen degradation exhibit increased mammary tumor formation and progression to metastasis. In addition, it has been reported that collagen deposition, increased levels of LOX, an enzyme responsible for collagen cross-link formation, results in increased collagen stiffness. Signature gene, POSTN, also promotes collagen cross-linking by interacting with BMP-1 to enhance the proteolytic activity of LOX. This results in the reorganization of loose connective tissue into linear tracks of fibers that serve as highways to promote chemotaxis of tumor cells. Indeed, breast cancer studies using live imaging have demonstrated that cancer cells migrate on collagen fibers in areas enriched in collagen. Collagen stiffness has also been shown to regulate stem cell differentiation, although the molecular mechanisms of how collagen composition regulates decisions between stem cell expansion and differentiation are not well understood. Furthermore, increased collagen deposition and remodeling increases interstitial pressure, which severely compromises the efficacy of drug delivery. In contrast, the reduction in collagen stiffness can repress the malignant behavior of mammary epithelial cells, and administration of collagenase increased the uptake and distribution of monoclonal antibodies in a mouse model of osteosarcoma. Thus, at least theoretically, collagen degradation by may be an effective approach to targeting the gene signature network. Therefore, one can test the effectiveness of collagenase in reducing ovarian cancer growth and/or increasing sensitivity to chemotherapy. Collagenase clostridium histolyticum (XIAFLEX) can be used for intraperitoneal injections because this drug has been approved by the FDA for Dupuytren contracture (clinicaltrials.gov; NCT00528606) and is commercially available.
- One expects that inhibition of individual biomarkers will be effective in reducing tumor growth and/or increasing sensitivity to cisplatin. If the main mechanism by which the biomarkers contribute to tumor progression is collagen deposition and cross-linking, loosening the collagen matrix with collagenase may be the most effective way to inhibit the entire network of biomarkers.
- Blockade of TGF-β and its signaling pathway provides multiple therapeutic There are many TGF-β signaling antagonist agents under development at both the pre-clinical and clinical stages. Some major classes of TGF-β inhibitors include ligand traps, antisense oligonucleotides (ASO), small molecule receptor kinase inhibitors, and peptide aptamers. Ligand traps serve as a sink for the excess TGF-β produced by tumor cells and fibroblasts during cancer progression, which increases with aggressiveness and tumor stage. Ligand traps can also include anti-ligand neutralizing antibodies and soluble decoy receptor proteins that incorporate the ectodomains from either TβKII or βRIII/betaglycan protein. Neutralizing antibodies have been raised against individual ligands or may be designed to block all three isomers. One example includes a pan-neutralizing anti-mouse TGF-β monoclonal antibody, 1D11. Examples of decoy receptor proteins include recombinant Fc-fusion proteins containing the soluble ectodomain of either TβRII (TβRII-Fc) or the type III receptor, betaglycan. ASOs can also be used to reduce the bioavailability of active TGF-β ligands in the local tumor microenvironment by blocking TGF-β synthesis. ASOs are single-stranded polynucleotide molecules, 13-25 nucleotide in length, that hybridize to complementary RNA, inhibiting mRNA function, and preventing protein synthesis through accelerated mRNA degradation by RNase H. One example includes AP12009 (Trabedersen).
- Another therapeutic strategy is to block TβRI activity through the use of small molecule receptor kinase inhibitors that act via ATP-competitive inhibition of the kinase catalytic activity of the receptor. Examples include small molecule inhibitor of TβRI, SB-431542, TβRI/ALK5 kinase inhibitor, Ki26894, TβRI inhibitor SD-208, dual inhibitor of TβRI/II, LY2109761, or inhibitors selective for the kinase domain of the
type 1 TGF-β receptor, LY2157299. Alternatively, other therapeutics targeting related pathways such as EGFR (erlotinib), ABL/PDGFR/KIT (imatinib), and VEGFR/RAF/PDGFR (sorafenib), may be used in combnation with a TGF-beta related therapeutics. - Lastly, targeting intracellular TGF-β signaling molecules, such as Smads, is possible with the use of peptide aptamers, although this is the least explored therapeutic strategy. Aptamers are small peptide molecules containing a target-binding and a scaffolding domain that stabilize and interfere with the function of the target. Aptamers may therefore be designed specifically against Smad2 versus Smad3, and against multimeric transcriptional complexes containing Smads and other transcription factors, transcriptional co-activators, or co-repressors. The Trx-SARA aptamer is and has been reported to reduce the levels of Smad2/3
Claims (6)
- A method of determining a prognosis of cancer in an individual, comprising:determining the presence or absence of a high level of expression in a sample from the individual relative to a normal baseline standard for a prognostic panel comprising the following markers:
AEBP1, COL11A1, COL5A1, COL6A2, LOX, POSTN, SNAI2, THBS2, TIMP3 and VCAN, andprognosing a case of cancer if the individual demonstrates the presence of a high level of expression relative to a normal baseline standard wherein the cancer is ovarian cancer with poor overall survival. - The method of claim 1, wherein the prognosis provides a therapeutic selection for the prognosed individual, selected from the group consisting of: chemotherapy, radiotherapy, surgery, and combinations thereof.
- A method of determining a diagnosis of cancer in an individual suspected of having cancer, comprising:determining the presence or absence of a high level of expression in a sample from the individual relative to a normal baseline standard for a diagnostic panel comprising the following markers:
AEBP1, COL11A1, COL5A1, COL6A2, LOX, POSTN, SNAI2, THBS2, TIMP3 and VCAN, anddiagnosing a case of cancer if the individual demonstrates the presence of a high levelof expression relative to a normal baseline standard, wherein the cancer is ovarian cancer with poor overall survival. - The method of claim 3, wherein the diagnosis provides a molecular subtype classification for the diagnosed case of cancer in the individual.
- A method for determining the subtype of a gynecological cancer, comprising:determining the presence or absence of a high level of expression in the individual relative to a normal baseline standard for a prognostic panel comprising the following markers:
AEBP1, COL11A1, COL5A1, COL6A2, LOX, POSTN, SNAI2, THBS2, TIMP3 and VCAN, anddetermining the subtype of the gynecological cancer a case of cancer if the individual demonstrates the presence of a high level of expression relative to a normal baseline standard, wherein the gynecological cancer is ovarian cancer and the subtype is serous ovarian cancer. - The method of claim 5,(i) wherein the ovarian cancer is characterized by elevated stromal or epithenlial-to-mesechymal transition activity or(ii) wherein determining the subtype of the gynecological cancer indicates a therapeutic treatment or(iii) wherein the therapeutic treatment is immunotherapy or is anti-fibrotic or modulates TGF-β pathway activity.
Applications Claiming Priority (2)
| Application Number | Priority Date | Filing Date | Title |
|---|---|---|---|
| US201261715183P | 2012-10-17 | 2012-10-17 | |
| PCT/US2013/065537 WO2014062978A1 (en) | 2012-10-17 | 2013-10-17 | Molecular signatures of ovarian cancer |
Publications (3)
| Publication Number | Publication Date |
|---|---|
| EP2908913A1 EP2908913A1 (en) | 2015-08-26 |
| EP2908913A4 EP2908913A4 (en) | 2016-10-12 |
| EP2908913B1 true EP2908913B1 (en) | 2018-10-03 |
Family
ID=50488764
Family Applications (1)
| Application Number | Title | Priority Date | Filing Date |
|---|---|---|---|
| EP13848075.1A Active EP2908913B1 (en) | 2012-10-17 | 2013-10-17 | Molecular signatures of ovarian cancer |
Country Status (6)
| Country | Link |
|---|---|
| US (1) | US10253368B2 (en) |
| EP (1) | EP2908913B1 (en) |
| AU (1) | AU2013331154B2 (en) |
| CA (1) | CA2886607A1 (en) |
| IL (1) | IL238335A0 (en) |
| WO (1) | WO2014062978A1 (en) |
Families Citing this family (35)
| Publication number | Priority date | Publication date | Assignee | Title |
|---|---|---|---|---|
| WO2014028862A1 (en) | 2012-08-17 | 2014-02-20 | Cornell University | Use of dna in circulating exosomes as a diagnostic marker for metastasic disease |
| CA2886607A1 (en) | 2012-10-17 | 2014-04-24 | Cedars-Sinai Medical Center | Molecular signatures of ovarian cancer |
| US10844436B2 (en) | 2014-04-01 | 2020-11-24 | Cornell University | Use of double-stranded DNA in exosomes: a novel biomarker in cancer detection |
| WO2016057702A2 (en) * | 2014-10-07 | 2016-04-14 | Cornell University | Methods for prognosing and preventing metastatic liver disease |
| HK1243141A1 (en) * | 2014-12-23 | 2018-07-06 | 豪夫迈.罗氏有限公司 | Compositions and methods for treating and diagnosing chemotherapy-resistant cancers |
| WO2016172710A2 (en) | 2015-04-24 | 2016-10-27 | Cornell University | Methods and reagents for determination and treatment of organotropic metastasis |
| US11000536B2 (en) * | 2015-04-30 | 2021-05-11 | Nant Holdings Ip, Llc | Patient treatment via teratogenic pharmaceutical compounds |
| JP6624704B2 (en) | 2015-08-31 | 2019-12-25 | 日立化成株式会社 | Molecular methods for assessing urothelial disease |
| US10267802B2 (en) | 2015-09-23 | 2019-04-23 | The Board Of Trustees Of The Leland Stanford Junior University | Methods of prognosis and diagnosis of ovarian cancer |
| US20170097355A1 (en) * | 2015-10-06 | 2017-04-06 | University Of Washington | Biomarkers and methods to distinguish ovarian cancer from benign tumors |
| US11823799B2 (en) * | 2015-11-20 | 2023-11-21 | Universite De Strasbourg | Method for identifying personalized therapeutic strategies for patients affected with a cancer |
| WO2017156519A1 (en) | 2016-03-11 | 2017-09-14 | The Board Of Trustees Of The University Of Illinois | Small-molecules active against gram-negative bacteria |
| JP6143920B1 (en) * | 2016-06-20 | 2017-06-07 | 国立研究開発法人国立がん研究センター | MMP1 gene transcripts and test methods as prognostic markers for ovarian cancer |
| GB201619808D0 (en) * | 2016-11-23 | 2017-01-04 | Univ London Queen Mary | Biomarkers for the prognosis and diagnosis of cancer |
| TWI787230B (en) | 2017-01-20 | 2022-12-21 | 法商賽諾菲公司 | Anti-tgf-beta antibodies and their use |
| TWI788321B (en) | 2017-01-20 | 2023-01-01 | 美商健臻公司 | Bone-targeting antibodies |
| US11963966B2 (en) | 2017-03-31 | 2024-04-23 | Dana-Farber Cancer Institute, Inc. | Compositions and methods for treating ovarian tumors |
| WO2018213141A1 (en) * | 2017-05-16 | 2018-11-22 | Hitachi Chemical Co. America, Ltd. | Methods for detecting ovarian cancer using extracellular vesicles for molecular analysis |
| US11274106B2 (en) | 2017-06-23 | 2022-03-15 | The Board Of Trustees Of The University Of Illinois | Topoisomerase inhibitors with antibacterial and anticancer activity |
| CN107365773A (en) * | 2017-08-11 | 2017-11-21 | 江苏省中国科学院植物研究所 | Chinese small iris cysteine rich GFP IlCDT1 and its plant expression vector and construction method |
| AU2019265019B2 (en) | 2018-05-11 | 2025-11-06 | Beam Therapeutics Inc. | Methods of substituting pathogenic amino acids using programmable base editor systems |
| WO2019241695A1 (en) * | 2018-06-14 | 2019-12-19 | The Regents Of The University Of Colorado, A Body Corporate | Methods of evaluating treatment outcome in high grade serous ovarian cancer |
| CN108926715B (en) * | 2018-08-08 | 2020-07-21 | 华中科技大学同济医学院附属同济医院 | Application of TAGLN gene expression inhibitor in the preparation of drugs for treating ovarian cancer |
| WO2020101432A1 (en) * | 2018-11-16 | 2020-05-22 | 가톨릭대학교 산학협력단 | Biomarker for predicting onset of hereditary ovarian cancer and use thereof |
| EP3657171A1 (en) * | 2018-11-20 | 2020-05-27 | Philipps-Universität Marburg | Method for the determination of the prognosis of ovarian carcinoma (oc) |
| US20200225239A1 (en) * | 2019-01-10 | 2020-07-16 | Massachusetts Institute Of Technology | Treatment methods for minimal residual disease |
| US12560590B2 (en) | 2019-01-23 | 2026-02-24 | Massachusetts Institute Of Technology | Rapid analysis of live cells |
| AU2020370867A1 (en) * | 2019-10-24 | 2022-06-09 | The Council Of The Queensland Institute Of Medical Research | A cancer diagnostic |
| EP4226377A1 (en) | 2020-10-09 | 2023-08-16 | Worldwide Innovative Network | Novel prediction method and gene signatures for the treatment of cancer |
| RU2750472C1 (en) * | 2021-01-26 | 2021-06-28 | федеральное государственное бюджетное учреждение "Национальный медицинский исследовательский центр онкологии" Министерства здравоохранения Российской Федерации | Minimally invasive method for diagnosis of high-grade serous ovarian adenocarcinoma based on copy index of sult1e1, cyp1b1, and esr1 genes |
| US20240254565A1 (en) * | 2021-06-21 | 2024-08-01 | Vanderbilt University | Unique cancer associated fibroblast subsets predict response to immunotherapy |
| CN116312814B (en) * | 2021-12-02 | 2024-09-27 | 复旦大学 | A method, device, apparatus and kit for constructing a molecular typing model for lung adenocarcinoma |
| CN114807374A (en) * | 2022-06-01 | 2022-07-29 | 北京大学第三医院(北京大学第三临床医学院) | Ovarian cancer prognosis risk model based on polyunsaturated fatty acid related genes and preparation method and application thereof |
| CN116103403B (en) * | 2023-01-18 | 2023-08-11 | 山东大学 | Biomarker for diagnosis and prognosis of ovarian cancer and application thereof |
| WO2026015087A1 (en) * | 2024-07-12 | 2026-01-15 | National University Of Singapore | A method for determining a subject's responsiveness to treatment with a vegf inhibitor |
Family Cites Families (6)
| Publication number | Priority date | Publication date | Assignee | Title |
|---|---|---|---|---|
| AU2002951346A0 (en) | 2002-09-05 | 2002-09-26 | Garvan Institute Of Medical Research | Diagnosis of ovarian cancer |
| US7723112B2 (en) * | 2005-10-31 | 2010-05-25 | The Regents Of The University Of Michigan | Compositions and methods for treating and diagnosing cancer |
| JP5468782B2 (en) * | 2006-03-02 | 2014-04-09 | エージェンシー フォー サイエンス,テクノロジー アンド リサーチ | Methods for cancer treatment and stem cell regulation |
| US9540695B2 (en) * | 2008-06-17 | 2017-01-10 | Rosetta Genomics Ltd. | Compositions and methods for prognosis of ovarian cancer |
| JP2013523186A (en) * | 2010-04-13 | 2013-06-17 | ザ トラスティース オブ コロンビア ユニバーシティ イン ザ シティ オブ ニューヨーク | Biomarker based on multi-cancer invasion related mechanism |
| CA2886607A1 (en) | 2012-10-17 | 2014-04-24 | Cedars-Sinai Medical Center | Molecular signatures of ovarian cancer |
-
2013
- 2013-10-17 CA CA 2886607 patent/CA2886607A1/en not_active Abandoned
- 2013-10-17 AU AU2013331154A patent/AU2013331154B2/en not_active Ceased
- 2013-10-17 EP EP13848075.1A patent/EP2908913B1/en active Active
- 2013-10-17 WO PCT/US2013/065537 patent/WO2014062978A1/en not_active Ceased
-
2015
- 2015-04-16 IL IL238335A patent/IL238335A0/en unknown
- 2015-04-17 US US14/690,291 patent/US10253368B2/en active Active
Non-Patent Citations (1)
| Title |
|---|
| None * |
Also Published As
| Publication number | Publication date |
|---|---|
| EP2908913A4 (en) | 2016-10-12 |
| WO2014062978A1 (en) | 2014-04-24 |
| AU2013331154B2 (en) | 2018-02-01 |
| EP2908913A1 (en) | 2015-08-26 |
| US10253368B2 (en) | 2019-04-09 |
| CA2886607A1 (en) | 2014-04-24 |
| AU2013331154A1 (en) | 2015-04-16 |
| US20150322530A1 (en) | 2015-11-12 |
| IL238335A0 (en) | 2015-06-30 |
Similar Documents
| Publication | Publication Date | Title |
|---|---|---|
| US10253368B2 (en) | Molecular signatures of ovarian cancer | |
| Liu et al. | Integrative molecular and spatial analysis reveals evolutionary dynamics and tumor-immune interplay of in situ and invasive acral melanoma | |
| Chang et al. | Single-cell multi-stage spatial evolutional map of esophageal carcinogenesis | |
| Hu et al. | Long noncoding RNA GAPLINC regulates CD44-dependent cell invasiveness and associates with poor prognosis of gastric cancer | |
| Bergamaschi et al. | Extracellular matrix signature identifies breast cancer subgroups with different clinical outcome | |
| Modlich et al. | Identifying superficial, muscle-invasive, and metastasizing transitional cell carcinoma of the bladder: use of cDNA array analysis of gene expression profiles | |
| Kahn et al. | The vascular landscape of human cancer | |
| Markert et al. | Molecular classification of prostate cancer using curated expression signatures | |
| Fergelot et al. | The experimental renal cell carcinoma model in the chick embryo | |
| Zhang et al. | Comprehensive analysis of the competing endogenous circRNA-lncRNA-miRNA-mRNA network and identification of a novel potential biomarker for hepatocellular carcinoma | |
| US20110182881A1 (en) | Signature and determinants associated with metastasis and methods of use thereof | |
| Williams et al. | MicroRNA-200c restoration reveals a cytokine profile to enhance M1 macrophage polarization in breast cancer | |
| Rabjerg et al. | Molecular characterization of clear cell renal cell carcinoma identifies CSNK 2A1, SPP 1 and DEFB 1 as promising novel prognostic markers | |
| Yokota et al. | Gene expression profile in the activation of subperitoneal fibroblasts reflects prognosis of patients with colon cancer | |
| Désert et al. | “Fibrous nests” in human hepatocellular carcinoma express a Wnt-induced gene signature associated with poor clinical outcome | |
| Zhang et al. | Single‐cell RNA sequencing to explore cancer‐associated fibroblasts heterogeneity:“Single” vision for “heterogeneous” environment | |
| Gulati et al. | Molecular analysis of primary and metastatic sites in patients with renal cell carcinoma | |
| Schultz et al. | Progression-specific genes identified in microdissected formalin-fixed and paraffin-embedded tissue containing matched ductal carcinoma in situ and invasive ductal breast cancers | |
| Wang et al. | Identification of the prognostic value of elevated ANGPTL4 expression in gallbladder cancer‐associated fibroblasts | |
| WO2016025717A1 (en) | Methods and materials for identifying metastatic malignant skin lesions and treating skin cancer | |
| Li et al. | The dynamically evolving cell states and ecosystem from benign nevi to melanoma | |
| Lin et al. | Molecular predictors of prognosis in lung cancer | |
| Zeng et al. | Phenotype remodelling of HNSCC cells in the muscle invasion environment | |
| Hodges et al. | Prostate cancer biomarkers: Current status | |
| Wu et al. | Single-cell analysis reveals diverse stromal subsets associated with immune evasion in triple-negative breast cancer |
Legal Events
| Date | Code | Title | Description |
|---|---|---|---|
| PUAI | Public reference made under article 153(3) epc to a published international application that has entered the european phase |
Free format text: ORIGINAL CODE: 0009012 |
|
| 17P | Request for examination filed |
Effective date: 20150501 |
|
| AK | Designated contracting states |
Kind code of ref document: A1 Designated state(s): AL AT BE BG CH CY CZ DE DK EE ES FI FR GB GR HR HU IE IS IT LI LT LU LV MC MK MT NL NO PL PT RO RS SE SI SK SM TR |
|
| AX | Request for extension of the european patent |
Extension state: BA ME |
|
| RIN1 | Information on inventor provided before grant (corrected) |
Inventor name: KARLAN, BETH Y. Inventor name: CHEON, DONG-JOO Inventor name: CUI, XIAOJIAN Inventor name: ORSULIC, SANDRA Inventor name: TIGHIOUART, MOURAD |
|
| DAX | Request for extension of the european patent (deleted) | ||
| RIC1 | Information provided on ipc code assigned before grant |
Ipc: C12Q 1/68 20060101AFI20160518BHEP |
|
| RA4 | Supplementary search report drawn up and despatched (corrected) |
Effective date: 20160909 |
|
| RIC1 | Information provided on ipc code assigned before grant |
Ipc: C12Q 1/68 20060101AFI20160905BHEP |
|
| 17Q | First examination report despatched |
Effective date: 20170823 |
|
| REG | Reference to a national code |
Ref country code: DE Ref legal event code: R079 Ref document number: 602013044633 Country of ref document: DE Free format text: PREVIOUS MAIN CLASS: A61P0035000000 Ipc: C12Q0001688600 |
|
| GRAP | Despatch of communication of intention to grant a patent |
Free format text: ORIGINAL CODE: EPIDOSNIGR1 |
|
| RIC1 | Information provided on ipc code assigned before grant |
Ipc: C12Q 1/6886 20180101AFI20180503BHEP |
|
| INTG | Intention to grant announced |
Effective date: 20180524 |
|
| GRAS | Grant fee paid |
Free format text: ORIGINAL CODE: EPIDOSNIGR3 |
|
| GRAA | (expected) grant |
Free format text: ORIGINAL CODE: 0009210 |
|
| AK | Designated contracting states |
Kind code of ref document: B1 Designated state(s): AL AT BE BG CH CY CZ DE DK EE ES FI FR GB GR HR HU IE IS IT LI LT LU LV MC MK MT NL NO PL PT RO RS SE SI SK SM TR |
|
| REG | Reference to a national code |
Ref country code: GB Ref legal event code: FG4D |
|
| REG | Reference to a national code |
Ref country code: CH Ref legal event code: EP Ref country code: AT Ref legal event code: REF Ref document number: 1048666 Country of ref document: AT Kind code of ref document: T Effective date: 20181015 |
|
| REG | Reference to a national code |
Ref country code: FR Ref legal event code: PLFP Year of fee payment: 6 |
|
| REG | Reference to a national code |
Ref country code: IE Ref legal event code: FG4D Ref country code: DE Ref legal event code: R096 Ref document number: 602013044633 Country of ref document: DE |
|
| REG | Reference to a national code |
Ref country code: NL Ref legal event code: MP Effective date: 20181003 |
|
| REG | Reference to a national code |
Ref country code: LT Ref legal event code: MG4D |
|
| REG | Reference to a national code |
Ref country code: AT Ref legal event code: MK05 Ref document number: 1048666 Country of ref document: AT Kind code of ref document: T Effective date: 20181003 |
|
| PG25 | Lapsed in a contracting state [announced via postgrant information from national office to epo] |
Ref country code: NL Free format text: LAPSE BECAUSE OF FAILURE TO SUBMIT A TRANSLATION OF THE DESCRIPTION OR TO PAY THE FEE WITHIN THE PRESCRIBED TIME-LIMIT Effective date: 20181003 |
|
| PG25 | Lapsed in a contracting state [announced via postgrant information from national office to epo] |
Ref country code: ES Free format text: LAPSE BECAUSE OF FAILURE TO SUBMIT A TRANSLATION OF THE DESCRIPTION OR TO PAY THE FEE WITHIN THE PRESCRIBED TIME-LIMIT Effective date: 20181003 Ref country code: AT Free format text: LAPSE BECAUSE OF FAILURE TO SUBMIT A TRANSLATION OF THE DESCRIPTION OR TO PAY THE FEE WITHIN THE PRESCRIBED TIME-LIMIT Effective date: 20181003 Ref country code: HR Free format text: LAPSE BECAUSE OF FAILURE TO SUBMIT A TRANSLATION OF THE DESCRIPTION OR TO PAY THE FEE WITHIN THE PRESCRIBED TIME-LIMIT Effective date: 20181003 Ref country code: LV Free format text: LAPSE BECAUSE OF FAILURE TO SUBMIT A TRANSLATION OF THE DESCRIPTION OR TO PAY THE FEE WITHIN THE PRESCRIBED TIME-LIMIT Effective date: 20181003 Ref country code: IS Free format text: LAPSE BECAUSE OF FAILURE TO SUBMIT A TRANSLATION OF THE DESCRIPTION OR TO PAY THE FEE WITHIN THE PRESCRIBED TIME-LIMIT Effective date: 20190203 Ref country code: FI Free format text: LAPSE BECAUSE OF FAILURE TO SUBMIT A TRANSLATION OF THE DESCRIPTION OR TO PAY THE FEE WITHIN THE PRESCRIBED TIME-LIMIT Effective date: 20181003 Ref country code: BG Free format text: LAPSE BECAUSE OF FAILURE TO SUBMIT A TRANSLATION OF THE DESCRIPTION OR TO PAY THE FEE WITHIN THE PRESCRIBED TIME-LIMIT Effective date: 20190103 Ref country code: PL Free format text: LAPSE BECAUSE OF FAILURE TO SUBMIT A TRANSLATION OF THE DESCRIPTION OR TO PAY THE FEE WITHIN THE PRESCRIBED TIME-LIMIT Effective date: 20181003 Ref country code: LT Free format text: LAPSE BECAUSE OF FAILURE TO SUBMIT A TRANSLATION OF THE DESCRIPTION OR TO PAY THE FEE WITHIN THE PRESCRIBED TIME-LIMIT Effective date: 20181003 Ref country code: NO Free format text: LAPSE BECAUSE OF FAILURE TO SUBMIT A TRANSLATION OF THE DESCRIPTION OR TO PAY THE FEE WITHIN THE PRESCRIBED TIME-LIMIT Effective date: 20190103 Ref country code: CZ Free format text: LAPSE BECAUSE OF FAILURE TO SUBMIT A TRANSLATION OF THE DESCRIPTION OR TO PAY THE FEE WITHIN THE PRESCRIBED TIME-LIMIT Effective date: 20181003 |
|
| PG25 | Lapsed in a contracting state [announced via postgrant information from national office to epo] |
Ref country code: RS Free format text: LAPSE BECAUSE OF FAILURE TO SUBMIT A TRANSLATION OF THE DESCRIPTION OR TO PAY THE FEE WITHIN THE PRESCRIBED TIME-LIMIT Effective date: 20181003 Ref country code: GR Free format text: LAPSE BECAUSE OF FAILURE TO SUBMIT A TRANSLATION OF THE DESCRIPTION OR TO PAY THE FEE WITHIN THE PRESCRIBED TIME-LIMIT Effective date: 20190104 Ref country code: PT Free format text: LAPSE BECAUSE OF FAILURE TO SUBMIT A TRANSLATION OF THE DESCRIPTION OR TO PAY THE FEE WITHIN THE PRESCRIBED TIME-LIMIT Effective date: 20190203 Ref country code: SE Free format text: LAPSE BECAUSE OF FAILURE TO SUBMIT A TRANSLATION OF THE DESCRIPTION OR TO PAY THE FEE WITHIN THE PRESCRIBED TIME-LIMIT Effective date: 20181003 Ref country code: AL Free format text: LAPSE BECAUSE OF FAILURE TO SUBMIT A TRANSLATION OF THE DESCRIPTION OR TO PAY THE FEE WITHIN THE PRESCRIBED TIME-LIMIT Effective date: 20181003 |
|
| REG | Reference to a national code |
Ref country code: CH Ref legal event code: PL |
|
| REG | Reference to a national code |
Ref country code: BE Ref legal event code: MM Effective date: 20181031 |
|
| PG25 | Lapsed in a contracting state [announced via postgrant information from national office to epo] |
Ref country code: LU Free format text: LAPSE BECAUSE OF NON-PAYMENT OF DUE FEES Effective date: 20181017 |
|
| REG | Reference to a national code |
Ref country code: DE Ref legal event code: R097 Ref document number: 602013044633 Country of ref document: DE |
|
| REG | Reference to a national code |
Ref country code: IE Ref legal event code: MM4A |
|
| PG25 | Lapsed in a contracting state [announced via postgrant information from national office to epo] |
Ref country code: DK Free format text: LAPSE BECAUSE OF FAILURE TO SUBMIT A TRANSLATION OF THE DESCRIPTION OR TO PAY THE FEE WITHIN THE PRESCRIBED TIME-LIMIT Effective date: 20181003 Ref country code: IT Free format text: LAPSE BECAUSE OF FAILURE TO SUBMIT A TRANSLATION OF THE DESCRIPTION OR TO PAY THE FEE WITHIN THE PRESCRIBED TIME-LIMIT Effective date: 20181003 |
|
| PLBE | No opposition filed within time limit |
Free format text: ORIGINAL CODE: 0009261 |
|
| STAA | Information on the status of an ep patent application or granted ep patent |
Free format text: STATUS: NO OPPOSITION FILED WITHIN TIME LIMIT |
|
| PG25 | Lapsed in a contracting state [announced via postgrant information from national office to epo] |
Ref country code: RO Free format text: LAPSE BECAUSE OF FAILURE TO SUBMIT A TRANSLATION OF THE DESCRIPTION OR TO PAY THE FEE WITHIN THE PRESCRIBED TIME-LIMIT Effective date: 20181003 Ref country code: SK Free format text: LAPSE BECAUSE OF FAILURE TO SUBMIT A TRANSLATION OF THE DESCRIPTION OR TO PAY THE FEE WITHIN THE PRESCRIBED TIME-LIMIT Effective date: 20181003 Ref country code: SM Free format text: LAPSE BECAUSE OF FAILURE TO SUBMIT A TRANSLATION OF THE DESCRIPTION OR TO PAY THE FEE WITHIN THE PRESCRIBED TIME-LIMIT Effective date: 20181003 Ref country code: BE Free format text: LAPSE BECAUSE OF NON-PAYMENT OF DUE FEES Effective date: 20181031 Ref country code: MC Free format text: LAPSE BECAUSE OF FAILURE TO SUBMIT A TRANSLATION OF THE DESCRIPTION OR TO PAY THE FEE WITHIN THE PRESCRIBED TIME-LIMIT Effective date: 20181003 Ref country code: LI Free format text: LAPSE BECAUSE OF NON-PAYMENT OF DUE FEES Effective date: 20181031 Ref country code: EE Free format text: LAPSE BECAUSE OF FAILURE TO SUBMIT A TRANSLATION OF THE DESCRIPTION OR TO PAY THE FEE WITHIN THE PRESCRIBED TIME-LIMIT Effective date: 20181003 Ref country code: CH Free format text: LAPSE BECAUSE OF NON-PAYMENT OF DUE FEES Effective date: 20181031 |
|
| 26N | No opposition filed |
Effective date: 20190704 |
|
| PG25 | Lapsed in a contracting state [announced via postgrant information from national office to epo] |
Ref country code: SI Free format text: LAPSE BECAUSE OF FAILURE TO SUBMIT A TRANSLATION OF THE DESCRIPTION OR TO PAY THE FEE WITHIN THE PRESCRIBED TIME-LIMIT Effective date: 20181003 Ref country code: IE Free format text: LAPSE BECAUSE OF NON-PAYMENT OF DUE FEES Effective date: 20181017 |
|
| PG25 | Lapsed in a contracting state [announced via postgrant information from national office to epo] |
Ref country code: MT Free format text: LAPSE BECAUSE OF NON-PAYMENT OF DUE FEES Effective date: 20181017 |
|
| PG25 | Lapsed in a contracting state [announced via postgrant information from national office to epo] |
Ref country code: TR Free format text: LAPSE BECAUSE OF FAILURE TO SUBMIT A TRANSLATION OF THE DESCRIPTION OR TO PAY THE FEE WITHIN THE PRESCRIBED TIME-LIMIT Effective date: 20181003 |
|
| PG25 | Lapsed in a contracting state [announced via postgrant information from national office to epo] |
Ref country code: MK Free format text: LAPSE BECAUSE OF NON-PAYMENT OF DUE FEES Effective date: 20181003 Ref country code: CY Free format text: LAPSE BECAUSE OF FAILURE TO SUBMIT A TRANSLATION OF THE DESCRIPTION OR TO PAY THE FEE WITHIN THE PRESCRIBED TIME-LIMIT Effective date: 20181003 Ref country code: HU Free format text: LAPSE BECAUSE OF FAILURE TO SUBMIT A TRANSLATION OF THE DESCRIPTION OR TO PAY THE FEE WITHIN THE PRESCRIBED TIME-LIMIT; INVALID AB INITIO Effective date: 20131017 |
|
| P01 | Opt-out of the competence of the unified patent court (upc) registered |
Effective date: 20230601 |
|
| PGFP | Annual fee paid to national office [announced via postgrant information from national office to epo] |
Ref country code: DE Payment date: 20251020 Year of fee payment: 13 |
|
| PGFP | Annual fee paid to national office [announced via postgrant information from national office to epo] |
Ref country code: GB Payment date: 20251022 Year of fee payment: 13 |
|
| PGFP | Annual fee paid to national office [announced via postgrant information from national office to epo] |
Ref country code: FR Payment date: 20251024 Year of fee payment: 13 |