EP2895827B1 - Vorrichtung zur maschinenzustandsüberwachung - Google Patents
Vorrichtung zur maschinenzustandsüberwachung Download PDFInfo
- Publication number
- EP2895827B1 EP2895827B1 EP13837138.0A EP13837138A EP2895827B1 EP 2895827 B1 EP2895827 B1 EP 2895827B1 EP 13837138 A EP13837138 A EP 13837138A EP 2895827 B1 EP2895827 B1 EP 2895827B1
- Authority
- EP
- European Patent Office
- Prior art keywords
- signal
- value
- digital
- amplitude
- frequency
- Prior art date
- Legal status (The legal status is an assumption and is not a legal conclusion. Google has not performed a legal analysis and makes no representation as to the accuracy of the status listed.)
- Active
Links
Images


Classifications
-
- G—PHYSICS
- G01—MEASURING; TESTING
- G01H—MEASUREMENT OF MECHANICAL VIBRATIONS OR ULTRASONIC, SONIC OR INFRASONIC WAVES
- G01H1/00—Measuring characteristics of vibrations in solids by using direct conduction to the detector
- G01H1/003—Measuring characteristics of vibrations in solids by using direct conduction to the detector of rotating machines
-
- G—PHYSICS
- G01—MEASURING; TESTING
- G01M—TESTING STATIC OR DYNAMIC BALANCE OF MACHINES OR STRUCTURES; TESTING OF STRUCTURES OR APPARATUS, NOT OTHERWISE PROVIDED FOR
- G01M13/00—Testing of machine parts
- G01M13/02—Gearings; Transmission mechanisms
- G01M13/028—Acoustic or vibration analysis
-
- G—PHYSICS
- G01—MEASURING; TESTING
- G01M—TESTING STATIC OR DYNAMIC BALANCE OF MACHINES OR STRUCTURES; TESTING OF STRUCTURES OR APPARATUS, NOT OTHERWISE PROVIDED FOR
- G01M13/00—Testing of machine parts
- G01M13/04—Bearings
- G01M13/045—Acoustic or vibration analysis
-
- G—PHYSICS
- G05—CONTROLLING; REGULATING
- G05B—CONTROL OR REGULATING SYSTEMS IN GENERAL; FUNCTIONAL ELEMENTS OF SUCH SYSTEMS; MONITORING OR TESTING ARRANGEMENTS FOR SUCH SYSTEMS OR ELEMENTS
- G05B19/00—Program-control systems
- G05B19/02—Program-control systems electric
- G05B19/18—Numerical control [NC], i.e. automatically operating machines, in particular machine tools, e.g. in a manufacturing environment, so as to execute positioning, movement or co-ordinated operations by means of program data in numerical form
- G05B19/406—Numerical control [NC], i.e. automatically operating machines, in particular machine tools, e.g. in a manufacturing environment, so as to execute positioning, movement or co-ordinated operations by means of program data in numerical form characterised by monitoring or safety
- G05B19/4069—Simulating machining process on screen
-
- G—PHYSICS
- G05—CONTROLLING; REGULATING
- G05B—CONTROL OR REGULATING SYSTEMS IN GENERAL; FUNCTIONAL ELEMENTS OF SUCH SYSTEMS; MONITORING OR TESTING ARRANGEMENTS FOR SUCH SYSTEMS OR ELEMENTS
- G05B19/00—Program-control systems
- G05B19/02—Program-control systems electric
- G05B19/18—Numerical control [NC], i.e. automatically operating machines, in particular machine tools, e.g. in a manufacturing environment, so as to execute positioning, movement or co-ordinated operations by means of program data in numerical form
- G05B19/416—Numerical control [NC], i.e. automatically operating machines, in particular machine tools, e.g. in a manufacturing environment, so as to execute positioning, movement or co-ordinated operations by means of program data in numerical form characterised by control of velocity, acceleration or deceleration
Definitions
- the present invention relates to a method for analysing the condition of a machine, and to an apparatus for analysing the condition of a machine.
- the invention also relates to a system including such an apparatus and to a method of operating such an apparatus.
- the invention also relates to a computer program for causing a computer to perform an analysis function.
- Machines with moving parts are subject to wear with the passage of time, which often causes the condition of the machine to deteriorate.
- Examples of such machines with movable parts are motors, pumps, generators, compressors, lathes and CNC-machines.
- the movable parts may comprise a shaft and bearings.
- the operating condition of such a machine is preferably evaluated from time to time.
- the operating condition can be determined by measuring vibrations emanating from a bearing or by measuring temperature on the casing of the machine, which temperatures are dependent on the operating condition of the bearing.
- Such condition checks of machines with rotating or other moving parts are of great significance for safety and also for the length of the life of such machines. It is known to manually perform such measurements on machines. This ordinarily is done by an operator with the help of a measuring instrument performing measurements at measuring points on one or several machines.
- shock pulse measuring apparatus may generate information indicative of the condition of a bearing or a machine.
- WO 03062766 discloses a machine having a measuring point and a shaft with a certain shaft diameter, wherein the shaft can rotate when the machine is in use.
- WO 03062766 also discloses an apparatus for analysing the condition of a machine having a rotating shaft.
- the disclosed apparatus has a sensor for producing a measured value indicating vibration at a measuring point.
- the apparatus disclosed in WO 03062766 has a data processor and a memory.
- the memory may store program code which, when run on the data processor, will cause the analysis apparatus to perform a Machine Condition Monitoring function.
- Such a Machine Condition Monitoring function may include shock pulse measuring.
- WO 2011/087440 A1 discloses an apparatus for analysis of the condition of a machine having a rotating part.
- An aspect of the invention relates to the problem of providing an improved apparatus for analysis of the condition of a machine having a rotating part.
- an apparatus for analysing the condition of a machine having a part rotatable with a speed of rotation comprising:
- the apparatus further comprises:
- the first condition value and the transformed signal are based on concurrent measurement data, or substantially the same measurement data, and as such the first condition value and the transformed signal may complement each other by providing mutually different perspectives on the same event, i.e. the condition of the monitored rotatable machine part during the measuring session, based on data collected during the measuring session.
- condition value generator is adapted to generate a second condition value in response to said sorted output peak values and said duration so that said second condition value is indicative of an second amplitude value having a second predetermined occurrence rate, and so that said second condition value is based on said selected first temporal portion of the digital measurement signal.
- Measurement experience indicates that, during operation of a specific undamaged rotational part, such as a roller bearing, the amplitude levels of the first condition value and the second condition value vary with the amount of lubrication in between the rolling elements and the raceway, whereas a relation between first condition value and the second condition value remains substantially constant.
- measurement experience indicate that the amplitude values of the first condition value as well the second condition value increase significantly, and there is also a distinguishable change in the relation between first condition value and the second condition value. More particularly, although both of the first and second condition values increase in response to a surface damage, the amplitude of first condition value increases distinctly more than the amplitude of the second condition value. Accordingly, the combination of the values of the first condition value and the second condition value may be interpreted to indicate not only a lubrication condition of the rotational part, but it is also indicative of the mechanical condition of the surfaces of the rotational part.
- this solution enables the delivery of a transformed signal which is indicative of said vibration signal repetition frequency while ensuring that the first condition value, the second condition value and the transformed signal are consistent with each other, since all these data are based on the same or substantially the same temporal portion of the digital measurement signal.
- the first and the second condition values are consistent with the transformed signal in that they provide mutually different aspects of the condition of the monitored rotational part. So, for example, when damage occurs in the raceway of a monitored bearing, the first and the second condition values will increase, as described above, thus indicating the presence of a surface damage. When the first and the second condition values increase to such an extent as to indicate the presence of an incipient damage to the monitored rotational part, experience has shown that the transformed signal will provide information about what type of damage there is.
- the first and the second condition values as well as the transformed signal are based on concurrent measurement data, or substantially the same measurement data, and as such the first and the second condition values and the transformed signal complement each other by providing mutually different perspectives on the same event, i.e. the condition of the monitored rotatable machine part during the measuring session, based on data collected during the whole duration of the measuring session.
- the transformed signal is indicative of the vibration signal repetition frequency, it may be possible to establish e.g. whether the incipient damage is located on the inner ring of the monitored bearing or on the outer ring of the monitored bearing.
- the apparatus may generate the first condition value and the second condition value on the basis of measurement data collected during the uninterrupted time period of the variably settable duration of said measuring session advantageously increases the reliability of the first condition value and the second condition value in the sense of truly reflecting the condition of the monitored part.
- the monitored rotatable part is a bearing in a crane which sometimes carries a heavy load, and which sometimes runs substantially unloaded
- the bearing will sometimes be subjected to a large force due to the carrying of the heavy load.
- the measurement data collected, i.e. the selected first temporal portion of the digital measurement signal includes the time period when the bearing is subjected to a large force.
- the variably settable duration of the measurement session advantageously enables an operator of the apparatus to set the duration so as to include the loaded time period in the measurement session.
- This solution may advantageously provide an explicit indication to the effect that a detected damage is located e.g. on the outer ring of a monitored bearing assembly, when the generated frequency factor estimate has a value that substantially corresponds to a stored value of an Outer Ring frequency factor value.
- the apparatus further comprises: an associator adapted to associate
- the digital rectifier is adapted to perform a full-wave rectification so as to generate a rectified digital signal dependent on said digital measurement signal including absolute values of said sequence of sample values.
- the smoothing stage may eliminate "dents" in the rectified signal, and it will do so by always adjusting the amplitude upwards.
- the rectified signal may include a sampled value having significantly lower amplitude that its neighbour samples
- the signal from the smoothing stage will always be smooth.
- the median-filter would also reduce the top amplitude value of the output signal in relation to the top value of the rectified input signal.
- a median-filter would make the signal more smooth
- the smoothing stage as defined above will not only make the signal more smooth, but it will also maintain the amplitude values of the highest detected amplitudes in the rectified signal.
- the smoothing stage includes a first peak sample selector which is adapted to receive a plurality of temporally consecutive sample values
- Fig. 1 shows a schematic block diagram of an embodiment of a condition analyzing system 2 according to an embodiment of the invention.
- Reference numeral 4 relates to a client location with a machine 6 having a movable part 8.
- the movable part may comprise bearings 7 and a shaft 8 which, when the machine is in operation, rotates.
- the operating condition of the shaft 8 or of a bearing 7 can be determined in response to vibrations emanating from the shaft and/or bearing when the shaft rotates.
- the client location 4, which may also be referred to as client part or user part may for example be the premises of a wind farm, i.e. a group of wind turbines at a location, or the premises of a paper mill plant, or some other manufacturing plant having machines with movable parts.
- condition analyzing system 2 is operative when a sensor 10 is attached on or at a measuring point 12 on the body of the machine 6.
- Figure 1 only illustrates two measuring points 12, it to be understood that a location 4 may comprise any number of measuring points 12.
- the condition analysis system 2 shown in Figure 1 comprises an analysis apparatus 14 for analysing the condition of a machine on the basis of measurement values delivered by the sensor 10.
- the analysis apparatus 14 has a communication port 16 for bi-directional data exchange.
- the communication port 16 is connectable to a communications network 18, e.g. via a data interface 19.
- the communications network 18 may be the world wide internet, also known as the Internet.
- the communications network 18 may also comprise a public switched telephone network.
- a server computer 20 is connected to the communications network 18.
- the server 20 may comprise a database 22, user input/output interfaces 24 and data processing hardware 26, and a communications port 29.
- the server computer 20 is located on a location 28, which is geographically separate from the client location 4.
- the server location 28 may be in a first city, such as the Swedish capital Swiss, and the client location may be in another city, such as Stuttgart, Germany or Detroit in Michigan, USA.
- the server location 28 may be in a first part of a town and the client location may be in another part of the same town.
- the server location 28 may also be referred to as supplier part 28, or supplier part location 28.
- a central control location 31 comprises a control computer 33 having data processing hardware and software for surveying a plurality of machines at the client location 4.
- the machines 6 may be wind turbines or gear boxes used in wind turbines. Alternatively the machines may include machinery in e.g. a paper mill.
- the control computer 33 may comprise a database 22B, user input/output interfaces 24B and data processing hardware 26B, and a communications port 29B.
- the central control location 31 may be separated from the client location 4 by a geographic distance.
- communications port 29B the control computer 33 can be coupled to communicate with analysis apparatus 14 via port 16.
- the analysis apparatus 14 may deliver measurement data being partly processed so as to allow further signal processing and/or analysis to be performed at the central location 31 by control computer 33.
- a supplier company occupies the supplier part location 28.
- the supplier company may sell and deliver analysis apparatuses 14 and/or software for use in an analysis apparatus 14.
- the supplier company may also sell and deliver analysis software for use in the control computer at the central control location 31.
- Such analysis software 94,105 is discussed in connection with Figure 4 below.
- Such analysis software 94,105 may be delivered by transmission over said communications network 18.
- the apparatus 14 is a portable apparatus which may be connected to the communications network 18 from time to time.
- the apparatus 14 is connected to the communications network 18 substantially continuously.
- the apparatus 14 according to this embodiment may substantially always be "on line" available for communication with the supplier computer 20 and/or with the control computer 33 at control location 31.
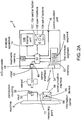
- Fig. 2A is a schematic block diagram of an embodiment of a part of the condition analyzing system 2 shown in Fig 1 .
- the condition analyzing system as illustrated in Fig. 2A , comprises a sensor unit 10 for producing a measured value.
- the measured value may be dependent on movement or, more precisely, dependent on vibrations or shock pulses caused by bearings when the shaft rotates.
- An embodiment of the condition analyzing system 2 is operative when a device 30 is firmly mounted on or at a measuring point on a machine 6.
- the device 30 mounted at the measuring point may be referred to as a stud 30.
- a stud 30 can comprise a connection coupling 32 to which the sensor unit 10 is removably attachable.
- the connection coupling 32 can, for example comprise double start threads for enabling the sensor unit to be mechanically engaged with the stud by means of a 1 ⁇ 4 turn rotation.
- a measuring point 12 can comprise a threaded recess in the casing of the machine.
- a stud 30 may have a protruding part with threads corresponding to those of the recess for enabling the stud to be firmly attached to the measuring point by introduction into the recess like a bolt.
- a measuring point can comprise a threaded recess in the casing of the machine, and the sensor unit 10 may comprise corresponding threads so that it can be directly introduced into the recess.
- the measuring point is marked on the casing of the machine only with a painted mark.
- the machine 6 exemplified in Fig. 2A may have a rotating shaft with a certain shaft diameter d1.
- the shaft in the machine 24 may rotate with a speed of rotation VI when the machine 6 is in use.
- the sensor unit 10 may be coupled to the apparatus 14 for analysing the condition of a machine.
- the analysis apparatus 14 comprises a sensor interface 40 for receiving a measured signal or measurement data, produced by the sensor 10.
- the sensor interface 40 is coupled to a data processing means 50 capable of controlling the operation of the analysis apparatus 14 in accordance with program code.
- the data processing means 50 is also coupled to a memory 60 for storing said program code.
- the sensor interface 40 comprises an input 42 for receiving an analogue signal, the input 42 being connected to an analogue-to-digital (A/D) converter 44, the digital output 48 of which is coupled to the data processing means 50.
- A/D analogue-to-digital
- the A/D converter 44 samples the received analogue signal with a certain sampling frequency f S so as to deliver a digital measurement data signal S MD having said certain sampling frequency fs and wherein the amplitude of each sample depends on the amplitude of the received analogue signal at the moment of sampling.
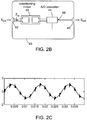
- the sensor interface 40 comprises an input 42 for receiving an analogue signal S EA from a Shock Pulse Measurement Sensor, a conditioning circuit 43 coupled to receive the analogue signal, and an A/D converter 44 coupled to receive the conditioned analogue signal from the conditioning circuit 43.
- the A/D converter 44 samples the received conditioned analogue signal with a certain sampling frequency fs so as to deliver a digital measurement data signal S MD having said certain sampling frequency f S and wherein the amplitude of each sample depends on the amplitude of the received analogue signal at the moment of sampling.
- the sampling theorem guarantees that bandlimited signals (i.e., signals which have a maximum frequency) can be reconstructed perfectly from their sampled version, if the sampling rate fs is more than twice the maximum frequency f SEAmax of the analogue signal S EA to be monitored.
- the frequency equal to one-half of the sampling rate is therefore a theoretical limit on the highest frequency that can be unambiguously represented by the sampled signal S MD .
- This frequency (half the sampling rate) is called the Nyquist frequency of the sampling system. Frequencies above the Nyquist frequency f N can be observed in the sampled signal, but their frequency is ambiguous.
- a frequency component with frequency f cannot be distinguished from other components with frequencies B ⁇ f N + f, and B ⁇ f N - f for nonzero integers B.
- This ambiguity known as aliasing may be handled by filtering the signal with an anti-aliasing filter (usually a low-pass filter with cutoff near the Nyquist frequency) before conversion to the sampled discrete representation.
- an anti-aliasing filter usually a low-pass filter with cutoff near the Nyquist frequency
- the sampling frequency may be selected to a higher value than 2.
- the factor k may be selected to a value higher than 2,0.
- factor k may be selected to a value between 2,0 and 2,9 in order to provide a good safety margin while avoiding to generate unnecessarily many sample values.
- the factor k is advantageously selected such that 100 ⁇ k/ 2 renders an integer.
- f SEAmax f S / k wherein f SEAmax is the highest frequency to be analyzed in the sampled signal
- a digital measurement data signal S MD having a certain sampling frequency f S , is generated in response to said received analogue measurement signal S EA .
- the digital output 48 of the A/D converter 44 is coupled to the data processing means 50 via an output 49 of the sensor interface 40 so as to deliver the digital measurement data signal S MD to the data processing means 50.
- the sensor unit 10 may comprise a vibration transducer, the sensor unit being structured to physically engage the connection coupling of the measuring point so that vibrations of the machine at the measuring point are transferred to the vibration transducer.
- the sensor unit comprises a transducer having a piezo-electric element. When the measuring point 12 vibrates, the sensor unit 10, or at least a part of it, also vibrates and the transducer then produces an electrical signal of which the frequency and amplitude depend on the mechanical vibration frequency and the vibration amplitude of the measuring point 12, respectively.
- the sensor unit 10 is a vibration sensor, providing an analogue amplitude signal of e.g. 10 mV/g in the Frequency Range 1.00 to 10000 Hz.
- Such a vibration sensor is designed to deliver substantially the same amplitude of 10 mV irrespective of whether it is exerted to the acceleration of 1 g (9,82 m/s 2 ) at 1 Hz, 3 Hz or 10 Hz.
- a typical vibration sensor has a linear response in a specified frequency range up to around 10 kHz.
- Mechanical vibrations in that frequency range emanating from rotating machine parts are usually caused by imbalance or misalignment.
- the linear response vibration sensor typically also has several different mechanical resonance frequencies dependent on the physical path between sensor and vibration source.
- a damage in a roller bearing may cause relatively sharp elastic waves, known as shock pulses, travelling along a physical path in the housing of a machine before reaching the sensor.
- shock pulses often have a broad frequency spectrum.
- the amplitude of a roller bearing shock pulse is typically lower than the amplitude of a vibration caused by imbalance or misalignment.
- the broad frequency spectrum of shock pulse signatures enables them to activate a "ringing response" or a resonance at a resonance frequency associated with the sensor.
- a typical measuring signal from a vibration sensor may have a wave form as shown in Figure 2C , i.e. a dominant low frequency signal with a superimposed higher frequency lower amplitude resonant "ringing response".
- the low frequency component In order to enable analysis of the shock pulse signature, often emanating from a bearing damage, the low frequency component must be filtered out. This can be achieved by means of a high pass filter or by means of a band pass filter. However, these filters must be adjusted such that the low frequency signal portion is blocked while the high frequency signal portion is passed on.
- An individual vibration sensor will typically have one resonance frequency associated with the physical path from one shock pulse signal source, and a different resonance frequency associated with the physical path from another shock pulse signal source, as mentioned in US 6,053,047 . Hence, filter adjustment aiming to pass the high frequency signal portion requires individual adaptation when a vibration sensor is used.
- the resulting signal will consist of the shock pulse signature(s).
- the analysis of the shock pulse signature(s) emanating from a vibration sensor is somewhat impaired by the fact that the amplitude response as well as resonance frequency inherently varies dependent on the individual physical path from the shock pulse signal sources.
- Shock Pulse Measurement sensor is designed and adapted to provide a pre-determined mechanical resonance frequency, as described in further detail below.
- This feature of the Shock Pulse Measurement sensor advantageously renders repeatable measurement results in that the output signal from a Shock Pulse Measurement sensor has a stable resonance frequency substantially independent of the physical path between the shock pulse signal source and the shock pulse sensor. Moreover, mutually different individual shock pulse sensors provide a very small, if any, deviation in resonance frequency. An advantageous effect of this is that signal processing is simplified, in that filters need not be individually adjusted, in contrast to the case described above when vibration sensors are used. Moreover, the amplitude response from shock pulse sensors is well defined such that an individual measurement provides reliable information when measurement is performed in accordance with appropriate measurement methods defined by S.P.M. Instrument AB.
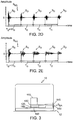
- Figure 2D illustrates a measuring signal amplitude generated by a shock pulse sensor 10
- Figure 2E illustrates a measuring signal amplitude generated by a vibration sensor 10. Both sensors have been exerted to the same series of mechanical shocks without the typical low frequency signal content.
- the vertical axes represent amplitude of an analogue electrical signal generated by the respective sensor
- the horizontal axes represent time.
- the respective analogue measurement signals S EA include a vibration signal signature S D having
- the sensor is a Shock Pulse Measurement sensor.
- Figure 3 is a simplified illustration of a Shock Pulse Measurement sensor 10 according to an embodiment of the invention.
- the sensor comprises a part 110 having a certain mass or weight and a piezo-electrical element 120.
- the piezo-electrical element 120 is somewhat flexible so that it can contract and expand when exerted to external force.
- the piezo-electrical element 120 is provided with electrically conducting layers 130 and 140, respectively, on opposing surfaces. As the piezo-electrical element 120 contracts and expands it generates an electric signal which is picked up by the conducting layers 130 and 140.
- a mechanical vibration is transformed into an analogue electrical measurement signal S EA , which is delivered on output terminals 145, 150.
- the piezo-electrical element 120 may be positioned between the weight 110 and a surface 160 which, during operation, is physically attached to the measuring point 12, as illustrated in Figure 3 .
- the Shock Pulse Measurement sensor 10 has a resonance frequency that depends on the mechanical characteristics for the sensor, such as the mass m of weight part 110 and the resilience of piezo-electrical element 120. Hence, the piezo-electrical element has an elasticity and a spring constant k. The mechanical resonance frequency f RM for the sensor is therefore also dependent on the mass m and the spring constant k.
- the actual mechanical resonance frequency for a Shock Pulse Measurement sensor 10 may also depend on other factors, such as the nature of the attachment of the sensor 10 to the body of the machine 6.
- the resonant Shock Pulse Measurement sensor 10 is thereby particularly sensitive to vibrations having a frequency on or near the mechanical resonance frequency f RM .
- the Shock Pulse Measurement sensor 10 may be designed so that the mechanical resonance frequency f RM is somewhere in the range from 28 kHz to 37 kHz. According to another embodiment the mechanical resonance frequency f RM is somewhere in the range from 30 kHz to 35 kHz.
- the analogue electrical measurement signal has an electrical amplitude which may vary over the frequency spectrum.
- the Shock Pulse Measurement sensor 10 were exerted to mechanical vibrations with identical amplitude in all frequencies from e.g. 1 Hz to e.g. 200 000 kHz, then the amplitude of the analogue signal S EA from the Shock Pulse Measurement Sensor will have a maximum at the mechanical resonance frequency f RM , since the sensor will resonate when being "pushed" with that frequency.
- the conditioning circuit 43 receives the analogue signal S EA .
- the conditioning circuit 43 may be designed to be an impedance adaption circuit designed to adapt the input impedance of the A/D-converter as seen from the sensor terminals 145,150 so that an optimum signal transfer will occur.
- the conditioning circuit 43 may operate to adapt the input impedance Z in as seen from the sensor terminals 145,150 so that a maximum electric power is delivered to the A/D-converter 44.
- the analogue signal S EA is fed to the primary winding of a transformer, and a conditioned analogue signal is delivered by a secondary winding of the transformer.
- the A/D converter 44 is coupled to receive the conditioned analogue signal from the conditioning circuit 43.
- the A/D converter 44 has an input impedance Z 44 , and the input impedance of the A/D-converter as seen from the sensor terminals 145,150 will be (n1/n2) 2 ⁇ Z 44 , when the conditioning circuit 43 is coupled in between the sensor terminals 145,150 and the input terminals of the A/D converter 44.
- the A/D converter 44 samples the received conditioned analogue signal with a certain sampling frequency f S so as to deliver a digital measurement data signal S MD having said certain sampling frequency f S and wherein the amplitude of each sample depends on the amplitude of the received analogue signal at the moment of sampling.
- the digital measurement data signal S MD is delivered to a means 180 for digital signal processing (See Fig 5 ).
- the means 180 for digital signal processing comprises the data processor 50 and program code for causing the data processor 50 to perform digital signal processing.
- the processor 50 is embodied by a Digital Signal Processor.
- the Digital Signal Processor may also be referred to as a DSP.
- the data processing means 50 is coupled to a memory 60 for storing said program code.
- the program memory 60 is preferably a non-volatile memory.
- the memory 60 may be a read/write memory, i.e. enabling both reading data from the memory and writing new data onto the memory 60.
- the program memory 60 is embodied by a FLASH memory.
- the program memory 60 may comprise a first memory segment 70 for storing a first set of program code 80 which is executable so as to control the analysis apparatus 14 to perform basic operations ( Figure 2A and Figure 4 ).
- the program memory may also comprise a second memory segment 90 for storing a second set of program code 94.
- the second set of program code 94 in the second memory segment 90 may include program code for causing the analysis apparatus to process the detected signal, or signals, so as to generate a pre-processed signal or a set of pre-processed signals.
- the memory 60 may also include a third memory segment 100 for storing a third set of program code 104.
- the set of program code 104 in the third memory segment 100 may include program code for causing the analysis apparatus to perform a selected analysis function 105. When an analysis function is executed it may cause the analysis apparatus to present a corresponding analysis result on user interface 106 or to deliver the analysis result on port 16 (See Fig 1 and Fig 2A and Fig. 7 ).
- the data processing means 50 is also coupled to a read/write memory 52 for data storage. Moreover, the data processing means 50 may be coupled to an analysis apparatus communications interface 54.
- the analysis apparatus communications interface 54 provides for bi-directional communication with a measuring point communication interface 56 which is attachable on, at or in the vicinity of the measuring point on the machine.
- the measuring point 12 may comprise a connection coupling 32, a readable and writeable information carrier 58, and a measuring point communication interface 56.
- the writeable information carrier 58, and the measuring point communication interface 56 may be provided in a separate device 59 placed in the vicinity of the stud 30, as illustrated in Figure 2 .
- the writeable information carrier 58, and the measuring point communication interface 56 may be provided within the stud 30. This is described in more detail in WO 98/01831 .
- the system 2 is arranged to allow bidirectional communication between the measuring point communication interface 56 and the analysis apparatus communication interface 54.
- the measuring point communication interface 56 and the analysis apparatus communication interface 54 are preferably constructed to allow wireless communication.
- the measuring point communication interface and the analysis apparatus communication interface are constructed to communicate with one another by radio frequency (RF) signals.
- RF radio frequency
- This embodiment includes an antenna in the measuring point communication interface 56 and another antenna the analysis apparatus communication interface 54.
- Figure 4 is a simplified illustration of an embodiment of the memory 60 and its contents.
- the simplified illustration is intended to convey understanding of the general idea of storing different program functions in memory 60, and it is not necessarily a correct technical teaching of the way in which a program would be stored in a real memory circuit.
- the first memory segment 70 stores program code for controlling the analysis apparatus 14 to perform basic operations.
- the simplified illustration of Figure 4 shows pseudo code, it is to be understood that the program code 80 may be constituted by machine code, or any level program code that can be executed or interpreted by the data processing means 50 ( Fig.2A ).
- the second memory segment 90 stores a second set of program code 94.
- the program code 94 in segment 90 when run on the data processing means 50, will cause the analysis apparatus 14 to perform a function, such as a digital signal processing function.
- the function may comprise an advanced mathematical processing of the digital measurement data signal S MD .
- the program code 94 is adapted to cause the processor means 50 to perform signal processing functions described in connection with Figures 5 , 6 , 9, 10, 11A, 11B , 12A, 12B , 13A-C, 14A, 14B, 15A and/or Fig. 16 in this document.
- a computer program for controlling the function of the analysis apparatus may be downloaded from the server computer 20.
- This means that the program-to-be-downloaded is transmitted to over the communications network 18.
- the downloaded program may be loaded into a digital memory, such as memory 60 (See figure 2A and 4 ).
- a signal processing program 94 and or an analysis function program 104, 105 may be received via a communications port, such as port 16 ( Fig 1 & 2A ), so as to load it into memory 60.
- a signal processing program 94 and or an analysis function program 104, 105 may be received via communications port 29B ( Fig 1 ), so as to load it into a program memory location in computer 26B or in database 22B.
- An aspect of the invention relates to a computer program product, such as a program code means 94 and/or program code means 104, 105 loadable into a digital memory of an apparatus.
- the computer program product comprising software code portions for performing signal processing methods and/or analysis functions when said product is run on a data processing unit 50 of an apparatus for analysing the condition of a machine.
- run on a data processing unit means that the computer program plus the data processing unit carries out a method of the kind described in this document.
- a computer program product, loadable into a digital memory of a condition analysing apparatus means that a computer program can be introduced into a digital memory of a condition analysing apparatus so as achieve a condition analysing apparatus programmed to be capable of, or adapted to, carrying out a method of the kind described above.
- loaded into a digital memory of a condition analysing apparatus means that the condition analysing apparatus programmed in this way is capable of, or adapted to, carrying out a method of the kind described above.
- the above mentioned computer program product may also be loadable onto a computer readable medium, such as a compact disc or DVD.
- a computer readable medium may be used for delivery of the program to a client.
- the analysis apparatus 14 comprises a user input interface 102, whereby an operator may interact with the analysis apparatus 14.
- the user input interface 102 comprises a set of buttons 104.
- An embodiment of the analysis apparatus 14 comprises a user output interface 106.
- the user output interface may comprise a display unit 106.
- the data processing means 50 when it runs a basic program function provided in the basic program code 80, provides for user interaction by means of the user input interface 102 and the display unit 106.
- the set of buttons 104 may be limited to a few buttons, such as for example five buttons, as illustrated in Figure 2A .
- a central button 107 may be used for an ENTER or SELECT function, whereas other, more peripheral buttons may be used for moving a cursor on the display 106.
- symbols and text may be entered into the apparatus 14 via the user interface.
- the display unit 106 may, for example, display a number of symbols, such as the letters of alphabet, while the cursor is movable on the display in response to user input so as to allow the user to input information.
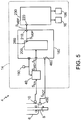
- FIG. 5 is a schematic block diagram of an embodiment of the analysis apparatus 14 at a client location 4 with a machine 6 having a movable shaft 8.
- the sensor 10 which may be a Shock Pulse Measurement Sensor, is shown attached to the body of the machine 6 so as to pick up mechanical vibrations and so as to deliver an analogue measurement signal S EA indicative of the detected mechanical vibrations to the sensor interface 40.
- the sensor interface 40 may be designed as described in connection with Fig. 2A or 2B .
- the sensor interface 40 delivers a digital measurement data signal S MD to a means 180 for digital signal processing.
- the digital measurement data signal S MD has a sampling frequency fs, and the amplitude value of each sample depends on the amplitude of the received analogue measurement signal S EA at the moment of sampling.
- the sampling frequency f S may be controlled by a clock signal delivered by a clock 190, as illustrated in Figure 5 .
- the clock signal may also be delivered to the means 180 for digital signal processing.
- the means 180 for digital signal processing includes a pre-processor 200 for performing a pre-processing of the digital measurement data signal S MD so as to deliver a pre-processed digital signal S MDP on an output 210.
- the output 210 is coupled to an input 220 of an evaluator 230.
- the evaluator 230 is adapted to evaluate the pre-processed digital signal S MDP so as to deliver a result of the evaluation to a user interface 106.
- the result of the evaluation may be delivered to a communication port 16 so as to enable the transmission of the result e.g. to a control computer 33 at a control site 31 (See Figure 1 ).
- the functions described in connection with the functional blocks in means 180 for digital signal processing, pre-processor 200 and evaluator 230 may be embodied by computer program code 94 and/or 104 as described in connection with memory blocks 90 and 100 in connection with Figure 4 above.
- a user may require only a few basic monitoring functions for detection of whether the condition of a machine is normal or abnormal.
- On detecting an abnormal condition the user may call for specialized professional maintenance personnel to establish the exact nature of the problem, and for performing the necessary maintenance work.
- the professional maintenance personnel frequently needs and uses a broad range of evaluation functions making it possible to establish the nature of, and/or cause for, an abnormal machine condition.
- different users of an analysis apparatus 14 may pose very different demands on the function of the apparatus.
- the term Condition Monitoring function is used in this document for a function for detection of whether the condition of a machine is normal or somewhat deteriorated or abnormal.
- the term Condition Monitoring function also comprises an evaluation function making it possible to establish the nature of, and/or cause for, an abnormal machine condition.
- the condition monitoring functions F1, F2...Fn includes functions such as: vibration analysis, shock pulse measuring, Peak level analysis, spectrum analysis of shock pulse measurement data, Fast Fourier Transformation of vibration measurement data, graphical presentation of condition data on a user interface, storage of condition data in a writeable information carrier on said machine, storage of condition data in a writeable information carrier in said apparatus, tachometering, imbalance detection, and misalignment detection.
- the apparatus 14 includes the following functions:
- Embodiments of the function F7 "storage of condition data in a writeable information carrier on said machine", and F13 vibration analysis and retrieval of condition data is described in more detail in WO 98/01831 .
- the peak level analysis F3 may be performed on the basis of the enveloped time domain signal S ENV delivered by an enveloper 250.
- the signal S ENV is also referred to as S MDP .
- the peak level analysis F3 is adapted to monitor the signal for the duration of a peak monitoring period T PM for the purpose of establishing the maximum amplitude level.
- the peak amplitude may be indicative of Oil film thickness in a monitored bearing.
- the detected peak amplitude may be indicative of separation between the metal surfaces in the rolling interface.
- the oil film thickness may depend on lubricant supply and/or on alignment of the shaft.
- the oil film thickness may depend on the load on the shaft, i.e. on the force with which metal surfaces are pressed together, the metal surfaces being e.g. that of a bearing and that of a shaft.
- the actual detected value of the maximum amplitude level may also depend on the mechanical state of the bearing surfaces, .i.e the condition of the bearing assembly. Accordingly, the detected value of the maximum amplitude level may depend on roughness of the metal surfaces in the rolling interface, and/or damage to a metal surface in the rolling interface. The detected value of the maximum amplitude level may also depend on the occurrence of a loose particle in the bearing assembly.
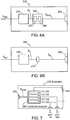
- Figure 6A illustrates a schematic block diagram of an embodiment of the pre-processor 200 according to an embodiment of the present invention.
- the digital measurement data signal S MD is coupled to a digital band pass filter 240 having a lower cutoff frequency f LC , an upper cutoff frequency f UC and passband bandwidth between the upper and lower cutoff frequencies.
- the output from the digital band pass filter 240 is connected to a digital enveloper 250. According to an embodiment of the invention the signal output from the enveloper 250 is delivered to an output 260.
- the output 260 of the pre-processor 200 is coupled to output 210 of digital signal processing means 180 for delivery to the input 220 of evaluator 230.
- the upper and lower cutoff frequencies of the digital band pass filter 240 may selected so that the frequency components of the signal S MD at the resonance frequency f RM for the sensor are in the passband bandwidth.
- an amplification of the mechanical vibration is achieved by the sensor being mechanically resonant at the resonance frequency f RM .
- the analogue measurement signal S EA reflects an amplified value of the vibrations at and around the resonance frequency f RM .
- the band pass filter according to the Figure 6 embodiment advantageously suppresses the signal at frequencies below and above resonance frequency f RM , so as to further enhance the components of the measurement signal at the resonance frequency f RM .
- the digital band pass filter 240 advantageously further reduces noise inherently included in the measurement signal, since any noise components below the lower cutoff frequency f LC , and above upper cutoff frequency f UC are also eliminated or reduced.
- the digital band pass filter 240 may be designed to have a lower cutoff frequency f LC being lower than the lowest resonance frequency value f RM , and an upper cutoff frequency f UC being higher than the highest resonance frequency value f RMU .
- the digital band pass filter 240 may deliver a passband digital measurement data signal S F having an advantageously low out-of-band noise content and reflecting mechanical vibrations in the passband.
- the passband digital measurement data signal S F may be delivered to an enveloper 250.
- the digital enveloper 250 accordingly receives the passband digital measurement data signal S F which may reflect a signal having positive as well as negative amplitudes.
- the received signal is rectified by a digital rectifier 270, and the rectified signal may be filtered by an optional low pass filter 280 so as to produce a digital envelop signal S ENV .
- the signal S ENV is a digital representation of an envelope signal being produced in response to the filtered measurement data signal S F .
- the optional low pass filter 280 may be eliminated.
- the signal S ENV is delivered to the output 260 of pre-processor 200.
- the pre-processed digital signal S MDP delivered on the output 210 is the digital envelop signal S ENV .
- the digital enveloper 250 will advantageously produce a true rectification without any biasing errors. Accordingly, the digital envelop signal S ENV will have a good Signal-to-Noise Ratio, since the sensor being mechanically resonant at the resonance frequency in the passband of the digital band pass filter 240 leads to a high signal amplitude and the signal processing being performed in the digital domain eliminates addition of noise and eliminates addition of biasing errors.
- the pre-processed digital signal S MDP is delivered to input 220 of the evaluator 230.
- the filter 240 is a high pass filter having a cut-off frequency f LC .
- This embodiment simplifies the design by replacing the band-pass filter with a high-pass filter 240, thereby leaving the low pass filtering to another low pass filter downstream, such as the low pass filter 280.
- the cut-off frequency fLc of the high pass filter 240 is selected to approximately the value of the lowest expected mechanical resonance frequency value f RMU of the resonant Shock Pulse Measurement sensor 10.
- the high-pass filtered signal is then passed to the rectifier 270 and on to the low pass filter 280.
- Figure 6B illustrates an embodiment according to which the digital band pass filter 240 delivers the filtered signal S F to the digital rectifier 270, and the rectifier 270 delivers the rectified signal S R directly to a condition analyzer 290 (See Fig 7 in conjunction with Fig 6B ).
- Figure 7 illustrates an embodiment of the evaluator 230 (See also Fig 5 ).
- the Figure 7 embodiment of the evaluator 230 includes the condition analyser 290 adapted to receive a pre-processed digital signal S MDP indicative of the condition of the machine 6.
- the condition analyser 290 can be controlled to perform a selected condition analysis function 105 by means of a selection signal delivered on a control input 300. Examples of condition analysis functions 105 are schematically illustrated as boxes in Fig 7 .
- the selection signal delivered on control input 300 may be generated by means of user interaction with the user interface102 (See Figure 2A ).
- the analysis apparatus 14 may include a Peak level analysis function F3, 105 (See Fig 4 & Fig. 7 ).
- the Peak level analysis function may be performed by the condition analyser 290 in response to activation via control input 300.
- the analyzer 290 will activate a peak level analyzer F3, 105 (See Fig 7 ), and the digital measurement signal SMDP will be passed to an input of the peak level analyzer F3, 105.
- the peak level analyzer F3, 105 is adapted to monitor the signal for a variably settable duration (TMeas) of a measuring session for the purpose of collecting a number of peak amplitude values.
- TMeas variably settable duration
- the peak amplitude detected in the measurement signal may, when the peak amplitude value originates from a mechanical vibration in the monitored machine, be indicative of the condition of the machine.
- the peak amplitude value may be indicative of the condition of the bearing assembly.
- the peak amplitude value may be indicative of Oil film thickness in a monitored bearing.
- the detected peak amplitude may be indicative of separation between the metal surfaces in the rolling interface.
- the oil film thickness may depend on lubricant supply and/or on alignment of the shaft.
- the oil film thickness may depend on the load on the shaft, i.e. on the force with which metal surfaces are pressed together, the metal surfaces being e.g. that of a bearing and that of a shaft.
- the actual detected value of the peak amplitude levels may also depend on the mechanical state of the bearing surfaces.
- the rotation of the rotatable machine part may cause a mechanical vibration V MD indicative of a deteriorated condition in that rotatable machine part.
- the normal distribution is a probability distribution that describes data that cluster around the mean.
- the graph of the associated probability density function is bell-shaped, with a peak at the mean, and is known as the Gaussian function or bell curve.
- FIG 8 is a schematic block diagram illustrating an improved apparatus 14.
- the illustrated apparatus 14 includes a transducer 10 for converting mechanical vibrations in a bearing to analogue electrical oscillations S EA .
- the presently preferred transducer may comprise a resonant piezoelectric accelerometer, as described above in this document.
- the analogue signal S EA from the transducer 10 may be delivered to a conditioning circuit 43 which may be coupled to receive the analogue signal S EA , and an A/D converter 44 may be coupled to receive the conditioned analogue signal from the conditioning circuit 43.
- the A/D converter 44 samples the received conditioned analogue signal with a certain sampling frequency f S so as to deliver a digital measurement data signal S MD having said certain sampling frequency fs and wherein the amplitude of each sample depends on the amplitude of the received analogue signal at the moment of sampling.
- the digital measurement data signal S MD may be filtered, e.g. by a digital filter 240, so that the resulting signal has an upper frequency limit value f SEAmax corresponding to an upper cutoff filter frequency f UC .
- the digital filter 240 may be a digital band pass filter 240 as described in connection with Figure 6A and/or Figure 6B .
- a digital rectifier 270 may be provided to perform a rectification of the digital signal so as to generate a rectified digital signal S R dependent on said digital measurement signal S MD .
- the digital rectifier 270 is adapted to perform a full-wave rectification so as to generate a rectified digital signal S R dependent on said digital measurement signal S MD including absolute values of the resulting sequence of sample values.
- a digital peak value detector 310 may be adapted to generate output peak values A PO on an output 315 dependent on said sequence of sample values S MD , S R .
- the detected signal peaks or detected signal peak values A PO may be delivered from the peak detector output 315 to an input 840 of a log generator 850.
- the log generator 850 is adapted to generate the logarithmic amplitude values corresponding to the amplitude of the received detected signal peaks or detected signal peak values A PO .
- an output 860 of log generator 850 is adapted to deliver logarithmic amplitude values.
- a value sorter 870 also referred to as peak value discriminator 870, is adapted to receive the logarithmic amplitude values and to sort the received the logarithmic amplitude values into amplitude bins corresponding to the received logarithmic amplitude values during a measuring session.
- the value sorter 870 may be adapted to deliver sorted amplitude values A PO , e.g. in the form of a table 470 at the end of a measuring session.
- the table 470 may be a table histogram 470 and/or cumulative histogram table 530, as discussed and illustrated in connection with Figures 9 and/or 11 below.
- a measuring session controller 904 may be provided to control a variably settable duration T Meas of the measuring session.
- the measuring session controller 904 may provide a control signal T control so as to turn on switches 909A and 909B simultaneously, or substantially simultaneously, and so as to turn off the switches 909A and 909B simultaneously, or substantially simultaneously.
- the switches 909A and 909B may be switched on at the start of the measuring session duration T Meas
- the switches 909A and 909B may be switched off at the end of the measuring session duration T Meas .
- the peak value discriminator 870 will operate for the duration of the measuring session duration T Meas , and at the end of the measuring session duration T Meas the relevant time value T MeasV , counted e.g as an amount of seconds, is stored in association with the table 470.
- the measuring session duration T Meas may be settable by a user via the user interface. Alternatively, the measuring session duration T Meas may be settable in dependence on the duration necessary for obtaining a desired frequency resolution by the Fast Fourier Transformer 1020.
- Figure 9 is a schematic illustration of plural memory positions arranged as a table 470, and suitable for storage of data to be collected.
- the table 470 may be stored in the memory 52 ( Fig 2A ) or in a memory internal to the processor 50.
- Figure 10 illustrates a histogram having plural amplitude bins 500, each amplitude bin representing an amplitude level A r .
- the number of amplitude bins may be set to a suitable number by the user, via user interface 102 ( Figure 2A ).
- Figure 10 illustrates a number of amplitude bins along one axis 480, and occurrence of detected peak amplitude values along another axis 490. However, in the illustration of Figure 10 no values have been plotted in the histogram.
- the illustrated table 470 is a representation of the histogram shown in Figure 10 , having amplitude bins 500, individually referred to by references r1 to r750, each amplitude bin r1..r750 representing an amplitude level A r .
- the table 470 also includes memory positions 510 for amplitude values A, and memory positions 520 for variables N r reflecting the occurrence.
- Bin r1 is associated with an amplitude value A r1 and with a memory position for a variable N r1 for storing a value indicating how many times the amplitude Ar1 has been detected.
- all the occurrence variables N r1 to N r750 may be set to zero (0).Thereafter the measuring session may begin.
- said detected peak amplitude values are sorted into corresponding amplitude ranges 500 so as to reflect occurrence N of detected peak amplitude values Ap within said plurality of amplitude ranges 500 (See Figure 9 ).
- the duration of the measurement session is controlled by measuring session controller 904, in dependence of time information provided by a clock 190 ( Fig 5 ).
- the switch 909A turns off, so that no more peak amplitude values can be added in the table.
- the occurrence values N r in the respective bins are divided by the relevant time value T MeasV , counted e.g as an amount of seconds, so as to obtain an average occurrence frequency value f C , expressed e.g. as pulses per second for each of the amplitude bins. Since these average values are counted as an average for the complete duration of the measuring session, the resulting value has been found to be advantageously reliable.
- two occurrence frequency values f C1 and f C2 are to be identified.
- the first occurrence frequency value fci corresponds to a mean value of about 40 peak values per second
- the second occurrence frequency value f C2 corresponds to a mean value of about 1000 peak values per second.
- the apparatus 14 further comprises
- Figure 11 is an illustration of a cumulative histogram table 530 corresponding to the histogram table of Figure 9 .
- the cumulative histogram table of Figure 11 includes the same number of amplitude range bins as the Figure 9 table.
- the occurrence N' is reflected as the number of occurrences of detected peaks having an amplitude higher than the amplitude A r ' of associated amplitude bin r. This advantageously provides for a smoother curve when the cumulative histogram is plotted.
- the cumulative histogram will provide a smoother curve, which makes is more suitable for use in estimating occurrence at one amplitude level based on the observation of occurrences at other amplitude levels.
- the data of the table of Figure 9 may advantageously be arranged as a cumulative histogram 530, and the two occurrence frequency values f C1 and f C2 may be identified from the cumulative histogram 530.
- the first occurrence frequency value fci may correspond to a mean value of about 40 peak values per second
- the second occurrence frequency value f C2 may correspond to a mean value of about 1000 peak values per second.
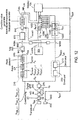
- FIG 12 is a schematic block diagram of another embodiment of the analysis apparatus 14.
- the illustrated apparatus 14 includes a transducer 10 for converting mechanical vibrations in a bearing to analogue electrical oscillations S EA .
- the presently preferred transducer may comprise a resonant piezoelectric accelerometer, as described above in this document.
- the analogue signal S EA from the transducer 10 may be delivered to a conditioning circuit 43 which may be coupled to receive the analogue signal S EA , and an A/D converter 44 may be coupled to receive the conditioned analogue signal from the conditioning circuit 43.
- the A/D converter 44 samples the received conditioned analogue signal with a certain sampling frequency fs so as to deliver a digital measurement data signal S MD having said certain sampling frequency f S and wherein the amplitude of each sample depends on the amplitude of the received analogue signal at the moment of sampling.
- the digital measurement data signal S MD may be filtered, e.g. by a digital filter 240, so that the resulting digitally filtered signal S F has an upper frequency limit value f SEAmax corresponding to an upper cutoff filter frequency f UC .
- the digital filter 240 may be a digital band pass filter 240 as described in connection with Figure 6A and/or Figure 6B .
- a digital rectifier 270 may be provided to perform a rectification of the digital signal so as to generate a rectified digital signal S R .
- the digital rectifier 270 is adapted to perform a full-wave rectification so as to generate a rectified digital signal S R .
- the digital rectifier 270 is adapted to perform a full-wave rectification of the digitally filtered signal so as to generate the rectified digital signal S R .
- the rectified signal S R may be delivered to a digital peak value detector 310 as well as to an enveloper 250.
- the digital peak value detector 310 may be adapted to generate output peak values A PO on a peak detector output 315 dependent on said sequence of sample values S MD , S R , S F .
- the detected signal peaks or detected signal peak values A PO may be delivered from the peak detector output 315 to an input 840 of a log generator 850.
- the log generator 850 is adapted to generate the logarithmic amplitude values corresponding to the amplitude of the received detected signal peaks or detected signal peak values A PO .
- an output 860 of log generator 850 is adapted to deliver logarithmic amplitude values.
- a value sorter 870 also referred to as peak value discriminator 870, is adapted to receive the logarithmic amplitude values and to sort the received the logarithmic amplitude values into amplitude bins corresponding to the received logarithmic amplitude values during a measuring session.
- the value sorter 870 may be adapted to deliver sorted amplitude values A PO , e.g. in the form of a table 470 at the end of a measuring session.
- the table 470 may be a table histogram 470 and/or a cumulative histogram table 530, as discussed and illustrated in connection with Figures 9 and/or 11 below.
- a measuring session controller 904 may be provided to control a variably settable duration T Meas of the measuring session.
- the measuring session controller 904 may provide a control signal T control so as to turn on switches 909A and 909B simultaneously, or substantially simultaneously, and so as to turn off the switches 909A and 909B simultaneously, or substantially simultaneously.
- the switches 909A and 909B may be switched on at the start of the measuring session duration T Meas
- the switches 909A and 909B may be switched off at the end of the measuring session duration T Meas .
- the peak value discriminator 870 will operate for the duration of the measuring session duration T Meas , and at the end of the measuring session duration T Meas the relevant time value T MeasV , counted e.g as an amount of seconds, may be stored in association with the table 470, 530.
- the relevant time value T MeasV may be stored in a memory 910, as illustrated in Figure 12 .
- the memory 910 may also store the histogram table 470 and/or cumulative histogram table 530 delivered from the value sorter 870.
- the memory 910 may be embodied by the memory 52 ( Fig 2A ) or it may be embodied by a memory internal to the processor 50.
- the measuring session duration T Meas may be settable by a user via the user interface 102 (see Figure 2A ). Alternatively, the measuring session duration T Meas may be settable in dependence on the duration necessary for obtaining a desired frequency resolution by the Fast Fourier Transformer 1020.
- a condition value generator 1030 is adapted to receive the relevant time value T MeasV and the histogram table 470 and/or cumulative histogram table 530 from the value sorter 870.
- the condition value generator 1030 operates to divide the occurrence values N r in the respective bins by the relevant time value T MeasV , counted e.g as an amount of seconds, so as to obtain an average occurrence frequency value fc, expressed e.g. as pulses per second for each of the amplitude bins.
- an embodiment of the condition value generator 1030 operates to generate a normalized interpretable histogram. It is normalized in the sense that since the occurrence frequency values f C are averaged, the values of the normalized histogram will be useful for comparisons with corresponding values of other normalized interpretable histograms irrespective of the measurements session durations of the mutually different histogram values. In this manner an individual value of the normalized histogram will be useful for comparison with a reference value irrespective of the measurement session duration T Meas employed for generating the individual value.
- condition value generator 1030 is adapted to generate a first condition value LR D in response to said sorted output peak values A PO and said duration T Meas so that said first condition value LR D is indicative of a first amplitude value A LRD having a first predetermined occurrence rate f C1 .
- condition value generator 1030 is also adapted to generate a first condition value LR D in response to said sorted output peak values A PO and said duration T Meas so that said first condition value LR D is based on a selected first temporal portion of the digital measurement signal S MD , S R .
- condition value generator 1030 is also adapted to generate a second condition value HR LUB in response to said sorted output peak values A PO and said duration T Meas so that said second condition value HR LUB is indicative of an second amplitude value A HRLUB having a second predetermined occurrence rate f C2 , and so that said second condition value HR LUB is based on said selected first temporal portion of the digital measurement signal S MD , S R .
- the rectified signal S R may be delivered to a digital peak value detector 310 as well as to an enveloper 250.
- the apparatus 14 further comprises a decimator 1010 adapted to generate a decimated digital signal S RED in dependence of said rectified signal S R , as illustrated in Figure 12 , so that the decimated digital signal S RED has a reduced sampling frequency f SR ; and a Fourier Transformer 1020 adapted to generate a transformed signal S FT in dependence of a selected second temporal portion of said decimated digital signal S RED so that said transformed signal S FT is indicative of said vibration signal repetition frequency f D .
- the apparatus is arranged to coordinate the generation of the transformed signal S FT with the generation of the first condition value LR D so that the selected second temporal portion of said decimated digital signal S RED is based substantially on said selected first temporal portion of the digital measurement signal S MD , and so that said selected first temporal portion of the digital measurement signal S MD is generated during the variably settable duration T Meas of said measuring session.
- the apparatus may also comprise an associator 1035 adapted to associate the first condition value LR D with the transformed signal S FT , as illustrated in Figure 12 .
- the Figure 12 embodiment thus advantageously enables the delivery of a first condition value LR D which is indicative of the first amplitude value A LRD of peak values A PO having a first predetermined occurrence rate fci and of a transformed signal S FT which is indicative of said vibration signal repetition frequency f D while ensuring that the first condition value LR D and the transformed signal SFT are consistent with each other, since both of them are based on the same or substantially the same temporal portion of the digital measurement signal S MD .
- an associator 1035 adapted to associate the first condition value LR D with the transformed signal S FT enables presentation of the first condition value LR D associated with the transformed signal S FT .
- Such presentation may be achieved by the display 106, as illustrated in Figure 12 .
- the first condition value (LR D ) and the transformed signal (SFT) are based on concurrent measurement data, or substantially the same measurement data, and as such the first condition value (LR D ) and the transformed signal (SFT) may complement each other by providing mutually different perspectives on the same event, i.e. the condition of the monitored rotatable machine part (7,8) during the measuring session, based on data collected during the whole duration (T meas ) of the measuring session, as mentioned above.
- a sensor 450 may be provided for detecting speed of rotation f ROT associated with the rotatable part 7,8 of the machine 6, as illustrated in Figures 1 , 8 and 12 , so as to generate a signal indicative of detected speed of rotation f ROT .
- the signal indicative of detected speed of rotation f ROT may be provided to an apparatus input 1040 for receiving the signal indicative of detected speed of rotation f ROT associated with said rotatable part 7, 8.
- the signal indicative of detected speed of rotation f ROT may be delivered to the decimator 1010 and/or to the condition analyzer 290 and/or to the display 106, and/or to the associator 1035, as illustrated in Figure 12 .
- the apparatus comprises an analyser 290 having a first analyzer input 1050 for receiving said first condition value LR D ; and a second analyzer input 1060 for receiving said second condition value HR LUB ; wherein the analyzer 290 is adapted to generate a status signal indicative of whether the condition of the machine is normal or abnormal in dependence on said first condition value LR D and said second condition value HR LUB .
- the fact that the apparatus may generate the first condition value LR D and the second condition value HR LUB on the basis of measurement data S MD , S R collected during the uninterrupted time period of the variably settable duration T Meas of said measuring session advantageously increases the reliability of the first condition value LR D and the second condition value HR LUB in the sense of truly reflecting the condition of the monitored part.
- the monitored rotatable part is a bearing in a crane which sometimes carries a heavy load, and which sometimes runs substantially unloaded
- the bearing will sometimes be subjected to a large force due to the carrying of the heavy load.
- the measurement data collected i.e. the selected first temporal portion of the digital measurement signal S MD , S R
- the variably settable duration T Meas of the measurement session advantageously enables an operator of the apparatus to set the duration T Meas so as to include the loaded time period in the measurement session.
- the apparatus comprises an apparatus input 1040 for receiving a signal indicative of a detected speed of rotation (f ROT ) associated with said rotatable part 7,8 (see Fig. 1 and 12 ).
- the apparatus may also comprise a third analyzer input 1070 for receiving said signal indicative of a detected speed of rotation (f ROT ); and a fourth analyzer input 1080 for receiving a bearing frequency factor value (OR, IR, FTF, BS); and a fifth analyzer input 1090 for receiving said transformed signal (S FT , f D ).
- the analyzer may be adapted to generate a status signal indicative of the nature of, and/or cause for, an abnormal machine condition in dependence of said speed of rotation signal (f ROT ), said bearing frequency factor value (OR, IR, FTF, BS) and said transformed signal (S FT , fD).
- the analyzer 290, 1035 is adapted to generate a status signal indicative of a probable location of an incipient damage in dependence of
- the analyzer 290, 1035 is adapted to extract said at least one vibration signal repetition frequency (f D ) from said transformed signal (S FT , f D ); and the analyzer is adapted to generate a frequency factor estimate (F fEST ) in dependence on said at least one vibration signal repetition frequency (f D ) and said detected speed of rotation (f ROT ); and the analyzer is adapted to compare the generated frequency factor estimate (F fEST ) with a stored plurality of frequency factors (F fstore1 , F fstore2 , F fstore3 ,.. F fstoren ); and wherein the analyzer is adapted to generate a status signal indicative of a probable location of an incipient damage in dependence of said frequency factor comparison.
- This solution may advantageously provide an explicit indication to the effect that a detected damage is located e.g. on the outer ring of a monitored bearing assembly, when the generated frequency factor estimate (F fEST ) has a value that substantially corresponds to a stored value of an Outer Ring frequency factor value.
- An embodiment of an apparatus for analysing the condition of a machine having a part (7) rotatable with a speed of rotation comprises: an input 42 for receiving an analogue measurement signal S EA indicative of a vibration signal signature (S D ) having a vibration frequency F SEA and at least one repetition frequency f D ; and an A/D converter 40, 44) adapted to generate a digital measurement signal S MD dependent on the analogue measurement signal, said digital measurement signal S MD having a first sample rate (f S ), the first sample rate being at least twice (k) said vibration frequency (f SEA ).
- this embodiment also comprises a digital rectifier 270 adapted to perform full-wave rectification so as to generate a rectified digital signal S R dependent on said digital measurement signal S MD ; and a smoothing stage 1100 adapted to generate a smoothened digital signal (S Smooth ) dependent on said rectified digital signal (S R ).
- the smoothing stage 1100 is adapted to adjust an output sample amplitude value (S SOUT_i ) upwards in dependence on
- the smoothing stage will eliminate "dents" in the rectified signal, and it will do so by always adjusting the amplitude upwards.
- the rectified signal S R may include a sampled value S SIN_i having significantly lower amplitude that its temporally adjacent neighbour samples S SIN_i-1 and S SINi+1 , the signal S SMOOTH from the smoothing stage will always be smooth.
- smoothing stage 1100 may be adapted to adjust an output sample amplitude value S SOUT_ i , wherein i denotes the temporal position of the sample, upwards in dependence on the amplitude of the corresponding input sample amplitude value S SIN_i and in dependence on the amplitude of temporally preceding input sample amplitude value S SIN_i-1 , as well as in dependence on the amplitude of temporally succeeding the input sample amplitude value S SIN_i+1 .
- the median-filter would also reduce the top amplitude value of the output signal in relation to the top value of the rectified input signal.
- the smoothing stage as defined above will not only make the signal more smooth, but it will also maintain the amplitude values of the highest detected amplitudes in the rectified signal.
- this embodiment also comprises an asymmetric digital filter 1110 for generating an asymmetrically low pass filtered signal S ASYM in response to the smoothed digital signal S Smooth .
- the asymmetric digital filter 1110 may be adapted to generate the asymmetrically filtered signal (S ASYM ) so that in response to a detected positive time derivative of the smoothed digital a first settable filter value k is set to a first value KRise; and in response to a detected negative time derivative of the smoothed digital signal said first settable filter value (k) is set to a second value kFall.
- a peak detector 330 may be adapted to detect the peak value Ap of the asymmetrically filtered signal S ASYM , as illustrated in Figure 12 , and to deliver the output peak values A PO on a peak value detector output 315.
- the smoothing stage 1100 includes
- the smoothing stage includes a first peak sample selector 1100 which is adapted to receive a plurality of temporally consecutive sample values of the rectified signal S R ;
- the asymmetric digital filter 1110 is adapted to generate the asymmetrically filtered signal (S ASYM ) so that
Landscapes
- Physics & Mathematics (AREA)
- General Physics & Mathematics (AREA)
- Engineering & Computer Science (AREA)
- Human Computer Interaction (AREA)
- Manufacturing & Machinery (AREA)
- Automation & Control Theory (AREA)
- Acoustics & Sound (AREA)
- Measurement Of Mechanical Vibrations Or Ultrasonic Waves (AREA)
- Testing Of Devices, Machine Parts, Or Other Structures Thereof (AREA)
Claims (13)
- Vorrichtung zum Analysieren des Maschinenzustands mit einem mit einer Drehzahl (fROT) drehbaren Teil (7, 8), umfassend:einen Umwandler (10) zum Erzeugen eines analogen Messsignals (SEA) als Antwort auf die Maschinenschwingung, sodass das analoge Messsignal (SEA) eine Vibrationssignalsignatur (SD) einschließt miteiner Schwingungsfrequenz (fSEA), die niedriger als ein oberer Frequenzgrenzwert (fSEAmax) ist, undmindestens einer Schwingungssignal-Wiederholfrequenz (fD) undeiner Schwingungssignalamplitude;einen A/D-Wandler (40, 44), ausgebildet zum Erzeugen eines digitalen Messsignals (SMD, SR) mit einer Sequenz von Abtastwerten (SMD, SR) abhängig von dem analogen Messsignal (SEA), wobei das digitale Messsignal (SMD, SR) eine erste Abtastrate (fs) aufweist;
einen digitalen Spitzenwertdetektor (310), ausgebildet zum Erzeugen eines Ausgangsspitzenwertes (APO) abhängig von der Sequenz von Abtastwerten (SMD, SR); ein Spitzenwertdiskriminator (870), ausgebildet zum Sortieren der Ausgangsspitzenwerte (APO) in entsprechende Amplitudenbereiche während einer Messsitzung; eine Messsitzungssteuerung (904), ausgebildet zum Steuern einer Dauer (TMeas) der Messsitzung;
ein Zustandwertgenerator (1030), ausgebildet zum Erzeugen eines ersten Zustandswerts (LRD) als Antwort auf die sortierten Ausgangsspitzenwerte (APO) und die Dauer (TMeas), sodassder erste Zustandswert (LRD) indikativ ist für einen ersten Amplitudenwert (ALRD) mit einer ersten vorbestimmten Häufigkeitsrate (fC1) und sodass der erste Zustandswert (LRD) auf einen ausgewählten ersten zeitlichen Abschnitt des digitalen Messsignals (SMD, SR) basiert;dadurch gekennzeichnet, dass die Vorrichtung ferner umfasst:einen Dezimator (1010), ausgebildet zum Erzeugen eines dezimierten digitalen Signals (SRED; SRED1; SRED2) in Abhängigkeit von dem digitalen Messsignal (SMD, SR), sodass das dezimierte digitale Signal (SRED; SRED1; SRED2) eine reduzierte Abtastfrequenz (fSR; fSR1) aufweist; undeinen Fourier-Transformator (1020), ausgebildet zum Erzeugen eines transformierten Signals (SFT) in Abhängigkeit eines ausgewählten zweiten zeitlichen Abschnitts des dezimierten digitalen Signals (SRED; SRED1; SRED2), sodass das transformierte Signal (SFT) indikativ ist für die Schwingungssignal-Wiederholfrequenz (fD); wobei die Vorrichtung angeordnet ist, umdas Erzeugen des transformierten Signals (SFT) mit dem Erzeugen des ersten Zustandswerts (LRD) zu koordinieren, sodassder erste Zustandswert (LRD) und das transformierte Signal (SFT) konsistent zueinander sind, wobei der erste Zustandswert (LRD) und das transformierte Signal (SFT) auf den gleichen oder im Wesentlichen gleichen zeitlichen Abschnitt des digitalen Messsignals (SMD, SR) basieren, der ausgewählte zweite zeitliche Abschnitt des dezimierten digitalen Signals (SRED; SRED1; SRED2) im Wesentlichen auf den ausgewählten ersten zeitlichen Abschnitt des digitalen Messsignals (SMD) basiert und der ausgewählte erste zeitliche Abschnitt des digitalen Messsignals (SMD) während der Dauer (TMeas) der Messsitzung erzeugt wird. - Vorrichtung nach Anspruch 1, wobeider Zustandwertgenerator ausgebildet ist, um einen zweiten Zustandswerts (HRLUB) als Antwort auf die sortierten Ausgangsspitzenwerte (APO) und die Dauer (TMeas) zu erzeugen, sodassder zweite Zustandswert (HRLUB) indikativ ist für einen zweiten Amplitudenwert (AHRLUB) mit einer zweiten vorbestimmten Häufigkeitsrate (fC2), und sodass der zweite Zustandswert (HRLUB) auf den ausgewählten ersten zeitlichen Abschnitt des digitalen Messsignals (SMD, SR) basiert.
- Vorrichtung nach Anspruch 2, ferner umfassendeinen Analysator miteinem ersten Analysatoreingang zum Empfangen des ersten Zustandswerts (LRD);einem zweiten Analysatoreingang zum Empfangen des zweiten Zustandswerts (HRLUB); wobeider Analysator ausgebildet ist, um ein Statussignal, das dafür indikativ ist, ob der Zustand der Maschine normal oder abnormal ist, in Abhängigkeit von dem ersten Zustandswert (LRD) und dem zweiten Zustandswert (HRLUB) zu erzeugen.
- Vorrichtung nach Anspruch 3, ferner umfassend
einen Vorrichtungseingang zum Empfangen eines Signals, das indikativ ist für eine erfasste, mit dem drehbaren Teil (7,8) verbundene, Drehzahl (fROT);einen dritten Analysatoreingang zum Empfangen des Signals, das indikativ ist für eine erfasste Drehzahl (fROT);einen vierten Analysatoreingang zum Empfangen eines Lagerfrequenzfaktorwerts (OR, IR, FTF, BS); undeinen fünften Analysatoreingang zum Empfangen des transformierten Signals; wobei
der Analysator ausgebildet ist, um ein Statussignal, das indikativ ist für die Art der und/oder die Ursache für einen abnormalen Maschinenzustand in Abhängigkeit von dem Drehzahlsignal (fROT), dem Lagerfrequenzfaktorwert (OR, IR, FTF, BS) und dem transformierten Signal zu erzeugen. - Vorrichtung nach Anspruch 3, ferner umfassend
einen Vorrichtungseingang zum Empfangen eines Signals, das indikativ ist für eine erfasste, mit dem drehbaren Teil (7,8) verbundene, Drehzahl (fROT);einen dritten Analysatoreingang zum Empfangen des Signals, das indikativ ist für eine erfasste Drehzahl (fROT);einen vierten Analysatoreingang zum Empfangen eines Lagerfrequenzfaktorwerts (OR, IR, FTF, BS); undeinen fünften Analysatoreingang zum Empfangen des transformierten Signals; wobei
der Analysator ausgebildet ist, um ein Statussignal, das indikativ ist für einen wahrscheinlichen Ort einer beginnenden Beschädigung in Abhängigkeit von dem Drehzahlsignal (fROT),
dem Lagerfrequenzfaktorwert (OR, IR, FTF, BS) und
dem transformierten Signal zu erzeugen. - Vorrichtung nach Anspruch 3, ferner umfassend
einen Vorrichtungseingang zum Empfangen eines Signals, das indikativ ist für eine erfasste, mit dem drehbaren Teil (7, 8) verbundene, Drehzahl (fROT);einen dritten Analysatoreingang zum Empfangen des Signals, das indikativ ist für eine erfasste Drehzahl (fROT);einen vierten Analysatoreingang zum Empfangen eines Lagerfrequenzfaktorwerts (OR, IR, FTF, BS); undeinen fünften Analysatoreingang zum Empfangen des transformierten Signals; wobei
der Analysator ausgebildet ist, um die mindestens eine Schwingungssignal-Wiederholfrequenz (fD) aus dem transformierten Signal zu extrahieren; und der Analysator ausgebildet ist, um eine Frequenzfaktorschätzung (FfEST) in Abhängigkeit von der mindestens einen Schwingungssignal-Wiederholfrequenz (fD) und der erfassten Drehzahl (fROT) zu erzeugen; und
der Analysator ausgebildet ist, um die erzeugte Frequenzfaktorschätzung (FfEST) mit einer Vielzahl von gespeicherten Frequenzfaktoren (Ffstorei, Ffstore2, Ffstore3,... Ffstoren) zu vergleichen; und wobei
der Analysator ausgebildet ist, um ein Statussignal, das indikativ ist für einen wahrscheinlichen Ort einer beginnenden Beschädigung in Abhängigkeit von dem Frequenzfaktorvergleich zu erzeugen. - Vorrichtung nach einem der Ansprüche 1 bis 6, ferner umfassend:einen Assoziator, ausgebildet zum Assoziierendes ersten Zustandswerts (LRD) mitdem transformierten Signal.
- Vorrichtung nach einem der Ansprüche 1 bis 6, ferner umfassend:einen digitalen Gleichrichter (270), ausgebildet zum Durchführen einer Gleichrichtung um ein gleichgerichtetes digitales Signal (SR) abhängig von dem digitalen Messsignal (SMD) zu erzeugen; und wobeider digitale Spitzenwertdetektor ausgebildet ist, um die Ausgangsspitzenwerte (APO) abhängig von dem gleichgerichteten digitalen Signal (SMD, SR) zu erzeugen; undder Dezimator ausgebildet ist, um die Dezimierung an dem gleichgerichteten digitalen Signal (SR) durchzuführen, um das dezimierte digitale Signal (SRED; SRED1; SRED2) mit einer reduzierten Abtastfrequenz (fSR1; fSR1) zu erreichen.
- Vorrichtung nach Anspruch 8, wobei:
der digitale Gleichrichter (270) ausgebildet ist, um eine Vollwellengleichrichtung durchzuführen, um ein gleichgerichtetes digitales Signal (SR) abhängig von dem digitalen Messsignal (SMD) einschließlich Absolutwerte der Sequenz der Abtastwerte (SMD, SR) zu erzeugen. - Vorrichtung nach Anspruch 1, ferner umfassend
einen digitalen Gleichrichter (270), ausgebildet zum Durchführen von Vollwellengleichrichtung, um ein gleichgerichtetes digitales Signal (SR) abhängig von dem digitalen Messsignal (SMD) zu erzeugen; wobei
der digitale Spitzenwertdetektor (310)
eine Glättungsstufe (1100), ausgebildet zum Erzeugen eines geglätteten digitalen Signals (SSmooth) abhängig von dem gleichgerichteten digitalen Signal (SR), einschließt; wobei die Glättungsstufe (1100) ausgebildet ist, um einen Ausgangs-Abtastamplitudenwert (SSOUT_i) nach oben in Abhängigkeit von
der Amplitude des entsprechenden Eingangs-Abtastamplitudenwerts (SSIN_i) und in Abhängigkeit von
der Amplitude der zeitlich benachbarten Eingangs-Abtastamplitudenwerte (SSIN_i-1, SSIN_i+1) einzustellen; und
einen asymmetrischen digitalen Filter (1110) zum Erzeugen eines asymmetrischen Tiefpass gefilterten Signals (SASYM) als Antwort auf das geglättete digitale Signal (SSmooth); wobei der asymmetrische digitale Filter ausgebildet ist, um das asymmetrisch gefilterte Signal (SASYM) zu erzeugen, sodass
als Antwort auf eine detektierte positive zeitliche Ableitung des geglätteten digitalen Signals, ein erster einstellbarer Filterwert (k) auf einen ersten Wert (KRise) gesetzt wird, und
als Antwort auf eine detektierte negative zeitliche Ableitung des geglätteten digitalen Signals, der erste einstellbare Filterwert (k) auf einen zweiten Wert (KFall) gesetzt wird; und
ein Spitzendetektor (330), ausgebildet zum Erfassen eines Spitzenwerts (AP) des asymmetrischen gefilterten Signals (SASYM), wobei der Spitzendetektor (330) ausgebildet ist, um die Ausgangsspitzenwerte (APO) auf einen Spitzenwert Detektorausgang (315) zu liefern; und wobei
der Spitzendetektor (330) ausgebildet ist, um die Lieferfrequenz der Ausgangsspitzenwerte (AP, APO) so zu begrenzen, dass die Ausgangsspitzenwerte (AP, APO) mit einer maximalen Lieferfrequenz von fdP geliefert werden, wobei wobei fS die erste Abtastrate ist, unde eine Zahl größer als zwei ist.
 - Vorrichtung nach Anspruch 10, wobei die Glättungsstufe (1100) einen ersten Spitzenabtastselektor (1100) einschließt, ausgebildet zum Analysieren v aufeinanderfolgender empfangener Abtastwerte, und zum Identifizieren der höchsten Amplitude dieser v aufeinanderfolgender empfangener Abtastwerte, und zum Liefern der v aufeinanderfolgenden Ausgangsabtastwerte mit mindestens einem der v aufeinanderfolgenden Ausgangsabtastwerte mit einem angepassten Amplitudenwert, wobei die Anpassung eine Amplitudenerhöhung ist,
wobei, v eine ganze Zahl mit einem Wert von etwa fs/fSEA ist;
wobei fs die erste Abtastrate ist, und
FSEA die Schwingungsfrequenz ist. - Vorrichtung nach Anspruch 10, wobei
die Glättungsstufe
einen ersten Spitzenabtastselektor einschließt, der ausgebildet ist, um eine Vielzahl von zeitlich aufeinanderfolgenden Abtastwerten zu empfangen; und
die Amplitude eines ausgewählten Abtastwerts aus den empfangenen mehreren aufeinanderfolgenden Abtastwerten zu identifizieren; und- die Amplitude des ausgewählten Abtastwertes, - die Amplitude der Abtastung, die dem ausgewählten Abtastwert unmittelbar vorausgeht und - die Amplitude der Abtastung, die dem ausgewählten Abtastwert nachgeht zu analysieren;
und
einen Ausgangsabtastwert als Antwort auf die ausgewählten Abtastwerte zu liefern, sodass der Ausgangsabtastwert eine Amplitude hat, entsprechend der höchsten, in der Analyse erfassten Amplitude. - Vorrichtung nach Anspruch 10, wobei:der asymmetrische digitale Filter ausgebildet ist, um das asymmetrisch gefilterte Signal (SASYM) zu erzeugen, sodassals Antwort auf eine detektierte positive zeitliche Ableitung des geglätteten digitalen Signals (SSmooth) das asymmetrische gefilterte Signal (SASYM) eine positive zeitliche Ableitung im Wesentlichen gleich der des geglätteten digitalen Signals (SSmooth) haben wird; undals Antwort auf eine detektierte negative zeitliche Ableitung des geglätteten digitalen Signals (SSmooth) das asymmetrische gefilterte Signal (SASYM) eine negative zeitliche Ableitung haben wird, die langsamer ist als die des geglätteten digitalen Signals (SSmooth).
Applications Claiming Priority (3)
| Application Number | Priority Date | Filing Date | Title |
|---|---|---|---|
| SE1200552 | 2012-09-11 | ||
| US201261732483P | 2012-12-03 | 2012-12-03 | |
| PCT/SE2013/051062 WO2014042582A1 (en) | 2012-09-11 | 2013-09-11 | Apparatus for monitoring the condition of a machine |
Related Child Applications (1)
| Application Number | Title | Priority Date | Filing Date |
|---|---|---|---|
| EP20177798.4 Division-Into | 2020-06-02 |
Publications (4)
| Publication Number | Publication Date |
|---|---|
| EP2895827A1 EP2895827A1 (de) | 2015-07-22 |
| EP2895827A4 EP2895827A4 (de) | 2016-10-19 |
| EP2895827B1 true EP2895827B1 (de) | 2020-06-03 |
| EP2895827B8 EP2895827B8 (de) | 2020-08-19 |
Family
ID=50278532
Family Applications (1)
| Application Number | Title | Priority Date | Filing Date |
|---|---|---|---|
| EP13837138.0A Active EP2895827B8 (de) | 2012-09-11 | 2013-09-11 | Vorrichtung zur maschinenzustandsüberwachung |
Country Status (3)
| Country | Link |
|---|---|
| US (5) | US9772219B2 (de) |
| EP (1) | EP2895827B8 (de) |
| WO (1) | WO2014042582A1 (de) |
Families Citing this family (21)
| Publication number | Priority date | Publication date | Assignee | Title |
|---|---|---|---|---|
| CN103398768B (zh) | 2008-12-22 | 2017-10-13 | S.P.M.仪器公司 | 分析具有旋转部件的机器的状态的方法和系统 |
| US9772219B2 (en) * | 2012-09-11 | 2017-09-26 | S.P.M. Instrument Ab | Apparatus for monitoring the condition of a machine |
| KR101393741B1 (ko) * | 2014-02-26 | 2014-05-13 | 건양대학교산학협력단 | 건설구조물의 동적응답 획득을 위한 달팽이관 원리 기반의 무선 계측 시스템 |
| EP3081914B1 (de) * | 2015-04-15 | 2018-07-04 | Siemens Aktiengesellschaft | Überwachung einer maschine mit einer rotierenden maschinenkomponente |
| US12276420B2 (en) | 2016-02-03 | 2025-04-15 | Strong Force Iot Portfolio 2016, Llc | Industrial internet of things smart heating systems and methods that produce and use hydrogen fuel |
| CN108700492B (zh) * | 2016-02-23 | 2020-08-11 | Ntn株式会社 | 异常诊断装置和异常诊断方法 |
| US10788395B2 (en) * | 2017-02-10 | 2020-09-29 | Aktiebolaget Skf | Method and device of processing of vibration sensor signals |
| US10816437B2 (en) * | 2017-03-22 | 2020-10-27 | General Electric Company | Contactless rotor state/speed measurement of x-ray tube |
| DE102017109460A1 (de) * | 2017-05-03 | 2018-11-08 | Prüftechnik Dieter Busch AG | System und Verfahren zur Schwingungsmessung an einer Maschine |
| FR3069668B1 (fr) * | 2017-07-27 | 2021-02-12 | Safran | Procede et dispositif de recherche d'un defaut susceptible d'affecter un dispositif mecanique tournant de transmission de puissance |
| US11188065B2 (en) * | 2017-09-23 | 2021-11-30 | Nanoprecise Sci Corp. | System and method for automated fault diagnosis and prognosis for rotating equipment |
| CN108830128A (zh) * | 2018-03-28 | 2018-11-16 | 中南大学 | 基于类噪声信号vmd分解的电力系统低频振荡模态辨识方法 |
| US20200133254A1 (en) | 2018-05-07 | 2020-04-30 | Strong Force Iot Portfolio 2016, Llc | Methods and systems for data collection, learning, and streaming of machine signals for part identification and operating characteristics determination using the industrial internet of things |
| EP4440165B1 (de) | 2019-01-13 | 2026-02-18 | Strong Force Iot Portfolio 2016, LLC | Überwachung und verwaltung industrieller einstellungen |
| CN110441018B (zh) * | 2019-08-14 | 2021-07-13 | 清华大学 | 火工冲击响应数据时频分析方法 |
| US11257249B2 (en) | 2019-10-31 | 2022-02-22 | Baker Hughes Oilfield Operations Llc | Ensuring correct portable sensor placement |
| DE102020204227A1 (de) * | 2020-04-01 | 2021-10-07 | Aktiebolaget Skf | Vorrichtung zum Überwachen einer Maschine |
| CA3174873A1 (en) | 2020-04-09 | 2021-10-14 | Tim Sundstrom | System for controlling an internal state of a tumbling mill |
| CN111521259B (zh) * | 2020-04-30 | 2022-02-18 | 中国恩菲工程技术有限公司 | 磨机检测方法、装置与设备 |
| US11635060B2 (en) * | 2021-01-20 | 2023-04-25 | General Electric Company | System for operating a wind turbine using cumulative load histograms based on actual operation thereof |
| CA3232805A1 (en) | 2021-10-09 | 2023-04-13 | Tim Sundstrom | System and method for pump control based on pump vibrations |
Family Cites Families (19)
| Publication number | Priority date | Publication date | Assignee | Title |
|---|---|---|---|---|
| JPS54111871A (en) * | 1978-02-22 | 1979-09-01 | Hitachi Ltd | Frequency detecting method |
| US5109700A (en) * | 1990-07-13 | 1992-05-05 | Life Systems, Inc. | Method and apparatus for analyzing rotating machines |
| US5895857A (en) * | 1995-11-08 | 1999-04-20 | Csi Technology, Inc. | Machine fault detection using vibration signal peak detector |
| SE510771C2 (sv) | 1996-07-05 | 1999-06-21 | Spm Instr Ab | Förfarande för utvärdering av konditionen för en maskin jämte analysapparat samt anordning för samverkan med analysapparaten |
| US6053047A (en) | 1998-09-29 | 2000-04-25 | Allen-Bradley Company, Llc | Determining faults in multiple bearings using one vibration sensor |
| US6868348B1 (en) | 1999-10-29 | 2005-03-15 | Entek Ird International Corporation | Adaptive high frequency energy detection |
| EP1474660B1 (de) | 2002-01-18 | 2011-03-16 | SPM Instrument AB | Analysesystem zur analyse des zustands einer maschine |
| US6618128B2 (en) | 2002-01-23 | 2003-09-09 | Csi Technology, Inc. | Optical speed sensing system |
| US7027953B2 (en) * | 2002-12-30 | 2006-04-11 | Rsl Electronics Ltd. | Method and system for diagnostics and prognostics of a mechanical system |
| US7640139B2 (en) | 2004-10-18 | 2009-12-29 | Nsk Ltd. | Abnormality diagnosing system for mechanical equipment |
| WO2010074648A1 (en) * | 2008-12-22 | 2010-07-01 | S.P.M. Instrument Ab | An analysis system |
| CN103398768B (zh) * | 2008-12-22 | 2017-10-13 | S.P.M.仪器公司 | 分析具有旋转部件的机器的状态的方法和系统 |
| US8812265B2 (en) * | 2008-12-22 | 2014-08-19 | S.P.M. Instrument Ab | Analysis system |
| WO2010128928A1 (en) * | 2009-05-05 | 2010-11-11 | S.P.M. Instrument Ab | An apparatus and a method for analysing the vibration of a machine having a rotating part |
| SE535559C2 (sv) | 2010-01-18 | 2012-09-25 | Spm Instr Ab | Förfarande och anordning för analys av tillståndet hos maskin med roterande del |
| US9772219B2 (en) * | 2012-09-11 | 2017-09-26 | S.P.M. Instrument Ab | Apparatus for monitoring the condition of a machine |
| JP2015532848A (ja) | 2012-09-20 | 2015-11-16 | ビー−ケー メディカル エーピーエス | 画像組織(tissue)動作推定 |
| US9341512B2 (en) * | 2013-03-15 | 2016-05-17 | Fluke Corporation | Frequency response of vibration sensors |
| CN105378445B (zh) * | 2013-05-21 | 2018-10-26 | 科恩起重机环球公司 | 用于监测齿轮状态的方法和数据处理系统 |
-
2013
- 2013-09-11 US US14/425,472 patent/US9772219B2/en active Active
- 2013-09-11 EP EP13837138.0A patent/EP2895827B8/de active Active
- 2013-09-11 WO PCT/SE2013/051062 patent/WO2014042582A1/en not_active Ceased
-
2017
- 2017-08-14 US US15/675,933 patent/US10260935B2/en active Active
-
2019
- 2019-04-12 US US16/383,463 patent/US11015972B2/en active Active
-
2021
- 2021-04-22 US US17/238,038 patent/US11614357B2/en active Active
-
2023
- 2023-03-15 US US18/121,854 patent/US20230324216A1/en not_active Abandoned
Non-Patent Citations (1)
| Title |
|---|
| None * |
Also Published As
| Publication number | Publication date |
|---|---|
| US11614357B2 (en) | 2023-03-28 |
| WO2014042582A1 (en) | 2014-03-20 |
| EP2895827A4 (de) | 2016-10-19 |
| US10260935B2 (en) | 2019-04-16 |
| US9772219B2 (en) | 2017-09-26 |
| EP2895827A1 (de) | 2015-07-22 |
| US20220003595A1 (en) | 2022-01-06 |
| US20190368919A1 (en) | 2019-12-05 |
| US20180094968A1 (en) | 2018-04-05 |
| US20150226603A1 (en) | 2015-08-13 |
| US20230324216A1 (en) | 2023-10-12 |
| US11015972B2 (en) | 2021-05-25 |
| EP2895827B8 (de) | 2020-08-19 |
| WO2014042582A4 (en) | 2014-05-15 |
Similar Documents
| Publication | Publication Date | Title |
|---|---|---|
| US11614357B2 (en) | Apparatus for monitoring the condition of a machine | |
| US11561127B2 (en) | Apparatus for analysing the condition of a machine having a rotating part | |
| US11054301B2 (en) | Method and a system for analysing the condition of a rotating machine part | |
| US11599085B2 (en) | Method and apparatus for analysing the condition of a machine having a rotating part | |
| US10852179B2 (en) | Apparatus and a method for analysing the vibration of a machine having a rotating part | |
| US8810396B2 (en) | Analysis system | |
| US9200980B2 (en) | Analysis system | |
| US9304033B2 (en) | Analysis system |
Legal Events
| Date | Code | Title | Description |
|---|---|---|---|
| PUAI | Public reference made under article 153(3) epc to a published international application that has entered the european phase |
Free format text: ORIGINAL CODE: 0009012 |
|
| 17P | Request for examination filed |
Effective date: 20150211 |
|
| AK | Designated contracting states |
Kind code of ref document: A1 Designated state(s): AL AT BE BG CH CY CZ DE DK EE ES FI FR GB GR HR HU IE IS IT LI LT LU LV MC MK MT NL NO PL PT RO RS SE SI SK SM TR |
|
| AX | Request for extension of the european patent |
Extension state: BA ME |
|
| DAX | Request for extension of the european patent (deleted) | ||
| RIC1 | Information provided on ipc code assigned before grant |
Ipc: G01M 13/00 20060101ALI20160506BHEP Ipc: G01P 3/44 20060101ALI20160506BHEP Ipc: G06F 7/06 20060101ALI20160506BHEP Ipc: G01H 1/00 20060101AFI20160506BHEP |
|
| RA4 | Supplementary search report drawn up and despatched (corrected) |
Effective date: 20160916 |
|
| RIC1 | Information provided on ipc code assigned before grant |
Ipc: G01P 3/44 20060101ALI20160912BHEP Ipc: G01M 13/00 20060101ALI20160912BHEP Ipc: G01H 1/00 20060101AFI20160912BHEP Ipc: G06F 7/06 20060101ALI20160912BHEP |
|
| STAA | Information on the status of an ep patent application or granted ep patent |
Free format text: STATUS: EXAMINATION IS IN PROGRESS |
|
| 17Q | First examination report despatched |
Effective date: 20180417 |
|
| GRAP | Despatch of communication of intention to grant a patent |
Free format text: ORIGINAL CODE: EPIDOSNIGR1 |
|
| STAA | Information on the status of an ep patent application or granted ep patent |
Free format text: STATUS: GRANT OF PATENT IS INTENDED |
|
| INTG | Intention to grant announced |
Effective date: 20191022 |
|
| RIN1 | Information on inventor provided before grant (corrected) |
Inventor name: HEDIN, LARS-OLOV ELIS |
|
| GRAJ | Information related to disapproval of communication of intention to grant by the applicant or resumption of examination proceedings by the epo deleted |
Free format text: ORIGINAL CODE: EPIDOSDIGR1 |
|
| STAA | Information on the status of an ep patent application or granted ep patent |
Free format text: STATUS: EXAMINATION IS IN PROGRESS |
|
| INTC | Intention to grant announced (deleted) | ||
| GRAJ | Information related to disapproval of communication of intention to grant by the applicant or resumption of examination proceedings by the epo deleted |
Free format text: ORIGINAL CODE: EPIDOSDIGR1 |
|
| GRAP | Despatch of communication of intention to grant a patent |
Free format text: ORIGINAL CODE: EPIDOSNIGR1 |
|
| GRAR | Information related to intention to grant a patent recorded |
Free format text: ORIGINAL CODE: EPIDOSNIGR71 |
|
| GRAS | Grant fee paid |
Free format text: ORIGINAL CODE: EPIDOSNIGR3 |
|
| STAA | Information on the status of an ep patent application or granted ep patent |
Free format text: STATUS: GRANT OF PATENT IS INTENDED |
|
| GRAA | (expected) grant |
Free format text: ORIGINAL CODE: 0009210 |
|
| STAA | Information on the status of an ep patent application or granted ep patent |
Free format text: STATUS: THE PATENT HAS BEEN GRANTED |
|
| AK | Designated contracting states |
Kind code of ref document: B1 Designated state(s): AL AT BE BG CH CY CZ DE DK EE ES FI FR GB GR HR HU IE IS IT LI LT LU LV MC MK MT NL NO PL PT RO RS SE SI SK SM TR |
|
| INTG | Intention to grant announced |
Effective date: 20200429 |
|
| REG | Reference to a national code |
Ref country code: GB Ref legal event code: FG4D |
|
| GRAT | Correction requested after decision to grant or after decision to maintain patent in amended form |
Free format text: ORIGINAL CODE: EPIDOSNCDEC |
|
| REG | Reference to a national code |
Ref country code: CH Ref legal event code: EP Ref country code: AT Ref legal event code: REF Ref document number: 1277488 Country of ref document: AT Kind code of ref document: T Effective date: 20200615 |
|
| REG | Reference to a national code |
Ref country code: DE Ref legal event code: R096 Ref document number: 602013069679 Country of ref document: DE |
|
| REG | Reference to a national code |
Ref country code: CH Ref legal event code: PK Free format text: BERICHTIGUNGEN |
|
| RIN2 | Information on inventor provided after grant (corrected) |
Inventor name: HEDIN, LARS-OLOV ELIS |
|
| RAP2 | Party data changed (patent owner data changed or rights of a patent transferred) |
Owner name: S.P.M. INSTRUMENT AB |
|
| REG | Reference to a national code |
Ref country code: CH Ref legal event code: PK Free format text: BERICHTIGUNG B8 |
|
| REG | Reference to a national code |
Ref country code: DE Ref legal event code: R081 Ref document number: 602013069679 Country of ref document: DE Owner name: S.P.M. INSTRUMENT AB, SE Free format text: FORMER OWNER: SPM INSTRUMENT AB, STRAENGNAES, SE |
|
| REG | Reference to a national code |
Ref country code: DE Ref legal event code: R083 Ref document number: 602013069679 Country of ref document: DE |
|
| REG | Reference to a national code |
Ref country code: LT Ref legal event code: MG4D |
|
| PG25 | Lapsed in a contracting state [announced via postgrant information from national office to epo] |
Ref country code: FI Free format text: LAPSE BECAUSE OF FAILURE TO SUBMIT A TRANSLATION OF THE DESCRIPTION OR TO PAY THE FEE WITHIN THE PRESCRIBED TIME-LIMIT Effective date: 20200603 Ref country code: NO Free format text: LAPSE BECAUSE OF FAILURE TO SUBMIT A TRANSLATION OF THE DESCRIPTION OR TO PAY THE FEE WITHIN THE PRESCRIBED TIME-LIMIT Effective date: 20200903 Ref country code: GR Free format text: LAPSE BECAUSE OF FAILURE TO SUBMIT A TRANSLATION OF THE DESCRIPTION OR TO PAY THE FEE WITHIN THE PRESCRIBED TIME-LIMIT Effective date: 20200904 Ref country code: SE Free format text: LAPSE BECAUSE OF FAILURE TO SUBMIT A TRANSLATION OF THE DESCRIPTION OR TO PAY THE FEE WITHIN THE PRESCRIBED TIME-LIMIT Effective date: 20200603 Ref country code: LT Free format text: LAPSE BECAUSE OF FAILURE TO SUBMIT A TRANSLATION OF THE DESCRIPTION OR TO PAY THE FEE WITHIN THE PRESCRIBED TIME-LIMIT Effective date: 20200603 |
|
| REG | Reference to a national code |
Ref country code: NL Ref legal event code: MP Effective date: 20200603 |
|
| PG25 | Lapsed in a contracting state [announced via postgrant information from national office to epo] |
Ref country code: BG Free format text: LAPSE BECAUSE OF FAILURE TO SUBMIT A TRANSLATION OF THE DESCRIPTION OR TO PAY THE FEE WITHIN THE PRESCRIBED TIME-LIMIT Effective date: 20200903 Ref country code: HR Free format text: LAPSE BECAUSE OF FAILURE TO SUBMIT A TRANSLATION OF THE DESCRIPTION OR TO PAY THE FEE WITHIN THE PRESCRIBED TIME-LIMIT Effective date: 20200603 Ref country code: LV Free format text: LAPSE BECAUSE OF FAILURE TO SUBMIT A TRANSLATION OF THE DESCRIPTION OR TO PAY THE FEE WITHIN THE PRESCRIBED TIME-LIMIT Effective date: 20200603 Ref country code: RS Free format text: LAPSE BECAUSE OF FAILURE TO SUBMIT A TRANSLATION OF THE DESCRIPTION OR TO PAY THE FEE WITHIN THE PRESCRIBED TIME-LIMIT Effective date: 20200603 |
|
| REG | Reference to a national code |
Ref country code: AT Ref legal event code: MK05 Ref document number: 1277488 Country of ref document: AT Kind code of ref document: T Effective date: 20200603 |
|
| PG25 | Lapsed in a contracting state [announced via postgrant information from national office to epo] |
Ref country code: AL Free format text: LAPSE BECAUSE OF FAILURE TO SUBMIT A TRANSLATION OF THE DESCRIPTION OR TO PAY THE FEE WITHIN THE PRESCRIBED TIME-LIMIT Effective date: 20200603 Ref country code: NL Free format text: LAPSE BECAUSE OF FAILURE TO SUBMIT A TRANSLATION OF THE DESCRIPTION OR TO PAY THE FEE WITHIN THE PRESCRIBED TIME-LIMIT Effective date: 20200603 |
|
| PG25 | Lapsed in a contracting state [announced via postgrant information from national office to epo] |
Ref country code: AT Free format text: LAPSE BECAUSE OF FAILURE TO SUBMIT A TRANSLATION OF THE DESCRIPTION OR TO PAY THE FEE WITHIN THE PRESCRIBED TIME-LIMIT Effective date: 20200603 Ref country code: ES Free format text: LAPSE BECAUSE OF FAILURE TO SUBMIT A TRANSLATION OF THE DESCRIPTION OR TO PAY THE FEE WITHIN THE PRESCRIBED TIME-LIMIT Effective date: 20200603 Ref country code: RO Free format text: LAPSE BECAUSE OF FAILURE TO SUBMIT A TRANSLATION OF THE DESCRIPTION OR TO PAY THE FEE WITHIN THE PRESCRIBED TIME-LIMIT Effective date: 20200603 Ref country code: IT Free format text: LAPSE BECAUSE OF FAILURE TO SUBMIT A TRANSLATION OF THE DESCRIPTION OR TO PAY THE FEE WITHIN THE PRESCRIBED TIME-LIMIT Effective date: 20200603 Ref country code: CZ Free format text: LAPSE BECAUSE OF FAILURE TO SUBMIT A TRANSLATION OF THE DESCRIPTION OR TO PAY THE FEE WITHIN THE PRESCRIBED TIME-LIMIT Effective date: 20200603 Ref country code: PT Free format text: LAPSE BECAUSE OF FAILURE TO SUBMIT A TRANSLATION OF THE DESCRIPTION OR TO PAY THE FEE WITHIN THE PRESCRIBED TIME-LIMIT Effective date: 20201006 Ref country code: EE Free format text: LAPSE BECAUSE OF FAILURE TO SUBMIT A TRANSLATION OF THE DESCRIPTION OR TO PAY THE FEE WITHIN THE PRESCRIBED TIME-LIMIT Effective date: 20200603 Ref country code: SM Free format text: LAPSE BECAUSE OF FAILURE TO SUBMIT A TRANSLATION OF THE DESCRIPTION OR TO PAY THE FEE WITHIN THE PRESCRIBED TIME-LIMIT Effective date: 20200603 |
|
| PG25 | Lapsed in a contracting state [announced via postgrant information from national office to epo] |
Ref country code: PL Free format text: LAPSE BECAUSE OF FAILURE TO SUBMIT A TRANSLATION OF THE DESCRIPTION OR TO PAY THE FEE WITHIN THE PRESCRIBED TIME-LIMIT Effective date: 20200603 Ref country code: SK Free format text: LAPSE BECAUSE OF FAILURE TO SUBMIT A TRANSLATION OF THE DESCRIPTION OR TO PAY THE FEE WITHIN THE PRESCRIBED TIME-LIMIT Effective date: 20200603 Ref country code: IS Free format text: LAPSE BECAUSE OF FAILURE TO SUBMIT A TRANSLATION OF THE DESCRIPTION OR TO PAY THE FEE WITHIN THE PRESCRIBED TIME-LIMIT Effective date: 20201003 |
|
| REG | Reference to a national code |
Ref country code: DE Ref legal event code: R097 Ref document number: 602013069679 Country of ref document: DE |
|
| PLBE | No opposition filed within time limit |
Free format text: ORIGINAL CODE: 0009261 |
|
| STAA | Information on the status of an ep patent application or granted ep patent |
Free format text: STATUS: NO OPPOSITION FILED WITHIN TIME LIMIT |
|
| PG25 | Lapsed in a contracting state [announced via postgrant information from national office to epo] |
Ref country code: MC Free format text: LAPSE BECAUSE OF FAILURE TO SUBMIT A TRANSLATION OF THE DESCRIPTION OR TO PAY THE FEE WITHIN THE PRESCRIBED TIME-LIMIT Effective date: 20200603 Ref country code: DK Free format text: LAPSE BECAUSE OF FAILURE TO SUBMIT A TRANSLATION OF THE DESCRIPTION OR TO PAY THE FEE WITHIN THE PRESCRIBED TIME-LIMIT Effective date: 20200603 |
|
| REG | Reference to a national code |
Ref country code: CH Ref legal event code: PL |
|
| 26N | No opposition filed |
Effective date: 20210304 |
|
| PG25 | Lapsed in a contracting state [announced via postgrant information from national office to epo] |
Ref country code: SI Free format text: LAPSE BECAUSE OF FAILURE TO SUBMIT A TRANSLATION OF THE DESCRIPTION OR TO PAY THE FEE WITHIN THE PRESCRIBED TIME-LIMIT Effective date: 20200603 |
|
| REG | Reference to a national code |
Ref country code: BE Ref legal event code: MM Effective date: 20200930 |
|
| PG25 | Lapsed in a contracting state [announced via postgrant information from national office to epo] |
Ref country code: LU Free format text: LAPSE BECAUSE OF NON-PAYMENT OF DUE FEES Effective date: 20200911 |
|
| PG25 | Lapsed in a contracting state [announced via postgrant information from national office to epo] |
Ref country code: FR Free format text: LAPSE BECAUSE OF NON-PAYMENT OF DUE FEES Effective date: 20200930 |
|
| PG25 | Lapsed in a contracting state [announced via postgrant information from national office to epo] |
Ref country code: IE Free format text: LAPSE BECAUSE OF NON-PAYMENT OF DUE FEES Effective date: 20200911 Ref country code: LI Free format text: LAPSE BECAUSE OF NON-PAYMENT OF DUE FEES Effective date: 20200930 Ref country code: CH Free format text: LAPSE BECAUSE OF NON-PAYMENT OF DUE FEES Effective date: 20200930 Ref country code: BE Free format text: LAPSE BECAUSE OF NON-PAYMENT OF DUE FEES Effective date: 20200930 |
|
| PG25 | Lapsed in a contracting state [announced via postgrant information from national office to epo] |
Ref country code: TR Free format text: LAPSE BECAUSE OF FAILURE TO SUBMIT A TRANSLATION OF THE DESCRIPTION OR TO PAY THE FEE WITHIN THE PRESCRIBED TIME-LIMIT Effective date: 20200603 Ref country code: MT Free format text: LAPSE BECAUSE OF FAILURE TO SUBMIT A TRANSLATION OF THE DESCRIPTION OR TO PAY THE FEE WITHIN THE PRESCRIBED TIME-LIMIT Effective date: 20200603 Ref country code: CY Free format text: LAPSE BECAUSE OF FAILURE TO SUBMIT A TRANSLATION OF THE DESCRIPTION OR TO PAY THE FEE WITHIN THE PRESCRIBED TIME-LIMIT Effective date: 20200603 |
|
| PG25 | Lapsed in a contracting state [announced via postgrant information from national office to epo] |
Ref country code: MK Free format text: LAPSE BECAUSE OF FAILURE TO SUBMIT A TRANSLATION OF THE DESCRIPTION OR TO PAY THE FEE WITHIN THE PRESCRIBED TIME-LIMIT Effective date: 20200603 |
|
| P01 | Opt-out of the competence of the unified patent court (upc) registered |
Effective date: 20230523 |
|
| PGFP | Annual fee paid to national office [announced via postgrant information from national office to epo] |
Ref country code: DE Payment date: 20250820 Year of fee payment: 13 |
|
| PGFP | Annual fee paid to national office [announced via postgrant information from national office to epo] |
Ref country code: GB Payment date: 20250716 Year of fee payment: 13 |