EP2843875A1 - Détermination et utilisation de mesures de performance de liaison - Google Patents
Détermination et utilisation de mesures de performance de liaison Download PDFInfo
- Publication number
- EP2843875A1 EP2843875A1 EP13250099.2A EP13250099A EP2843875A1 EP 2843875 A1 EP2843875 A1 EP 2843875A1 EP 13250099 A EP13250099 A EP 13250099A EP 2843875 A1 EP2843875 A1 EP 2843875A1
- Authority
- EP
- European Patent Office
- Prior art keywords
- network
- data
- link
- path
- performance
- Prior art date
- Legal status (The legal status is an assumption and is not a legal conclusion. Google has not performed a legal analysis and makes no representation as to the accuracy of the status listed.)
- Ceased
Links
Images

Classifications
-
- H—ELECTRICITY
- H04—ELECTRIC COMMUNICATION TECHNIQUE
- H04L—TRANSMISSION OF DIGITAL INFORMATION, e.g. TELEGRAPHIC COMMUNICATION
- H04L45/00—Routing or path finding of packets in data switching networks
- H04L45/12—Shortest path evaluation
- H04L45/123—Evaluation of link metrics
-
- H—ELECTRICITY
- H04—ELECTRIC COMMUNICATION TECHNIQUE
- H04L—TRANSMISSION OF DIGITAL INFORMATION, e.g. TELEGRAPHIC COMMUNICATION
- H04L41/00—Arrangements for maintenance, administration or management of data switching networks, e.g. of packet switching networks
- H04L41/14—Network analysis or design
- H04L41/142—Network analysis or design using statistical or mathematical methods
-
- H—ELECTRICITY
- H04—ELECTRIC COMMUNICATION TECHNIQUE
- H04L—TRANSMISSION OF DIGITAL INFORMATION, e.g. TELEGRAPHIC COMMUNICATION
- H04L41/00—Arrangements for maintenance, administration or management of data switching networks, e.g. of packet switching networks
- H04L41/16—Arrangements for maintenance, administration or management of data switching networks, e.g. of packet switching networks using machine learning or artificial intelligence
-
- H—ELECTRICITY
- H04—ELECTRIC COMMUNICATION TECHNIQUE
- H04L—TRANSMISSION OF DIGITAL INFORMATION, e.g. TELEGRAPHIC COMMUNICATION
- H04L45/00—Routing or path finding of packets in data switching networks
- H04L45/302—Route determination based on requested QoS
-
- H—ELECTRICITY
- H04—ELECTRIC COMMUNICATION TECHNIQUE
- H04L—TRANSMISSION OF DIGITAL INFORMATION, e.g. TELEGRAPHIC COMMUNICATION
- H04L45/00—Routing or path finding of packets in data switching networks
- H04L45/70—Routing based on monitoring results
-
- H—ELECTRICITY
- H04—ELECTRIC COMMUNICATION TECHNIQUE
- H04L—TRANSMISSION OF DIGITAL INFORMATION, e.g. TELEGRAPHIC COMMUNICATION
- H04L47/00—Traffic control in data switching networks
- H04L47/10—Flow control; Congestion control
- H04L47/20—Traffic policing
-
- H—ELECTRICITY
- H04—ELECTRIC COMMUNICATION TECHNIQUE
- H04L—TRANSMISSION OF DIGITAL INFORMATION, e.g. TELEGRAPHIC COMMUNICATION
- H04L41/00—Arrangements for maintenance, administration or management of data switching networks, e.g. of packet switching networks
- H04L41/14—Network analysis or design
- H04L41/147—Network analysis or design for predicting network behaviour
Definitions
- the present invention relates to methods and apparatus for determining link performance measures in respect of communication links in a data communication network, where the network comprises a plurality of data forwarding nodes each capable of forwarding data along a plurality of communication links. Further aspects of the present invention relate to the use of link performance measures in relation to decisions regarding the routing and/or re-routing of data in a network, and in relation to determining measures indicative of expected quality of experience in respect of data traversing end-to-end paths across a network.
- end-to-end performance of services delivered across a network may be important, and various ways in which good or poor end-to-end performance may manifest itself and be monitored or perceived by end-users.
- Various factors may affect end-to-end performance, including the performance of an end-user's own local network or a computing device therein, but unsatisfactory end-to-end performance in respect of a service is often caused by links on the route that carries the service across a network, the choice of which is generally not under the control of the end-user.
- SLA service-level agreement
- end-users of the service are likely to perceive that they have experienced poor performance. Poor performance can manifest itself, for example, as drop-outs in a video service, as poor voice-quality in a Voice-over- Internet Protocol (VoIP) call, as slow response behaviour in an application running on a remote server, etc.
- SLA parameters e.g. delay, jitter, packet loss etc.
- video content with rapid scene changes generally requires a higher bit-rate to achieve the same quality of perception as video content with little movement.
- QoS Quality of Service
- QoE Quality of Experience
- SLA parameters may be too lenient for good QoE, possibly having been selected mainly out of cost considerations.
- Real-time collection of per-link performance metrics from the network might be a challenge.
- many services may be transmitted over one link, the theoretical link capacity of which should be able to sustain all of the services, but fluctuating data rates may result in them competing with each other for capacity at certain times, leading to a poor end-to-end performance for some or all of them.
- One or more links on a route may thus be insufficient for delivering good end-to-end performance of a service.
- a network operator may have access to network performance metrics per link in real-time, and may use these, but such real-time "per link" network performance metrics are not always available, and even if they are, they might be spurious or poorly understood.
- routing is done according to standard protocols based simply on minimising hop-count, it may not be possible to pick links that can guarantee an SLA.
- a paper entitled “QoE Content Distribution Network for Cloud Architecture” by Hai Anh Tran, Abdelhamid Mellouk and Said Hoceini (First International Symposium on Network Cloud Computing and Applications (NCCA), November 2011) relates to "cloud” services and their increasing use in the provision of network services. Due to the high bandwidth requirements of cloud services, use may be made of Content Distribution Networks (CDNs), which may support high request volume and improve network quality using a mechanism based on replication of information among multiple servers.
- CDNs Content Distribution Networks
- the paper proposes a Content Distribution Network Cloud Architecture, which based not just on Quality of Service criteria (such as round trip time, network hops, loss rate, etc.) but also on the Quality of Experience that represents end-users perception and satisfaction.
- QoE scores may be used in combination with QoS parameters to compute a link score or link cost that can be used in a routing function, describing how QoE values can be sent back along the route data packets have travelled and how link scores may be updates via a known method called "Q-Learning".
- Past techniques for predicting link failures and link QoS degradation have generally required real-time link performance metrics, such as those from a Management Information Base (MIB) of routers, to determine these weak links.
- MIB Management Information Base
- International application WO 2012/085498 relates to communications network management, and in particular to a communications network which is divided into a plurality of segments, each segment comprising one or more routers and one or more communications links that connect the routers.
- QoS thresholds can be defined for each of the segments, and if it is predicted that one of these thresholds is to be breached in one of the segments, for example due to a communications link or a router being overloaded, then a segment management module associated with that segment can re-route the traffic.
- International application WO 2012/085519 also relates to communications network management and to a communications network which is divided into a plurality of segments, each segment comprising one or more routers and one or more communications links that connect the routers.
- each segment also comprises a segment management module.
- Each of the segment management modules reports to a supervisory management module (of which the network may have more than one). If a segment management module predicts that a QoS threshold will be breached, it may re-route a data flow within that segment. If such a re-route is not possible, a request may be sent to the appropriate supervisory management module to initiate a re-routing to a further segment.
- International application WO 2011/117570498 relates to a technique for network routing adaptation based on failure prediction, and in particular to a system that predicts network events and triggers a pre-emptive response, and aims to predict network link failures and create a change in the network before the failure actually happens by instigating policy-based adjustment of routing parameters.
- An example implementation operates in two phases. In the first phase, the historical operation of a network is observed, to determine observed relationships between link or cluster failures that have occurred, and subsequent failures of different links or clusters. From these observed relationships, failure rules can be derived that are then applied to control routing in the network during a control phase.
- the derived failure rules are applied such that if a link or cluster failure occurs, then from the rules a prior knowledge of what additional links may fail in the next time period is obtained, and remedial action can be taken such as routing data traffic away from the links that are predicted to fail.
- MIB parameters are available in real-time to the decision-making unit. Such parameters may not be available, however, or may be difficult to obtain and/or keep "concurrent" (i.e. updated appropriately by all instances). For instance, reported metrics can be out-of-date and/or not synchronised with reports from neighbouring routers (due to possible randomness in report generation as well as lags in polling or delays/errors incurred in the network while transmitting such traps to the decision-making unit). It might also generate management traffic loads from all intermediate routers that the operator might find undesirable.
- a method of determining link performance measures in respect of communication links in a data communication network comprising a plurality of data forwarding nodes each capable of forwarding data along a plurality of communication links, the method comprising:
- the route information may be obtained from a route information database.
- the route information may be obtained from data units that are intended to traverse, are traversing, or have traversed a path across the network.
- the step of receiving end-to-end path performance measures may comprise receiving end-to-end path performance measures from one or more data-sending network nodes and/or from one or more data-receiving network-nodes.
- the received end-to-end path performance measures may comprise objective performance measures made in respect of characteristics indicative of network performance on the end-to-end path.
- the received end-to-end path performance measures may comprise subjective performance measures made in respect of characteristics indicative of network performance on the end-to-end path.
- the data traversing the network may have one of a plurality of categories associated therewith, and the step of determining one or more link performance measures may comprise identifying end-to-end path performance measures received in respect of data of one or more categories that is traversing the network, and determining, in dependence on end-to-end path performance measures received in respect of data of said one or more categories traversing a plurality of end-to-end paths having at least one link in common, and on the basis of route information identifying the links of which those end-to-end paths are comprised, one or more category-specific link performance measures, the or each category-specific link performance measure relating to performance in respect of said one or more categories of a link of which at least one of those end-to-end paths is comprised.
- the categories with which data traversing the network are associated may include one or more categories such as class of service, type of service, or others.
- the data forwarding nodes are nodes such as routers, capable of implementing routing decisions whereby to forward data units via any of a plurality of links.
- routing decisions may be made by processors at the nodes themselves according to predetermined rules, based on information received about the performance of the network and/or of links and other nodes, for example, or may be made by one or more other entities and communicated to the nodes in order to be implemented by them.
- Methods according to preferred embodiments do not require real-time link performance metrics, such as those from the Management Information Base (MIB) of routers.
- MIB Management Information Base
- Methods according to preferred embodiments may be used by network operators for example, who may use them to identify poorly performing links in a network, for example. This may be done reactively and/or predictively, with traffic being re-routed around links found to have performed or be performing poorly, or around links predicted to perform poorly (in the future generally, or at specific times of day, for example).
- Methods according to preferred embodiments may be used for the identification of one or more links having a link performance measure indicative of performance below a predetermined threshold, in which case routing rules may then be updated allowing routing decisions to be taken such as to route data along other links, rather than those deemed to be poorly-performing or "weak" links.
- Alternative embodiments may be used for the identification of one or more links having a link performance measure indicative of performance above a predetermined threshold, in which case routing rules may then be updated allowing routing decisions to be taken such as to route data along those deemed to be high-performing or "strong" links, rather than other links.
- Methods according to preferred embodiments may determine link performance measures based on end-to-end route performance measures such as perception scores, which may also be used to determine measures of overall quality of experience.
- end-to-end route performance measures such as perception scores
- end-to-end perception scores may be received from the client-side.
- data is video content
- end-to-end perception scores indicative of user-rated perceived video quality may be used.
- weak links may be determined.
- Such techniques may be applicable in scenarios where real-time performance metrics may be inaccessible for constant retrieval but can be collected in batches (say, overnight) instead. In such scenarios, prior art techniques may be inapplicable as they may require access to link performance metrics to make real-time routing decisions.
- Methods according to preferred embodiments may be used to identify links that are responsible for poor end-to-end QoE without directly measuring individual link performance and relating it to an end-to-end performance measure.
- a network management system using techniques such as the above may identify weak links over time that are responsible for poor end-to-end service performance and ensure that they are less likely to be selected or are not selected for routes in the future. This can lead to route choices that better support a desired end-to-end service performance level.
- a method of deriving or updating routing rules in dependence on which routing decisions may be implemented by data forwarding nodes in a network comprising determining one or more link performance measures in respect of one or more communication links in a data communication network using a method according to the first aspect, and deriving or updating routing rules in dependence on the one or more link performance measures so-determined.
- link performance measures determined using methods according to the first aspect may be used to derive or update routing rules in dependence on which routing decisions may be implemented by data forwarding nodes in a network.
- the routing rules may be for use by processors at the nodes themselves, for example, or may be for use by one or more other entities, with routing decisions made using those rules being communicated to the nodes in order to be implemented by them.
- a measure indicative of expected quality of experience in respect of data traversing an end-to-end path across a network comprising a plurality of communication links which together form a path via which data may traverse the network from a data-sending network-node to a data-receiving network-node, the method comprising:
- link performance measures determined using methods according to the first aspect may be used to determine measures indicative of expected quality of experience in respect of data traversing an end-to-end path across a network.
- measures indicative of expected quality of experience may themselves be used to make routing decisions, for example.
- apparatus for determining link performance measures in respect of communication links in a data communication network comprising a plurality of data forwarding nodes each capable of forwarding data along a plurality of communication links, the apparatus comprising:
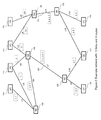
- FIG. 1 is a system diagram illustrating the principal types of entities which may be involved in performing route analysis according to a preferred embodiment. It shows a network 100, which may be the Internet, a core network, or a part thereof, for example. It shows three service hosts 110 (each labelled "H"), which are connected to (and are thus able to send data to and/or receive data from) three end-user clients 130 (each labelled "U") via the network 100.
- the network 100 is shown as having three intermediate forwarding nodes or routers 120 (each labelled "N") connected by network links 125.
- Figure 1 Only a few service hosts 110 and end-user clients 130 are shown in Figure 1 , and for simplicity the network 100 is shown with only a few forwarding nodes or routers 120 and a few links 125.
- Figure 2 which will be discussed in more detail later, illustrates how even with only a few entities involved, there may be several routes for the provision of networked services by hosts to clients, and that these routes may share some or all of the links of which they are comprised with other routes. It will be understood that the aim of Figure 1 is mainly to indicate the types of entities which may be involved, and that a core network would in general have many more routers and links that are shown in Figures 1 and 2 .
- Figure 1 also shows a link performance analysis system 10.
- This has an input 12, an analysis module 14 and an output 16.
- the input is in communication (via the network 100, via another network, or otherwise - possible communication lines are indicated by dotted lines) with some or all of the end-user network nodes 110,130, and is thereby able to receive information from them, including path performance measures (as will be discussed in more detail later).
- it may receive path performance measures only from data-receiving end-user network nodes (such as end-user clients 130), while in others, it may receive path performance measures only from data-sending end-user network nodes (such as service hosts 110), but in general, it may receive path performance measures from data-receiving and data-sending end-user network nodes.
- path performance measures received at the input 12 of the link performance analysis system 10 are passed to an analysis module 14, which has access to a route database 18.
- the route database 18 may be a part of the link performance analysis system 10, or it may be an external database with which the analysis module 14 of the link performance analysis system 10 may communicate (via the network 100, via another network, or otherwise). It is able to provide route information in respect of particular end-to-end paths between particular data-sending and data-receiving end-user network nodes, and/or in respect of particular network services provided by particular data-sending nodes to particular data-receiving nodes, the route information identifying the links of which those end-to-end paths are comprised.
- the route information in the route database may be updated in response to information received about faults, link performance, topology changes, and other factors which may affect the route that data may take across the network.
- route information need not be provided from a single dedicated route database.
- the route information may instead be obtained from a distributed route database, from network nodes (possibly via Link State Advertisement (LSA) or other messages), from data units that are intended to traverse, are traversing, or have traversed a path across the network 100, or in other ways.
- LSA Link State Advertisement
- Such information may thus be provided to the system 10 by the data units in question or others, or by network nodes that have sent, forwarded or received data units, the route information being provided directly or via one or more route databases, for example.
- the analysis module 14 is arranged to process the received path performance measures together with route information, and to determine, in dependence on path performance measures received in respect of end-to-end paths having at least one link in common together with route information identifying the links of which those end-to-end paths are comprised, link performance measures, the link performance measures relating to links of which those end-to-end paths are comprised.
- Link performance measures determined by the analysis unit 14 are then provided to an output 16 of the link performance analysis system 10, which may provide them to a unit 20 such as a route manager, to allow the link performance measures to be taken into account in further routing decisions, and/or to a diagnosis unit for further diagnostic analysis.
- the route manager and/or diagnosis unit 20 may be a part of the system 10, or may be separate, and may be distributed or centralised.
- link performance measures determined by the system 10 are to be taken into account in further routing decisions
- information concerning the link performance measures, updated routing tables or routing decisions may need to be provided to network nodes such as data-sending network nodes (service hosts 110, for example), intermediate network nodes (forwarding nodes or routers 120, for example) or other network entities such as nodes holding routing databases. Connectivity back into the network for such purposes is not shown in Figure 1 in order to avoid this becoming unnecessarily cluttered, but it will be understood that there are several possible options for doing this.
- a network (which in general would have many more nodes than network 100 as shown in Figure 1 ) carries a multitude of end-to-end services. These services can include video streams, VOIP calls, interactive applications, multiplayer games, etc.
- a link performance analysis system 10 which will generally be referred to as a route analyser 10.
- the primary measure that is computed by the route analyser 10 in respect of each of a plurality of links in the network order to identify weak links is a link performance measure D L .
- a D L value of 1 means that the given link is only part of routes that currently have optimal end-to-end performance (or performance above a threshold regarded as "good” or "acceptable", for example).
- a D L value of 0 means that the link is part of one or more routes that are suffering from poor end-to-end performance.
- link performance measures so-determined may be provided to data senders and/or to routers and other network nodes responsible for forwarding data, to a unit 20 such as a route manager which may use them in order to determine how to route or re-route data (communicating its decisions to senders and forwarding nodes as applicable), and/or to a diagnosis unit for further analysis, for example.
- a unit 20 such as a route manager which may use them in order to determine how to route or re-route data (communicating its decisions to senders and forwarding nodes as applicable), and/or to a diagnosis unit for further analysis, for example.
- link performance measures determined according to some embodiments may be used predictively, rather than for immediate or direct use in routing or re-routing, however.
- D L may be calculated in the following manner, a detailed process for which will be described later with reference to Figure 3 .
- route analyser 10 uses route analyser 10 to compute D L for the links in the network:
- inputs of the first type are computed or otherwise determined on the client side, and indicate a measure of the overall quality of experience from the point of view of data-receiving end-user clients 130.
- This measure can be purely objective, or can take into account subjective factors that reflect the perception of the end-user. Measures can be, for example, subjective quality of perception for video streams, pixilation of videos, number of dropped frames in the content per time interval, voice quality of VOIP calls, and application performance like end-to-end response time. Note that these are all examples of end-to-end performance measures, subjective or otherwise. Purely subjective measures can be, for example, user feedback on a scale of 1 to 10, 1 meaning poor and 10 meaning excellent.
- end-to-end performance measures may be determined or computed in a variety of different ways. In this example, however the measure is obtained, it will be assumed that it provides a number which can be normalised such that 0 represents poor (or otherwise unacceptable) performance and 1 represents excellent (or otherwise acceptable) performance.
- This end-to-end quality measure will henceforth be referred to as E S,U for a given service S, reported by an end-user client U that consumes this service.
- the clients 130 regularly or frequently report their E S,U measure or measures to the route analyser 10. They may communicate directly with the route analyser.
- the E S,U measures may reflect performance from the point of view of the service hosts 110 as well as or instead of performance from the point of view of the clients 130. If it is desired that the measure should take into account performance from the point of view of service hosts 110 and clients 130, to make the measure dependent on parameters observed by both, both may communicate directly with the route analyser 10. Alternatively, for example, the clients 130 may feed their data back to the service hosts 110, who may include their data into a combined measure before providing this to the route analyser 10. This may allow service hosts providing a service to multiple clients to determine a performance measure in respect of multiple clients. The service host may combine the values received from clients on a "per client" and/or on a "per time period" basis.
- a suitable summarisation would be, for example, to compute averages per client every 5 minutes and to store the averages for a moving 24 hour time window.
- the reporting entity be it the service hosts or the clients, would in general decide upon an aggregation method and reporting interval. For example, reporting of an average or minimum E S,U could be done at the end of a service to characterise the performance for the duration of the service.
- the route analyser 10 maintains a table with the following information, based on information received from service hosts H1, H2 and H3: Table 1: Table T E-2-E of end-to-end performance values maintained by a service host Service host Application Type Class of Service End-User Client Time E S,U H1 Video stream EF U1 23/11/2012 10.55 0.67 H1 Video stream EF U1 23/11/2012 11.00 0.56 H2 Database Access AF U2 23/11/2012 08.00 0.98 H3 Video stream EF U3 23/11/2012 08.00 0.34 ... ... ... ...
- the route analyser 10 receives the hop-by-hop route of the service S in question within the network from the ingress point to the egress point.
- This can be obtained in a number of ways, depending on the protocol stack used by the application. For example, it can be obtained from resource reservation protocols such as RSVP.
- RSVP resource reservation protocols
- the end-to-end route within the network can be obtained from the protocol itself as it supports a topology map of the network and associated link costs.
- these routes can be known in advance.
- routing information for the multicast trees can be obtained from the respective routers' Tree Information Base (TIB).
- TIB Tree Information Base
- E S,U and R S,U data is consumed by the route analyser 10.
- This entity can rest anywhere in the network including at ingress routers, at service hosts or as a dedicated unit.
- the route analyser 10 can correlate the T E-2-E tables with the route information for the services shown in the table to compute average E S,U values per route.
- average E S,U values can be computed per route (i.e. for each Service Host: End-User Client combination), per class of service / type of service / time of day, or sub-combinations thereof.
- D L is computed as follows. If a link is part of a route, it is assigned the E S,U value reported for this route. If the link is part of only one route, this becomes its D L value. If the link is part of more than one route, its D L value is the average of the E S,U scores of all of these routes. For example, if link L is part of three different routes, the services on which have E S,U values of 0.3, 0.7 and 0.8 respectively, the D L value for link L is 0.6. Links in respect of which no E S,U value or route information is known may have their D L value initialised to 1.0 by default. Evidently this is a trusting approach where links are not negatively impacted if there is no information about them.
- D L values can also be grouped by application type or Class of Service ("CoS"), resulting in a vector of D L values per link.
- CoS Class of Service
- the average calculated over the number of routes supported by L can be computed as a weighted average to differentiate in importance between the routes and the services they support.
- the route E S,U value can also be weighted by the number of clients consuming the service(s) on this route.
- the update of a D L value can be done as a smoothed average over time, combining new information with the old average, to avoid rapid changes.
- a network may support various classes of service. In such scenarios, it may be appropriate to incorporate information about these into the computation of D L in different ways, either to produce individual D L values for the different classes, or to produce combined DL values reflecting the overall performance of links for the data of the various classes they are carrying. As mentioned above, it would be possible to have a vector of D L values for the multiple classes of service. Using the score for routing purposes (as will be discussed later) then means that the network may also have an awareness of available traffic bandwidth in each class of service on a link L to avoid sending a high bandwidth of traffic through the link based on a high D L value which might result in a see-saw effect of decreasing the D L value due to subsequent congestion.
- one other possible implementation is to combine the vector of D L values into a single value by giving weighting factors to each of the classes of service and using this to compute a single D L value.
- Factors to take into account in assigning these weighting factors for link L could include: bandwidth availability for the CoS in the link L (related to queue management policies in its associated routers) and importance of that particular CoS to the operator. For example, EF/AF traffic (i.e. "Expedited Forwarding" and "Assured Forwarding”) could be considered to be more important than DE traffic (“Default").
- D L values may be determined. It will be noted that while this is a possible method to compute D L values, this method can be replaced by a variety of others, subject to the necessary network knowledge being available. It will also be noted that other types of link performance measures may be determined instead. A detailed description of how another such type of link performance measure may be determined will be given later with reference to Figure 4 .
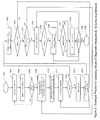
- an algorithm to update the D L values for all links may be invoked periodically by the route analyser 10 to update D L values in respect of some or all of the links 125 in the network 100. It begins in step s300 and first runs a loop (s302 - s306) where counters temp_L and count_L are initialised to zero (s304) for each link L in the current link set LS.
- the route analyser maintains a link set LS where it stores all links it has encountered in any route and their respective D L values. If the link set LS has been exhausted in s306 the algorithm continues with two nested loops s308 - s324.
- the outer loop s308 - s324 runs over all entries in the table T E-2-E .
- the inner loop s312 - s322 runs over all links L in a particular route R.
- the route analyser retrieves the next entry from T E-2-E and identifies service host H and end-user client U in respect thereof.
- the route R from H to U is determined based on information from the route database.
- the route R consists of a list of links, and the inner loop s312 - s322 involves running through all links in the route to add up the scores from the T E-2-E table and to count the number of services in which a link is used.
- s314 it is established if the link is already contained in the current link set LS. If a link has not been seen by the route analyser, it gets a default D L value of 1, the link is added to the link set LS in s316, and counters temp_L and count_L are initialised to zero (s318). Otherwise the process continues directly with s320. In s320 the E S,U score is added to the current sum for L in temp_L and increase L's service counter is increased by 1. The process continues with the inner loop from s312 if the test in s322 reveals more links in the route R, otherwise it is checked in s324 if there are more unprocessed entries in T E-2-E .
- Exemplary pseudo-code which may be invoked periodically by a route analyser 10 according to an embodiment in order to update all D L values in the network using a process such as that described above and shown in Figure 3 could be as follows:
- D L values determined as set out above or using processes according to other embodiments may be used simply to diagnose "weak" links in the network. This may be achieved in the absence of real-time network performance metrics (from the MIB, for example).
- a low D L value for a link L may indicate that the link is part of one or more underperforming routes, whereas a high D L value may indicate that the link is part of one or more routes that support services with good QoE.
- links with a consistently low D L value can be highlighted to an operator for investigation and troubleshooting.
- D L values may also be used as a trigger or basis for re-routing. This may be achieved in real-time, the D L values being used by the route analyser 10 or another entity to trigger re-routing around weak links.
- the method of pushing the routing changes back to the routing entities to distributed routing daemons running on each of the routers, or to a centralised entity that handles local routing, for example) will not be discussed in detail here, as well-known techniques may be used.
- a mechanism of communication would exist between the route analyser 10 and the forwarding plane where packet switching takes place. Methods of achieving this include using Telnet, or using an API that interfaces between the network and the intelligence unit.
- Routing traffic away from an underperforming link may allow it the chance to recover, should congestion be the cause of poor performance.
- the D L value of a link may increase, after which it may be autonomously reused in routing.
- a simple way to turn a D L value into a link cost value is to compute 1-D L , in accordance with routing protocols that are configured to prefer lower link costs over higher ones. This can either be used on its own or combined with the existing routing metric. This can be done by weighting the D L value in relation to the unicast (or multicast) routing cost and adding it to the existing cost metric. The weight applied to the two costs depends on the importance that the operator wishes to apportion to each of the two components.
- C L is a cost value that reflects the number of times a given link L is part of poorly performing routes. This is different to D L since the latter is a function of perceived end-to-end performance, whereas C L is a function of the number of times a link is part of any route perceived as being an underperforming route (thus not needing to take into account the extent of the poor performance).
- the C L value of a link L essentially reflects the number of occasions that the link is common to two or more underperforming routes.
- C L may be calculated in the following manner, a detailed process for which will be described later with reference to Figure 4 .
- the route analyser 10 first sorts the routes into high-performing and low-performing routes based on E S,U values.
- the route analyser 10 maintains a list of poorly performing routes (as determined from the E S,U value) and removes routes from this list if they are no longer in use or if their E S,U values subsequently increase.
- it identifies common links in this list of poorly performing routes. It can do this by computing the length " le " of a route and adding a value of 1/ le to the C L value of a link L. Length le is the number of hops the route contains from one client to another.
- the C L value is a penalty measure for poor performance of a route and by apportioning it equally to each component link in the route, the penalty can be distributed evenly. This is because knowledge that an end-to-end route is exhibiting poor performance may not allow a determination as to which of its component links may be responsible for the overall poor performance. This procedure may be performed for all links and all the routes in the network segment. Therefore, if a link is a common link of several poorly performing routes, its link cost C L increases through this procedure (as will be described with reference to Figure 4 ) with each addition weighted by the length of the route that contributes to that increase. If a link is shared by many poorly performing routes, its C L value will be higher than that of other links.
- C L values are initialised to a default value, which could be set depending upon the class of service that this C L value is computed for, so that links can be differentiated when used in routing algorithms per class of service.
- the route analyser may age C L values and decrease them over time such that link costs return to their default values if links are no longer used or no longer appear as a common link in low performing routes.
- route performance there could be a higher number of levels into which route performance may be classified, such as "high”, “medium” and “low", of course.
- a three-tier classification system for the performance of individual links may be used. In such a case, the network could continue using the component links classified to be of "medium” performance under certain (less congested) network conditions, for example.
- a link that is part of a "medium” performing route may be penalised by a different value added to its C L factor.
- Such a system can be expanded, each tier of classification being treated differently and contributing differently to the cumulative C L value for link L, for example.
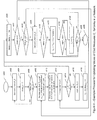
- an algorithm to update the C L values for all links may be invoked periodically by the route analyser 10 to update C L values in respect of some or all of the links 125 in the network 100. It begins in step s400 and first runs a loop (s402 - s406) where a counter ctemp_L is initialised to zero (s404) for each link L in the current link set LS_C, ctemp_L being a temporary variable.
- the route analyser maintains a link set LS_C where it stores all links it has encountered in any route and their respective C L values. If the link set LS_C has been exhausted in s406 the algorithm continues with two nested loops s408-s424.
- the outer loop s408 - s424 runs over all entries in the table T E-2-E .
- the inner loop s412 - s422 runs over all links L in a particular route R.
- the route R from H to U is determined based on information from the route database, and its length le (which may be measured as a number of hops) is established.
- the route R consists of a list of links, and the inner loop s412 - s422 involves running through all links in the route to add a contribution to the ctemp_L count that reflects the chance that a particular link is responsible for having caused the E S,U score for the route it is in to have been below the threshold "t".
- s414 it is established if the link is already contained in the current link set LS_C. If a link has not been seen by the route analyser, it gets a default C L value of 0, the link is added to the link set LS_C in s416, and counter ctemp_L is initialised to zero (s418). Otherwise the process continues directly with s420.
- the current sum for L is incremented in counter ctemp_L by an amount inversely proportional to the number of hops in the route.
- the process continues with the inner loop from s412 if the test in s422 reveals more links in the route R, otherwise it is checked in s424 if there are more unprocessed entries in T E-2-E . If so the process continues with the outer loop from s408, otherwise it continues with s426. From s426, another loop s426 - s436 starts in which the new C L values are computed for each link in the link set LS_C.
- the route analyser takes the next link from the link set LS_C in s426 and checks in s428 if the service counter is zero (to avoid divisions by zero). If the counter is not zero, C L is computed according to the formula in s430 which is a weighted average of the old C L value and the new ctemp_L count. A weight "v" between 0 and 1 is used here, similarly to the weight "w” used in the process of Figure 3 . If the counter is zero then C L is not recomputed and it is checked in s432 if the C L value should be aged (as explained in relation to Figure 3 , for example). If the decision is made to age the C L value, the formula in s434 is applied using the same weight v.
- Exemplary pseudo-code which may be invoked periodically by a route analyser 10 according to an embodiment in order to update all C L values in the network using a process such as that described above and shown in Figure 4 could be as follows:
- C L values may be used similarly to D L values as described above (e.g. for diagnostics and for re-routing). C L values can also be directly used in cost calculations without needing to subtract them from 1 in order to obtain a cost value (as described above in relation to D L ). C L values may need to be scaled to be comparable to other cost metrics used by existing routing algorithms, however, depending on how much importance the operator wishes to apportion to C L compared to existing link cost measures.
- C L values like D L values, generally become more reliable when more routes are analysed and several consistent route overlaps through common links are found. Using too few routes might result in erroneous penalising of common links between these routes where congestion might actually have occurred elsewhere on the routes but the common links are penalised instead. Analysing several routes increases the likelihood of route overlaps and therefore improves the efficiency of diagnosis.
- link performance measures determined according to some embodiments may be used predictively, rather than for immediate or direct use in routing or re-routing, however.
- the following discussion relates to this aspect.
- a multilayer perceptron (or similar machine learning or predictive data analytics algorithm) may be used. It will be understood that a multilayer perceptron is only one of many possible machine learning techniques that can be used, however.
- the neural network comprises of an input layer, one or more hidden layers and one output layer.
- the neural network learns the relationship between a route and its end-to-end performance to predict the latter, given the former.
- a route in the IP network is represented as a vector of component links. This is derived as explained in earlier sections (using routing protocols or RSVP).
- Each link is then represented for the neural network as a number of link performance metrics such as throughput, delay, jitter, MIB metrics, link cost including D L or C L values, etc.
- link performance metrics such as throughput, delay, jitter, MIB metrics, link cost including D L or C L values, etc.
- Links are represented in the input layer of the neural network by groups of input neurons. Each input neuron group contains one input neuron for each available link performance metric.
- the input layer of the multilayer perceptron contains enough groups of input neurons to accept link performance metrics for the longest possible route in the network. Shorter routes are padded by "perfect" links.
- the purpose of the neural network is to predict the end-to-end performance of a route (i.e. the E S,U value) given a set of performance metrics for the component links of this route as well as an additional optional set of parameters (described in the next paragraph).
- the output layer of the neural network will have one output neuron for each type of end-to-end performance measure (E S,U ) that we want to consider. This is applicable if we use, for example, a different E S,U value for each service S provided by a service host H to an end-user client U. Alternatively, we can use separate neural networks for each E S,U value. This could be done if a single neural network turns out to be too hard to train using the available data, i.e. if its performance would be too low after training, for example.
- the training data used for the neural network are vectors containing three groups of values:
- the missing link performance values are imputed by "perfect" link performance values, i.e. values representing maximum possible throughput, zero latency, zero jitter, etc. These perfect values are considered to be network parameters and are set by the operator. The exact values do not matter as long as they are genuinely describing optimal link performance in the network.
- the data needed for building the neural network is collected by the route analyser 10. It uses information from the T E-2-E table described earlier plus additional link and network performance metrics that are available from the network 100.
- Network performance metrics can be obtained from Simple Network Management Protocol (SNMP) agents, resource reservation protocols such as Resource Reservation Protocol (RSVP), media control protocols such as RTP Control Protocol (RTCP) and Interior Gateway Protocol (IGP) / Multiprotocol Label Switching (MPLS) / multicast routing tables.
- SNMP Simple Network Management Protocol
- RVP Resource Reservation Protocol
- RTCP RTP Control Protocol
- IGP Interior Gateway Protocol
- MPLS Multiprotocol Label Switching
- the training database will be constantly refreshed with new data and old data will be removed. For example, records older than 24 hours may be deleted.
- the neural network may be regularly retrained, for example, every hour, to make sure it constantly reflects the current network structure and behaviour.
- the neural network may be applied if a routing algorithm wants to predict the end-to-end performance of a given route.
- a route is mapped into a vector of component links, which is then represented as a sequence of input values for the neural network.
- the output of the neural network is the predicted end-to-end performance of the route, i.e. its predicted E S,U value.
- PE S,U the predicted E S,U value.
- This can be one or more values depending on the configuration of the neural network and the nature of the end-to-end performance measures used.
- the route analyser uses the neural network to predict its end-to-end performance PE S,U as described in the previous section.
- the neural network produces an output value between 0 and 1.
- the routing algorithm can use the prediction to accept or discard a potential route or pick the best from a number of possible routes. This is the effect that the learning algorithm has on the network.
- a predictive D L value (PD L ) and a predictive C L value (PC L ) can be computed as described in the "Diagnostic Usage" section earlier. The reason the values are predictive is that they are based on PE S,U values instead of actual E S,U values.
- the route analyser proactively determines links to avoid because they are expected to perform poorly, and therefore allows poor end-to-end performance to be avoided in the first place. This is different to re-routing using E S,U , D L and C L values, which indicate that poor QoE has already occurred - using these measures for routing (in its most proactive form) only serves to prevent future drops of QoE.
- a non-predictive version may well run through cycles of poor and better end-to-end performance, whereas a predictive system may prevent poor end-to-end performance entirely after its initial training phase.
- This has four service hosts 110 (labelled as H1 to H4) providing services to three end-user clients 130 (U1 to U3) via a network which includes five intermediate forwarding nodes or routers 120 (N1 to N5) and thirteen links (L1 to L13), which provide nine possible end-to-end paths or routes for the delivery of services to the end-user clients.
- the routes or paths used for the services are indicated by the numbers 1 to 9 in dashed-line boxes.
- path 1 goes from client H1 to router N1 via link L1, which also carries data using path 7, as indicated by the dashed-line box containing the path numbers "1, 7".
- Path 1 continues via link L6 to router N2, then via link L7 to router N3, and on via link L9 to end-user client U1, as indicated by dashed-line boxes on each of the relevant links containing the path number "1" (amongst other path numbers).
- Service hosts H1-H4 maintain end-to-end performance tables with the following information: Table 2: Table T E-2-E of end-to-end performance values maintained by video server H1 Service Class of Service End-User Client Time Performance Video-stream EF U1 23/11/2012 11.00 0.77 Video-stream EF U2 23/11/2012 11.00 0.86 Video-stream EF U1 23/11/2012 18.00 0.98 . Video-stream EF U2 23/11/2012 18.00 0.84 ... ... ... ...
- Table 3 Table T E-2-E of end-to-end performance values maintained by database server H2 Service Class of Service End-User Client Time Performance Database AF U1 23/11/2012 11.00 0.58 Database AF U2 23/11/2012 11.00 0.74 Database AF U1 23/11/2012 18.00 0.67 Database AF U2 23/11/2012 18.10 0.59 ... ... ... ... Table 4: Table T E-2-E of end-to-end performance values maintained by video server H3 Service Class of Service End-User Client Time Performance Video-stream EF U1 23/11/2012 20.00 0.77 Video-stream EF U2 23/11/2012 20.00 0.21 Video-stream EF U3 23/11/2012 20.00 0.19 ... ... ... ...
- Table 5 Table T E-2-E of end-to-end performance values maintained by application server H4 Service Class of Service End-User Client Time Performance Application EF U2 23/11/2012 20.00 0.25 Application EF U3 23/11/2012 20.00 0.21 ... ... ... ...
- H1 is a video server serving end-user clients U1 and U2 via routes 1 and 7;
- H2 is a database server serving U1 and U2 via routes 2 and 3;
- H3 is another video server providing a video stream to U1, U2 and U3 via routes 4, 5 and 8;
- H4 is an application server serving U2 and U3 via routes 6 and 9.
- Routes 5, 6, 8 and 9 are below the threshold of 0.40 which triggers the analysis for weak links in the route analyser.
- the links used by these routes are L4, L5, L11, L12 and L13.
- the length le of each of the routes is 3. That means we obtain the following C L values:
- the first 12 values are link performance values, the next two values (11 and 0) are the hour and minute of the performance measurement, the next value is the traffic on the route and 0.77 is the reported end-to-end performance. Other training vectors are formed accordingly.
Priority Applications (4)
| Application Number | Priority Date | Filing Date | Title |
|---|---|---|---|
| EP13250099.2A EP2843875A1 (fr) | 2013-08-30 | 2013-08-30 | Détermination et utilisation de mesures de performance de liaison |
| PCT/GB2014/000337 WO2015028774A1 (fr) | 2013-08-30 | 2014-08-29 | Détermination et utilisation de mesures de performances de lien |
| EP14759246.3A EP3039817B1 (fr) | 2013-08-30 | 2014-08-29 | Détermination et utilisation de mesures de performance de liaison |
| US14/914,733 US10637767B2 (en) | 2013-08-30 | 2014-08-29 | Determination and use of link performance measures |
Applications Claiming Priority (1)
| Application Number | Priority Date | Filing Date | Title |
|---|---|---|---|
| EP13250099.2A EP2843875A1 (fr) | 2013-08-30 | 2013-08-30 | Détermination et utilisation de mesures de performance de liaison |
Publications (1)
| Publication Number | Publication Date |
|---|---|
| EP2843875A1 true EP2843875A1 (fr) | 2015-03-04 |
Family
ID=49165680
Family Applications (2)
| Application Number | Title | Priority Date | Filing Date |
|---|---|---|---|
| EP13250099.2A Ceased EP2843875A1 (fr) | 2013-08-30 | 2013-08-30 | Détermination et utilisation de mesures de performance de liaison |
| EP14759246.3A Active EP3039817B1 (fr) | 2013-08-30 | 2014-08-29 | Détermination et utilisation de mesures de performance de liaison |
Family Applications After (1)
| Application Number | Title | Priority Date | Filing Date |
|---|---|---|---|
| EP14759246.3A Active EP3039817B1 (fr) | 2013-08-30 | 2014-08-29 | Détermination et utilisation de mesures de performance de liaison |
Country Status (3)
| Country | Link |
|---|---|
| US (1) | US10637767B2 (fr) |
| EP (2) | EP2843875A1 (fr) |
| WO (1) | WO2015028774A1 (fr) |
Cited By (6)
| Publication number | Priority date | Publication date | Assignee | Title |
|---|---|---|---|---|
| CN107547914A (zh) * | 2017-08-15 | 2018-01-05 | 浙江工业大学 | Dash标准下的基于knn‑q学习的视频片段获取优化方法 |
| CN109104368A (zh) * | 2018-09-12 | 2018-12-28 | 网宿科技股份有限公司 | 一种请求连接方法、装置、服务器及计算机可读存储介质 |
| CN110135482A (zh) * | 2019-04-30 | 2019-08-16 | 中国地质大学(武汉) | 一种基于卷积神经网络的网络拓扑推断方法及系统 |
| EP3528432A1 (fr) * | 2018-02-16 | 2019-08-21 | Nokia Solutions and Networks Oy | Procédé et appareil de surveillance d'un réseau de télécommunication |
| CN110311812A (zh) * | 2019-06-24 | 2019-10-08 | 深圳市腾讯计算机系统有限公司 | 一种网络分析方法、装置和存储介质 |
| WO2020249299A1 (fr) * | 2019-06-11 | 2020-12-17 | Telefonaktiebolaget Lm Ericsson (Publ) | Procédés et appareil de routage de trafic de données |
Families Citing this family (21)
| Publication number | Priority date | Publication date | Assignee | Title |
|---|---|---|---|---|
| US9092482B2 (en) | 2013-03-14 | 2015-07-28 | Palantir Technologies, Inc. | Fair scheduling for mixed-query loads |
| AU2014203218B2 (en) * | 2014-06-13 | 2016-08-25 | Canon Kabushiki Kaisha | Memory configuration for inter-processor communication in an MPSoC |
| DE102014018873A1 (de) * | 2014-12-16 | 2016-06-30 | Unify Gmbh & Co. Kg | Telekommunikationsanordnung und Verfahren zum Herstellen einer RTC-Verbindung zwischen einem ersten Endpunkt und einem zweiten Endpunkt |
| US9743299B2 (en) * | 2014-12-22 | 2017-08-22 | International Business Machines Corporation | Network performance testing in non-homogeneous networks |
| US9838317B1 (en) * | 2015-04-10 | 2017-12-05 | Juniper Networks, Inc. | Policy-based selective traffic reroute based on predicted traffic loss |
| US9787560B2 (en) * | 2015-06-04 | 2017-10-10 | Microsoft Technology Licensing Llc | Effective service node traffic routing |
| US11108883B2 (en) * | 2015-09-04 | 2021-08-31 | Google Llc | Systems and methods for remote network topology discovery |
| US10430240B2 (en) * | 2015-10-13 | 2019-10-01 | Palantir Technologies Inc. | Fault-tolerant and highly-available configuration of distributed services |
| US20180041426A1 (en) * | 2016-08-08 | 2018-02-08 | Layer3 TV, Inc. | Dynamic route selection for routing data in a content delivery system |
| US11106540B1 (en) | 2017-04-03 | 2021-08-31 | Amazon Technologies, Inc. | Database command replay |
| US11500824B1 (en) | 2017-04-03 | 2022-11-15 | Amazon Technologies, Inc. | Database proxy |
| US11182496B1 (en) * | 2017-04-03 | 2021-11-23 | Amazon Technologies, Inc. | Database proxy connection management |
| US11392603B1 (en) | 2017-04-03 | 2022-07-19 | Amazon Technologies, Inc. | Database rest API |
| US10819591B2 (en) | 2017-05-30 | 2020-10-27 | At&T Intellectual Property I, L.P. | Optical transport network design system |
| US10462042B2 (en) * | 2017-06-20 | 2019-10-29 | Cisco Technology, Inc. | Network path selection |
| US10812388B2 (en) | 2019-02-07 | 2020-10-20 | Cisco Technology, Inc. | Preventing damage to flows in an SDN fabric by predicting failures using machine learning |
| CN110493076B (zh) * | 2019-08-05 | 2022-03-25 | 电子科技大学 | 一种基于sdn的链路往返时延测量方法 |
| US11240153B1 (en) | 2020-07-31 | 2022-02-01 | Cisco Technology, Inc. | Scoring policies for predictive routing suggestions |
| CN113556394B (zh) * | 2021-07-20 | 2022-12-06 | 北京百度网讯科技有限公司 | 云产品网络用量处理方法、装置、设备、存储介质及产品 |
| US11924734B2 (en) * | 2021-10-07 | 2024-03-05 | Juniper Networks, Inc. | Wireless signal strength-based detection of poor network link performance |
| US11658904B1 (en) | 2021-11-22 | 2023-05-23 | Cisco Technology, Inc. | Application-aware routing based on path KPI dynamics |
Citations (6)
| Publication number | Priority date | Publication date | Assignee | Title |
|---|---|---|---|---|
| US20060274760A1 (en) * | 2005-06-07 | 2006-12-07 | Level 3 Communications, Inc. | Internet packet quality monitor |
| JP2007221424A (ja) * | 2006-02-16 | 2007-08-30 | Nec Corp | 通信品質計測方法およびシステム |
| US20080080376A1 (en) * | 2006-09-28 | 2008-04-03 | Akshay Adhikari | Root Cause Analysis of Network Performance Based on Exculpation or Inculpation Sets |
| WO2011000011A1 (fr) | 2009-06-29 | 2011-01-06 | Trumpf Maschinen Austria Gmbh & Co. Kg. | Dispositif et procédé de pliage de pièce |
| WO2012085519A1 (fr) | 2010-12-24 | 2012-06-28 | British Telecommunications Public Limited Company | Gestion de réseau de communication |
| WO2012085498A1 (fr) | 2010-12-24 | 2012-06-28 | British Telecommunications Public Limited Company | Gestion de réseau de communication |
Family Cites Families (6)
| Publication number | Priority date | Publication date | Assignee | Title |
|---|---|---|---|---|
| US5831972A (en) * | 1996-10-17 | 1998-11-03 | Mci Communications Corporation | Method of and system for mapping sonet performance parameters to ATM quality of service parameters |
| US6968948B2 (en) * | 2003-08-15 | 2005-11-29 | Walter Scott | Container for holding live plants for display and sale for a long duration |
| US7742063B2 (en) * | 2005-07-07 | 2010-06-22 | Lsi Corporation | Efficient and high speed 2D data transpose engine for SOC application |
| US7693064B2 (en) * | 2005-10-24 | 2010-04-06 | Cisco Technology, Inc. | Forwarding packets to a directed acyclic graph destination using link selection based on received link metrics |
| US20080008037A1 (en) * | 2006-07-07 | 2008-01-10 | Welker Kenneth E | Acoustic propagation velocity modeling methods, apparatus and systems |
| EP2375637A1 (fr) | 2010-03-22 | 2011-10-12 | British Telecommunications Public Limited Company | Adaptation d'acheminement de réseau basé sur une prédiction des défaillances |
-
2013
- 2013-08-30 EP EP13250099.2A patent/EP2843875A1/fr not_active Ceased
-
2014
- 2014-08-29 US US14/914,733 patent/US10637767B2/en active Active
- 2014-08-29 WO PCT/GB2014/000337 patent/WO2015028774A1/fr active Application Filing
- 2014-08-29 EP EP14759246.3A patent/EP3039817B1/fr active Active
Patent Citations (6)
| Publication number | Priority date | Publication date | Assignee | Title |
|---|---|---|---|---|
| US20060274760A1 (en) * | 2005-06-07 | 2006-12-07 | Level 3 Communications, Inc. | Internet packet quality monitor |
| JP2007221424A (ja) * | 2006-02-16 | 2007-08-30 | Nec Corp | 通信品質計測方法およびシステム |
| US20080080376A1 (en) * | 2006-09-28 | 2008-04-03 | Akshay Adhikari | Root Cause Analysis of Network Performance Based on Exculpation or Inculpation Sets |
| WO2011000011A1 (fr) | 2009-06-29 | 2011-01-06 | Trumpf Maschinen Austria Gmbh & Co. Kg. | Dispositif et procédé de pliage de pièce |
| WO2012085519A1 (fr) | 2010-12-24 | 2012-06-28 | British Telecommunications Public Limited Company | Gestion de réseau de communication |
| WO2012085498A1 (fr) | 2010-12-24 | 2012-06-28 | British Telecommunications Public Limited Company | Gestion de réseau de communication |
Non-Patent Citations (1)
| Title |
|---|
| HAI ANH TRAN: "QoE Content Distribution Network for Cloud Architecture", ABDELHAMID MELLOUK AND SAID HOCEINI (FIRST INTERNATIONAL SYMPOSIUM ON NETWORK CLOUD COMPUTING AND APPLICATIONS (NCCA, November 2011 (2011-11-01) |
Cited By (8)
| Publication number | Priority date | Publication date | Assignee | Title |
|---|---|---|---|---|
| CN107547914A (zh) * | 2017-08-15 | 2018-01-05 | 浙江工业大学 | Dash标准下的基于knn‑q学习的视频片段获取优化方法 |
| EP3528432A1 (fr) * | 2018-02-16 | 2019-08-21 | Nokia Solutions and Networks Oy | Procédé et appareil de surveillance d'un réseau de télécommunication |
| US11146344B2 (en) | 2018-02-16 | 2021-10-12 | Nokia Solutions And Networks Oy | Method and apparatus for monitoring a telecommunication network |
| CN109104368A (zh) * | 2018-09-12 | 2018-12-28 | 网宿科技股份有限公司 | 一种请求连接方法、装置、服务器及计算机可读存储介质 |
| CN110135482A (zh) * | 2019-04-30 | 2019-08-16 | 中国地质大学(武汉) | 一种基于卷积神经网络的网络拓扑推断方法及系统 |
| WO2020249299A1 (fr) * | 2019-06-11 | 2020-12-17 | Telefonaktiebolaget Lm Ericsson (Publ) | Procédés et appareil de routage de trafic de données |
| CN110311812A (zh) * | 2019-06-24 | 2019-10-08 | 深圳市腾讯计算机系统有限公司 | 一种网络分析方法、装置和存储介质 |
| CN110311812B (zh) * | 2019-06-24 | 2023-01-24 | 深圳市腾讯计算机系统有限公司 | 一种网络分析方法、装置和存储介质 |
Also Published As
| Publication number | Publication date |
|---|---|
| US20160218963A1 (en) | 2016-07-28 |
| EP3039817A1 (fr) | 2016-07-06 |
| EP3039817B1 (fr) | 2018-04-25 |
| WO2015028774A1 (fr) | 2015-03-05 |
| US10637767B2 (en) | 2020-04-28 |
Similar Documents
| Publication | Publication Date | Title |
|---|---|---|
| EP3039817B1 (fr) | Détermination et utilisation de mesures de performance de liaison | |
| US11405295B2 (en) | Scalable distributed end-to-end performance delay measurement for segment routing policies | |
| US9680767B2 (en) | Session admission in a communications network | |
| US10075390B2 (en) | Communications network using a tunnel to connect two network nodes | |
| US10924393B2 (en) | Per-flow call admission control using a predictive model to estimate tunnel QoS in SD-WAN networks | |
| US7561517B2 (en) | Passive route control of data networks | |
| US7903573B2 (en) | Method and system for network traffic matrix analysis | |
| Binsahaq et al. | A survey on autonomic provisioning and management of QoS in SDN networks | |
| US7933743B2 (en) | Determining overall network health and stability | |
| EP2869506B1 (fr) | Équité et évitement de congestion dans des réseaux de données avec de multiples sources de trafic | |
| WO2017097359A1 (fr) | Surveillance de trafic dans un réseau de communication | |
| KR101541531B1 (ko) | 소프트웨어 정의 네트워크 환경에서 사용 가능한 대역폭 패턴 기반 라우팅 기법 | |
| US20230018772A1 (en) | Root-causing saas endpoints for network issues in application-driven predictive routing | |
| Al-Jawad et al. | Policy-based QoS management framework for software-defined networks | |
| Houidi et al. | Multi-agent graph convolutional reinforcement learning for intelligent load balancing | |
| Barakabitze et al. | QoEMultiSDN: Management of multimedia services using MPTCP/SR in softwarized and virtualized networks | |
| US11909803B1 (en) | Application selection based on network characteristics | |
| US11683260B2 (en) | Estimating a traffic matrix of a communication network using network topology features | |
| US20240137293A1 (en) | Using chatbots to collect direct user feedback on application experience | |
| US20240015104A1 (en) | Quantifying application quality of experience under different path performance motifs | |
| Barabas et al. | Congestion control based on distributed statistical QoS-aware routing management | |
| Wu | Fine-Grained Traffic Management in Computer Networks | |
| Harhira et al. | Multi-path dynamic admission control in MPLS networks with end-to-end delay guarantees | |
| HINES et al. | QoEMultiSDN: Management of Multimedia Services using MPTCP/SR in Softwarized and Virtualized Networks | |
| Awduche et al. | INTERNET-DRAFT |
Legal Events
| Date | Code | Title | Description |
|---|---|---|---|
| 17P | Request for examination filed |
Effective date: 20130830 |
|
| AK | Designated contracting states |
Kind code of ref document: A1 Designated state(s): AL AT BE BG CH CY CZ DE DK EE ES FI FR GB GR HR HU IE IS IT LI LT LU LV MC MK MT NL NO PL PT RO RS SE SI SK SM TR |
|
| AX | Request for extension of the european patent |
Extension state: BA ME |
|
| PUAI | Public reference made under article 153(3) epc to a published international application that has entered the european phase |
Free format text: ORIGINAL CODE: 0009012 |
|
| STAA | Information on the status of an ep patent application or granted ep patent |
Free format text: STATUS: THE APPLICATION HAS BEEN REFUSED |
|
| 18R | Application refused |
Effective date: 20150322 |