EP2838067A1 - Pipeline administration assistance device and pipeline administration assistance system - Google Patents
Pipeline administration assistance device and pipeline administration assistance system Download PDFInfo
- Publication number
- EP2838067A1 EP2838067A1 EP12872855.7A EP12872855A EP2838067A1 EP 2838067 A1 EP2838067 A1 EP 2838067A1 EP 12872855 A EP12872855 A EP 12872855A EP 2838067 A1 EP2838067 A1 EP 2838067A1
- Authority
- EP
- European Patent Office
- Prior art keywords
- pipeline
- data
- section
- processing unit
- event data
- Prior art date
- Legal status (The legal status is an assumption and is not a legal conclusion. Google has not performed a legal analysis and makes no representation as to the accuracy of the status listed.)
- Ceased
Links
Images



Classifications
-
- G—PHYSICS
- G06—COMPUTING OR CALCULATING; COUNTING
- G06Q—INFORMATION AND COMMUNICATION TECHNOLOGY [ICT] SPECIALLY ADAPTED FOR ADMINISTRATIVE, COMMERCIAL, FINANCIAL, MANAGERIAL OR SUPERVISORY PURPOSES; SYSTEMS OR METHODS SPECIALLY ADAPTED FOR ADMINISTRATIVE, COMMERCIAL, FINANCIAL, MANAGERIAL OR SUPERVISORY PURPOSES, NOT OTHERWISE PROVIDED FOR
- G06Q50/00—Information and communication technology [ICT] specially adapted for implementation of business processes of specific business sectors, e.g. utilities or tourism
- G06Q50/06—Energy or water supply
-
- G—PHYSICS
- G01—MEASURING; TESTING
- G01N—INVESTIGATING OR ANALYSING MATERIALS BY DETERMINING THEIR CHEMICAL OR PHYSICAL PROPERTIES
- G01N19/00—Investigating materials by mechanical methods
- G01N19/08—Detecting presence of flaws or irregularities
-
- G—PHYSICS
- G01—MEASURING; TESTING
- G01F—MEASURING VOLUME, VOLUME FLOW, MASS FLOW OR LIQUID LEVEL; METERING BY VOLUME
- G01F1/00—Measuring the volume flow or mass flow of fluid or fluent solid material wherein the fluid passes through a meter in a continuous flow
- G01F1/05—Measuring the volume flow or mass flow of fluid or fluent solid material wherein the fluid passes through a meter in a continuous flow by using mechanical effects
-
- G—PHYSICS
- G01—MEASURING; TESTING
- G01H—MEASUREMENT OF MECHANICAL VIBRATIONS OR ULTRASONIC, SONIC OR INFRASONIC WAVES
- G01H17/00—Measuring mechanical vibrations or ultrasonic, sonic or infrasonic waves, not provided for in the other groups of this subclass
-
- G—PHYSICS
- G01—MEASURING; TESTING
- G01M—TESTING STATIC OR DYNAMIC BALANCE OF MACHINES OR STRUCTURES; TESTING OF STRUCTURES OR APPARATUS, NOT OTHERWISE PROVIDED FOR
- G01M3/00—Investigating fluid-tightness of structures
- G01M3/02—Investigating fluid-tightness of structures by using fluid or vacuum
- G01M3/04—Investigating fluid-tightness of structures by using fluid or vacuum by detecting the presence of fluid at the leakage point
- G01M3/24—Investigating fluid-tightness of structures by using fluid or vacuum by detecting the presence of fluid at the leakage point using infrasonic, sonic or ultrasonic vibrations
- G01M3/243—Investigating fluid-tightness of structures by using fluid or vacuum by detecting the presence of fluid at the leakage point using infrasonic, sonic or ultrasonic vibrations for pipes
-
- G—PHYSICS
- G06—COMPUTING OR CALCULATING; COUNTING
- G06F—ELECTRIC DIGITAL DATA PROCESSING
- G06F17/00—Digital computing or data processing equipment or methods, specially adapted for specific functions
- G06F17/10—Complex mathematical operations
- G06F17/18—Complex mathematical operations for evaluating statistical data, e.g. average values, frequency distributions, probability functions, regression analysis
-
- G—PHYSICS
- G06—COMPUTING OR CALCULATING; COUNTING
- G06Q—INFORMATION AND COMMUNICATION TECHNOLOGY [ICT] SPECIALLY ADAPTED FOR ADMINISTRATIVE, COMMERCIAL, FINANCIAL, MANAGERIAL OR SUPERVISORY PURPOSES; SYSTEMS OR METHODS SPECIALLY ADAPTED FOR ADMINISTRATIVE, COMMERCIAL, FINANCIAL, MANAGERIAL OR SUPERVISORY PURPOSES, NOT OTHERWISE PROVIDED FOR
- G06Q10/00—Administration; Management
- G06Q10/06—Resources, workflows, human or project management; Enterprise or organisation planning; Enterprise or organisation modelling
- G06Q10/063—Operations research, analysis or management
Definitions
- the present invention relates to a pipeline management supporting server and a pipeline management supporting system.
- the pipeline database is a collection of attribute data (the type of pipe, the diameter, the installation year, and the like) of pipe components configuring a pipeline.
- the map shows a location of a pipe network of the pipeline.
- the attribute data of a pipe component configuring a pipeline and the location information data of a pipe network can be uniformly managed and can be shown by superimposing them on the map.
- Examples of the water-leakage detection include a measurement at plural locations by loggers, a measurement at two locations and correlation analysis between them, and a measurement of sound.
- the measurement of sound is performed as follows. A skilled worker goes to a site in the midnight with little noise to detect a water-leakage sound from the surface of the ground, a manhole, or the like.
- a system in which a flow rate measurement device, a pressure measurement device, or a vibration measurement device is attached to a target pipeline, collected measurement data are sent to a remote central processing center, and an abnormality such as a water-leakage is detected on the basis of the measurement data has been proposed (Patent Document 1).
- Patent Document 1 JP H8-96039 A
- the present invention is intended to provide a pipeline management supporting server and a pipeline management supporting system, capable of unifying management of attribute data of a pipe component and location information on a pipe network, efficiently detecting an abnormality of a pipeline remotely, and diagnosing the degradation state of the pipeline.
- the pipeline management supporting server of the present invention is a pipeline management supporting server including: a private data processing unit; and a statistical calculation processing unit, wherein the private data processing unit includes: an event data acquisition section that acquires event data of a pipeline measured by at least one sensor; a measured event data storage section that stores the event data of the pipeline; a pipeline database data storage section that accumulates pipeline database data; a possible abnormality detection section; and an information output section, wherein the possible abnormality detection section identifies a pipeline and a location pertaining to the acquired event data of the pipeline with reference to the pipeline database data stored in the pipeline database data storage section and generates possible abnormality detection information on the acquired event data of the pipeline, the statistical calculation processing unit includes: a data analysis section; and a statistical calculation data storage section that stores statistical calculation data, wherein the data analysis section prepares, from event data of plural pipelines each having the same attribute as the pipeline pertaining to the event data acquired by the private data processing unit, an aging characteristic graph of the plural pipelines, the statistical
- the pipeline management supporting system of the present invention is a pipeline management supporting system including: a pipeline management supporting server; at least one sensor; an operation display device; at least one data collection transmission terminal; and a communication network, wherein the pipeline management supporting server is the pipeline management supporting server according to the present invention, event data measured by the at least one sensor are sent to the pipeline management supporting server by the at least one data collection transmission terminal through the communication network, and abnormality determination result detection information and degradation state diagnostic information output from the pipeline management supporting server are acquirable by the operation display device via the communication network.
- the present invention makes it possible to uniformly manage attribute data of a pipe component and location information on a pipe network, efficiently detect an abnormality of a pipeline remotely, and diagnose the degradation state of the pipeline.
- the statistical calculation data storage section may include a previously-prepared aging characteristic graph of pipelines each having the same attribute as the pipeline pertaining to the event data acquired by the private data processing unit, and the data analysis section may generate degradation state diagnostic information on the pipeline pertaining to the event data acquired by the private data processing unit by checking the pipeline against the previously-prepared aging characteristic graph.
- the statistical calculation processing unit further includes a calculation processing correction section, and the calculation processing correction section updates the aging characteristic graph on the basis of the acquired event data.
- the data analysis section further extracts disturbance energy data included in the event data and prepares a disturbance energy characteristic graph on the basis of the disturbance energy data.
- the degradation state diagnostic information generated by the data analysis section is at least one of degradation index evaluation information and soundness index evaluation information on the pipeline.
- the at least one sensor includes at least one vibration sensor, and the event data include vibration data acquired by the at least one vibration sensor is preferable.
- the at least one sensor further includes at least one flow rate sensor, and the event data include flow rate data acquired by the at least one flow rate sensor.
- the pipeline to be managed preferably is a water supply pipeline.
- FIG. 1 is a block diagram showing an example of a configuration of the pipeline management supporting server according to the present invention.
- FIG. 2 is an example of a configuration of the pipeline management supporting system according to the present invention. The present embodiment is described with reference to, as an example, the case where a pipeline to be managed is a water supply pipeline.
- the identical parts are denoted by identical reference numerals.
- this pipeline management supporting system includes a pipeline management supporting server 1, a vibration sensor(s) (vibration measurement device(s)) 31 and a flow rate sensor(s) (flow rate measurement device(s)) 32 as the at least one sensor, an operation display device (client PC) 51 arranged in a management center 2 of a business entity, and a mobile terminal 21 and/or a fixed relay station 22 as the at least one data collection transmission terminal.
- the flow rate sensor(s) 32 is an optional component, may not be included, and is preferably included.
- the client PC 51 is, for example, a PC in the Waterworks Bureau of each municipality.
- An asset management system 5 is connected to the pipeline management supporting server 1.
- the asset management system 5 includes an asset management database data storage section (AMDB) 131.
- AMDB asset management database data storage section
- the pipeline management supporting server 1 is connected to the mobile terminal 21 and/or the fixed relay station 22 in a field 3 and the operation display device 51 in the management center 2 via a communication network 4.
- the communication network 4 is not particularly limited, and a conventionally known communication network can be used.
- the communication network 4 may be a wired communication network or a wireless communication network, and examples thereof include a telephone network, the Internet, and LAN (local-area network).
- the pipeline management supporting server 1 is, for example, arranged in a data center (operated in the cloud environment), collects data (vibration data and flow rate data) measured by many vibration measurement devices 31 (and flow rate measurement devices 32) in plural business entities via a mobile terminal 21 and/or a fixed relay station 22, and outputs processing results such as an abnormality detection, a function correction, the degradation state, and the like to an operation display device 51 as the degradation state diagnostic information and abnormality determination result detection information that is generated by examining the possible abnormality detection information and the degradation state diagnostic information in comparison.
- the vibration data and the flow rate data correspond to the "event data" of the present invention.
- the pipeline management supporting server 1 includes a private data processing unit 11 and a statistical calculation processing unit 12 as main components.
- the private data processing unit 11 includes a pipeline database data storage section (PDB) 111, a measured event data storage section (MDB) 112, a possible abnormality detection section 113, an event data acquisition section 114, and an information output section 115.
- the statistical calculation processing unit 12 includes a statistical calculation data storage section (SDB) 121 and a data analysis section 122 and further includes a calculation processing correction section 123.
- the calculation processing correction section 123 is an optional component, may not be included, and is preferably included.
- the event data acquisition section 114 is connected to the MDB 112, the possible abnormality detection section 113, and the data analysis section 122.
- the PDB 111 is connected to the MDB 112 and the data analysis section 122.
- the MDB 112 is connected to the possible abnormality detection section 113.
- the possible abnormality detection section 113 is connected to the information output section 115.
- the information output section 115 is connected to the MDB 112.
- the data analysis section 122 is connected to the SDB 121.
- the SDB 121 is connected to the information output section 115.
- the calculation processing correction section 123 is connected to the SDB 121.
- the private data processing unit 11 generates abnormality determination result detection information. Specifically, in the private data processing unit 11, the event data acquisition section 114 acquires vibration data and flow rate data (event data) of a pipeline, measured by the vibration sensor(s) 31 and the flow rate sensor(s) 32.
- the MDB 112 stores the event data.
- the PDB 111 stores a pipeline database data.
- the possible abnormality detection section 113 identifies a pipeline and a location pertaining to the acquired event data with reference to the pipeline database data.
- the possible abnormality detection section 113 generates possible abnormality detection information on the acquired event data by time correlation analysis such as an invariant analysis technique.
- the determination of abnormality or normality is performed by examining this possible abnormality detection information and degradation state diagnostic information that is generated by the data analysis section 122 in the statistical calculation processing unit 12 described below in comparison. By the determination, the abnormality determination result detection information is generated. Afterward, the information output section 115 outputs the abnormality determination result detection information and the degradation state diagnostic method to the operation display device 51.
- the statistical calculation processing unit 12 is intended to improve the accuracy of a citation function as interpolation of the statistical calculation, the determination logic, and the like.
- event data measurement data such as vibration data and flow rate data
- measurement data on each business entity are collected, and on the basis of the measurement data, the statistical calculation processing is performed. Afterward, the results of the statistical calculation are reflected to private processing for each business entity.
- the data analysis section 122 prepares, from event data on plural (preferably many) pipelines each having the same attribute as the pipeline pertaining to the event data acquired by the private data processing unit 11, an aging characteristic graph of the plural pipelines.
- the statistical calculation data storage section 121 stores statistical calculation data and the aging characteristic graph prepared by the data analysis section 122.
- the data analysis section 122 further generates degradation state diagnostic information on the pipeline pertaining to the event data acquired by the private data processing unit 11 by checking the pipeline against the aging characteristic graph.
- the statistical calculation data storage section 121 may include a previously-prepared aging characteristic graph of pipelines each having the same attribute as the pipeline pertaining to the event data acquired by the private data processing unit 11, and the data analysis section 122 may generate degradation state diagnostic information on the pipeline pertaining to the event data acquired by the private data processing unit 11 by checking the pipeline against the previously-prepared aging characteristic graph.
- the calculation processing correction section 123 updates the aging characteristic graph on the basis of the event data acquired by the private data processing unit 11.
- the management center 2 can be, for example, a management center in the Waterworks Bureau of each municipality.
- the operation display device (client PC) 51 is, as mentioned above, arranged in the management center 2 of each business entity.
- the operation display device 51 performs request operations of various processes for the pipeline management supporting server 1 and acquires and displays the results of the calculation processing and the like from the pipeline management supporting server 1.
- the results of the calculation processing includes the degradation state diagnostic information and abnormality determination result detection information that is generated by examining the possible abnormality detection information and the degradation state diagnostic information in comparison and are specifically described below.
- the operation display device 51 includes an operation unit such as a keyboard or a mouse and a display unit such as a display.
- the operation display device 51 can perform plural connected operations to the pipeline management supporting server 1.
- the vibration sensor(s) 31 is arranged in a water supply pipeline 40 in a manhole 41 or on the road or the surface of the ground immediately above the water supply pipeline 40 (vibration propagation under the ground). A sensor number is given for the vibration sensor(s) 31.
- the flow rate sensor(s) 32 is arranged in the water supply pipeline 40 in the manhole 40.
- the vibration sensor(s) 31 is, for example, a high-sensitivity vibration sensor(s) (e.g., a vibration sensor with a voltage sensitivity: about 20 mV/(m/s 2 ) and the minimum detection acceleration: about 0.01 m/s 2 ) and contains a processing circuit that performs A/D conversion, primary filtering processing, and the like, a battery, a short-range wireless module, and the like.
- the flow rate sensor(s) 32 is utilized and connected for the purpose of requiring a measurement device(s) other than the vibration sensor(s) to detect a water-leakage or predict degradation.
- the flow rate sensor(s) 32 can be, for example, an ultrasonic flow rate sensor(s) or the like.
- Such flow rate sensor can be arranged by a method capable of attaching the flow rate sensor(s) afterward without requiring boring a pipe component of a pipeline and processing such as cutting and the like.
- the accuracy of the vibration sensor(s) 31 is reduced in some cases by air bubbles, contaminations, and the like. In order to prevent this reduction, it is preferable to use the vibration sensor(s) 31 and the flow arte sensor 32 in combination.
- the mobile terminal 21 and/or the fixed relay station 22 functions as the data collection transmission terminal(s). That is, the mobile terminal 21 and/or the fixed relay station 22 receives vibration data or flow rate data measured by plural vibration sensors (vibration measurement devices) 31 or plural flow rate sensors (flow rate measurement devices) 32 through a short-range wireless communication.
- the mobile terminal 21 and/or the fixed relay station 22 sends the received vibration data or the received flow rate data to the pipeline management supporting server 1 through the communication network 4.
- the mobile terminal 21 and/or the fixed relay station 22 may subject the received vibration data or the received flow rate data to secondary processing, for example, before sending, so that the received vibration data or the received flow rate data become transmittable.
- the mobile terminal 21 may receive results of the processes in the pipeline management supporting server 1 and may have a display function which enables the mobile terminal 21 to find out the state of a water-leakage or the like at a site, for example.
- the asset management system 5 includes the AMDB 131 as mentioned above.
- the AMDB 131 stores asset database data.
- the asset management system 5 manages data of the pipe attributes and the aging state in the asset database data, the soundness assessment by degradation checking/investigation circumstances, and the hazard assessment by the consideration of an influence of an earthquake disaster and the like, for example.
- the asset management system 5 is linked with the private data processing unit 11 in the pipeline management supporting server 1, for example.
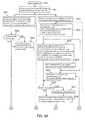
- the vibration data of the vibration measurement device(s) 31 (and the flow rate data of the flow rate measurement device(s) 32) arranged in each pipeline are collected to the pipeline management supporting server 1 regularly or as required via the mobile terminal 21 and/or the fixed relay station 22. Afterward, processes of abnormality determination result detection, a degradation evaluation, and a soundness evaluation are performed in the pipeline management supporting server 1. The results of the processes are read by and output to the operation display device 51 of the management center 2 in each business entity. Moreover, the pipeline management supporting server 1 is linked with the asset management system 5, for example, to support consideration of the medium- to long-term replacement/investment plan. The procedures of the processes in the pipeline management supporting server 1 are described below with reference to FIGs. 1 to 6B .
- Step S1 measurement data are acquired by an event data acquisition section 114 (Step S1). Afterward, a pipeline and a location pertaining to the measurement data are found out by checking the sensor number of the vibration sensor against the management database by a possible abnormality detection section 113 (Step S2).
- the possible abnormality detection section 113 subjects the vibration data of each vibration measurement device 31 alone to relative evaluation of acceleration variation with respect to the time axis in a characteristic frequency band of a target pipeline and performs correlation prediction analysis such as invariant analysis technique (Step SA1). By this analysis, a possible abnormality is detected (Step SA2). In both of the case where there is generation of possible abnormality (Yes) and the case where there is no generation of possible abnormality (No), the vibration data and the analysis results are stored and accumulated in the MDB 112 (Step SA3) (Private data processing).
- a frequency response graph shown in FIG. 3 is determined from the measurement data by Fourier transformation or the like.
- the sensor output voltage in the characteristic frequency band is increased in the abnormality state.
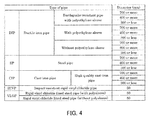
- the pipeline attribute categories based on the pipeline database data can be, for example, pipeline attribute categories shown in FIG. 4 .
- pipelines are categorized by the type of pipe and the diameter (mm).
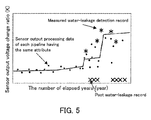
- the sensor output processing data and the water-leakage results are plotted (the measurement data are superimposed on the real events), and for example, on the basis of the management database data categorized according to the diameter that is a pipeline attribute category shown in FIG 4 , an aging characteristic graph (aging change graph) is formed (Step SC3) (Statistical calculation processing).
- An example of the aging characteristic graph is shown in FIG.
- the vertical axis indicates the sensor output voltage change ratio (K) that is the sensor output processing data
- the horizontal axis indicates the number of elapsed years
- "*” represents a water-leakage detection record at the time of measurement (measured water-leakage detection record)
- ⁇ represents a past water-leakage record.
- step SC4 in view of an interval of acquiring measurement data, a cycle of updating plots for each pipeline is previously set, and when new measurement data are acquired in the step SC5, the aging characteristic graph is updated on the basis of the update cycle.
- Step SC6 with respect to the circumstances of the aging characteristic graph prepared according to the diameter that is a pipeline attribute category, whether or not there is a singular point is checked, and when there is a singular point, the basic data (sensor output processing data in a characteristic frequency band) of the singular point are checked and reconsidered using the operation display element 51 (Step SC7).
- the step SC8 the deviation of the aging characteristic graph from an averaging curve (approximate characteristic curve) graph is found out according to the elapsed years (Statistical calculation processing).
- degradation indexes (the degradation index number of years, a degradation index output, a graph pattern, and the soundness) are extracted and set from the aging characteristic graph prepared according to the diameter that is a pipeline attribute category) (Statistical calculation processing).
- the degradation index number of years is the number of elapsed years in which a water-leakage frequency becomes high, i.e., the number of elapsed years at a point with a large variation of the sensor output processing data at around the number of elapsed years.
- the variation point can be extracted from a slope change by differentiation, and the number of the variation points may be plural.
- the degradation index output is a sensor output processing data value corresponding to the degradation index number of years.
- the graph pattern is a numerically converted graph shape such as the number of variation points in the sensor output processing data, an output slope change in a range of the small number of elapsed years, and the like and is preferably expressed by a mathematical formula using an approximate formula that can be partitioned.
- the number of elapsed years that is the number of elapsed years at the variation point of the final sensor output processing data or more is set as a maximum value, and three or five indexes are set in view of the number of degradation index years, the degradation index output, the variation of output by the number of elapsed years, and statutory useful life.
- the statistical processing results such as aging characteristics categorized according to the diameter that is a pipeline attribute category, the aging deviation, the degradation indexes, the water-leakage generation frequency, the correlation with disturbance energy, and the like are stored and accumulated in the SDB 121.
- the abnormality determination result detection and the degradation evaluation by measurement of only single target, are realistically impossible because of requirement of a lapse of decades. Therefore, a water-leakage generation frequency (e.g., case/100 km/year) is statistically determined from past water-leakage records (Step SC11).
- a surrounding load application (vehicle driving vibration and the like).
- Step SB1 vibration data per unit time measured randomly in daytime and nighttime are subjected to integration processing.
- Step SB2 disturbance energy in management of each target is determined.
- step SB2 numerical values of degradation indexes (the number of years, outputs) with respect to the magnitude of the disturbance energy are organized in a table or a graph. By the organization results, an approximate formula is expressed by a mathematical formula if possible (Statistical calculation processing).
- step SA4 the possible abnormality evaluation analyzed with respect to the measurement data of the vibration measurement device(s) arranged in each pipeline, an evaluation by the degradation indexes determined by the statistical calculation processing unit 12, and an evaluation by the disturbance energy index are performed.
- step SA5 with respect to the measurement results exceeding previously-set certain conditions (Yes), a water-leakage alarm and a degradation alarm are activated (Step SA6), and the measurement results are output by the information output section 115 (Step SA8).
- Step SA7 on the basis of the measurement results, the corresponding soundness is determined.
- step SA9 the results of the water-leakage determination, the degradation abnormality determination, and the soundness determination are stored and accumulated in the MDB 112. Furthermore, in the step SA10, degradation diagnostic information including the soundness is reflected in the asset management system 5 (Private data processing).
- the installation year is estimated through determination of the predicted number of elapsed years by comparing the aging characteristic graph prepared according to the diameter that is a pipeline attribute category and the vibration measurement values of a target pipeline in the step SD1. Afterward, in the step SD2, the estimated installation year is reflected in the attribute data on the MDB 112.
- step SD3 by repeatedly performing labeling based on measurement results (labeling by input processing to aging characteristics categorized according to the diameter that is a pipeline attribute category, an update of the labeling by input processing to the disturbance energy evaluation) or reconsidering and updating setting of the conditions for the alarm determination, the accuracy of the water-leakage detection, the degradation prediction, and the soundness evaluation can be improved (Statistical calculation processing).
- the determination accuracy can be further improved by connecting, for example, measurement device(s) such as a flow rate measurement device(s) and the like in addition to the vibration measurement device(s).
- measurement device(s) such as a flow rate measurement device(s) and the like in addition to the vibration measurement device(s).
- a method capable of attaching these measurement device(s) afterward without requiring boring a pipe component of a pipeline and processing such as cutting and the like can be used.
- an ultrasonic flow rate measurement device(s) is arranged adjacent to the upstream side(s) of a vibration measurement device(s) (the number of the flow rate measurement devices to be arranged can be less than the vibration measurement device(s)) and measures a flow rate.
- a reflection of the water-leakage determination and the like in the asset management system 5 is described with reference to an example.
- the hazard of each pipeline considering factors of the environmental conditions is considered.
- a diameter correction coefficient, a liquefaction correction coefficient, and a standard damage ratio by earthquake intensity of each pipeline to be managed are considered and set to determine the hazard on the basis of conventionally known references and documents such as the "conference report on earthquake resistance of pipeline” (Ministry of Health, Labour and Welfare, Conference of earthquake resistance of pipeline) and the "technical research and development report on prediction and search for damage to water supply by earthquake” (Japan Water Research Center).
- Mapping of a pipeline database is superimposed on a hazard map in which prediction of a liquefaction area and earthquake intensity by area are performed to set the liquefaction correction coefficient and the standard damage ratio by earthquake intensity, of each target pipeline.
- a replacement plan is considered.
- the asset management can be performed with reference to, for example, the "instruction regarding asset management in water supply business" (Ministry of Health, Labour and Welfare).
- the priority for replacement of pipeline to be managed is set on the basis of the soundness determination and the hazard determination based on the measurement results of each pipeline, a replacement demand outlook is developed on the basis of the estimation of life cycle cost of each pipeline, and the operable medium- to long-term replacement plan (including a repair and an implementation method) and the operable medium- to long-term investment plan are developed by comparing with the fiscal balance outlook.
- a pipeline management supporting server and a pipeline management supporting system capable of unifying management of attribute data of a pipe component and location information on a pipe network, efficiently detecting an abnormality of a pipeline remotely, and diagnosing the degradation state of the pipeline, can be provided.
- the pipeline to be managed is a water supply pipeline
- the pipeline to be managed in the present invention is not limited to the water supply pipeline, and the present invention is applicable to a wide range of field such as pipeline networks of plants and energy-related facilities such as pipelines of oil and gas and the like.
Landscapes
- Engineering & Computer Science (AREA)
- Physics & Mathematics (AREA)
- Business, Economics & Management (AREA)
- General Physics & Mathematics (AREA)
- Economics (AREA)
- Human Resources & Organizations (AREA)
- Theoretical Computer Science (AREA)
- Strategic Management (AREA)
- Health & Medical Sciences (AREA)
- Entrepreneurship & Innovation (AREA)
- Marketing (AREA)
- General Business, Economics & Management (AREA)
- Tourism & Hospitality (AREA)
- Data Mining & Analysis (AREA)
- Operations Research (AREA)
- General Health & Medical Sciences (AREA)
- Mathematical Analysis (AREA)
- Mathematical Physics (AREA)
- Pure & Applied Mathematics (AREA)
- Mathematical Optimization (AREA)
- Computational Mathematics (AREA)
- Life Sciences & Earth Sciences (AREA)
- Primary Health Care (AREA)
- Water Supply & Treatment (AREA)
- Development Economics (AREA)
- Educational Administration (AREA)
- Public Health (AREA)
- Game Theory and Decision Science (AREA)
- Quality & Reliability (AREA)
- Fluid Mechanics (AREA)
- Algebra (AREA)
- Bioinformatics & Cheminformatics (AREA)
- Pathology (AREA)
- Evolutionary Biology (AREA)
- Immunology (AREA)
- Biochemistry (AREA)
- Probability & Statistics with Applications (AREA)
- Analytical Chemistry (AREA)
- Bioinformatics & Computational Biology (AREA)
- Chemical & Material Sciences (AREA)
Abstract
Description
- The present invention relates to a pipeline management supporting server and a pipeline management supporting system.
- As a technique of managing pipelines such as a water supply pipeline and the like, there is an management database mapping system in which a pipeline database and a map are combined. The pipeline database is a collection of attribute data (the type of pipe, the diameter, the installation year, and the like) of pipe components configuring a pipeline. The map shows a location of a pipe network of the pipeline. In the management database mapping, the attribute data of a pipe component configuring a pipeline and the location information data of a pipe network can be uniformly managed and can be shown by superimposing them on the map. On the other hand, as maintenance of the pipeline, for example, there is a water-leakage detection in a water supply pipeline. Examples of the water-leakage detection include a measurement at plural locations by loggers, a measurement at two locations and correlation analysis between them, and a measurement of sound. Among them, the measurement of sound is performed as follows. A skilled worker goes to a site in the midnight with little noise to detect a water-leakage sound from the surface of the ground, a manhole, or the like. Moreover, in order to maintain and manage a water supply pipeline network, a system in which a flow rate measurement device, a pressure measurement device, or a vibration measurement device is attached to a target pipeline, collected measurement data are sent to a remote central processing center, and an abnormality such as a water-leakage is detected on the basis of the measurement data has been proposed (Patent Document 1).
- Patent Document 1:
JP H8-96039 A - In the conventional management database mapping system, although attribute data of a pipe component and location information on a pipe network can be uniformly managed, an abnormality of a pipeline cannot be detected. Moreover, in the conventional technique of detecting a water-leakage and the like, the detection is performed on site, skilled workers are required specifically for the measurement of sound, and the operation of the measurement is complicated. That is to say, the conventional technique is not efficient. In contrast, in the system proposed in the
Patent Document 1, attribute data of a pipe component and location information on a pipe network can be uniformly managed, and further, an abnormality of a pipeline can be detected remotely. That is to say, the system ofPatent Document 1 is efficient. Although the detection of a water-leakage is important, it is further required to predict an abnormality such as a water-leakage in advance from the viewpoint of limited water resources, economy, and prevention of disasters caused by a cave in the road and the like by a water-leakage. However, in the system of thePatent Document 1, although an abnormality can be detected, the degradation state of a pipeline cannot be diagnosed. Such problem occurs not only in management of water supply pipeline networks but also in pipeline networks of plants and energy-related facilities such as pipelines of oil and gas and the like. - Hence, the present invention is intended to provide a pipeline management supporting server and a pipeline management supporting system, capable of unifying management of attribute data of a pipe component and location information on a pipe network, efficiently detecting an abnormality of a pipeline remotely, and diagnosing the degradation state of the pipeline.
- In order to achieve the aforementioned objects, the pipeline management supporting server of the present invention is a pipeline management supporting server including: a private data processing unit; and a statistical calculation processing unit, wherein the private data processing unit includes: an event data acquisition section that acquires event data of a pipeline measured by at least one sensor; a measured event data storage section that stores the event data of the pipeline; a pipeline database data storage section that accumulates pipeline database data; a possible abnormality detection section; and an information output section, wherein the possible abnormality detection section identifies a pipeline and a location pertaining to the acquired event data of the pipeline with reference to the pipeline database data stored in the pipeline database data storage section and generates possible abnormality detection information on the acquired event data of the pipeline, the statistical calculation processing unit includes: a data analysis section; and a statistical calculation data storage section that stores statistical calculation data, wherein the data analysis section prepares, from event data of plural pipelines each having the same attribute as the pipeline pertaining to the event data acquired by the private data processing unit, an aging characteristic graph of the plural pipelines, the statistical calculation data storage section stores the aging characteristic graph prepared by the data analysis section, the data analysis section further generates degradation state diagnostic information on the pipeline pertaining to the event data acquired by the private data processing unit by checking the pipeline against the aging characteristic graph, and the information output section of the private processing unit outputs the degradation state diagnostic information and abnormality determination result detection information that is generated by examining the possible abnormality detection information and the degradation state diagnostic information in comparison.
- The pipeline management supporting system of the present invention is a pipeline management supporting system including: a pipeline management supporting server; at least one sensor; an operation display device; at least one data collection transmission terminal; and a communication network, wherein the pipeline management supporting server is the pipeline management supporting server according to the present invention, event data measured by the at least one sensor are sent to the pipeline management supporting server by the at least one data collection transmission terminal through the communication network, and abnormality determination result detection information and degradation state diagnostic information output from the pipeline management supporting server are acquirable by the operation display device via the communication network.
- The present invention makes it possible to uniformly manage attribute data of a pipe component and location information on a pipe network, efficiently detect an abnormality of a pipeline remotely, and diagnose the degradation state of the pipeline.
-
- [
FIG 1] FIG. 1 is a block diagram showing a configuration of an example of the pipeline management supporting server according to the present invention. - [
FIG 2] FIG. 2 is an explanatory drawing showing a configuration of an example of the pipeline supporting system according to the present invention. - [
FIG. 3] FIG. 3 is a graph showing an example of vibration data in an example of the present invention. - [
FIG 4] FIG. 4 is an explanatory drawing showing an example of management database data in an example of the present invention. - [
FIG. 5] FIG 5 is an example of an aging characteristic graph in an example of the present invention. - [
FIG. 6A] FIG. 6A is a flow chart showing an example of a processing flow in the pipeline management supporting server according to the present invention. - [
FIG. 6B] FIG. 6B is a flow chart showing another example of a processing flow in the pipeline management supporting server according to the present invention. - In the pipeline management supporting server of the present invention, as substitute for generating an aging characteristic graph by the data analysis section, the statistical calculation data storage section may include a previously-prepared aging characteristic graph of pipelines each having the same attribute as the pipeline pertaining to the event data acquired by the private data processing unit, and the data analysis section may generate degradation state diagnostic information on the pipeline pertaining to the event data acquired by the private data processing unit by checking the pipeline against the previously-prepared aging characteristic graph.
- In the pipeline management supporting server of the present invention, it is preferred that the statistical calculation processing unit further includes a calculation processing correction section, and the calculation processing correction section updates the aging characteristic graph on the basis of the acquired event data.
- In the statistical calculation processing unit of the pipeline management supporting server of the present invention, it is preferred that the data analysis section further extracts disturbance energy data included in the event data and prepares a disturbance energy characteristic graph on the basis of the disturbance energy data.
- In the statistical calculation processing unit of the pipeline management supporting server of the present invention, it is preferred that the degradation state diagnostic information generated by the data analysis section is at least one of degradation index evaluation information and soundness index evaluation information on the pipeline.
- In a preferred aspect of the pipeline management supporting server of the present invention, the at least one sensor includes at least one vibration sensor, and the event data include vibration data acquired by the at least one vibration sensor is preferable. In this aspect, it is preferred that the at least one sensor further includes at least one flow rate sensor, and the event data include flow rate data acquired by the at least one flow rate sensor.
- In the pipeline management supporting server of the present invention, the pipeline to be managed preferably is a water supply pipeline.
- The embodiment of the present invention is described below. The following embodiment, however, is merely an example of the present invention, and the present invention is not at all limited by the following embodiment.
-
FIG. 1 is a block diagram showing an example of a configuration of the pipeline management supporting server according to the present invention.FIG. 2 is an example of a configuration of the pipeline management supporting system according to the present invention. The present embodiment is described with reference to, as an example, the case where a pipeline to be managed is a water supply pipeline. InFIGs. 1 and2 , the identical parts are denoted by identical reference numerals. - As shown in
FIG 2 , this pipeline management supporting system includes a pipelinemanagement supporting server 1, a vibration sensor(s) (vibration measurement device(s)) 31 and a flow rate sensor(s) (flow rate measurement device(s)) 32 as the at least one sensor, an operation display device (client PC) 51 arranged in amanagement center 2 of a business entity, and amobile terminal 21 and/or afixed relay station 22 as the at least one data collection transmission terminal. The flow rate sensor(s) 32 is an optional component, may not be included, and is preferably included. The client PC 51 is, for example, a PC in the Waterworks Bureau of each municipality. Anasset management system 5 is connected to the pipelinemanagement supporting server 1. Theasset management system 5 includes an asset management database data storage section (AMDB) 131. In this pipeline management supporting system, the pipelinemanagement supporting server 1 is connected to themobile terminal 21 and/or thefixed relay station 22 in afield 3 and theoperation display device 51 in themanagement center 2 via acommunication network 4. Thecommunication network 4 is not particularly limited, and a conventionally known communication network can be used. Thecommunication network 4 may be a wired communication network or a wireless communication network, and examples thereof include a telephone network, the Internet, and LAN (local-area network). - The pipeline
management supporting server 1 is, for example, arranged in a data center (operated in the cloud environment), collects data (vibration data and flow rate data) measured by many vibration measurement devices 31 (and flow rate measurement devices 32) in plural business entities via amobile terminal 21 and/or a fixedrelay station 22, and outputs processing results such as an abnormality detection, a function correction, the degradation state, and the like to anoperation display device 51 as the degradation state diagnostic information and abnormality determination result detection information that is generated by examining the possible abnormality detection information and the degradation state diagnostic information in comparison. The vibration data and the flow rate data correspond to the "event data" of the present invention. - As shown in
FIGs. 1 and2 , the pipelinemanagement supporting server 1 includes a privatedata processing unit 11 and a statisticalcalculation processing unit 12 as main components. The privatedata processing unit 11 includes a pipeline database data storage section (PDB) 111, a measured event data storage section (MDB) 112, a possibleabnormality detection section 113, an eventdata acquisition section 114, and aninformation output section 115. The statisticalcalculation processing unit 12 includes a statistical calculation data storage section (SDB) 121 and adata analysis section 122 and further includes a calculationprocessing correction section 123. The calculationprocessing correction section 123 is an optional component, may not be included, and is preferably included. The eventdata acquisition section 114 is connected to theMDB 112, the possibleabnormality detection section 113, and thedata analysis section 122. ThePDB 111 is connected to theMDB 112 and thedata analysis section 122. TheMDB 112 is connected to the possibleabnormality detection section 113. The possibleabnormality detection section 113 is connected to theinformation output section 115. Theinformation output section 115 is connected to theMDB 112. Thedata analysis section 122 is connected to theSDB 121. TheSDB 121 is connected to theinformation output section 115. The calculationprocessing correction section 123 is connected to theSDB 121. - The private
data processing unit 11 generates abnormality determination result detection information. Specifically, in the privatedata processing unit 11, the eventdata acquisition section 114 acquires vibration data and flow rate data (event data) of a pipeline, measured by the vibration sensor(s) 31 and the flow rate sensor(s) 32. TheMDB 112 stores the event data. ThePDB 111 stores a pipeline database data. The possibleabnormality detection section 113 identifies a pipeline and a location pertaining to the acquired event data with reference to the pipeline database data. The possibleabnormality detection section 113 generates possible abnormality detection information on the acquired event data by time correlation analysis such as an invariant analysis technique. The determination of abnormality or normality is performed by examining this possible abnormality detection information and degradation state diagnostic information that is generated by thedata analysis section 122 in the statisticalcalculation processing unit 12 described below in comparison. By the determination, the abnormality determination result detection information is generated. Afterward, theinformation output section 115 outputs the abnormality determination result detection information and the degradation state diagnostic method to theoperation display device 51. - The statistical
calculation processing unit 12 is intended to improve the accuracy of a citation function as interpolation of the statistical calculation, the determination logic, and the like. In order to handle more event data (measurement data such as vibration data and flow rate data), measurement data on each business entity are collected, and on the basis of the measurement data, the statistical calculation processing is performed. Afterward, the results of the statistical calculation are reflected to private processing for each business entity. In the statisticalcalculation processing unit 12, thedata analysis section 122 prepares, from event data on plural (preferably many) pipelines each having the same attribute as the pipeline pertaining to the event data acquired by the privatedata processing unit 11, an aging characteristic graph of the plural pipelines. The statistical calculationdata storage section 121 stores statistical calculation data and the aging characteristic graph prepared by thedata analysis section 122. Thedata analysis section 122 further generates degradation state diagnostic information on the pipeline pertaining to the event data acquired by the privatedata processing unit 11 by checking the pipeline against the aging characteristic graph. In the pipelinemanagement supporting server 1, as substitute for generating an aging characteristic graph by thedata analysis section 122, the statistical calculationdata storage section 121 may include a previously-prepared aging characteristic graph of pipelines each having the same attribute as the pipeline pertaining to the event data acquired by the privatedata processing unit 11, and thedata analysis section 122 may generate degradation state diagnostic information on the pipeline pertaining to the event data acquired by the privatedata processing unit 11 by checking the pipeline against the previously-prepared aging characteristic graph. The calculationprocessing correction section 123 updates the aging characteristic graph on the basis of the event data acquired by the privatedata processing unit 11. - The
management center 2 can be, for example, a management center in the Waterworks Bureau of each municipality. The operation display device (client PC) 51 is, as mentioned above, arranged in themanagement center 2 of each business entity. Theoperation display device 51 performs request operations of various processes for the pipelinemanagement supporting server 1 and acquires and displays the results of the calculation processing and the like from the pipelinemanagement supporting server 1. The results of the calculation processing includes the degradation state diagnostic information and abnormality determination result detection information that is generated by examining the possible abnormality detection information and the degradation state diagnostic information in comparison and are specifically described below. Theoperation display device 51 includes an operation unit such as a keyboard or a mouse and a display unit such as a display. Theoperation display device 51 can perform plural connected operations to the pipelinemanagement supporting server 1. - In the
field 3, the vibration sensor(s) 31 is arranged in awater supply pipeline 40 in amanhole 41 or on the road or the surface of the ground immediately above the water supply pipeline 40 (vibration propagation under the ground). A sensor number is given for the vibration sensor(s) 31. The flow rate sensor(s) 32 is arranged in thewater supply pipeline 40 in themanhole 40. The vibration sensor(s) 31 is, for example, a high-sensitivity vibration sensor(s) (e.g., a vibration sensor with a voltage sensitivity: about 20 mV/(m/s2) and the minimum detection acceleration: about 0.01 m/s2) and contains a processing circuit that performs A/D conversion, primary filtering processing, and the like, a battery, a short-range wireless module, and the like. The flow rate sensor(s) 32 is utilized and connected for the purpose of requiring a measurement device(s) other than the vibration sensor(s) to detect a water-leakage or predict degradation. The flow rate sensor(s) 32 can be, for example, an ultrasonic flow rate sensor(s) or the like. Such flow rate sensor can be arranged by a method capable of attaching the flow rate sensor(s) afterward without requiring boring a pipe component of a pipeline and processing such as cutting and the like. The accuracy of the vibration sensor(s) 31 is reduced in some cases by air bubbles, contaminations, and the like. In order to prevent this reduction, it is preferable to use the vibration sensor(s) 31 and the flow artesensor 32 in combination. - The
mobile terminal 21 and/or the fixedrelay station 22 functions as the data collection transmission terminal(s). That is, themobile terminal 21 and/or the fixedrelay station 22 receives vibration data or flow rate data measured by plural vibration sensors (vibration measurement devices) 31 or plural flow rate sensors (flow rate measurement devices) 32 through a short-range wireless communication. Themobile terminal 21 and/or the fixedrelay station 22 sends the received vibration data or the received flow rate data to the pipelinemanagement supporting server 1 through thecommunication network 4. Themobile terminal 21 and/or the fixedrelay station 22 may subject the received vibration data or the received flow rate data to secondary processing, for example, before sending, so that the received vibration data or the received flow rate data become transmittable. Themobile terminal 21 may receive results of the processes in the pipelinemanagement supporting server 1 and may have a display function which enables themobile terminal 21 to find out the state of a water-leakage or the like at a site, for example. - The
asset management system 5 includes theAMDB 131 as mentioned above. TheAMDB 131 stores asset database data. Theasset management system 5 manages data of the pipe attributes and the aging state in the asset database data, the soundness assessment by degradation checking/investigation circumstances, and the hazard assessment by the consideration of an influence of an earthquake disaster and the like, for example. Theasset management system 5 is linked with the privatedata processing unit 11 in the pipelinemanagement supporting server 1, for example. By this linking, on the basis of the above-mentioned data, the life cycle cost of each pipeline is estimated, and the replacement demand of a managed entire pipeline is predicted, and the life cycle cost and the replacement demand are considered by comparing with the fiscal balance outlook to support the medium- to long-term replacement/investment plan. - As mentioned above, the vibration data of the vibration measurement device(s) 31 (and the flow rate data of the flow rate measurement device(s) 32) arranged in each pipeline are collected to the pipeline
management supporting server 1 regularly or as required via themobile terminal 21 and/or the fixedrelay station 22. Afterward, processes of abnormality determination result detection, a degradation evaluation, and a soundness evaluation are performed in the pipelinemanagement supporting server 1. The results of the processes are read by and output to theoperation display device 51 of themanagement center 2 in each business entity. Moreover, the pipelinemanagement supporting server 1 is linked with theasset management system 5, for example, to support consideration of the medium- to long-term replacement/investment plan. The procedures of the processes in the pipelinemanagement supporting server 1 are described below with reference toFIGs. 1 to 6B . - First, as mentioned above, measurement data are acquired by an event data acquisition section 114 (Step S1). Afterward, a pipeline and a location pertaining to the measurement data are found out by checking the sensor number of the vibration sensor against the management database by a possible abnormality detection section 113 (Step S2).
- The possible
abnormality detection section 113 subjects the vibration data of eachvibration measurement device 31 alone to relative evaluation of acceleration variation with respect to the time axis in a characteristic frequency band of a target pipeline and performs correlation prediction analysis such as invariant analysis technique (Step SA1). By this analysis, a possible abnormality is detected (Step SA2). In both of the case where there is generation of possible abnormality (Yes) and the case where there is no generation of possible abnormality (No), the vibration data and the analysis results are stored and accumulated in the MDB 112 (Step SA3) (Private data processing). - Aging characteristics of pipeline(s) having the same attribute as the target pipeline are obtained by statistical consideration processing based on the pipeline database data, using the
data analysis section 122. Specifically, first, in the step SC1, a frequency response graph shown inFIG. 3 is determined from the measurement data by Fourier transformation or the like. In the graph, the sensor output voltage change ratio b/a = K assuming that the sensor output voltage in the normality state is a (mVrms), and the measured sensor output voltage is b (mVrms) in the characteristic frequency band of the target pipeline or the integration ratio SB/SA in the characteristic frequency band is determined as a non-dimensional sensor output processing data (Step SC2). As shown inFIG 3 , the sensor output voltage in the characteristic frequency band is increased in the abnormality state. Moreover, large amounts of measurement data of pipelines with the various numbers of elapsed years from installation are collected by pipeline attribute categories based on the pipeline database data. The pipeline attribute categories based on the pipeline database data can be, for example, pipeline attribute categories shown inFIG. 4 . As shown inFIG. 4 , in these pipeline attribute categories, pipelines are categorized by the type of pipe and the diameter (mm). Afterward, the sensor output processing data and the water-leakage results are plotted (the measurement data are superimposed on the real events), and for example, on the basis of the management database data categorized according to the diameter that is a pipeline attribute category shown inFIG 4 , an aging characteristic graph (aging change graph) is formed (Step SC3) (Statistical calculation processing). An example of the aging characteristic graph is shown inFIG. 5 . InFIG 5 , the vertical axis indicates the sensor output voltage change ratio (K) that is the sensor output processing data, the horizontal axis indicates the number of elapsed years, "*" represents a water-leakage detection record at the time of measurement (measured water-leakage detection record), and "×" represents a past water-leakage record. - In the step SC4, in view of an interval of acquiring measurement data, a cycle of updating plots for each pipeline is previously set, and when new measurement data are acquired in the step SC5, the aging characteristic graph is updated on the basis of the update cycle.
- Subsequently, in the step SC6, with respect to the circumstances of the aging characteristic graph prepared according to the diameter that is a pipeline attribute category, whether or not there is a singular point is checked, and when there is a singular point, the basic data (sensor output processing data in a characteristic frequency band) of the singular point are checked and reconsidered using the operation display element 51 (Step SC7). Moreover, in the step SC8, the deviation of the aging characteristic graph from an averaging curve (approximate characteristic curve) graph is found out according to the elapsed years (Statistical calculation processing).
- Subsequently, in the step SC9, degradation indexes (the degradation index number of years, a degradation index output, a graph pattern, and the soundness) are extracted and set from the aging characteristic graph prepared according to the diameter that is a pipeline attribute category) (Statistical calculation processing). The degradation index number of years is the number of elapsed years in which a water-leakage frequency becomes high, i.e., the number of elapsed years at a point with a large variation of the sensor output processing data at around the number of elapsed years. The variation point can be extracted from a slope change by differentiation, and the number of the variation points may be plural. The degradation index output is a sensor output processing data value corresponding to the degradation index number of years. The graph pattern is a numerically converted graph shape such as the number of variation points in the sensor output processing data, an output slope change in a range of the small number of elapsed years, and the like and is preferably expressed by a mathematical formula using an approximate formula that can be partitioned. For the soundness, the number of elapsed years that is the number of elapsed years at the variation point of the final sensor output processing data or more is set as a maximum value, and three or five indexes are set in view of the number of degradation index years, the degradation index output, the variation of output by the number of elapsed years, and statutory useful life.
- In the step SC10, the statistical processing results such as aging characteristics categorized according to the diameter that is a pipeline attribute category, the aging deviation, the degradation indexes, the water-leakage generation frequency, the correlation with disturbance energy, and the like are stored and accumulated in the
SDB 121. The abnormality determination result detection and the degradation evaluation, by measurement of only single target, are realistically impossible because of requirement of a lapse of decades. Therefore, a water-leakage generation frequency (e.g., case/100 km/year) is statistically determined from past water-leakage records (Step SC11). Moreover, as a cause of water-leakage, there is a surrounding load application (vehicle driving vibration and the like). Thus, vibration data per unit time measured randomly in daytime and nighttime are subjected to integration processing. By this process, disturbance energy in management of each target is determined (Step SB1). Afterward, in the step SB2, numerical values of degradation indexes (the number of years, outputs) with respect to the magnitude of the disturbance energy are organized in a table or a graph. By the organization results, an approximate formula is expressed by a mathematical formula if possible (Statistical calculation processing). - Subsequently, in the step SA4, the possible abnormality evaluation analyzed with respect to the measurement data of the vibration measurement device(s) arranged in each pipeline, an evaluation by the degradation indexes determined by the statistical
calculation processing unit 12, and an evaluation by the disturbance energy index are performed. Afterward, in the step SA5, with respect to the measurement results exceeding previously-set certain conditions (Yes), a water-leakage alarm and a degradation alarm are activated (Step SA6), and the measurement results are output by the information output section 115 (Step SA8). Furthermore, in the step SA7, on the basis of the measurement results, the corresponding soundness is determined. Afterward, in the step SA9, the results of the water-leakage determination, the degradation abnormality determination, and the soundness determination are stored and accumulated in theMDB 112. Furthermore, in the step SA10, degradation diagnostic information including the soundness is reflected in the asset management system 5 (Private data processing). - When there is a pipeline with an unknown installation year due to an error in the pipeline database, the installation year is estimated through determination of the predicted number of elapsed years by comparing the aging characteristic graph prepared according to the diameter that is a pipeline attribute category and the vibration measurement values of a target pipeline in the step SD1. Afterward, in the step SD2, the estimated installation year is reflected in the attribute data on the
MDB 112. - In the step SD3, by repeatedly performing labeling based on measurement results (labeling by input processing to aging characteristics categorized according to the diameter that is a pipeline attribute category, an update of the labeling by input processing to the disturbance energy evaluation) or reconsidering and updating setting of the conditions for the alarm determination, the accuracy of the water-leakage detection, the degradation prediction, and the soundness evaluation can be improved (Statistical calculation processing).
- In the detection of abnormality such as a water-leakage or the like and the degradation prediction, as in the present embodiment, the determination accuracy can be further improved by connecting, for example, measurement device(s) such as a flow rate measurement device(s) and the like in addition to the vibration measurement device(s). For these measurement device(s), a method capable of attaching these measurement device(s) afterward without requiring boring a pipe component of a pipeline and processing such as cutting and the like can be used. For example, an ultrasonic flow rate measurement device(s) is arranged adjacent to the upstream side(s) of a vibration measurement device(s) (the number of the flow rate measurement devices to be arranged can be less than the vibration measurement device(s)) and measures a flow rate. In the case of an increase in flow rate in a time period in which a water supply is less utilized such as early morning and midnight or an increase in total flow rate in a certain period of time, a possibility of water-leakage is increased. In contrast, when the flow rate is reduced, degradation due to narrowing a flow path by scale adhesion/deposition and the like is expected. The measurement device(s) is used considering the concerns of reduction in accuracy due to air bubbles, contaminations, and the like.
- Next, a reflection of the water-leakage determination and the like in the
asset management system 5 is described with reference to an example. The hazard of each pipeline considering factors of the environmental conditions is considered. For example, a diameter correction coefficient, a liquefaction correction coefficient, and a standard damage ratio by earthquake intensity of each pipeline to be managed are considered and set to determine the hazard on the basis of conventionally known references and documents such as the "conference report on earthquake resistance of pipeline" (Ministry of Health, Labour and Welfare, Conference of earthquake resistance of pipeline) and the "technical research and development report on prediction and search for damage to water supply by earthquake" (Japan Water Research Center). Mapping of a pipeline database is superimposed on a hazard map in which prediction of a liquefaction area and earthquake intensity by area are performed to set the liquefaction correction coefficient and the standard damage ratio by earthquake intensity, of each target pipeline. - By linking with the
asset management system 5, a replacement plan is considered. The asset management can be performed with reference to, for example, the "instruction regarding asset management in water supply business" (Ministry of Health, Labour and Welfare). The priority for replacement of pipeline to be managed is set on the basis of the soundness determination and the hazard determination based on the measurement results of each pipeline, a replacement demand outlook is developed on the basis of the estimation of life cycle cost of each pipeline, and the operable medium- to long-term replacement plan (including a repair and an implementation method) and the operable medium- to long-term investment plan are developed by comparing with the fiscal balance outlook. - As described above, according to the present invention, a pipeline management supporting server and a pipeline management supporting system, capable of unifying management of attribute data of a pipe component and location information on a pipe network, efficiently detecting an abnormality of a pipeline remotely, and diagnosing the degradation state of the pipeline, can be provided. Although the case where the pipeline to be managed is a water supply pipeline is specifically described in the embodiment, the pipeline to be managed in the present invention is not limited to the water supply pipeline, and the present invention is applicable to a wide range of field such as pipeline networks of plants and energy-related facilities such as pipelines of oil and gas and the like.
- This application is based upon and claims the benefit of priority from Japanese patent application No.
2012-083205, filed on March 30, 2012 -
- 1
- pipeline management supporting server
- 2
- management center
- 3
- field
- 4
- communication network
- 5
- asset management system
- 11
- private data processing unit
- 12
- statistical calculation processing unit
- 21
- mobile terminal (data collection transmission terminal)
- 22
- fixed relay station (data collection transmission terminal)
- 31
- vibration sensor (sensor)
- 32
- flow rate sensor (sensor)
- 40
- water supply pipeline
- 41
- manhole
- 51
- operation display device
- 111
- pipeline database data storage section (PDB)
- 112
- measured event data storage section (MDB)
- 113
- possible abnormality detection section
- 114
- event data acquisition section
- 115
- information output section
- 121
- statistical calculation data storage section (SDB)
- 122
- data analysis section
- 123
- calculation processing correction section
- 131
- asset management database data storage section (AMDB)
Claims (9)
- A pipeline management supporting server comprising:a private data processing unit; anda statistical calculation processing unit, whereinthe private data processing unit comprises:an event data acquisition section that acquires event data of a pipeline measured by at least one sensor;a measured event data storage section that stores the event data of the pipeline;a pipeline database data storage section that stores pipeline database data;a possible abnormality detection section; andan information output section, whereinthe possible abnormality detection section identifies a pipeline and a location pertaining to the acquired event data of the pipeline with reference to the pipeline database data stored in the pipeline database data storage section and generates possible abnormality detection information on the acquired event data of the pipeline,the statistical calculation processing unit comprises:a data analysis section; anda statistical calculation data storage section that stores statistical calculation data, whereinthe data analysis section prepares, from event data of plural pipelines each having the same attribute as the pipeline pertaining to the event data acquired by the private data processing unit, an aging characteristic graph of the plural pipelines,the statistical calculation data storage section stores the aging characteristic graph prepared by the data analysis section,the data analysis section further generates degradation state diagnostic information on the pipeline pertaining to the event data acquired by the private data processing unit by checking the pipeline against the aging characteristic graph, andthe information output section of the private processing unit outputs the degradation information diagnostic method and abnormality determination result detection information that is generated by examining the possible abnormality detection information and the degradation state diagnostic information in comparison.
- The pipeline management supporting server according to claim 1, wherein
as substitute for generating an aging characteristic graph by the data analysis section, the statistical calculation data storage section includes a previously-prepared aging characteristic graph of pipelines each having the same attribute as the pipeline pertaining to the event data acquired by the private data processing unit, and
the data analysis section generates degradation state diagnostic information on the pipeline pertaining to the event data acquired by the private data processing unit by checking the pipeline against the previously-prepared aging characteristic graph. - The pipeline management supporting server according to claim 1 or 2, wherein
the statistical calculation processing unit further comprises a calculation processing correction section, and
the calculation processing correction section updates the aging characteristic graph on the basis of the acquired event data. - The pipeline management supporting server according to claim 3, wherein
in the statistical calculation processing unit, the data analysis section further extracts disturbance energy data included in the event data and prepares a disturbance energy characteristic graph on the basis of the disturbance energy data. - The pipeline management supporting server according to any one of claims 1 to 4, wherein
in the statistical calculation processing unit, the degradation state diagnostic information generated by the data analysis section is at least one of degradation index evaluation information and soundness index evaluation information on the pipeline. - The pipeline management supporting server according to any one of claims 1 to 5, wherein
the at least one sensor comprises at least one vibration sensor, and
the event data comprise vibration data acquired by the at least one vibration sensor. - The pipeline management supporting server according to claim 6, wherein
the at least one sensor further comprises at least one flow rate sensor, and
the event data comprise flow rate data acquired by the at least one flow rate sensor. - The pipeline management supporting server according to any one of claims 1 to 7, wherein
the pipeline to be managed is a water supply pipeline. - A pipeline management supporting system comprising:a pipeline management supporting server;at least one sensor;an operation display device;at least one data collection transmission terminal; anda communication network, whereinthe pipeline management supporting server is the pipeline management supporting server according to any one of claims 1 to 8,event data measured by the at least one sensor are sent to the pipeline management supporting server by the at least one data collection transmission terminal through the communication network, andabnormality determination result detection information and degradation state diagnostic information output from the pipeline management supporting server are acquirable by the operation display device via the communication network.
Applications Claiming Priority (2)
| Application Number | Priority Date | Filing Date | Title |
|---|---|---|---|
| JP2012083205 | 2012-03-30 | ||
| PCT/JP2012/084048 WO2013145493A1 (en) | 2012-03-30 | 2012-12-28 | Pipeline administration assistance device and pipeline administration assistance system |
Publications (2)
| Publication Number | Publication Date |
|---|---|
| EP2838067A1 true EP2838067A1 (en) | 2015-02-18 |
| EP2838067A4 EP2838067A4 (en) | 2015-11-04 |
Family
ID=49258822
Family Applications (1)
| Application Number | Title | Priority Date | Filing Date |
|---|---|---|---|
| EP12872855.7A Ceased EP2838067A4 (en) | 2012-03-30 | 2012-12-28 | Pipeline administration assistance device and pipeline administration assistance system |
Country Status (4)
| Country | Link |
|---|---|
| US (1) | US9921146B2 (en) |
| EP (1) | EP2838067A4 (en) |
| JP (1) | JP5769039B2 (en) |
| WO (1) | WO2013145493A1 (en) |
Cited By (3)
| Publication number | Priority date | Publication date | Assignee | Title |
|---|---|---|---|---|
| CN105065917A (en) * | 2015-08-24 | 2015-11-18 | 苏交科集团股份有限公司 | Urban drainage network online detection method |
| EP3731171A4 (en) * | 2017-12-22 | 2020-11-18 | NEC Corporation | Asset management device and asset management method |
| EP3789547A4 (en) * | 2018-06-11 | 2021-12-08 | Hitachi, Ltd. | WATER LEAK DETECTION METHOD, WATER LEAK DETECTION DEVICE AND VIBRATION SENSOR CONNECTOR |
Families Citing this family (24)
| Publication number | Priority date | Publication date | Assignee | Title |
|---|---|---|---|---|
| US9336287B2 (en) * | 2013-09-26 | 2016-05-10 | SecurityDo Corp. | System and method for merging network events and security events via superimposing data |
| JP6230375B2 (en) * | 2013-11-07 | 2017-11-15 | 株式会社日立製作所 | Pipeline renewal plan planning support system and pipe renewal plan planning support method |
| EA037819B1 (en) | 2014-07-31 | 2021-05-25 | Камоцци Диджитал С.Р.Л. | Method for monitoring physical parameters of textile machinery |
| US9719881B2 (en) * | 2014-08-29 | 2017-08-01 | Verizon Patent And Licensing Inc. | Scalable framework for managing civil structure monitoring devices |
| GB2549209B (en) * | 2014-10-29 | 2020-11-04 | Nec Corp | Tap water management system, tap water management device, tap water management method, and tap water management program recording medium |
| GB2564256A (en) * | 2015-12-03 | 2019-01-09 | Nec Corp | Device, method, and recording medium |
| JP6338610B2 (en) * | 2016-02-23 | 2018-06-06 | 日本電信電話株式会社 | Pipe damage prediction apparatus, pipe damage prediction method, and pipe damage prediction program |
| WO2017199455A1 (en) * | 2016-05-19 | 2017-11-23 | 株式会社 東芝 | Water leakage determination device and water leakage determination method |
| JP6729932B2 (en) * | 2016-07-24 | 2020-07-29 | 管清工業株式会社 | Sewer pipe deterioration prediction system and sewer pipe deterioration prediction method |
| US10366167B2 (en) * | 2017-01-16 | 2019-07-30 | Marlabs Innovations Private Limited | Method for interpretation of charts using statistical techniques and machine learning and creating automated summaries in natural language |
| JP6992291B2 (en) | 2017-07-07 | 2022-01-13 | 富士通株式会社 | State identification method, state identification device and state identification program |
| KR101899112B1 (en) * | 2017-08-24 | 2018-09-17 | 서계숙 | Real-time leak detection system for ICT-based water distribution |
| JP6954070B2 (en) * | 2017-12-08 | 2021-10-27 | 富士通株式会社 | Discrimination program, discrimination method and discrimination device |
| CN108071942A (en) * | 2018-01-26 | 2018-05-25 | 钦州学院 | A kind of city gas pipeline safety patrol inspection FTP client FTP and its method for inspecting based on mobile phone |
| JP7040065B2 (en) | 2018-01-31 | 2022-03-23 | 富士通株式会社 | Detection program, detection method and detection device |
| JP6936200B2 (en) * | 2018-09-28 | 2021-09-15 | 株式会社日立製作所 | Leakage detection system and method |
| CN111063174B (en) * | 2018-10-17 | 2022-07-12 | 海隆石油集团(上海)信息技术有限公司 | Pipeline line safety early warning system based on distributed optical fiber sensing |
| CN110823995A (en) * | 2019-11-27 | 2020-02-21 | 陕西泰诺特检测技术有限公司 | Oxide skin detection method and imaging device |
| CN112800090A (en) * | 2020-07-14 | 2021-05-14 | 袁媛 | Data processing method combining edge computing and path analysis and big data cloud platform |
| JP7827285B2 (en) * | 2021-10-15 | 2026-03-10 | 株式会社ピー・アイ・シー | Water pipe deterioration degree determination program |
| JP7675035B2 (en) * | 2022-02-09 | 2025-05-12 | 株式会社日立製作所 | Vibration sensor installation support system |
| CN115031680B (en) * | 2022-06-08 | 2023-04-25 | 淮阴师范学院 | Long oil and gas pipeline data monitoring and analyzing system based on Internet |
| JP7778678B2 (en) * | 2022-12-19 | 2025-12-02 | 株式会社クボタ | Buried environment classification map creation device, buried pipe deterioration prediction device, buried environment classification map creation method, buried pipe deterioration prediction method and program |
| CN116105939B (en) * | 2023-04-11 | 2023-06-30 | 东莞先知大数据有限公司 | Grinder risk determination method and device, electronic equipment and storage medium |
Family Cites Families (13)
| Publication number | Priority date | Publication date | Assignee | Title |
|---|---|---|---|---|
| JPH0664664B2 (en) | 1988-09-19 | 1994-08-22 | 株式会社日立製作所 | Failure prediction device |
| JP3327303B2 (en) * | 1993-10-12 | 2002-09-24 | 岩崎通信機株式会社 | Method and apparatus for estimating life of object under test |
| JPH0896039A (en) | 1994-09-29 | 1996-04-12 | Akira Hayashi | Water pipeline information management device |
| JP2000259222A (en) * | 1999-03-04 | 2000-09-22 | Hitachi Ltd | Equipment monitoring and preventive maintenance system |
| US6567006B1 (en) * | 1999-11-19 | 2003-05-20 | Flow Metrix, Inc. | Monitoring vibrations in a pipeline network |
| US6735549B2 (en) | 2001-03-28 | 2004-05-11 | Westinghouse Electric Co. Llc | Predictive maintenance display system |
| JP2003345927A (en) | 2002-05-27 | 2003-12-05 | Toshiba Corp | Soundness evaluation device |
| US6957157B2 (en) * | 2002-11-12 | 2005-10-18 | Flow Metrix, Inc. | Tracking vibrations in a pipeline network |
| JP4322617B2 (en) * | 2003-10-08 | 2009-09-02 | 株式会社東芝 | Pipeline renewal plan support device |
| JP4460423B2 (en) * | 2004-11-10 | 2010-05-12 | 晃 幸田 | Noise removal method for leak detection |
| EP2122320B1 (en) * | 2007-02-22 | 2018-10-10 | Micro Motion, Inc. | Vibratory pipeline diagnostic system and method |
| JP2009079906A (en) * | 2007-09-25 | 2009-04-16 | Toshiba Corp | Vibration evaluation apparatus and method |
| US8665101B2 (en) * | 2009-11-16 | 2014-03-04 | Aquarius Spectrum Ltd. | System method and device for leak detection and localization in a pipe network |
-
2012
- 2012-12-28 JP JP2014507339A patent/JP5769039B2/en not_active Expired - Fee Related
- 2012-12-28 EP EP12872855.7A patent/EP2838067A4/en not_active Ceased
- 2012-12-28 US US14/375,886 patent/US9921146B2/en active Active
- 2012-12-28 WO PCT/JP2012/084048 patent/WO2013145493A1/en not_active Ceased
Cited By (6)
| Publication number | Priority date | Publication date | Assignee | Title |
|---|---|---|---|---|
| CN105065917A (en) * | 2015-08-24 | 2015-11-18 | 苏交科集团股份有限公司 | Urban drainage network online detection method |
| CN105065917B (en) * | 2015-08-24 | 2017-06-23 | 苏交科集团股份有限公司 | Urban drainage pipe network online test method |
| EP3731171A4 (en) * | 2017-12-22 | 2020-11-18 | NEC Corporation | Asset management device and asset management method |
| EP3789547A4 (en) * | 2018-06-11 | 2021-12-08 | Hitachi, Ltd. | WATER LEAK DETECTION METHOD, WATER LEAK DETECTION DEVICE AND VIBRATION SENSOR CONNECTOR |
| AU2018427471B2 (en) * | 2018-06-11 | 2022-04-21 | Hitachi, Ltd. | Water leakage detection method, water leakage detection apparatus, and vibration sensor terminal |
| US11624675B2 (en) | 2018-06-11 | 2023-04-11 | Hitachi, Ltd. | Water leakage detection method, water leakage detection apparatus, and vibration sensor terminal |
Also Published As
| Publication number | Publication date |
|---|---|
| WO2013145493A1 (en) | 2013-10-03 |
| JP5769039B2 (en) | 2015-08-26 |
| US20150046099A1 (en) | 2015-02-12 |
| US9921146B2 (en) | 2018-03-20 |
| JPWO2013145493A1 (en) | 2015-12-10 |
| EP2838067A4 (en) | 2015-11-04 |
Similar Documents
| Publication | Publication Date | Title |
|---|---|---|
| EP2838067A1 (en) | Pipeline administration assistance device and pipeline administration assistance system | |
| Valinejadshoubi et al. | Development of a BIM-based data management system for structural health monitoring with application to modular buildings: Case study | |
| Rainieri et al. | Integrated seismic early warning and structural health monitoring of critical civil infrastructures in seismically prone areas | |
| Farrar et al. | Structural health monitoring studies of the Alamosa Canyon and I-40 bridges | |
| US9441988B2 (en) | System and method for identifying likely geographical locations of anomalies in a water utility network | |
| JP4612696B2 (en) | Water leakage diagnosis device and water leakage diagnosis method for water distribution pipe | |
| EP3413154B1 (en) | Equipment diagnostic device, equipment diagnostic method, and equipment diagnostic program | |
| Rolfes et al. | Integral SHM-system for offshore wind turbines using smart wireless sensors | |
| KR101903879B1 (en) | Device and method for seismic safety estimation for infrastructures | |
| CN119334236B (en) | A Beidou-based structural deformation monitoring method, system and storage medium | |
| WO2019007497A1 (en) | Non-intrusive vibrational method and apparatus of a centralized system for water distribution network pipelines' leak detection and monitoring | |
| KR20210081136A (en) | A diagnosis and monitoring system based on geographic information system for the large-scale water supply pipes | |
| RU2459136C2 (en) | Method to monitor pipeline corrosion and device for its realisation | |
| JPH0896039A (en) | Water pipeline information management device | |
| Naeim | Real-time damage detection and performance evaluation for buildings | |
| Moravej et al. | Computation-effective structural performance assessment using Gaussian process-based finite element model updating and reliability analysis | |
| JP2008139985A (en) | Field inspection monitoring support device | |
| RU2630279C1 (en) | Pipeline operational risks management method and system for it | |
| JP2005114583A (en) | Pipeline renewal plan support apparatus and system | |
| Christos et al. | Autonomous low-cost wireless sensor platform for leakage detection in oil and gas pipes | |
| KR101635806B1 (en) | Facility safety management system having multi-function measuring module of interactive function, intelligence function and duty function, and method for the same | |
| JP6664776B1 (en) | Abnormality determination method and abnormality determination system for structure | |
| CN119469558A (en) | A distributed optical fiber leakage detection method, device and system | |
| JP2002319086A (en) | System and method for measuring environment | |
| RU2767263C1 (en) | Method for integrated assessment of indicators determining the technical condition of pipeline systems, and a monitoring system for its implementation |
Legal Events
| Date | Code | Title | Description |
|---|---|---|---|
| PUAI | Public reference made under article 153(3) epc to a published international application that has entered the european phase |
Free format text: ORIGINAL CODE: 0009012 |
|
| 17P | Request for examination filed |
Effective date: 20140731 |
|
| AK | Designated contracting states |
Kind code of ref document: A1 Designated state(s): AL AT BE BG CH CY CZ DE DK EE ES FI FR GB GR HR HU IE IS IT LI LT LU LV MC MK MT NL NO PL PT RO RS SE SI SK SM TR |
|
| AX | Request for extension of the european patent |
Extension state: BA ME |
|
| DAX | Request for extension of the european patent (deleted) | ||
| RA4 | Supplementary search report drawn up and despatched (corrected) |
Effective date: 20151002 |
|
| RIC1 | Information provided on ipc code assigned before grant |
Ipc: G06Q 50/06 20120101AFI20150928BHEP Ipc: G01M 3/00 20060101ALI20150928BHEP |
|
| 17Q | First examination report despatched |
Effective date: 20171130 |
|
| REG | Reference to a national code |
Ref country code: DE Ref legal event code: R003 |
|
| STAA | Information on the status of an ep patent application or granted ep patent |
Free format text: STATUS: THE APPLICATION HAS BEEN REFUSED |
|
| 18R | Application refused |
Effective date: 20190507 |