EP2837270B1 - Fault detection, localization and performance monitoring of photosensors for lighting controls - Google Patents
Fault detection, localization and performance monitoring of photosensors for lighting controls Download PDFInfo
- Publication number
- EP2837270B1 EP2837270B1 EP13727974.1A EP13727974A EP2837270B1 EP 2837270 B1 EP2837270 B1 EP 2837270B1 EP 13727974 A EP13727974 A EP 13727974A EP 2837270 B1 EP2837270 B1 EP 2837270B1
- Authority
- EP
- European Patent Office
- Prior art keywords
- sensors
- subsystem
- sensor
- faulty
- locating
- Prior art date
- Legal status (The legal status is an assumption and is not a legal conclusion. Google has not performed a legal analysis and makes no representation as to the accuracy of the status listed.)
- Active
Links
Images



Classifications
-
- G—PHYSICS
- G01—MEASURING; TESTING
- G01J—MEASUREMENT OF INTENSITY, VELOCITY, SPECTRAL CONTENT, POLARISATION, PHASE OR PULSE CHARACTERISTICS OF INFRARED, VISIBLE OR ULTRAVIOLET LIGHT; COLORIMETRY; RADIATION PYROMETRY
- G01J1/00—Photometry, e.g. photographic exposure meter
- G01J1/02—Details
- G01J1/0228—Control of working procedures; Failure detection; Spectral bandwidth calculation
-
- H—ELECTRICITY
- H05—ELECTRIC TECHNIQUES NOT OTHERWISE PROVIDED FOR
- H05B—ELECTRIC HEATING; ELECTRIC LIGHT SOURCES NOT OTHERWISE PROVIDED FOR; CIRCUIT ARRANGEMENTS FOR ELECTRIC LIGHT SOURCES, IN GENERAL
- H05B47/00—Circuit arrangements for operating light sources in general, i.e. where the type of light source is not relevant
- H05B47/10—Controlling the light source
- H05B47/175—Controlling the light source by remote control
- H05B47/18—Controlling the light source by remote control via data-bus transmission
-
- H—ELECTRICITY
- H05—ELECTRIC TECHNIQUES NOT OTHERWISE PROVIDED FOR
- H05B—ELECTRIC HEATING; ELECTRIC LIGHT SOURCES NOT OTHERWISE PROVIDED FOR; CIRCUIT ARRANGEMENTS FOR ELECTRIC LIGHT SOURCES, IN GENERAL
- H05B47/00—Circuit arrangements for operating light sources in general, i.e. where the type of light source is not relevant
- H05B47/10—Controlling the light source
- H05B47/175—Controlling the light source by remote control
- H05B47/19—Controlling the light source by remote control via wireless transmission
Definitions
- the invention generally relates to lighting control, and more particularly to monitoring the performance of sensors in lighting control systems.
- WO 2010/086757 A1 discloses a controller, method and system, for controlling lighting responsive to ambient lighting conditions.
- the processor of the controller compares the reading with the user's preference and sends a command to at least one luminaire to adjust the illumination of the workspace.
- An electronic sensor for measurement can be, for example, a photosensor, an occupancy sensor, an orientation sensor, or a location sensor.
- the interface collects the reading from the electronic sensor via a wireless communication link.
- One critical performance aspect of a lighting control system is the performance of its sensors, for example, light sensors.
- the performance of such sensors needs to be monitored to ensure that they properly operate.
- Abnormal or defective sensors clearly affect the performance of the advanced lighting control system, leading to lost opportunities and hampering savings.
- Light sensor abnormalities could be due to multiple sources including, for example, user tampering, dust on the surface of the sensor, electronic degradation, change of the reflective environment, communication problems, and so on.
- a light sensor that fails to operate according to its calibrated performance compromises the overall lighting control system performance. Typically, such problems are not noticed, or are attributed to the performance of the lighting control system.
- the invention relates to a system for monitoring sensors according to claim 1 and a method for monitoring a plurality of sensors according to claim 6.
- Certain embodiments disclosed herein include a system for monitoring sensors of a lighting control system.
- the system comprises a plurality of sensors connected to a network; and a computing device connected to the network comprising a training subsystem, a detecting subsystem and a locating subsystem, wherein the training subsystem is configured to determine an optimum operation of the system, wherein the detecting subsystem is configured to collect measurements from the plurality of sensors and determine, based in part on data provided from at least the training subsystem, a faulty sensor from among the plurality of sensors, and wherein the locating subsystem is configured to determine a location of the faulty sensor from among the plurality of sensors based on a fault indicator determined for each of the plurality of sensors.
- Certain embodiments disclosed herein also include an apparatus in a lighting control system for monitoring sensors therein.
- the apparatus comprises an interface to a network for at least collecting data from a plurality of sensors connected to the network; a fault detection unit that includes a training subsystem, a detecting subsystem and a locating subsystem, wherein the training subsystem is configured to determine an optimum operation of the lighting control system, wherein the detecting subsystem is configured to collect measurements from the plurality of sensors and to determine, based in part on data provided from at least the training subsystem, if there is a faulty sensor from among the plurality of sensors, and wherein the locating subsystem is configured to determine the location of the faulty sensor from among the plurality of sensors based on a fault indicator determined for each of the plurality of sensors; and a storage component for storing data respective of at least one of the training subsystem, the detecting subsystem and the locating subsystem.
- Certain embodiments disclosed herein also include a method for monitoring sensors of a lighting control system.
- the method comprises performing a training of a plurality of sensors of the lighting control system to determine a joint probability distribution function (PDF) of the illuminance at a given time t; collecting parameters from the training and storing the parameters in a prior data storage; observing illuminance of the plurality of sensors; determining if there is at least a faulty sensor from among the plurality of sensors based in part on the parameters stored prior data storage; and locating a faulty sensor based on the determination of the existence of the at least a faulty sensor and the prior data.
- PDF joint probability distribution function
- the inherent correlation of multiple sensors of a lighting control system provides advantages over existing systems.
- historical data is collected from the sensors of a lighting control system. Such data may be collected over a network to which the sensors are connected. Once data is collected several steps are taken in order to determine the operational status of each sensor and possible corrective action thereto.
- Fig. 1 depicts an exemplary and non-limiting schematic diagram of a lighting control system 100 according to an embodiment of the invention.
- a plurality of sensors 130-1 through 130-N (where N is an integer number greater than 1) and collectively referred to as sensors 130, are coupled to a network 120.
- the network 120 may comprise a serial bus, parallel bus, a local area network (LAN), a wide area network (WAN), and the like, whether wireless or wired, and any combinations thereof.
- LAN local area network
- WAN wide area network
- the sensors 130 are photosensors.
- the fault detection unit 114 includes a series of instructions embedded in a tangible computer readable medium that when executed by the computer 110 performs the steps for detection and location as discussed in greater detail herein below.
- the fault detection unit 114 may also include a display or other means for showing the results of the processing performed by the computer system 110.
- the fault detection unit 114 performs a training operation, a fault detection operation, and a fault localization operation.
- some statistics are computed for a group of sensors 130 over a portion of the historical data contained in the storage 112. Such statistics include a classification of historical data into groups, and estimation of the statistical variables of each group, i.e., the parameters of the joint distribution function, for example but not by way of limitation, mean, variance, and/or covariance.
- a process takes place where for each time event or each duration of time (e.g., a 30 minute span) and for a particular reading from a set of sensors 130, the computer system 110 computes the probability that the currently measured data is correct or otherwise likely to occur given prior sensor measurement relationships, i.e., a correlation is determined. If the probability is low, then the computer system 110 can identify this measurement event as problematic or faulty.
- t n ⁇ 0 where x ( t ) is the reading of a set of the sensors 130 being checked.
- x ( t ) is the reading of a set of the sensors 130 being checked.
- an attempt is made to locate the sensor or sensors which are faulty.
- This operation is based on an evaluation of the likelihood of the measurement from a certain sensor. Once the faulty sensor(s) from the sensors 130 are identified, the faulty sensor(s) can be flagged as such for further investigation. Such investigation may be manual, where a building operator can investigate the cause of the performance deviation and correct the problem of such faulty sensors. Alternatively, one or more self-calibration operation can also be undertaken when possible, for example, by initiating a self-calibration process by the computer system 110 causing a faulty sensor of the sensors 130 to perform self-calibration. Self-calibration algorithms are not discussed herein. According to one embodiment, faults or abnormalities are identified in measurement data received from the sensors 130 with the following properties: low probability of false alarm; and, low probability of misdetection.
- a faulty sensor is a sensor providing abnormal measurement data, which may be attributable to various reasons, for example, user tampering, dust on the surface of the sensor, electronic degradation, change of the reflective environment, communication problems, and so on.
- a faulty sensor is not limited to an actual failure of the sensor.
- An effective estimation of the joint distribution of illuminance/luminance measured by sensors (hereinafter, without loss of generality, the term daylight illuminance may be used) is key to design an effective fault detection system.
- a Gaussian mixture model is selected to describe the joint probability distribution function (PDF) of the daylight illuminance. That is, the PDF of the daylight illuminance is approximated by a superposition of multiple Gaussian distributions. Therefore, the following information of the Gaussian mixture model is required to be determined: the optimum number of Gaussian distribution components at a given time t ; the mean vector and the covariance matrix for each Gaussian distribution; and, the proper weight for each Gaussian distribution when combined.
- PDF joint probability distribution function
- the optimum number of Gaussian distribution components is denoted as L *( t ), and denotes the mean vector, the covariance matrix, and the weight for the k th Gaussian distribution as ⁇ k ( t ), ⁇ k ( t ), ⁇ k ( t ), respectively, thereby providing a joint distribution of the daylight illuminance at a given time t as: p x t
- x ( t ) is a column vector denoting the daylight illuminance
- the parameter set ⁇ L * ( t ), ⁇ k ( t ), ⁇ k ( t ), ⁇ k ( t ) ⁇ completely describes the PDF of the daylight illuminance. How to find the parameter set ⁇ L * ( t ), ⁇ k ( t ), ⁇ k ( t ), ⁇ k ( t ) ⁇ according to one embodiment of a fault detection subsystem will be described herein below in greater detail.
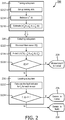
- Fig. 2 depicts an exemplary and non-limiting flowchart 200 of a sensor fault detection and location system according to an embodiment of the invention.
- the system 200 includes three subsystems, a training subsystem 210, a detection subsystem 220, and a fault location subsystem 230.
- the task of the training subsystem 210 is to estimate the joint probability density function of the daylight illuminance from the stored training data.
- the training subsystem 210 is typically trained off-line and provides the detecting subsystem 220 and locating subsystem 230 with the estimated model parameters used by these subsystems.
- the task of the detecting subsystem 220 is to detect whether or not there is a fault in the measurement from the sensors 130.
- Subsystem 220 runs online and tests real-time measurements based on the estimated model parameters from the training subsystem 210. Once there is a detected fault, the detecting subsystem 220 notifies the locating subsystem 230 to test the measurement from each sensor 130 and to determine which of the sensors 130 is providing the faulty measurement. The details of the subsystems 210, 220 and 230 are discussed in further detail herein below.
- the training subsystem 210 shown in Fig. 2 includes three operations: S212 grouping of the training data, S214 estimation of the optimum number of Gaussian distributions L * (t) 214, and S216 estimation of ⁇ k ( t ), ⁇ k ( t ), ⁇ k ( t ).
- the training subsystem 210 groups the training data according to the observation time of the data and the desired observation window length.
- the training data is defined as the pre-stored normal daylight illuminance measured from functional sensors of the sensors 130.
- the observation time is the time instance when the daylight illuminance is measured.
- the observation window length is the time duration to discretize the originally continuous time information. For instance, if the observation window length is 30 minutes, all the daylight illuminance measurements with the 30 minute time interval are grouped together and viewed as following the same PDF.
- the training subsystem 210 determines the optimum number of Gaussian distribution components. To find L * (t) is equivalent to finding the optimum number of clusters to describe the daylight illuminance, the clusters being described in greater detail herein below.
- Fig. 3 is an exemplary and non-limiting graph showing the illuminance distribution of illuminance data gathered during 16:00-16:01 from, for example, a west-facing window in a typical room, from a single sensor of the sensors 130.
- the optimum number of clusters is defined herein as the number of clusters that properly describes that data without inducing excessive model complexity. For instance, three clusters is a better choice to describe the illuminance data in Fig. 3 compared to a partition into ten different clusters.
- an X-means algorithm is utilized in this step to find L * (t).
- Fig. 4 is an exemplary and non-limiting diagram of the result of the L * (t) for the west-facing room. From Fig. 4 , it is understood that the optimum number of clusters of the illuminance varies overtime based on the daylight availability. For example, during night time, when there is no daylight, the optimum number of clusters is only 2; while between 15:00 and 18:00 hours, when there is direct sunlight for the west-facing room, the optimum number of clusters is between 8 and 11. It should be further noted that the optimum number of clusters of the illuminance also depends on the observation window length and the environment of the building.
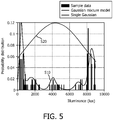
- Fig. 5 shows an exemplary and non-limiting graph comparing the estimated PDFs of the daylight illuminance near the west-facing window of a typical room (shown as a red solid curve 510) during 16:00-16:01 (1-min observation window) based on a Gaussian mixture model and the traditional single Gaussian model (curve 520).
- the Gaussian mixture model 510 describes the daylight illuminance much more accurately and clearly embodies the multimodal nature of the daylight illuminance distribution.
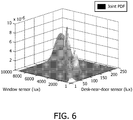
- Fig. 6 provides a graph showing the estimated joint PDF of the daylight illuminance near the west-facing window and at a desk near the door of a typical room during 16:00-16:01 (1-min observation window) based on a Gaussian mixture model with two measurements.
- the locating subsystem 230 evaluates the measurement and locates the faulty sensor(s) of the sensors 130. As shown in Fig. 2 , the faulty sensors are located by examining their fault indicator I j (t) 230, where j represents the number of sensor 130-j.
- the fault indicator according to the invention is defined as an evaluation of the likelihood of the measurement from a certain sensor.
- the fault indicators can be different functions as long as they can reflect the likelihood of the measurement.
- ⁇ k , j ⁇ t ⁇ k t
- ⁇ k , j , j ⁇ t represents the element on the j th row and the j th column of the matrix ⁇ k ⁇ t .
- each component of the Gaussian mixture model becomes a single variate Gaussian.
- the rule of determining whether or not sensor j has an error is determined simply by comparing I j (t) with a predetermined threshold ⁇ j as follows: ⁇ I j t > ⁇ j sensor j is normal I j t ⁇ ⁇ j sensor j has fault that is, the sensor j is determined to be operating normally if I j (t) is larger than ⁇ j 236, and is determined to be faulty 238 otherwise.
- the status of each sensor 130 may be displayed by the computer 110.
- the thresholds for fault detecting and locating need not to be the same.
- ⁇ is a scalar, e.g. 10 -2 , to provide a margin for the fault detection by the subsystems 220 and 230.
- Figs. 7-9 illustrate by non-limiting examples, the operation of a lighting system according to various embodiments of the invention.
- three different environments are discussed: a dining room ( Fig. 7 ), an office room ( Fig. 8 ), and a building hallway ( Fig. 9 ).
- the sample rate for all the sensors in the experiments is 1 sample/minute.
- the observation window length is 1 minute.
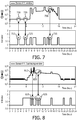
- Fig. 7 provides an exemplary and non-limiting timing diagram demonstrating the fault detection and locating system testing the illuminance from a typical dining room mentioned above.
- training data was collected over a period of 28 days and the measurements from all 5 sensors are used to train the fault detection and locating system.
- nine artificial faulty periods of 30-minutes are randomly inserted into the illuminance data.
- the sensor measuring the illuminance through the window (denoted by "sensor #1: window" in Fig. 7 ) is assumed to have fault.
- the graph at the top of Fig. 7 shows the illuminance data with inserted faulty measurements.
- the graph at the bottom of Fig. 7 shows the output of the detection performed by subsystems 220 and 230, when there is a detected fault the output is 1, otherwise, the output is 0.
- the threshold is set based on a fault indicator that is the marginal probability density.
- the fault detection subsystem 220 is able to detect the faulty measurements even if they are close to a normal measurement.
- the faulty measurements highlighted in circles 710, 720 and 730 are similar to the normal measurements; however, the subsystems 220 and 230 detect the slight abnormality as indicated by the respective circles 715, 725 and 735.
- Fig. 8 provides an exemplary and non-limiting timing diagram demonstrating the operation of system 100 testing the illuminance from, for example, a typical office room having 13 sensors.
- training data collected over a period of 30 days and the measurements from all 13 sensors are used to train the fault detection and locating system. Again nine artificial faulty periods of 30-minutes are randomly inserted into the illuminance data.
- the sensor measuring the illuminance through the window (denoted by "sensor #1: east-facing window" in Fig. 8 ) is assumed to have fault.
- the graph at the top of Fig. 8 shows the illuminance data with inserted faulty measurements.
- the graph at the bottom of Fig. 8 shows the output of the subsystems 220 and 230; when there is a detected fault the output is 1, otherwise the output is 0.
- the threshold is set based on a fault indicator that is the marginal probability density.
- Fig. 9 provides an exemplary and non-limiting timing diagram demonstrating a fault detection system testing the illuminance from, for example, a building hallway having four sensors.
- training data collected over a period of 30 days and the measurements from all four sensors are used to train the fault detection and locating system.
- nine artificial faulty periods of 30-minutes are randomly inserted into the illuminance data.
- the sensor measuring the illuminance through a window (denoted by "sensor #1: west-facing cafeteria" in Fig. 9 ) is assumed to have a fault.
- the graph at the top of Fig. 9 shows the illuminance data with inserted faulty measurements.
- the graph at the bottom of Fig. 9 shows the output of the subsystems 220 and 230; when there is a detected fault the output is 1, otherwise the output is 0.
- the threshold is set based on a fault indicator that is the marginal probability density.
- the various embodiments disclosed herein can be implemented as hardware, firmware, software or any combination thereof.
- the software is preferably implemented as an application program tangibly embodied on a program storage unit, a non-transitory computer readable medium, or a non-transitory machine-readable storage medium that can be in a form of a digital circuit, an analogy circuit, a magnetic medium, or combination thereof.
- the application program may be uploaded to, and executed by, a machine comprising any suitable architecture.
- the machine is implemented on a computer platform having hardware such as one or more central processing units (“CPUs"), a memory, and input/output interfaces.
- CPUs central processing units
- the computer platform may also include an operating system and microinstruction code.
Landscapes
- Physics & Mathematics (AREA)
- Spectroscopy & Molecular Physics (AREA)
- General Physics & Mathematics (AREA)
- Engineering & Computer Science (AREA)
- Computer Networks & Wireless Communication (AREA)
- Circuit Arrangement For Electric Light Sources In General (AREA)
- Selective Calling Equipment (AREA)
Description
- The invention generally relates to lighting control, and more particularly to monitoring the performance of sensors in lighting control systems.
- The proliferation of advanced lighting controls in general, and the use of networked systems for such controls in particular, is expected to increase. Such demand is fuelled by an increase in awareness of issues relating to energy savings, reducing the ecological impact footprint, utilizing government incentives, and the desire to meet certain building performance goals and industry certificates, such as a certificate for Leadership in Energy and Environment Design (LEED).
-
WO 2010/086757 A1 discloses a controller, method and system, for controlling lighting responsive to ambient lighting conditions. The processor of the controller compares the reading with the user's preference and sends a command to at least one luminaire to adjust the illumination of the workspace. An electronic sensor for measurement can be, for example, a photosensor, an occupancy sensor, an orientation sensor, or a location sensor. In some embodiments, the interface collects the reading from the electronic sensor via a wireless communication link. - As a result of the demand for such advances, the complexity of lighting control systems is migrating from simple light switches to more advanced complex systems that incorporate multiple subsystems. Maintaining optimum performance of these advanced lighting control systems requires, in part, the use of advanced strategies that have not been commonly applied to lighting control systems in the past.
- One critical performance aspect of a lighting control system is the performance of its sensors, for example, light sensors. The performance of such sensors needs to be monitored to ensure that they properly operate. Abnormal or defective sensors clearly affect the performance of the advanced lighting control system, leading to lost opportunities and hampering savings. Light sensor abnormalities could be due to multiple sources including, for example, user tampering, dust on the surface of the sensor, electronic degradation, change of the reflective environment, communication problems, and so on. A light sensor that fails to operate according to its calibrated performance compromises the overall lighting control system performance. Typically, such problems are not noticed, or are attributed to the performance of the lighting control system. Currently there is no available solution to determine if problems in a lighting system are attributable to a light sensor that is faulty and needs replacement, repair, and even self- or manual calibration. This is a major disadvantage since users of such lighting systems tend to disable such systems when the overall performance is compromised, thus increasing the power consumption.
- International patent application
WO 2010/086757 A1 further teaches a lighting control system, which may use information provided by two or more sensors to detect a potential error in the information provided by one of the sensor. This can be achieved through comparing data collected by plural sensors in the system at a given moment in time. This requires continuously monitoring and comparing individual sensor readings to determine the error. A further publicationUS 2008 086283 discloses a method for monitoring a system comprising a plurality of sensors. - Therefore, it would be advantageous to provide an improved lighting control system having a solution for detection of faults of at least light sensors. It would be further advantageous if the solution would allow corrective actions that can be taken either automatically or by, for example, a building operator, as soon as a problem is detected. The invention relates to a system for monitoring sensors according to
claim 1 and a method for monitoring a plurality of sensors according toclaim 6. - Certain embodiments disclosed herein include a system for monitoring sensors of a lighting control system. The system comprises a plurality of sensors connected to a network; and a computing device connected to the network comprising a training subsystem, a detecting subsystem and a locating subsystem, wherein the training subsystem is configured to determine an optimum operation of the system, wherein the detecting subsystem is configured to collect measurements from the plurality of sensors and determine, based in part on data provided from at least the training subsystem, a faulty sensor from among the plurality of sensors, and wherein the locating subsystem is configured to determine a location of the faulty sensor from among the plurality of sensors based on a fault indicator determined for each of the plurality of sensors.
- Certain embodiments disclosed herein also include an apparatus in a lighting control system for monitoring sensors therein. The apparatus comprises an interface to a network for at least collecting data from a plurality of sensors connected to the network; a fault detection unit that includes a training subsystem, a detecting subsystem and a locating subsystem, wherein the training subsystem is configured to determine an optimum operation of the lighting control system, wherein the detecting subsystem is configured to collect measurements from the plurality of sensors and to determine, based in part on data provided from at least the training subsystem, if there is a faulty sensor from among the plurality of sensors, and wherein the locating subsystem is configured to determine the location of the faulty sensor from among the plurality of sensors based on a fault indicator determined for each of the plurality of sensors; and a storage component for storing data respective of at least one of the training subsystem, the detecting subsystem and the locating subsystem.
- Certain embodiments disclosed herein also include a method for monitoring sensors of a lighting control system. The method comprises performing a training of a plurality of sensors of the lighting control system to determine a joint probability distribution function (PDF) of the illuminance at a given time t; collecting parameters from the training and storing the parameters in a prior data storage; observing illuminance of the plurality of sensors; determining if there is at least a faulty sensor from among the plurality of sensors based in part on the parameters stored prior data storage; and locating a faulty sensor based on the determination of the existence of the at least a faulty sensor and the prior data.
- The subject matter that is regarded as the invention is particularly pointed out and distinctly claimed in the claims at the conclusion of the specification. The foregoing and other features and advantages of the invention will be apparent from the following detailed description taken in conjunction with the accompanying drawings.
-
Figure 1 is a schematic diagram of a lighting control system according to an embodiment of the invention; -
Figure 2 is a schematic flowchart of a sensor fault detection and location system according to an embodiment of the invention; -
Figure 3 is a graph showing the illuminance distribution of illuminance data gathered from a west-facing window in a typical room; -
Figure 4 is a graph showing the optimum number of clusters of the illuminance data based on a 60-min observation window; -
Figure 5 is a graph showing the comparison of the estimated joint probability distribution functions (PDF) of the daylight illuminance near for example, a window of a typical room (based on Gaussian mixture model and signal Gaussian model); -
Figure 6 is a graph showing the estimated joint PDF of the daylight illuminance near for example, a window and the desk near the door of a typical room based on Gaussian mixture model; -
Figure 7 is a timing diagram demonstrating the fault detection system testing the illuminance from for example, a typical dining room; -
Figure 8 is a timing diagram demonstrating the fault detection system testing the illuminance from for example, a typical office room; and -
Figure 9 is a timing diagram demonstrating the fault detection system testing the illuminance from for example, a typical cafeteria room. - It is important to note that the embodiments disclosed are only examples of the many advantageous uses of the innovative teachings herein. In general, statements made in the specification of the present application do not necessarily limit any of the various claimed inventions. Moreover, some statements may apply to some inventive features but not to others. In general, unless otherwise indicated, singular elements may be in plural and vice versa with no loss of generality. In the drawings, like numerals refer to like parts through several views.
- According to various embodiments discussed herein, the inherent correlation of multiple sensors of a lighting control system, as well as the correlation of a single sensor over a period of time, provide advantages over existing systems. To this end, historical data is collected from the sensors of a lighting control system. Such data may be collected over a network to which the sensors are connected. Once data is collected several steps are taken in order to determine the operational status of each sensor and possible corrective action thereto.
-
Fig. 1 depicts an exemplary and non-limiting schematic diagram of alighting control system 100 according to an embodiment of the invention. A plurality of sensors 130-1 through 130-N (where N is an integer number greater than 1) and collectively referred to assensors 130, are coupled to anetwork 120. Thenetwork 120 may comprise a serial bus, parallel bus, a local area network (LAN), a wide area network (WAN), and the like, whether wireless or wired, and any combinations thereof. To thenetwork 120 there is connected acomputer system 110, through a network interface, that comprises, for example, computational circuits and processors typical of such systems, adata storage 112 for the storage of the historical data respective of thesensors 130, and afault detection unit 114. In an embodiment, thesensors 130 are photosensors. - The
fault detection unit 114 includes a series of instructions embedded in a tangible computer readable medium that when executed by thecomputer 110 performs the steps for detection and location as discussed in greater detail herein below. Thefault detection unit 114 may also include a display or other means for showing the results of the processing performed by thecomputer system 110. - The
fault detection unit 114 performs a training operation, a fault detection operation, and a fault localization operation. In the training operation, some statistics are computed for a group ofsensors 130 over a portion of the historical data contained in thestorage 112. Such statistics include a classification of historical data into groups, and estimation of the statistical variables of each group, i.e., the parameters of the joint distribution function, for example but not by way of limitation, mean, variance, and/or covariance. - In the fault detection operation, a process takes place where for each time event or each duration of time (e.g., a 30 minute span) and for a particular reading from a set of
sensors 130, thecomputer system 110 computes the probability that the currently measured data is correct or otherwise likely to occur given prior sensor measurement relationships, i.e., a correlation is determined. If the probability is low, then thecomputer system 110 can identify this measurement event as problematic or faulty. A fault is viewed as an event with negligible probability, i.e., an event that is unlikely to happen, expressed as:
sensors 130 being checked. In the fault localization operation, an attempt is made to locate the sensor or sensors which are faulty. - This operation is based on an evaluation of the likelihood of the measurement from a certain sensor. Once the faulty sensor(s) from the
sensors 130 are identified, the faulty sensor(s) can be flagged as such for further investigation. Such investigation may be manual, where a building operator can investigate the cause of the performance deviation and correct the problem of such faulty sensors. Alternatively, one or more self-calibration operation can also be undertaken when possible, for example, by initiating a self-calibration process by thecomputer system 110 causing a faulty sensor of thesensors 130 to perform self-calibration. Self-calibration algorithms are not discussed herein. According to one embodiment, faults or abnormalities are identified in measurement data received from thesensors 130 with the following properties: low probability of false alarm; and, low probability of misdetection. - A faulty sensor is a sensor providing abnormal measurement data, which may be attributable to various reasons, for example, user tampering, dust on the surface of the sensor, electronic degradation, change of the reflective environment, communication problems, and so on. A faulty sensor is not limited to an actual failure of the sensor.
- An effective estimation of the joint distribution of illuminance/luminance measured by sensors (hereinafter, without loss of generality, the term daylight illuminance may be used) is key to design an effective fault detection system. For the purpose of illustration, a Gaussian mixture model is selected to describe the joint probability distribution function (PDF) of the daylight illuminance. That is, the PDF of the daylight illuminance is approximated by a superposition of multiple Gaussian distributions. Therefore, the following information of the Gaussian mixture model is required to be determined: the optimum number of Gaussian distribution components at a given time t; the mean vector and the covariance matrix for each Gaussian distribution; and, the proper weight for each Gaussian distribution when combined. Hence, for a given time t, the optimum number of Gaussian distribution components is denoted as L*(t), and denotes the mean vector, the covariance matrix, and the weight for the kth Gaussian distribution as µ k (t),Σ k (t),πk (t), respectively, thereby providing a joint distribution of the daylight illuminance at a given time t as:

-
Fig. 2 depicts an exemplary andnon-limiting flowchart 200 of a sensor fault detection and location system according to an embodiment of the invention. Thesystem 200 includes three subsystems, atraining subsystem 210, adetection subsystem 220, and afault location subsystem 230. The task of thetraining subsystem 210 is to estimate the joint probability density function of the daylight illuminance from the stored training data. Thetraining subsystem 210 is typically trained off-line and provides the detectingsubsystem 220 and locatingsubsystem 230 with the estimated model parameters used by these subsystems. The task of the detectingsubsystem 220 is to detect whether or not there is a fault in the measurement from thesensors 130.Subsystem 220 runs online and tests real-time measurements based on the estimated model parameters from thetraining subsystem 210. Once there is a detected fault, the detectingsubsystem 220 notifies the locatingsubsystem 230 to test the measurement from eachsensor 130 and to determine which of thesensors 130 is providing the faulty measurement. The details of thesubsystems - The
training subsystem 210 shown inFig. 2 includes three operations: S212 grouping of the training data, S214 estimation of the optimum number of Gaussian distributions L*(t) 214, and S216 estimation of µ k (t),Σ k (t),πk (t). - In S212, the
training subsystem 210 groups the training data according to the observation time of the data and the desired observation window length. The training data is defined as the pre-stored normal daylight illuminance measured from functional sensors of thesensors 130. The observation time is the time instance when the daylight illuminance is measured. The observation window length is the time duration to discretize the originally continuous time information. For instance, if the observation window length is 30 minutes, all the daylight illuminance measurements with the 30 minute time interval are grouped together and viewed as following the same PDF. In S214, thetraining subsystem 210 determines the optimum number of Gaussian distribution components. To find L*(t) is equivalent to finding the optimum number of clusters to describe the daylight illuminance, the clusters being described in greater detail herein below. -
Fig. 3 is an exemplary and non-limiting graph showing the illuminance distribution of illuminance data gathered during 16:00-16:01 from, for example, a west-facing window in a typical room, from a single sensor of thesensors 130. By simply observingFig. 3 , it is readily understood that the data can be roughly grouped into several clusters based on the illuminance levels. The optimum number of clusters is defined herein as the number of clusters that properly describes that data without inducing excessive model complexity. For instance, three clusters is a better choice to describe the illuminance data inFig. 3 compared to a partition into ten different clusters. For example, an X-means algorithm is utilized in this step to find L*(t). -
Fig. 4 is an exemplary and non-limiting diagram of the result of the L*(t) for the west-facing room. FromFig. 4 , it is understood that the optimum number of clusters of the illuminance varies overtime based on the daylight availability. For example, during night time, when there is no daylight, the optimum number of clusters is only 2; while between 15:00 and 18:00 hours, when there is direct sunlight for the west-facing room, the optimum number of clusters is between 8 and 11. It should be further noted that the optimum number of clusters of the illuminance also depends on the observation window length and the environment of the building. - Returning to
Fig. 2 , in S216 it is necessary to find the parameter set µ k (t),Σ k (t),πk (t) based on L*(t) found in S214, where 1≤k≤L *(t) and πk (t) satisfies:


-
Fig. 5 shows an exemplary and non-limiting graph comparing the estimated PDFs of the daylight illuminance near the west-facing window of a typical room (shown as a red solid curve 510) during 16:00-16:01 (1-min observation window) based on a Gaussian mixture model and the traditional single Gaussian model (curve 520). Compared with the traditional singleGaussian distribution assumption 520, theGaussian mixture model 510 describes the daylight illuminance much more accurately and clearly embodies the multimodal nature of the daylight illuminance distribution. Another example of the Gaussian mixture model for two daylight measurements is shown inFig. 6 . Specifically,Fig. 6 provides a graph showing the estimated joint PDF of the daylight illuminance near the west-facing window and at a desk near the door of a typical room during 16:00-16:01 (1-min observation window) based on a Gaussian mixture model with two measurements. - Returning to
Fig. 2 , once the system has been trained by thetraining subsystem 210, the detectingsubsystem 220 receives in S222 a new incoming observation x(t) for which a respective probability density is determined in S224 based on the previously found parameter sets:

subsystem 230 to determine which of thesensors 130 is a faulty sensor. - Lastly, the locating
subsystem 230 evaluates the measurement and locates the faulty sensor(s) of thesensors 130. As shown inFig. 2 , the faulty sensors are located by examining their fault indicator Ij(t) 230, where j represents the number of sensor 130-j. The fault indicator according to the invention is defined as an evaluation of the likelihood of the measurement from a certain sensor. The fault indicators can be different functions as long as they can reflect the likelihood of the measurement. For instance, the fault indicator of sensor j can be the following conditional probability density:


δ j 236, and is determined to be faulty 238 otherwise. In an embodiment, the status of eachsensor 130 may be displayed by thecomputer 110. It should be understood that the thresholds for fault detecting and locating need not to be the same. The appropriate values of the thresholds can be obtained from the training data. For example, if the fault indicator is the marginal probability density, the threshold can be found as:
subsystems - The following discussions relating to
Figs. 7-9 illustrate by non-limiting examples, the operation of a lighting system according to various embodiments of the invention. For this illustrative purpose, three different environments are discussed: a dining room (Fig. 7 ), an office room (Fig. 8 ), and a building hallway (Fig. 9 ). The sample rate for all the sensors in the experiments is 1 sample/minute. The observation window length is 1 minute. There are five sensors deployed in the dining room, thirteen sensors deployed in the office room, and four sensors deployed in the building hallway. These sensors are placed at various locations. In the case of the office room and dining room, the sensors are located at the ceiling, table/desks and window. In the case of the hallway, sensors are located on the windows at different locations along the hallway. -
Fig. 7 provides an exemplary and non-limiting timing diagram demonstrating the fault detection and locating system testing the illuminance from a typical dining room mentioned above. In this example, training data was collected over a period of 28 days and the measurements from all 5 sensors are used to train the fault detection and locating system. In this example nine artificial faulty periods of 30-minutes are randomly inserted into the illuminance data. During each faulty period, the sensor measuring the illuminance through the window (denoted by "sensor #1: window" inFig. 7 ) is assumed to have fault. - The graph at the top of
Fig. 7 shows the illuminance data with inserted faulty measurements. The graph at the bottom ofFig. 7 shows the output of the detection performed bysubsystems - By effectively exploiting the correlation between different illuminance measurements, the
fault detection subsystem 220 is able to detect the faulty measurements even if they are close to a normal measurement. For example, the faulty measurements highlighted incircles subsystems respective circles -
Fig. 8 provides an exemplary and non-limiting timing diagram demonstrating the operation ofsystem 100 testing the illuminance from, for example, a typical office room having 13 sensors. In this example training data collected over a period of 30 days and the measurements from all 13 sensors are used to train the fault detection and locating system. Again nine artificial faulty periods of 30-minutes are randomly inserted into the illuminance data. During each faulty period, the sensor measuring the illuminance through the window (denoted by "sensor #1: east-facing window" inFig. 8 ) is assumed to have fault. The graph at the top ofFig. 8 shows the illuminance data with inserted faulty measurements. - The graph at the bottom of
Fig. 8 shows the output of thesubsystems circles respective circles -
Fig. 9 provides an exemplary and non-limiting timing diagram demonstrating a fault detection system testing the illuminance from, for example, a building hallway having four sensors. In this example training data collected over a period of 30 days and the measurements from all four sensors are used to train the fault detection and locating system. Again, nine artificial faulty periods of 30-minutes are randomly inserted into the illuminance data. During each faulty period, the sensor measuring the illuminance through a window (denoted by "sensor #1: west-facing cafeteria" inFig. 9 ) is assumed to have a fault. The graph at the top ofFig. 9 shows the illuminance data with inserted faulty measurements. - The graph at the bottom of
Fig. 9 shows the output of thesubsystems circles respective circles - The various embodiments disclosed herein can be implemented as hardware, firmware, software or any combination thereof. Moreover, the software is preferably implemented as an application program tangibly embodied on a program storage unit, a non-transitory computer readable medium, or a non-transitory machine-readable storage medium that can be in a form of a digital circuit, an analogy circuit, a magnetic medium, or combination thereof. The application program may be uploaded to, and executed by, a machine comprising any suitable architecture. Preferably, the machine is implemented on a computer platform having hardware such as one or more central processing units ("CPUs"), a memory, and input/output interfaces. The computer platform may also include an operating system and microinstruction code. The various processes and functions described herein may be either part of the microinstruction code or part of the application program, or any combination thereof, which may be executed by a CPU, whether or not such computer or processor is explicitly shown. In addition, various other peripheral units may be connected to the computer platform such as an additional data storage unit and a printing unit.
- While the present invention has been described at some length and with some particularity with respect to the several described embodiments, it is not intended that it should be limited to any such particulars or embodiments or any particular embodiment, but it is to be construed with references to the appended claims so as to provide the broadest possible interpretation of such claims in view of the prior art and, therefore, to effectively encompass the intended scope of the invention. Furthermore, the foregoing describes the invention in terms of embodiments foreseen by the inventor for which an enabling description was available, notwithstanding that insubstantial modifications of the invention, not presently foreseen, may nonetheless represent equivalents thereto.
Claims (6)
- A system (100) for monitoring sensors of a lighting control system, comprising:a plurality of sensors (130-1, 130-N) connected to a network; anda computing device (110) connected to the network comprising a training subsystem (210), a detecting subsystem (220) and a locating subsystem (230),wherein the training subsystem is configured to compute statistics for the plurality of sensors over a portion of historical data of the plurality of sensors,wherein the detecting subsystem is configured to collect measurements from the plurality of sensors and determine, based on the statistics provided by the training subsystem, a probability that the measurements are correct and, if the probability is less than a first threshold, that there is a faulty sensor from among the plurality of sensors,characterized in that once the faulty sensor from among the plurality of sensors is detected, the detecting subsystem is configured to notify the locating subsystem to test the measurement from each sensor (130-1, 130-N) from the plurality of sensors (130-1, 130-N);wherein the locating subsystem is configured to locate the faulty sensor from among the plurality of sensors based on a fault indicator determined for each of the plurality of sensors, wherein each fault indicator is a respective probability density that reflects a likelihood of a respective measurement,wherein the locating subsystem is further configured to compare, for each sensor, the respective probability density to a respective predefined second threshold value to determine if each sensor is faulty or not.
- The system of claim 1, wherein the sensors are photosensors.
- The system of claim 1, wherein the training subsystem is configured to determine a joint probability distribution function (PDF) of the illuminance at a given time t.
- The system of claim 1, wherein the detecting subsystem is configured to determine a probability density.
- The system of claim 4, wherein the detecting subsystem is configured to compare the probability density to a predefined threshold value to determine if there is a faulty sensor of the plurality of sensors.
- A method for monitoring a plurality of sensors of a lighting control system, the method comprising:computing statistics, by a training subsystem, over a portion of historical data of the plurality of sensors,collecting measurements from the plurality of sensors,determining, by a detecting subsystem, based on the statistics provided by the training subsystem, a probability that the measurements are correct and, if the probability is less than a first threshold, that there is a faulty sensor from among the plurality of sensors, characterized in thatonce the faulty sensor from among the plurality of sensors is detected, the detecting subsystem is configured to notify a locating subsystem to test the measurement from each sensor (130-1, 130-N) from the plurality of sensors (130-1, 130-N); andlocating, by the locating subsystem, the faulty sensor from among the plurality of sensors based on a fault indicator determined for each of the plurality of sensors, wherein each fault indicator is a respective probability density that reflects a likelihood of a respective measurement, and wherein the faulty sensor is located by comparing, for each sensor, the respective probability density to a respective predefined second threshold value to determine if each sensor is faulty or not.
Applications Claiming Priority (2)
| Application Number | Priority Date | Filing Date | Title |
|---|---|---|---|
| US201261622110P | 2012-04-10 | 2012-04-10 | |
| PCT/IB2013/052698 WO2013153490A2 (en) | 2012-04-10 | 2013-04-04 | Fault detection, localization and performance monitoring of photosensors for lighting controls |
Publications (2)
| Publication Number | Publication Date |
|---|---|
| EP2837270A2 EP2837270A2 (en) | 2015-02-18 |
| EP2837270B1 true EP2837270B1 (en) | 2020-06-17 |
Family
ID=48579141
Family Applications (1)
| Application Number | Title | Priority Date | Filing Date |
|---|---|---|---|
| EP13727974.1A Active EP2837270B1 (en) | 2012-04-10 | 2013-04-04 | Fault detection, localization and performance monitoring of photosensors for lighting controls |
Country Status (5)
| Country | Link |
|---|---|
| US (1) | US9651416B2 (en) |
| EP (1) | EP2837270B1 (en) |
| JP (1) | JP6275115B2 (en) |
| CN (1) | CN104221475B (en) |
| WO (1) | WO2013153490A2 (en) |
Families Citing this family (13)
| Publication number | Priority date | Publication date | Assignee | Title |
|---|---|---|---|---|
| JP2017508152A (en) * | 2014-02-26 | 2017-03-23 | フィリップス ライティング ホールディング ビー ヴィ | Method for detecting defective optical sensors |
| US10431106B1 (en) | 2015-04-13 | 2019-10-01 | Aptima, Inc. | Systems and methods to measure performance |
| US10378936B2 (en) | 2015-09-04 | 2019-08-13 | International Business Machines Corporation | Identification of failed sensors in a system of interconnected devices |
| JP6527804B2 (en) * | 2015-10-06 | 2019-06-05 | 株式会社トプコン | Electromagnetic wave measuring apparatus, electromagnetic wave measuring method and program |
| CN109691234B (en) * | 2016-07-26 | 2022-12-06 | 昕诺飞控股有限公司 | Lighting Sensor Analysis |
| US11445589B2 (en) * | 2017-06-27 | 2022-09-13 | Signify Holding B.V. | Method and system for asset localization, performance assessment, and fault detection |
| US10346228B2 (en) * | 2017-07-12 | 2019-07-09 | Siemens Aktiengesellschaft | Method and system for deviation detection in sensor datasets |
| JP7241076B2 (en) * | 2017-12-05 | 2023-03-16 | シグニファイ ホールディング ビー ヴィ | Systems, methods and apparatus for distributed detection of luminaire anomalies |
| US11310892B2 (en) | 2018-01-26 | 2022-04-19 | Signify Holding B.V. | System, methods, and apparatuses for distributed detection of luminaire anomalies |
| CN108307575A (en) * | 2018-02-07 | 2018-07-20 | 江西电力职业技术学院 | Automatic reporting system and method |
| US11706864B1 (en) * | 2020-07-24 | 2023-07-18 | Synapse Wireless, Inc. | Systems and methods for verifying operation and configuration of a lighting network |
| CN116086605A (en) * | 2023-01-12 | 2023-05-09 | 武汉海微科技有限公司 | Light sensation visual detection method and system |
| CN120086097B (en) * | 2025-05-06 | 2025-08-05 | 之江实验室 | Monitoring method for large model training of heterogeneous clusters and electronic equipment |
Citations (2)
| Publication number | Priority date | Publication date | Assignee | Title |
|---|---|---|---|---|
| WO2006046251A2 (en) * | 2004-10-28 | 2006-05-04 | Insyst Ltd. | Detection system for rare situation in processes |
| US20080086283A1 (en) * | 2006-10-05 | 2008-04-10 | Siemens Corporate Research, Inc. | Bayesian Sensor Estimation For Machine Condition Monitoring |
Family Cites Families (8)
| Publication number | Priority date | Publication date | Assignee | Title |
|---|---|---|---|---|
| US6115654A (en) * | 1997-12-23 | 2000-09-05 | Simmonds Precision Products, Inc. | Universal sensor interface system and method |
| US5987399A (en) * | 1998-01-14 | 1999-11-16 | Arch Development Corporation | Ultrasensitive surveillance of sensors and processes |
| JP2009158183A (en) | 2007-12-25 | 2009-07-16 | Toshiba Lighting & Technology Corp | Lighting control system |
| RU2538786C2 (en) * | 2009-01-29 | 2015-01-10 | Конинклейке Филипс Электроникс, Н.В. | Light control system reacting to ambient illumination conditions |
| CN102742362B (en) * | 2010-02-09 | 2015-06-03 | 皇家飞利浦电子股份有限公司 | Presence detection system and lighting system comprising such a system |
| US8706271B2 (en) * | 2010-02-18 | 2014-04-22 | Redwood Systems, Inc. | Integration of computing device and lighting system |
| EP2828839B1 (en) * | 2012-03-20 | 2017-10-25 | Philips Lighting Holding B.V. | Interference detection in a network of active sensors |
| US9474138B2 (en) * | 2012-04-25 | 2016-10-18 | Koninklijke Philips N.V. | Failure detection in lighting system |
-
2013
- 2013-04-04 JP JP2015505042A patent/JP6275115B2/en active Active
- 2013-04-04 CN CN201380019405.3A patent/CN104221475B/en active Active
- 2013-04-04 US US14/391,262 patent/US9651416B2/en active Active
- 2013-04-04 WO PCT/IB2013/052698 patent/WO2013153490A2/en not_active Ceased
- 2013-04-04 EP EP13727974.1A patent/EP2837270B1/en active Active
Patent Citations (2)
| Publication number | Priority date | Publication date | Assignee | Title |
|---|---|---|---|---|
| WO2006046251A2 (en) * | 2004-10-28 | 2006-05-04 | Insyst Ltd. | Detection system for rare situation in processes |
| US20080086283A1 (en) * | 2006-10-05 | 2008-04-10 | Siemens Corporate Research, Inc. | Bayesian Sensor Estimation For Machine Condition Monitoring |
Also Published As
| Publication number | Publication date |
|---|---|
| US20150073750A1 (en) | 2015-03-12 |
| WO2013153490A2 (en) | 2013-10-17 |
| JP2015518246A (en) | 2015-06-25 |
| CN104221475B (en) | 2017-02-22 |
| CN104221475A (en) | 2014-12-17 |
| EP2837270A2 (en) | 2015-02-18 |
| US9651416B2 (en) | 2017-05-16 |
| WO2013153490A3 (en) | 2013-12-05 |
| JP6275115B2 (en) | 2018-02-07 |
Similar Documents
| Publication | Publication Date | Title |
|---|---|---|
| US9651416B2 (en) | Fault detection, localization and performance monitoring of photosensors for lighting controls | |
| CN112101662B (en) | Device health status and life cycle detection method, storage medium and electronic device | |
| CN110869715B (en) | Method for isolating and recovering multi-core sensor in taxi | |
| JP6301791B2 (en) | Distribution network failure sign diagnosis system and method | |
| US11934522B2 (en) | System and method for detecting malicious activities and anomalies in building systems | |
| EP2946219B2 (en) | Method, apparatus and computer-program product for determining faults in a lighting system | |
| CN116703252B (en) | Intelligent building information management method based on SaaS | |
| CN108196170B (en) | A fault arc detection system and method | |
| KR20150022145A (en) | Prediction method of abnormal data, and a computer-readable storege medium having program to perform the same | |
| KR20220132824A (en) | Distribution facility condition monitoring system and method | |
| KR20160003549A (en) | Communication abnormality detecting apparatus, communication abnormality detecting method and program | |
| EP3179327B1 (en) | Equipment monitoring system, equipment monitoring program, and equipment monitoring method | |
| CN118019190A (en) | A smart lighting system based on pedestrian perception | |
| CN118980934A (en) | A method and system for rapid evaluation and detection of electrochemical batteries | |
| JP4310409B2 (en) | Life change detection method, apparatus and program | |
| CN118364337A (en) | Energy data processing evaluation management system and method | |
| CN110398386A (en) | A method for intelligently judging the state of temperature and humidity measuring points in air conditioning system | |
| CN116192038A (en) | Photovoltaic system fault diagnosis method, device and computer equipment | |
| KR20160026492A (en) | Anomaly detection method using confidence interval estimation based on time series analysis | |
| US20240192650A1 (en) | Occupancy estimation based on multiple sensor inputs | |
| US20220334030A1 (en) | Time series data processing method | |
| JP2017508152A (en) | Method for detecting defective optical sensors | |
| CN117493129B (en) | Operating power monitoring system of computer control equipment | |
| KR20160074023A (en) | Fault diagnosis system through a power analysis of the lighting in the building | |
| KR102900536B1 (en) | Structure H sensor system |
Legal Events
| Date | Code | Title | Description |
|---|---|---|---|
| PUAI | Public reference made under article 153(3) epc to a published international application that has entered the european phase |
Free format text: ORIGINAL CODE: 0009012 |
|
| 17P | Request for examination filed |
Effective date: 20141110 |
|
| AK | Designated contracting states |
Kind code of ref document: A2 Designated state(s): AL AT BE BG CH CY CZ DE DK EE ES FI FR GB GR HR HU IE IS IT LI LT LU LV MC MK MT NL NO PL PT RO RS SE SI SK SM TR |
|
| AX | Request for extension of the european patent |
Extension state: BA ME |
|
| DAX | Request for extension of the european patent (deleted) | ||
| RAP1 | Party data changed (applicant data changed or rights of an application transferred) |
Owner name: PHILIPS LIGHTING HOLDING B.V. |
|
| STAA | Information on the status of an ep patent application or granted ep patent |
Free format text: STATUS: EXAMINATION IS IN PROGRESS |
|
| 17Q | First examination report despatched |
Effective date: 20170102 |
|
| RIN1 | Information on inventor provided before grant (corrected) |
Inventor name: BIRRU, DAGNACHEW Inventor name: WANG, TIANQI |
|
| RAP1 | Party data changed (applicant data changed or rights of an application transferred) |
Owner name: PHILIPS LIGHTING HOLDING B.V. |
|
| RAP1 | Party data changed (applicant data changed or rights of an application transferred) |
Owner name: SIGNIFY HOLDING B.V. |
|
| GRAP | Despatch of communication of intention to grant a patent |
Free format text: ORIGINAL CODE: EPIDOSNIGR1 |
|
| STAA | Information on the status of an ep patent application or granted ep patent |
Free format text: STATUS: GRANT OF PATENT IS INTENDED |
|
| INTG | Intention to grant announced |
Effective date: 20200110 |
|
| GRAS | Grant fee paid |
Free format text: ORIGINAL CODE: EPIDOSNIGR3 |
|
| GRAA | (expected) grant |
Free format text: ORIGINAL CODE: 0009210 |
|
| STAA | Information on the status of an ep patent application or granted ep patent |
Free format text: STATUS: THE PATENT HAS BEEN GRANTED |
|
| AK | Designated contracting states |
Kind code of ref document: B1 Designated state(s): AL AT BE BG CH CY CZ DE DK EE ES FI FR GB GR HR HU IE IS IT LI LT LU LV MC MK MT NL NO PL PT RO RS SE SI SK SM TR |
|
| REG | Reference to a national code |
Ref country code: GB Ref legal event code: FG4D |
|
| REG | Reference to a national code |
Ref country code: CH Ref legal event code: EP |
|
| REG | Reference to a national code |
Ref country code: DE Ref legal event code: R096 Ref document number: 602013069913 Country of ref document: DE |
|
| REG | Reference to a national code |
Ref country code: IE Ref legal event code: FG4D |
|
| REG | Reference to a national code |
Ref country code: AT Ref legal event code: REF Ref document number: 1282924 Country of ref document: AT Kind code of ref document: T Effective date: 20200715 |
|
| REG | Reference to a national code |
Ref country code: NL Ref legal event code: FP |
|
| PG25 | Lapsed in a contracting state [announced via postgrant information from national office to epo] |
Ref country code: NO Free format text: LAPSE BECAUSE OF FAILURE TO SUBMIT A TRANSLATION OF THE DESCRIPTION OR TO PAY THE FEE WITHIN THE PRESCRIBED TIME-LIMIT Effective date: 20200917 Ref country code: SE Free format text: LAPSE BECAUSE OF FAILURE TO SUBMIT A TRANSLATION OF THE DESCRIPTION OR TO PAY THE FEE WITHIN THE PRESCRIBED TIME-LIMIT Effective date: 20200617 Ref country code: GR Free format text: LAPSE BECAUSE OF FAILURE TO SUBMIT A TRANSLATION OF THE DESCRIPTION OR TO PAY THE FEE WITHIN THE PRESCRIBED TIME-LIMIT Effective date: 20200918 Ref country code: FI Free format text: LAPSE BECAUSE OF FAILURE TO SUBMIT A TRANSLATION OF THE DESCRIPTION OR TO PAY THE FEE WITHIN THE PRESCRIBED TIME-LIMIT Effective date: 20200617 Ref country code: LT Free format text: LAPSE BECAUSE OF FAILURE TO SUBMIT A TRANSLATION OF THE DESCRIPTION OR TO PAY THE FEE WITHIN THE PRESCRIBED TIME-LIMIT Effective date: 20200617 |
|
| REG | Reference to a national code |
Ref country code: LT Ref legal event code: MG4D |
|
| PG25 | Lapsed in a contracting state [announced via postgrant information from national office to epo] |
Ref country code: LV Free format text: LAPSE BECAUSE OF FAILURE TO SUBMIT A TRANSLATION OF THE DESCRIPTION OR TO PAY THE FEE WITHIN THE PRESCRIBED TIME-LIMIT Effective date: 20200617 Ref country code: HR Free format text: LAPSE BECAUSE OF FAILURE TO SUBMIT A TRANSLATION OF THE DESCRIPTION OR TO PAY THE FEE WITHIN THE PRESCRIBED TIME-LIMIT Effective date: 20200617 Ref country code: RS Free format text: LAPSE BECAUSE OF FAILURE TO SUBMIT A TRANSLATION OF THE DESCRIPTION OR TO PAY THE FEE WITHIN THE PRESCRIBED TIME-LIMIT Effective date: 20200617 Ref country code: BG Free format text: LAPSE BECAUSE OF FAILURE TO SUBMIT A TRANSLATION OF THE DESCRIPTION OR TO PAY THE FEE WITHIN THE PRESCRIBED TIME-LIMIT Effective date: 20200917 |
|
| REG | Reference to a national code |
Ref country code: AT Ref legal event code: MK05 Ref document number: 1282924 Country of ref document: AT Kind code of ref document: T Effective date: 20200617 |
|
| PG25 | Lapsed in a contracting state [announced via postgrant information from national office to epo] |
Ref country code: AL Free format text: LAPSE BECAUSE OF FAILURE TO SUBMIT A TRANSLATION OF THE DESCRIPTION OR TO PAY THE FEE WITHIN THE PRESCRIBED TIME-LIMIT Effective date: 20200617 |
|
| PG25 | Lapsed in a contracting state [announced via postgrant information from national office to epo] |
Ref country code: EE Free format text: LAPSE BECAUSE OF FAILURE TO SUBMIT A TRANSLATION OF THE DESCRIPTION OR TO PAY THE FEE WITHIN THE PRESCRIBED TIME-LIMIT Effective date: 20200617 Ref country code: SM Free format text: LAPSE BECAUSE OF FAILURE TO SUBMIT A TRANSLATION OF THE DESCRIPTION OR TO PAY THE FEE WITHIN THE PRESCRIBED TIME-LIMIT Effective date: 20200617 Ref country code: PT Free format text: LAPSE BECAUSE OF FAILURE TO SUBMIT A TRANSLATION OF THE DESCRIPTION OR TO PAY THE FEE WITHIN THE PRESCRIBED TIME-LIMIT Effective date: 20201019 Ref country code: ES Free format text: LAPSE BECAUSE OF FAILURE TO SUBMIT A TRANSLATION OF THE DESCRIPTION OR TO PAY THE FEE WITHIN THE PRESCRIBED TIME-LIMIT Effective date: 20200617 Ref country code: AT Free format text: LAPSE BECAUSE OF FAILURE TO SUBMIT A TRANSLATION OF THE DESCRIPTION OR TO PAY THE FEE WITHIN THE PRESCRIBED TIME-LIMIT Effective date: 20200617 Ref country code: RO Free format text: LAPSE BECAUSE OF FAILURE TO SUBMIT A TRANSLATION OF THE DESCRIPTION OR TO PAY THE FEE WITHIN THE PRESCRIBED TIME-LIMIT Effective date: 20200617 Ref country code: CZ Free format text: LAPSE BECAUSE OF FAILURE TO SUBMIT A TRANSLATION OF THE DESCRIPTION OR TO PAY THE FEE WITHIN THE PRESCRIBED TIME-LIMIT Effective date: 20200617 |
|
| PG25 | Lapsed in a contracting state [announced via postgrant information from national office to epo] |
Ref country code: PL Free format text: LAPSE BECAUSE OF FAILURE TO SUBMIT A TRANSLATION OF THE DESCRIPTION OR TO PAY THE FEE WITHIN THE PRESCRIBED TIME-LIMIT Effective date: 20200617 Ref country code: SK Free format text: LAPSE BECAUSE OF FAILURE TO SUBMIT A TRANSLATION OF THE DESCRIPTION OR TO PAY THE FEE WITHIN THE PRESCRIBED TIME-LIMIT Effective date: 20200617 Ref country code: IS Free format text: LAPSE BECAUSE OF FAILURE TO SUBMIT A TRANSLATION OF THE DESCRIPTION OR TO PAY THE FEE WITHIN THE PRESCRIBED TIME-LIMIT Effective date: 20201017 |
|
| REG | Reference to a national code |
Ref country code: DE Ref legal event code: R097 Ref document number: 602013069913 Country of ref document: DE |
|
| PLBE | No opposition filed within time limit |
Free format text: ORIGINAL CODE: 0009261 |
|
| STAA | Information on the status of an ep patent application or granted ep patent |
Free format text: STATUS: NO OPPOSITION FILED WITHIN TIME LIMIT |
|
| PG25 | Lapsed in a contracting state [announced via postgrant information from national office to epo] |
Ref country code: DK Free format text: LAPSE BECAUSE OF FAILURE TO SUBMIT A TRANSLATION OF THE DESCRIPTION OR TO PAY THE FEE WITHIN THE PRESCRIBED TIME-LIMIT Effective date: 20200617 |
|
| 26N | No opposition filed |
Effective date: 20210318 |
|
| PG25 | Lapsed in a contracting state [announced via postgrant information from national office to epo] |
Ref country code: SI Free format text: LAPSE BECAUSE OF FAILURE TO SUBMIT A TRANSLATION OF THE DESCRIPTION OR TO PAY THE FEE WITHIN THE PRESCRIBED TIME-LIMIT Effective date: 20200617 |
|
| PG25 | Lapsed in a contracting state [announced via postgrant information from national office to epo] |
Ref country code: MC Free format text: LAPSE BECAUSE OF FAILURE TO SUBMIT A TRANSLATION OF THE DESCRIPTION OR TO PAY THE FEE WITHIN THE PRESCRIBED TIME-LIMIT Effective date: 20200617 |
|
| PG25 | Lapsed in a contracting state [announced via postgrant information from national office to epo] |
Ref country code: LU Free format text: LAPSE BECAUSE OF NON-PAYMENT OF DUE FEES Effective date: 20210404 |
|
| REG | Reference to a national code |
Ref country code: BE Ref legal event code: MM Effective date: 20210430 |
|
| PG25 | Lapsed in a contracting state [announced via postgrant information from national office to epo] |
Ref country code: LI Free format text: LAPSE BECAUSE OF NON-PAYMENT OF DUE FEES Effective date: 20210430 Ref country code: CH Free format text: LAPSE BECAUSE OF NON-PAYMENT OF DUE FEES Effective date: 20210430 |
|
| PG25 | Lapsed in a contracting state [announced via postgrant information from national office to epo] |
Ref country code: IE Free format text: LAPSE BECAUSE OF NON-PAYMENT OF DUE FEES Effective date: 20210404 |
|
| PG25 | Lapsed in a contracting state [announced via postgrant information from national office to epo] |
Ref country code: IS Free format text: LAPSE BECAUSE OF FAILURE TO SUBMIT A TRANSLATION OF THE DESCRIPTION OR TO PAY THE FEE WITHIN THE PRESCRIBED TIME-LIMIT Effective date: 20201017 |
|
| PG25 | Lapsed in a contracting state [announced via postgrant information from national office to epo] |
Ref country code: BE Free format text: LAPSE BECAUSE OF NON-PAYMENT OF DUE FEES Effective date: 20210430 |
|
| PG25 | Lapsed in a contracting state [announced via postgrant information from national office to epo] |
Ref country code: HU Free format text: LAPSE BECAUSE OF FAILURE TO SUBMIT A TRANSLATION OF THE DESCRIPTION OR TO PAY THE FEE WITHIN THE PRESCRIBED TIME-LIMIT; INVALID AB INITIO Effective date: 20130404 |
|
| P01 | Opt-out of the competence of the unified patent court (upc) registered |
Effective date: 20230421 |
|
| PG25 | Lapsed in a contracting state [announced via postgrant information from national office to epo] |
Ref country code: CY Free format text: LAPSE BECAUSE OF FAILURE TO SUBMIT A TRANSLATION OF THE DESCRIPTION OR TO PAY THE FEE WITHIN THE PRESCRIBED TIME-LIMIT Effective date: 20200617 |
|
| PG25 | Lapsed in a contracting state [announced via postgrant information from national office to epo] |
Ref country code: MK Free format text: LAPSE BECAUSE OF FAILURE TO SUBMIT A TRANSLATION OF THE DESCRIPTION OR TO PAY THE FEE WITHIN THE PRESCRIBED TIME-LIMIT Effective date: 20200617 |
|
| PG25 | Lapsed in a contracting state [announced via postgrant information from national office to epo] |
Ref country code: TR Free format text: LAPSE BECAUSE OF FAILURE TO SUBMIT A TRANSLATION OF THE DESCRIPTION OR TO PAY THE FEE WITHIN THE PRESCRIBED TIME-LIMIT Effective date: 20200617 |
|
| PG25 | Lapsed in a contracting state [announced via postgrant information from national office to epo] |
Ref country code: MT Free format text: LAPSE BECAUSE OF FAILURE TO SUBMIT A TRANSLATION OF THE DESCRIPTION OR TO PAY THE FEE WITHIN THE PRESCRIBED TIME-LIMIT Effective date: 20200617 |
|
| PGFP | Annual fee paid to national office [announced via postgrant information from national office to epo] |
Ref country code: GB Payment date: 20260226 Year of fee payment: 14 |
|
| PGFP | Annual fee paid to national office [announced via postgrant information from national office to epo] |
Ref country code: NL Payment date: 20260423 Year of fee payment: 14 |
|
| PGFP | Annual fee paid to national office [announced via postgrant information from national office to epo] |
Ref country code: IT Payment date: 20260422 Year of fee payment: 14 |
|
| PGFP | Annual fee paid to national office [announced via postgrant information from national office to epo] |
Ref country code: DE Payment date: 20260623 Year of fee payment: 14 |
|
| PGFP | Annual fee paid to national office [announced via postgrant information from national office to epo] |
Ref country code: FR Payment date: 20260423 Year of fee payment: 14 |