EP2835751A1 - Procédé de déconvolution d'informations moléculaires mixtes dans un échantillon complexe afin d'identifier des organismes - Google Patents
Procédé de déconvolution d'informations moléculaires mixtes dans un échantillon complexe afin d'identifier des organismes Download PDFInfo
- Publication number
- EP2835751A1 EP2835751A1 EP13306125.9A EP13306125A EP2835751A1 EP 2835751 A1 EP2835751 A1 EP 2835751A1 EP 13306125 A EP13306125 A EP 13306125A EP 2835751 A1 EP2835751 A1 EP 2835751A1
- Authority
- EP
- European Patent Office
- Prior art keywords
- taxon
- matches
- sample
- organism
- database
- Prior art date
- Legal status (The legal status is an assumption and is not a legal conclusion. Google has not performed a legal analysis and makes no representation as to the accuracy of the status listed.)
- Withdrawn
Links
Images


Classifications
-
- G—PHYSICS
- G16—INFORMATION AND COMMUNICATION TECHNOLOGY [ICT] SPECIALLY ADAPTED FOR SPECIFIC APPLICATION FIELDS
- G16B—BIOINFORMATICS, i.e. INFORMATION AND COMMUNICATION TECHNOLOGY [ICT] SPECIALLY ADAPTED FOR GENETIC OR PROTEIN-RELATED DATA PROCESSING IN COMPUTATIONAL MOLECULAR BIOLOGY
- G16B10/00—ICT specially adapted for evolutionary bioinformatics, e.g. phylogenetic tree construction or analysis
-
- G—PHYSICS
- G16—INFORMATION AND COMMUNICATION TECHNOLOGY [ICT] SPECIALLY ADAPTED FOR SPECIFIC APPLICATION FIELDS
- G16B—BIOINFORMATICS, i.e. INFORMATION AND COMMUNICATION TECHNOLOGY [ICT] SPECIALLY ADAPTED FOR GENETIC OR PROTEIN-RELATED DATA PROCESSING IN COMPUTATIONAL MOLECULAR BIOLOGY
- G16B20/00—ICT specially adapted for functional genomics or proteomics, e.g. genotype-phenotype associations
Definitions
- the present invention relates to a method to determine the identity (if already reported in a taxonomic database) or the identity of the closest related organism reported in a taxonomic database of one or more organisms present in a sample.
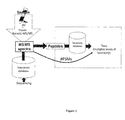
- the present invention does this by comparing a data set acquired by analysing at least one component of the biological sample for instance its protein content, and comparing this with a database derived from large programs of genome sequencing and annotation of known organisms so as to match each component of the protein content of the sample to one or more taxon and then collating the phylogenetic distance between the taxa and the number of matches.
- microorganisms, viruses, multicellular organisms, or debris/contaminants originating from these organisms or culture media or additives in a sample is an important and ongoing area of research.
- the ability to identify the presence of known or emergent strains of infectious agents such as bacterial, viral or other disease causing organisms in a sample is important for the purposes of public health, epidemiology and public safety.
- a given product, such as a processed food or cosmetic preparation comprises only the claimed biological constituents is also a growing concern due to the increasing prevalence of highly processed food stuffs in the food chain and the reliance of consumers on manufacturers and retailers that their products can be trusted.
- reagents which are specific for a given organism or at best a related group of organisms.
- These reagents include materials such as 'organism specific' PCR primers or antibodies that can be used in a detection method.
- Other methods include DNA/RNA/antibody microarrays which comprise sequences from different organisms. In all cases due to the limitations of the number of materials comprised/used in such methods it is not possible to provide an entirely comprehensive assay. The problem with all these methods is therefore that identification is based upon the use of a specific detection reagent (or set of reagents).
- the number of specific peptides or even the total number of peptides are not representative of the quantities of each organism because of "degenerate" peptides shared by organisms which must be specifically analysed in case of mixtures of organisms and contaminated samples.
- the present invention relates to a method which allows the identification of any organism(s) present in a complex biological sample, by analysing the data in a more global and complete manner than any existing method.
- This new method compares data obtained on at least one component of the sample for instance its DNA, RNA, protein or lipid content, or upon a combination of data about these components, and based upon a comparison of this data set with existing databases allows the determination of the organism or organisms present in the sample if these are present in the database, or alternatively provides an accurate prediction of the relatedness of the unknown organisms present in the sample to the most closely related organism in the database.
- this method allows for the quantification of the amount of each organism present in a sample. This quantification can either be relative, in terms of the percentage of each organism present or absolute.
- the claimed invention also allows an identification confidence level to be determined at each taxonomical level for each organism identified in the sample.
- the claimed invention allows an identification of the organism or a part of the said organism present in a given sample without the need of fastidious isolation or cultivation of this organism.
- the present invention can be used in a large number of fields including but not limited to microbiology, environmental sciences, food industry, farming, bioremediation, waste management, human health, green energy and green chemistry, biomining, cleaning controls, air and water quality management, plant and crop improvement, biodiversity management, counter-bioterrorism, forensics science, synthetic biology.
- This method can be applied to the analysis of a sample using any method that generates signals that can be assigned to taxonomical levels (strain, species, genus, etc..), the analysis could therefore be upon aspects of the sample such as it entire or a part of its protein content (global molecular weights or sequences or subset of sequences); peptide content (global molecular weights or sequences); lipid profile; metabolite profile; nucleotide content (size of fragments or sequences or subset of sequences).
- the assignment of the signal to a taxonomical level can be done either by interpretation of the signal (or part of it) or correspondence (or partial correspondence) with records established previously or predicted for individual organisms.
- the data set can be generated using methods and materials such as liquid chromatography, mass spectrometry, liquid chromatography/mass spectrometry, static fluorescence, dynamic fluorescence, high performance liquid chromatography, ultra-high performance liquid chromatography, enzyme-linked immunoadsorbant assay, real-time PCR, or combinations thereof and wherein said mass spectrometry is liquid chromatography/mass spectrometry, liquid chromatography/mass spectrometry/mass spectrometry, ultra-high performance liquid chromatography mass spectrometry/mass spectrometry, Matrix-assisted laser desorption/ionization (MALDI) mass spectrometry/mass spectrometry, Biological Aerosol Mass Spectrometry, ion mobility/mass spectrometry or ion mobility/mass spectrometry/mass spectrometry, the tandem mass spectrometry being performed in data dependent mode or data independent mode, RNA or DNA microarrays; RNA or DNA or protein sequencing methods, protein
- multiple components of the sample are analysed, for instance the DNA or protein content is analysed using appropriate techniques.
- the sample comprises eukaryotic organisms, animals, bacteria, archaea, spores, protista, algaea, plants, virus, viral capsids, fungi, yeasts, eukaryotic cells, blood cells, cancer cells, neuronal cells, primary cells or epithelial cells, or parts or mixture of these items such as plant roots, plant leafs, plant seeds, animal tissues, animal organs, or derived cells such as those obtained by repeated cultures under selective or non-selective pressure, or engineered cells such as genetically modified organisms or organisms created by means of synthetic biology, or parts secreted or released by these items such as milk, toxins, enzymes, antibiotic resistances, virulence factors, growth factors or hormones, or parts considered as contaminants such as keratins or unexpected molecules, or parts considered as additives such as molecules used as decoy or used as standards or as culture medium components.
- tax means a group of one (or more) populations of organism(s), which a taxonomist adjudges to be a unit.
- peptide spectrum match(es) or "PSM(s)” means a match from a MS/MS spectrum query to a given peptide.
- nucleic acid sequence means the sequence of a deoxyribonucleic acid (DNA) or ribonucleic acid (RNA), or part of this sequence.
- nucleic acid sequence reads means the output of any method or technology that is used to determine the order of the bases (adenine, guanine, cytosine, thymine, uracile) in a strand of DNA or RNA or the output of any method or technology that is used to assemble parts of deoxyribonucleic acid (DNA) or ribonucleic acid (RNA) sequences.
- nucleic acid sequence reads quality factor means the global evaluation of per-base error probabilities reported by sequencers for each nucleic acid sequence reads (mean per-base error probabilities reported for each nucleotide position of the sequence; cumulated per-base error probabilities for all the nucleotides).
- nucleic acid sequence quality factor means the global evaluation of per-contig error probabilities for the assembly result.
- nucleic acid sequence reads redundancy means the number of identical nucleic acid sequence reads.
- specific matches means components that are assigned at a unique taxon at a given taxonomic level.
- taxon may mean a superkingdom, phylum, class, order, family, genus, species, strain or any other recognised group or population of organisms which are phylogenetically related and which have characters in common which differentiate the group from other such groups.
- the correlation curve used to generate a deconvolution function in step d) is a monotonic decreasing function.
- the phylogenetic distance may be calculated as described in the examples below based upon the relatedness of the taxons selected during step b) of the claimed method or the phylogenetic distance may be assigned to each taxon on the basis of an existing measurement of the relatedness of the taxons such as those described in the art.
- said taxons are clades at a given taxonomical level, ranging from superkingdom to species, or to the most precise taxonomical rank beyond the species level such as subspecies.
- Peptide spectrum matches per taxon are then the aggregation of subtaxons data. Distances between taxons are infered from distances between subtaxons, using for example mean or median calculation.
- said database comprises only data which has been fully annotated and attributed.
- the database against which the data set of step a) is compared comprises only data that has been fully annotated and attributed, that is it has been shown to represent a native structure/sequence/profile from the organism which was sequenced/analysed.
- step b) may be performed using a first database comprising all selected data and a second database comprising only annotated and attributed data.
- the taxon selected on the basis of the second database is chosen.
- Y is the number of matches attributed to taxa data points
- exp() is the exponential function
- N k is the number of matches attributed to the taxon k chosen as the reference for distances calculation (X-axis)
- X k is the phylogenetic distance between a taxon and taxon k
- a k is the percentage of the exponential term in the form exp(-X k /d1 k ), with the complement to 1 attributed to the second exponential term in the form exp(-X k /d2 k ).
- Terms d1 k and d2 k are homogenous to distances representing components more or less shared between taxons due to sequence conservation.
- d k represents the phylogenetic distance between the taxon in the sample and the closest taxon in the database, which is said taxon k with the highest number of matches.
- the claimed method may comprise the further steps:
- the claimed method may be used to identify all of the organisms present in a sample, by identifying each organism present therein by subtracting the data present in the data set which relates to each identified organism either iteratively or concurrently until only data at or below noise level remains.
- step b) is performed iteratively on an increasingly lower number of taxons, wherein only the identified taxons after repetition of steps c) to h) are retained and then from within these retained taxon(s) a new comparison of the data set with a database of known proteins is made and the assignment of each of said plurality of peptide spectrum matches to one or more higher taxon(s).
- step b) is performed iteratively on an increasingly smaller number of taxons, wherein only the taxons identified after repetition of steps c) to h) are retained and then from within these retained taxon(s) further steps b) to f) are repeated at least one time.
- step b) is performed iteratively on an increasingly smaller number of taxons, wherein only the taxons with the highest numbers of specific matches are retained and then from within these retained taxon(s) further step b) to f) are repeated at least one time.
- step b) the measurement of peptide abundance is performed by a method selected from the group comprising a method using extracted Ion Chromatograms, a quantification method based on mass spectrometry data or associated liquid-chromatography data, the MS/MS total ion current and methods based on peptide fragments isolation and quantification such as selected reaction monitoring (SRM) or multiple reaction monitoring (MRM).
- SRM selected reaction monitoring
- MRM multiple reaction monitoring
- step b) the measurement of nucleotide abundancy is performed using "nucleic acid reads" quality factor or "nucleic acid reads” redundancy.
- step c) the top 100 or top 10 peptide sequence matches are selected.
- the said component is a nucleic acid sequence
- said matches are nucleic acid sequences
- the measurement is performed using "nucleic acid” quality factor
- the said component is a nucleic acid sequence
- said matches are "nucleic acid sequence reads”
- the measurement is performed using "nucleic acid reads" quality factor or "nucleic acid reads” redundancy.
- the biological sample is prepared for analysis of its whole protein content by tandem mass spectrometry, for example following the protocol described in ( FR1354692 ) or using standard approach such as described in Mass Spectrometry: A Textbook (Springer, 2011 ).
- the sample undergoes protein precipitation by trichloroacetic acid (10% final), centrifugation in an Eppendorf centrifuge, removal of the supernatant, pellet dissolved into Laemmli buffer, SDS-PAGE electrophoresis but with a short migration time, excision of a polyacrylamide band containing the whole proteome, reduction and alkylation of cysteines by iodoacetamide, and enzymatic proteolysis by trypsin. The resulting peptides are then washed, concentrated and loaded onto a reverse-phase chromatography column coupled to a mass spectrometer for tandem mass spectrometry analysis.
- the sample processed in the experiment reported in figures 3 and 4 was prepared from an Escherichia coli BL21(DE3) culture grown in liquid LB medium (Lysogeny Broth, i.e. 10 g tryptone + 5 g yeast extract + 10 g NaCl for 1 liter of distilled or deionized water).
- the sample consisted in the equivalent of 250 ⁇ l of culture harvested at an optical density (OD) value of 1 as measured at 600 nm (about 1E9 cells).
- OD optical density
- the whole protein content of these cells was subjected to SDS-PAGE and processed with trypsin in presence of ProteaseMax reagent, yielding a solution of 50 ⁇ L of tryptic peptides.
- a fraction (1 ⁇ L out of 50 ⁇ L) of the resulting processed sample was injected in the mass spectrometer.
- the sample processed in the experiment reported in figures 5 and 6 was prepared by mixing two distinct cultures grown separately: Escherichia coli BL21(DE3) culture grown in liquid LB medium and Ruegeria pomeroyi DSS-3 grown in liquid marine broth.
- the mixed sample consisted in the equivalent of a volume of 50 ⁇ L of Escherichia coli BL21(DE3) culture at DO (600 nm) equal to 1 (about 2E8 cells), added to a volume of 250 ⁇ L of Ruegeria pomeroyi DSS-3 culture at DO (600nm) equal to 1 (about 1E9 cells).
- a fraction (1 ⁇ L out of 50 ⁇ L) of the resulting processed sample was injected in the mass spectrometer.
- Step 1 Load 1 to 10 ⁇ L (maximum volume allowed by the system) of the acidified peptide mixture and resolve over a 90 min linear gradient from 5 to 50% solvent B (0.1 % formic acid, 80% acetonitrile in water) using a flow rate of 0.3 ⁇ L/min.
- the loading volume is adjusted as a function of the total current measured by the mass spectrometer to avoid saturating the detector.
- Step 2 Collect full-scan mass spectra over the 300 to 1,800 m / z range and MS/MS on the three most abundant precursor ions (minimum signal required set at 10,000, possible charge states: 2+), with dynamic exclusion of previously-selected ions (exclusion duration of 10 sec, one replicate).
- the resulting RAW file recorded by the mass spectrometer contains MS spectra and MS/MS spectra for MS isotopic patterns corresponding to certain requirements (intensity above 10000, +2 charge). These requirements are associated with peptides that have a high probability of being identified from the corresponding MS/MS fragmentation spectrum.
- the RAW file is converted to MGF (Mascot Generic File) format using the extract_msn.exe program (ThermoScientific), with options set as follows: 400 (minimum mass), 5,000 (maximum mass), 0 (grouping tolerance), 0 (intermediate scans), 10 (minimum peaks), 2 (extract MSn), and 1,000 (threshold).
- NCBI nr database is downloaded weekly on the Mascot server from ftp://ftp.ncbi.nih.gov/BLAST/db/ in fasta format. This database is used both by Mascot for identifications and to create a BLAST formatted database for BLAST searches.
- NCBI taxonomy database is also loaded weekly on the server from ftp://ftp.ncbi.nih.gov/pub/taxonomy/.
- Files used are gi_taxid_rot.dmp for gi to taxid mapping; nodes.dmp for taxonomy level and hierarchy; and names.dmp for taxons names.
- Python packages The Mascot DAT files can be read using the msparser tool (Matrix Science). The Python version of msparser is used (v2.4.02) and interfaced with a complete package written in Python (v2.6.6).
- Additional packages to the Python installation include biopython (v1.55), lxml (v3.0.1), numpy (v1.6.2), scipy (v0.9.0), poster (v0.8.1), pysqlite2, tablib (v0.9.1), and ujson (v1.23).
- a Python library from ThermoScientific, msfilereader can also be used to access RAW files (in which case python package comtypes (v0.6.2) is needed).
- NCBInr fasta files are processed to create a BLAST database using the makeBLASTdb.exe utility with the options parse_seqids and hash_index set and the following parameters: prot (dbtype), gi_taxid_prot.dmp (taxid_map), NCBInr (title), and NCBInr (out).
- Curve fitting and signal deconvolution are performed in Excel (Microsoft Office 2010), using VBA macros and the solver for curve fitting (GRG non linear, default options). Alternatively, they can be performed with any tools efficient for mixture model analysis, including the evaluation of the number of components, for example using scipy functions, such as curvefit and the Levenberg-Marquardt algorithm, using the Jacobian matrix of the correlation function for curve fitting.
- Python packages include msparser (Matrix Science) used to access Mascot DAT files and msfilereader (ThermoScientifc) used to access RAW files.
- the ranges to collect intensity data associated to a PSM were 1.2 ppm for the m / z window compared to the peptide m / z, and 300 s compared to the retention time (RT) of the MS/MS considered. All MS scans, acquired at 1 Hertz, where processed with these m/z and RT ranges to extract the full XIC, and collect the maximum intensity value associated with each PSM.
- Unassembled whole genome sequencing (WGS) data were downloaded for a typical Escherichia coli sequencing on Illumina HiSeq 2000 for ERR163875.
- a first random SRA subset (14,448 reads) was transformed to fasta format using the SRA toolkit (NCBI) to convert SRA to fastq, then the BioPython SeqIO.convert function was used to obtain a fasta file.
- This file was used as a query for a BLASTn search on NCBI nt with default parameters except for a E-value at 1e-20.
- a second subset of 14,428 reads was then selected on the double criteria: (i) 200 bp sequence with no undetermined nucleotide (N) and, (ii) at least one BLAST hit with a E-value below 1e-20.
- a Python script was written to associate organism information to each read using the "Hit_def" field from the XML BLAST output after minor "Hit_def” curation to homogenize species naming.
- the final output in Table VI also includes a numbering of reads only associated with the species taxa listed.
- the first step of the procedure consists of the assignation of peptide sequences to the MS/MS spectra recorded by tandem mass spectrometry.
- the inventors used the MASCOT software with standard parameters.
- the efficiency of MS/MS spectra assignment using the current peptide extraction protocol for samples corresponding to either Gram+ or Gram- bacteria is indicated in Table I by the assignment ratio. This ratio is the number of spectra assigned by Mascot to a peptide sequence from the database at a confidence value p below 0.05, also called Peptide Spectrum Matches (PSMs).
- the ratio of assigned MS/MS spectra per recorded spectra in our experimental set-up varies from 63 to 71 % at a confidence value of 95% (p ⁇ 0.05) for data recorded for this specific organism.
- the ratio drops to 27 to 35% even at a confidence value of 90% (p ⁇ 0.10) because of a higher number of peptides matching the m / z value of the parent solely by chance.
- a faster Mascot search will be obtained by selecting a subset of the NCBInr based on a unique taxon per genus, selected for being representative of the number of proteins in the genus and for good sequencing quality (complete status on NCBI genomes - http://www.ncbi.nlm.nih.gov/genome or GOLD - http://www.genomesonline.org).
- This reduced database allows a higher number of PSMs than with the whole NCBInr database in a first faster coarse-grained Mascot search, while retaining the capability to identify the different genera represented in the sample.
- Table I Efficiency of MS/MS spectra assignments for pure organisms using a dedicated protein database extracted from the NCBInr or the complete protein NCBInr database.
- the next stage of the process is to attribute spectra to taxons, using PSMs from the Mascot search.
- Classical proteomics tries to maximize the protein inference confidence by means such as parsimony (a rule which attributes each spectrum only to the most probable protein, i.e., with the highest number of spectra or peptides attributed) or a minimum of 2 different peptides to validate a protein (see the journal " Molecular and Cellular Proteomics" current guidelines: http://www.mcponline.org/site/misc/PhialdelphiaGuidelinesFINALDRAFT.pdf ).
- the ⁇ org.ID procedure does not involve the interpretation of data in terms of proteins, instead all the information available is used to estimate a quantitative representative of the contribution of an organism in a complex sample, possibly in a mixture.
- Conservation of tryptic peptide sequences is such that many sequences can be found in several organisms from different clades because they are in conserved regions of widespread conserved proteins. The co-occurrence of such conserved peptides is higher for closely-related organisms than far-related organisms. Table II shows this level of conservation for a specific dataset ( E. coli BL21(DE3)) at the phylum level.
- a sqlite database is built using Python with 3 tables.
- the first table is called 'gi2firstgi' and associates each gi from the NCBInr with the first gi listed in the fasta file if they correspond to the same polypeptide sequence.
- a gi is a unique identifier of a given polypeptide in the NCBI database. All gis associated with the same "first" gi thus share exactly the same polypeptide sequence, summarizing the non-redundancy information in the NCBInr database.
- This table is created from a parsing of all headers from the NCBInr database.
- the second table called 'gi2taxid' is created directly from the gi_taxid_prot.dmp NCBI taxonomy file and associates gis (master key) to taxids.
- the third table called 'taxid2nbgis_nbseqs' associates taxids (i) with the number of gis per taxid by querying each taxid in the second table (gi2taxid) and (ii) with the number of different sequences, using the first table (gi2firstgi) to identify redundant gis of identical sequence (one gi for the NCBI RefSeq and one for the Genbank accession, for example).
- a first listing of all PSMs above the p-value threshold is compiled from the DAT file using msparser, allowing the mapping of spectra to peptides. This stage is not limited to the PSM of highest score for each spectrum because the inventors address sample mixtures without parsimony requirements. All proteins containing each peptide are then associated to each spectrum using the msparser, and Table gi2firstgi is used to enlarge protein mapping to all proteins, redundant or non-redundant. Table gi2taxid is then used to convert gis to taxids and obtain an association of each spectrum with a list of unique taxids.
- Proteins corresponding to the Protein DataBank are excluded because many structures are obtained with mutated sequences, resulting in abnormal taxon specific spectra.
- File nodes.dmp (taxonomic hierarchy and level information) is processed, and the spectrum-taxa information is reversed to obtain a list of spectra per taxon, including sub-taxon aggregation for clade taxa. Spectra lists for each taxon are finally uniquified before counting spectra per taxon.
- the "no rank" level can correspond to strains
- the aggregation of several sub-taxa of the same "no rank” level was performed, but sub-taxa were also listed in the same evaluation. This result corresponds to a table including both "no rank" and leaf taxons, which also allows the evaluation at the finest taxonomical level of bacterial leaf taxa only referenced at the species level.
- a counting of unique (or specific) PSMs is performed for each taxon, indicating the number of PSMs that are only associated to each given taxon.
- Table II lists a subset of such information at the phylum level and Table III at the "no rank + leaf" level, i.e., the most resolute level, for the same pure E. coli BL21(DE3) strain sample.
- Species Escherichia sp. 1_1_43 appears in Table III because it has no "no rank" sub-taxon.
- Taxon 37762 for E. coli B collects 2288 PSMs for only 97 sequences in the database because of its sub-taxon (taxid 413997).
- Table III Numbering of PSMs per taxon at the most resolute level, i.e. the "no rank + leaf” level, and at the species level for selected taxons, for a an E.coli BL21(DE3) pure sample.
- Name Taxid Tax Rank Super kingdom # sequences # MS/MS # specific MS/MS # peptides Escherichia coli BL21(DE3) 469008 no rank Bacteria 4380 2315 0 1321 Escherichia coli 'BL21-Goid(DE3)pLysS AG' 866768 no rank Bacteria 4156 2315 0 1321 Escherichia coli H489 656404 no rank Bacteria 4525 2301 0 1311 Escherichia coli B 37762 no rank Bacteria 97 2286 0 1306 Escherichia coli B str.
- This method was chosen for the phylopeptidomic approach as a starting point for the automation of the calculation of a phylogenetic distance between taxa for several reasons.
- the data used are similar to the data collected in tandem mass spectrometry experiments, i.e. partial protein sequences.
- concentration ratios for visible peptides are limited by the dynamic range of the instruments, currently at about 4 orders of magnitudes.
- protein concentration ratios ranging from 7 for bacteria to 10 orders of magnitudes for eukaryotes, only the MS/MS detectable peptides from the most abundant proteins are consistently analyzed, corresponding in general to more conserved proteins of the key cellular functions (such as proteins involved in translation) rather than proteins of higher specificity.
- a second reason is the availability of fast tools such as BLAST to identify COGs homologues in any given proteome.
- a third reason is the stringency of the method, where pre-existing alignment of COGs can serve as a frame, following some curations.
- a first synchronization of COGs sequences used in the alignment with current sequences and sequences-to-taxon associations has been performed, to match data reported in the NCBI taxonomy history files. In addition to this curation, 11 taxons have been removed from the reference alignment to suppress sequence redundancy.
- the methodology to add a new taxon to the root MSA is to identify the closest taxon ("reference taxon") in the root MSA using NCBI taxonomy hierarchy information.
- COGs sequences for the reference taxon (COGs_fasta) are then queried using BLAST against the NCBInr filtered with the list of gis corresponding to the taxid to be added.
- This list of gis (gi_list) is easily extracted from the gi2taxid sqlite table for the new taxid.
- the BLASTp.exe utility is run with optimized parameters: COGs_fasta (query), gi_list (gilist), 1 (max_target_seqs), 9 (gapopen), 1 (gapextend), BLOSUM90 (matrix).
- COGs_fasta query
- gi_list gilist
- 1 max_target_seqs
- 9 gapopen
- 1 gapextend
- BLOSUM90 matrix
- CLUSTALW is used to generate a phylip tree (.ph), using the neighbour-joining algorithm to construct the tree.
- a patristic distance matrix is extracted from the phylip tree, using for example the R program or the dendropy package in Python.
- clustalw is not a phylogeny tool, the distance error compared to PHYML or Phylip's PROTDIST are minor compared to the time taken for bootstrapping in more evolved methods.
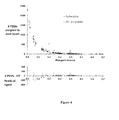
- Figures 3 and 4 were plotted at the strain and genus taxonomic level, respectively.
- N is the number of PSMs attributed to the taxon chosen as the reference for distances calculation (X-axis)
- A is the percentage of the exponential term in the form e -X/d1 , with the complement to 1 attributed to the second exponential term in the form e -X/d2 .
- the parameters of this function are fitted to minimize a convergence criterion, representative of the differences between data points and function.
- An improved model includes a function by parts, adapted to non-sequenced organisms.
- An additional parameter d is used, indicative of the phylogenetic distance between the best taxon found in databases, and the actual organism in the sample.
- d ⁇ X : Y N ⁇ A ⁇ e - X / d ⁇ 1 + 1 - A ⁇ e - X / d ⁇ 2 .
- figure 3 and 4 the latter function was used, with parameters d1 and d2 fixed to 0.0122 and 0.0733 respectively, and parameters N, A and d fitted, using a non-linear adjustment method.
- Figure 3 and 4 were fitted using the "GRG nonlinear" method of Excel 2010 solver, adjusting the sum of absolute differences between data points and function to 0.
- nonlinear methods such as Levenberg-Marquardt could be used, using the Jacobian matrix holding partial derivatives of the function described (or a sum of such functions in the case of a mixture of organisms) with respect to each of the parameters, or whatever adapted method known from the art.
- Data shown in figure 5 and figure 6 correspond to the number of PSMs per taxon for a sample prepared by mixing a fraction of two cultures of microorganisms, namely Escherichia coli BL21(DE3) (taxid: 469008) and Ruegeria pomeryoi DSS-3 (taxid: 246200), as detailed in Materials and Methods.
- the amounts used equivalent to 250 ⁇ l at an OD of 1 for R. pomeroyi and 1/5 of this amount for E.coli, should correspond to a ratio of cells for R. pomeroyi : E.coli equal to 5.
- Deconvoluted number of PSMs, Nr and Nc represent the number of spectra attributed to each organism, excluding the fraction of PSM resulting from the presence of other organisms in the mixture.
- the deconvolution process to identify taxons in a mixture sample can either be iterative or concurrent.
- the current data indicates that a generic value for parameter d1 can be found, and d2 and A might need to be slightly adjusted per clade (for a given PSM confidence level). They have yet to be adapted to different values for different taxonomical levels.
- Function 2 by parts, can be used to deconvolute the signal of a non-sequenced organism.
- the global process can be itemized in 8 stages following the prior sample preparation and processing on a LC-MS/MS instrument:
- the deconvoluted amount of PSM is very similar to the number of spectral counts (SC) used in comparative proteomics to quantify ratios of proteins in different conditions.
- the XIC based quantification of a taxon can then be computed for example using the sum of a subset comprising the 100 most intense XICs associated to it, as shown in Figure 7 .
- the correlation of this quantitation with distances between taxa was also used to deconvolute in particular the contribution of PSMs shared between organisms, which is a crucial problem for closely related organisms.
- a better estimation of the ratio of any sample can be obtained after normalizing the intensities with a measurement where the ratio is known such as the 1:1 ratio as done in Table IV..
- any other mass spectrometry-based quantitative methods could also be applied to associate an intensity value to each PSM signal, such as the Total Ion current (TIC) of the MS/MS spectrum.
- TIC Total Ion current
- Table IV Relative quantification of dilutions of E. coli BL21 to a reference organism: R. pomeroyi DSS-3, and comparison of OD ratios to the MS quantification methods using deconvoluted #PSMs and XIC values.
- Absolute quantification of pure samples is also within reach, but requires a calibration curve to correlate the taxon signal to a signal representative of a number of cells in the sample.
- This calibration depends on (i) the correspondence between number of cells and peptides amounts for different cell types, (ii) the protocol leading to a digested sample from a cell extract, (iii) the characteristics of the separation process before introduction in the mass spectrometer, (iv) the mass spectrometer capacity to process exhaustively all peptides ions at any elution stage (v) the mass spectrometer reproducibility for varying complex samples.
- a test was performed with a selected organism ( E . coli BL21 ) for which two cell amounts were processed similarly. The two samples, M3 and M12, differed by a ratio of 10 in terms of Optical Density as measured at 600 nm. Results are shown in Table V.
- Table V Quantification of 2 samples of E . coli BL21 of cells contents in a ratio of 1/10, as estimated by OD. Sum of Top10 XIC gives an accurate ratio estimate, thus absolute quantitation if a reference is known.
- Function 2 which is detailed above, can be used to analyze a sample containing organisms with unsequenced genomes or not present in the search database. Such condition was simulated using data from figures 3 and 4 . Distances between the strain effectively present in the sample, i.e. Escherichia coli BL21(DE3), taxid: 469008, and other taxons have been used to identify the first taxon at a distance above 0.025. In this case, the first organism identified was Cronobacter sakazakii ES15 (taxid: 1138308), at a distance of 0.0251. This organism is from the same family as Escherichia coli, namely the Enterobacteriaceae family ( Enterobacteriales order).
- Figure 8 was plotted using taxid 1138308 as the reference organism for X values, and displaying only taxons at a distance from taxid 469008 above 0.025.
- parameter d (0.0288) is close to the distance used to exclude taxons (0.0250), and is thus an indicator of the distance between the organism in the sample and the closest representative in the database used for fitting.
- the sensitivity of this indicator of phylogenetic distance has been assessed on the same sample by removing all Escherichia coli strains up to a distance of 0.0009 from strain E. coli BL21(DE3), corresponding to the first organism of a different species, namely Shigella flexneri 2a str. 2457T (taxid: 198215).
- This organism is from the same family as Escherichia coli, namely the Enterobacteriaceae family (Enterobacteriales order), and closely-related to Escherichia genus representatives.
- this organism as the reference organism for distances selection from the distance matrix, the best fit is obtained with a parameter d of 0.0005, whereas d is found at 0 when the reference organism is the correct one for the sample.
- the method is thus sensitive enough to identify sequenced organisms at the strain level, but also to characterize if the identification of an unsequenced organism is correct even at the species level.
- the most direct identification data is the number of spectra specific of a given taxon, at each taxonomical level.
- the dramatic increase of sequenced organisms leads to a lowering of this information to the noise level, in particular at the strain or even the species level. This is already the case for Escherichia coli strains, which identification at the strain level can no longer be performed relying only on this information as shown in Table III.
- the number of deconvoluted spectra per taxon is much more informative, and even essential in case of a mixture of organisms.
- SRA Sequence Read Archive
- WGS Whole Genome Shotgun
- a correlation function between DNA read counts per taxon and taxa distances can thus be established, and used to deconvolute species in a mixture of organisms, satisfying all requirements set forward in figure 2 to identify a field were the invention can be applied.
- a quantification of organisms could also be processed by using for instance a measure of the redundancy of each read, in a similar fashion as the use of XIC information in mass spectrometry.
- RNA-seq allows performing such identification and quantification of organisms present in mixtures taking RNA as starting material for next-generation sequencing of the nucleotide sequences.
Priority Applications (6)
| Application Number | Priority Date | Filing Date | Title |
|---|---|---|---|
| EP13306125.9A EP2835751A1 (fr) | 2013-08-06 | 2013-08-06 | Procédé de déconvolution d'informations moléculaires mixtes dans un échantillon complexe afin d'identifier des organismes |
| ES14777173T ES2943115T3 (es) | 2013-08-06 | 2014-07-30 | Procedimiento de deconvolución de información molecular mixta en una muestra compleja para identificar uno o más organismos |
| EP14777173.7A EP3030997B1 (fr) | 2013-08-06 | 2014-07-30 | Procédé de déconvolution d'informations moléculaires mixtes dans un échantillon complexe afin d'identifier des organismes |
| US14/910,425 US11177017B2 (en) | 2013-08-06 | 2014-07-30 | Method of deconvolution of mixed molecular information in a complex sample to identify organism(s) |
| CA2920595A CA2920595C (fr) | 2013-08-06 | 2014-07-30 | Procede de deconvolution d'informations moleculaires mixtes dans un echantillon complexe afin d'identifier un ou plusieurs organismes |
| PCT/IB2014/063560 WO2015019245A1 (fr) | 2013-08-06 | 2014-07-30 | Procédé de déconvolution d'informations moléculaires mixtes dans un échantillon complexe afin d'identifier un ou plusieurs organismes |
Applications Claiming Priority (1)
| Application Number | Priority Date | Filing Date | Title |
|---|---|---|---|
| EP13306125.9A EP2835751A1 (fr) | 2013-08-06 | 2013-08-06 | Procédé de déconvolution d'informations moléculaires mixtes dans un échantillon complexe afin d'identifier des organismes |
Publications (1)
| Publication Number | Publication Date |
|---|---|
| EP2835751A1 true EP2835751A1 (fr) | 2015-02-11 |
Family
ID=49123806
Family Applications (2)
| Application Number | Title | Priority Date | Filing Date |
|---|---|---|---|
| EP13306125.9A Withdrawn EP2835751A1 (fr) | 2013-08-06 | 2013-08-06 | Procédé de déconvolution d'informations moléculaires mixtes dans un échantillon complexe afin d'identifier des organismes |
| EP14777173.7A Active EP3030997B1 (fr) | 2013-08-06 | 2014-07-30 | Procédé de déconvolution d'informations moléculaires mixtes dans un échantillon complexe afin d'identifier des organismes |
Family Applications After (1)
| Application Number | Title | Priority Date | Filing Date |
|---|---|---|---|
| EP14777173.7A Active EP3030997B1 (fr) | 2013-08-06 | 2014-07-30 | Procédé de déconvolution d'informations moléculaires mixtes dans un échantillon complexe afin d'identifier des organismes |
Country Status (5)
| Country | Link |
|---|---|
| US (1) | US11177017B2 (fr) |
| EP (2) | EP2835751A1 (fr) |
| CA (1) | CA2920595C (fr) |
| ES (1) | ES2943115T3 (fr) |
| WO (1) | WO2015019245A1 (fr) |
Cited By (1)
| Publication number | Priority date | Publication date | Assignee | Title |
|---|---|---|---|---|
| CN111164422A (zh) * | 2017-08-07 | 2020-05-15 | 新加坡科技研究局 | 从液相色谱-质谱(lc-ms)数据中快速分析和鉴定脂质 |
Families Citing this family (1)
| Publication number | Priority date | Publication date | Assignee | Title |
|---|---|---|---|---|
| CN116630447B (zh) * | 2023-07-24 | 2023-10-20 | 成都海风锐智科技有限责任公司 | 一种基于图像处理的天气预测方法 |
Citations (2)
| Publication number | Priority date | Publication date | Assignee | Title |
|---|---|---|---|---|
| FR1354692A (fr) | 1963-04-29 | 1964-03-06 | Hitachi Ltd | Système de ralentissement pour véhicules automobiles |
| US8224581B1 (en) * | 2009-06-18 | 2012-07-17 | The United States Of America As Represented By The Secretary Of The Army | Methods for detection and identification of cell type |
Family Cites Families (2)
| Publication number | Priority date | Publication date | Assignee | Title |
|---|---|---|---|---|
| US6738502B1 (en) * | 1999-06-04 | 2004-05-18 | Kairos Scientific, Inc. | Multispectral taxonomic identification |
| WO2014138119A2 (fr) * | 2013-03-04 | 2014-09-12 | Fry Laboratories, LLC | Procédé et trousse pour la caractérisation de micro-organismes |
-
2013
- 2013-08-06 EP EP13306125.9A patent/EP2835751A1/fr not_active Withdrawn
-
2014
- 2014-07-30 WO PCT/IB2014/063560 patent/WO2015019245A1/fr active Application Filing
- 2014-07-30 EP EP14777173.7A patent/EP3030997B1/fr active Active
- 2014-07-30 ES ES14777173T patent/ES2943115T3/es active Active
- 2014-07-30 US US14/910,425 patent/US11177017B2/en active Active
- 2014-07-30 CA CA2920595A patent/CA2920595C/fr active Active
Patent Citations (3)
| Publication number | Priority date | Publication date | Assignee | Title |
|---|---|---|---|---|
| FR1354692A (fr) | 1963-04-29 | 1964-03-06 | Hitachi Ltd | Système de ralentissement pour véhicules automobiles |
| US8224581B1 (en) * | 2009-06-18 | 2012-07-17 | The United States Of America As Represented By The Secretary Of The Army | Methods for detection and identification of cell type |
| US8412464B1 (en) | 2009-06-18 | 2013-04-02 | The United States Of America As Represented By The Secretary Of The Army | Methods for detection and identification of cell type |
Non-Patent Citations (10)
| Title |
|---|
| "Mass Spectrometry: A Textbook", 2011, SPRINGER |
| CICCARELLI, F. D.; DOERKS, T.; VON MERING, C.; CREEVEY, C. J.; SNEL, B.; BORK, P.: "Toward automatic reconstruction of a highly resolved tree of life", SCIENCE, vol. 311, no. 5765, 2006, pages 1283 - 1287 |
| DWORZANSKI, J. P.; DESHPANDE, S. V.; CHEN, R.; JABBOUR, R. E.; SNYDER, A. P.; WICK, C. H.; LI, L.: "Mass spectrometry-based proteomics combined with bioinformatic tools for bacterial classification", JOURNAL OF PROTEOME RESEARCH, vol. 5, no. 1, 2006, pages 76 - 87 |
| DWORZANSKI, J. P.; DICKINSON, D. N.; DESHPANDE, S. V.; SNYDER, A. P.; ECKENRODE, B. A.: "Discrimination and Phylogenomic Classification of Bacillus anthracis-cereus-thuringiensis Strains Based on LC-MS/MS Analysis of Whole Cell Protein Digests", ANALYTICAL CHEMISTRY, vol. 82, no. 1, 2010, pages 145 - 155 |
| DWORZANSKI, J. P.; SNYDER, A. P.; CHEN, R.; ZHANG, H. Y.; WISHART, D.; LI, L.: "Identification of bacteria using tandem mass spectrometry combined with a proteome database and statistical scoring", ANALYTICAL CHEMISTRY, vol. 76, no. 8, 2004, pages 2355 - 2366 |
| JABBOUR, R. E.; DESHPANDE, S. V.; WADE, M. M.; STANFORD, M. F.; WICK, C. H.; ZULICH, A. W.; SKOWRONSKI, E. W.; SNYDER, A. P.: "Double- Blind Characterization of Non-Genome-Sequenced Bacteria by Mass Spectrometry- Based Proteomics", APPLIED AND ENVIRONMENTAL MICROBIOLOGY, vol. 76, no. 11, 2010, pages 3637 - 3644 |
| JACEK P. DWORZANSKI ET AL: "Identification of Bacteria Using Tandem Mass Spectrometry Combined with a Proteome Database and Statistical Scoring", ANALYTICAL CHEMISTRY, vol. 76, no. 8, 1 April 2004 (2004-04-01), pages 2355 - 2366, XP055012238, ISSN: 0003-2700, DOI: 10.1021/ac0349781 * |
| JACEK P. DWORZANSKI ET AL: "Mass Spectrometry-Based Proteomics Combined with Bioinformatic Tools for Bacterial Classification", JOURNAL OF PROTEOME RESEARCH, vol. 5, no. 1, 1 January 2006 (2006-01-01), pages 76 - 87, XP055012223, ISSN: 1535-3893, DOI: 10.1021/pr050294t * |
| P. RIBECA ET AL: "Computational challenges of sequence classification in microbiomic data", BRIEFINGS IN BIOINFORMATICS, vol. 12, no. 6, 1 November 2011 (2011-11-01), pages 614 - 625, XP055104588, ISSN: 1467-5463, DOI: 10.1093/bib/bbr019 * |
| SHOKRALLA, S.; SPALL, J. L.; GIBSON, J. F.; HAJIBABAEI, M.: "Next-generation sequencing technologies for environmental DNA research", MOLECULAR ECOLOGY, vol. 21, no. 8, 2012, pages 1794 - 1805 |
Cited By (2)
| Publication number | Priority date | Publication date | Assignee | Title |
|---|---|---|---|---|
| CN111164422A (zh) * | 2017-08-07 | 2020-05-15 | 新加坡科技研究局 | 从液相色谱-质谱(lc-ms)数据中快速分析和鉴定脂质 |
| CN111164422B (zh) * | 2017-08-07 | 2023-05-02 | 新加坡科技研究局 | 从液相色谱-质谱(lc-ms)数据中快速分析和鉴定脂质 |
Also Published As
| Publication number | Publication date |
|---|---|
| CA2920595C (fr) | 2022-12-06 |
| EP3030997B1 (fr) | 2023-03-29 |
| WO2015019245A1 (fr) | 2015-02-12 |
| US20160300011A1 (en) | 2016-10-13 |
| CA2920595A1 (fr) | 2015-02-12 |
| US11177017B2 (en) | 2021-11-16 |
| ES2943115T3 (es) | 2023-06-09 |
| EP3030997A1 (fr) | 2016-06-15 |
Similar Documents
| Publication | Publication Date | Title |
|---|---|---|
| Tang et al. | ANPELA: analysis and performance assessment of the label-free quantification workflow for metaproteomic studies | |
| Zou et al. | Sequence clustering in bioinformatics: an empirical study | |
| Nesvizhskii | A survey of computational methods and error rate estimation procedures for peptide and protein identification in shotgun proteomics | |
| Nie et al. | Correlation of mRNA expression and protein abundance affected by multiple sequence features related to translational efficiency in Desulfovibrio vulgaris: a quantitative analysis | |
| Nesvizhskii | Protein identification by tandem mass spectrometry and sequence database searching | |
| Elias et al. | Comparative evaluation of mass spectrometry platforms used in large-scale proteomics investigations | |
| Nesvizhskii et al. | Analysis and validation of proteomic data generated by tandem mass spectrometry | |
| Mahe et al. | Automatic identification of mixed bacterial species fingerprints in a MALDI-TOF mass-spectrum | |
| Nedelkov et al. | Using the global proteome machine for protein identification | |
| JP6238069B2 (ja) | 微生物の識別方法 | |
| Pible et al. | Estimating relative biomasses of organisms in microbiota using “phylopeptidomics” | |
| Kleikamp et al. | Database-independent de novo metaproteomics of complex microbial communities | |
| Saheb Kashaf et al. | Recovering prokaryotic genomes from host-associated, short-read shotgun metagenomic sequencing data | |
| Higdon et al. | A predictive model for identifying proteins by a single peptide match | |
| Corvelo et al. | taxMaps: comprehensive and highly accurate taxonomic classification of short-read data in reasonable time | |
| Wang et al. | A novel peptidomic approach to strain typing of clinical Acinetobacter baumannii isolates using mass spectrometry | |
| Alves et al. | Rapid classification and identification of multiple microorganisms with accurate statistical significance via high-resolution tandem mass spectrometry | |
| Lin et al. | Benchmarking differential expression, imputation and quantification methods for proteomics data | |
| Potgieter et al. | MetaNovo: a probabilistic approach to peptide and polymorphism discovery in complex metaproteomic datasets | |
| Jiménez et al. | Searching sequence databases over the internet: protein identification using MS‐Fit | |
| Phillips et al. | Increased time sampling in an evolve‐and‐resequence experiment with outcrossing Saccharomyces cerevisiae reveals multiple paths of adaptive change | |
| Diao et al. | Validation of a metagenomic next-generation sequencing assay for lower respiratory pathogen detection | |
| EP3030997B1 (fr) | Procédé de déconvolution d'informations moléculaires mixtes dans un échantillon complexe afin d'identifier des organismes | |
| Shah et al. | Embracing ambiguity in the taxonomic classification of microbiome sequencing data | |
| Torres-García et al. | Integrative analysis of transcriptomic and proteomic data of Desulfovibrio vulgaris: a non-linear model to predict abundance of undetected proteins |
Legal Events
| Date | Code | Title | Description |
|---|---|---|---|
| PUAI | Public reference made under article 153(3) epc to a published international application that has entered the european phase |
Free format text: ORIGINAL CODE: 0009012 |
|
| 17P | Request for examination filed |
Effective date: 20130806 |
|
| AK | Designated contracting states |
Kind code of ref document: A1 Designated state(s): AL AT BE BG CH CY CZ DE DK EE ES FI FR GB GR HR HU IE IS IT LI LT LU LV MC MK MT NL NO PL PT RO RS SE SI SK SM TR |
|
| AX | Request for extension of the european patent |
Extension state: BA ME |
|
| R17P | Request for examination filed (corrected) |
Effective date: 20150811 |
|
| RBV | Designated contracting states (corrected) |
Designated state(s): AL AT BE BG CH CY CZ DE DK EE ES FI FR GB GR HR HU IE IS IT LI LT LU LV MC MK MT NL NO PL PT RO RS SE SI SK SM TR |
|
| STAA | Information on the status of an ep patent application or granted ep patent |
Free format text: STATUS: THE APPLICATION IS DEEMED TO BE WITHDRAWN |
|
| 18D | Application deemed to be withdrawn |
Effective date: 20150812 |