EP2803317B1 - Mri method for measuring diffusion parameters of tracer in living organ tissue space and extracellular space - Google Patents
Mri method for measuring diffusion parameters of tracer in living organ tissue space and extracellular space Download PDFInfo
- Publication number
- EP2803317B1 EP2803317B1 EP12864813.6A EP12864813A EP2803317B1 EP 2803317 B1 EP2803317 B1 EP 2803317B1 EP 12864813 A EP12864813 A EP 12864813A EP 2803317 B1 EP2803317 B1 EP 2803317B1
- Authority
- EP
- European Patent Office
- Prior art keywords
- tracer
- diffusion
- images
- magnetic resonance
- equation
- Prior art date
- Legal status (The legal status is an assumption and is not a legal conclusion. Google has not performed a legal analysis and makes no representation as to the accuracy of the status listed.)
- Active
Links
- 0 C(C1NC1)C1C*C1 Chemical compound C(C1NC1)C1C*C1 0.000 description 3
Images



Classifications
-
- A—HUMAN NECESSITIES
- A61—MEDICAL OR VETERINARY SCIENCE; HYGIENE
- A61B—DIAGNOSIS; SURGERY; IDENTIFICATION
- A61B5/00—Measuring for diagnostic purposes; Identification of persons
- A61B5/05—Detecting, measuring or recording for diagnosis by means of electric currents or magnetic fields; Measuring using microwaves or radio waves
- A61B5/055—Detecting, measuring or recording for diagnosis by means of electric currents or magnetic fields; Measuring using microwaves or radio waves involving electronic [EMR] or nuclear [NMR] magnetic resonance, e.g. magnetic resonance imaging
-
- G—PHYSICS
- G01—MEASURING; TESTING
- G01R—MEASURING ELECTRIC VARIABLES; MEASURING MAGNETIC VARIABLES
- G01R33/00—Arrangements or instruments for measuring magnetic variables
- G01R33/20—Arrangements or instruments for measuring magnetic variables involving magnetic resonance
- G01R33/44—Arrangements or instruments for measuring magnetic variables involving magnetic resonance using nuclear magnetic resonance [NMR]
- G01R33/48—NMR imaging systems
- G01R33/54—Signal processing systems, e.g. using pulse sequences ; Generation or control of pulse sequences; Operator console
- G01R33/56—Image enhancement or correction, e.g. subtraction or averaging techniques, e.g. improvement of signal-to-noise ratio and resolution
- G01R33/5601—Image enhancement or correction, e.g. subtraction or averaging techniques, e.g. improvement of signal-to-noise ratio and resolution involving use of a contrast agent for contrast manipulation, e.g. a paramagnetic, super-paramagnetic, ferromagnetic or hyperpolarised contrast agent
-
- G—PHYSICS
- G01—MEASURING; TESTING
- G01R—MEASURING ELECTRIC VARIABLES; MEASURING MAGNETIC VARIABLES
- G01R33/00—Arrangements or instruments for measuring magnetic variables
- G01R33/20—Arrangements or instruments for measuring magnetic variables involving magnetic resonance
- G01R33/44—Arrangements or instruments for measuring magnetic variables involving magnetic resonance using nuclear magnetic resonance [NMR]
- G01R33/48—NMR imaging systems
- G01R33/54—Signal processing systems, e.g. using pulse sequences ; Generation or control of pulse sequences; Operator console
- G01R33/56—Image enhancement or correction, e.g. subtraction or averaging techniques, e.g. improvement of signal-to-noise ratio and resolution
- G01R33/563—Image enhancement or correction, e.g. subtraction or averaging techniques, e.g. improvement of signal-to-noise ratio and resolution of moving material, e.g. flow contrast angiography
- G01R33/56308—Characterization of motion or flow; Dynamic imaging
-
- G—PHYSICS
- G01—MEASURING; TESTING
- G01R—MEASURING ELECTRIC VARIABLES; MEASURING MAGNETIC VARIABLES
- G01R33/00—Arrangements or instruments for measuring magnetic variables
- G01R33/20—Arrangements or instruments for measuring magnetic variables involving magnetic resonance
- G01R33/44—Arrangements or instruments for measuring magnetic variables involving magnetic resonance using nuclear magnetic resonance [NMR]
- G01R33/48—NMR imaging systems
- G01R33/54—Signal processing systems, e.g. using pulse sequences ; Generation or control of pulse sequences; Operator console
- G01R33/56—Image enhancement or correction, e.g. subtraction or averaging techniques, e.g. improvement of signal-to-noise ratio and resolution
- G01R33/563—Image enhancement or correction, e.g. subtraction or averaging techniques, e.g. improvement of signal-to-noise ratio and resolution of moving material, e.g. flow contrast angiography
- G01R33/5635—Angiography, e.g. contrast-enhanced angiography [CE-MRA] or time-of-flight angiography [TOF-MRA]
-
- G—PHYSICS
- G01—MEASURING; TESTING
- G01R—MEASURING ELECTRIC VARIABLES; MEASURING MAGNETIC VARIABLES
- G01R33/00—Arrangements or instruments for measuring magnetic variables
- G01R33/20—Arrangements or instruments for measuring magnetic variables involving magnetic resonance
- G01R33/44—Arrangements or instruments for measuring magnetic variables involving magnetic resonance using nuclear magnetic resonance [NMR]
- G01R33/48—NMR imaging systems
- G01R33/54—Signal processing systems, e.g. using pulse sequences ; Generation or control of pulse sequences; Operator console
- G01R33/56—Image enhancement or correction, e.g. subtraction or averaging techniques, e.g. improvement of signal-to-noise ratio and resolution
- G01R33/563—Image enhancement or correction, e.g. subtraction or averaging techniques, e.g. improvement of signal-to-noise ratio and resolution of moving material, e.g. flow contrast angiography
- G01R33/56366—Perfusion imaging
-
- G—PHYSICS
- G01—MEASURING; TESTING
- G01R—MEASURING ELECTRIC VARIABLES; MEASURING MAGNETIC VARIABLES
- G01R33/00—Arrangements or instruments for measuring magnetic variables
- G01R33/20—Arrangements or instruments for measuring magnetic variables involving magnetic resonance
- G01R33/44—Arrangements or instruments for measuring magnetic variables involving magnetic resonance using nuclear magnetic resonance [NMR]
- G01R33/48—NMR imaging systems
- G01R33/58—Calibration of imaging systems, e.g. using test probes, Phantoms; Calibration objects or fiducial markers such as active or passive RF coils surrounding an MR active material
Definitions
- the invention relates to a method for computing the parameter of a tracer distributing in the living organism and diffusing in the ECS (Brain Extracellular Space), especially to a method for analyzing and computing the diffusion parameters of the tracer in the living organism with the aid of the MRI image.
- the radioactive tracer method provides the possibility of in-vivo study and visual measurement for drug distribution and clearance process.
- iodine and the other tracers depend on the X-ray, CT and other imaging equipment.
- the X-ray, CT and the radioactive isotope can generate ionizing radiation and ionization damage which are harmful to the subject.
- the MRI (Magnetic Resonance Imaging) technique has become a widely-used imaging technique. Using MRI to observe the anatomical structure and physiological function of human body or animal has the advantages of in-vivo, non-invasive and real-time imaging.
- the MRI tracer further develops the application of MRI technique.
- T1 positive tracer represented by Gadolinium-diethylenetriaminepentaacetic acid (Gd-DTPA)
- T2 negative tracer represented by iron nanoparticle
- the research also shows that the tracer in the living organism are difficult to be observed and quantitively analyzed owing to the image deformation and signal loss caused by the interference of the iron nanoparticle on the gradient field.
- the DWI (Diffusion Weighted Imaging) has also been used in measurement of the living organism.
- the DWI is a MRI technique used for measuring ADC (Apparent diffusion Coefficient) of the water and other molecules in body and FA (Anisotropy Fraction) of the tissue.
- ADC Current diffusion Coefficient
- FA Anaisotropy Fraction
- This technique is based on the principle of molecular diffusion change causing MRI image signal change in tissue.
- the MRI signal intensity is low where diffusion process along said direction inside the tissue is obvious, and vise versa.
- the ADC values can be calculated via different MRI signal intensities caused by different diffusion sensitive gradients.
- the parameters of diffusion tensor can be obtained, such as the FA, which is ratio of the anisotropy to the whole diffusion and reflects the movement intensity of the molecules on the main vector shaft of the diffusion.
- the Chinese patent application CN2010102086244 relates to a method for measuring physiological parameters of ISF and ECS.
- the quantitative analysis of the spatial and temporal distribution of the tracer in the brain ECS is not involved in this patent.
- WO 2011/069283 A1 concerns a method for measuring physiological parameters in cerebral interstitial fluid (ISF) and cerebral extracellular space (ECS). It is a method for measuring physiological parameters such as diffusion, flow and elimination etc. of materials among the cerebral ISF within the cerebral ECS.
- the method comprises the steps of: placing the subject's brain in the magnetic resonance imaging device, administering a magnetic resonance imaging contrast agent into the subject's cerebral ISF, afterwards measuring the signal intensity of the contrast agent in MRI image, and according to the signal intensity, determining the distribution of the contrast agent at the corresponding part, and the concentration and concentration change rate of the contrast agent in each brain region.
- the present invention provides a method for computing the parameter of tracer distributing in the living organism and diffusing in the ECS according to claim 1. Further aspects of the present invention are defined in the dependent claims.
- the present invention obtains the diffusion feature of the tracer in the living organism via the MRI signal change caused by the diffusing of the tracer in the living organism so that the distribution change and clearance process of the tracer caused by the diffusion in the living organism can be directly reflected.
- the present invention segments and registers the acquired three-dimensional image with the aid of MRI tracing technique, then uses anisotropic diffusion equation to finally get the spatial structure parameter of the living organism and the diffusion and clearance parameter of the tracer therein, as well as provides the pharmacokinetic parameter including the volume distribution of the molecule the and the overall clearance.
- Certain exemplary embodiments can provide a method, in which the tracer is Gd-DTPA and the living organism is brain ECS.
- the present invention provides a method for computing the parameter of tracer distributing in the living organism and diffusing in the ECS, comprising: (1)measuring magnetic resonance signal increment ( ⁇ SI) corresponding to the different tracer concentrations (C) in agarose; (2)according to the value measured in the step (1), determining a upper limit of the tracer concentration when having a linear relation with the magnetic resonance signal increment ( ⁇ SI) and determining the linear relation between the magnetic resonance signal increment ( ⁇ SI) and the tracer concentration (C); (3) obtaining magnetic resonance images from different times of the living organism, who has been injected the tracer with different concentrations of tracer at injection sites (Q);(4) orderly registering the regions of interest from the obtained magnetic resonance images; and (5) fitting the parameter of the tracer distributing in the living organism according to the registered images, which comprises: (5.1) determining the diffusion equation of the tracer, (5.2) conversing the equation determined in the step (5.1) according to the relation between the tracer concentration and the magnetic resonance signal increment, (5.3) solving the equation acquired in
- the diffusion equation of the tracer in the standard coordinates obtained in the step (5.1) is: wherein, D is the free diffusion coefficient of the tracer, ⁇ (x, y, z) is the tortuosity of a point(x, y, z) in the living organism, C is the tracer concentration which is obtained via the magnetic resonance signal increment ( ⁇ SI), t is the time interval between the tracer injection and the magnetic resonance image acquisition, a is the ratio of the volume of brain ECS to all volume of the living organism, k' is the clearance rate of the tracer in the living organism which is a constant.
- ⁇ C ⁇ t D ⁇ 2 2 ⁇ 2 C ⁇ x 2 + D ⁇ y 2 + ⁇ 2 C ⁇ y 2 + D ⁇ z 2 ⁇ 2 C ⁇ z 2 + Q ⁇ ⁇ k ′ C
- D is the free diffusion coefficient of the tracer
- ⁇ x , ⁇ ⁇ and ⁇ z are the tortuosities of the living organism along the axial X, Y and Z respectively
- C is the tracer concentration which is obtained via the magnetic resonance signal increment ( ⁇ SI)
- t is the time interval between the tracer injection and the magnetic resonance image acquisition
- a is the ratio of volume of the brain ECS to all volume of the living organism
- k' is the clearance rate of the tracer in the living organism which is a constant.
- ⁇ ⁇ SI ⁇ t D ⁇ x y z 2 ⁇ 2 ⁇ SI ⁇ r 2 + Q ⁇ k ⁇ k ′ ⁇ SI + k ′ b , wherein, k and b are constants, ⁇ SI is the magnetic resonance signal increment, d is the real space distance corresponding to a single pixel.
- ⁇ SI t + ⁇ t ⁇ ⁇ SI t D ⁇ x y z ⁇ 2 ⁇ SI + Q ⁇ k ⁇ k ′ ⁇ SI t + k ′ b ,
- ⁇ t is the sampling time in unit
- ⁇ (x, y, z) is the tortuosity of a point(x, y, z) in space
- ⁇ i is the space distance of the sample in any direction (axis i).
- Certain exemplary embodiments can provide a method, in which the tracer is Gd-DTPA, the diffusion parameters of the living organisms comprises the effective diffusion efficient D*, tortuosity ⁇ and clearance rate k' of Gd-DTPA in the ECS.
- the diffusion parameters reflecting the structure and physical feature of the tissue cell, as well as the distribution and clearance process of the tracer in brain are both can be obtained in living organism.
- the present method can calculate the micro parameter such as the effective diffusion efficient D*, the tortuosity ⁇ and the clearance rate k' as well as the macro parameter such as distribution volume (Vd) and distribution volume fraction, so that can design the disease treatment protocol and be helpful to the clinical medication.
- valuable data for analysis can be acquired by calculating the diffusion and clearance data of Gd-DTPA in the brain ECS.
- Gadolinium-diethylenetriaminepentaacetic acid which is Mag-nevist solution produced by Bayer Schering Pharma AG was used as the tracer.
- the corresponding MRI signal intensities of the tracer with the actual concentration in agarose gel and rat brain were measured.
- Male Sprague Dawley rats weighing 250-300g were used in the experiment.
- the living organism used for measurement is the rat brain.
- a Siemens Magnetom Trio 3.0 T MRI system was used to obtain the rat brain images.
- FIG. 1 shows MRI images of with different Gd-DTPA concentrations in MRI device, wherein shows MRI images of the agarose gel obtained via an eight channels wrist coil after injecting different concentrations of Gd-DTPA ranging from 0-100mM at 37°C.
- a 3D MP-RAGE Magnetic Networkization Prepared Rapid Gradient Echo
- FIG. 2 shows the relation between the Gd-DTPA concentration (C) and the MRI signal intensity increment ( ⁇ SI) when the Gd-DTPA concentration (C) ranging from 0-100mM.
- the result shows that: when the concentration ranging from 0-100mM, as concentration of Gd-DTPA (C) increases, the MRI signal intensity increment ( ⁇ SI) increases first then decreases. The curve is bell-shaped and reaches its peak at 4mM then gradually declining. The artifact appeared at 50mM. The value of ⁇ SI turns into negative when the Gd-DTPA concentration becomes 100mM, indicating that the MRI signal intensity has been lower than that of pure water while the Gd-DTPA concentration becomes 100mM.
- FIG. 3 shows the relation between the Gd-DTPA concentration (C) and the MRI signal intensity increment ( ⁇ SI) when the Gd-DTPA is ranging from 0-4mM.
- the Gd-DTPA concentration (C) ranging from 0-1mM
- the MRI signal intensity increment ( ⁇ SI) rapidly linear-increases with the rise of the concentration (C) and reaches its peak at 4mM.
- the upper limit of the tracer concentration is 4mM.
- the position of the injection site Q and the depth of Gd-DTPA microinjection of the rat brains were determined by three-dimensional reconstructed image basing on the brain stereotaxic atlas.
- the specific method was: preparing skin, shaving between the eyes of rats about 4cm skin backwards along the midline of the skull and exposing the skull plate; then fixing the rats in a stereotactic apparatus and administrating the drug at the injection site Q using magnetic drug delivery system; rubbing off the skull plate at the entry point with an electric drill, setting a micro syringe into the brain and manually administrating 2 ⁇ LGd-DTPA solution with the concentration of 10mM into the target location in three injection with the interval of 5min.
- the syringe was left for 10 min in the brain when drug injection was finished before the micro syringe was exited and the skin was sutured. Scanned images were taken in 15min, 30min, 1h, 2h, 3h, 4h, 6h, 9h and 12h and imaging parameters were set as the mentioned above.
- FIG. 6 schematically shows the method for processing the above acquired time-series MRI images.
- the bias field is first to be correct to eliminate the signal strength deviation among the sequence of images; the image registration technique is then used to unify the position of the increment images with the referenced images; the diffusion model is finally solved via the distribution of the tracer concentration from different times obtained by the analysis of the signal strength increment.
- the time series are aligned with the same coordinate system via image registration techniques.
- the grayscale of the MRI image are uneven because of the impact of bias field due to the imperfections of the MRI procedure, i.e. the grayscale will smoothly change in the imaging area of a same even tissue. If there is no correction of the bias field, the subtracted difference of grayscale does not reflect the tracer concentration even though two images are aligned with the reference position because the grayscale of pixel changes according to the different imaging position in bias field.
- the accuracy validation is assured and the diffusion model is solved via registration and uneven grayscale correction of the images having character of MR time series.
- the tracer diffusion process is embodied in MR time series image.
- the grayscale distribution of images from different times varies, which makes difficulty to the similarity measurement.
- the rigid transformation and the elastic deformation may both exist in image, which affect the time-series MR image registration, e.g. as shown in FIG. 7 , in the imaging process, the significant deformation in the most tissue was caused by the movement of rat, but the rigid transformation only exist in the brain.
- the image registration method in combination with the ROI (region of interest) segmentation is used and the mutual information is selected as the similarity criterion.
- FIG. 8 exemplary shows the framework of the algorithm.
- the mutual information is a criterion of similarity basing on information theory and is widely used in registration of the multi and the single mode images.
- the mutual information is defined as the difference between edge entropy and joint entropy of the two images: wherein, H( f ), H(g) and H( f ,g) are the edge entropy and joint entropy of two images; N and M are the number of samples of two grayscale value in the two images; p(i), p(j) and p (i, j) are the probability of grayscale value appears.
- the mutual information is a kind of a regional grayscale statistical measurement and does not require the grayscale correspondence between points of two images.
- the mutual information has more advantages in similarity measurement comparing with other methods especially for MR time-series images due to the grayscale inhomogeneity and the grayscale change caused by the tracer.
- the calculation of the similarity measurement of the mutual information is limit within the region of interest (such as the brain of rats), so that only the rigid transformation is considered in the registration process.
- the interactive image segmentation method basing on the graph theory is used to solve the problem of the lost of the part edge of the target, which is caused by noise disturbance and the lack of grayscale contrast.
- the method supports the rapid amendment basing on the initial segmentation result. Therefore, it is suitable for the extraction of region of interest under complicated situation of MR time series images to improve the successful rate of image registration.
- the image correction method is: firstly correcting the bias field for each set of image, then unifying the signal intensity among sequences.
- the bias field can be modified by estimating the grayscale bias field B, so that the real MR signal can be recovered using the formula (2).
- the bias field correction can improve the consistency of the signal intensity distribution within a single set of images.
- the consistence of grayscale distribution of the same tissue among the series may be reduced after correction because only intensity information within a single set of images is taken for consideration. This problem is more obvious especially when the signal intensity drifts. Therefore, in an exemplary embodiment of the present invention, a correction method using grayscale value statistical characteristic to uniform the signal intensity is further included.
- the ROI can be determined via human interaction or automatic selected by region clustering and the corresponding methods of region matching based on the Mean-Shift algorithm.
- the corrected image is obtained.
- the tracer concentration in a particular region in the living organism can be obtained via the MRI signal intensity increment.
- the present invention can establish a diffusion model of the tracer in the living organism and work out the parameter reflecting the feature of the living organism.
- the diffusion model basing on the equation (5) is alterable in each direction so that the irregular diffusion surface is available when the tortuosity in each direction is calculated.
- ⁇ SI ⁇ PQ 2 ⁇ Dt ⁇ ⁇ ⁇ + ⁇ ⁇ ⁇ e ⁇ ⁇ PQ 2 r ⁇ ⁇ 2 4 Dt ⁇ k ′ t d ⁇ + Qk ⁇ k ′ + b 1 ⁇ e ⁇ k ′ t
- the diffusion coefficient the loss ratio k' and the part volume ratio ⁇ along the PQ direction can be fit via the acquisition of all pixel values of all the lines PQ from different times.
- equation (10) fully considers the space variability of the tortuosity, the solution of equation (8) is difficult to get.
- the equation (8) is a partial differential formula with variable coefficients and usually has no analytic solution.
- ⁇ t is the sampling time in each unit
- ⁇ i represents the space distance of sampling along the axis i. It depends on the space resolution of the image along the axis i.
- the discrete equation (11) can be equivalent to the continuity equation (10).
- the real sampling rate is low, so the obtained space tortuosity ⁇ , the loss ratio k' and the part volume rate ⁇ are not strictly the values but the values of "average" concept.
- the space tortuosity ⁇ , the loss rate k' and the part volume ratio a along the three axial are to be solved using the method of least squares.
- equation (19) The undetermined parameters of equation (19) are almost 2 times larger than that of the isotropic discrete equations.
- the equation (19) has a higher precision, i.e. the objective function equation (12) is smaller so that the real diffusion concentration can be better predicted.
- the corresponding position parameters and the corresponding time parameters should be imported into the equation for fitting to solve the flow parameters of brain interstitial fluid.
- the flow parameter of brain interstitial fluid can be automatically fit.
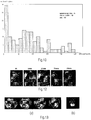
- FIG. 11 shows the images scanned in different time of SD rat after anesthesia in magnetic resonance imaging wrist coil, after injection of Gd-DTPA (2 ⁇ L,10mM) by microinjection via different injection site.
- the injection site located in (a)the caudate nucleus, (b) located in the substantia nigra striatum, (c) located in the thalamus, (d) located in the occipital cortex and (e) located in the subcortical white matter.
- the diffusion parameters in different regions in the brains can be obtained.
- Table 1 shows anisotropy of the diffusion parameters for the caudate nucleus of the rats.
- Table 3 shows the distribution volume changing with time of the tracer Gd-DTPA after injection through caudate nucleus in the brain.
- Table1 diffusion parameters in different regions of SD rats' brain Brain area D ⁇ ( ⁇ 10 -4 /mm 2 ⁇ s -1 ) k' ( ⁇ 10-4 /mM ⁇ L -1 ⁇ s -1 ) ⁇ caudate putamen (CPu) 3.38 0.76 1.24 substantianigra (SN) 2.06 8.28 1.59 thalamus (T) 3.28 1.44 1.26 occipital cortex (Oc) 3.25 1.55 1.26 medial prefrontal cortex (mPFC) 2.31 2.38 1.50
- Table 2 the anisotropic diffusion parameters of rats' caudate nucleus regions parameters D ⁇ ( ⁇ 10 -4 /mm 2 ⁇ s -1 ) k' ( ⁇ 10 -5 /mM ⁇ L -1 ⁇ s -1 ) direction -X 3.57 ⁇ 0.88 7.14 ⁇ 3.06 X 3.73 ⁇ 1.10 7.67 ⁇ 3.96 -Y 3.05 ⁇ 0.93 7.59 ⁇ 4.04 Z 2.54 ⁇ 1.27 7.74 ⁇
- Calculation method about distribution volume (Vd), distribution volume fraction and general clearance of the tracer in the living organism is as follows: reconstructing the registered and subtracted images into axial images; quantitative measuring the signal increment region in image of each layer via the Matlab program as shown in figures; and recording the number of pixels in the increment region and the signal intensity value of each pixel.
- Vd distribution volumes
- Gd-DTPA tracer
- the distribution volume fraction of Gd-DTPA in the brain hemisphere ECS can be obtained by dividing the Vd from different times by the volume of the brain hemisphere of the rat.
- the macro clearance is defined as the total signal intensity at a previous time subtracting the total signal intensity at a later time, then dividing the initial total signal intensity.
- FIG. 9 shows using Matlab software to measure the un-increment region subtracting increment region.
- the selected region in the FIG. is obtained by subtracting the image before increment from the increment image.
- the increment region is shown as the "bright region” and the other un-increment region is shown as the "dark region”.
- FIG. 10 shows the graphical results of the increment region in FIG. 9 , wherein the abscissa is the signal intensity and the ordinate is the number of pixels.
- Using the bulleted method above can measure the Vd, the distribution volume fraction and the macro clearance of the caudate nucleus.
- Table 4 shows the macro clearances from different times after the Gd-DTPA injection to the caudate nucleus of eight SD rats
- Table 4 the macro clearances from different times after the Gd-DTPA injection to the caudate nucleus of eight SD rats time(h) Macro clearance(/h) 1-2 0.23 2-3 0.12 3-4 0.19 4-6 0.11 6-9 0.06 9-12 0.08
- FIG. 12 shows the diffusion MRI images scanned in different time after injecting the Gd-DTPA into the skeletal muscle of the rats.
- the left high signal region adjacent to the femur is the Gd-DTPA's diffusion region after injection.
- Table 5 shows the diffusion parameters after Gd-DTPA injection via the skeletal muscle gap.
- Table 6 shows the time-varying changing rule of the distribution volume of the Gd-DTPA in the skeletal muscle gap of the rat.
- Table 7 shows the macro clearance of the Gd-DTPA in the skeletal muscle gap
- Table 5 the diffusion parameters of the Gd-DTPA in the skeletal muscle gap parameters D ⁇ ( ⁇ 10 -4 /mm 2 ⁇ s -1 ) k' ( ⁇ 10 -4 /mM ⁇ L -1 ⁇ s -1 ) direction -X 2.611 2.359 X 2.930 2.870 -Y 8.235 10.940 Z 9.537 7.817 -Z 7.154 5.083
- Table 6 the time-varying change rule of distribution volume of the Gd-DTPA in the skeletal muscle gap time(min) Vd(mm 3 ) 5 407 10 383 15 234 25 0
- Table 7 the macro clearance the Gd-DTPA in the skeletal muscle gap of the rat time(h)
- FIG. 13 shows the diffusion images of Gd-DTPA in the glioma model of the brain of the rat, wherein (a) the high signal areas of the T1WI are the diffusion areas of Gd-DTPA and the low signal areas are the gliomas locations, (b) the high signal area of the T2WI is the gliomas location.
- Table 8 shows the diffusion parameter of Gd-DTPA in the glioma brain of the rat.
- Table 8 the diffusion parameter of Gd-DTPA in the glioma brain of the rat parameters D ⁇ ( ⁇ 10 -4 /mm ⁇ s -1 ) k' ( ⁇ 10 -4 /mM ⁇ L -1 ⁇ s -1 ) direction -X 4.02 3.31 X 3.60 3.13 -Y 4.82 3.12 Z 4.61 3.15 -Z 5.63 3.05
- Table 9 the time-varying change rule of distribution volume of the Gd-DTPA in the glioma brain of the rat Time (h) Vd(mm 3 ) Distribution Volume Fraction (%) 0.25 466 4.85 0.5 651 6.78 1 720 7.50 2 503 5.24 3 0 0
- Table 10 the macro clearances of the Gd-DTPA in the glioma brain of the rat Time (h) Macro clearances (/h) 0.5-1 0.23 1-2 0.36 2-3 0.41
- the calculation method provided in the present invention can use the MRI scan image of the interested the living organism to accurately calculate the tracer distribution in the gap of the living organism and the diffusion parameter in the ECS, which is helpful to the research of diseases diagnosis and pharmacokinetics.
Landscapes
- Physics & Mathematics (AREA)
- Health & Medical Sciences (AREA)
- Nuclear Medicine, Radiotherapy & Molecular Imaging (AREA)
- High Energy & Nuclear Physics (AREA)
- Life Sciences & Earth Sciences (AREA)
- General Health & Medical Sciences (AREA)
- Radiology & Medical Imaging (AREA)
- Engineering & Computer Science (AREA)
- Condensed Matter Physics & Semiconductors (AREA)
- General Physics & Mathematics (AREA)
- Signal Processing (AREA)
- Vascular Medicine (AREA)
- Biophysics (AREA)
- Pathology (AREA)
- Biomedical Technology (AREA)
- Heart & Thoracic Surgery (AREA)
- Medical Informatics (AREA)
- Molecular Biology (AREA)
- Surgery (AREA)
- Animal Behavior & Ethology (AREA)
- Public Health (AREA)
- Veterinary Medicine (AREA)
- Magnetic Resonance Imaging Apparatus (AREA)
Description
- The invention relates to a method for computing the parameter of a tracer distributing in the living organism and diffusing in the ECS (Brain Extracellular Space), especially to a method for analyzing and computing the diffusion parameters of the tracer in the living organism with the aid of the MRI image.
- In the pharmacokinetics study, in order to evaluate the drug diffusion and predict its effect in target, it needs to execute and dissect animals and get their tissue samples or collect venous blood from healthy volunteers so as to measure the drug concentrations of the tissue and the blood from different time points after administration. Using this traditional research method, the subject will be invaded and only macro-scopic distribution rules of the drug can be obtained. The micro distribution rules of the drug are still unavailable. In addition, the reserving and transferring the samples will cost much before in-vitro measurement.
- With the rapid development of the radiological technology, the radioactive tracer method provides the possibility of in-vivo study and visual measurement for drug distribution and clearance process. However, iodine and the other tracers depend on the X-ray, CT and other imaging equipment. The X-ray, CT and the radioactive isotope can generate ionizing radiation and ionization damage which are harmful to the subject. The MRI (Magnetic Resonance Imaging) technique has become a widely-used imaging technique. Using MRI to observe the anatomical structure and physiological function of human body or animal has the advantages of in-vivo, non-invasive and real-time imaging. The MRI tracer further develops the application of MRI technique.
- At present, two kinds of tracer are primarily used in the MRI examination: one is T1 positive tracer represented by Gadolinium-diethylenetriaminepentaacetic acid (Gd-DTPA) and the other is T2 negative tracer represented by iron nanoparticle. The pilot study has been conducted by the academics on clearance route for metabolic substance in the ISF (interstitial fluid) via using the iron nanoparticle as the MRI tracer. The study confirmed that the iron nanoparticle injected in the brain is cleared out from nasal mucosa lymphoid tissue to cervical lymph nodes.
- However, the research also shows that the tracer in the living organism are difficult to be observed and quantitively analyzed owing to the image deformation and signal loss caused by the interference of the iron nanoparticle on the gradient field.
- The DWI (Diffusion Weighted Imaging) has also been used in measurement of the living organism. The DWI is a MRI technique used for measuring ADC (Apparent diffusion Coefficient) of the water and other molecules in body and FA (Anisotropy Fraction) of the tissue. This technique is based on the principle of molecular diffusion change causing MRI image signal change in tissue. When applying a lining diffusion sensitive gradient field on a certain direction, the MRI signal intensity is low where diffusion process along said direction inside the tissue is obvious, and vise versa. The ADC values can be calculated via different MRI signal intensities caused by different diffusion sensitive gradients. By applying more than six diffusion sensitive gradients with different directions, the parameters of diffusion tensor can be obtained, such as the FA, which is ratio of the anisotropy to the whole diffusion and reflects the movement intensity of the molecules on the main vector shaft of the diffusion.
- Therefore, developing a method for quantitively measuring the diffusion parameters in vivo has great value on the studying of the metabolism and clinical drug treatment at the particular anatomic site.
- The Chinese patent application
CN2010102086244 - Document M. Pellerin, "Incorporating Contrast Agents Diffusion Into the Analysis of DCE-MRI Data", Magnetic Resonance in Medicine 58, p. 1124-1134, 2007, describes a diffusion-perfusion model in which diffusion of a low molecular weight contrast agent is incorporated in a standard two-compartment Tofts model.
-
WO 2011/069283 A1 concerns a method for measuring physiological parameters in cerebral interstitial fluid (ISF) and cerebral extracellular space (ECS). It is a method for measuring physiological parameters such as diffusion, flow and elimination etc. of materials among the cerebral ISF within the cerebral ECS. The method comprises the steps of: placing the subject's brain in the magnetic resonance imaging device, administering a magnetic resonance imaging contrast agent into the subject's cerebral ISF, afterwards measuring the signal intensity of the contrast agent in MRI image, and according to the signal intensity, determining the distribution of the contrast agent at the corresponding part, and the concentration and concentration change rate of the contrast agent in each brain region. - The present invention provides a method for computing the parameter of tracer distributing in the living organism and diffusing in the ECS according to
claim 1. Further aspects of the present invention are defined in the dependent claims. The present invention obtains the diffusion feature of the tracer in the living organism via the MRI signal change caused by the diffusing of the tracer in the living organism so that the distribution change and clearance process of the tracer caused by the diffusion in the living organism can be directly reflected. - Furthermore, the present invention segments and registers the acquired three-dimensional image with the aid of MRI tracing technique, then uses anisotropic diffusion equation to finally get the spatial structure parameter of the living organism and the diffusion and clearance parameter of the tracer therein, as well as provides the pharmacokinetic parameter including the volume distribution of the molecule the and the overall clearance. Certain exemplary embodiments can provide a method, in which the tracer is Gd-DTPA and the living organism is brain ECS.
- The present invention provides a method for computing the parameter of tracer distributing in the living organism and diffusing in the ECS, comprising: (1)measuring magnetic resonance signal increment (ΔSI) corresponding to the different tracer concentrations (C) in agarose; (2)according to the value measured in the step (1), determining a upper limit of the tracer concentration when having a linear relation with the magnetic resonance signal increment (ΔSI) and determining the linear relation between the magnetic resonance signal increment (ΔSI) and the tracer concentration (C); (3) obtaining magnetic resonance images from different times of the living organism, who has been injected the tracer with different concentrations of tracer at injection sites (Q);(4) orderly registering the regions of interest from the obtained magnetic resonance images; and (5) fitting the parameter of the tracer distributing in the living organism according to the registered images, which comprises: (5.1) determining the diffusion equation of the tracer, (5.2) conversing the equation determined in the step (5.1) according to the relation between the tracer concentration and the magnetic resonance signal increment, (5.3) solving the equation acquired in the step (5.2) to fit the diffusion parameter including diffusion coefficient D*, loss ratio k' and /or part volume ratio a of the tracer.
- Certain examples outside the scope of the present invention and useful for understanding the invention can provide a method, in which the diffusion equation of the tracer diffusing from the injection site (Q) to a certain point (P) in the space determined in the steps (5.1) is:


- In the method provided by the present invention, the diffusion equation of the tracer in the standard coordinates obtained in the step (5.1) is:


- The equation after converting in the step (5.2) is:


- In the method provided by the present invention, the equation obtained in the step (5.3) can be fitted via the least square method using the following equation:

mín f(λ,α,k')=∥Ax-b∥2. The non-zero element in the row (x, y, z, t,:) in the matrix A is: b(x,y,z,t,:)=ΔSI(t+ Δt)-ΔSI(t). The row (x, y, z, t,:) of known vector b is: b(x,y,z,t,:) = ΔSI (t + Δt) - ΔSI(t). The substitution variable x is:
- Certain exemplary embodiments can provide a method, in which the image registration steps comprises:
- Certain exemplary embodiments can provide a method, in which the registration process of the step (4) further comprises a grayscale correction as following:

- Certain exemplary embodiments can provide a method, in which the grayscale correction further comprises:

- Certain exemplary embodiments can provide a method, in which the tracer is Gd-DTPA, the diffusion parameters of the living organisms comprises the effective diffusion efficient D*, tortuosity λ and clearance rate k' of Gd-DTPA in the ECS.
- Using the method according to the present invention, the diffusion parameters reflecting the structure and physical feature of the tissue cell, as well as the distribution and clearance process of the tracer in brain are both can be obtained in living organism. The present method can calculate the micro parameter such as the effective diffusion efficient D*, the tortuosity λ and the clearance rate k' as well as the macro parameter such as distribution volume (Vd) and distribution volume fraction, so that can design the disease treatment protocol and be helpful to the clinical medication. For example, valuable data for analysis can be acquired by calculating the diffusion and clearance data of Gd-DTPA in the brain ECS.
-
-
FIG. 1 shows MRI images with different Gd-DTPA concentrations in MRI device. -
FIG. 2 shows the relation between the Gd-DTPA concentration (C) and the MRI signal intensity increment (ΔSI) when the Gd-DTPA concentration ranging from 0-100mM. -
FIG. 3 shows the relation between the Gd-DTPA concentration (C) and the MRI signal intensity increment (ΔSI) when the Gd-DTPA concentration ranging from 0-4mM. -
FIG. 4 shows under wrist coil imaging, the linear relation between the Gd-DTPA concentration (C) and the MRI signal intensity increment (ΔSI) when the Gd-DTPA concentration ranging from 0-1.5mM. -
FIG. 5 shows under head coil imaging, the linear relation between the Gd-DTPA concentration (C) 0-1.5mM and the MRI signal intensity increment (ΔSI) when the Gd-DTPA concentration ranging from 0-1.5mM. -
FIG. 6 schematically shows the method for processing the above-acquired time-series MRI images. -
FIG. 7 shows the obvious deformation in most tissue caused by movement of the rat during imaging. -
FIG. 8 shows the registration framework of the time-weighted MRI images according to the present invention. -
FIG. 9 shows using Matlab software to measure the un-increment region subtracting increment region. -
FIG. 10 shows the graphical results of measuring the MRI increment signal of the increment region inFIG. 9 , wherein the axis X is signal intensity and the axis Y is the number of pixels. -
FIG. 11 shows the images of SD rats scanned from different times after injection of Gd-DTPA (2µL, 10mM) via the injection sites of (a) the caudate nucleus, (b) substantia nigros, (c) thalamus, (d) occipital cortex and (e) subcortical white matter. -
FIG. 12 shows the diffusion MRI images scanned from different times after injecting the Gd-DTPA into the rat skeletal muscle. -
FIG. 13 shows the diffusion images of Gd-DTPA in the glioma models of the rat brains, wherein (a) the high signal area of the T1WI is diffusion areas of Gd-DTPA and the low signal area is the gliomas location, (b) high signal area of the T2WI is the gliomas location. - The preferred embodiments of the present invention are described below with reference to the accompanying drawings.
- A method for computing the physiological parameter in the living organism will be illustrated with the following embodiment. In the embodiment, Gadolinium-diethylenetriaminepentaacetic acid (Gd-DTPA) which is Mag-nevist solution produced by Bayer Schering Pharma AG was used as the tracer. The corresponding MRI signal intensities of the tracer with the actual concentration in agarose gel and rat brain were measured. Male Sprague Dawley rats weighing 250-300g were used in the experiment. The living organism used for measurement is the rat brain. A Siemens Magnetom Trio 3.0 T MRI system was used to obtain the rat brain images.
-
FIG. 1 shows MRI images of with different Gd-DTPA concentrations in MRI device, wherein shows MRI images of the agarose gel obtained via an eight channels wrist coil after injecting different concentrations of Gd-DTPA ranging from 0-100mM at 37°C. A 3D MP-RAGE (Magnetization Prepared Rapid Gradient Echo) was used for T1-weighted sequence. The parameter was as follows: ET (echo time) = 3.7 ms, RT (repetition time) = 1500 ms, flip angle =9°, TI (inversion time) = 900 ms, FOV (field of view) = 267 mm, pixel = 0.5 × 0.5 × 0.5 mm3, matrix = 512 × 96. -
FIG. 2 shows the relation between the Gd-DTPA concentration (C) and the MRI signal intensity increment (ΔSI) when the Gd-DTPA concentration (C) ranging from 0-100mM. The result shows that: when the concentration ranging from 0-100mM, as concentration of Gd-DTPA (C) increases, the MRI signal intensity increment (ΔSI) increases first then decreases. The curve is bell-shaped and reaches its peak at 4mM then gradually declining. The artifact appeared at 50mM. The value of ΔSI turns into negative when the Gd-DTPA concentration becomes 100mM, indicating that the MRI signal intensity has been lower than that of pure water while the Gd-DTPA concentration becomes 100mM. -
FIG. 3 shows the relation between the Gd-DTPA concentration (C) and the MRI signal intensity increment (ΔSI) when the Gd-DTPA is ranging from 0-4mM. When the Gd-DTPA concentration (C) ranging from 0-1mM, the MRI signal intensity increment (ΔSI) rapidly linear-increases with the rise of the concentration (C) and reaches its peak at 4mM. Thus, it is concluded that when the MRI signal intensity increment (ΔSI) and the concentration (C) are in a linear relationship, the upper limit of the tracer concentration is 4mM. -
FIG. 4 shows under wrist coil imaging, the linear relation between the signal intensity increment (ΔSI) of the relating Gd-DTPA and the Gd-DTPA concentration (C) when the Gd-DTPA concentration ranging from 0-1.5mM, wherein,
the fitting linear equation is: y=499.54x+194.76,
the fitting goodness is: R2=0.9538. -
FIG. 5 shows under head coil imaging, the linear relation between the signal intensity increment (ΔSI) of the relating Gd-DTPA and Gd-DTPA concentration (C) when the Gd-DTPA concentration ranging from 0-1.5mM, wherein,
the fitting linear equation is: y=294.26x+197.9,
the fitting goodness :R2=0.8379. - Thus it can be seen that linear relation between the Gd-DTPA concentration and the corresponding signal intensity increment ΔSI varies while using different imaging coils. To get a good fitting curve, we can choose different RF coils according to different organs of the living body when imaging.
- In this embodiment, the position of the injection site Q and the depth of Gd-DTPA microinjection of the rat brains were determined by three-dimensional reconstructed image basing on the brain stereotaxic atlas. The specific method was: preparing skin, shaving between the eyes of rats about 4cm skin backwards along the midline of the skull and exposing the skull plate; then fixing the rats in a stereotactic apparatus and administrating the drug at the injection site Q using magnetic drug delivery system; rubbing off the skull plate at the entry point with an electric drill, setting a micro syringe into the brain and manually administrating 2µLGd-DTPA solution with the concentration of 10mM into the target location in three injection with the interval of 5min. The syringe was left for 10 min in the brain when drug injection was finished before the micro syringe was exited and the skin was sutured. Scanned images were taken in 15min, 30min, 1h, 2h, 3h, 4h, 6h, 9h and 12h and imaging parameters were set as the mentioned above.
-
FIG. 6 schematically shows the method for processing the above acquired time-series MRI images. As shown in the FIG., the bias field is first to be correct to eliminate the signal strength deviation among the sequence of images; the image registration technique is then used to unify the position of the increment images with the referenced images; the diffusion model is finally solved via the distribution of the tracer concentration from different times obtained by the analysis of the signal strength increment. - Since it takes a long time to acquire the MR image, the position of measured object will inevitably change during acquisition process. Therefore, before the subtraction of the images, the time series are aligned with the same coordinate system via image registration techniques. Besides, the grayscale of the MRI image are uneven because of the impact of bias field due to the imperfections of the MRI procedure, i.e. the grayscale will smoothly change in the imaging area of a same even tissue. If there is no correction of the bias field, the subtracted difference of grayscale does not reflect the tracer concentration even though two images are aligned with the reference position because the grayscale of pixel changes according to the different imaging position in bias field. Thus, the accuracy validation is assured and the diffusion model is solved via registration and uneven grayscale correction of the images having character of MR time series.
- The tracer diffusion process is embodied in MR time series image. The grayscale distribution of images from different times varies, which makes difficulty to the similarity measurement. In addition, the rigid transformation and the elastic deformation may both exist in image, which affect the time-series MR image registration, e.g. as shown in
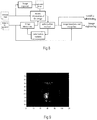
FIG. 7 , in the imaging process, the significant deformation in the most tissue was caused by the movement of rat, but the rigid transformation only exist in the brain. - In an exemplary embodiment of the present invention, the image registration method in combination with the ROI (region of interest) segmentation is used and the mutual information is selected as the similarity criterion.
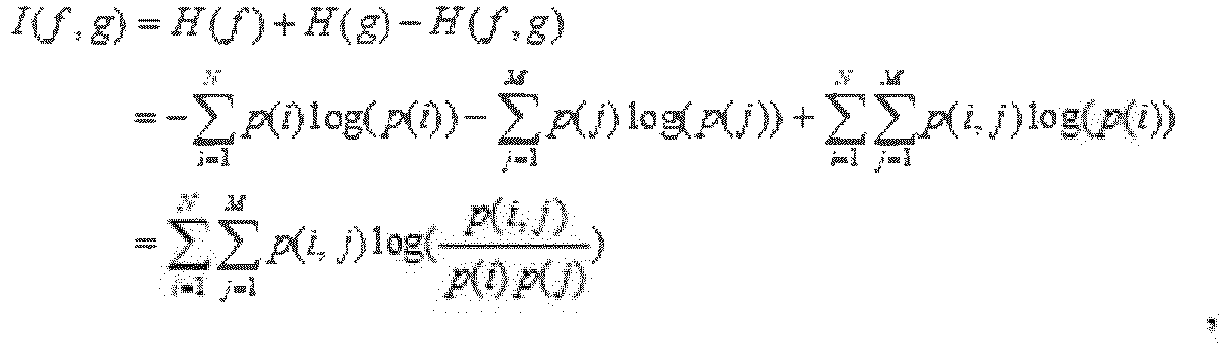
FIG. 8 exemplary shows the framework of the algorithm. - The mutual information is a criterion of similarity basing on information theory and is widely used in registration of the multi and the single mode images. Regarding the two images (f and g) to be registered, the mutual information is defined as the difference between edge entropy and joint entropy of the two images:

- In addition, as shown in
FIG. 8 , using image segmentation module in the framework in the image registration, the calculation of the similarity measurement of the mutual information is limit within the region of interest (such as the brain of rats), so that only the rigid transformation is considered in the registration process. Thus the influence of the elastic deformation of the surrounding tissue to the registration accuracy is avoided. Furthermore, for fast and accurately extracting of the region of interest, the interactive image segmentation method basing on the graph theory is used to solve the problem of the lost of the part edge of the target, which is caused by noise disturbance and the lack of grayscale contrast. The method supports the rapid amendment basing on the initial segmentation result. Therefore, it is suitable for the extraction of region of interest under complicated situation of MR time series images to improve the successful rate of image registration. - In an exemplary embodiment of the present invention, regarding the MR signal intensity change for the time-series images, the image correction method is: firstly correcting the bias field for each set of image, then unifying the signal intensity among sequences.
- According to the most commonly used model of MRI, the imaged MR signal can be represented as:

- wherein, I is the imaging signal;
- f MR is the real NMR signal which is not polluted by noise and non-uniform field;
- B is the grayscale bias field;
- n is the additive noise introduced during the imaging.
- Thus, the bias field can be modified by estimating the grayscale bias field B, so that the real MR signal can be recovered using the formula (2).
- To solve this problem, we intend to use correction method basing on High-Frequency Maximization. The distribution of bias field is obtained via an iteration process of the distribution of the signal intensity of the images in order to maximize the high-frequency content of the grayscale distribution of the images. This method does not require prior knowledge and can be automatic performed, therefore, is more suitable for processing the MR image which has a large data.
- The bias field correction can improve the consistency of the signal intensity distribution within a single set of images. However, the consistence of grayscale distribution of the same tissue among the series may be reduced after correction because only intensity information within a single set of images is taken for consideration. This problem is more obvious especially when the signal intensity drifts. Therefore, in an exemplary embodiment of the present invention, a correction method using grayscale value statistical characteristic to uniform the signal intensity is further included.
- Given two images f 1 and f 2 for correction, two regions of interest, R1 and R2 are picked from the same positions in the imaging regions from the uniform tissue. The (u1,σ1) and (u2,σ2) are get via accounting the mean values and variances of the signal intensities in the regions of interest. The grayscale uniform correction is realized by the linear transformation below:

- The ROI can be determined via human interaction or automatic selected by region clustering and the corresponding methods of region matching based on the Mean-Shift algorithm.
- As shown in
FIG. 8 , segmenting regions of interest of the standard reference images and images to be registered, then registering the images via mutual information according to formula(1) or correcting the grayscale using high-frequency-maximization basing method according to formula (3), the corrected image is obtained. Using the above method, the tracer concentration in a particular region in the living organism can be obtained via the MRI signal intensity increment. Basing on the obtained tracer concentration, the present invention can establish a diffusion model of the tracer in the living organism and work out the parameter reflecting the feature of the living organism. - In examples outside the scope of the present invention and useful for understanding the present invention, for reflecting the structure of ECS, assuming that the tortuosity between a point P and the injection site Q is only depend on the direction:

- Therefore, the diffusion equation along the direction of PQ can be:

- wherein, D is the free diffusion coefficient of the tracer in the agarose gel;
- r is the distance between the calculation point P and the injection site Q;
- C is the concentration of the tracer in the part of brain tissue, obtaining from calculating of the MRI signal increment (ΔSI);
- t is the time interval between the tracer injection and the acquisition of MRI image;
- a is the volume ratio of the brain ECS to the whole brain;
- k' the clearance rate of the tracer in the brain which is a constant;
- λPQ is the tortuosity of the brain between the point P and the tracer injection site Q.
- It can be seen that different from the current diffusion models, the diffusion model basing on the equation (5) is alterable in each direction so that the irregular diffusion surface is available when the tortuosity in each direction is calculated.
- Due to the approximately linear relation between the tracer concentration and the MRI image signal increment, the MRI signal increment ΔSI satisfied the diffusion equation as below:
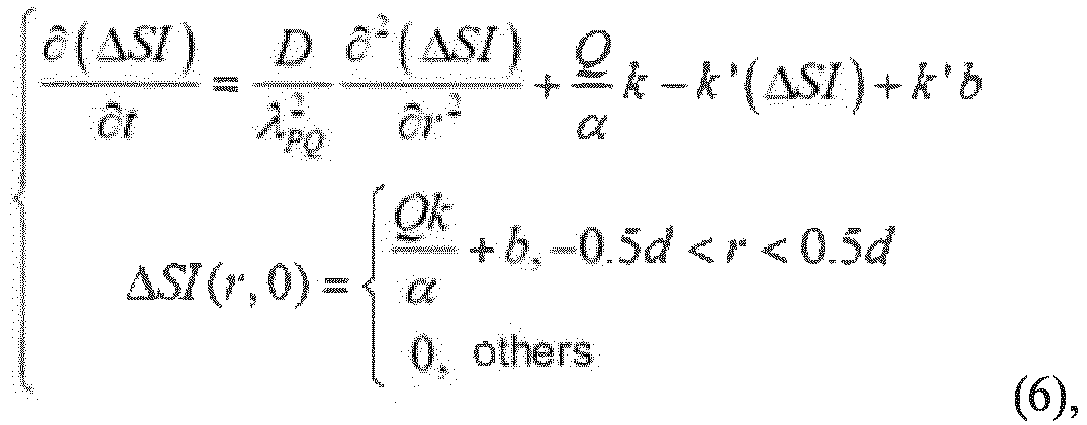
- Thus, the equation solution of formula (5) is obtained as:

- The diffusion coefficient

- Although the tortuosity varies in different directions and remains unchanged in the same direction in equation (5), the real tortuosity probably varies in the same direction. The space variability of the tortuosity should be determined to accurately describe the real diffusion process. The tortuosity of a point (x, y, z) in space is:


- Although equation (10) fully considers the space variability of the tortuosity, the solution of equation (8) is difficult to get. The equation (8) is a partial differential formula with variable coefficients and usually has no analytic solution. The continuous problem can be turned into a discrete problem to solve the equation (10):


- For the discrete equation (11), the space tortuosity λ, the loss ratio k' and the part volume ratio α can be fit by the least squares method, i.e. the solution of the below optimization problem is required:

- Write the equation (12) in a matrix form and get:


- When the time sampling rate and the space sampling rate are high, the discrete equation (11) can be equivalent to the continuity equation (10). Under normal circumstances, the real sampling rate is low, so the obtained space tortuosity λ, the loss ratio k' and the part volume rate α are not strictly the values but the values of "average" concept.
- The molecular diffusion from a point in ECS may have anisotropic feature, i.e. the molecular may quickly spread in one direction but be blocked in another direction. Therefore, we need to consider the anisotropy of molecular diffusion. Assuming the main direction of the anisotropic diffusion tensor is consistent with coordinate axis, the equation (2) can be generalized to the anisotropic case:

- Sykova E and Nicholson C have solved the equation (3):


- In an isotropic medium, λ = λ x = λ y = λ z , the equation (18) reduced to (17).
- It can be seen in the equation (17) that the tortuosity is a constant which can not reflect the actual ECS structure. In order to reflect the real structure of ECS, the discrete equation (11) can be generalized to the anisotropic case:

- Similarly, the space tortuosity λ, the loss rate k' and the part volume ratio a along the three axial are to be solved using the method of least squares. Different from the isotropic case, the coefficient matrix A and substitution variable x are changed into:


- The undetermined parameters of equation (19) are almost 2 times larger than that of the isotropic discrete equations. The equation (19) has a higher precision, i.e. the objective function equation (12) is smaller so that the real diffusion concentration can be better predicted.
- Large numbers of the tracer concentration values, the corresponding position parameters and the corresponding time parameters should be imported into the equation for fitting to solve the flow parameters of brain interstitial fluid. According to the method of the present invention, using the concentration value and its relevant position parameter and time parameters of each pixel in concentration distribution map which is automatically read by corresponding computer program, the flow parameter of brain interstitial fluid can be automatically fit.
-
FIG. 11 shows the images scanned in different time of SD rat after anesthesia in magnetic resonance imaging wrist coil, after injection of Gd-DTPA (2µL,10mM) by microinjection via different injection site. The injection site located in (a)the caudate nucleus, (b) located in the substantia nigra striatum, (c) located in the thalamus, (d) located in the occipital cortex and (e) located in the subcortical white matter. - Via calculating the collected images from regions of the caudate nucleus, the thalamus, the substantia nigra and the striatum, the pillow image cortex and the brain subcortical white matter of SD rats by the simulation method of the present invention, the diffusion parameters in different regions in the brains can be obtained. The results are shown in Table 1. Table 2 shows anisotropy of the diffusion parameters for the caudate nucleus of the rats. Table 3 shows the distribution volume changing with time of the tracer Gd-DTPA after injection through caudate nucleus in the brain.
Table1: diffusion parameters in different regions of SD rats' brain Brain area D∗ (×10-4/mm2·s-1) k' (×10-4/mM· L-1· s-1) λ caudate putamen (CPu) 3.38 0.76 1.24 substantianigra (SN) 2.06 8.28 1.59 thalamus (T) 3.28 1.44 1.26 occipital cortex (Oc) 3.25 1.55 1.26 medial prefrontal cortex (mPFC) 2.31 2.38 1.50 Table 2: the anisotropic diffusion parameters of rats' caudate nucleus regions parameters D∗ (×10-4/mm2·s-1) k' (×10-5/mM·L-1·s-1) direction -X 3.57 ± 0.88 7.14 ± 3.06 X 3.73 ± 1.10 7.67 ± 3.96 -Y 3.05 ± 0.93 7.59 ± 4.04 Z 2.54 ± 1.27 7.74 ± 4.07 -Z 4.01 ± 0.60 7.88 ± 6.24 Table 3: The change rule of distribution volume with Gd-DTPA after injection in caudate nucleus Time (h) Distribution Volume(Vd/mm3) Distribution Volume Fraction (%) 1 724.75 7.55 2 910.50 9.48 3 907.25 9.45 4 787.57 8.20 6 668.50 6.96 9 411.57 4.29 12 128.13 1.33 - Calculation method about distribution volume (Vd), distribution volume fraction and general clearance of the tracer in the living organism is as follows: reconstructing the registered and subtracted images into axial images; quantitative measuring the signal increment region in image of each layer via the Matlab program as shown in figures; and recording the number of pixels in the increment region and the signal intensity value of each pixel. According to the integral principle, we can obtain the distribution volumes (Vd) of the tracer (Gd-DTPA) from different times in the brain hemisphere ECS via adding up the increment region of each layer. The distribution volume fraction of Gd-DTPA in the brain hemisphere ECS can be obtained by dividing the Vd from different times by the volume of the brain hemisphere of the rat. The macro clearance is defined as the total signal intensity at a previous time subtracting the total signal intensity at a later time, then dividing the initial total signal intensity.
-
FIG. 9 shows using Matlab software to measure the un-increment region subtracting increment region. The selected region in the FIG. is obtained by subtracting the image before increment from the increment image. The increment region is shown as the "bright region" and the other un-increment region is shown as the "dark region".FIG. 10 shows the graphical results of the increment region inFIG. 9 , wherein the abscissa is the signal intensity and the ordinate is the number of pixels. Using the bulleted method above can measure the Vd, the distribution volume fraction and the macro clearance of the caudate nucleus. Table 4 shows the macro clearances from different times after the Gd-DTPA injection to the caudate nucleus of eight SD ratsTable 4: the macro clearances from different times after the Gd-DTPA injection to the caudate nucleus of eight SD rats time(h) Macro clearance(/h) 1-2 0.23 2-3 0.12 3-4 0.19 4-6 0.11 6-9 0.06 9-12 0.08 - Although the above invention is for the brain ECS of the SD rat, the present invention is applicable to other the living organisms.
FIG. 12 shows the diffusion MRI images scanned in different time after injecting the Gd-DTPA into the skeletal muscle of the rats. The left high signal region adjacent to the femur is the Gd-DTPA's diffusion region after injection. - Table 5 shows the diffusion parameters after Gd-DTPA injection via the skeletal muscle gap. Table 6 shows the time-varying changing rule of the distribution volume of the Gd-DTPA in the skeletal muscle gap of the rat. Table 7 shows the macro clearance of the Gd-DTPA in the skeletal muscle gap
Table 5: the diffusion parameters of the Gd-DTPA in the skeletal muscle gap parameters D∗ (×10-4/mm2·s-1) k' (×10-4/mM·L-1·s-1) direction -X 2.611 2.359 X 2.930 2.870 -Y 8.235 10.940 Z 9.537 7.817 -Z 7.154 5.083 Table 6: the time-varying change rule of distribution volume of the Gd-DTPA in the skeletal muscle gap time(min) Vd(mm3) 5 407 10 383 15 234 25 0 Table 7: the macro clearance the Gd-DTPA in the skeletal muscle gap of the rat time(h) Macro clearance(/h) 5-10 0.28 10-15 0.36 15-25 0.36 -
FIG. 13 shows the diffusion images of Gd-DTPA in the glioma model of the brain of the rat, wherein (a) the high signal areas of the T1WI are the diffusion areas of Gd-DTPA and the low signal areas are the gliomas locations, (b) the high signal area of the T2WI is the gliomas location.. - Table 8 shows the diffusion parameter of Gd-DTPA in the glioma brain of the rat.
Table 8: the diffusion parameter of Gd-DTPA in the glioma brain of the rat parameters D∗(×10-4/mm·s-1) k' (×10-4/mM·L-1·s-1) direction -X 4.02 3.31 X 3.60 3.13 -Y 4.82 3.12 Z 4.61 3.15 -Z 5.63 3.05 - Using the same method as used in the brain ECS, we can learn the time-varying change rule of distribution volume of the Gd-DTPA in the glioma brain of the rat. The results are in Table 9 and Table 10.
Table 9: the time-varying change rule of distribution volume of the Gd-DTPA in the glioma brain of the rat Time (h) Vd(mm3) Distribution Volume Fraction (%) 0.25 466 4.85 0.5 651 6.78 1 720 7.50 2 503 5.24 3 0 0 Table 10: the macro clearances of the Gd-DTPA in the glioma brain of the rat Time (h) Macro clearances (/h) 0.5-1 0.23 1-2 0.36 2-3 0.41 - The calculation method provided in the present invention can use the MRI scan image of the interested the living organism to accurately calculate the tracer distribution in the gap of the living organism and the diffusion parameter in the ECS, which is helpful to the research of diseases diagnosis and pharmacokinetics.
- The invention has been described with reference to the preferred embodiments. Modifications and alterations may occur to others upon reading and understanding the preceding detailed description. It is intended that the invention be construed as including all such modifications and alterations insofar as they come within the scope of the appended claims.
Claims (5)
- A method for computing parameters of a tracer distributing in a living organism and diffusing in an Extracellular Space, ECS, comprising:(1) measuring a magnetic resonance signal increment ΔSI corresponding to different tracer concentrations C in agarose;(2) according to the magnetic resonance signal increments measured in the step (1), determining an upper limit of the tracer concentration C up to which the tracer concentration C has a linear relation with the magnetic resonance signal increment ΔSI and determining the linear relation between the magnetic resonance signal increment ΔSI and the tracer concentration C;(3) obtaining magnetic resonance images from different times of the living organism, who has been injected the tracer with different concentrations of tracer at injection sites Q;(4) registering regions of interest from the obtained magnetic resonance images to obtain registered images; and(5) fitting parameters of the tracer distributing in the living organism according to the registered images, which comprises:
(5.1) determining a diffusion equation of the tracer, wherein fitting parameters of the tracer distributing in the living organism according to the registered images further comprises:(5.2) converting the diffusion equation determined in the step (5.1) according to the linear relation between the tracer concentration and the magnetic resonance signal increment, and(5.3) solving the diffusion equation acquired in the step (5.2) to fit diffusion parameters including diffusion coefficient D*, loss ratio k' and part volume ratio α of the tracer, wherein the part volume ratio α is a ratio of the volume of the Extracellular Space of a brain of the living organism to the volume of the whole brain, and the loss ratio k' is a clearance rate of the tracer in the brain which is a constant,wherein the diffusion equation of the tracer in the standard coordinates obtained in the step (5.1) is: wherein D is a free diffusion coefficient of the tracer,λ (x, y, z) is a tortuosity of a point (x, y, z) in the living organism,C is the tracer concentration which is obtained via the magnetic resonance signal increment ΔSI,t is a time interval between tracer injection and magnetic resonance image acquisition;the diffusion equation in an anisotropic condition can be equivalently transformed into :
 wherein k and b are constants,ΔSI is the magnetic resonance signal increment,D is the real space distance corresponding to a single pixel;the equation above is converted into a discrete model in the step (5.3) as follows:
 wherein Δt is the sampling time in each unit,ΔI is the space distance of the sample in any direction (axis i);wherein the equation obtained in the step (5.3) can be fitted via the least squares method using the following equation:


- The method according to claim 1, wherein the image registration steps comprises :
 wherein, H(f), H(g) and H(f,g) are the edge entropy and joint entropy of the two images,N and M are the numbers of grayscale samples of the two images,p(i), p(j) and p(i, j) are the possibilities of the grayscale appearing,f and g are the two images that are to be registered, andI (f, g) represents the mutual information defined as the difference between edge entropy and joint entropy of the two images.
 - The method according to claim 1, wherein the registration process of the step (4) further comprises a grayscale correction:
 wherein, f MR is the real NMR signals not polluted by noise and bias field,I is the imaging signal,B is the grayscale bias field, andn is the artificial noise introduced in the imaging process.
 - The method according to claim 3, wherein the grayscale correction further comprises:
 wherein, (u1,σ1) and (u2 ,σ2) are the mean values and the variances of the magnetic resonance signal intensities in two areas to be corrected,g is the real MRI image signal intensity,g' is the corrected MRI image signal intensity, andthe two areas to be corrected are picked from the same positions in imaging regions from a uniform tissue.
 - The method according to claim 1, wherein the tracer is Gd-DTPA, the diffusion parameter of the living organism comprises the effective diffusion efficient D*, the tortuosity λ and the clearance rate k' of Gd-DTPA in the Extracellular Space.
Applications Claiming Priority (1)
| Application Number | Priority Date | Filing Date | Title |
|---|---|---|---|
| PCT/CN2012/070352 WO2013104132A1 (en) | 2012-01-13 | 2012-01-13 | Method for measuring diffusion parameters of tracer in living organ tissue space and extracellular space |
Publications (3)
| Publication Number | Publication Date |
|---|---|
| EP2803317A1 EP2803317A1 (en) | 2014-11-19 |
| EP2803317A4 EP2803317A4 (en) | 2017-08-30 |
| EP2803317B1 true EP2803317B1 (en) | 2020-12-09 |
Family
ID=48781044
Family Applications (1)
| Application Number | Title | Priority Date | Filing Date |
|---|---|---|---|
| EP12864813.6A Active EP2803317B1 (en) | 2012-01-13 | 2012-01-13 | Mri method for measuring diffusion parameters of tracer in living organ tissue space and extracellular space |
Country Status (2)
| Country | Link |
|---|---|
| EP (1) | EP2803317B1 (en) |
| WO (1) | WO2013104132A1 (en) |
Families Citing this family (3)
| Publication number | Priority date | Publication date | Assignee | Title |
|---|---|---|---|---|
| TWI638335B (en) * | 2017-01-11 | 2018-10-11 | 國立臺灣大學 | Method for correcting a diffusion image having an artifact |
| CN112834541B (en) * | 2020-01-03 | 2022-07-29 | 上海纽迈电子科技有限公司 | Method for testing sodium content and sodium distribution |
| CN111505040A (en) * | 2020-05-14 | 2020-08-07 | 山东大学第二医院 | Special animal coil of liver ECS experiment |
Family Cites Families (3)
| Publication number | Priority date | Publication date | Assignee | Title |
|---|---|---|---|---|
| US6542769B2 (en) * | 2000-12-18 | 2003-04-01 | The General Hospital Corporation | Imaging system for obtaining quantative perfusion indices |
| WO2011069283A1 (en) * | 2009-12-07 | 2011-06-16 | 北京大学第三医院 | Method for measuring physiological parameters in cerebral interstitial fluid and cerebral extracellular space |
| CN102293634A (en) * | 2010-06-24 | 2011-12-28 | 北京大学第三医院 | Method for measuring intracerebral distribution, metabolism and clearance of traceable micro-molecular compound |
-
2012
- 2012-01-13 EP EP12864813.6A patent/EP2803317B1/en active Active
- 2012-01-13 WO PCT/CN2012/070352 patent/WO2013104132A1/en not_active Ceased
Non-Patent Citations (2)
| Title |
|---|
| JI ET AL: "A novel, fast entropy-minimization algorithm for bias field correction in MR images", MAGNETIC RESONANCE IMA, ELSEVIER SCIENCE, TARRYTOWN, NY, US, vol. 25, no. 2, 30 January 2007 (2007-01-30), pages 259 - 264, XP005867329, ISSN: 0730-725X, DOI: 10.1016/J.MRI.2006.09.012 * |
| MAES F ET AL: "Medical image registration using mutual information", PROCEEDINGS OF THE IEEE, IEEE. NEW YORK, US, vol. 91, no. 10, 1 October 2003 (2003-10-01), pages 1699 - 1722, XP011100853, ISSN: 0018-9219, DOI: 10.1109/JPROC.2003.817864 * |
Also Published As
| Publication number | Publication date |
|---|---|
| EP2803317A1 (en) | 2014-11-19 |
| WO2013104132A1 (en) | 2013-07-18 |
| EP2803317A4 (en) | 2017-08-30 |
Similar Documents
| Publication | Publication Date | Title |
|---|---|---|
| Huang et al. | High-gradient diffusion MRI reveals distinct estimates of axon diameter index within different white matter tracts in the in vivo human brain | |
| Bammer et al. | In vivo MR tractography using diffusion imaging | |
| Nie et al. | A rat brain MRI template with digital stereotaxic atlas of fine anatomical delineations in paxinos space and its automated application in voxel‐wise analysis | |
| Mukherjee et al. | Differences between gray matter and white matter water diffusion in stroke: diffusion-tensor MR imaging in 12 patients | |
| Iima et al. | Clinical intravoxel incoherent motion and diffusion MR imaging: past, present, and future | |
| Duval et al. | g-Ratio weighted imaging of the human spinal cord in vivo | |
| CA2845308C (en) | Assessment of coronary heart disease with carbon dioxide | |
| Han et al. | An in vivo study with an MRI tracer method reveals the biophysical properties of interstitial fluid in the rat brain | |
| Ella et al. | Computation of a high‐resolution MRI 3D stereotaxic atlas of the sheep brain | |
| CN101099678B (en) | Estimation of blood input function for functional medical scans | |
| Li et al. | A quantitative MRI method for imaging blood-brain barrier leakage in experimental traumatic brain injury | |
| Dougherty et al. | Occipital‐Callosal Pathways in Children: Validation and Atlas Development | |
| US20180185519A1 (en) | Assessment of coronary heart disease with carbon dioxide | |
| Kancheva et al. | Investigating secondary white matter degeneration following ischemic stroke by modelling affected fiber tracts | |
| Andersen et al. | Pig brain stereotaxic standard space: mapping of cerebral blood flow normative values and effect of MPTP-lesioning | |
| Cramer et al. | Reproducibility and optimal arterial input function selection in dynamic contrast‐enhanced perfusion MRI in the healthy brain | |
| Lv et al. | Performance of U-net based pyramidal lucas-kanade registration on free-breathing multi-b-value diffusion MRI of the kidney | |
| Mehrabian et al. | Arterial input function calculation in dynamic contrast-enhanced MRI: an in vivo validation study using co-registered contrast-enhanced ultrasound imaging | |
| EP2803317A1 (en) | Method for measuring diffusion parameters of tracer in living organ tissue space and extracellular space | |
| US20220110524A1 (en) | Quantitative measurement of the perivascular space for cns and brain disorders | |
| Wang et al. | 3D airway segmentation via hyperpolarized 3He gas MRI by using scale-based fuzzy connectedness | |
| CN102293634A (en) | Method for measuring intracerebral distribution, metabolism and clearance of traceable micro-molecular compound | |
| Gaass et al. | Pulmonary perfusion imaging: Qualitative comparison of TCIR MRI and SPECT/CT in porcine lung | |
| Poussier et al. | Quantitative SPM analysis involving an adaptive template may be easily applied to [18F] FDG PET images of the rat brain | |
| Teuho et al. | Effect of brain tissue and continuous template-based skull in MR-based attenuation correction for brain PET/MR |
Legal Events
| Date | Code | Title | Description |
|---|---|---|---|
| PUAI | Public reference made under article 153(3) epc to a published international application that has entered the european phase |
Free format text: ORIGINAL CODE: 0009012 |
|
| 17P | Request for examination filed |
Effective date: 20140807 |
|
| AK | Designated contracting states |
Kind code of ref document: A1 Designated state(s): AL AT BE BG CH CY CZ DE DK EE ES FI FR GB GR HR HU IE IS IT LI LT LU LV MC MK MT NL NO PL PT RO RS SE SI SK SM TR |
|
| RAP1 | Party data changed (applicant data changed or rights of an application transferred) |
Owner name: PEKING UNIVERSITY THIRD HOSPITAL |
|
| DAX | Request for extension of the european patent (deleted) | ||
| REG | Reference to a national code |
Ref country code: DE Ref legal event code: R079 Ref document number: 602012073690 Country of ref document: DE Free format text: PREVIOUS MAIN CLASS: A61B0005055000 Ipc: G01R0033563000 |
|
| RA4 | Supplementary search report drawn up and despatched (corrected) |
Effective date: 20170802 |
|
| RIC1 | Information provided on ipc code assigned before grant |
Ipc: G01R 33/563 20060101AFI20170727BHEP Ipc: G01R 33/58 20060101ALI20170727BHEP Ipc: A61B 5/055 20060101ALI20170727BHEP Ipc: G01R 33/56 20060101ALI20170727BHEP |
|
| STAA | Information on the status of an ep patent application or granted ep patent |
Free format text: STATUS: EXAMINATION IS IN PROGRESS |
|
| 17Q | First examination report despatched |
Effective date: 20190812 |
|
| GRAP | Despatch of communication of intention to grant a patent |
Free format text: ORIGINAL CODE: EPIDOSNIGR1 |
|
| STAA | Information on the status of an ep patent application or granted ep patent |
Free format text: STATUS: GRANT OF PATENT IS INTENDED |
|
| INTG | Intention to grant announced |
Effective date: 20200908 |
|
| GRAS | Grant fee paid |
Free format text: ORIGINAL CODE: EPIDOSNIGR3 |
|
| GRAA | (expected) grant |
Free format text: ORIGINAL CODE: 0009210 |
|
| STAA | Information on the status of an ep patent application or granted ep patent |
Free format text: STATUS: THE PATENT HAS BEEN GRANTED |
|
| AK | Designated contracting states |
Kind code of ref document: B1 Designated state(s): AL AT BE BG CH CY CZ DE DK EE ES FI FR GB GR HR HU IE IS IT LI LT LU LV MC MK MT NL NO PL PT RO RS SE SI SK SM TR |
|
| REG | Reference to a national code |
Ref country code: GB Ref legal event code: FG4D |
|
| REG | Reference to a national code |
Ref country code: AT Ref legal event code: REF Ref document number: 1343981 Country of ref document: AT Kind code of ref document: T Effective date: 20201215 Ref country code: CH Ref legal event code: EP |
|
| REG | Reference to a national code |
Ref country code: DE Ref legal event code: R096 Ref document number: 602012073690 Country of ref document: DE |
|
| REG | Reference to a national code |
Ref country code: IE Ref legal event code: FG4D |
|
| REG | Reference to a national code |
Ref country code: NL Ref legal event code: FP |
|
| PG25 | Lapsed in a contracting state [announced via postgrant information from national office to epo] |
Ref country code: GR Free format text: LAPSE BECAUSE OF FAILURE TO SUBMIT A TRANSLATION OF THE DESCRIPTION OR TO PAY THE FEE WITHIN THE PRESCRIBED TIME-LIMIT Effective date: 20210310 Ref country code: NO Free format text: LAPSE BECAUSE OF FAILURE TO SUBMIT A TRANSLATION OF THE DESCRIPTION OR TO PAY THE FEE WITHIN THE PRESCRIBED TIME-LIMIT Effective date: 20210309 Ref country code: RS Free format text: LAPSE BECAUSE OF FAILURE TO SUBMIT A TRANSLATION OF THE DESCRIPTION OR TO PAY THE FEE WITHIN THE PRESCRIBED TIME-LIMIT Effective date: 20201209 Ref country code: FI Free format text: LAPSE BECAUSE OF FAILURE TO SUBMIT A TRANSLATION OF THE DESCRIPTION OR TO PAY THE FEE WITHIN THE PRESCRIBED TIME-LIMIT Effective date: 20201209 |
|
| REG | Reference to a national code |
Ref country code: AT Ref legal event code: MK05 Ref document number: 1343981 Country of ref document: AT Kind code of ref document: T Effective date: 20201209 |
|
| PG25 | Lapsed in a contracting state [announced via postgrant information from national office to epo] |
Ref country code: SE Free format text: LAPSE BECAUSE OF FAILURE TO SUBMIT A TRANSLATION OF THE DESCRIPTION OR TO PAY THE FEE WITHIN THE PRESCRIBED TIME-LIMIT Effective date: 20201209 Ref country code: LV Free format text: LAPSE BECAUSE OF FAILURE TO SUBMIT A TRANSLATION OF THE DESCRIPTION OR TO PAY THE FEE WITHIN THE PRESCRIBED TIME-LIMIT Effective date: 20201209 Ref country code: BG Free format text: LAPSE BECAUSE OF FAILURE TO SUBMIT A TRANSLATION OF THE DESCRIPTION OR TO PAY THE FEE WITHIN THE PRESCRIBED TIME-LIMIT Effective date: 20210309 |
|
| PG25 | Lapsed in a contracting state [announced via postgrant information from national office to epo] |
Ref country code: HR Free format text: LAPSE BECAUSE OF FAILURE TO SUBMIT A TRANSLATION OF THE DESCRIPTION OR TO PAY THE FEE WITHIN THE PRESCRIBED TIME-LIMIT Effective date: 20201209 |
|
| REG | Reference to a national code |
Ref country code: LT Ref legal event code: MG9D |
|
| PG25 | Lapsed in a contracting state [announced via postgrant information from national office to epo] |
Ref country code: LT Free format text: LAPSE BECAUSE OF FAILURE TO SUBMIT A TRANSLATION OF THE DESCRIPTION OR TO PAY THE FEE WITHIN THE PRESCRIBED TIME-LIMIT Effective date: 20201209 Ref country code: SK Free format text: LAPSE BECAUSE OF FAILURE TO SUBMIT A TRANSLATION OF THE DESCRIPTION OR TO PAY THE FEE WITHIN THE PRESCRIBED TIME-LIMIT Effective date: 20201209 Ref country code: PT Free format text: LAPSE BECAUSE OF FAILURE TO SUBMIT A TRANSLATION OF THE DESCRIPTION OR TO PAY THE FEE WITHIN THE PRESCRIBED TIME-LIMIT Effective date: 20210409 Ref country code: RO Free format text: LAPSE BECAUSE OF FAILURE TO SUBMIT A TRANSLATION OF THE DESCRIPTION OR TO PAY THE FEE WITHIN THE PRESCRIBED TIME-LIMIT Effective date: 20201209 Ref country code: SM Free format text: LAPSE BECAUSE OF FAILURE TO SUBMIT A TRANSLATION OF THE DESCRIPTION OR TO PAY THE FEE WITHIN THE PRESCRIBED TIME-LIMIT Effective date: 20201209 Ref country code: CZ Free format text: LAPSE BECAUSE OF FAILURE TO SUBMIT A TRANSLATION OF THE DESCRIPTION OR TO PAY THE FEE WITHIN THE PRESCRIBED TIME-LIMIT Effective date: 20201209 Ref country code: EE Free format text: LAPSE BECAUSE OF FAILURE TO SUBMIT A TRANSLATION OF THE DESCRIPTION OR TO PAY THE FEE WITHIN THE PRESCRIBED TIME-LIMIT Effective date: 20201209 |
|
| PG25 | Lapsed in a contracting state [announced via postgrant information from national office to epo] |
Ref country code: AT Free format text: LAPSE BECAUSE OF FAILURE TO SUBMIT A TRANSLATION OF THE DESCRIPTION OR TO PAY THE FEE WITHIN THE PRESCRIBED TIME-LIMIT Effective date: 20201209 Ref country code: PL Free format text: LAPSE BECAUSE OF FAILURE TO SUBMIT A TRANSLATION OF THE DESCRIPTION OR TO PAY THE FEE WITHIN THE PRESCRIBED TIME-LIMIT Effective date: 20201209 |
|
| REG | Reference to a national code |
Ref country code: CH Ref legal event code: PL |
|
| REG | Reference to a national code |
Ref country code: DE Ref legal event code: R097 Ref document number: 602012073690 Country of ref document: DE |
|
| PG25 | Lapsed in a contracting state [announced via postgrant information from national office to epo] |
Ref country code: LU Free format text: LAPSE BECAUSE OF NON-PAYMENT OF DUE FEES Effective date: 20210113 Ref country code: IS Free format text: LAPSE BECAUSE OF FAILURE TO SUBMIT A TRANSLATION OF THE DESCRIPTION OR TO PAY THE FEE WITHIN THE PRESCRIBED TIME-LIMIT Effective date: 20210409 Ref country code: MC Free format text: LAPSE BECAUSE OF FAILURE TO SUBMIT A TRANSLATION OF THE DESCRIPTION OR TO PAY THE FEE WITHIN THE PRESCRIBED TIME-LIMIT Effective date: 20201209 |
|
| REG | Reference to a national code |
Ref country code: BE Ref legal event code: MM Effective date: 20210131 |
|
| PLBE | No opposition filed within time limit |
Free format text: ORIGINAL CODE: 0009261 |
|
| STAA | Information on the status of an ep patent application or granted ep patent |
Free format text: STATUS: NO OPPOSITION FILED WITHIN TIME LIMIT |
|
| PG25 | Lapsed in a contracting state [announced via postgrant information from national office to epo] |
Ref country code: AL Free format text: LAPSE BECAUSE OF FAILURE TO SUBMIT A TRANSLATION OF THE DESCRIPTION OR TO PAY THE FEE WITHIN THE PRESCRIBED TIME-LIMIT Effective date: 20201209 Ref country code: IT Free format text: LAPSE BECAUSE OF FAILURE TO SUBMIT A TRANSLATION OF THE DESCRIPTION OR TO PAY THE FEE WITHIN THE PRESCRIBED TIME-LIMIT Effective date: 20201209 |
|
| 26N | No opposition filed |
Effective date: 20210910 |
|
| PG25 | Lapsed in a contracting state [announced via postgrant information from national office to epo] |
Ref country code: LI Free format text: LAPSE BECAUSE OF NON-PAYMENT OF DUE FEES Effective date: 20210131 Ref country code: SI Free format text: LAPSE BECAUSE OF FAILURE TO SUBMIT A TRANSLATION OF THE DESCRIPTION OR TO PAY THE FEE WITHIN THE PRESCRIBED TIME-LIMIT Effective date: 20201209 Ref country code: ES Free format text: LAPSE BECAUSE OF FAILURE TO SUBMIT A TRANSLATION OF THE DESCRIPTION OR TO PAY THE FEE WITHIN THE PRESCRIBED TIME-LIMIT Effective date: 20201209 Ref country code: DK Free format text: LAPSE BECAUSE OF FAILURE TO SUBMIT A TRANSLATION OF THE DESCRIPTION OR TO PAY THE FEE WITHIN THE PRESCRIBED TIME-LIMIT Effective date: 20201209 Ref country code: CH Free format text: LAPSE BECAUSE OF NON-PAYMENT OF DUE FEES Effective date: 20210131 |
|
| PG25 | Lapsed in a contracting state [announced via postgrant information from national office to epo] |
Ref country code: IE Free format text: LAPSE BECAUSE OF NON-PAYMENT OF DUE FEES Effective date: 20210113 |
|
| PG25 | Lapsed in a contracting state [announced via postgrant information from national office to epo] |
Ref country code: IS Free format text: LAPSE BECAUSE OF FAILURE TO SUBMIT A TRANSLATION OF THE DESCRIPTION OR TO PAY THE FEE WITHIN THE PRESCRIBED TIME-LIMIT Effective date: 20210409 |
|
| PG25 | Lapsed in a contracting state [announced via postgrant information from national office to epo] |
Ref country code: BE Free format text: LAPSE BECAUSE OF NON-PAYMENT OF DUE FEES Effective date: 20210131 |
|
| PG25 | Lapsed in a contracting state [announced via postgrant information from national office to epo] |
Ref country code: HU Free format text: LAPSE BECAUSE OF FAILURE TO SUBMIT A TRANSLATION OF THE DESCRIPTION OR TO PAY THE FEE WITHIN THE PRESCRIBED TIME-LIMIT; INVALID AB INITIO Effective date: 20120113 Ref country code: CY Free format text: LAPSE BECAUSE OF FAILURE TO SUBMIT A TRANSLATION OF THE DESCRIPTION OR TO PAY THE FEE WITHIN THE PRESCRIBED TIME-LIMIT Effective date: 20201209 |
|
| PG25 | Lapsed in a contracting state [announced via postgrant information from national office to epo] |
Ref country code: MK Free format text: LAPSE BECAUSE OF FAILURE TO SUBMIT A TRANSLATION OF THE DESCRIPTION OR TO PAY THE FEE WITHIN THE PRESCRIBED TIME-LIMIT Effective date: 20201209 |
|
| PG25 | Lapsed in a contracting state [announced via postgrant information from national office to epo] |
Ref country code: MT Free format text: LAPSE BECAUSE OF FAILURE TO SUBMIT A TRANSLATION OF THE DESCRIPTION OR TO PAY THE FEE WITHIN THE PRESCRIBED TIME-LIMIT Effective date: 20201209 |
|
| PG25 | Lapsed in a contracting state [announced via postgrant information from national office to epo] |
Ref country code: TR Free format text: LAPSE BECAUSE OF FAILURE TO SUBMIT A TRANSLATION OF THE DESCRIPTION OR TO PAY THE FEE WITHIN THE PRESCRIBED TIME-LIMIT Effective date: 20201209 |
|
| PGFP | Annual fee paid to national office [announced via postgrant information from national office to epo] |
Ref country code: NL Payment date: 20260121 Year of fee payment: 15 |
|
| PGFP | Annual fee paid to national office [announced via postgrant information from national office to epo] |
Ref country code: GB Payment date: 20260123 Year of fee payment: 15 |
|
| PGFP | Annual fee paid to national office [announced via postgrant information from national office to epo] |
Ref country code: DE Payment date: 20260121 Year of fee payment: 15 |
|
| PGFP | Annual fee paid to national office [announced via postgrant information from national office to epo] |
Ref country code: FR Payment date: 20260123 Year of fee payment: 15 |