EP2790016A1 - X-ray analysis device - Google Patents
X-ray analysis device Download PDFInfo
- Publication number
- EP2790016A1 EP2790016A1 EP12856326.9A EP12856326A EP2790016A1 EP 2790016 A1 EP2790016 A1 EP 2790016A1 EP 12856326 A EP12856326 A EP 12856326A EP 2790016 A1 EP2790016 A1 EP 2790016A1
- Authority
- EP
- European Patent Office
- Prior art keywords
- sample
- distribution
- rays
- roi
- characteristic
- Prior art date
- Legal status (The legal status is an assumption and is not a legal conclusion. Google has not performed a legal analysis and makes no representation as to the accuracy of the status listed.)
- Granted
Links
- 238000002441 X-ray diffraction Methods 0.000 title description 3
- 238000009826 distribution Methods 0.000 claims abstract description 107
- 238000001228 spectrum Methods 0.000 claims abstract description 55
- 238000001514 detection method Methods 0.000 claims description 9
- 235000013619 trace mineral Nutrition 0.000 abstract description 15
- 239000011573 trace mineral Substances 0.000 abstract description 15
- 238000002083 X-ray spectrum Methods 0.000 abstract description 2
- 238000010894 electron beam technology Methods 0.000 description 23
- 238000010586 diagram Methods 0.000 description 18
- 238000004876 x-ray fluorescence Methods 0.000 description 8
- 238000000034 method Methods 0.000 description 7
- 238000004590 computer program Methods 0.000 description 5
- 230000005540 biological transmission Effects 0.000 description 3
- 239000004065 semiconductor Substances 0.000 description 3
- 238000012935 Averaging Methods 0.000 description 2
- 238000007796 conventional method Methods 0.000 description 2
- 230000000694 effects Effects 0.000 description 2
- 238000010922 spray-dried dispersion Methods 0.000 description 2
- 240000006829 Ficus sundaica Species 0.000 description 1
- XUIMIQQOPSSXEZ-UHFFFAOYSA-N Silicon Chemical compound [Si] XUIMIQQOPSSXEZ-UHFFFAOYSA-N 0.000 description 1
- 238000004458 analytical method Methods 0.000 description 1
- 238000001816 cooling Methods 0.000 description 1
- 239000004973 liquid crystal related substance Substances 0.000 description 1
- 239000000463 material Substances 0.000 description 1
- 238000001000 micrograph Methods 0.000 description 1
- 230000003287 optical effect Effects 0.000 description 1
- 238000000879 optical micrograph Methods 0.000 description 1
- 239000002245 particle Substances 0.000 description 1
- 238000004451 qualitative analysis Methods 0.000 description 1
- 238000004445 quantitative analysis Methods 0.000 description 1
- 229910052710 silicon Inorganic materials 0.000 description 1
- 239000010703 silicon Substances 0.000 description 1
Images





Classifications
-
- G—PHYSICS
- G01—MEASURING; TESTING
- G01N—INVESTIGATING OR ANALYSING MATERIALS BY DETERMINING THEIR CHEMICAL OR PHYSICAL PROPERTIES
- G01N23/00—Investigating or analysing materials by the use of wave or particle radiation, e.g. X-rays or neutrons, not covered by groups G01N3/00 – G01N17/00, G01N21/00 or G01N22/00
- G01N23/22—Investigating or analysing materials by the use of wave or particle radiation, e.g. X-rays or neutrons, not covered by groups G01N3/00 – G01N17/00, G01N21/00 or G01N22/00 by measuring secondary emission from the material
- G01N23/223—Investigating or analysing materials by the use of wave or particle radiation, e.g. X-rays or neutrons, not covered by groups G01N3/00 – G01N17/00, G01N21/00 or G01N22/00 by measuring secondary emission from the material by irradiating the sample with X-rays or gamma-rays and by measuring X-ray fluorescence
-
- G—PHYSICS
- G01—MEASURING; TESTING
- G01N—INVESTIGATING OR ANALYSING MATERIALS BY DETERMINING THEIR CHEMICAL OR PHYSICAL PROPERTIES
- G01N23/00—Investigating or analysing materials by the use of wave or particle radiation, e.g. X-rays or neutrons, not covered by groups G01N3/00 – G01N17/00, G01N21/00 or G01N22/00
- G01N23/22—Investigating or analysing materials by the use of wave or particle radiation, e.g. X-rays or neutrons, not covered by groups G01N3/00 – G01N17/00, G01N21/00 or G01N22/00 by measuring secondary emission from the material
- G01N23/225—Investigating or analysing materials by the use of wave or particle radiation, e.g. X-rays or neutrons, not covered by groups G01N3/00 – G01N17/00, G01N21/00 or G01N22/00 by measuring secondary emission from the material using electron or ion
- G01N23/2251—Investigating or analysing materials by the use of wave or particle radiation, e.g. X-rays or neutrons, not covered by groups G01N3/00 – G01N17/00, G01N21/00 or G01N22/00 by measuring secondary emission from the material using electron or ion using incident electron beams, e.g. scanning electron microscopy [SEM]
- G01N23/2252—Measuring emitted X-rays, e.g. electron probe microanalysis [EPMA]
-
- G—PHYSICS
- G01—MEASURING; TESTING
- G01N—INVESTIGATING OR ANALYSING MATERIALS BY DETERMINING THEIR CHEMICAL OR PHYSICAL PROPERTIES
- G01N2223/00—Investigating materials by wave or particle radiation
- G01N2223/07—Investigating materials by wave or particle radiation secondary emission
- G01N2223/076—X-ray fluorescence
-
- G—PHYSICS
- G01—MEASURING; TESTING
- G01N—INVESTIGATING OR ANALYSING MATERIALS BY DETERMINING THEIR CHEMICAL OR PHYSICAL PROPERTIES
- G01N2223/00—Investigating materials by wave or particle radiation
- G01N2223/40—Imaging
- G01N2223/402—Imaging mapping distribution of elements
-
- G—PHYSICS
- G01—MEASURING; TESTING
- G01N—INVESTIGATING OR ANALYSING MATERIALS BY DETERMINING THEIR CHEMICAL OR PHYSICAL PROPERTIES
- G01N2223/00—Investigating materials by wave or particle radiation
- G01N2223/40—Imaging
- G01N2223/418—Imaging electron microscope
Definitions
- the present invention relates to an X-ray analyzer scanning a sample with a beam, then detecting X-rays generated on the sample, and thereby obtaining element distribution in the sample.
- X-ray analysis is a technique of analysis in which a beam of electron rays, X-rays, or the like is projected onto a sample, then characteristic X-rays or X-ray fluorescence generated on the sample are detected, and then from a spectrum of characteristic X-rays or X-ray fluorescence, qualitative analysis or quantitative analysis of an element contained in the sample is performed. Further, when the characteristic X-rays or the X-ray fluorescence are detected with scanning the sample with the beam, distribution of the element contained in the sample is obtained.
- the X-ray analyzer employing an electron beam is incorporated in an electron microscope in some cases.
- Patent Document 1 discloses an example of a technique of generating element distribution image by X-ray analysis.
- an ROI region of interest
- intensity distribution of characteristic X-rays or X-ray fluorescence whose energy is included in the ROI is acquired so that distribution of each element is acquired.
- positioning of an area where the trace element is inhomogeneously distributed has been performed on the basis of an image other than an element distribution image, like an electron microscope image and an optical microscope image of the sample.
- Patent Document 1 Japanese Patent Publication No. 3654551
- element distribution is obtained after an ROI is set up in advance.
- An ROI is allowed to be set up manually after the spectrum of characteristic X-rays or X-ray fluorescence is checked. Nevertheless, it is difficult to find a signal of a trace element from the spectrum. Thus, it is difficult to acquire element distribution of a trace element.
- the work of generating an image other than an element distribution image, performing the positioning on the basis of the image, generating a spectrum, and checking the spectrum need be repeated until a trace element is found. This has caused a problem of time and effort.
- the contents of obtained information are different between an element distribution image and an image other than an element distribution image.
- an area where a trace element is inhomogeneously distributed is allowed to be identified on the basis of an image other than an element distribution image. Accordingly, in the conventional method, it is difficult to rapidly obtain element distribution covering the entire elements contained in the sample.
- An object thereof is to provide an X-ray analyzer that repeats setting of an ROI and identification of an element on the basis of characteristic X-rays or X-ray fluorescence whose intensity is high in the outside of the ROI and that thereby rapidly obtains element distribution covering as much as possible the elements contained in a sample.
- An X-ray analyzer which scans a sample with a beam, detects X-rays generated on the sample by the scanning, and obtains distribution of an element contained in the sample on the basis of the detection result
- the X-ray analyzer is characterized by comprising: element distribution obtaining means for, from the detection result of the X-rays generated in an area on the sample scanned with the beam, obtaining intensity distribution of the X-rays whose energy or wavelength is included in a range of energy or wavelength set up in correspondence to an element contained in the sample and thereby obtaining distribution of the element; means for acquiring intensity distribution of X-rays whose energy or wavelength is not included in the range; means for generating a spectrum of X-rays generated in an area on the sample corresponding to a portion where the intensity of X-rays is not less than a predetermined intensity in the acquired intensity distribution; element identification means for identifying an element contained in the sample on the basis of a peak included in the generated spectrum; and setting means for setting
- the X-ray analyzer obtains element distribution by using a range of energy or wavelength having been set up, then generates a spectrum of X-rays obtained from an area on the sample where the intensity of X-rays whose energy or wavelength is not included in the already set-up range is high, and then identifies a new element from the generated spectrum. Further, the X-ray analyzer sets a range of energy or wavelength corresponding to the identified element and then obtains element distribution by using the set-up range. As such, the X-ray analyzer repeats generation of an X-ray spectrum, identification of an element, setting of a range of energy or wavelength, and obtaining element distribution.
- the X-ray analyzer according to the present invention is characterized by further comprising means for displaying an image representing the distribution of the element at each time that the element distribution obtaining means obtains the distribution.
- the X-ray analyzer displays an element distribution image representing element distribution and then the user checks the distribution of each element contained in the sample.
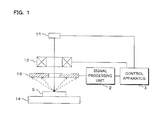
- FIG. 1 is a block diagram illustrating the configuration of an X-ray analyzer.
- the X-ray analyzer includes: an electron gun 11 projecting an electron beam (beam) onto a sample S; an electron lens system 12; and a sample stage 14 on which the sample S is placed.
- the electron lens system 12 includes a scanning coil changing the direction of the electron beam and corresponds to scanning means of the present invention.
- the electron gun 11 and the electron lens system 12 are connected to a control apparatus 3 controlling the entirety of the X-ray analyzer.
- the sample S having a planar shape is illustrated.
- the X-ray analyzer is allowed to measure a sample having another shape such as a spherical shape.
- An X-ray detector 13 is arranged between the electron lens system 12 and the sample stages 14.
- the X-ray detector 13 is formed in a shape having a hole through which the electron beam passes.
- the X-ray detector 13 configured by including an SDD (Silicon Drift Detector) as an X-ray sensor.
- SDD Silicon Drift Detector
- the X-ray detector 13 has a configuration that a plurality of SDDs are mounted on a board in which a hole is formed and then the plurality of SDDs are arranged around the hole.
- FIG. 1 illustrates a cross section of the X-ray detector 13.
- the X-ray detector 13 is arranged at a position that the electron beam passes through the hole, and arranged in a manner that the axis of the electron beam is perpendicular to the X-ray incident surface. Further, a cooling device (not illustrated) such as a Peltier device is attached to the X-ray detector 13. In a state that the sample S is placed on the sample stage 14, the X-ray detector 13 is arranged in front of the surface of the sample S onto which the electron beam is projected. In accordance with a control signal from the control apparatus 3, the electron gun 11 emits an electron beam and then the electron lens system 12 sets forth the direction of the electron beam, so that the electron beam pass through the hole of the X-ray detector 13 and then are projected onto the sample S on the sample stage 14.
- a cooling device such as a Peltier device
- characteristic X-rays are generated at a portion onto which the electron beam is projected. Then, the generated characteristic X-rays are detected by the X-ray detector 13.
- the electron beam is indicated by a solid-line arrow and the characteristic X-rays are indicated by dashed-line arrows.
- the X-ray detector 13 outputs a signal proportional to the energy of the detected characteristic X-ray.
- at least the electron gun 11, the electron lens system 12, the X-ray detector 13, and the sample stage 14 are placed in a vacuum chamber (not illustrated).
- the vacuum chamber is constructed from a material shielding electron rays and X-rays. Further, the inside of the vacuum chamber is kept at a vacuum during the operation of the X-ray analyzer.
- a signal processing unit 2 processing the outputted signal is connected to the X-ray detector 13.
- the signal processing unit 2 receives the signals outputted by the X-ray detector 13 and then performs the processing of counting the signals of each value and then acquiring the relation between the energy and the number of counts of the characteristic X-rays detected by the X-ray detector 13, that is, a spectrum of the characteristic X-rays.
- the signal processing unit 2 is connected to the control apparatus 3.
- the electron lens system 12 sequentially changes the direction of the electron beam so that the electron beam is projected onto the sample S in a manner of scanning the sample S. When the electron beam scan the sample S, the electron beam is sequentially projected onto each portion within the scan area of the sample S.
- characteristic X-rays generated at each portion on the sample S are sequentially detected by the X-ray detector 13.
- the signal processing unit 2 sequentially performs signal processing so as to sequentially generate a spectrum of characteristic X-rays generated at each portion on the sample S.
- the signal processing unit 2 sequentially outputs to the control apparatus 3 the data of the generated spectrum of the characteristic X-rays.
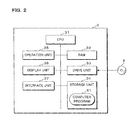
- FIG. 2 is a block diagram illustrating the internal configuration of the control apparatus 3.
- the control apparatus 3 is configured by employing a computer such as a personal computer.
- the control apparatus 3 includes: a CPU (Central Processing Unit) 31 performing arithmetic operation; a RAM (Random Access Memory) 32 storing temporary data generated in association with the arithmetic operation; a drive unit 33 reading information from a recording medium 4 such as an optical disc; and a nonvolatile storage unit 34 such as a hard disk.
- the control apparatus 3 includes: an operation unit 35 such as a keyboard and a mouse receiving operation by a user; a display unit 36 such as a liquid crystal display; and an interface unit 37.
- the interface unit 37 is connected to the electron gun 11, the electron lens system 12, and the signal processing unit 2.
- the CPU 31 causes the drive unit 33 to read a computer program 41 recorded on the recording medium 4 and then causes the storage unit 34 to store the read-out computer program 41.
- the computer program 41 is loaded from the storage unit 34 to the RAM 32 when necessary. Then, in accordance with the loaded computer program 41, the CPU 31 executes the processing necessary for the X-ray analyzer.
- the computer program 41 may be downloaded from the outside of the control apparatus 3.
- the control apparatus 3 receives through the interface unit 37 the data of the spectrum of characteristic X-rays outputted from the signal processing unit 2, and then stores the data into the storage unit 34. Further, the control apparatus 3 controls the operation of the electron lens system 12 connected to the interface unit 37.
- FIG. 3 is a characteristics diagram indicating an example of the spectrum of characteristic X-rays.
- the horizontal axis in the figure indicates the energy and the vertical axis indicates the number of counts of characteristic X-rays for each energy.
- the spectrum illustrated in FIG. 3 includes peaks indicated by A, B, and C.
- the energy of each peak caused by various elements is known in advance.
- an element corresponding to the peak included in the spectrum is identified.
- the identified element is contained in the sample S.
- the peak indicated by A is premised to be caused by element A
- the peak indicated by B is premised to be caused by element B
- the peak indicated by C is premised to be caused by element C.
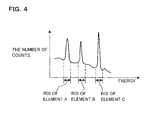
- FIG. 4 is a characteristics diagram illustrating an example of an ROI.
- a range of energy where the intensity of the peak of element A is not less than the intensity of the background signal is set up as the ROI of element A.
- the ROI of element B and the ROI of element C are set up similarly.
- the energy range set up as the ROI may be set forth by another method like the half-value width of each peak is set up as the energy width of the ROI.
- FIG. 5 is a flow chart illustrating a procedure of the processing executed by the X-ray analyzer.
- the user identifies in advance an element contained in the sample S from the spectrum of characteristic X-rays obtained in advance. Then, the user operates the operation unit 35 so as to set up in advance an ROI corresponding to the identified element.
- the data indicating the ROI set up in advance is stored in the storage unit 34. However, even in a state that the ROI is not set up in advance, the X-ray analyzer is allowed to execute the following processing.
- the CPU 31 transmits a control signal from the interface unit 37 to the electron gun 11 and the electron lens system 12 so that the X-ray analyzer starts the processing.
- the electron gun 11 emits an electron beam and then the electron lens system 12 adjusts the direction of the electron beam in accordance with the control from the control apparatus 3, so that the sample S is scanned with the electron beam and then the X-ray detector 13 detects the characteristic X-rays (S1).
- the electron lens system 12 two dimensionally scans an area of set-forth size on the sample S.
- the X-ray detector 13 outputs, to the signal processing unit 2, signals corresponding to the energies of the detected characteristic X-rays.
- the signal processing unit 2 sequentially generates a spectrum of characteristic X-rays generated at each portion on the sample S. Further, the CPU 31 reads from the storage unit 34 the data indicating the already set-up ROI and then outputs the data from the interface unit 37 to the signal processing unit 2. Then, the signal processing unit 2 receives the data indicating the ROI.
- the signal processing unit 2 From the generated spectrum of the characteristic X-rays, the signal processing unit 2 acquires the number of counts of characteristic X-rays whose energy is included in the ROI indicated by the received data, then establishes correspondence between the acquired number of counts and each portion on the sample S where the characteristic X-rays have been generated, and thereby obtains distribution of the element for which the ROI has been set up (S2). In a case that ROIs of a plurality of elements are set up, by using the number of counts of the characteristic X-rays whose energy is included in each ROI, the signal processing unit 2 obtains element distribution for each element. The signal processing unit 2 outputs the data of the obtained element distribution to the control apparatus 3. The control apparatus 3 receives the data of element distribution through the interface unit 37.
- the CPU 31 stores the data of element distribution into the storage unit 34.
- the processing of step S2 is skipped.
- the signal processing unit 2 acquires the number of counts of characteristic X-rays whose energy is not included in the already set-up ROI, then establishes correspondence between the acquired the number of counts and each portion on the sample S where the characteristic X-rays have been generated, and thereby obtains intensity distribution of the characteristic X-rays whose energy is not included in the already set-up ROI (S3).
- FIGS. 6A, 6B and 6C are schematic diagrams each illustrating an example of the element distribution image.
- FIG. 6A illustrates the distribution of element A
- FIG. 6B illustrates the distribution of element B
- FIG. 6C illustrates the distribution of element C.
- Each hatched portion in the figures indicates a portion where the intensity of the characteristic X-rays caused by each element on the sample S is high, that is, an area where the content of each element on the sample S is high.
- FIGS. 6A, 6B, or 6C are displayed on the display unit 36.
- the plurality of element distribution images are illustrated individually.
- the X-ray analyzer may be in a mode that an element distribution image in which the distribution of the plurality of elements are represented as one image is displayed.
- the CPU 31 does not display the element distribution image on the display unit 36.
- the CPU 31 determines whether the processing is to be continued (S5). When the processing is not to be continued (S5: NO), the CPU 31 terminates the processing.
- the processing is to be continued (S5: YES)
- the CPU 31 determines whether detection of a new element in addition to the already identified elements is to be performed (S6). When it is determined that detection of a new element is not to be performed (S6: NO), the CPU 31 returns the processing to step S1 so as to repeat scanning.
- the signal processing unit 2 specifies an area on the sample S corresponding to the portion where the intensity of the characteristic X-rays is higher than a predetermined intensity in the intensity distribution obtained at step S3 (S7).
- the employed predetermined intensity may be a constant value set forth in advance or alternatively a value obtained by averaging the intensity of the characteristic X-rays included in the intensity distribution.
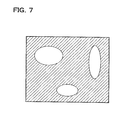
- FIG. 7 is a schematic diagram illustrating an example of the intensity distribution of characteristic X-rays whose energy is not included in the ROI. The hatched portion in the figure indicates a portion where the intensity of the characteristic X-rays is high and corresponds to the area specified at step S7.
- the intensity of the characteristic X-rays is low in the portions corresponding to the areas where the content of element A illustrated in FIG. 6A , element B illustrated in FIG. 6B , and element C illustrated in FIG. 6C is high. In the areas specified at step S7, the intensity of the characteristic X-rays not caused by the already identified elements is high. Thus, a probability is present that an element different from the already identified elements is contained.
- the CPU 31 causes the electron gun 11 and the electron lens system 12 to operate so as to scan the sample S with the electron beam.
- the X-ray detector 13 detects the characteristic X-rays (S8).
- the signal processing unit 2 sequentially generates spectra of the characteristic X-rays detected by the X-ray detector 13, then integrates the spectra of the characteristic X-rays generated from each portion of the area specified at step S7, and thereby generates a spectrum of the characteristic X-rays generated in the specified area on the sample S at a stage of termination of the scan (S9).
- the spectrum may be generated by averaging the plurality of spectra of the characteristics X-rays.
- the signal processing unit 2 outputs the data of the spectrum to the control apparatus 3.
- the control apparatus 3 receives the data of element distribution through the interface unit 37. Then, the CPU 31 stores the data of the spectrum into the storage unit 34.
- the generated spectrum of the characteristic X-rays is a spectrum corresponding to the content of elements contained in the area of the sample S specified at step S7.
- FIG. 8 is a characteristics diagram illustrating an example of the spectrum of characteristic X-rays generated at step S9. Characteristic X-rays from the area where the content of the already identified elements is high is not included. Thus, the intensities of the peaks caused by element A, element B, and element C are small. Further, the spectrum is a spectrum of characteristic X-rays from an area having a possibility that an element different from the already identified elements is contained. Thus, when an element different from the already identified elements is contained in the sample S, a peak caused by the element is included in the spectrum. The peak caused by the element different from the already identified elements appears as a relatively large peak. In FIG. 8 , a peak not related to any of element A, element B, and element C is indicated by D. The peak indicated by D is premised to be a peak caused by element D.
- the CPU 31 performs the processing of identifying a new element contained in the sample S (S10).
- the storage unit 34 stores in advance the data recording the energies of characteristic X-rays corresponding to various elements.
- the CPU 31 detects a peak included in the spectrum of the characteristic X-rays and then specifies the energy of the detected peak.
- the CPU 31 compares the specified energy with the energies of characteristic X-rays corresponding to various elements and thereby identifies the element. For example, element D causing the peak indicated by D in FIG. 8 is identified.
- the CPU 31 sets up a new ROI which is an energy range of characteristic X-rays corresponding to the newly identified element (S11). Specifically, the CPU 31 sets as an ROI an energy range that includes the peak in the spectrum used for identifying the element.
- the energy range set up as the ROI may be set forth by another method like the half-value width of each peak is set up as the energy width of the ROI.
- the ROI of element D is set up.
- FIG. 9 is a schematic diagram illustrating an example of the new element distribution image.
- the distribution of element D different from any of element A, element B, and element C is illustrated.
- the hatched portion in the figure indicates an area where the content of element D in the sample S is high.
- the distribution of element D having a lower content and inhomogeneously distributed in a smaller area than element A, element B, and element C is obtained.
- steps S1 to S11 When the processing of steps S1 to S11 is repeated, elements contained in the sample S are identified sequentially. Then, element distribution images of the identified element is sequentially displayed on the display unit 36. The user is allowed to check the displayed element distribution image. At a stage that an appropriately number of elements have been identified and then the element distribution images have been displayed, the user is allowed to operate the operation unit 35 so as to terminate the processing of the X-ray analyzer. Further, generation of the spectrum of characteristic X-rays and obtaining element distribution are executed by the signal processing unit 2 which is hardware. Thus, rapid display of the element distribution image is achieved easily.
- element distribution in the sample S is obtained by using an ROI, then an area on the sample S where the intensity of characteristic X-rays whose energy is not included in already set-up ROIs is high is specified, then a spectrum of the characteristic X-rays obtained from the specified area is generated, and thereby an element for which an ROI is not set up is identified from the generated spectrum.
- the intensity of characteristic X-rays not caused by the elements for which an ROI is already set up is high.
- the area where characteristic X-rays are to be acquired is limited to an area where a new element is able to be contained.
- the ratio of the area where a new element is contained to the area where characteristic X-rays are to be acquired becomes relatively large. Accordingly, in the spectrum of the characteristic X-rays, the peak caused by a new element becomes relatively large. That is, the peak of a trace element buried in the background or among other peaks in the spectrum of characteristic X-rays obtained from the entirety of the sample S becomes a detectable peak. Thus, identification of the trace element becomes easy. Further, the X-ray analyzer sets an ROI corresponding to the identified element and then obtains element distribution. Thus, even when the identified trace element is inhomogeneously distributed, distribution of the trace element is allowed to be obtained.
- the X-ray analyzer repeats specification of an area, generation of a spectrum of characteristic X-rays, identification of an element, setting of an ROI, scan of the sample, and obtaining element distribution. Unintended omission of setting of an ROI is avoided and hence the elements including trace elements contained in the sample S are allowed to be covered as much as possible. Since distribution of trace elements is allowed to be obtained from the detection result of characteristic X-rays, time and effort become unnecessary that have been necessary for obtaining distribution of trace elements on the basis of an image other than an element distribution image. Thus, in the present invention, element distribution covering as much as possible the elements contained in the sample S is allowed to be obtained easily and rapidly.
- the CPU 31 may generate a spectrum of characteristic X-rays within an energy range excluding the already set-up ROIs.
- the spectrum in this case does not include the number of counts of the characteristic X-rays corresponding to the already set-up ROIs and hence does not include the peaks caused by the already identified elements.
- the peak caused by the element appears more clearly in the spectrum.
- the present embodiment has been described for a mode that scan of the sample S is repeated in the processing of steps S1 to S11.
- the X-ray analyzer may be in a mode that the number of times of scanning the sample S is reduced.
- the X-ray analyzer may be in a mode that the data obtained when the sample S is scanned at step S1 is stored into the storage unit 34 and then the processing at and after step S2 is executed on the basis of the stored data.
- the X-ray analyzer executes the processing of generation of a spectrum, identification of an element, obtaining element distribution, and the like.
- the X-ray analyzer is allowed to easily and rapidly obtain element distribution covering as much as possible the elements contained in the sample S.
- the present embodiment has been described for a mode that the X-ray analyzer displays an element distribution image.
- the X-ray analyzer may be in a mode that the element distribution image is not displayed.
- the X-ray analyzer may be in a mode that the element distribution image is not displayed and that information indicating the situation of progress of the processing such as the names of identified elements and the number of identified elements is displayed on the display unit 36.
- the present embodiment has been described for a mode that the X-ray detector 13 is arranged at a position intersecting with the axis of an electron beam.
- the X-ray analyzer may be in a mode that the X-ray detector 13 is arranged at another position.
- the X-ray analyzer may be in a mode that the X-ray detector 13 is arranged on the side of the electron lens system 12.
- the present embodiment has been described for a mode of energy dispersive X-ray analyzer type in which characteristic X-rays are detected with being separated depending on the energy.
- the X-ray analyzer may be in a mode of wavelength dispersive X-ray analyzer in which characteristic X-rays are detected with being separated depending on the wavelength.
- the X-ray analyzer generates a spectrum in which correspondence is established between the wavelength and the number of counts of the characteristic X-rays, and further performs the processing of setting as an ROI the wavelength range of the characteristic X-rays corresponding to a particular element.
- the X-ray detector 13 has been premised to be a semiconductor detector employing an SDD.
- the X-ray detector 13 may be a semiconductor detector other than an SDD and may be a detector other than a semiconductor detector.
- the signal processing unit 2 may be in a mode of executing a part of the processing of the control apparatus 3 described in the present embodiment.
- the control apparatus 3 may be in a mode of executing a part of the processing of the signal processing unit 2 describing in the present embodiment.
- the X-ray analyzer may be in a mode that the signal processing unit 2 and the control apparatus 3 are integrated with each other.
- the X-ray analyzer according to the present embodiment may be in a mode of being incorporated in an SEM (scanning electron microscope) or a TEM (transmission electron microscope).
- the X-ray analyzer includes: a detector detecting electrons such as backscattered electrons, secondary electrons, and transmission electrons; and a signal processor processing a signal from the detector. Further, in this mode, at the time that an area on the sample S corresponding to a portion where the intensity of characteristic X-rays whose energy is not included in the ROI is high is specified at step S7, the X-ray analyzer may perform the processing of specifying the area on the basis of the contrast in the intensity of backscattered electrons, secondary electrons, or transmission electrons.
- the present embodiment has been described for a mode that the sample S is scanned by using an electron beam.
- the X-ray analyzer may be in a mode that the sample S is scanned by using another beam.
- the X-ray analyzer may be in a mode that the sample S is scanned by using an X-ray beam.
- the X-ray analyzer includes an X-ray source in place of the electron gun 11, does not include the electron lens system 12, and includes means of moving the sample stage 14 in a horizontal direction. With projecting an X-ray beam onto the sample S, the X-ray analyzer moves the sample stage 14 so as to move the X-ray projection position and thereby scans the sample S with the X-ray beam.
- the X-ray detector 13 detects X-ray fluorescence generated in the sample S. Further, the X-ray analyzer may be in a mode that the sample S is scanned by using a charged-particle beam. Also in these modes, the X-ray analyzer is allowed to obtain element distribution covering as much as possible the elements contained in the sample S.
Landscapes
- Physics & Mathematics (AREA)
- Health & Medical Sciences (AREA)
- Life Sciences & Earth Sciences (AREA)
- Chemical & Material Sciences (AREA)
- Analytical Chemistry (AREA)
- Biochemistry (AREA)
- General Health & Medical Sciences (AREA)
- General Physics & Mathematics (AREA)
- Immunology (AREA)
- Pathology (AREA)
- Analysing Materials By The Use Of Radiation (AREA)
Abstract
Description
- The present invention relates to an X-ray analyzer scanning a sample with a beam, then detecting X-rays generated on the sample, and thereby obtaining element distribution in the sample.
- X-ray analysis is a technique of analysis in which a beam of electron rays, X-rays, or the like is projected onto a sample, then characteristic X-rays or X-ray fluorescence generated on the sample are detected, and then from a spectrum of characteristic X-rays or X-ray fluorescence, qualitative analysis or quantitative analysis of an element contained in the sample is performed. Further, when the characteristic X-rays or the X-ray fluorescence are detected with scanning the sample with the beam, distribution of the element contained in the sample is obtained. The X-ray analyzer employing an electron beam is incorporated in an electron microscope in some cases. Patent Document 1 discloses an example of a technique of generating element distribution image by X-ray analysis.
- In the conventional art, when element distribution is to be obtained, an ROI (region of interest) is set up which is an energy range of characteristic X-rays or X-ray fluorescence corresponding to a particular element. Then, intensity distribution of characteristic X-rays or X-ray fluorescence whose energy is included in the ROI is acquired so that distribution of each element is acquired. Further, when distribution of a trace element inhomogeneously distributed on a sample is to be obtained, positioning of an area where the trace element is inhomogeneously distributed has been performed on the basis of an image other than an element distribution image, like an electron microscope image and an optical microscope image of the sample.
- Patent Document 1: Japanese Patent Publication No.
3654551 - In a conventional method, element distribution is obtained after an ROI is set up in advance. Thus, element distribution cannot be acquired for an element for which an ROI is not set up. An ROI is allowed to be set up manually after the spectrum of characteristic X-rays or X-ray fluorescence is checked. Nevertheless, it is difficult to find a signal of a trace element from the spectrum. Thus, it is difficult to acquire element distribution of a trace element. Further, in a method of positioning based on an image other than an element distribution image, the work of generating an image other than an element distribution image, performing the positioning on the basis of the image, generating a spectrum, and checking the spectrum need be repeated until a trace element is found. This has caused a problem of time and effort. Further, the contents of obtained information are different between an element distribution image and an image other than an element distribution image. Thus, it is not ensured that an area where a trace element is inhomogeneously distributed is allowed to be identified on the basis of an image other than an element distribution image. Accordingly, in the conventional method, it is difficult to rapidly obtain element distribution covering the entire elements contained in the sample.
- The present invention has been devised in view of such situations. An object thereof is to provide an X-ray analyzer that repeats setting of an ROI and identification of an element on the basis of characteristic X-rays or X-ray fluorescence whose intensity is high in the outside of the ROI and that thereby rapidly obtains element distribution covering as much as possible the elements contained in a sample.
- An X-ray analyzer according to the present invention, which scans a sample with a beam, detects X-rays generated on the sample by the scanning, and obtains distribution of an element contained in the sample on the basis of the detection result, the X-ray analyzer is characterized by comprising: element distribution obtaining means for, from the detection result of the X-rays generated in an area on the sample scanned with the beam, obtaining intensity distribution of the X-rays whose energy or wavelength is included in a range of energy or wavelength set up in correspondence to an element contained in the sample and thereby obtaining distribution of the element; means for acquiring intensity distribution of X-rays whose energy or wavelength is not included in the range; means for generating a spectrum of X-rays generated in an area on the sample corresponding to a portion where the intensity of X-rays is not less than a predetermined intensity in the acquired intensity distribution; element identification means for identifying an element contained in the sample on the basis of a peak included in the generated spectrum; and setting means for setting a range of energy or wavelength of X-rays corresponding to the element identified by the element identification means, wherein the element distribution generation means includes means for, in accordance with the range set by the setting means, obtaining distribution of the element identified by the element identification means.
- In the present invention, the X-ray analyzer obtains element distribution by using a range of energy or wavelength having been set up, then generates a spectrum of X-rays obtained from an area on the sample where the intensity of X-rays whose energy or wavelength is not included in the already set-up range is high, and then identifies a new element from the generated spectrum. Further, the X-ray analyzer sets a range of energy or wavelength corresponding to the identified element and then obtains element distribution by using the set-up range. As such, the X-ray analyzer repeats generation of an X-ray spectrum, identification of an element, setting of a range of energy or wavelength, and obtaining element distribution.
- The X-ray analyzer according to the present invention is characterized by further comprising means for displaying an image representing the distribution of the element at each time that the element distribution obtaining means obtains the distribution.
- In the present invention, at each time of obtaining element distribution, the X-ray analyzer displays an element distribution image representing element distribution and then the user checks the distribution of each element contained in the sample.
- In the present invention, distribution of a trace element is allowed to be obtained from a detection result of X-rays generated on a sample. Thus, time and effort necessary for obtaining element distribution are reduced and element distribution covering as much as possible the elements contained in the sample is obtained rapidly. Such excellent effects are provided by the present invention.
-
- [
FIG. 1] FIG. 1 is a block diagram illustrating a configuration of an X-ray analyzer. - [
FIG. 2] FIG. 2 is a block diagram illustrating an internal configuration of a control apparatus. - [
FIG. 3] FIG. 3 is a characteristics diagram indicating an example of a spectrum of characteristic X-rays. - [
FIG. 4] FIG. 4 is a characteristics diagram illustrating an example of an ROI. - [
FIG. 5] FIG. 5 is a flow chart illustrating a procedure of processing executed by an X-ray analyzer. - [
FIG. 6A] FIG. 6A is a schematic diagram illustrating an example of an element distribution image. - [
FIG. 6B] FIG. 6B is a schematic diagram illustrating an example of an element distribution image. - [
FIG. 6C] FIG. 6C is a schematic diagram illustrating an example of an element distribution image. - [
FIG. 7] FIG. 7 is a schematic diagram illustrating an example of intensity distribution of characteristic X-rays whose energy is not included in an ROI. - [
FIG. 8] FIG. 8 is a characteristics diagram illustrating an example of a spectrum of characteristic X-rays generated at step S9. - [
FIG. 9] FIG. 9 is a schematic diagram illustrating an example of a new element distribution image. - The present invention is described below in detail with reference to the drawings illustrating embodiments thereof.
-
FIG. 1 is a block diagram illustrating the configuration of an X-ray analyzer. The X-ray analyzer includes: anelectron gun 11 projecting an electron beam (beam) onto a sample S; anelectron lens system 12; and asample stage 14 on which the sample S is placed. Theelectron lens system 12 includes a scanning coil changing the direction of the electron beam and corresponds to scanning means of the present invention. Theelectron gun 11 and theelectron lens system 12 are connected to acontrol apparatus 3 controlling the entirety of the X-ray analyzer. Here, inFIG. 1 , the sample S having a planar shape is illustrated. However, the X-ray analyzer is allowed to measure a sample having another shape such as a spherical shape. - An
X-ray detector 13 is arranged between theelectron lens system 12 and thesample stages 14. TheX-ray detector 13 is formed in a shape having a hole through which the electron beam passes. Further, theX-ray detector 13 configured by including an SDD (Silicon Drift Detector) as an X-ray sensor. For example, theX-ray detector 13 has a configuration that a plurality of SDDs are mounted on a board in which a hole is formed and then the plurality of SDDs are arranged around the hole.FIG. 1 illustrates a cross section of theX-ray detector 13. TheX-ray detector 13 is arranged at a position that the electron beam passes through the hole, and arranged in a manner that the axis of the electron beam is perpendicular to the X-ray incident surface. Further, a cooling device (not illustrated) such as a Peltier device is attached to theX-ray detector 13. In a state that the sample S is placed on thesample stage 14, theX-ray detector 13 is arranged in front of the surface of the sample S onto which the electron beam is projected. In accordance with a control signal from thecontrol apparatus 3, theelectron gun 11 emits an electron beam and then theelectron lens system 12 sets forth the direction of the electron beam, so that the electron beam pass through the hole of theX-ray detector 13 and then are projected onto the sample S on thesample stage 14. On the sample S, characteristic X-rays are generated at a portion onto which the electron beam is projected. Then, the generated characteristic X-rays are detected by theX-ray detector 13. InFIG. 1 , the electron beam is indicated by a solid-line arrow and the characteristic X-rays are indicated by dashed-line arrows. TheX-ray detector 13 outputs a signal proportional to the energy of the detected characteristic X-ray. In the configuration of the X-ray analyzer, at least theelectron gun 11, theelectron lens system 12, theX-ray detector 13, and thesample stage 14 are placed in a vacuum chamber (not illustrated). The vacuum chamber is constructed from a material shielding electron rays and X-rays. Further, the inside of the vacuum chamber is kept at a vacuum during the operation of the X-ray analyzer. - A
signal processing unit 2 processing the outputted signal is connected to theX-ray detector 13. Thesignal processing unit 2 receives the signals outputted by theX-ray detector 13 and then performs the processing of counting the signals of each value and then acquiring the relation between the energy and the number of counts of the characteristic X-rays detected by theX-ray detector 13, that is, a spectrum of the characteristic X-rays. Thesignal processing unit 2 is connected to thecontrol apparatus 3. Theelectron lens system 12 sequentially changes the direction of the electron beam so that the electron beam is projected onto the sample S in a manner of scanning the sample S. When the electron beam scan the sample S, the electron beam is sequentially projected onto each portion within the scan area of the sample S. In association with the scan of the sample S with the electron beam, characteristic X-rays generated at each portion on the sample S are sequentially detected by theX-ray detector 13. Thesignal processing unit 2 sequentially performs signal processing so as to sequentially generate a spectrum of characteristic X-rays generated at each portion on the sample S. Thesignal processing unit 2 sequentially outputs to thecontrol apparatus 3 the data of the generated spectrum of the characteristic X-rays. -
FIG. 2 is a block diagram illustrating the internal configuration of thecontrol apparatus 3. Thecontrol apparatus 3 is configured by employing a computer such as a personal computer. Thecontrol apparatus 3 includes: a CPU (Central Processing Unit) 31 performing arithmetic operation; a RAM (Random Access Memory) 32 storing temporary data generated in association with the arithmetic operation; adrive unit 33 reading information from arecording medium 4 such as an optical disc; and anonvolatile storage unit 34 such as a hard disk. Further, thecontrol apparatus 3 includes: anoperation unit 35 such as a keyboard and a mouse receiving operation by a user; adisplay unit 36 such as a liquid crystal display; and aninterface unit 37. Theinterface unit 37 is connected to theelectron gun 11, theelectron lens system 12, and thesignal processing unit 2. TheCPU 31 causes thedrive unit 33 to read acomputer program 41 recorded on therecording medium 4 and then causes thestorage unit 34 to store the read-outcomputer program 41. Thecomputer program 41 is loaded from thestorage unit 34 to theRAM 32 when necessary. Then, in accordance with the loadedcomputer program 41, theCPU 31 executes the processing necessary for the X-ray analyzer. Here, thecomputer program 41 may be downloaded from the outside of thecontrol apparatus 3. Thecontrol apparatus 3 receives through theinterface unit 37 the data of the spectrum of characteristic X-rays outputted from thesignal processing unit 2, and then stores the data into thestorage unit 34. Further, thecontrol apparatus 3 controls the operation of theelectron lens system 12 connected to theinterface unit 37. - An element contained in the sample S is identified from the spectrum of characteristic X-rays obtained on the sample S.
FIG. 3 is a characteristics diagram indicating an example of the spectrum of characteristic X-rays. The horizontal axis in the figure indicates the energy and the vertical axis indicates the number of counts of characteristic X-rays for each energy. The spectrum illustrated inFIG. 3 includes peaks indicated by A, B, and C. The energy of each peak caused by various elements is known in advance. Thus, when the energy of the peak caused by each element is compared with the energy of a peak included in the spectrum, an element corresponding to the peak included in the spectrum is identified. The identified element is contained in the sample S. The peak indicated by A is premised to be caused by element A, the peak indicated by B is premised to be caused by element B, and the peak indicated by C is premised to be caused by element C. - After the element has been identified, setting of an ROI is allowed.
FIG. 4 is a characteristics diagram illustrating an example of an ROI. Among the energies of the characteristic X-rays, a range of energy where the intensity of the peak of element A is not less than the intensity of the background signal is set up as the ROI of element A. The ROI of element B and the ROI of element C are set up similarly. Here, the energy range set up as the ROI may be set forth by another method like the half-value width of each peak is set up as the energy width of the ROI. -
FIG. 5 is a flow chart illustrating a procedure of the processing executed by the X-ray analyzer. The user identifies in advance an element contained in the sample S from the spectrum of characteristic X-rays obtained in advance. Then, the user operates theoperation unit 35 so as to set up in advance an ROI corresponding to the identified element. The data indicating the ROI set up in advance is stored in thestorage unit 34. However, even in a state that the ROI is not set up in advance, the X-ray analyzer is allowed to execute the following processing. In response to a trigger such as an instruction generated by operation of the user and then received through theoperation unit 35, theCPU 31 transmits a control signal from theinterface unit 37 to theelectron gun 11 and theelectron lens system 12 so that the X-ray analyzer starts the processing. Theelectron gun 11 emits an electron beam and then theelectron lens system 12 adjusts the direction of the electron beam in accordance with the control from thecontrol apparatus 3, so that the sample S is scanned with the electron beam and then theX-ray detector 13 detects the characteristic X-rays (S1). Theelectron lens system 12 two dimensionally scans an area of set-forth size on the sample S. TheX-ray detector 13 outputs, to thesignal processing unit 2, signals corresponding to the energies of the detected characteristic X-rays. With the progress of the scanning, thesignal processing unit 2 sequentially generates a spectrum of characteristic X-rays generated at each portion on the sample S. Further, theCPU 31 reads from thestorage unit 34 the data indicating the already set-up ROI and then outputs the data from theinterface unit 37 to thesignal processing unit 2. Then, thesignal processing unit 2 receives the data indicating the ROI. - From the generated spectrum of the characteristic X-rays, the
signal processing unit 2 acquires the number of counts of characteristic X-rays whose energy is included in the ROI indicated by the received data, then establishes correspondence between the acquired number of counts and each portion on the sample S where the characteristic X-rays have been generated, and thereby obtains distribution of the element for which the ROI has been set up (S2). In a case that ROIs of a plurality of elements are set up, by using the number of counts of the characteristic X-rays whose energy is included in each ROI, thesignal processing unit 2 obtains element distribution for each element. Thesignal processing unit 2 outputs the data of the obtained element distribution to thecontrol apparatus 3. Thecontrol apparatus 3 receives the data of element distribution through theinterface unit 37. Then, theCPU 31 stores the data of element distribution into thestorage unit 34. Here, in a case that completely no ROI is set up, the processing of step S2 is skipped. Then, from the spectrum of the characteristic X-rays, thesignal processing unit 2 acquires the number of counts of characteristic X-rays whose energy is not included in the already set-up ROI, then establishes correspondence between the acquired the number of counts and each portion on the sample S where the characteristic X-rays have been generated, and thereby obtains intensity distribution of the characteristic X-rays whose energy is not included in the already set-up ROI (S3). - Then, the
CPU 31 causes thedisplay unit 36 to displays an element distribution image representing the element distribution generated at step S2 (S4). The element distribution image is an image in which the amount of each element contained at each portion on the sample S is represented.FIGS. 6A, 6B and 6C are schematic diagrams each illustrating an example of the element distribution image.FIG. 6A illustrates the distribution of element A,FIG. 6B illustrates the distribution of element B, andFIG. 6C illustrates the distribution of element C. Each hatched portion in the figures indicates a portion where the intensity of the characteristic X-rays caused by each element on the sample S is high, that is, an area where the content of each element on the sample S is high. At step S4, an element distribution image illustrated inFIG. 6A, 6B, or 6C is displayed on thedisplay unit 36. Here, inFIGS. 6A, 6B, and 6C , the plurality of element distribution images are illustrated individually. However, the X-ray analyzer may be in a mode that an element distribution image in which the distribution of the plurality of elements are represented as one image is displayed. Here, in a case that completely no ROI is set up, theCPU 31 does not display the element distribution image on thedisplay unit 36. - Then, in accordance with given conditions, for example, whether an instruction of termination inputted to by operation of the user has been received through the
operation unit 35, whether distribution of elements has been obtained in a number set forth in advance, and whether a given time set forth in advance has been elapsed, theCPU 31 determines whether the processing is to be continued (S5). When the processing is not to be continued (S5: NO), theCPU 31 terminates the processing. When the processing is to be continued (S5: YES), in accordance with given conditions, for example, whether distributions of elements of a predetermined number has been obtained, theCPU 31 determines whether detection of a new element in addition to the already identified elements is to be performed (S6). When it is determined that detection of a new element is not to be performed (S6: NO), theCPU 31 returns the processing to step S1 so as to repeat scanning. - When it is determined that detection of a new element is to be performed (S6: YES), then, the
signal processing unit 2 specifies an area on the sample S corresponding to the portion where the intensity of the characteristic X-rays is higher than a predetermined intensity in the intensity distribution obtained at step S3 (S7). The employed predetermined intensity may be a constant value set forth in advance or alternatively a value obtained by averaging the intensity of the characteristic X-rays included in the intensity distribution.FIG. 7 is a schematic diagram illustrating an example of the intensity distribution of characteristic X-rays whose energy is not included in the ROI. The hatched portion in the figure indicates a portion where the intensity of the characteristic X-rays is high and corresponds to the area specified at step S7. In the example illustrated inFIG. 7 , the intensity of the characteristic X-rays is low in the portions corresponding to the areas where the content of element A illustrated inFIG. 6A , element B illustrated inFIG. 6B , and element C illustrated inFIG. 6C is high. In the areas specified at step S7, the intensity of the characteristic X-rays not caused by the already identified elements is high. Thus, a probability is present that an element different from the already identified elements is contained. - Then, the
CPU 31 causes theelectron gun 11 and theelectron lens system 12 to operate so as to scan the sample S with the electron beam. Then, theX-ray detector 13 detects the characteristic X-rays (S8). Thesignal processing unit 2 sequentially generates spectra of the characteristic X-rays detected by theX-ray detector 13, then integrates the spectra of the characteristic X-rays generated from each portion of the area specified at step S7, and thereby generates a spectrum of the characteristic X-rays generated in the specified area on the sample S at a stage of termination of the scan (S9). Here, the spectrum may be generated by averaging the plurality of spectra of the characteristics X-rays. Thesignal processing unit 2 outputs the data of the spectrum to thecontrol apparatus 3. Thecontrol apparatus 3 receives the data of element distribution through theinterface unit 37. Then, theCPU 31 stores the data of the spectrum into thestorage unit 34. The generated spectrum of the characteristic X-rays is a spectrum corresponding to the content of elements contained in the area of the sample S specified at step S7. -
FIG. 8 is a characteristics diagram illustrating an example of the spectrum of characteristic X-rays generated at step S9. Characteristic X-rays from the area where the content of the already identified elements is high is not included. Thus, the intensities of the peaks caused by element A, element B, and element C are small. Further, the spectrum is a spectrum of characteristic X-rays from an area having a possibility that an element different from the already identified elements is contained. Thus, when an element different from the already identified elements is contained in the sample S, a peak caused by the element is included in the spectrum. The peak caused by the element different from the already identified elements appears as a relatively large peak. InFIG. 8 , a peak not related to any of element A, element B, and element C is indicated by D. The peak indicated by D is premised to be a peak caused by element D. - Then, on the basis of the peak included in the generated spectrum of the characteristic X-rays, the
CPU 31 performs the processing of identifying a new element contained in the sample S (S10). Thestorage unit 34 stores in advance the data recording the energies of characteristic X-rays corresponding to various elements. At step S10, theCPU 31 detects a peak included in the spectrum of the characteristic X-rays and then specifies the energy of the detected peak. TheCPU 31 compares the specified energy with the energies of characteristic X-rays corresponding to various elements and thereby identifies the element. For example, element D causing the peak indicated by D inFIG. 8 is identified. - Then, the
CPU 31 sets up a new ROI which is an energy range of characteristic X-rays corresponding to the newly identified element (S11). Specifically, theCPU 31 sets as an ROI an energy range that includes the peak in the spectrum used for identifying the element. Here, the energy range set up as the ROI may be set forth by another method like the half-value width of each peak is set up as the energy width of the ROI. At step S11, for example, the ROI of element D is set up. - Then, the
CPU 31 returns the processing to step S1. At that time, theCPU 31 outputs the data indicating the ROI set up at step S11, from theinterface unit 37 to thesignal processing unit 2. Then, thesignal processing unit 2 receives the data indicating the ROI. After that, at step S2, on the basis of the newly set-up ROI, element distribution of the newly identified element in the sample S is obtained. Then, at step S4, the new element distribution image is displayed on thedisplay unit 36.FIG. 9 is a schematic diagram illustrating an example of the new element distribution image. InFIG. 9 , the distribution of element D different from any of element A, element B, and element C is illustrated. The hatched portion in the figure indicates an area where the content of element D in the sample S is high. The distribution of element D having a lower content and inhomogeneously distributed in a smaller area than element A, element B, and element C is obtained. - When the processing of steps S1 to S11 is repeated, elements contained in the sample S are identified sequentially. Then, element distribution images of the identified element is sequentially displayed on the
display unit 36. The user is allowed to check the displayed element distribution image. At a stage that an appropriately number of elements have been identified and then the element distribution images have been displayed, the user is allowed to operate theoperation unit 35 so as to terminate the processing of the X-ray analyzer. Further, generation of the spectrum of characteristic X-rays and obtaining element distribution are executed by thesignal processing unit 2 which is hardware. Thus, rapid display of the element distribution image is achieved easily. - As described above, in the X-ray analyzer of the present invention, element distribution in the sample S is obtained by using an ROI, then an area on the sample S where the intensity of characteristic X-rays whose energy is not included in already set-up ROIs is high is specified, then a spectrum of the characteristic X-rays obtained from the specified area is generated, and thereby an element for which an ROI is not set up is identified from the generated spectrum. In the specified area, the intensity of characteristic X-rays not caused by the elements for which an ROI is already set up is high. Thus, it is possible that a new element is contained. The area where characteristic X-rays are to be acquired is limited to an area where a new element is able to be contained. Thus, the ratio of the area where a new element is contained to the area where characteristic X-rays are to be acquired becomes relatively large. Accordingly, in the spectrum of the characteristic X-rays, the peak caused by a new element becomes relatively large. That is, the peak of a trace element buried in the background or among other peaks in the spectrum of characteristic X-rays obtained from the entirety of the sample S becomes a detectable peak. Thus, identification of the trace element becomes easy. Further, the X-ray analyzer sets an ROI corresponding to the identified element and then obtains element distribution. Thus, even when the identified trace element is inhomogeneously distributed, distribution of the trace element is allowed to be obtained. Further, the X-ray analyzer repeats specification of an area, generation of a spectrum of characteristic X-rays, identification of an element, setting of an ROI, scan of the sample, and obtaining element distribution. Unintended omission of setting of an ROI is avoided and hence the elements including trace elements contained in the sample S are allowed to be covered as much as possible. Since distribution of trace elements is allowed to be obtained from the detection result of characteristic X-rays, time and effort become unnecessary that have been necessary for obtaining distribution of trace elements on the basis of an image other than an element distribution image. Thus, in the present invention, element distribution covering as much as possible the elements contained in the sample S is allowed to be obtained easily and rapidly.
- Here, in the processing executed by the X-ray analyzer, at step S9, the
CPU 31 may generate a spectrum of characteristic X-rays within an energy range excluding the already set-up ROIs. The spectrum in this case does not include the number of counts of the characteristic X-rays corresponding to the already set-up ROIs and hence does not include the peaks caused by the already identified elements. Thus, when an element different from the already identified elements is contained in the sample S, the peak caused by the element appears more clearly in the spectrum. - Further, the present embodiment has been described for a mode that scan of the sample S is repeated in the processing of steps S1 to S11. However, the X-ray analyzer may be in a mode that the number of times of scanning the sample S is reduced. For example, the X-ray analyzer may be in a mode that the data obtained when the sample S is scanned at step S1 is stored into the
storage unit 34 and then the processing at and after step S2 is executed on the basis of the stored data. In this mode, without executing the scan at step S8, on the basis of the data stored in thestorage unit 34, the X-ray analyzer executes the processing of generation of a spectrum, identification of an element, obtaining element distribution, and the like. Also in this mode, the X-ray analyzer is allowed to easily and rapidly obtain element distribution covering as much as possible the elements contained in the sample S. - Further, the present embodiment has been described for a mode that the X-ray analyzer displays an element distribution image. However, the X-ray analyzer may be in a mode that the element distribution image is not displayed. For example, the X-ray analyzer may be in a mode that the element distribution image is not displayed and that information indicating the situation of progress of the processing such as the names of identified elements and the number of identified elements is displayed on the
display unit 36. - Further, the present embodiment has been described for a mode that the
X-ray detector 13 is arranged at a position intersecting with the axis of an electron beam. However, the X-ray analyzer may be in a mode that theX-ray detector 13 is arranged at another position. For example, the X-ray analyzer may be in a mode that theX-ray detector 13 is arranged on the side of theelectron lens system 12. Further, the present embodiment has been described for a mode of energy dispersive X-ray analyzer type in which characteristic X-rays are detected with being separated depending on the energy. However, the X-ray analyzer may be in a mode of wavelength dispersive X-ray analyzer in which characteristic X-rays are detected with being separated depending on the wavelength. In this mode, the X-ray analyzer generates a spectrum in which correspondence is established between the wavelength and the number of counts of the characteristic X-rays, and further performs the processing of setting as an ROI the wavelength range of the characteristic X-rays corresponding to a particular element. Further, in the present embodiment, theX-ray detector 13 has been premised to be a semiconductor detector employing an SDD. However, theX-ray detector 13 may be a semiconductor detector other than an SDD and may be a detector other than a semiconductor detector. - Further, the
signal processing unit 2 may be in a mode of executing a part of the processing of thecontrol apparatus 3 described in the present embodiment. Further, thecontrol apparatus 3 may be in a mode of executing a part of the processing of thesignal processing unit 2 describing in the present embodiment. Further, the X-ray analyzer may be in a mode that thesignal processing unit 2 and thecontrol apparatus 3 are integrated with each other. Further, the X-ray analyzer according to the present embodiment may be in a mode of being incorporated in an SEM (scanning electron microscope) or a TEM (transmission electron microscope). In this mode, for the SEM or TEM application, the X-ray analyzer includes: a detector detecting electrons such as backscattered electrons, secondary electrons, and transmission electrons; and a signal processor processing a signal from the detector. Further, in this mode, at the time that an area on the sample S corresponding to a portion where the intensity of characteristic X-rays whose energy is not included in the ROI is high is specified at step S7, the X-ray analyzer may perform the processing of specifying the area on the basis of the contrast in the intensity of backscattered electrons, secondary electrons, or transmission electrons. - Further, the present embodiment has been described for a mode that the sample S is scanned by using an electron beam. However, the X-ray analyzer may be in a mode that the sample S is scanned by using another beam. For example, the X-ray analyzer may be in a mode that the sample S is scanned by using an X-ray beam. In this mode, the X-ray analyzer includes an X-ray source in place of the
electron gun 11, does not include theelectron lens system 12, and includes means of moving thesample stage 14 in a horizontal direction. With projecting an X-ray beam onto the sample S, the X-ray analyzer moves thesample stage 14 so as to move the X-ray projection position and thereby scans the sample S with the X-ray beam. TheX-ray detector 13 detects X-ray fluorescence generated in the sample S. Further, the X-ray analyzer may be in a mode that the sample S is scanned by using a charged-particle beam. Also in these modes, the X-ray analyzer is allowed to obtain element distribution covering as much as possible the elements contained in the sample S. -
- 11
- Electron gun
- 12
- Electron lens system
- 13
- X-ray detector
- 14
- Sample stage
- 2
- Signal processing unit
- 3
- Control apparatus
- 31
- CPU
- 34
- Storage unit
- 36
- Display unit
Claims (2)
- An X-ray analyzer which scans a sample with a beam, detects X-rays generated on the sample by the scanning, and obtains distribution of an element contained in the sample on the basis of the detection result, comprising:element distribution obtaining means for, from the detection result of the X-rays generated in an area on the sample scanned with the beam, obtaining intensity distribution of the X-rays whose energy or wavelength is included in a range of energy or wavelength set up in correspondence to an element contained in the sample and thereby obtaining distribution of the element;means for acquiring intensity distribution of X-rays whose energy or wavelength is not included in the range;means for generating a spectrum of X-rays generated in an area on the sample corresponding to a portion where the intensity of X-rays is not less than a predetermined intensity in the acquired intensity distribution;element identification means for identifying an element contained in the sample on the basis of a peak included in the generated spectrum; andsetting means for setting a range of energy or wavelength of X-rays corresponding to the element identified by the element identification means,wherein the element distribution generation means includesmeans for, in accordance with the range set by the setting means, obtaining distribution of the element identified by the element identification means.
- The X-ray analyzer according to claim 1, further comprising
means for displaying an image representing the distribution of the element at each time that the element distribution obtaining means obtains the distribution.
Applications Claiming Priority (2)
| Application Number | Priority Date | Filing Date | Title |
|---|---|---|---|
| JP2011270690 | 2011-12-09 | ||
| PCT/JP2012/081437 WO2013084905A1 (en) | 2011-12-09 | 2012-12-05 | X-ray analysis device |
Publications (4)
| Publication Number | Publication Date |
|---|---|
| EP2790016A1 true EP2790016A1 (en) | 2014-10-15 |
| EP2790016A8 EP2790016A8 (en) | 2014-12-03 |
| EP2790016A4 EP2790016A4 (en) | 2015-08-05 |
| EP2790016B1 EP2790016B1 (en) | 2017-07-19 |
Family
ID=48574263
Family Applications (1)
| Application Number | Title | Priority Date | Filing Date |
|---|---|---|---|
| EP12856326.9A Not-in-force EP2790016B1 (en) | 2011-12-09 | 2012-12-05 | X-ray analysis device |
Country Status (4)
| Country | Link |
|---|---|
| US (1) | US9250201B2 (en) |
| EP (1) | EP2790016B1 (en) |
| JP (1) | JP6010547B2 (en) |
| WO (1) | WO2013084905A1 (en) |
Families Citing this family (4)
| Publication number | Priority date | Publication date | Assignee | Title |
|---|---|---|---|---|
| DE112015000841T5 (en) * | 2014-02-18 | 2016-11-03 | Horiba, Ltd. | X-ray analysis device and computer program |
| US9933375B2 (en) * | 2015-09-25 | 2018-04-03 | Olympus Scientific Solutions Americas, Inc. | XRF/XRD system with dynamic management of multiple data processing units |
| CN107941830A (en) * | 2017-12-27 | 2018-04-20 | 钢研纳克检测技术股份有限公司 | The distributional analysis Image Acquisition and data handling system of Xray fluorescence spectrometer |
| WO2020059439A1 (en) * | 2018-09-19 | 2020-03-26 | 株式会社堀場製作所 | Element detection method, element detection device, and computer program |
Family Cites Families (10)
| Publication number | Priority date | Publication date | Assignee | Title |
|---|---|---|---|---|
| US5408098A (en) * | 1993-09-10 | 1995-04-18 | International Business Machines Corporation | Method and apparatus for detecting low loss electrons in a scanning electron microscope |
| US5578823A (en) * | 1994-12-16 | 1996-11-26 | Hitachi, Ltd. | Transmission electron microscope and method of observing element distribution by using the same |
| JP3654551B2 (en) | 1997-03-20 | 2005-06-02 | 株式会社堀場製作所 | Energy dispersive X-ray microanalyzer |
| JP3687541B2 (en) * | 1999-01-04 | 2005-08-24 | 株式会社日立製作所 | Element mapping apparatus, scanning transmission electron microscope, and element mapping method |
| US6909770B2 (en) * | 2001-12-05 | 2005-06-21 | The United States Of America As Represented By The United States National Aeronautics And Space Administration | Methods for identification and verification using vacuum XRF system |
| US7245696B2 (en) * | 2002-05-29 | 2007-07-17 | Xradia, Inc. | Element-specific X-ray fluorescence microscope and method of operation |
| CN103776855B (en) * | 2008-02-06 | 2017-05-31 | Fei 公司 | The method and system of modal data analysis |
| JP2009250867A (en) * | 2008-04-09 | 2009-10-29 | Jeol Ltd | X-ray analyzer with energy dispersive x-ray spectrometer |
| JP5425482B2 (en) * | 2009-01-16 | 2014-02-26 | 日本電子株式会社 | Analysis method and X-ray analyzer using energy dispersive X-ray spectrometer |
| JP2011038939A (en) * | 2009-08-13 | 2011-02-24 | Jeol Ltd | Spectrum classification method and apparatus of energy-dispersive x-ray spectroscope |
-
2012
- 2012-12-05 EP EP12856326.9A patent/EP2790016B1/en not_active Not-in-force
- 2012-12-05 WO PCT/JP2012/081437 patent/WO2013084905A1/en not_active Ceased
- 2012-12-05 JP JP2013548254A patent/JP6010547B2/en active Active
- 2012-12-05 US US14/359,436 patent/US9250201B2/en not_active Expired - Fee Related
Also Published As
| Publication number | Publication date |
|---|---|
| EP2790016B1 (en) | 2017-07-19 |
| JP6010547B2 (en) | 2016-10-19 |
| WO2013084905A1 (en) | 2013-06-13 |
| EP2790016A8 (en) | 2014-12-03 |
| JPWO2013084905A1 (en) | 2015-04-27 |
| US9250201B2 (en) | 2016-02-02 |
| US20150083909A1 (en) | 2015-03-26 |
| EP2790016A4 (en) | 2015-08-05 |
Similar Documents
| Publication | Publication Date | Title |
|---|---|---|
| KR101399505B1 (en) | Frame accumulation scanning method for energy dispersive x-ray fluorescence spectrometer | |
| US8748816B2 (en) | Clustering of multi-modal data | |
| JP6769402B2 (en) | Electron microanalyzer and data processing program | |
| TWI739196B (en) | Pattern measuring method, measuring system, and computer readable medium | |
| EP2511937A1 (en) | Electron microscope | |
| EP3518271A1 (en) | Scanning electron microscope and measurement method | |
| US9250201B2 (en) | X-ray analyzer | |
| US20190035597A1 (en) | Scanning electron microscope and image processing apparatus | |
| US8853629B2 (en) | Cross-section processing and observation method and cross-section processing and observation apparatus | |
| KR20230142591A (en) | High-resolution X-ray spectroscopy surface material analysis | |
| US11940397B2 (en) | Radiation detection device, recording medium, and positioning method | |
| US8450685B2 (en) | Electron probe microanalyzer and data processing method implemented therein | |
| JP7018365B2 (en) | Charged particle beam device and analysis method | |
| EP2790015A1 (en) | X-ray analysis device | |
| US20150012229A1 (en) | Sample analysis apparatus, non-transitory computer-readable recording medium and sample analysis method | |
| JP7702450B2 (en) | Spectral processing device, sample analysis device, and spectrum processing method | |
| JP5248759B2 (en) | Particle beam analyzer | |
| JP6472434B2 (en) | X-ray analyzer and computer program | |
| KR102602005B1 (en) | charged particle beam device | |
| US20150109431A1 (en) | Systems and Methods for Material Texture Analysis | |
| KR102800691B1 (en) | Charged particle beam apparatus | |
| US12340972B2 (en) | Method for operating a particle beam microscope, particle beam microscope and computer program product | |
| EP4123299B1 (en) | Analyzer apparatus and method of image processing | |
| WO2025094225A1 (en) | Image processing method, program, image processing device, and imaging mass spectrometry device | |
| JPS62285050A (en) | Quantitative analysis by sample surface scan type analyzer |
Legal Events
| Date | Code | Title | Description |
|---|---|---|---|
| PUAI | Public reference made under article 153(3) epc to a published international application that has entered the european phase |
Free format text: ORIGINAL CODE: 0009012 |
|
| 17P | Request for examination filed |
Effective date: 20140505 |
|
| AK | Designated contracting states |
Kind code of ref document: A1 Designated state(s): AL AT BE BG CH CY CZ DE DK EE ES FI FR GB GR HR HU IE IS IT LI LT LU LV MC MK MT NL NO PL PT RO RS SE SI SK SM TR |
|
| RAP1 | Party data changed (applicant data changed or rights of an application transferred) |
Owner name: HORIBA, LTD. |
|
| DAX | Request for extension of the european patent (deleted) | ||
| RA4 | Supplementary search report drawn up and despatched (corrected) |
Effective date: 20150702 |
|
| RIC1 | Information provided on ipc code assigned before grant |
Ipc: G01N 23/223 20060101ALI20150626BHEP Ipc: G01N 23/225 20060101AFI20150626BHEP |
|
| 17Q | First examination report despatched |
Effective date: 20160826 |
|
| STAA | Information on the status of an ep patent application or granted ep patent |
Free format text: STATUS: EXAMINATION IS IN PROGRESS |
|
| GRAP | Despatch of communication of intention to grant a patent |
Free format text: ORIGINAL CODE: EPIDOSNIGR1 |
|
| STAA | Information on the status of an ep patent application or granted ep patent |
Free format text: STATUS: GRANT OF PATENT IS INTENDED |
|
| INTG | Intention to grant announced |
Effective date: 20170203 |
|
| GRAS | Grant fee paid |
Free format text: ORIGINAL CODE: EPIDOSNIGR3 |
|
| GRAA | (expected) grant |
Free format text: ORIGINAL CODE: 0009210 |
|
| STAA | Information on the status of an ep patent application or granted ep patent |
Free format text: STATUS: THE PATENT HAS BEEN GRANTED |
|
| AK | Designated contracting states |
Kind code of ref document: B1 Designated state(s): AL AT BE BG CH CY CZ DE DK EE ES FI FR GB GR HR HU IE IS IT LI LT LU LV MC MK MT NL NO PL PT RO RS SE SI SK SM TR |
|
| REG | Reference to a national code |
Ref country code: GB Ref legal event code: FG4D |
|
| REG | Reference to a national code |
Ref country code: CH Ref legal event code: EP |
|
| REG | Reference to a national code |
Ref country code: IE Ref legal event code: FG4D |
|
| REG | Reference to a national code |
Ref country code: AT Ref legal event code: REF Ref document number: 910863 Country of ref document: AT Kind code of ref document: T Effective date: 20170815 |
|
| REG | Reference to a national code |
Ref country code: DE Ref legal event code: R096 Ref document number: 602012034870 Country of ref document: DE |
|
| REG | Reference to a national code |
Ref country code: NL Ref legal event code: MP Effective date: 20170719 |
|
| REG | Reference to a national code |
Ref country code: LT Ref legal event code: MG4D |
|
| REG | Reference to a national code |
Ref country code: AT Ref legal event code: MK05 Ref document number: 910863 Country of ref document: AT Kind code of ref document: T Effective date: 20170719 |
|
| PG25 | Lapsed in a contracting state [announced via postgrant information from national office to epo] |
Ref country code: NO Free format text: LAPSE BECAUSE OF FAILURE TO SUBMIT A TRANSLATION OF THE DESCRIPTION OR TO PAY THE FEE WITHIN THE PRESCRIBED TIME-LIMIT Effective date: 20171019 Ref country code: HR Free format text: LAPSE BECAUSE OF FAILURE TO SUBMIT A TRANSLATION OF THE DESCRIPTION OR TO PAY THE FEE WITHIN THE PRESCRIBED TIME-LIMIT Effective date: 20170719 Ref country code: FI Free format text: LAPSE BECAUSE OF FAILURE TO SUBMIT A TRANSLATION OF THE DESCRIPTION OR TO PAY THE FEE WITHIN THE PRESCRIBED TIME-LIMIT Effective date: 20170719 Ref country code: SE Free format text: LAPSE BECAUSE OF FAILURE TO SUBMIT A TRANSLATION OF THE DESCRIPTION OR TO PAY THE FEE WITHIN THE PRESCRIBED TIME-LIMIT Effective date: 20170719 Ref country code: NL Free format text: LAPSE BECAUSE OF FAILURE TO SUBMIT A TRANSLATION OF THE DESCRIPTION OR TO PAY THE FEE WITHIN THE PRESCRIBED TIME-LIMIT Effective date: 20170719 Ref country code: AT Free format text: LAPSE BECAUSE OF FAILURE TO SUBMIT A TRANSLATION OF THE DESCRIPTION OR TO PAY THE FEE WITHIN THE PRESCRIBED TIME-LIMIT Effective date: 20170719 Ref country code: LT Free format text: LAPSE BECAUSE OF FAILURE TO SUBMIT A TRANSLATION OF THE DESCRIPTION OR TO PAY THE FEE WITHIN THE PRESCRIBED TIME-LIMIT Effective date: 20170719 |
|
| PG25 | Lapsed in a contracting state [announced via postgrant information from national office to epo] |
Ref country code: GR Free format text: LAPSE BECAUSE OF FAILURE TO SUBMIT A TRANSLATION OF THE DESCRIPTION OR TO PAY THE FEE WITHIN THE PRESCRIBED TIME-LIMIT Effective date: 20171020 Ref country code: RS Free format text: LAPSE BECAUSE OF FAILURE TO SUBMIT A TRANSLATION OF THE DESCRIPTION OR TO PAY THE FEE WITHIN THE PRESCRIBED TIME-LIMIT Effective date: 20170719 Ref country code: ES Free format text: LAPSE BECAUSE OF FAILURE TO SUBMIT A TRANSLATION OF THE DESCRIPTION OR TO PAY THE FEE WITHIN THE PRESCRIBED TIME-LIMIT Effective date: 20170719 Ref country code: LV Free format text: LAPSE BECAUSE OF FAILURE TO SUBMIT A TRANSLATION OF THE DESCRIPTION OR TO PAY THE FEE WITHIN THE PRESCRIBED TIME-LIMIT Effective date: 20170719 Ref country code: PL Free format text: LAPSE BECAUSE OF FAILURE TO SUBMIT A TRANSLATION OF THE DESCRIPTION OR TO PAY THE FEE WITHIN THE PRESCRIBED TIME-LIMIT Effective date: 20170719 Ref country code: BG Free format text: LAPSE BECAUSE OF FAILURE TO SUBMIT A TRANSLATION OF THE DESCRIPTION OR TO PAY THE FEE WITHIN THE PRESCRIBED TIME-LIMIT Effective date: 20171019 Ref country code: IS Free format text: LAPSE BECAUSE OF FAILURE TO SUBMIT A TRANSLATION OF THE DESCRIPTION OR TO PAY THE FEE WITHIN THE PRESCRIBED TIME-LIMIT Effective date: 20171119 |
|
| REG | Reference to a national code |
Ref country code: DE Ref legal event code: R097 Ref document number: 602012034870 Country of ref document: DE |
|
| PG25 | Lapsed in a contracting state [announced via postgrant information from national office to epo] |
Ref country code: DK Free format text: LAPSE BECAUSE OF FAILURE TO SUBMIT A TRANSLATION OF THE DESCRIPTION OR TO PAY THE FEE WITHIN THE PRESCRIBED TIME-LIMIT Effective date: 20170719 Ref country code: RO Free format text: LAPSE BECAUSE OF FAILURE TO SUBMIT A TRANSLATION OF THE DESCRIPTION OR TO PAY THE FEE WITHIN THE PRESCRIBED TIME-LIMIT Effective date: 20170719 Ref country code: CZ Free format text: LAPSE BECAUSE OF FAILURE TO SUBMIT A TRANSLATION OF THE DESCRIPTION OR TO PAY THE FEE WITHIN THE PRESCRIBED TIME-LIMIT Effective date: 20170719 |
|
| PLBE | No opposition filed within time limit |
Free format text: ORIGINAL CODE: 0009261 |
|
| STAA | Information on the status of an ep patent application or granted ep patent |
Free format text: STATUS: NO OPPOSITION FILED WITHIN TIME LIMIT |
|
| PG25 | Lapsed in a contracting state [announced via postgrant information from national office to epo] |
Ref country code: EE Free format text: LAPSE BECAUSE OF FAILURE TO SUBMIT A TRANSLATION OF THE DESCRIPTION OR TO PAY THE FEE WITHIN THE PRESCRIBED TIME-LIMIT Effective date: 20170719 Ref country code: SM Free format text: LAPSE BECAUSE OF FAILURE TO SUBMIT A TRANSLATION OF THE DESCRIPTION OR TO PAY THE FEE WITHIN THE PRESCRIBED TIME-LIMIT Effective date: 20170719 Ref country code: SK Free format text: LAPSE BECAUSE OF FAILURE TO SUBMIT A TRANSLATION OF THE DESCRIPTION OR TO PAY THE FEE WITHIN THE PRESCRIBED TIME-LIMIT Effective date: 20170719 Ref country code: IT Free format text: LAPSE BECAUSE OF FAILURE TO SUBMIT A TRANSLATION OF THE DESCRIPTION OR TO PAY THE FEE WITHIN THE PRESCRIBED TIME-LIMIT Effective date: 20170719 |
|
| 26N | No opposition filed |
Effective date: 20180420 |
|
| REG | Reference to a national code |
Ref country code: CH Ref legal event code: PL |
|
| PG25 | Lapsed in a contracting state [announced via postgrant information from national office to epo] |
Ref country code: SI Free format text: LAPSE BECAUSE OF FAILURE TO SUBMIT A TRANSLATION OF THE DESCRIPTION OR TO PAY THE FEE WITHIN THE PRESCRIBED TIME-LIMIT Effective date: 20170719 |
|
| REG | Reference to a national code |
Ref country code: IE Ref legal event code: MM4A |
|
| PG25 | Lapsed in a contracting state [announced via postgrant information from national office to epo] |
Ref country code: MT Free format text: LAPSE BECAUSE OF NON-PAYMENT OF DUE FEES Effective date: 20171205 Ref country code: LU Free format text: LAPSE BECAUSE OF NON-PAYMENT OF DUE FEES Effective date: 20171205 |
|
| REG | Reference to a national code |
Ref country code: FR Ref legal event code: ST Effective date: 20180831 |
|
| REG | Reference to a national code |
Ref country code: BE Ref legal event code: MM Effective date: 20171231 |
|
| PG25 | Lapsed in a contracting state [announced via postgrant information from national office to epo] |
Ref country code: FR Free format text: LAPSE BECAUSE OF NON-PAYMENT OF DUE FEES Effective date: 20180102 Ref country code: IE Free format text: LAPSE BECAUSE OF NON-PAYMENT OF DUE FEES Effective date: 20171205 |
|
| PG25 | Lapsed in a contracting state [announced via postgrant information from national office to epo] |
Ref country code: LI Free format text: LAPSE BECAUSE OF NON-PAYMENT OF DUE FEES Effective date: 20171231 Ref country code: BE Free format text: LAPSE BECAUSE OF NON-PAYMENT OF DUE FEES Effective date: 20171231 Ref country code: CH Free format text: LAPSE BECAUSE OF NON-PAYMENT OF DUE FEES Effective date: 20171231 |
|
| PG25 | Lapsed in a contracting state [announced via postgrant information from national office to epo] |
Ref country code: MC Free format text: LAPSE BECAUSE OF FAILURE TO SUBMIT A TRANSLATION OF THE DESCRIPTION OR TO PAY THE FEE WITHIN THE PRESCRIBED TIME-LIMIT Effective date: 20170719 Ref country code: HU Free format text: LAPSE BECAUSE OF FAILURE TO SUBMIT A TRANSLATION OF THE DESCRIPTION OR TO PAY THE FEE WITHIN THE PRESCRIBED TIME-LIMIT; INVALID AB INITIO Effective date: 20121205 |
|
| PG25 | Lapsed in a contracting state [announced via postgrant information from national office to epo] |
Ref country code: CY Free format text: LAPSE BECAUSE OF FAILURE TO SUBMIT A TRANSLATION OF THE DESCRIPTION OR TO PAY THE FEE WITHIN THE PRESCRIBED TIME-LIMIT Effective date: 20170719 |
|
| PG25 | Lapsed in a contracting state [announced via postgrant information from national office to epo] |
Ref country code: MK Free format text: LAPSE BECAUSE OF FAILURE TO SUBMIT A TRANSLATION OF THE DESCRIPTION OR TO PAY THE FEE WITHIN THE PRESCRIBED TIME-LIMIT Effective date: 20170719 |
|
| PG25 | Lapsed in a contracting state [announced via postgrant information from national office to epo] |
Ref country code: TR Free format text: LAPSE BECAUSE OF FAILURE TO SUBMIT A TRANSLATION OF THE DESCRIPTION OR TO PAY THE FEE WITHIN THE PRESCRIBED TIME-LIMIT Effective date: 20170719 |
|
| PG25 | Lapsed in a contracting state [announced via postgrant information from national office to epo] |
Ref country code: PT Free format text: LAPSE BECAUSE OF FAILURE TO SUBMIT A TRANSLATION OF THE DESCRIPTION OR TO PAY THE FEE WITHIN THE PRESCRIBED TIME-LIMIT Effective date: 20170719 |
|
| PG25 | Lapsed in a contracting state [announced via postgrant information from national office to epo] |
Ref country code: AL Free format text: LAPSE BECAUSE OF FAILURE TO SUBMIT A TRANSLATION OF THE DESCRIPTION OR TO PAY THE FEE WITHIN THE PRESCRIBED TIME-LIMIT Effective date: 20170719 |
|
| PGFP | Annual fee paid to national office [announced via postgrant information from national office to epo] |
Ref country code: GB Payment date: 20201126 Year of fee payment: 9 Ref country code: DE Payment date: 20201124 Year of fee payment: 9 |
|
| REG | Reference to a national code |
Ref country code: DE Ref legal event code: R119 Ref document number: 602012034870 Country of ref document: DE |
|
| GBPC | Gb: european patent ceased through non-payment of renewal fee |
Effective date: 20211205 |
|
| PG25 | Lapsed in a contracting state [announced via postgrant information from national office to epo] |
Ref country code: GB Free format text: LAPSE BECAUSE OF NON-PAYMENT OF DUE FEES Effective date: 20211205 Ref country code: DE Free format text: LAPSE BECAUSE OF NON-PAYMENT OF DUE FEES Effective date: 20220701 |