EP2778720B1 - Verfahren und Systeme zur Interpolation von in Meeresumgebungen erfassten mehrkomponentigen seismischen Daten - Google Patents
Verfahren und Systeme zur Interpolation von in Meeresumgebungen erfassten mehrkomponentigen seismischen Daten Download PDFInfo
- Publication number
- EP2778720B1 EP2778720B1 EP14158639.6A EP14158639A EP2778720B1 EP 2778720 B1 EP2778720 B1 EP 2778720B1 EP 14158639 A EP14158639 A EP 14158639A EP 2778720 B1 EP2778720 B1 EP 2778720B1
- Authority
- EP
- European Patent Office
- Prior art keywords
- wavefield
- pressure
- samples
- acceleration
- sample rate
- Prior art date
- Legal status (The legal status is an assumption and is not a legal conclusion. Google has not performed a legal analysis and makes no representation as to the accuracy of the status listed.)
- Active
Links
Images




Classifications
-
- G—PHYSICS
- G01—MEASURING; TESTING
- G01V—GEOPHYSICS; GRAVITATIONAL MEASUREMENTS; DETECTING MASSES OR OBJECTS; TAGS
- G01V1/00—Seismology; Seismic or acoustic prospecting or detecting
- G01V1/28—Processing seismic data, e.g. for interpretation or for event detection
- G01V1/30—Analysis
-
- G—PHYSICS
- G01—MEASURING; TESTING
- G01V—GEOPHYSICS; GRAVITATIONAL MEASUREMENTS; DETECTING MASSES OR OBJECTS; TAGS
- G01V1/00—Seismology; Seismic or acoustic prospecting or detecting
- G01V1/38—Seismology; Seismic or acoustic prospecting or detecting specially adapted for water-covered areas
-
- G—PHYSICS
- G01—MEASURING; TESTING
- G01V—GEOPHYSICS; GRAVITATIONAL MEASUREMENTS; DETECTING MASSES OR OBJECTS; TAGS
- G01V2210/00—Details of seismic processing or analysis
- G01V2210/50—Corrections or adjustments related to wave propagation
- G01V2210/57—Trace interpolation or extrapolation, e.g. for virtual receiver; Anti-aliasing for missing receivers
Definitions
- an exploration-seismology vessel tows a seismic source and the same, or another vessel, tows one or more streamers that form a seismic data acquisition surface below the surface of the water and over a subterranean formation to be surveyed for hydrocarbon deposits.
- the vessel contains seismic acquisition equipment, such as navigation control, seismic source control, seismic receiver control, and recording equipment.
- the seismic source control activates the seismic source, which is typically an array of source elements, such as air guns, to produce acoustic impulses at selected times.
- Each acoustic impulse is a sound wave that travels down through the water and into the subterranean formation.
- a portion of the sound wave is transmitted and another portion is reflected back toward the body of water to propagate toward the surface.
- the streamers towed behind the vessel are elongated cable-like structures.
- Each streamer may include a number of seismic receivers or multi-component sensors that record pressure and particle motion wavefields associated with the sound waves reflected back into the water from the subterranean formation.
- the recorded pressure and particle motion wavefields are transmitted along the streamers to the survey vessel were the wavefields are stored and may be processed on board the survey vessel using the acquisition equipment. Because the pressure and particle motion wavefields are typically collected over large survey areas using numerous streamers, each equipped with a multitude of receivers, the pressure and particle motion data collected can be extremely large and costly to store and process. Those working in the petroleum industry continue to seek methods and systems that reduce the overall amount of data collected in a marine survey while not compromising on the quality of the results produced from the reduced amounts of seismic data.
- Robertsson et al "On the use of multicomponent streamer recordings for reconstruction of pressure wavefields in the crossline direction" (Geophysics, vol.73, n°5; 1 September 2008, pages A45-A49 ) discloses an interpolation method for streamer data based on pressure and velocity samples.
- GB 2479200 A discloses a method of providing marine seismic data in which an interpolating filter is applied to multicomponent seismic measurements to obtain pressure data and/or vertical particle velocity component related data corresponding to source locations additional to the source locations at which a source was actuated.
- This disclosure presents computational systems and methods for interpolating a pressure wavefield based on pressure wavefield and particle motion wavefield data recorded in a marine seismic survey as defined by the appended claims.
- the pressure and particle motion wavefields are sampled at a sample rate that is less than a lower bound for sample rates typically used to interpolate the pressure wavefield from the pressure wavefield samples alone.
- the particle motion wavefield is an acceleration wavefield.
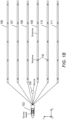
- FIGS 1A-1B show side-elevation and top views, respectively, of a marine seismic data acquisition system composed of an exploration seismology survey vessel 102 towing a source 104 and six separate streamers 106-111 beneath a free surface 112 of a body of water.
- the body of water can be a region of an ocean, a sea, a lake, or a river.
- each streamer is attached at one end to the survey vessel 102 via a streamer-data-transmission cable.
- the streamers 106-111 form a planar horizontal receiver acquisition surface with respect to the free surface 112.
- the receiver acquisition surface may be smoothly varying due to active sea currents and weather conditions.
- a receiver acquisition surface is not limited to having a planar horizontal orientation with respect to the free surface 112.
- the streamers may be towed at depths that orient the receiver acquisition surface at an angle with respect to the free surface 112 or so that one or more of the streamers are towed at different depths.
- a receiver acquisition surface is not limited to six streamers as shown in Figure 1B . In practice, the number of receivers used to form a receiver acquisition surface can range from as few as one streamer to as many as 20 or more streamers.
- Figure 1A includes an x 1 x 3 -plane 114 and Figure 1B includes an x 1 x 2 -plane 116 of the same Cartesian coordinate system having three orthogonal, spatial coordinate axes labeled x 1 , x 2 and x 3 .
- the coordinate system is used to specify orientations and coordinate locations within a body of water.
- the x 1 -direction specifies the position of a point in a direction parallel to the length of the streamers and is referred to as the "in-line" direction.
- the x 2 -direction specifies the position of a point in a direction perpendicular to the x 1 -direction and substantially parallel to the free surface 112 and is referred to as the "cross-line" direction.
- the x 3 -direction specifies the position of a point perpendicular to the x 1 x 2 -plane (i.e., perpendicular to the free surface 112) with the positive x 3 -direction pointing downward away from the free surface 112.
- Streamer depth below the free surface 112 can be estimated at various locations along the streamers using depth measuring devices attached to the streamers.
- the depth measuring devices can measure hydrostatic pressure or utilize acoustic distance measurements.
- the depth measuring devices can be integrated with depth controllers, such as paravanes or water kites, that control and maintain the depth and position of the streamers as the streamers are towed through a body of water.
- the depth measuring devices are typically placed at intervals (e.g., about 300 meter intervals) along each streamer. Note that in other embodiments buoys may be used to maintain the orientation and depth of the streamers below the free surface 112.
- shaded rectangles 118 represent receivers or sensors that are spaced-apart along the length of each streamer.
- the streamers 106-111 are long cables containing power and data-transmission lines that connect the receivers 118 to seismic acquisition equipment located on board the survey vessel 102.
- Each receiver is a dual sensor including a particle motion sensor that detects vertical displacement within the body of water over time by detecting particle motion accelerations, and a pressure sensor that detects variations in water pressure over time.
- Figure 1A shows a cross-sectional view of the survey vessel 102 towing the source 104 and streamers above a subterranean formation 120.
- Curve 122 represents a surface of the subterranean formation 120.
- the subterranean formation 120 is composed of a number of subterranean layers of sediment and rock.
- Curves 124, 126, and 128 represent interfaces between subterranean layers of different compositions.
- a shaded region 130 bounded at the top by a curve 132 and at the bottom by a curve 134, represents a hydrocarbon-rich subterranean deposit, the depth and positional coordinates of which may be determined by analysis of seismic data collected during a marine seismic survey.
- the source 104 produces an acoustic impulse at spatial and temporal intervals.
- the source 104 may be towed by a separate survey vessel or a number of sources may be towed by a number of different vessels.
- Source 104 may be an air gun, marine vibrator, or an array of air guns and/or marine vibrators.
- Figure 1A illustrates an acoustic impulse expanding outward from the source 104 as a pressure wavefield 136 represented by semicircles of increasing radius centered at the source 104. The wavefronts are, in effect, shown in vertical plane cross section in Figure 1A .
- the outward and downward expanding portion of the pressure wavefield 136 is called the "primary wavefield,” which eventually reaches the surface 122 of the subterranean formation 120, at which point the primary wavefield is partially reflected from the surface 122 and partially transmitted downward into the subterranean formation 120, becoming elastic waves within the subterranean formation 120.
- the acoustic impulse is composed of compressional pressure waves, or P-waves, while in the subterranean formation 120, the waves include both P-waves and transverse waves, or S-waves.
- each point of the surface 122 and each point of the interfaces within the underlying subterranean formation 120 becomes a potential secondary point source from which acoustic and elastic wave energy, respectively, may emanate upward toward the receivers 118 in response to the acoustic impulse generated by the source 104 and downward-propagating elastic waves generated from the pressure impulse.
- secondary waves of significant amplitude are generally emitted from points on or close to the surface 122, such as point 138, and from points on or very close to interfaces in the subterranean formation 120, such as points 140 and 142.
- Tertiary waves called "receiver ghosts" are produced by secondary waves that are reflected from the free surface 112 back towards the streamers 106-111 and the subterranean formation 120.
- the secondary waves are generally emitted at different times within a range of times following the initial acoustic impulse.
- a point on the surface 122 such as the point 138, receives a pressure disturbance corresponding to the initial acoustic impulse more quickly than a point within the subterranean formation 120, such as points 140 and 142.
- a point on the surface 122 directly beneath the source 104 receives the acoustic impulse sooner than a more distant-lying point on the surface 122.
- the times at which secondary and higher-order waves are emitted from various points within the subterranean formation 120 are related to the distance, in three-dimensional space, of the points from the source 104.
- the travel times of the primary wavefield and secondary wavefield emitted in response to the primary wavefield are functions of distance from the source 104 as well as the materials and physical characteristics of the materials through which the primary wave travels.
- the secondary expanding wavefronts may be altered as the wavefronts cross interfaces and as the velocity of sound varies in the media are traversed by the wave.
- the superposition of waves emitted from within the subterranean formation 120 in response to the primary wavefield is a generally complicated wavefield that includes information about the shapes, sizes, and material characteristics of the subterranean formation 120, including information about the shapes, sizes, and locations of the various reflecting features within the subterranean formation 120 of interest to exploration seismologists.
- Figure 2 shows a side-elevation view of the marine seismic data acquisition system with a magnified view 202 of receiver 118.
- the magnified view 202 reveals that the receiver 118 is a multi-component sensor composed of a pressure sensor 204 and three particle motion sensors 206.
- the pressure sensor may be a hydrophone.
- the pressure sensor 204 measures changes in pressure over time and records pressure wavefield data denoted by P x ⁇ r t , where the subscript r is a receiver index, x ⁇ r are the coordinates of the receiver, and t represents time.
- the motion sensors 206 are responsive to water motion in different directions.
- three particle motion sensors 206 are collocated in the streamer 109 with the pressure sensor 204 to record particle motion wavefields in the x 1 -, x 2 -, and x 3 -directions.
- the particle motion sensors are responsive to the acceleration of the particles in the water.
- the motion sensor data may be differentiated to obtain velocity wavefield data.
- the particle acceleration data may be integrated to obtain velocity wavefield data.
- the resulting wavefield data produced by the motion sensors 206 are orthogonal velocity wavefields denoted by V x 1 x ⁇ r t , V x 2 x ⁇ r t , and V x 3 x ⁇ r t , which correspond to particle motion velocity wavefields in the x 1 -, x 2 -, and x 3 -directions, respectively, at the receiver r and are collectively denoted by ( V x 1 , V x 2 , V x 3 ) r .
- the streamers 106-111 and the survey vessel 102 may include sensing electronics and data-processing facilities that allow measurements from each receiver to be correlated with absolute positions on the free surface 112 and absolute three-dimensional positions with respect to an arbitrary three-dimensional coordinate system.
- the pressure data and particle motion data represent pressure and particle motion wavefields.
- directional arrow 208 represents the direction of an up-going wavefield detected by a receiver 210 and dashed arrows 212 represents a down-going wavefield produced by the up-going wavefield reflection from the free surface 112 before reaching the receiver 210.
- the pressure wavefield P x ⁇ r t measured at a receiver is composed of an up-going pressure wavefield component and a down-going pressure wavefield component
- the x 3 -component or vertical velocity wavefield V x 3 x ⁇ r t measured at a particle motion sensor is composed of an up-going velocity wavefield component and a down-going velocity wavefield component.
- the down-going wavefield is called a receiver ghost that contaminates pressure and particle motion velocity data and creates notches in the spectral domain. Filtering is done to remove the down-going wavefields from the pressure and particle motion velocity data leaving the up-going wavefields which are used to generate images of the subterranean formation.
- Each pressure sensor and particle motion sensor generates seismic data in the form of a time series that consist of a number of consecutive measured values called amplitudes separated in time by a sample period.
- the time series recorded by a pressure or motion sensor is called a "trace," which may consist of thousands of samples with a sample rate of about 1 to 5 samples/ms.
- a trace is a recording of a subterranean formation response to acoustic energy that passes from the source 104, through subterranean layers, and is ultimately recorded by a sensor.
- a trace records variations in a time-dependent amplitude that represents acoustic energy in the portion of the secondary wavefield measured by the sensor.
- a secondary wavefield typically arrives first at the receivers located closest to the source 104. The distance from the source 104 to a receiver is called the source-receiver offset, which creates a delay in the arrival time of a secondary wavefield from a substantially horizontal interface within the subterranean formation.
- Figure 3 shows ray paths 301-305 that represent paths of an acoustic impulse 300 output from the source 104 to the interface 124.
- Rays 306-310 represent the paths of acoustic energy reflected from the interface 124 (i.e., secondary wavefields) to the receivers located along the streamer 109.
- Each pressure sensor measures the pressure wavefield P x ⁇ r t and the motion sensors at each receiver measure particle motion velocity wavefields V x 1 x ⁇ r t , V x 2 x ⁇ r t , and V x 3 x ⁇ r t of the acoustic energy reflected from the interface 124.
- the pressure wavefield P x ⁇ r t and velocity wavefields ( V x 1 , V x 2 , V x 3 ) r measured at each receiver r are time sampled, as described in greater detail below, and recorded as four separate traces. A number of traces taken together either from the same streamer or across the streamers can be used to form a gather, which represents a portion of a measured wavefield.
- the traces associated with the pressure P x ⁇ r t wavefield measured at the five pressure sensors located along the streamer 109 can be used to form a shot-receiver gather that represents an in-line pressure wavefield
- the traces associated with the velocity wavefield V x 3 x ⁇ r t measured at the five particle motion sensors located along the streamer 109 can be used to form a shot-receiver gather that represents an in-line vertical velocity wavefield.
- Other types of gathers can be formed from the pressure and velocities including common-receiver gathers and common-midpoint gathers.
- Figure 4A shows a plot of a source-receiver gather of example traces 401-405 of the acoustic energy reflected from the interface 124 and recorded by the five receives located along the streamer 109 shown in Figure 3 .
- Vertical axis 406 represents time and horizontal axis 408 represents trace numbers with trace "1" representing the seismic data generated by the receiver located closest to the source 104 and trace "5" representing the seismic data generated by the receiver located farthest from the source 104.
- the traces 401-405 can represent variation in the amplitude of the pressure wavefield P x ⁇ r t or variation in amplitude of any one of the velocity wavefield components V x 1 x ⁇ r t , V x 2 x ⁇ r t , and V x 3 x ⁇ r t .
- the example traces include wavelets or pulses 410-414 that represent the acoustic energy reflected from the interface 124. Peaks, colored black, and troughs of each trace represent changes in the amplitude measured by the pressure sensors or motion sensors.
- the distances along the traces 401-405 from the trace number axis 408 to the wavelets 410-414 represents the travel time of the acoustic energy output from the source 104 to the interface 124 and ultimately to the receivers.
- the amplitude of the peak or trough of the wavelets 410-414 indicates the magnitude of acoustic energy recorded by the pressure sensor or motion sensor. Note that the arrival times versus source-receiver offset is longer with increased source-receiver offset and, in this example, has a hyperbolic shape 416.
- the traces from different source-receiver pairs may be corrected during seismic data processing to remove the effects of different source-receiver offsets in a process called "normal moveout" ("NMO").
- Figure 4B shows a gather of the traces 410-414 after NMO has been applied to align the pulses in time as represented by horizontal line 418.
- traces from different shot records with a common reflection point can be stacked to form a single trace during seismic data processing. Stacking improves the signal-to-noise ratio, reduces noise, improves seismic data quality, and reduces the amount of data.
- a typical trace does not represent a single reflection from a single interface, as represented in Figures 4A-4B .
- a trace represents the time-dependant amplitude of acoustic energy associated with numerous reflections of acoustic energy from within the subterranean formation.
- Figure 4C shows a gather of 15 traces recorded over a period of time. Each trace, such as trace 420, varies in amplitude over time and represents acoustic energy reflected from a number of different interfaces within a subterranean formation as measured by a pressure sensor or a motion sensor.
- the gather shown in Figure 4C can represent a pressure wavefield or a velocity wavefield and can be a source-receiver gather, a common-receiver gather, or a common-midpoint gather.
- Figure 5 shows a time-domain plot of an example time-dependent continuous signal denoted by x ( t ).
- Horizontal axis 502 represents time denoted by t
- vertical axis 504 represents the signal amplitude
- curve 506 represents the signal x ( t ).
- the signal x ( t ) can represent time-dependent variations in the pressure wavefield P(t), the particle motion wavefield, or time-dependent variations in the velocity wavefields V x 1 ( t ), V x 2 ( t ), and V x 3 ( t ) measured at a receiver r , where in the following description the receiver coordinates x r are suppressed.
- the signal x ( t ) is typically sampled and recorded at regularly spaced times separated by time intervals called "sample periods" denoted by T s .
- Figure 5 includes a magnified view 508 of a segment of the signal x ( t ).
- Dashed line 510 represents the continuous signal x ( t ) and solid dots 512 represent the amplitude of the signal x(t) recorded at regularly spaced time intervals equal to the sample period T s .
- f s sample rate or sample frequency
- x ( nT s ) the discrete signal
- magnified view 508 includes time samples x (( n - 1) T s ), x ( nT s ), and x (( n + 1) T s ) that are recorded at regularly spaced times ( n - 1) T s , nT s , and ( n + 1) T s separated by the same sample period T s .
- the discrete signal x ( nT s ) can represent a time-sample pressure wavefield recorded by a pressure sensor or a velocity wavefield recorded by a motion sensor, the discrete signal x ( nT s ) is a trace as described above.
- the signal x ( t ) is effectively band-limited because of various environmental, source and recording factors that limit the frequency content of the signal.
- the band limit of a trace is revealed when the trace is transformed to the spectral domain.
- a Fourier transform can be used to transform the trace x ( nT s ) to the spectral domain: x nT s ⁇ FT X ⁇ k
- FIG. 6 shows a spectral domain plot of an example frequency spectrum resulting from transforming the trace x ( nT s ) represented in Figure 5 to the spectral domain.
- the horizontal axis represents the frequency ⁇
- vertical axis 604 represents the spectral amplitude
- jagged-curve 606 represents the B -band limited frequency spectrum X ( ⁇ k ) of the trace x ( nT s ).
- Point B along the frequency axis represents a finite frequency beyond which the spectrum X ( ⁇ k ) is essentially zero. Any signal that has a Fourier transform, or frequency spectrum, that is essentially zero for frequencies greater than a finite frequency B is called “band limited” and the frequency B is called the "band limit.”
- the signal x ( t ) can be interpolated or reconstructed from its samples x ( nT s ) when each sample is considered as specifying the scaling and location of a sine function.
- Equation (5) is called “the sampling theorem.”
- the signal x ( t ) In order to avoid temporal aliasing (i.e., losing signal information as a result of sampling), the signal x ( t ) must be band limited to less than half the sample rate f s .
- the signal x ( t ) can be interpolated using Equation (6) with a sample rate greater than or equal to half the Nyquist rate (i.e., f N /2).
- Figure 7A shows a horizontal axis 702 that represents frequencies greater than zero
- Figure 7B shows a horizontal axis 704 that represents time greater than zero
- Dashed directional arrow 706 represents sample rates that are greater than or equal to the Nyquist rate, f N
- the signal x ( t ) can be interpolated using Equation (5) with just the samples x ( nT s ) produced at a sample rate f s greater than the Nyquist rate and sample periods T s that lie between zero and the Nyquist period T N .
- Dot-dashed directional arrow 710 represents sample rates f R that are greater than or equal to half the Nyquist rate, f N /2
- dot-dashed directional arrow 712 represents corresponding sample periods T between zero and twice the Nyquist period T N .
- the signal x ( t ) can be interpolated using Equation (6) with samples x ( nT ) and time derivatives of the samples ⁇ t x ( nT ) at a sample rate f R greater than f N /2 (i.e., f R > f N /2) .
- Equation (6) allows for reconstruction of the signal x ( t ) with samples x ( nT ) and time derivatives of the samples ⁇ t x ( nT ) recorded at a sample rate f R between f N /2 and f N (i.e., f N > f R > f N /2) and sample period T between T N and 2 T N (i.e., T N ⁇ T ⁇ 2 T N ).
- Figures 7A-7B illustrate how Equation (6) can be used to reduce the number of samples to less than half the number of samples recorded with a typical sample rate used to record seismic data provided the sample data and the time derivative of the sample data are known.
- the Nyquist rate for recording a pressure wavefield P ( t ) is about 3.5 samples/ms.
- a typical sample rate of about 4 samples/ms can be used and the pressure wavefield P ( t ) can be interpolated from just the pressure samples P ( nT s ) using Equation (5).
- Equation (6) the sample rate can be reduced to a sample rate greater than half the Nyquist rate of 1.75 Hz, and the pressure signal P ( t ) can be interpolated provided the pressure samples P ( nT ) and time derivatives of the pressure samples ⁇ t P ( nT ) are known for each time sample.
- Equation (6) enables interpolation of a time-dependent pressure wavefield with about half the number of samples typically used to record pressure data, provided pressure samples and corresponding time derivatives of the pressure samples are recorded for each time sample.
- the time derivatives of the pressure wavefield can be calculated from the velocity wavefields.
- Equation (9) The measurements of P ( t ) and V j ( t ) are recorded by sensors in a streamer with known properties that can be considered as a locally homogenous time-invariant medium, or is dragged through a water layer with similar properties that are known, or can be measured independently.
- the seismic reflection data of interest are the up-going or vertically travelling wavefields (i.e., x 3 -direction).
- the time derivative of the pressure wavefield in Equation (10) can be approximated by: ⁇ t P t ⁇ ⁇ c ⁇ ⁇ t V 3 t + n h where n h represents noise that depends on the horizontal particle velocity components V x 1 ( t ) and V x 2 ( t ).
- Equation (11) depends on time derivatives of the velocities V 1 ( nT ), V 2 ( nT ), and V 3 ( nT ) and Equation (13) depends on time derivatives of the velocity V 3 ( nT ), which are particle motion accelerations.
- the particle motion acceleration can be determined in a number ways.
- the particle motion sensors deployed at the receivers are MEMS accelerometers that output sampled acceleration a 3 ( nT ), which is time sampled at substantially the same sample rate f R as the pressure wavefield.
- the acceleration can be calculated from the slope of the recorded vertical velocity samples surrounding the sample V 3 ( nT ).
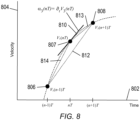
- Figure 8 shows a plot of three consecutive example vertical velocity samples.
- Horizontal axis 802 represents time
- vertical axis 804 represents velocity
- shaded dots 806-808 represent vertical velocity samples V 3 (( n - 1 ) T ), V 3 ( nT ), and V 3 (( n + 1) T ), respectively.
- the acceleration a 3 ( nT ) at time sample nT is the slope of a tangent line 810 at the point 807.
- the acceleration a 3 ( nT ) can be approximated from the neighboring vertical velocity samples V 3 (( n - 1) T ), V 3 ( nT ), and V 3 (( n + 1) T ) as follows: a 3 nT ⁇ V 3 n + 1 T ⁇ V 3 n ⁇ 1 T 2 T a 3 nT ⁇ V 3 n + 1 T ⁇ V 3 nT T a 3 nT ⁇ V 3 nT ⁇ V 3 n ⁇ 1 T T
- Equations (14a)-(14c) are represented by slopes of dotted lines 812-814, respectively. Similar equations can be used to calculate approximate accelerations a 1 ( nT ) and a 2 ( nT ) in the in-line and cross-line directions in Equation (11).
- Figure 9 shows a flow diagram of a method for interpolating a pressure wavefield in the time domain.
- pressure wavefield samples P ( nT ) sampled with a sample rate f R greater than or equal to half the Nyquist rate f N are received.
- the samples P ( nT ) are pressure sensors located at a receiver r along a streamer towed by a survey vessel as described above.
- one or more particle motion wavefields that are sampled at the sample rate f R are received.
- the particle motion wavefields are recorded by particle motion sensors collocated with the pressure sensor.
- the particle motion wavefields may be differentiated to convert the wavefield data into velocity wavefields V 1 ( nT ), V 2 ( nT ), and V 3 ( nT ), and when the motion sensors are responsive to acceleration (i.e., MEMS accelerometers), the particle motion wavefields are acceleration wavefields a x 1 ( nT ), a x 2 ( nT ), and a x 3 ( nT ).
- acceleration wavefields are calculated from the velocity wavefields as described above with reference to Equations (14a)-(14c).
- a time derivative for the pressure sample ⁇ t P ( nT ) is calculated according to Equation (10) or Equation (12).
- the pressure wavefield is interpolated from the pressure samples P ( nT ) and the approximate time derivatives for the pressure sample ⁇ t P ( nT ) using Equation (11) or Equation (12).
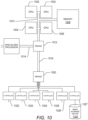
- Figure 10 shows an example of a generalized computer system that executes efficient methods for interpolating the pressure wavefield in the time domain and therefore represents a geophysical-analysis data-processing system.
- the internal components of many small, mid-sized, and large computer systems as well as specialized processor-based storage systems can be described with respect to this generalized architecture, although each particular system may feature many additional components, subsystems, and similar, parallel systems with architectures similar to this generalized architecture.
- the computer system contains one or multiple central processing units (“CPUs”) 1002-1005, one or more electronic memories 1008 interconnected with the CPUs by a CPU/memory-subsystem bus 1010 or multiple busses, a first bridge 1012 that interconnects the CPU/memory-subsystem bus 1010 with additional busses 1014 and 1016, or other types of high-speed interconnection media, including multiple, high-speed serial interconnects.
- CPUs central processing units
- electronic memories 1008 interconnected with the CPUs by a CPU/memory-subsystem bus 1010 or multiple busses, a first bridge 1012 that interconnects the CPU/memory-subsystem bus 1010 with additional busses 1014 and 1016, or other types of high-speed interconnection media, including multiple, high-speed serial interconnects.
- the busses or serial interconnections connect the CPUs and memory with specialized processors, such as a graphics processor 1018, and with one or more additional bridges 1020, which are interconnected with high-speed serial links or with multiple controllers 1022-1027, such as controller 1027, that provide access to various different types of computer-readable media, such as computer-readable medium 1028, electronic displays, input devices, and other such components, subcomponents, and computational resources.
- the electronic displays including visual display screen, audio speakers, and other output interfaces
- the input devices including mice, keyboards, touch screens, and other such input interfaces, together constitute input and output interfaces that allow the computer system to interact with human users.
- Computer-readable medium 1028 is a data-storage device, including electronic memory, optical or magnetic disk drive, USB drive, flash memory and other such data-storage device.
- the computer-readable medium 1028 can be used to store machine-readable instructions that encode the computational methods described above and can be used to store encoded data, during store operations, and from which encoded data can be retrieved, during read operations, by computer systems, data-storage systems, and peripheral devices.
- Embodiments described above are not intended to be limited to the descriptions above.
- any number of different computational-processing-method implementations that carry out the interpolation methods described above may be designed and developed using various different programming languages and computer platforms and by varying different implementation parameters, including control structures, variables, data structures, modular organization, and other such parameters.
- the computational representations of wavefields, operators, and other computational objects may be implemented in different ways.
- the systems and methods for interpolating seismic data can be executed in near-real time while conducting a marine survey of a subterranean formation.
- the term "near-real time” refers to a time delay due to data transmission and data processing that is short enough to allow timely use of the processed data during further data acquisition.
- near-real time can refer to a situation in which the time delay due to transmission and processing is insignificant. In other words, near-real time approximates real time when the time for data transmission and data processing appears imperceptible. Near-real time can also refer to a perceptible time delay for data transmission and data processing but the time delay is not so long that quality control cannot be executed.
Landscapes
- Life Sciences & Earth Sciences (AREA)
- Physics & Mathematics (AREA)
- Remote Sensing (AREA)
- Engineering & Computer Science (AREA)
- Geology (AREA)
- Environmental & Geological Engineering (AREA)
- Acoustics & Sound (AREA)
- General Life Sciences & Earth Sciences (AREA)
- General Physics & Mathematics (AREA)
- Geophysics (AREA)
- Oceanography (AREA)
- Geophysics And Detection Of Objects (AREA)
- Image Generation (AREA)
Claims (4)
- Verfahren zum Interpolieren seismischer Daten, die aus einer seismischen Untersuchung des Meeres unter Verwendung eines programmierbaren Computers erhalten wurden, der programmiert ist, um mindestens die Operationen durchzuführen zum:Empfangen (901) von Druckwellenfeldproben eines mit einem Drucksensor (204) bei einer Abtastrate gemessenen Druckwellenfelds;gekennzeichnet durch Empfangen (902) von Beschleunigungswellenfeldproben eines Beschleunigungswellenfelds, das mit einem MEMS-Beschleunigungsmesser bei der Abtastrate gemessen wurde, wobei sich der MEMS-Beschleunigungsmesser zusammen mit dem Drucksensor in einem Streamer befindet; undInterpolieren (906) eines Druckwellenfelds in der Zeitdomäne basierend auf den Druckwellenfeldproben und den Beschleunigungswellenfeldproben, wobei die Abtastrate geringer als eine Nyquist-Rate des Druckwellenfelds und größer als die halbe Nyquist-Rate ist.
- System zum Interpolieren seismischer Daten, wobei das System umfasst:einen oder mehrere Prozessoren (1002);ein oder mehrere computerlesbare Medien (1008); undeine Routine, die in einem oder mehreren Datenspeichervorrichtung (1028) gespeichert ist und von einem oder mehreren Prozessoren (1002) ausgeführt wird, wobei die Routine gerichtet ist auf:Abrufen von Druckwellenfeldproben, die in einem oder mehreren computerlesbaren Medien (1008) bei einer Abtastrate aufgezeichnet sind;gekennzeichnet durch Abrufen von Beschleunigungswellenfeldproben eines Beschleunigungswellenfelds, das mit einem MEMS-Beschleunigungsmesser bei der Abtastrate gemessen und in einem oder mehreren computerlesbaren Medien (1008) aufgezeichnet wurde, wobei sich der MEMS-Beschleunigungsmesser zusammen mit dem Drucksensor in einem Streamer befindet;Interpolieren (906) eines Druckwellenfelds in der Zeitdomäne basierend auf den Druckwellenfeldproben und den Beschleunigungswellenfeldproben; undSpeichern des Druckwellenfelds in einem oder mehreren computerlesbaren Medien (1008), wobei die Abtastrate geringer als eine Nyquist-Rate des Druckwellenfelds und größer als die Hälfte der Nyquist-Rate ist.
- System nach Anspruch 2, das weiter Empfangen der Druckwellenfeldproben, Empfangen der Beschleunigungswellenfelder und Interpolieren des Druckwellenfelds in nahezu Echtzeit an Bord eines Untersuchungsschiffes (102) umfasst.
- Nichtflüchtiges computerlesbares Medium (1028), das darauf codierte maschinenlesbare Anweisungen aufweist, um es einem oder mehrere Prozessoren (1002) eines Computersystems zu ermöglichen, die Operationen auszuführen zumEmpfangen (901) von Druckwellenfeldproben eines von einem in einem Streamer (109) befindlichen Drucksensor (204) bei einer Abtastrate gemessenen Druckwellenfelds;gekennzeichnet durch Empfangen (902) entweder von Beschleunigungswellenfeldproben eines Beschleunigungswellenfelds, das von einem Beschleunigungsmesser bei der Abtastrate gemessen wurde, wobei sich der Beschleunigungsmesser (206) zusammen mit dem Drucksensor (204) in dem Streamer (109) befindet, oder von Zeitableitungen von Vertikalgeschwindigkeitswellenfeldproben, die mit einem Partikelbewegungssensor gemessen wurden, wobei sich der Partikelbewegungssensor zusammen mit dem Drucksensor in dem Streamer befindet, und die Zeitableitungen der Vertikalgeschwindigkeitswellenfeldproben die Beschleunigungswellenfeldproben annähern; undInterpolieren (906) eines Druckwellenfelds in der Zeitdomäne basierend entweder auf den Druckwellenfeldproben und den Beschleunigungswellenfeldproben oder den Druckwellenfeldproben und den Zeitableitungen der Vertikalgeschwindigkeitswellenfeldproben, wobei die Abtastrate geringer als eine Nyquist-Rate des Druckwellenfelds und größer als die halbe Nyquist-Rate ist.
Applications Claiming Priority (2)
| Application Number | Priority Date | Filing Date | Title |
|---|---|---|---|
| US201361794947P | 2013-03-15 | 2013-03-15 | |
| US14/053,264 US9846247B2 (en) | 2013-03-15 | 2013-10-14 | Methods and systems for interpolation of multi-component seismic data collected in a marine environment |
Publications (3)
| Publication Number | Publication Date |
|---|---|
| EP2778720A2 EP2778720A2 (de) | 2014-09-17 |
| EP2778720A3 EP2778720A3 (de) | 2016-01-27 |
| EP2778720B1 true EP2778720B1 (de) | 2024-11-20 |
Family
ID=50236108
Family Applications (1)
| Application Number | Title | Priority Date | Filing Date |
|---|---|---|---|
| EP14158639.6A Active EP2778720B1 (de) | 2013-03-15 | 2014-03-10 | Verfahren und Systeme zur Interpolation von in Meeresumgebungen erfassten mehrkomponentigen seismischen Daten |
Country Status (6)
| Country | Link |
|---|---|
| US (1) | US9846247B2 (de) |
| EP (1) | EP2778720B1 (de) |
| AU (1) | AU2014201535B2 (de) |
| BR (1) | BR102014005997B1 (de) |
| MX (1) | MX343720B (de) |
| SG (2) | SG10201706818TA (de) |
Families Citing this family (1)
| Publication number | Priority date | Publication date | Assignee | Title |
|---|---|---|---|---|
| GB202002441D0 (en) * | 2020-02-21 | 2020-04-08 | Res & Innovation Uk | Measuring snowfall |
Citations (1)
| Publication number | Priority date | Publication date | Assignee | Title |
|---|---|---|---|---|
| US20100002541A1 (en) * | 2008-07-05 | 2010-01-07 | Ahmet Kemal Ozdemir | Interpolating seismic data |
Family Cites Families (26)
| Publication number | Priority date | Publication date | Assignee | Title |
|---|---|---|---|---|
| US6005916A (en) * | 1992-10-14 | 1999-12-21 | Techniscan, Inc. | Apparatus and method for imaging with wavefields using inverse scattering techniques |
| GB2337591B (en) * | 1998-05-20 | 2000-07-12 | Geco As | Adaptive seismic noise and interference attenuation method |
| US6292754B1 (en) * | 1999-11-11 | 2001-09-18 | Bp Corporation North America Inc. | Vector recomposition of seismic 3-D converted-wave data |
| WO2002059647A1 (en) * | 2001-01-25 | 2002-08-01 | Westerngeco Seismic Holdings Limited | A method of processing marine seismic data and a method of seismic surveying |
| GB2376527B (en) * | 2001-06-16 | 2004-12-15 | Westerngeco Ltd | A method of processing data |
| GB2395305B (en) * | 2002-11-15 | 2006-03-22 | Westerngeco Seismic Holdings | Processing seismic data |
| WO2005098731A2 (en) * | 2004-03-29 | 2005-10-20 | German Peter T | Systems and methods to determine elastic properties of materials |
| US7791980B2 (en) | 2004-05-21 | 2010-09-07 | Westerngeco L.L.C. | Interpolation and extrapolation method for seismic recordings |
| US7082368B2 (en) * | 2004-06-04 | 2006-07-25 | Schlumberger Technology Corporation | Seismic event correlation and Vp-Vs estimation |
| US7394724B1 (en) * | 2005-08-09 | 2008-07-01 | Uzes Charles A | System for detecting, tracking, and reconstructing signals in spectrally competitive environments |
| US7782710B1 (en) * | 2005-08-09 | 2010-08-24 | Uzes Charles A | System for detecting, tracking, and reconstructing signals in spectrally competitive environments |
| US7643377B1 (en) * | 2005-08-09 | 2010-01-05 | Uzes Charles A | System for detecting, tracking, and reconstructing signals in spectrally competitive environments |
| US7123548B1 (en) * | 2005-08-09 | 2006-10-17 | Uzes Charles A | System for detecting, tracking, and reconstructing signals in spectrally competitive environments |
| US8542555B1 (en) * | 2005-08-09 | 2013-09-24 | Charles A. Uzes | System for detecting, tracking, and reconstructing signals in spectrally competitive environments |
| US7379386B2 (en) * | 2006-07-12 | 2008-05-27 | Westerngeco L.L.C. | Workflow for processing streamer seismic data |
| US7660203B2 (en) * | 2007-03-08 | 2010-02-09 | Westerngeco L.L.C. | Systems and methods for seismic data acquisition employing asynchronous, decoupled data sampling and transmission |
| US8120991B2 (en) * | 2006-11-03 | 2012-02-21 | Paradigm Geophysical (Luxembourg) S.A.R.L. | System and method for full azimuth angle domain imaging in reduced dimensional coordinate systems |
| US8077543B2 (en) * | 2007-04-17 | 2011-12-13 | Dirk-Jan Van Manen | Mitigation of noise in marine multicomponent seismic data through the relationship between wavefield components at the free surface |
| GB2450122B (en) | 2007-06-13 | 2009-08-05 | Westerngeco Seismic Holdings | Method of representing signals |
| US7755970B2 (en) * | 2007-06-22 | 2010-07-13 | Westerngeco L.L.C. | Methods for controlling marine seismic equipment orientation during acquisition of marine seismic data |
| US7702463B2 (en) * | 2007-12-12 | 2010-04-20 | Landmark Graphics Corporation, A Halliburton Company | Systems and methods for enhancing a seismic data image |
| US8554484B2 (en) * | 2009-02-13 | 2013-10-08 | Westerngeco L.L.C. | Reconstructing seismic wavefields |
| US20100211322A1 (en) * | 2009-02-13 | 2010-08-19 | Massimiliano Vassallo | Interpolating a pressure wavefield along an undersampled direction |
| US9285493B2 (en) * | 2009-08-27 | 2016-03-15 | Pgs Geophysical As | Sensor grouping for dual sensor marine seismic streamer and method for seismic surveying |
| US9310503B2 (en) * | 2009-10-23 | 2016-04-12 | Westerngeco L.L.C. | Methods to process seismic data contaminated by coherent energy radiated from more than one source |
| GB2479200A (en) * | 2010-04-01 | 2011-10-05 | Statoil Asa | Interpolating pressure and/or vertical particle velocity data from multi-component marine seismic data including horizontal derivatives |
-
2013
- 2013-10-14 US US14/053,264 patent/US9846247B2/en active Active
-
2014
- 2014-03-10 EP EP14158639.6A patent/EP2778720B1/de active Active
- 2014-03-13 SG SG10201706818TA patent/SG10201706818TA/en unknown
- 2014-03-13 SG SG10201400609YA patent/SG10201400609YA/en unknown
- 2014-03-14 MX MX2014003205A patent/MX343720B/es active IP Right Grant
- 2014-03-14 BR BR102014005997-0A patent/BR102014005997B1/pt active IP Right Grant
- 2014-03-14 AU AU2014201535A patent/AU2014201535B2/en active Active
Patent Citations (1)
| Publication number | Priority date | Publication date | Assignee | Title |
|---|---|---|---|---|
| US20100002541A1 (en) * | 2008-07-05 | 2010-01-07 | Ahmet Kemal Ozdemir | Interpolating seismic data |
Also Published As
| Publication number | Publication date |
|---|---|
| EP2778720A2 (de) | 2014-09-17 |
| MX343720B (es) | 2016-11-17 |
| BR102014005997B1 (pt) | 2021-09-08 |
| BR102014005997A2 (pt) | 2015-10-06 |
| SG10201400609YA (en) | 2014-10-30 |
| MX2014003205A (es) | 2015-03-25 |
| AU2014201535B2 (en) | 2018-02-15 |
| US9846247B2 (en) | 2017-12-19 |
| EP2778720A3 (de) | 2016-01-27 |
| SG10201706818TA (en) | 2017-09-28 |
| US20140269181A1 (en) | 2014-09-18 |
| AU2014201535A1 (en) | 2014-10-02 |
Similar Documents
| Publication | Publication Date | Title |
|---|---|---|
| US11327196B2 (en) | Marine surveys conducted with multiple source arrays | |
| US10670757B2 (en) | Methods and systems for quantifying coherency and constraining coherency-based separation in simultaneous shooting acquisition | |
| AU2013245550B2 (en) | Systems and methods for high-resolution imaging using separated wavefields | |
| US10393901B2 (en) | Wavefield interpolation and regularization in imaging of multiple reflection energy | |
| AU2015261556B2 (en) | Wavefield separation based on a matching operator between sensor responses in multi-component streamers | |
| EP3956696B1 (de) | Dämpfung von niederfrequenten geräuschen in kontinuierlich aufgezeichneten wellenfeldern | |
| US10107929B2 (en) | Methods and systems to determine ghost operators from marine seismic data | |
| AU2015205965B2 (en) | Methods and systems that combine wavefields associated with generalized source activation times and near-continuously recorded seismic data | |
| AU2015203813B2 (en) | Methods and systems of wavefield separation applied to near-continuously recorded wavefields | |
| US11391857B2 (en) | Methods and systems for attenuating residual acoustic energy in seismic data | |
| EP2778720B1 (de) | Verfahren und Systeme zur Interpolation von in Meeresumgebungen erfassten mehrkomponentigen seismischen Daten | |
| NO20151060A1 (en) | Methods and systems that determine a velocity wavefield from a measured pressure wavefield | |
| AU2015201786A1 (en) | Methods and systems to separate wavefields using pressure wavefield data | |
| GB2535883A (en) | Methods and systems of wavefield separation applied to near-continuously recorded wavefields |
Legal Events
| Date | Code | Title | Description |
|---|---|---|---|
| 17P | Request for examination filed |
Effective date: 20140310 |
|
| AK | Designated contracting states |
Kind code of ref document: A2 Designated state(s): AL AT BE BG CH CY CZ DE DK EE ES FI FR GB GR HR HU IE IS IT LI LT LU LV MC MK MT NL NO PL PT RO RS SE SI SK SM TR |
|
| AX | Request for extension of the european patent |
Extension state: BA ME |
|
| PUAI | Public reference made under article 153(3) epc to a published international application that has entered the european phase |
Free format text: ORIGINAL CODE: 0009012 |
|
| PUAL | Search report despatched |
Free format text: ORIGINAL CODE: 0009013 |
|
| AK | Designated contracting states |
Kind code of ref document: A3 Designated state(s): AL AT BE BG CH CY CZ DE DK EE ES FI FR GB GR HR HU IE IS IT LI LT LU LV MC MK MT NL NO PL PT RO RS SE SI SK SM TR |
|
| AX | Request for extension of the european patent |
Extension state: BA ME |
|
| RIC1 | Information provided on ipc code assigned before grant |
Ipc: G01V 1/38 20060101AFI20151221BHEP |
|
| R17P | Request for examination filed (corrected) |
Effective date: 20160727 |
|
| RBV | Designated contracting states (corrected) |
Designated state(s): AL AT BE BG CH CY CZ DE DK EE ES FI FR GB GR HR HU IE IS IT LI LT LU LV MC MK MT NL NO PL PT RO RS SE SI SK SM TR |
|
| STAA | Information on the status of an ep patent application or granted ep patent |
Free format text: STATUS: EXAMINATION IS IN PROGRESS |
|
| 17Q | First examination report despatched |
Effective date: 20180816 |
|
| P01 | Opt-out of the competence of the unified patent court (upc) registered |
Effective date: 20230516 |
|
| GRAP | Despatch of communication of intention to grant a patent |
Free format text: ORIGINAL CODE: EPIDOSNIGR1 |
|
| STAA | Information on the status of an ep patent application or granted ep patent |
Free format text: STATUS: GRANT OF PATENT IS INTENDED |
|
| INTG | Intention to grant announced |
Effective date: 20240620 |
|
| GRAS | Grant fee paid |
Free format text: ORIGINAL CODE: EPIDOSNIGR3 |
|
| GRAA | (expected) grant |
Free format text: ORIGINAL CODE: 0009210 |
|
| STAA | Information on the status of an ep patent application or granted ep patent |
Free format text: STATUS: THE PATENT HAS BEEN GRANTED |
|
| AK | Designated contracting states |
Kind code of ref document: B1 Designated state(s): AL AT BE BG CH CY CZ DE DK EE ES FI FR GB GR HR HU IE IS IT LI LT LU LV MC MK MT NL NO PL PT RO RS SE SI SK SM TR |
|
| REG | Reference to a national code |
Ref country code: GB Ref legal event code: FG4D |
|
| REG | Reference to a national code |
Ref country code: CH Ref legal event code: EP |
|
| REG | Reference to a national code |
Ref country code: DE Ref legal event code: R096 Ref document number: 602014091189 Country of ref document: DE |
|
| REG | Reference to a national code |
Ref country code: IE Ref legal event code: FG4D |
|
| REG | Reference to a national code |
Ref country code: LT Ref legal event code: MG9D |
|
| REG | Reference to a national code |
Ref country code: NL Ref legal event code: MP Effective date: 20241120 |
|
| PG25 | Lapsed in a contracting state [announced via postgrant information from national office to epo] |
Ref country code: HR Free format text: LAPSE BECAUSE OF FAILURE TO SUBMIT A TRANSLATION OF THE DESCRIPTION OR TO PAY THE FEE WITHIN THE PRESCRIBED TIME-LIMIT Effective date: 20241120 Ref country code: PT Free format text: LAPSE BECAUSE OF FAILURE TO SUBMIT A TRANSLATION OF THE DESCRIPTION OR TO PAY THE FEE WITHIN THE PRESCRIBED TIME-LIMIT Effective date: 20250320 Ref country code: IS Free format text: LAPSE BECAUSE OF FAILURE TO SUBMIT A TRANSLATION OF THE DESCRIPTION OR TO PAY THE FEE WITHIN THE PRESCRIBED TIME-LIMIT Effective date: 20250320 |
|
| PG25 | Lapsed in a contracting state [announced via postgrant information from national office to epo] |
Ref country code: FI Free format text: LAPSE BECAUSE OF FAILURE TO SUBMIT A TRANSLATION OF THE DESCRIPTION OR TO PAY THE FEE WITHIN THE PRESCRIBED TIME-LIMIT Effective date: 20241120 Ref country code: NL Free format text: LAPSE BECAUSE OF FAILURE TO SUBMIT A TRANSLATION OF THE DESCRIPTION OR TO PAY THE FEE WITHIN THE PRESCRIBED TIME-LIMIT Effective date: 20241120 |
|
| REG | Reference to a national code |
Ref country code: AT Ref legal event code: MK05 Ref document number: 1744070 Country of ref document: AT Kind code of ref document: T Effective date: 20241120 |
|
| PG25 | Lapsed in a contracting state [announced via postgrant information from national office to epo] |
Ref country code: BG Free format text: LAPSE BECAUSE OF FAILURE TO SUBMIT A TRANSLATION OF THE DESCRIPTION OR TO PAY THE FEE WITHIN THE PRESCRIBED TIME-LIMIT Effective date: 20241120 |
|
| PG25 | Lapsed in a contracting state [announced via postgrant information from national office to epo] |
Ref country code: ES Free format text: LAPSE BECAUSE OF FAILURE TO SUBMIT A TRANSLATION OF THE DESCRIPTION OR TO PAY THE FEE WITHIN THE PRESCRIBED TIME-LIMIT Effective date: 20241120 |
|
| PG25 | Lapsed in a contracting state [announced via postgrant information from national office to epo] |
Ref country code: GR Free format text: LAPSE BECAUSE OF FAILURE TO SUBMIT A TRANSLATION OF THE DESCRIPTION OR TO PAY THE FEE WITHIN THE PRESCRIBED TIME-LIMIT Effective date: 20250221 Ref country code: AT Free format text: LAPSE BECAUSE OF FAILURE TO SUBMIT A TRANSLATION OF THE DESCRIPTION OR TO PAY THE FEE WITHIN THE PRESCRIBED TIME-LIMIT Effective date: 20241120 Ref country code: LV Free format text: LAPSE BECAUSE OF FAILURE TO SUBMIT A TRANSLATION OF THE DESCRIPTION OR TO PAY THE FEE WITHIN THE PRESCRIBED TIME-LIMIT Effective date: 20241120 |
|
| PG25 | Lapsed in a contracting state [announced via postgrant information from national office to epo] |
Ref country code: PL Free format text: LAPSE BECAUSE OF FAILURE TO SUBMIT A TRANSLATION OF THE DESCRIPTION OR TO PAY THE FEE WITHIN THE PRESCRIBED TIME-LIMIT Effective date: 20241120 |
|
| PG25 | Lapsed in a contracting state [announced via postgrant information from national office to epo] |
Ref country code: RS Free format text: LAPSE BECAUSE OF FAILURE TO SUBMIT A TRANSLATION OF THE DESCRIPTION OR TO PAY THE FEE WITHIN THE PRESCRIBED TIME-LIMIT Effective date: 20250220 |
|
| PG25 | Lapsed in a contracting state [announced via postgrant information from national office to epo] |
Ref country code: SM Free format text: LAPSE BECAUSE OF FAILURE TO SUBMIT A TRANSLATION OF THE DESCRIPTION OR TO PAY THE FEE WITHIN THE PRESCRIBED TIME-LIMIT Effective date: 20241120 |
|
| PG25 | Lapsed in a contracting state [announced via postgrant information from national office to epo] |
Ref country code: DK Free format text: LAPSE BECAUSE OF FAILURE TO SUBMIT A TRANSLATION OF THE DESCRIPTION OR TO PAY THE FEE WITHIN THE PRESCRIBED TIME-LIMIT Effective date: 20241120 |
|
| PG25 | Lapsed in a contracting state [announced via postgrant information from national office to epo] |
Ref country code: EE Free format text: LAPSE BECAUSE OF FAILURE TO SUBMIT A TRANSLATION OF THE DESCRIPTION OR TO PAY THE FEE WITHIN THE PRESCRIBED TIME-LIMIT Effective date: 20241120 |
|
| PG25 | Lapsed in a contracting state [announced via postgrant information from national office to epo] |
Ref country code: RO Free format text: LAPSE BECAUSE OF FAILURE TO SUBMIT A TRANSLATION OF THE DESCRIPTION OR TO PAY THE FEE WITHIN THE PRESCRIBED TIME-LIMIT Effective date: 20241120 |
|
| PG25 | Lapsed in a contracting state [announced via postgrant information from national office to epo] |
Ref country code: SK Free format text: LAPSE BECAUSE OF FAILURE TO SUBMIT A TRANSLATION OF THE DESCRIPTION OR TO PAY THE FEE WITHIN THE PRESCRIBED TIME-LIMIT Effective date: 20241120 |
|
| PG25 | Lapsed in a contracting state [announced via postgrant information from national office to epo] |
Ref country code: CZ Free format text: LAPSE BECAUSE OF FAILURE TO SUBMIT A TRANSLATION OF THE DESCRIPTION OR TO PAY THE FEE WITHIN THE PRESCRIBED TIME-LIMIT Effective date: 20241120 |
|
| PG25 | Lapsed in a contracting state [announced via postgrant information from national office to epo] |
Ref country code: IT Free format text: LAPSE BECAUSE OF FAILURE TO SUBMIT A TRANSLATION OF THE DESCRIPTION OR TO PAY THE FEE WITHIN THE PRESCRIBED TIME-LIMIT Effective date: 20241120 |
|
| REG | Reference to a national code |
Ref country code: DE Ref legal event code: R097 Ref document number: 602014091189 Country of ref document: DE |
|
| PG25 | Lapsed in a contracting state [announced via postgrant information from national office to epo] |
Ref country code: SE Free format text: LAPSE BECAUSE OF FAILURE TO SUBMIT A TRANSLATION OF THE DESCRIPTION OR TO PAY THE FEE WITHIN THE PRESCRIBED TIME-LIMIT Effective date: 20241120 |
|
| PLBE | No opposition filed within time limit |
Free format text: ORIGINAL CODE: 0009261 |
|
| STAA | Information on the status of an ep patent application or granted ep patent |
Free format text: STATUS: NO OPPOSITION FILED WITHIN TIME LIMIT |
|
| REG | Reference to a national code |
Ref country code: DE Ref legal event code: R119 Ref document number: 602014091189 Country of ref document: DE |
|
| PG25 | Lapsed in a contracting state [announced via postgrant information from national office to epo] |
Ref country code: MC Free format text: LAPSE BECAUSE OF FAILURE TO SUBMIT A TRANSLATION OF THE DESCRIPTION OR TO PAY THE FEE WITHIN THE PRESCRIBED TIME-LIMIT Effective date: 20241120 |
|
| 26N | No opposition filed |
Effective date: 20250821 |
|
| REG | Reference to a national code |
Ref country code: CH Ref legal event code: H13 Free format text: ST27 STATUS EVENT CODE: U-0-0-H10-H13 (AS PROVIDED BY THE NATIONAL OFFICE) Effective date: 20251023 |
|
| PG25 | Lapsed in a contracting state [announced via postgrant information from national office to epo] |
Ref country code: LU Free format text: LAPSE BECAUSE OF NON-PAYMENT OF DUE FEES Effective date: 20250310 |
|
| REG | Reference to a national code |
Ref country code: BE Ref legal event code: MM Effective date: 20250331 |
|
| PG25 | Lapsed in a contracting state [announced via postgrant information from national office to epo] |
Ref country code: DE Free format text: LAPSE BECAUSE OF NON-PAYMENT OF DUE FEES Effective date: 20251001 |
|
| PG25 | Lapsed in a contracting state [announced via postgrant information from national office to epo] |
Ref country code: BE Free format text: LAPSE BECAUSE OF NON-PAYMENT OF DUE FEES Effective date: 20250331 |
|
| PG25 | Lapsed in a contracting state [announced via postgrant information from national office to epo] |
Ref country code: CH Free format text: LAPSE BECAUSE OF NON-PAYMENT OF DUE FEES Effective date: 20250331 |
|
| PG25 | Lapsed in a contracting state [announced via postgrant information from national office to epo] |
Ref country code: IE Free format text: LAPSE BECAUSE OF NON-PAYMENT OF DUE FEES Effective date: 20250310 |
|
| PGFP | Annual fee paid to national office [announced via postgrant information from national office to epo] |
Ref country code: GB Payment date: 20260128 Year of fee payment: 13 |
|
| PGFP | Annual fee paid to national office [announced via postgrant information from national office to epo] |
Ref country code: NO Payment date: 20260227 Year of fee payment: 13 |
|
| PGFP | Annual fee paid to national office [announced via postgrant information from national office to epo] |
Ref country code: FR Payment date: 20260123 Year of fee payment: 13 |