EP2767275A1 - Nortriptyline, haloperidol or prochlorperazine edisylate for use in the treatment of tuberculosis as well as two screening methods - Google Patents
Nortriptyline, haloperidol or prochlorperazine edisylate for use in the treatment of tuberculosis as well as two screening methods Download PDFInfo
- Publication number
- EP2767275A1 EP2767275A1 EP13155069.1A EP13155069A EP2767275A1 EP 2767275 A1 EP2767275 A1 EP 2767275A1 EP 13155069 A EP13155069 A EP 13155069A EP 2767275 A1 EP2767275 A1 EP 2767275A1
- Authority
- EP
- European Patent Office
- Prior art keywords
- cell
- cells
- parameters
- compounds
- bacteria
- Prior art date
- Legal status (The legal status is an assumption and is not a legal conclusion. Google has not performed a legal analysis and makes no representation as to the accuracy of the status listed.)
- Withdrawn
Links
- LNEPOXFFQSENCJ-UHFFFAOYSA-N haloperidol Chemical compound C1CC(O)(C=2C=CC(Cl)=CC=2)CCN1CCCC(=O)C1=CC=C(F)C=C1 LNEPOXFFQSENCJ-UHFFFAOYSA-N 0.000 title claims abstract description 144
- WIKYUJGCLQQFNW-UHFFFAOYSA-N prochlorperazine Chemical compound C1CN(C)CCN1CCCN1C2=CC(Cl)=CC=C2SC2=CC=CC=C21 WIKYUJGCLQQFNW-UHFFFAOYSA-N 0.000 title claims abstract description 96
- 229960003111 prochlorperazine Drugs 0.000 title claims abstract description 93
- 238000000034 method Methods 0.000 title claims abstract description 90
- PHVGLTMQBUFIQQ-UHFFFAOYSA-N Nortryptiline Chemical compound C1CC2=CC=CC=C2C(=CCCNC)C2=CC=CC=C21 PHVGLTMQBUFIQQ-UHFFFAOYSA-N 0.000 title claims abstract description 75
- 229960001158 nortriptyline Drugs 0.000 title claims abstract description 67
- 229960003878 haloperidol Drugs 0.000 title claims abstract description 66
- 201000008827 tuberculosis Diseases 0.000 title claims abstract description 41
- 238000012216 screening Methods 0.000 title description 10
- 150000001875 compounds Chemical class 0.000 claims abstract description 249
- 239000008194 pharmaceutical composition Substances 0.000 claims abstract description 22
- 230000002147 killing effect Effects 0.000 claims abstract description 18
- 150000002611 lead compounds Chemical class 0.000 claims abstract description 13
- 230000007248 cellular mechanism Effects 0.000 claims abstract description 12
- 230000003213 activating effect Effects 0.000 claims abstract description 8
- 239000003937 drug carrier Substances 0.000 claims abstract description 7
- 241000894006 Bacteria Species 0.000 claims description 122
- 238000012360 testing method Methods 0.000 claims description 55
- 230000000694 effects Effects 0.000 claims description 44
- 230000001580 bacterial effect Effects 0.000 claims description 40
- 230000006870 function Effects 0.000 claims description 36
- 108090000623 proteins and genes Proteins 0.000 claims description 35
- 238000009826 distribution Methods 0.000 claims description 31
- 239000000126 substance Substances 0.000 claims description 28
- 239000003550 marker Substances 0.000 claims description 24
- 239000000523 sample Substances 0.000 claims description 23
- 238000004422 calculation algorithm Methods 0.000 claims description 22
- 230000002068 genetic effect Effects 0.000 claims description 18
- 108091030071 RNAI Proteins 0.000 claims description 17
- 230000009368 gene silencing by RNA Effects 0.000 claims description 17
- 102100037850 Interferon gamma Human genes 0.000 claims description 15
- 108010074328 Interferon-gamma Proteins 0.000 claims description 15
- 230000004075 alteration Effects 0.000 claims description 15
- 230000015572 biosynthetic process Effects 0.000 claims description 15
- 231100000419 toxicity Toxicity 0.000 claims description 14
- 230000001988 toxicity Effects 0.000 claims description 14
- 239000003795 chemical substances by application Substances 0.000 claims description 12
- 238000003786 synthesis reaction Methods 0.000 claims description 10
- 239000004475 Arginine Substances 0.000 claims description 9
- ODKSFYDXXFIFQN-UHFFFAOYSA-N arginine Natural products OC(=O)C(N)CCCNC(N)=N ODKSFYDXXFIFQN-UHFFFAOYSA-N 0.000 claims description 9
- 230000003115 biocidal effect Effects 0.000 claims description 9
- 230000004640 cellular pathway Effects 0.000 claims description 9
- 229930003316 Vitamin D Natural products 0.000 claims description 7
- QYSXJUFSXHHAJI-XFEUOLMDSA-N Vitamin D3 Natural products C1(/[C@@H]2CC[C@@H]([C@]2(CCC1)C)[C@H](C)CCCC(C)C)=C/C=C1\C[C@@H](O)CCC1=C QYSXJUFSXHHAJI-XFEUOLMDSA-N 0.000 claims description 7
- 230000003247 decreasing effect Effects 0.000 claims description 7
- 230000001976 improved effect Effects 0.000 claims description 7
- 230000001404 mediated effect Effects 0.000 claims description 7
- 230000000144 pharmacologic effect Effects 0.000 claims description 7
- 238000001228 spectrum Methods 0.000 claims description 7
- 235000019166 vitamin D Nutrition 0.000 claims description 7
- 239000011710 vitamin D Substances 0.000 claims description 7
- 150000003710 vitamin D derivatives Chemical class 0.000 claims description 7
- 229940046008 vitamin d Drugs 0.000 claims description 7
- ODKSFYDXXFIFQN-BYPYZUCNSA-P L-argininium(2+) Chemical compound NC(=[NH2+])NCCC[C@H]([NH3+])C(O)=O ODKSFYDXXFIFQN-BYPYZUCNSA-P 0.000 claims description 6
- 230000032050 esterification Effects 0.000 claims description 6
- 238000005886 esterification reaction Methods 0.000 claims description 6
- 125000002887 hydroxy group Chemical group [H]O* 0.000 claims description 6
- 238000006243 chemical reaction Methods 0.000 claims description 5
- 210000000056 organ Anatomy 0.000 claims description 5
- 238000010186 staining Methods 0.000 claims description 5
- 230000001225 therapeutic effect Effects 0.000 claims description 5
- 229910019142 PO4 Inorganic materials 0.000 claims description 4
- 125000002777 acetyl group Chemical group [H]C([H])([H])C(*)=O 0.000 claims description 4
- 230000008859 change Effects 0.000 claims description 4
- 235000021317 phosphate Nutrition 0.000 claims description 4
- 125000001424 substituent group Chemical group 0.000 claims description 4
- 239000013543 active substance Substances 0.000 claims description 3
- 238000001914 filtration Methods 0.000 claims description 3
- 102000034287 fluorescent proteins Human genes 0.000 claims description 3
- 108091006047 fluorescent proteins Proteins 0.000 claims description 3
- 239000012474 protein marker Substances 0.000 claims description 3
- 150000003839 salts Chemical class 0.000 claims description 3
- 230000009466 transformation Effects 0.000 claims description 3
- RREANTFLPGEWEN-MBLPBCRHSA-N 7-[4-[[(3z)-3-[4-amino-5-[(3,4,5-trimethoxyphenyl)methyl]pyrimidin-2-yl]imino-5-fluoro-2-oxoindol-1-yl]methyl]piperazin-1-yl]-1-cyclopropyl-6-fluoro-4-oxoquinoline-3-carboxylic acid Chemical compound COC1=C(OC)C(OC)=CC(CC=2C(=NC(\N=C/3C4=CC(F)=CC=C4N(CN4CCN(CC4)C=4C(=CC=5C(=O)C(C(O)=O)=CN(C=5C=4)C4CC4)F)C\3=O)=NC=2)N)=C1 RREANTFLPGEWEN-MBLPBCRHSA-N 0.000 claims description 2
- 238000006640 acetylation reaction Methods 0.000 claims description 2
- 150000001299 aldehydes Chemical class 0.000 claims description 2
- 150000001408 amides Chemical class 0.000 claims description 2
- 125000003178 carboxy group Chemical group [H]OC(*)=O 0.000 claims description 2
- 150000001735 carboxylic acids Chemical class 0.000 claims description 2
- 125000004122 cyclic group Chemical group 0.000 claims description 2
- 238000001212 derivatisation Methods 0.000 claims description 2
- 235000011180 diphosphates Nutrition 0.000 claims description 2
- 230000029142 excretion Effects 0.000 claims description 2
- 150000002466 imines Chemical class 0.000 claims description 2
- 150000002576 ketones Chemical class 0.000 claims description 2
- 230000004060 metabolic process Effects 0.000 claims description 2
- 230000004048 modification Effects 0.000 claims description 2
- 238000012986 modification Methods 0.000 claims description 2
- 150000002917 oxazolidines Chemical class 0.000 claims description 2
- 150000002923 oximes Chemical class 0.000 claims description 2
- PWXJULSLLONQHY-UHFFFAOYSA-N phenylcarbamic acid Chemical class OC(=O)NC1=CC=CC=C1 PWXJULSLLONQHY-UHFFFAOYSA-N 0.000 claims description 2
- 150000003013 phosphoric acid derivatives Chemical class 0.000 claims description 2
- 229920000642 polymer Polymers 0.000 claims description 2
- 150000003467 sulfuric acid derivatives Chemical class 0.000 claims description 2
- 231100001274 therapeutic index Toxicity 0.000 claims description 2
- 150000003548 thiazolidines Chemical class 0.000 claims description 2
- 238000005457 optimization Methods 0.000 claims 1
- 210000004027 cell Anatomy 0.000 description 276
- IAZDPXIOMUYVGZ-UHFFFAOYSA-N Dimethylsulphoxide Chemical compound CS(C)=O IAZDPXIOMUYVGZ-UHFFFAOYSA-N 0.000 description 66
- 239000005090 green fluorescent protein Substances 0.000 description 64
- 230000003834 intracellular effect Effects 0.000 description 46
- 230000004900 autophagic degradation Effects 0.000 description 41
- 238000003556 assay Methods 0.000 description 35
- 241000186366 Mycobacterium bovis Species 0.000 description 31
- 210000001163 endosome Anatomy 0.000 description 30
- 108010043121 Green Fluorescent Proteins Proteins 0.000 description 26
- 102000004144 Green Fluorescent Proteins Human genes 0.000 description 26
- 230000012202 endocytosis Effects 0.000 description 26
- 238000002474 experimental method Methods 0.000 description 25
- 210000000680 phagosome Anatomy 0.000 description 25
- 210000004957 autophagosome Anatomy 0.000 description 24
- 229940079593 drug Drugs 0.000 description 24
- 239000003814 drug Substances 0.000 description 24
- 230000032258 transport Effects 0.000 description 23
- 102000007330 LDL Lipoproteins Human genes 0.000 description 22
- 108010007622 LDL Lipoproteins Proteins 0.000 description 22
- 238000004458 analytical method Methods 0.000 description 20
- 230000004083 survival effect Effects 0.000 description 18
- -1 Serenase Chemical compound 0.000 description 17
- 230000001965 increasing effect Effects 0.000 description 17
- 210000004940 nucleus Anatomy 0.000 description 17
- 210000003712 lysosome Anatomy 0.000 description 16
- 230000001868 lysosomic effect Effects 0.000 description 16
- 239000000203 mixture Substances 0.000 description 16
- 238000013459 approach Methods 0.000 description 15
- 230000004908 autophagic flux Effects 0.000 description 15
- 208000015181 infectious disease Diseases 0.000 description 15
- 210000002540 macrophage Anatomy 0.000 description 15
- 230000001355 anti-mycobacterial effect Effects 0.000 description 14
- 210000004980 monocyte derived macrophage Anatomy 0.000 description 14
- 239000013598 vector Substances 0.000 description 13
- 230000001413 cellular effect Effects 0.000 description 12
- 230000008045 co-localization Effects 0.000 description 12
- 239000000306 component Substances 0.000 description 12
- 230000001419 dependent effect Effects 0.000 description 12
- 238000005259 measurement Methods 0.000 description 12
- 239000012528 membrane Substances 0.000 description 12
- WHTVZRBIWZFKQO-AWEZNQCLSA-N (S)-chloroquine Chemical compound ClC1=CC=C2C(N[C@@H](C)CCCN(CC)CC)=CC=NC2=C1 WHTVZRBIWZFKQO-AWEZNQCLSA-N 0.000 description 11
- 239000003926 antimycobacterial agent Substances 0.000 description 11
- WHTVZRBIWZFKQO-UHFFFAOYSA-N chloroquine Natural products ClC1=CC=C2C(NC(C)CCCN(CC)CC)=CC=NC2=C1 WHTVZRBIWZFKQO-UHFFFAOYSA-N 0.000 description 11
- 229960003677 chloroquine Drugs 0.000 description 11
- 230000035800 maturation Effects 0.000 description 11
- XDHNQDDQEHDUTM-ZGOPVUMHSA-N (7R,8S,9S,15S,16R)-16-[(2S,3R,4S)-4-[(2R,4R,5S,6R)-2,4-dihydroxy-5-methyl-6-propan-2-yloxan-2-yl]-3-hydroxypentan-2-yl]-8-hydroxy-3,15-dimethoxy-5,7,9,11-tetramethyl-1-oxacyclohexadeca-3,5,11,13-tetraen-2-one Chemical compound CO[C@H]1C=CC=C(C)C[C@H](C)[C@H](O)[C@H](C)C=C(C)C=C(OC)C(=O)O[C@@H]1[C@@H](C)[C@@H](O)[C@H](C)[C@]1(O)O[C@H](C(C)C)[C@@H](C)[C@H](O)C1 XDHNQDDQEHDUTM-ZGOPVUMHSA-N 0.000 description 10
- 230000002121 endocytic effect Effects 0.000 description 10
- 230000007246 mechanism Effects 0.000 description 10
- 230000000670 limiting effect Effects 0.000 description 9
- 230000037361 pathway Effects 0.000 description 9
- FWBHETKCLVMNFS-UHFFFAOYSA-N 4',6-Diamino-2-phenylindol Chemical compound C1=CC(C(=N)N)=CC=C1C1=CC2=CC=C(C(N)=N)C=C2N1 FWBHETKCLVMNFS-UHFFFAOYSA-N 0.000 description 8
- 208000035143 Bacterial infection Diseases 0.000 description 8
- 208000022362 bacterial infectious disease Diseases 0.000 description 8
- 239000006185 dispersion Substances 0.000 description 8
- 229910052731 fluorine Inorganic materials 0.000 description 8
- 239000011159 matrix material Substances 0.000 description 8
- 208000024191 minimally invasive lung adenocarcinoma Diseases 0.000 description 8
- 239000013642 negative control Substances 0.000 description 8
- 230000015556 catabolic process Effects 0.000 description 7
- 238000006731 degradation reaction Methods 0.000 description 7
- 239000007850 fluorescent dye Substances 0.000 description 7
- 230000033001 locomotion Effects 0.000 description 7
- 230000008569 process Effects 0.000 description 7
- 235000018102 proteins Nutrition 0.000 description 7
- 102000004169 proteins and genes Human genes 0.000 description 7
- 238000011002 quantification Methods 0.000 description 7
- JQXXHWHPUNPDRT-WLSIYKJHSA-N rifampicin Chemical compound O([C@](C1=O)(C)O/C=C/[C@@H]([C@H]([C@@H](OC(C)=O)[C@H](C)[C@H](O)[C@H](C)[C@@H](O)[C@@H](C)\C=C\C=C(C)/C(=O)NC=2C(O)=C3C([O-])=C4C)C)OC)C4=C1C3=C(O)C=2\C=N\N1CC[NH+](C)CC1 JQXXHWHPUNPDRT-WLSIYKJHSA-N 0.000 description 7
- 229960001225 rifampicin Drugs 0.000 description 7
- ZPBYVFQJHWLTFB-UHFFFAOYSA-N 3-methyl-7H-purin-6-imine Chemical compound CN1C=NC(=N)C2=C1NC=N2 ZPBYVFQJHWLTFB-UHFFFAOYSA-N 0.000 description 6
- PLXBWHJQWKZRKG-UHFFFAOYSA-N Resazurin Chemical compound C1=CC(=O)C=C2OC3=CC(O)=CC=C3[N+]([O-])=C21 PLXBWHJQWKZRKG-UHFFFAOYSA-N 0.000 description 6
- 230000002378 acidificating effect Effects 0.000 description 6
- 230000000844 anti-bacterial effect Effects 0.000 description 6
- XDHNQDDQEHDUTM-UHFFFAOYSA-N bafliomycin A1 Natural products COC1C=CC=C(C)CC(C)C(O)C(C)C=C(C)C=C(OC)C(=O)OC1C(C)C(O)C(C)C1(O)OC(C(C)C)C(C)C(O)C1 XDHNQDDQEHDUTM-UHFFFAOYSA-N 0.000 description 6
- 230000000875 corresponding effect Effects 0.000 description 6
- 238000006073 displacement reaction Methods 0.000 description 6
- 230000004927 fusion Effects 0.000 description 6
- 229910052739 hydrogen Inorganic materials 0.000 description 6
- 238000010191 image analysis Methods 0.000 description 6
- 230000010354 integration Effects 0.000 description 6
- 230000000877 morphologic effect Effects 0.000 description 6
- ZAHRKKWIAAJSAO-UHFFFAOYSA-N rapamycin Natural products COCC(O)C(=C/C(C)C(=O)CC(OC(=O)C1CCCCN1C(=O)C(=O)C2(O)OC(CC(OC)C(=CC=CC=CC(C)CC(C)C(=O)C)C)CCC2C)C(C)CC3CCC(O)C(C3)OC)C ZAHRKKWIAAJSAO-UHFFFAOYSA-N 0.000 description 6
- QFJCIRLUMZQUOT-HPLJOQBZSA-N sirolimus Chemical compound C1C[C@@H](O)[C@H](OC)C[C@@H]1C[C@@H](C)[C@H]1OC(=O)[C@@H]2CCCCN2C(=O)C(=O)[C@](O)(O2)[C@H](C)CC[C@H]2C[C@H](OC)/C(C)=C/C=C/C=C/[C@@H](C)C[C@@H](C)C(=O)[C@H](OC)[C@H](O)/C(C)=C/[C@@H](C)C(=O)C1 QFJCIRLUMZQUOT-HPLJOQBZSA-N 0.000 description 6
- 229960002930 sirolimus Drugs 0.000 description 6
- VBEQCZHXXJYVRD-GACYYNSASA-N uroanthelone Chemical compound C([C@@H](C(=O)N[C@H](C(=O)N[C@@H](CS)C(=O)N[C@@H](CC(N)=O)C(=O)N[C@@H](CS)C(=O)N[C@H](C(=O)N[C@@H]([C@@H](C)CC)C(=O)NCC(=O)N[C@@H](CC=1C=CC(O)=CC=1)C(=O)N[C@@H](CO)C(=O)NCC(=O)N[C@@H](CC(O)=O)C(=O)N[C@@H](CCCNC(N)=N)C(=O)N[C@@H](CS)C(=O)N[C@@H](CCC(N)=O)C(=O)N[C@@H]([C@@H](C)O)C(=O)N[C@@H](CCCNC(N)=N)C(=O)N[C@@H](CC(O)=O)C(=O)N[C@@H](CC(C)C)C(=O)N[C@@H](CCCNC(N)=N)C(=O)N[C@@H](CC=1C2=CC=CC=C2NC=1)C(=O)N[C@@H](CC=1C2=CC=CC=C2NC=1)C(=O)N[C@@H](CCC(O)=O)C(=O)N[C@@H](CC(C)C)C(=O)N[C@@H](CCCNC(N)=N)C(O)=O)C(C)C)[C@@H](C)O)NC(=O)[C@H](CO)NC(=O)[C@H](CC(O)=O)NC(=O)[C@H](CC(C)C)NC(=O)[C@H](CO)NC(=O)[C@H](CCC(O)=O)NC(=O)[C@@H](NC(=O)[C@H](CC=1NC=NC=1)NC(=O)[C@H](CCSC)NC(=O)[C@H](CS)NC(=O)[C@@H](NC(=O)CNC(=O)CNC(=O)[C@H](CC(N)=O)NC(=O)[C@H](CC(C)C)NC(=O)[C@H](CS)NC(=O)[C@H](CC=1C=CC(O)=CC=1)NC(=O)CNC(=O)[C@H](CC(O)=O)NC(=O)[C@H](CC=1C=CC(O)=CC=1)NC(=O)[C@H](CO)NC(=O)[C@H](CO)NC(=O)[C@H]1N(CCC1)C(=O)[C@H](CS)NC(=O)CNC(=O)[C@H]1N(CCC1)C(=O)[C@H](CC=1C=CC(O)=CC=1)NC(=O)[C@H](CO)NC(=O)[C@@H](N)CC(N)=O)C(C)C)[C@@H](C)CC)C1=CC=C(O)C=C1 VBEQCZHXXJYVRD-GACYYNSASA-N 0.000 description 6
- FSASIHFSFGAIJM-UHFFFAOYSA-N 3MeA Natural products CN1C=NC(N)=C2N=CN=C12 FSASIHFSFGAIJM-UHFFFAOYSA-N 0.000 description 5
- 208000012886 Vertigo Diseases 0.000 description 5
- 229960004821 amikacin Drugs 0.000 description 5
- LKCWBDHBTVXHDL-RMDFUYIESA-N amikacin Chemical compound O([C@@H]1[C@@H](N)C[C@H]([C@@H]([C@H]1O)O[C@@H]1[C@@H]([C@@H](N)[C@H](O)[C@@H](CO)O1)O)NC(=O)[C@@H](O)CCN)[C@H]1O[C@H](CN)[C@@H](O)[C@H](O)[C@H]1O LKCWBDHBTVXHDL-RMDFUYIESA-N 0.000 description 5
- 229960000836 amitriptyline Drugs 0.000 description 5
- KRMDCWKBEZIMAB-UHFFFAOYSA-N amitriptyline Chemical compound C1CC2=CC=CC=C2C(=CCCN(C)C)C2=CC=CC=C21 KRMDCWKBEZIMAB-UHFFFAOYSA-N 0.000 description 5
- 230000004071 biological effect Effects 0.000 description 5
- 230000037396 body weight Effects 0.000 description 5
- 229910052799 carbon Inorganic materials 0.000 description 5
- 238000010201 enrichment analysis Methods 0.000 description 5
- 238000011534 incubation Methods 0.000 description 5
- 239000003112 inhibitor Substances 0.000 description 5
- 230000003993 interaction Effects 0.000 description 5
- 230000004899 motility Effects 0.000 description 5
- 108020004707 nucleic acids Proteins 0.000 description 5
- 150000007523 nucleic acids Chemical class 0.000 description 5
- 102000039446 nucleic acids Human genes 0.000 description 5
- 238000003908 quality control method Methods 0.000 description 5
- 230000002829 reductive effect Effects 0.000 description 5
- 150000003384 small molecules Chemical class 0.000 description 5
- 238000010200 validation analysis Methods 0.000 description 5
- GMBQZIIUCVWOCD-UQHLGXRBSA-N (25R)-5beta-spirostan-3beta-ol Chemical compound O([C@@H]1[C@@H]([C@]2(CC[C@@H]3[C@@]4(C)CC[C@H](O)C[C@H]4CC[C@H]3[C@@H]2C1)C)[C@@H]1C)[C@]11CC[C@@H](C)CO1 GMBQZIIUCVWOCD-UQHLGXRBSA-N 0.000 description 4
- CFKMVGJGLGKFKI-UHFFFAOYSA-N 4-chloro-m-cresol Chemical compound CC1=CC(O)=CC=C1Cl CFKMVGJGLGKFKI-UHFFFAOYSA-N 0.000 description 4
- GZYFIMLSHBLMKF-UHFFFAOYSA-N ALBIZZIINE Chemical compound OC(=O)C(N)CNC(N)=O GZYFIMLSHBLMKF-UHFFFAOYSA-N 0.000 description 4
- DGXLEDCXMIJNPJ-UHFFFAOYSA-N Arthoniaic acid Chemical compound CCCCCC(=O)CC1=CC(O)=CC(O)=C1C(=O)OC1=CC(CC(=O)CCCCC)=C(C(O)=O)C(OC)=C1 DGXLEDCXMIJNPJ-UHFFFAOYSA-N 0.000 description 4
- 108020004459 Small interfering RNA Proteins 0.000 description 4
- FAPWRFPIFSIZLT-UHFFFAOYSA-M Sodium chloride Chemical compound [Na+].[Cl-] FAPWRFPIFSIZLT-UHFFFAOYSA-M 0.000 description 4
- 102000004338 Transferrin Human genes 0.000 description 4
- 108090000901 Transferrin Proteins 0.000 description 4
- 230000000996 additive effect Effects 0.000 description 4
- YZXBAPSDXZZRGB-DOFZRALJSA-N arachidonic acid Chemical compound CCCCC\C=C/C\C=C/C\C=C/C\C=C/CCCC(O)=O YZXBAPSDXZZRGB-DOFZRALJSA-N 0.000 description 4
- 230000008901 benefit Effects 0.000 description 4
- MYSWGUAQZAJSOK-UHFFFAOYSA-N ciprofloxacin Chemical compound C12=CC(N3CCNCC3)=C(F)C=C2C(=O)C(C(=O)O)=CN1C1CC1 MYSWGUAQZAJSOK-UHFFFAOYSA-N 0.000 description 4
- 230000007423 decrease Effects 0.000 description 4
- 230000003413 degradative effect Effects 0.000 description 4
- 201000010099 disease Diseases 0.000 description 4
- 208000037265 diseases, disorders, signs and symptoms Diseases 0.000 description 4
- 238000001493 electron microscopy Methods 0.000 description 4
- HKQYGTCOTHHOMP-UHFFFAOYSA-N formononetin Chemical compound C1=CC(OC)=CC=C1C1=COC2=CC(O)=CC=C2C1=O HKQYGTCOTHHOMP-UHFFFAOYSA-N 0.000 description 4
- 230000005764 inhibitory process Effects 0.000 description 4
- 239000007788 liquid Substances 0.000 description 4
- 230000002132 lysosomal effect Effects 0.000 description 4
- 230000009670 mycobacterial growth Effects 0.000 description 4
- IEVVSJFLBYOUCJ-UHFFFAOYSA-N norstictic acid Chemical compound O1C2=C3C(O)OC(=O)C3=C(O)C(C)=C2OC(=O)C2=C1C(C=O)=C(O)C=C2C IEVVSJFLBYOUCJ-UHFFFAOYSA-N 0.000 description 4
- WEXRUCMBJFQVBZ-UHFFFAOYSA-N pentobarbital Chemical compound CCCC(C)C1(CC)C(=O)NC(=O)NC1=O WEXRUCMBJFQVBZ-UHFFFAOYSA-N 0.000 description 4
- 230000009467 reduction Effects 0.000 description 4
- 239000000243 solution Substances 0.000 description 4
- 238000009987 spinning Methods 0.000 description 4
- 230000009897 systematic effect Effects 0.000 description 4
- 239000012581 transferrin Substances 0.000 description 4
- XLYOFNOQVPJJNP-UHFFFAOYSA-N water Substances O XLYOFNOQVPJJNP-UHFFFAOYSA-N 0.000 description 4
- VURKRJGMSKJIQX-UHFFFAOYSA-N xanthopterin Chemical compound N1C(=O)C=NC2=C1C(=O)N=C(N)N2 VURKRJGMSKJIQX-UHFFFAOYSA-N 0.000 description 4
- QTBSBXVTEAMEQO-UHFFFAOYSA-N Acetic acid Chemical compound CC(O)=O QTBSBXVTEAMEQO-UHFFFAOYSA-N 0.000 description 3
- 102400001368 Epidermal growth factor Human genes 0.000 description 3
- 101800003838 Epidermal growth factor Proteins 0.000 description 3
- 241001646725 Mycobacterium tuberculosis H37Rv Species 0.000 description 3
- 101150030875 RAB7A gene Proteins 0.000 description 3
- 102000013530 TOR Serine-Threonine Kinases Human genes 0.000 description 3
- 108010065917 TOR Serine-Threonine Kinases Proteins 0.000 description 3
- 238000009825 accumulation Methods 0.000 description 3
- 230000009471 action Effects 0.000 description 3
- 239000000654 additive Substances 0.000 description 3
- 238000003349 alamar blue assay Methods 0.000 description 3
- 230000006907 apoptotic process Effects 0.000 description 3
- 239000000969 carrier Substances 0.000 description 3
- 230000033077 cellular process Effects 0.000 description 3
- 238000007621 cluster analysis Methods 0.000 description 3
- 230000002596 correlated effect Effects 0.000 description 3
- 210000000805 cytoplasm Anatomy 0.000 description 3
- 230000001086 cytosolic effect Effects 0.000 description 3
- 238000013461 design Methods 0.000 description 3
- 230000001627 detrimental effect Effects 0.000 description 3
- VYFYYTLLBUKUHU-UHFFFAOYSA-N dopamine Chemical compound NCCC1=CC=C(O)C(O)=C1 VYFYYTLLBUKUHU-UHFFFAOYSA-N 0.000 description 3
- 229940072185 drug for treatment of tuberculosis Drugs 0.000 description 3
- 229940116977 epidermal growth factor Drugs 0.000 description 3
- 239000000284 extract Substances 0.000 description 3
- 238000009472 formulation Methods 0.000 description 3
- 230000012010 growth Effects 0.000 description 3
- 230000007438 host cellular process Effects 0.000 description 3
- 235000003642 hunger Nutrition 0.000 description 3
- 230000006698 induction Effects 0.000 description 3
- 230000002401 inhibitory effect Effects 0.000 description 3
- 230000006674 lysosomal degradation Effects 0.000 description 3
- 238000002483 medication Methods 0.000 description 3
- 210000001616 monocyte Anatomy 0.000 description 3
- 230000020477 pH reduction Effects 0.000 description 3
- 230000001717 pathogenic effect Effects 0.000 description 3
- 230000007115 recruitment Effects 0.000 description 3
- 230000001105 regulatory effect Effects 0.000 description 3
- 230000011218 segmentation Effects 0.000 description 3
- 230000037351 starvation Effects 0.000 description 3
- XMVQWNRDPAAMJB-UHFFFAOYSA-N (+)-13-Cyclopent-2-enyl-tridecansaeure Natural products OC(=O)CCCCCCCCCCCCC1CCC=C1 XMVQWNRDPAAMJB-UHFFFAOYSA-N 0.000 description 2
- GXFZCDMWGMFGFL-KKXMJGKMSA-N (+)-Tubocurarine chloride hydrochloride Chemical compound [Cl-].[Cl-].C([C@H]1[N+](C)(C)CCC=2C=C(C(=C(OC3=CC=C(C=C3)C[C@H]3C=4C=C(C(=CC=4CC[NH+]3C)OC)O3)C=21)O)OC)C1=CC=C(O)C3=C1 GXFZCDMWGMFGFL-KKXMJGKMSA-N 0.000 description 2
- RWCVSDKDFSVZNF-KRYGIPSASA-N (1R,2R,4S)-2-ethyl-2,4,5,7,10-pentahydroxy-6,11-dioxo-3,4-dihydro-1H-tetracene-1-carboxylic acid methyl ester Chemical compound O=C1C2=C(O)C=CC(O)=C2C(=O)C2=C1C(O)=C1[C@@H](O)C[C@@](CC)(O)[C@H](C(=O)OC)C1=C2 RWCVSDKDFSVZNF-KRYGIPSASA-N 0.000 description 2
- ZERWDZDNDJBYKA-UHFFFAOYSA-N (2,5-dioxopyrrolidin-1-yl) octadecanoate Chemical compound CCCCCCCCCCCCCCCCCC(=O)ON1C(=O)CCC1=O ZERWDZDNDJBYKA-UHFFFAOYSA-N 0.000 description 2
- XMAYWYJOQHXEEK-OZXSUGGESA-N (2R,4S)-ketoconazole Chemical compound C1CN(C(=O)C)CCN1C(C=C1)=CC=C1OC[C@@H]1O[C@@](CN2C=NC=C2)(C=2C(=CC(Cl)=CC=2)Cl)OC1 XMAYWYJOQHXEEK-OZXSUGGESA-N 0.000 description 2
- AAFNEINEQRQMTF-LREBCSMRSA-N (2r,3r)-2,3-dihydroxybutanedioic acid;1,2,2,6,6-pentamethylpiperidine Chemical compound OC(=O)[C@H](O)[C@@H](O)C(O)=O.CN1C(C)(C)CCCC1(C)C AAFNEINEQRQMTF-LREBCSMRSA-N 0.000 description 2
- AJZJIYUOOJLBAU-ZYIUJVGZSA-N (2r,3s)-2,3-dihydroxybutanedioic acid;(2s)-n,n,2-trimethyl-3-phenothiazin-10-ylpropan-1-amine Chemical compound OC(=O)[C@@H](O)[C@@H](O)C(O)=O.C1=CC=C2N(C[C@H](CN(C)C)C)C3=CC=CC=C3SC2=C1.C1=CC=C2N(C[C@H](CN(C)C)C)C3=CC=CC=C3SC2=C1 AJZJIYUOOJLBAU-ZYIUJVGZSA-N 0.000 description 2
- GRRNUXAQVGOGFE-HUCHGKBZSA-N (3'r,3as,4s,4's,5'r,6r,6'r,7s,7as)-4-[(1r,2s,3r,5s,6r)-3-amino-2,6-dihydroxy-5-(methylamino)cyclohexyl]oxy-6'-[(1s)-1-amino-2-hydroxyethyl]-6-(hydroxymethyl)spiro[4,6,7,7a-tetrahydro-3ah-[1,3]dioxolo[4,5-c]pyran-2,2'-oxane]-3',4',5',7-tetrol Chemical compound O[C@@H]1[C@@H](NC)C[C@@H](N)[C@H](O)[C@H]1O[C@H]1[C@H]2OC3([C@@H]([C@@H](O)[C@@H](O)[C@@H]([C@@H](N)CO)O3)O)O[C@H]2[C@@H](O)[C@@H](CO)O1 GRRNUXAQVGOGFE-HUCHGKBZSA-N 0.000 description 2
- NTWLPZMPTFQYQI-UHFFFAOYSA-N (3alpha)-olean-12-ene-3,23-diol Natural products C1CC(O)C(C)(CO)C2CCC3(C)C4(C)CCC5(C)CCC(C)(C)CC5C4=CCC3C21C NTWLPZMPTFQYQI-UHFFFAOYSA-N 0.000 description 2
- YQSHYGCCYVPRDI-UHFFFAOYSA-N (4-propan-2-ylphenyl)methanamine Chemical compound CC(C)C1=CC=C(CN)C=C1 YQSHYGCCYVPRDI-UHFFFAOYSA-N 0.000 description 2
- METKIMKYRPQLGS-GFCCVEGCSA-N (R)-atenolol Chemical compound CC(C)NC[C@@H](O)COC1=CC=C(CC(N)=O)C=C1 METKIMKYRPQLGS-GFCCVEGCSA-N 0.000 description 2
- XMVQWNRDPAAMJB-QGZVFWFLSA-N (S)-chaulmoogric acid Chemical compound OC(=O)CCCCCCCCCCCC[C@H]1CCC=C1 XMVQWNRDPAAMJB-QGZVFWFLSA-N 0.000 description 2
- IPANUAHQWFDVAG-BTJKTKAUSA-N (z)-4-hydroxy-4-oxobut-2-enoate;1-methyl-4-thioxanthen-9-ylidenepiperidin-1-ium Chemical compound OC(=O)\C=C/C(O)=O.C1CN(C)CCC1=C1C2=CC=CC=C2SC2=CC=CC=C21 IPANUAHQWFDVAG-BTJKTKAUSA-N 0.000 description 2
- DTOUUUZOYKYHEP-UHFFFAOYSA-N 1,3-bis(2-ethylhexyl)-5-methyl-1,3-diazinan-5-amine Chemical compound CCCCC(CC)CN1CN(CC(CC)CCCC)CC(C)(N)C1 DTOUUUZOYKYHEP-UHFFFAOYSA-N 0.000 description 2
- FLNXBVJLPJNOSI-UHFFFAOYSA-N 1-[2-[(4-chlorophenyl)-phenylmethoxy]ethyl]piperidine Chemical compound C1=CC(Cl)=CC=C1C(C=1C=CC=CC=1)OCCN1CCCCC1 FLNXBVJLPJNOSI-UHFFFAOYSA-N 0.000 description 2
- YKBGVTZYEHREMT-KVQBGUIXSA-N 2'-deoxyguanosine Chemical compound C1=NC=2C(=O)NC(N)=NC=2N1[C@H]1C[C@H](O)[C@@H](CO)O1 YKBGVTZYEHREMT-KVQBGUIXSA-N 0.000 description 2
- HQVZOORKDNCGCK-UHFFFAOYSA-N 2-[(2,4-dichlorophenyl)methyl]-4-(2,4,4-trimethylpentan-2-yl)phenol Chemical compound CC(C)(C)CC(C)(C)C1=CC=C(O)C(CC=2C(=CC(Cl)=CC=2)Cl)=C1 HQVZOORKDNCGCK-UHFFFAOYSA-N 0.000 description 2
- PYTMYKVIJXPNBD-OQKDUQJOSA-N 2-[4-[(z)-2-chloro-1,2-diphenylethenyl]phenoxy]-n,n-diethylethanamine;hydron;2-hydroxypropane-1,2,3-tricarboxylate Chemical compound OC(=O)CC(O)(C(O)=O)CC(O)=O.C1=CC(OCCN(CC)CC)=CC=C1C(\C=1C=CC=CC=1)=C(/Cl)C1=CC=CC=C1 PYTMYKVIJXPNBD-OQKDUQJOSA-N 0.000 description 2
- XJKZZVPYOOIMPE-UHFFFAOYSA-N 2-[4-[oxo(thiophen-2-yl)methyl]phenyl]propanoic acid methyl ester Chemical compound C1=CC(C(C)C(=O)OC)=CC=C1C(=O)C1=CC=CS1 XJKZZVPYOOIMPE-UHFFFAOYSA-N 0.000 description 2
- GLQPTZAAUROJMO-UHFFFAOYSA-N 4-(3,4-dimethoxyphenyl)benzaldehyde Chemical compound C1=C(OC)C(OC)=CC=C1C1=CC=C(C=O)C=C1 GLQPTZAAUROJMO-UHFFFAOYSA-N 0.000 description 2
- NCEXCGUAXVAJMI-UHFFFAOYSA-N 5,6,7-trimethoxy-3-(3,4,5-trimethoxyphenyl)-1-benzopyran-4-one Chemical compound COC1=C(OC)C(OC)=CC(C=2C(C3=C(OC)C(OC)=C(OC)C=C3OC=2)=O)=C1 NCEXCGUAXVAJMI-UHFFFAOYSA-N 0.000 description 2
- FGBFEFJZYZDLSZ-UHFFFAOYSA-N 5,7-dimethoxy-2,3-dimethyl-2,3-dihydroinden-1-one Chemical compound COC1=CC(OC)=CC2=C1C(=O)C(C)C2C FGBFEFJZYZDLSZ-UHFFFAOYSA-N 0.000 description 2
- UBHSARJULCDNFC-UHFFFAOYSA-N 5-benzyl-2-methyl-3,4-dihydro-1h-pyrido[4,3-b]indole;naphthalene-1,5-disulfonic acid Chemical compound C1=CC=C2C(S(=O)(=O)O)=CC=CC2=C1S(O)(=O)=O.C1N(C)CCC2=C1C1=CC=CC=C1N2CC1=CC=CC=C1 UBHSARJULCDNFC-UHFFFAOYSA-N 0.000 description 2
- RPKLZQLYODPWTM-LVVAJZGHSA-N 5beta-cholanic acid Chemical compound C([C@H]1CC2)CCC[C@]1(C)[C@@H]1[C@@H]2[C@@H]2CC[C@H]([C@@H](CCC(O)=O)C)[C@@]2(C)CC1 RPKLZQLYODPWTM-LVVAJZGHSA-N 0.000 description 2
- KFYRPLNVJVHZGT-UHFFFAOYSA-N Amitriptyline hydrochloride Chemical compound Cl.C1CC2=CC=CC=C2C(=CCCN(C)C)C2=CC=CC=C21 KFYRPLNVJVHZGT-UHFFFAOYSA-N 0.000 description 2
- NLXLAEXVIDQMFP-UHFFFAOYSA-N Ammonia chloride Chemical compound [NH4+].[Cl-] NLXLAEXVIDQMFP-UHFFFAOYSA-N 0.000 description 2
- 102000018616 Apolipoproteins B Human genes 0.000 description 2
- 108010027006 Apolipoproteins B Proteins 0.000 description 2
- FXNFHKRTJBSTCS-UHFFFAOYSA-N Baicalein Natural products C=1C(=O)C=2C(O)=C(O)C(O)=CC=2OC=1C1=CC=CC=C1 FXNFHKRTJBSTCS-UHFFFAOYSA-N 0.000 description 2
- KXDROGADUISDGY-UHFFFAOYSA-N Benzamil hydrochloride Chemical compound C=1C=CC=CC=1CN=C(N)NC(=O)C1=NC(Cl)=C(N)N=C1N KXDROGADUISDGY-UHFFFAOYSA-N 0.000 description 2
- YWJXCIXBAKGUKZ-HJJNZUOJSA-N Bergenin Chemical compound O[C@H]1[C@H](O)[C@@H](CO)O[C@H]2C3=C(O)C(OC)=C(O)C=C3C(=O)O[C@@H]21 YWJXCIXBAKGUKZ-HJJNZUOJSA-N 0.000 description 2
- XULPLJSODQQHPH-UHFFFAOYSA-N Bergenin Natural products OCC1OC2C(OC(=O)c3cc(O)c(CO)c(O)c23)C(O)C1O XULPLJSODQQHPH-UHFFFAOYSA-N 0.000 description 2
- 239000002051 C09CA08 - Olmesartan medoxomil Substances 0.000 description 2
- RZZPDXZPRHQOCG-OJAKKHQRSA-N CDP-choline Chemical compound O[C@@H]1[C@H](O)[C@@H](COP(O)(=O)OP([O-])(=O)OCC[N+](C)(C)C)O[C@H]1N1C(=O)N=C(N)C=C1 RZZPDXZPRHQOCG-OJAKKHQRSA-N 0.000 description 2
- OKTJSMMVPCPJKN-UHFFFAOYSA-N Carbon Chemical compound [C] OKTJSMMVPCPJKN-UHFFFAOYSA-N 0.000 description 2
- CURLTUGMZLYLDI-UHFFFAOYSA-N Carbon dioxide Chemical compound O=C=O CURLTUGMZLYLDI-UHFFFAOYSA-N 0.000 description 2
- DYDCUQKUCUHJBH-UWTATZPHSA-N D-Cycloserine Chemical compound N[C@@H]1CONC1=O DYDCUQKUCUHJBH-UWTATZPHSA-N 0.000 description 2
- MHNSPTUQQIYJOT-SJDTYFKWSA-N Doxepin Hydrochloride Chemical compound Cl.C1OC2=CC=CC=C2C(=C/CCN(C)C)/C2=CC=CC=C21 MHNSPTUQQIYJOT-SJDTYFKWSA-N 0.000 description 2
- 241000196324 Embryophyta Species 0.000 description 2
- 239000004258 Ethoxyquin Substances 0.000 description 2
- XEKOWRVHYACXOJ-UHFFFAOYSA-N Ethyl acetate Chemical class CCOC(C)=O XEKOWRVHYACXOJ-UHFFFAOYSA-N 0.000 description 2
- DHMQDGOQFOQNFH-UHFFFAOYSA-N Glycine Chemical compound NCC(O)=O DHMQDGOQFOQNFH-UHFFFAOYSA-N 0.000 description 2
- GCGBHJLBFAPRDB-UHFFFAOYSA-N Hederagenin Natural products CC1(C)CCC2(CCC3(C)C4CCC5C(C)(CO)C(O)CCC5(C)C4CC=C3C2C1)C(=O)O GCGBHJLBFAPRDB-UHFFFAOYSA-N 0.000 description 2
- OCJYIGYOJCODJL-UHFFFAOYSA-N Meclizine Chemical compound CC1=CC=CC(CN2CCN(CC2)C(C=2C=CC=CC=2)C=2C=CC(Cl)=CC=2)=C1 OCJYIGYOJCODJL-UHFFFAOYSA-N 0.000 description 2
- RLJFTICUTYVZDG-UHFFFAOYSA-N Methiothepine Chemical compound C12=CC(SC)=CC=C2SC2=CC=CC=C2CC1N1CCN(C)CC1 RLJFTICUTYVZDG-UHFFFAOYSA-N 0.000 description 2
- 241001467552 Mycobacterium bovis BCG Species 0.000 description 2
- RTHCYVBBDHJXIQ-UHFFFAOYSA-N N-methyl-3-phenyl-3-[4-(trifluoromethyl)phenoxy]propan-1-amine Chemical compound C=1C=CC=CC=1C(CCNC)OC1=CC=C(C(F)(F)F)C=C1 RTHCYVBBDHJXIQ-UHFFFAOYSA-N 0.000 description 2
- UQGKUQLKSCSZGY-UHFFFAOYSA-N Olmesartan medoxomil Chemical compound C=1C=C(C=2C(=CC=CC=2)C2=NNN=N2)C=CC=1CN1C(CCC)=NC(C(C)(C)O)=C1C(=O)OCC=1OC(=O)OC=1C UQGKUQLKSCSZGY-UHFFFAOYSA-N 0.000 description 2
- JYDNKGUBLIKNAM-UHFFFAOYSA-N Oxyallobutulin Natural products C1CC(=O)C(C)(C)C2CCC3(C)C4(C)CCC5(CO)CCC(C(=C)C)C5C4CCC3C21C JYDNKGUBLIKNAM-UHFFFAOYSA-N 0.000 description 2
- RGCVKNLCSQQDEP-UHFFFAOYSA-N Perphenazine Chemical compound C1CN(CCO)CCN1CCCN1C2=CC(Cl)=CC=C2SC2=CC=CC=C21 RGCVKNLCSQQDEP-UHFFFAOYSA-N 0.000 description 2
- OOPDAHSJBRZRPH-UHFFFAOYSA-L Pyrvinium pamoate Chemical compound C1=CC2=CC(N(C)C)=CC=C2[N+](C)=C1C=CC(=C1C)C=C(C)N1C1=CC=CC=C1.C1=CC2=CC(N(C)C)=CC=C2[N+](C)=C1C=CC(=C1C)C=C(C)N1C1=CC=CC=C1.C12=CC=CC=C2C=C(C([O-])=O)C(O)=C1CC1=C(O)C(C([O-])=O)=CC2=CC=CC=C12 OOPDAHSJBRZRPH-UHFFFAOYSA-L 0.000 description 2
- 240000004808 Saccharomyces cerevisiae Species 0.000 description 2
- 235000014680 Saccharomyces cerevisiae Nutrition 0.000 description 2
- 235000013290 Sagittaria latifolia Nutrition 0.000 description 2
- GCGBHJLBFAPRDB-KCVAUKQGSA-N Scutellaric acid Natural products CC1(C)CC[C@@]2(CC[C@@]3(C)[C@@H]4CC[C@H]5[C@@](C)(CO)[C@H](O)CC[C@]5(C)[C@H]4CC=C3[C@@H]2C1)C(=O)O GCGBHJLBFAPRDB-KCVAUKQGSA-N 0.000 description 2
- FOCVUCIESVLUNU-UHFFFAOYSA-N Thiotepa Chemical compound C1CN1P(N1CC1)(=S)N1CC1 FOCVUCIESVLUNU-UHFFFAOYSA-N 0.000 description 2
- GFBKORZTTCHDGY-UWVJOHFNSA-N Thiothixene Chemical compound C12=CC(S(=O)(=O)N(C)C)=CC=C2SC2=CC=CC=C2\C1=C\CCN1CCN(C)CC1 GFBKORZTTCHDGY-UWVJOHFNSA-N 0.000 description 2
- RTMWIZOXNKJHRE-UHFFFAOYSA-N Tigogenin Natural products CC1COC2CC(C)(OC12)C3CCC4C5CCC6CC(O)CCC6(C)C5CCC34C RTMWIZOXNKJHRE-UHFFFAOYSA-N 0.000 description 2
- 229940123445 Tricyclic antidepressant Drugs 0.000 description 2
- FVECELJHCSPHKY-UHFFFAOYSA-N Veratridine Natural products C1=C(OC)C(OC)=CC=C1C(=O)OC1C2(O)OC34CC5(O)C(CN6C(CCC(C)C6)C6(C)O)C6(O)C(O)CC5(O)C4CCC2C3(C)CC1 FVECELJHCSPHKY-UHFFFAOYSA-N 0.000 description 2
- TTYVYRHNIVBWCB-VNQPRFMTSA-N [(1r,2s,5r)-5-methyl-2-propan-2-ylcyclohexyl] benzoate Chemical compound CC(C)[C@@H]1CC[C@@H](C)C[C@H]1OC(=O)C1=CC=CC=C1 TTYVYRHNIVBWCB-VNQPRFMTSA-N 0.000 description 2
- YYBNDIVPHIWTPK-KYJQVDHRSA-N [(3as,8bs)-3,4,8b-trimethyl-1,2,3,3a-tetrahydropyrrolo[2,3-b]indol-3-ium-7-yl] n-methylcarbamate;sulfate Chemical compound [O-]S([O-])(=O)=O.C12=CC(OC(=O)NC)=CC=C2N(C)[C@@H]2[C@@]1(C)CC[NH+]2C.C12=CC(OC(=O)NC)=CC=C2N(C)[C@@H]2[C@@]1(C)CC[NH+]2C YYBNDIVPHIWTPK-KYJQVDHRSA-N 0.000 description 2
- YASYVMFAVPKPKE-UHFFFAOYSA-N acephate Chemical compound COP(=O)(SC)NC(C)=O YASYVMFAVPKPKE-UHFFFAOYSA-N 0.000 description 2
- ORVBSFQTFRBNRP-AVKWCDSFSA-N acetic acid [(4bS)-4b,8,8-trimethyl-1-propan-2-yl-5,6,7,8a,9,10-hexahydrophenanthren-2-yl] ester Chemical compound C1CC2C(C)(C)CCC[C@]2(C)C2=C1C(C(C)C)=C(OC(C)=O)C=C2 ORVBSFQTFRBNRP-AVKWCDSFSA-N 0.000 description 2
- IVXFOQQPPONQTB-UHFFFAOYSA-N acetic acid [4-(5,7-diacetyloxy-4-oxo-1-benzopyran-2-yl)phenyl] ester Chemical compound C1=CC(OC(=O)C)=CC=C1C1=CC(=O)C2=C(OC(C)=O)C=C(OC(C)=O)C=C2O1 IVXFOQQPPONQTB-UHFFFAOYSA-N 0.000 description 2
- 229960001306 alverine citrate Drugs 0.000 description 2
- RYHCACJBKCOBTJ-UHFFFAOYSA-N alverine citrate Chemical compound OC(=O)CC(O)(C(O)=O)CC(O)=O.C=1C=CC=CC=1CCCN(CC)CCCC1=CC=CC=C1 RYHCACJBKCOBTJ-UHFFFAOYSA-N 0.000 description 2
- 150000001413 amino acids Chemical class 0.000 description 2
- 229960005119 amitriptyline hydrochloride Drugs 0.000 description 2
- 229960002519 amoxapine Drugs 0.000 description 2
- QWGDMFLQWFTERH-UHFFFAOYSA-N amoxapine Chemical compound C12=CC(Cl)=CC=C2OC2=CC=CC=C2N=C1N1CCNCC1 QWGDMFLQWFTERH-UHFFFAOYSA-N 0.000 description 2
- NUZWLKWWNNJHPT-UHFFFAOYSA-N anthralin Chemical compound C1C2=CC=CC(O)=C2C(=O)C2=C1C=CC=C2O NUZWLKWWNNJHPT-UHFFFAOYSA-N 0.000 description 2
- 239000003242 anti bacterial agent Substances 0.000 description 2
- 230000000561 anti-psychotic effect Effects 0.000 description 2
- 229940088710 antibiotic agent Drugs 0.000 description 2
- 239000003963 antioxidant agent Substances 0.000 description 2
- 235000006708 antioxidants Nutrition 0.000 description 2
- 239000000164 antipsychotic agent Substances 0.000 description 2
- 229940005529 antipsychotics Drugs 0.000 description 2
- 239000007864 aqueous solution Substances 0.000 description 2
- 229940114079 arachidonic acid Drugs 0.000 description 2
- 235000021342 arachidonic acid Nutrition 0.000 description 2
- BLUAFEHZUWYNDE-NNWCWBAJSA-N artemisinin Chemical compound C([C@](OO1)(C)O2)C[C@H]3[C@H](C)CC[C@@H]4[C@@]31[C@@H]2OC(=O)[C@@H]4C BLUAFEHZUWYNDE-NNWCWBAJSA-N 0.000 description 2
- 229930101531 artemisinin Natural products 0.000 description 2
- 229960004191 artemisinin Drugs 0.000 description 2
- 229960002274 atenolol Drugs 0.000 description 2
- IUCNQFHEWLYECJ-UAPRPQGYSA-L atractyloside potassium salt Chemical compound [K+].[K+].O1C(CO)C(OS([O-])(=O)=O)C(OS([O-])(=O)=O)C(OC(=O)CC(C)C)C1O[C@H]1C[C@@]2(C)[C@@H]3CCC(C(=C)[C@@H]4O)C[C@]34CC[C@@H]2[C@H](C(O)=O)C1 IUCNQFHEWLYECJ-UAPRPQGYSA-L 0.000 description 2
- 230000007455 autophagic response Effects 0.000 description 2
- 239000012822 autophagy inhibitor Substances 0.000 description 2
- 230000003385 bacteriostatic effect Effects 0.000 description 2
- UDFLTIRFTXWNJO-UHFFFAOYSA-N baicalein Chemical compound O1C2=CC(=O)C(O)=C(O)C2=C(O)C=C1C1=CC=CC=C1 UDFLTIRFTXWNJO-UHFFFAOYSA-N 0.000 description 2
- 229940015301 baicalein Drugs 0.000 description 2
- HMQPEDMEOBLSQB-RPHKZZMBSA-N beta-D-Galp-(1->3)-D-GlcpNAc Chemical compound CC(=O)N[C@H]1C(O)O[C@H](CO)[C@@H](O)[C@@H]1O[C@H]1[C@H](O)[C@@H](O)[C@@H](O)[C@@H](CO)O1 HMQPEDMEOBLSQB-RPHKZZMBSA-N 0.000 description 2
- FVWJYYTZTCVBKE-ROUWMTJPSA-N betulin Chemical compound C1C[C@H](O)C(C)(C)[C@@H]2CC[C@@]3(C)[C@]4(C)CC[C@@]5(CO)CC[C@@H](C(=C)C)[C@@H]5[C@H]4CC[C@@H]3[C@]21C FVWJYYTZTCVBKE-ROUWMTJPSA-N 0.000 description 2
- MVIRREHRVZLANQ-UHFFFAOYSA-N betulin Natural products CC(=O)OC1CCC2(C)C(CCC3(C)C2CC=C4C5C(CCC5(CO)CCC34C)C(=C)C)C1(C)C MVIRREHRVZLANQ-UHFFFAOYSA-N 0.000 description 2
- 238000004166 bioassay Methods 0.000 description 2
- 230000000903 blocking effect Effects 0.000 description 2
- IUWVALYLNVXWKX-UHFFFAOYSA-N butamben Chemical compound CCCCOC(=O)C1=CC=C(N)C=C1 IUWVALYLNVXWKX-UHFFFAOYSA-N 0.000 description 2
- 229960000400 butamben Drugs 0.000 description 2
- 238000004364 calculation method Methods 0.000 description 2
- 125000004432 carbon atom Chemical group C* 0.000 description 2
- IVUMCTKHWDRRMH-UHFFFAOYSA-N carprofen Chemical compound C1=CC(Cl)=C[C]2C3=CC=C(C(C(O)=O)C)C=C3N=C21 IVUMCTKHWDRRMH-UHFFFAOYSA-N 0.000 description 2
- 229960003184 carprofen Drugs 0.000 description 2
- 229960004841 cefadroxil Drugs 0.000 description 2
- NBFNMSULHIODTC-CYJZLJNKSA-N cefadroxil monohydrate Chemical compound O.C1([C@@H](N)C(=O)N[C@H]2[C@@H]3N(C2=O)C(=C(CS3)C)C(O)=O)=CC=C(O)C=C1 NBFNMSULHIODTC-CYJZLJNKSA-N 0.000 description 2
- AFZFFLVORLEPPO-UVYJNCLZSA-N cefditoren pivoxil Chemical compound S([C@@H]1[C@@H](C(N1C=1C(=O)OCOC(=O)C(C)(C)C)=O)NC(=O)\C(=N/OC)C=2N=C(N)SC=2)CC=1\C=C/C=1SC=NC=1C AFZFFLVORLEPPO-UVYJNCLZSA-N 0.000 description 2
- 238000004113 cell culture Methods 0.000 description 2
- 210000003855 cell nucleus Anatomy 0.000 description 2
- VQHSOMBJVWLPSR-WELRSGGNSA-N cellobiotol Chemical compound OC[C@H](O)[C@@H](O)[C@@H]([C@H](O)CO)O[C@@H]1O[C@H](CO)[C@@H](O)[C@H](O)[C@H]1O VQHSOMBJVWLPSR-WELRSGGNSA-N 0.000 description 2
- 239000002738 chelating agent Substances 0.000 description 2
- 229960002242 chlorocresol Drugs 0.000 description 2
- 229960001076 chlorpromazine Drugs 0.000 description 2
- ZPEIMTDSQAKGNT-UHFFFAOYSA-N chlorpromazine Chemical compound C1=C(Cl)C=C2N(CCCN(C)C)C3=CC=CC=C3SC2=C1 ZPEIMTDSQAKGNT-UHFFFAOYSA-N 0.000 description 2
- GGCLNOIGPMGLDB-GYKMGIIDSA-N cholest-5-en-3-one Chemical compound C1C=C2CC(=O)CC[C@]2(C)[C@@H]2[C@@H]1[C@@H]1CC[C@H]([C@H](C)CCCC(C)C)[C@@]1(C)CC2 GGCLNOIGPMGLDB-GYKMGIIDSA-N 0.000 description 2
- 229960003405 ciprofloxacin Drugs 0.000 description 2
- 229960001284 citicoline Drugs 0.000 description 2
- 229960002626 clarithromycin Drugs 0.000 description 2
- AGOYDEPGAOXOCK-KCBOHYOISA-N clarithromycin Chemical compound O([C@@H]1[C@@H](C)C(=O)O[C@@H]([C@@]([C@H](O)[C@@H](C)C(=O)[C@H](C)C[C@](C)([C@H](O[C@H]2[C@@H]([C@H](C[C@@H](C)O2)N(C)C)O)[C@H]1C)OC)(C)O)CC)[C@H]1C[C@@](C)(OC)[C@@H](O)[C@H](C)O1 AGOYDEPGAOXOCK-KCBOHYOISA-N 0.000 description 2
- 229960003769 clofoctol Drugs 0.000 description 2
- 229940046989 clomiphene citrate Drugs 0.000 description 2
- 229960001564 clomipramine hydrochloride Drugs 0.000 description 2
- 229960002544 cloperastine Drugs 0.000 description 2
- 235000015246 common arrowhead Nutrition 0.000 description 2
- 238000009833 condensation Methods 0.000 description 2
- 230000005494 condensation Effects 0.000 description 2
- 229960000500 cyclobenzaprine hydrochloride Drugs 0.000 description 2
- VXEAYBOGHINOKW-UHFFFAOYSA-N cyclobenzaprine hydrochloride Chemical compound Cl.C1=CC2=CC=CC=C2C(=CCCN(C)C)C2=CC=CC=C21 VXEAYBOGHINOKW-UHFFFAOYSA-N 0.000 description 2
- 229960003829 desipramine hydrochloride Drugs 0.000 description 2
- XAEWZDYWZHIUCT-UHFFFAOYSA-N desipramine hydrochloride Chemical compound [H+].[Cl-].C1CC2=CC=CC=C2N(CCCNC)C2=CC=CC=C21 XAEWZDYWZHIUCT-UHFFFAOYSA-N 0.000 description 2
- 238000011161 development Methods 0.000 description 2
- 230000018109 developmental process Effects 0.000 description 2
- 229960003782 dextromethorphan hydrobromide Drugs 0.000 description 2
- NFDFQCUYFHCNBW-SCGPFSFSSA-N dienestrol Chemical compound C=1C=C(O)C=CC=1\C(=C/C)\C(=C\C)\C1=CC=C(O)C=C1 NFDFQCUYFHCNBW-SCGPFSFSSA-N 0.000 description 2
- 229960003839 dienestrol Drugs 0.000 description 2
- LPRLDRXGWKXRMQ-UHFFFAOYSA-N diphenylpyraline hydrochloride Chemical compound [Cl-].C1C[NH+](C)CCC1OC(C=1C=CC=CC=1)C1=CC=CC=C1 LPRLDRXGWKXRMQ-UHFFFAOYSA-N 0.000 description 2
- 229960002392 diphenylpyraline hydrochloride Drugs 0.000 description 2
- 229960002311 dithranol Drugs 0.000 description 2
- 231100000673 dose–response relationship Toxicity 0.000 description 2
- 229960002861 doxepin hydrochloride Drugs 0.000 description 2
- 239000000975 dye Substances 0.000 description 2
- 230000000522 effect on autophagocytosis Effects 0.000 description 2
- 238000000635 electron micrograph Methods 0.000 description 2
- 239000000839 emulsion Substances 0.000 description 2
- AEUTYOVWOVBAKS-UWVGGRQHSA-N ethambutol Chemical compound CC[C@@H](CO)NCCN[C@@H](CC)CO AEUTYOVWOVBAKS-UWVGGRQHSA-N 0.000 description 2
- 229960002077 ethopropazine hydrochloride Drugs 0.000 description 2
- 235000019285 ethoxyquin Nutrition 0.000 description 2
- DECIPOUIJURFOJ-UHFFFAOYSA-N ethoxyquin Chemical compound N1C(C)(C)C=C(C)C2=CC(OCC)=CC=C21 DECIPOUIJURFOJ-UHFFFAOYSA-N 0.000 description 2
- 229940093500 ethoxyquin Drugs 0.000 description 2
- 210000003527 eukaryotic cell Anatomy 0.000 description 2
- 239000000945 filler Substances 0.000 description 2
- 229960002949 fluorouracil Drugs 0.000 description 2
- 229960002464 fluoxetine Drugs 0.000 description 2
- 229960001258 fluphenazine hydrochloride Drugs 0.000 description 2
- RIKPNWPEMPODJD-UHFFFAOYSA-N formononetin Natural products C1=CC(OC)=CC=C1C1=COC2=CC=CC=C2C1=O RIKPNWPEMPODJD-UHFFFAOYSA-N 0.000 description 2
- 238000013467 fragmentation Methods 0.000 description 2
- 238000006062 fragmentation reaction Methods 0.000 description 2
- PCHJSUWPFVWCPO-UHFFFAOYSA-N gold Chemical compound [Au] PCHJSUWPFVWCPO-UHFFFAOYSA-N 0.000 description 2
- 238000009499 grossing Methods 0.000 description 2
- 239000001963 growth medium Substances 0.000 description 2
- PGOYMURMZNDHNS-MYPRUECHSA-N hederagenin Chemical compound C1C[C@H](O)[C@@](C)(CO)[C@@H]2CC[C@@]3(C)[C@]4(C)CC[C@@]5(C(O)=O)CCC(C)(C)C[C@H]5C4=CC[C@@H]3[C@]21C PGOYMURMZNDHNS-MYPRUECHSA-N 0.000 description 2
- 229960004867 hexetidine Drugs 0.000 description 2
- 238000012203 high throughput assay Methods 0.000 description 2
- 238000003384 imaging method Methods 0.000 description 2
- XZZXIYZZBJDEEP-UHFFFAOYSA-N imipramine hydrochloride Chemical compound [Cl-].C1CC2=CC=CC=C2N(CCC[NH+](C)C)C2=CC=CC=C21 XZZXIYZZBJDEEP-UHFFFAOYSA-N 0.000 description 2
- 229960002102 imipramine hydrochloride Drugs 0.000 description 2
- 239000000411 inducer Substances 0.000 description 2
- 230000001939 inductive effect Effects 0.000 description 2
- 230000036512 infertility Effects 0.000 description 2
- 229960003130 interferon gamma Drugs 0.000 description 2
- 229930027917 kanamycin Natural products 0.000 description 2
- 229960000318 kanamycin Drugs 0.000 description 2
- SBUJHOSQTJFQJX-NOAMYHISSA-N kanamycin Chemical compound O[C@@H]1[C@@H](O)[C@H](O)[C@@H](CN)O[C@@H]1O[C@H]1[C@H](O)[C@@H](O[C@@H]2[C@@H]([C@@H](N)[C@H](O)[C@@H](CO)O2)O)[C@H](N)C[C@@H]1N SBUJHOSQTJFQJX-NOAMYHISSA-N 0.000 description 2
- 229930182823 kanamycin A Natural products 0.000 description 2
- 229960004125 ketoconazole Drugs 0.000 description 2
- YNQQEYBLVYAWNX-WLHGVMLRSA-N ketotifen fumarate Chemical compound OC(=O)\C=C\C(O)=O.C1CN(C)CCC1=C1C2=CC=CC=C2CC(=O)C2=C1C=CS2 YNQQEYBLVYAWNX-WLHGVMLRSA-N 0.000 description 2
- 229960003630 ketotifen fumarate Drugs 0.000 description 2
- TYZROVQLWOKYKF-ZDUSSCGKSA-N linezolid Chemical compound O=C1O[C@@H](CNC(=O)C)CN1C(C=C1F)=CC=C1N1CCOCC1 TYZROVQLWOKYKF-ZDUSSCGKSA-N 0.000 description 2
- 229960003907 linezolid Drugs 0.000 description 2
- 238000010859 live-cell imaging Methods 0.000 description 2
- 229960002983 loperamide hydrochloride Drugs 0.000 description 2
- PGYPOBZJRVSMDS-UHFFFAOYSA-N loperamide hydrochloride Chemical compound Cl.C=1C=CC=CC=1C(C=1C=CC=CC=1)(C(=O)N(C)C)CCN(CC1)CCC1(O)C1=CC=C(Cl)C=C1 PGYPOBZJRVSMDS-UHFFFAOYSA-N 0.000 description 2
- YQZBAXDVDZTKEQ-UHFFFAOYSA-N loxapine succinate Chemical compound [H+].[H+].[O-]C(=O)CCC([O-])=O.C1CN(C)CCN1C1=NC2=CC=CC=C2OC2=CC=C(Cl)C=C12 YQZBAXDVDZTKEQ-UHFFFAOYSA-N 0.000 description 2
- 239000012931 lyophilized formulation Substances 0.000 description 2
- 210000004962 mammalian cell Anatomy 0.000 description 2
- 238000013507 mapping Methods 0.000 description 2
- 229960004992 maprotiline hydrochloride Drugs 0.000 description 2
- 239000000463 material Substances 0.000 description 2
- 230000010534 mechanism of action Effects 0.000 description 2
- 229940018415 meclizine hydrochloride Drugs 0.000 description 2
- 239000002609 medium Substances 0.000 description 2
- WZHJKEUHNJHDLS-QTGUNEKASA-N metergoline Chemical compound C([C@H]1CN([C@H]2[C@@H](C=3C=CC=C4N(C)C=C(C=34)C2)C1)C)NC(=O)OCC1=CC=CC=C1 WZHJKEUHNJHDLS-QTGUNEKASA-N 0.000 description 2
- 229960004650 metergoline Drugs 0.000 description 2
- RPKLZQLYODPWTM-UHFFFAOYSA-N methyl 15-acetoxy(10),13E-ent-halimadien-18-oate Natural products C1CC2CCCCC2(C)C2C1C1CCC(C(CCC(O)=O)C)C1(C)CC2 RPKLZQLYODPWTM-UHFFFAOYSA-N 0.000 description 2
- 238000000520 microinjection Methods 0.000 description 2
- 210000003470 mitochondria Anatomy 0.000 description 2
- 229960003702 moxifloxacin Drugs 0.000 description 2
- FABPRXSRWADJSP-MEDUHNTESA-N moxifloxacin Chemical compound COC1=C(N2C[C@H]3NCCC[C@H]3C2)C(F)=CC(C(C(C(O)=O)=C2)=O)=C1N2C1CC1 FABPRXSRWADJSP-MEDUHNTESA-N 0.000 description 2
- 201000009671 multidrug-resistant tuberculosis Diseases 0.000 description 2
- 229960001513 nalbuphine hydrochloride Drugs 0.000 description 2
- YZLZPSJXMWGIFH-BCXQGASESA-N nalbuphine hydrochloride Chemical compound [H+].[Cl-].C([C@]12[C@H]3OC=4C(O)=CC=C(C2=4)C[C@@H]2[C@]1(O)CC[C@@H]3O)CN2CC1CCC1 YZLZPSJXMWGIFH-BCXQGASESA-N 0.000 description 2
- 231100000252 nontoxic Toxicity 0.000 description 2
- 230000003000 nontoxic effect Effects 0.000 description 2
- 238000010606 normalization Methods 0.000 description 2
- 229960001199 olmesartan medoxomil Drugs 0.000 description 2
- 150000002894 organic compounds Chemical class 0.000 description 2
- 244000052769 pathogen Species 0.000 description 2
- 229950009414 pempidine Drugs 0.000 description 2
- 229960001412 pentobarbital Drugs 0.000 description 2
- 229960000762 perphenazine Drugs 0.000 description 2
- 239000000546 pharmaceutical excipient Substances 0.000 description 2
- 239000010452 phosphate Substances 0.000 description 2
- NBIIXXVUZAFLBC-UHFFFAOYSA-K phosphate Chemical compound [O-]P([O-])([O-])=O NBIIXXVUZAFLBC-UHFFFAOYSA-K 0.000 description 2
- 229960001847 physostigmine sulfate Drugs 0.000 description 2
- 229960000399 pimethixene Drugs 0.000 description 2
- 239000013641 positive control Substances 0.000 description 2
- 230000003389 potentiating effect Effects 0.000 description 2
- 238000002360 preparation method Methods 0.000 description 2
- 102000004196 processed proteins & peptides Human genes 0.000 description 2
- 108090000765 processed proteins & peptides Proteins 0.000 description 2
- 238000012545 processing Methods 0.000 description 2
- DSKIOWHQLUWFLG-SPIKMXEPSA-N prochlorperazine maleate Chemical compound [H+].[H+].[H+].[H+].[O-]C(=O)\C=C/C([O-])=O.[O-]C(=O)\C=C/C([O-])=O.C1CN(C)CCN1CCCN1C2=CC(Cl)=CC=C2SC2=CC=CC=C21 DSKIOWHQLUWFLG-SPIKMXEPSA-N 0.000 description 2
- 239000000047 product Substances 0.000 description 2
- VXPCQISYVPFYRK-UHFFFAOYSA-N profenamine hydrochloride Chemical compound Cl.C1=CC=C2N(CC(C)N(CC)CC)C3=CC=CC=C3SC2=C1 VXPCQISYVPFYRK-UHFFFAOYSA-N 0.000 description 2
- 210000001236 prokaryotic cell Anatomy 0.000 description 2
- 229960001836 promazine hydrochloride Drugs 0.000 description 2
- JIVSXRLRGOICGA-UHFFFAOYSA-N promazine hydrochloride Chemical compound [H+].[Cl-].C1=CC=C2N(CCCN(C)C)C3=CC=CC=C3SC2=C1 JIVSXRLRGOICGA-UHFFFAOYSA-N 0.000 description 2
- 229960002244 promethazine hydrochloride Drugs 0.000 description 2
- XXPDBLUZJRXNNZ-UHFFFAOYSA-N promethazine hydrochloride Chemical compound Cl.C1=CC=C2N(CC(C)N(C)C)C3=CC=CC=C3SC2=C1 XXPDBLUZJRXNNZ-UHFFFAOYSA-N 0.000 description 2
- AAEVYOVXGOFMJO-UHFFFAOYSA-N prometryn Chemical compound CSC1=NC(NC(C)C)=NC(NC(C)C)=N1 AAEVYOVXGOFMJO-UHFFFAOYSA-N 0.000 description 2
- XWIHRGFIPXWGEF-UHFFFAOYSA-N propafenone hydrochloride Chemical compound Cl.CCCNCC(O)COC1=CC=CC=C1C(=O)CCC1=CC=CC=C1 XWIHRGFIPXWGEF-UHFFFAOYSA-N 0.000 description 2
- 229960002443 propafenone hydrochloride Drugs 0.000 description 2
- 230000004850 protein–protein interaction Effects 0.000 description 2
- 229960001077 pyrvinium pamoate Drugs 0.000 description 2
- VBHKTXLEJZIDJF-UHFFFAOYSA-N quinalizarin Chemical compound C1=CC(O)=C2C(=O)C3=C(O)C(O)=CC=C3C(=O)C2=C1O VBHKTXLEJZIDJF-UHFFFAOYSA-N 0.000 description 2
- RZJQGNCSTQAWON-UHFFFAOYSA-N rofecoxib Chemical compound C1=CC(S(=O)(=O)C)=CC=C1C1=C(C=2C=CC=CC=2)C(=O)OC1 RZJQGNCSTQAWON-UHFFFAOYSA-N 0.000 description 2
- 229960000371 rofecoxib Drugs 0.000 description 2
- 238000010187 selection method Methods 0.000 description 2
- 229960003660 sertraline hydrochloride Drugs 0.000 description 2
- 238000011524 similarity measure Methods 0.000 description 2
- 229950002323 smilagenin Drugs 0.000 description 2
- 239000011780 sodium chloride Substances 0.000 description 2
- 239000007787 solid Substances 0.000 description 2
- GUCKKCMJTSNWCU-BQBZGAKWSA-N spaglumic acid Chemical compound CC(=O)N[C@H](C(O)=O)CC(=O)N[C@H](C(O)=O)CCC(O)=O GUCKKCMJTSNWCU-BQBZGAKWSA-N 0.000 description 2
- 229960000341 spaglumic acid Drugs 0.000 description 2
- 230000008093 supporting effect Effects 0.000 description 2
- FQZYTYWMLGAPFJ-OQKDUQJOSA-N tamoxifen citrate Chemical compound [H+].[H+].[H+].[O-]C(=O)CC(O)(CC([O-])=O)C([O-])=O.C=1C=CC=CC=1C(/CC)=C(C=1C=CC(OCCN(C)C)=CC=1)/C1=CC=CC=C1 FQZYTYWMLGAPFJ-OQKDUQJOSA-N 0.000 description 2
- 229960003454 tamoxifen citrate Drugs 0.000 description 2
- 230000008685 targeting Effects 0.000 description 2
- LJVAJPDWBABPEJ-PNUFFHFMSA-N telithromycin Chemical compound O([C@@H]1[C@@H](C)C(=O)[C@@H](C)C(=O)O[C@@H]([C@]2(OC(=O)N(CCCCN3C=C(N=C3)C=3C=NC=CC=3)[C@@H]2[C@@H](C)C(=O)[C@H](C)C[C@@]1(C)OC)C)CC)[C@@H]1O[C@H](C)C[C@H](N(C)C)[C@H]1O LJVAJPDWBABPEJ-PNUFFHFMSA-N 0.000 description 2
- 229960003250 telithromycin Drugs 0.000 description 2
- OTVAEFIXJLOWRX-NXEZZACHSA-N thiamphenicol Chemical compound CS(=O)(=O)C1=CC=C([C@@H](O)[C@@H](CO)NC(=O)C(Cl)Cl)C=C1 OTVAEFIXJLOWRX-NXEZZACHSA-N 0.000 description 2
- 229960003053 thiamphenicol Drugs 0.000 description 2
- 229960001196 thiotepa Drugs 0.000 description 2
- 229960005013 tiotixene Drugs 0.000 description 2
- 210000001519 tissue Anatomy 0.000 description 2
- 238000002179 total cell area Methods 0.000 description 2
- 231100000331 toxic Toxicity 0.000 description 2
- 230000002588 toxic effect Effects 0.000 description 2
- 238000001890 transfection Methods 0.000 description 2
- 239000003029 tricyclic antidepressant agent Substances 0.000 description 2
- 229960000315 trifluoperazine hydrochloride Drugs 0.000 description 2
- BXDAOUXDMHXPDI-UHFFFAOYSA-N trifluoperazine hydrochloride Chemical compound [H+].[H+].[Cl-].[Cl-].C1CN(C)CCN1CCCN1C2=CC(C(F)(F)F)=CC=C2SC2=CC=CC=C21 BXDAOUXDMHXPDI-UHFFFAOYSA-N 0.000 description 2
- 229960004312 triflupromazine hydrochloride Drugs 0.000 description 2
- FTNWXGFYRHWUKG-UHFFFAOYSA-N triflupromazine hydrochloride Chemical compound [H+].[Cl-].C1=C(C(F)(F)F)C=C2N(CCCN(C)C)C3=CC=CC=C3SC2=C1 FTNWXGFYRHWUKG-UHFFFAOYSA-N 0.000 description 2
- 229960004479 trihexyphenidyl hydrochloride Drugs 0.000 description 2
- QDWJJTJNXAKQKD-UHFFFAOYSA-N trihexyphenidyl hydrochloride Chemical compound Cl.C1CCCCC1C(C=1C=CC=CC=1)(O)CCN1CCCCC1 QDWJJTJNXAKQKD-UHFFFAOYSA-N 0.000 description 2
- 229940076784 trimeprazine tartrate Drugs 0.000 description 2
- YDGHCKHAXOUQOS-BTJKTKAUSA-N trimipramine maleate Chemical compound [O-]C(=O)\C=C/C([O-])=O.C1CC2=CC=CC=C2[NH+](CC(C[NH+](C)C)C)C2=CC=CC=C21 YDGHCKHAXOUQOS-BTJKTKAUSA-N 0.000 description 2
- 229960002835 trimipramine maleate Drugs 0.000 description 2
- 229960002655 tubocurarine chloride Drugs 0.000 description 2
- FVECELJHCSPHKY-YFUMOZOISA-N veratridine Chemical compound C1=C(OC)C(OC)=CC=C1C(=O)O[C@@H]1[C@@]2(O)O[C@@]34C[C@@]5(O)[C@H](CN6[C@@H](CC[C@H](C)C6)[C@@]6(C)O)[C@]6(O)[C@@H](O)C[C@@]5(O)[C@@H]4CC[C@H]2[C@]3(C)CC1 FVECELJHCSPHKY-YFUMOZOISA-N 0.000 description 2
- BPICBUSOMSTKRF-UHFFFAOYSA-N xylazine Chemical compound CC1=CC=CC(C)=C1NC1=NCCCS1 BPICBUSOMSTKRF-UHFFFAOYSA-N 0.000 description 2
- 229960001600 xylazine Drugs 0.000 description 2
- FMCGSUUBYTWNDP-ONGXEEELSA-N (1R,2S)-2-(dimethylamino)-1-phenyl-1-propanol Chemical compound CN(C)[C@@H](C)[C@H](O)C1=CC=CC=C1 FMCGSUUBYTWNDP-ONGXEEELSA-N 0.000 description 1
- BFCDFTHTSVTWOG-PXNSSMCTSA-N (1r,2s)-2-(octylamino)-1-(4-propan-2-ylsulfanylphenyl)propan-1-ol Chemical compound CCCCCCCCN[C@@H](C)[C@H](O)C1=CC=C(SC(C)C)C=C1 BFCDFTHTSVTWOG-PXNSSMCTSA-N 0.000 description 1
- HPWIIERXAFODPP-GHBBWTPBSA-N (3r,4r)-3,6-diamino-n-[(3s,6z,9s,12s,15s)-3-[(6r)-2-amino-1,4,5,6-tetrahydropyrimidin-6-yl]-6-[(carbamoylamino)methylidene]-9,12-bis(hydroxymethyl)-2,5,8,11,14-pentaoxo-1,4,7,10,13-pentazacyclohexadec-15-yl]-4-hydroxyhexanamide Chemical compound N1C(=O)\C(=C\NC(N)=O)NC(=O)[C@H](CO)NC(=O)[C@H](CO)NC(=O)[C@@H](NC(=O)C[C@@H](N)[C@H](O)CCN)CNC(=O)[C@@H]1[C@@H]1NC(=N)NCC1 HPWIIERXAFODPP-GHBBWTPBSA-N 0.000 description 1
- VCOPTHOUUNAYKQ-WBTCAYNUSA-N (3s)-3,6-diamino-n-[[(2s,5s,8e,11s,15s)-15-amino-11-[(6r)-2-amino-1,4,5,6-tetrahydropyrimidin-6-yl]-8-[(carbamoylamino)methylidene]-2-(hydroxymethyl)-3,6,9,12,16-pentaoxo-1,4,7,10,13-pentazacyclohexadec-5-yl]methyl]hexanamide;(3s)-3,6-diamino-n-[[(2s,5s,8 Chemical compound N1C(=O)\C(=C/NC(N)=O)NC(=O)[C@H](CNC(=O)C[C@@H](N)CCCN)NC(=O)[C@H](C)NC(=O)[C@@H](N)CNC(=O)[C@@H]1[C@@H]1NC(N)=NCC1.N1C(=O)\C(=C/NC(N)=O)NC(=O)[C@H](CNC(=O)C[C@@H](N)CCCN)NC(=O)[C@H](CO)NC(=O)[C@@H](N)CNC(=O)[C@@H]1[C@@H]1NC(N)=NCC1 VCOPTHOUUNAYKQ-WBTCAYNUSA-N 0.000 description 1
- SZPQTEWIRPXBTC-KFOWTEFUSA-N 1,2-dipalmitoyl-sn-glycero-3-phospho-(1'D-myo-inositol-3'-phosphate) Chemical compound CCCCCCCCCCCCCCCC(=O)OC[C@@H](OC(=O)CCCCCCCCCCCCCCC)COP(O)(=O)O[C@H]1[C@H](O)[C@@H](O)[C@H](O)[C@@H](OP(O)(O)=O)[C@H]1O SZPQTEWIRPXBTC-KFOWTEFUSA-N 0.000 description 1
- OCHPVPSALUKLOM-UHFFFAOYSA-N 12a-Hydroxy-9-Demethylmunduserone-8-Carboxylic Acid Chemical compound O=C1C2(O)C=3C=C(OC)C(OC)=CC=3OCC2OC2=C1C=CC(O)=C2C(O)=O OCHPVPSALUKLOM-UHFFFAOYSA-N 0.000 description 1
- MPDGHEJMBKOTSU-YKLVYJNSSA-N 18beta-glycyrrhetic acid Chemical compound C([C@H]1C2=CC(=O)[C@H]34)[C@@](C)(C(O)=O)CC[C@]1(C)CC[C@@]2(C)[C@]4(C)CC[C@@H]1[C@]3(C)CC[C@H](O)C1(C)C MPDGHEJMBKOTSU-YKLVYJNSSA-N 0.000 description 1
- VGIRNWJSIRVFRT-UHFFFAOYSA-N 2',7'-difluorofluorescein Chemical compound OC(=O)C1=CC=CC=C1C1=C2C=C(F)C(=O)C=C2OC2=CC(O)=C(F)C=C21 VGIRNWJSIRVFRT-UHFFFAOYSA-N 0.000 description 1
- 125000003821 2-(trimethylsilyl)ethoxymethyl group Chemical group [H]C([H])([H])[Si](C([H])([H])[H])(C([H])([H])[H])C([H])([H])C(OC([H])([H])[*])([H])[H] 0.000 description 1
- XJCXEUYJQHPEAE-UHFFFAOYSA-N 2-[3-(cyanomethyl)-5-methylphenyl]acetonitrile Chemical compound CC1=CC(CC#N)=CC(CC#N)=C1 XJCXEUYJQHPEAE-UHFFFAOYSA-N 0.000 description 1
- ACNUVXZPCIABEX-UHFFFAOYSA-N 3',6'-diaminospiro[2-benzofuran-3,9'-xanthene]-1-one Chemical compound O1C(=O)C2=CC=CC=C2C21C1=CC=C(N)C=C1OC1=CC(N)=CC=C21 ACNUVXZPCIABEX-UHFFFAOYSA-N 0.000 description 1
- NJXWZWXCHBNOOG-UHFFFAOYSA-N 3,3-diphenylpropyl(1-phenylethyl)azanium;chloride Chemical compound [Cl-].C=1C=CC=CC=1C(C)[NH2+]CCC(C=1C=CC=CC=1)C1=CC=CC=C1 NJXWZWXCHBNOOG-UHFFFAOYSA-N 0.000 description 1
- QCQCHGYLTSGIGX-GHXANHINSA-N 4-[[(3ar,5ar,5br,7ar,9s,11ar,11br,13as)-5a,5b,8,8,11a-pentamethyl-3a-[(5-methylpyridine-3-carbonyl)amino]-2-oxo-1-propan-2-yl-4,5,6,7,7a,9,10,11,11b,12,13,13a-dodecahydro-3h-cyclopenta[a]chrysen-9-yl]oxy]-2,2-dimethyl-4-oxobutanoic acid Chemical compound N([C@@]12CC[C@@]3(C)[C@]4(C)CC[C@H]5C(C)(C)[C@@H](OC(=O)CC(C)(C)C(O)=O)CC[C@]5(C)[C@H]4CC[C@@H]3C1=C(C(C2)=O)C(C)C)C(=O)C1=CN=CC(C)=C1 QCQCHGYLTSGIGX-GHXANHINSA-N 0.000 description 1
- 208000030507 AIDS Diseases 0.000 description 1
- 206010054196 Affect lability Diseases 0.000 description 1
- 229920001817 Agar Polymers 0.000 description 1
- 206010001488 Aggression Diseases 0.000 description 1
- 239000012099 Alexa Fluor family Substances 0.000 description 1
- 101710145634 Antigen 1 Proteins 0.000 description 1
- 241001081972 Arctium medians Species 0.000 description 1
- CIWBSHSKHKDKBQ-JLAZNSOCSA-N Ascorbic acid Natural products OC[C@H](O)[C@H]1OC(=O)C(O)=C1O CIWBSHSKHKDKBQ-JLAZNSOCSA-N 0.000 description 1
- 238000012935 Averaging Methods 0.000 description 1
- 241000193830 Bacillus <bacterium> Species 0.000 description 1
- 241000208199 Buxus sempervirens Species 0.000 description 1
- OYPRJOBELJOOCE-UHFFFAOYSA-N Calcium Chemical compound [Ca] OYPRJOBELJOOCE-UHFFFAOYSA-N 0.000 description 1
- 108010065839 Capreomycin Proteins 0.000 description 1
- UGFAIRIUMAVXCW-UHFFFAOYSA-N Carbon monoxide Chemical compound [O+]#[C-] UGFAIRIUMAVXCW-UHFFFAOYSA-N 0.000 description 1
- 102000014914 Carrier Proteins Human genes 0.000 description 1
- 108010078791 Carrier Proteins Proteins 0.000 description 1
- AMTSLHRSERHBCF-IBQNZTRDSA-N Carylophyllene Oxide Chemical compound C1C[C@H]2C(C)(C)C[C@@H]2C(=C)CC2OC21C AMTSLHRSERHBCF-IBQNZTRDSA-N 0.000 description 1
- 208000017667 Chronic Disease Diseases 0.000 description 1
- 206010008874 Chronic Fatigue Syndrome Diseases 0.000 description 1
- 208000000094 Chronic Pain Diseases 0.000 description 1
- KRKNYBCHXYNGOX-UHFFFAOYSA-K Citrate Chemical compound [O-]C(=O)CC(O)(CC([O-])=O)C([O-])=O KRKNYBCHXYNGOX-UHFFFAOYSA-K 0.000 description 1
- 208000035473 Communicable disease Diseases 0.000 description 1
- 206010011224 Cough Diseases 0.000 description 1
- 241000699802 Cricetulus griseus Species 0.000 description 1
- 108090000695 Cytokines Proteins 0.000 description 1
- 102000004127 Cytokines Human genes 0.000 description 1
- DYDCUQKUCUHJBH-UHFFFAOYSA-N D-Cycloserine Natural products NC1CONC1=O DYDCUQKUCUHJBH-UHFFFAOYSA-N 0.000 description 1
- FBPFZTCFMRRESA-FSIIMWSLSA-N D-Glucitol Natural products OC[C@H](O)[C@H](O)[C@@H](O)[C@H](O)CO FBPFZTCFMRRESA-FSIIMWSLSA-N 0.000 description 1
- FBPFZTCFMRRESA-KVTDHHQDSA-N D-Mannitol Chemical compound OC[C@@H](O)[C@@H](O)[C@H](O)[C@H](O)CO FBPFZTCFMRRESA-KVTDHHQDSA-N 0.000 description 1
- FBPFZTCFMRRESA-JGWLITMVSA-N D-glucitol Chemical compound OC[C@H](O)[C@@H](O)[C@H](O)[C@H](O)CO FBPFZTCFMRRESA-JGWLITMVSA-N 0.000 description 1
- WQZGKKKJIJFFOK-QTVWNMPRSA-N D-mannopyranose Chemical compound OC[C@H]1OC(O)[C@@H](O)[C@@H](O)[C@@H]1O WQZGKKKJIJFFOK-QTVWNMPRSA-N 0.000 description 1
- 108020004414 DNA Proteins 0.000 description 1
- 229920002307 Dextran Polymers 0.000 description 1
- 239000004375 Dextrin Substances 0.000 description 1
- 229920001353 Dextrin Polymers 0.000 description 1
- 241000255581 Drosophila <fruit fly, genus> Species 0.000 description 1
- KCXVZYZYPLLWCC-UHFFFAOYSA-N EDTA Chemical compound OC(=O)CN(CC(O)=O)CCN(CC(O)=O)CC(O)=O KCXVZYZYPLLWCC-UHFFFAOYSA-N 0.000 description 1
- 208000008967 Enuresis Diseases 0.000 description 1
- 108010038532 Enviomycin Proteins 0.000 description 1
- 102000004190 Enzymes Human genes 0.000 description 1
- 108090000790 Enzymes Proteins 0.000 description 1
- 241000588722 Escherichia Species 0.000 description 1
- 229940124602 FDA-approved drug Drugs 0.000 description 1
- GHASVSINZRGABV-UHFFFAOYSA-N Fluorouracil Chemical compound FC1=CNC(=O)NC1=O GHASVSINZRGABV-UHFFFAOYSA-N 0.000 description 1
- 108010010803 Gelatin Proteins 0.000 description 1
- WQZGKKKJIJFFOK-GASJEMHNSA-N Glucose Natural products OC[C@H]1OC(O)[C@H](O)[C@@H](O)[C@@H]1O WQZGKKKJIJFFOK-GASJEMHNSA-N 0.000 description 1
- WHUUTDBJXJRKMK-UHFFFAOYSA-N Glutamic acid Natural products OC(=O)C(N)CCC(O)=O WHUUTDBJXJRKMK-UHFFFAOYSA-N 0.000 description 1
- SXRSQZLOMIGNAQ-UHFFFAOYSA-N Glutaraldehyde Chemical compound O=CCCCC=O SXRSQZLOMIGNAQ-UHFFFAOYSA-N 0.000 description 1
- 239000004471 Glycine Substances 0.000 description 1
- MPDGHEJMBKOTSU-UHFFFAOYSA-N Glycyrrhetinsaeure Natural products C12C(=O)C=C3C4CC(C)(C(O)=O)CCC4(C)CCC3(C)C1(C)CCC1C2(C)CCC(O)C1(C)C MPDGHEJMBKOTSU-UHFFFAOYSA-N 0.000 description 1
- 229920000209 Hexadimethrine bromide Polymers 0.000 description 1
- 241000238631 Hexapoda Species 0.000 description 1
- DSNIERNBMAVNJI-UHFFFAOYSA-N Hieracin Natural products C=1C(O)=CC(O)=C(C(C=2)=O)C=1OC=2C1=CC(O)=C(O)C=C1O DSNIERNBMAVNJI-UHFFFAOYSA-N 0.000 description 1
- DGAQECJNVWCQMB-PUAWFVPOSA-M Ilexoside XXIX Chemical compound C[C@@H]1CC[C@@]2(CC[C@@]3(C(=CC[C@H]4[C@]3(CC[C@@H]5[C@@]4(CC[C@@H](C5(C)C)OS(=O)(=O)[O-])C)C)[C@@H]2[C@]1(C)O)C)C(=O)O[C@H]6[C@@H]([C@H]([C@@H]([C@H](O6)CO)O)O)O.[Na+] DGAQECJNVWCQMB-PUAWFVPOSA-M 0.000 description 1
- 108060003951 Immunoglobulin Proteins 0.000 description 1
- 108010050904 Interferons Proteins 0.000 description 1
- 102000014150 Interferons Human genes 0.000 description 1
- 241000235058 Komagataella pastoris Species 0.000 description 1
- CKLJMWTZIZZHCS-REOHCLBHSA-N L-aspartic acid Chemical compound OC(=O)[C@@H](N)CC(O)=O CKLJMWTZIZZHCS-REOHCLBHSA-N 0.000 description 1
- WHUUTDBJXJRKMK-VKHMYHEASA-N L-glutamic acid Chemical compound OC(=O)[C@@H](N)CCC(O)=O WHUUTDBJXJRKMK-VKHMYHEASA-N 0.000 description 1
- GDBQQVLCIARPGH-UHFFFAOYSA-N Leupeptin Natural products CC(C)CC(NC(C)=O)C(=O)NC(CC(C)C)C(=O)NC(C=O)CCCN=C(N)N GDBQQVLCIARPGH-UHFFFAOYSA-N 0.000 description 1
- GSDSWSVVBLHKDQ-JTQLQIEISA-N Levofloxacin Chemical compound C([C@@H](N1C2=C(C(C(C(O)=O)=C1)=O)C=C1F)C)OC2=C1N1CCN(C)CC1 GSDSWSVVBLHKDQ-JTQLQIEISA-N 0.000 description 1
- 241000124008 Mammalia Species 0.000 description 1
- 229930195725 Mannitol Natural products 0.000 description 1
- 241001465754 Metazoa Species 0.000 description 1
- 108091022875 Microtubule Proteins 0.000 description 1
- 102000029749 Microtubule Human genes 0.000 description 1
- 208000019695 Migraine disease Diseases 0.000 description 1
- 206010027603 Migraine headaches Diseases 0.000 description 1
- 208000013716 Motor tics Diseases 0.000 description 1
- 206010062207 Mycobacterial infection Diseases 0.000 description 1
- 241000186359 Mycobacterium Species 0.000 description 1
- 241001467553 Mycobacterium africanum Species 0.000 description 1
- 241000186367 Mycobacterium avium Species 0.000 description 1
- 241000186365 Mycobacterium fortuitum Species 0.000 description 1
- 241000187492 Mycobacterium marinum Species 0.000 description 1
- 241000187480 Mycobacterium smegmatis Species 0.000 description 1
- 241000187479 Mycobacterium tuberculosis Species 0.000 description 1
- 241000187917 Mycobacterium ulcerans Species 0.000 description 1
- 206010028813 Nausea Diseases 0.000 description 1
- 208000031705 Neglected disease Diseases 0.000 description 1
- 206010028980 Neoplasm Diseases 0.000 description 1
- 208000002193 Pain Diseases 0.000 description 1
- 229930040373 Paraformaldehyde Natural products 0.000 description 1
- 241000286209 Phasianidae Species 0.000 description 1
- VRDIULHPQTYCLN-UHFFFAOYSA-N Prothionamide Chemical compound CCCC1=CC(C(N)=S)=CC=N1 VRDIULHPQTYCLN-UHFFFAOYSA-N 0.000 description 1
- 208000028017 Psychotic disease Diseases 0.000 description 1
- 206010038997 Retroviral infections Diseases 0.000 description 1
- 241000293869 Salmonella enterica subsp. enterica serovar Typhimurium Species 0.000 description 1
- 102000007562 Serum Albumin Human genes 0.000 description 1
- 108010071390 Serum Albumin Proteins 0.000 description 1
- 241000256248 Spodoptera Species 0.000 description 1
- 241000187747 Streptomyces Species 0.000 description 1
- 238000000692 Student's t-test Methods 0.000 description 1
- KLBQZWRITKRQQV-UHFFFAOYSA-N Thioridazine Chemical compound C12=CC(SC)=CC=C2SC2=CC=CC=C2N1CCC1CCCCN1C KLBQZWRITKRQQV-UHFFFAOYSA-N 0.000 description 1
- 208000008234 Tics Diseases 0.000 description 1
- 208000000323 Tourette Syndrome Diseases 0.000 description 1
- 208000016620 Tourette disease Diseases 0.000 description 1
- 102000004243 Tubulin Human genes 0.000 description 1
- 108090000704 Tubulin Proteins 0.000 description 1
- COQLPRJCUIATTQ-UHFFFAOYSA-N Uranyl acetate Chemical compound O.O.O=[U]=O.CC(O)=O.CC(O)=O COQLPRJCUIATTQ-UHFFFAOYSA-N 0.000 description 1
- 108010015940 Viomycin Proteins 0.000 description 1
- OZKXLOZHHUHGNV-UHFFFAOYSA-N Viomycin Natural products NCCCC(N)CC(=O)NC1CNC(=O)C(=CNC(=O)N)NC(=O)C(CO)NC(=O)C(CO)NC(=O)C(NC1=O)C2CC(O)NC(=N)N2 OZKXLOZHHUHGNV-UHFFFAOYSA-N 0.000 description 1
- ZWBTYMGEBZUQTK-PVLSIAFMSA-N [(7S,9E,11S,12R,13S,14R,15R,16R,17S,18S,19E,21Z)-2,15,17,32-tetrahydroxy-11-methoxy-3,7,12,14,16,18,22-heptamethyl-1'-(2-methylpropyl)-6,23-dioxospiro[8,33-dioxa-24,27,29-triazapentacyclo[23.6.1.14,7.05,31.026,30]tritriaconta-1(32),2,4,9,19,21,24,26,30-nonaene-28,4'-piperidine]-13-yl] acetate Chemical compound CO[C@H]1\C=C\O[C@@]2(C)Oc3c(C2=O)c2c4NC5(CCN(CC(C)C)CC5)N=c4c(=NC(=O)\C(C)=C/C=C/[C@H](C)[C@H](O)[C@@H](C)[C@@H](O)[C@@H](C)[C@H](OC(C)=O)[C@@H]1C)c(O)c2c(O)c3C ZWBTYMGEBZUQTK-PVLSIAFMSA-N 0.000 description 1
- 230000002159 abnormal effect Effects 0.000 description 1
- 230000001133 acceleration Effects 0.000 description 1
- 239000002253 acid Substances 0.000 description 1
- 230000004913 activation Effects 0.000 description 1
- 230000009056 active transport Effects 0.000 description 1
- 208000036981 active tuberculosis Diseases 0.000 description 1
- 125000002015 acyclic group Chemical group 0.000 description 1
- 230000003044 adaptive effect Effects 0.000 description 1
- 230000004721 adaptive immunity Effects 0.000 description 1
- 239000002671 adjuvant Substances 0.000 description 1
- 239000008272 agar Substances 0.000 description 1
- 239000004411 aluminium Substances 0.000 description 1
- 229910052782 aluminium Inorganic materials 0.000 description 1
- XAGFODPZIPBFFR-UHFFFAOYSA-N aluminium Chemical compound [Al] XAGFODPZIPBFFR-UHFFFAOYSA-N 0.000 description 1
- 235000001014 amino acid Nutrition 0.000 description 1
- 229940126575 aminoglycoside Drugs 0.000 description 1
- 235000019270 ammonium chloride Nutrition 0.000 description 1
- 230000003466 anti-cipated effect Effects 0.000 description 1
- 230000003474 anti-emetic effect Effects 0.000 description 1
- 230000000845 anti-microbial effect Effects 0.000 description 1
- 230000002365 anti-tubercular Effects 0.000 description 1
- 239000002111 antiemetic agent Substances 0.000 description 1
- 239000004599 antimicrobial Substances 0.000 description 1
- 230000003078 antioxidant effect Effects 0.000 description 1
- 235000009697 arginine Nutrition 0.000 description 1
- 230000001174 ascending effect Effects 0.000 description 1
- 229960005070 ascorbic acid Drugs 0.000 description 1
- 235000010323 ascorbic acid Nutrition 0.000 description 1
- 239000011668 ascorbic acid Substances 0.000 description 1
- 235000003704 aspartic acid Nutrition 0.000 description 1
- 230000004642 autophagic pathway Effects 0.000 description 1
- 230000005033 autophagosome formation Effects 0.000 description 1
- 229960004335 azelastine hydrochloride Drugs 0.000 description 1
- YEJAJYAHJQIWNU-UHFFFAOYSA-N azelastine hydrochloride Chemical compound Cl.C1CN(C)CCCC1N1C(=O)C2=CC=CC=C2C(CC=2C=CC(Cl)=CC=2)=N1 YEJAJYAHJQIWNU-UHFFFAOYSA-N 0.000 description 1
- 239000008228 bacteriostatic water for injection Substances 0.000 description 1
- XDHNQDDQEHDUTM-JQWOJBOSSA-N bafilomycin A1 Chemical compound CO[C@H]1\C=C\C=C(C)\C[C@H](C)[C@H](O)[C@H](C)\C=C(/C)\C=C(OC)\C(=O)O[C@@H]1[C@@H](C)[C@@H](O)[C@H](C)[C@]1(O)O[C@H](C(C)C)[C@@H](C)[C@H](O)C1 XDHNQDDQEHDUTM-JQWOJBOSSA-N 0.000 description 1
- 239000003855 balanced salt solution Substances 0.000 description 1
- 239000011324 bead Substances 0.000 description 1
- 230000003542 behavioural effect Effects 0.000 description 1
- GIJXKZJWITVLHI-PMOLBWCYSA-N benzatropine Chemical compound O([C@H]1C[C@H]2CC[C@@H](C1)N2C)C(C=1C=CC=CC=1)C1=CC=CC=C1 GIJXKZJWITVLHI-PMOLBWCYSA-N 0.000 description 1
- 229960001081 benzatropine Drugs 0.000 description 1
- 229960004156 bepridil hydrochloride Drugs 0.000 description 1
- JXBBWYGMTNAYNM-UHFFFAOYSA-N bepridil hydrochloride Chemical compound [H+].[Cl-].C1CCCN1C(COCC(C)C)CN(C=1C=CC=CC=1)CC1=CC=CC=C1 JXBBWYGMTNAYNM-UHFFFAOYSA-N 0.000 description 1
- WQZGKKKJIJFFOK-VFUOTHLCSA-N beta-D-glucose Chemical compound OC[C@H]1O[C@@H](O)[C@H](O)[C@@H](O)[C@@H]1O WQZGKKKJIJFFOK-VFUOTHLCSA-N 0.000 description 1
- OQFSQFPPLPISGP-UHFFFAOYSA-N beta-carboxyaspartic acid Natural products OC(=O)C(N)C(C(O)=O)C(O)=O OQFSQFPPLPISGP-UHFFFAOYSA-N 0.000 description 1
- 239000011230 binding agent Substances 0.000 description 1
- 230000000975 bioactive effect Effects 0.000 description 1
- 230000008436 biogenesis Effects 0.000 description 1
- 230000031018 biological processes and functions Effects 0.000 description 1
- 230000033228 biological regulation Effects 0.000 description 1
- HOQPTLCRWVZIQZ-UHFFFAOYSA-H bis[[2-(5-hydroxy-4,7-dioxo-1,3,2$l^{2}-dioxaplumbepan-5-yl)acetyl]oxy]lead Chemical compound [Pb+2].[Pb+2].[Pb+2].[O-]C(=O)CC(O)(CC([O-])=O)C([O-])=O.[O-]C(=O)CC(O)(CC([O-])=O)C([O-])=O HOQPTLCRWVZIQZ-UHFFFAOYSA-H 0.000 description 1
- 210000004369 blood Anatomy 0.000 description 1
- 239000008280 blood Substances 0.000 description 1
- 210000001185 bone marrow Anatomy 0.000 description 1
- 210000004556 brain Anatomy 0.000 description 1
- 239000000872 buffer Substances 0.000 description 1
- 239000011575 calcium Substances 0.000 description 1
- 229910052791 calcium Inorganic materials 0.000 description 1
- 229960004602 capreomycin Drugs 0.000 description 1
- 150000001720 carbohydrates Chemical class 0.000 description 1
- 235000014633 carbohydrates Nutrition 0.000 description 1
- 239000001569 carbon dioxide Substances 0.000 description 1
- 229910002092 carbon dioxide Inorganic materials 0.000 description 1
- 239000011203 carbon fibre reinforced carbon Substances 0.000 description 1
- 229910002091 carbon monoxide Inorganic materials 0.000 description 1
- 150000004649 carbonic acid derivatives Chemical class 0.000 description 1
- 210000004413 cardiac myocyte Anatomy 0.000 description 1
- 238000000423 cell based assay Methods 0.000 description 1
- 239000006143 cell culture medium Substances 0.000 description 1
- 230000030833 cell death Effects 0.000 description 1
- 230000032823 cell division Effects 0.000 description 1
- 230000003915 cell function Effects 0.000 description 1
- 210000000170 cell membrane Anatomy 0.000 description 1
- 230000036755 cellular response Effects 0.000 description 1
- 239000001913 cellulose Substances 0.000 description 1
- 229920002678 cellulose Polymers 0.000 description 1
- 238000012822 chemical development Methods 0.000 description 1
- 238000002512 chemotherapy Methods 0.000 description 1
- 229960002881 clemastine Drugs 0.000 description 1
- YNNUSGIPVFPVBX-NHCUHLMSSA-N clemastine Chemical compound CN1CCC[C@@H]1CCO[C@@](C)(C=1C=CC(Cl)=CC=1)C1=CC=CC=C1 YNNUSGIPVFPVBX-NHCUHLMSSA-N 0.000 description 1
- 238000000975 co-precipitation Methods 0.000 description 1
- 230000001332 colony forming effect Effects 0.000 description 1
- 238000004737 colorimetric analysis Methods 0.000 description 1
- 238000002648 combination therapy Methods 0.000 description 1
- 229940088505 compazine Drugs 0.000 description 1
- 238000004590 computer program Methods 0.000 description 1
- 238000004624 confocal microscopy Methods 0.000 description 1
- 238000010276 construction Methods 0.000 description 1
- 238000007796 conventional method Methods 0.000 description 1
- 238000012937 correction Methods 0.000 description 1
- 230000001186 cumulative effect Effects 0.000 description 1
- 229960003077 cycloserine Drugs 0.000 description 1
- 210000004292 cytoskeleton Anatomy 0.000 description 1
- 231100000135 cytotoxicity Toxicity 0.000 description 1
- 230000003013 cytotoxicity Effects 0.000 description 1
- 238000007405 data analysis Methods 0.000 description 1
- 238000000354 decomposition reaction Methods 0.000 description 1
- 210000004443 dendritic cell Anatomy 0.000 description 1
- 238000001514 detection method Methods 0.000 description 1
- 235000019425 dextrin Nutrition 0.000 description 1
- 206010012601 diabetes mellitus Diseases 0.000 description 1
- GUBNMFJOJGDCEL-UHFFFAOYSA-N dicyclomine hydrochloride Chemical compound [Cl-].C1CCCCC1C1(C(=O)OCC[NH+](CC)CC)CCCCC1 GUBNMFJOJGDCEL-UHFFFAOYSA-N 0.000 description 1
- 229940110321 dicyclomine hydrochloride Drugs 0.000 description 1
- 238000009792 diffusion process Methods 0.000 description 1
- 239000003085 diluting agent Substances 0.000 description 1
- 239000012895 dilution Substances 0.000 description 1
- 238000010790 dilution Methods 0.000 description 1
- 150000002016 disaccharides Chemical class 0.000 description 1
- 229960003638 dopamine Drugs 0.000 description 1
- 238000007876 drug discovery Methods 0.000 description 1
- 208000015355 drug-resistant tuberculosis Diseases 0.000 description 1
- 239000012636 effector Substances 0.000 description 1
- 230000005670 electromagnetic radiation Effects 0.000 description 1
- 238000004520 electroporation Methods 0.000 description 1
- 230000004651 endocytosis pathway Effects 0.000 description 1
- 230000002708 enhancing effect Effects 0.000 description 1
- 229960003720 enoxolone Drugs 0.000 description 1
- 229950000219 enviomycin Drugs 0.000 description 1
- 229960000285 ethambutol Drugs 0.000 description 1
- AEOCXXJPGCBFJA-UHFFFAOYSA-N ethionamide Chemical compound CCC1=CC(C(N)=S)=CC=N1 AEOCXXJPGCBFJA-UHFFFAOYSA-N 0.000 description 1
- 229960002001 ethionamide Drugs 0.000 description 1
- 238000011156 evaluation Methods 0.000 description 1
- 230000005284 excitation Effects 0.000 description 1
- 230000007717 exclusion Effects 0.000 description 1
- 239000002360 explosive Substances 0.000 description 1
- 239000013604 expression vector Substances 0.000 description 1
- 238000000605 extraction Methods 0.000 description 1
- 229960002602 fendiline Drugs 0.000 description 1
- 210000002950 fibroblast Anatomy 0.000 description 1
- 239000000834 fixative Substances 0.000 description 1
- GNBHRKFJIUUOQI-UHFFFAOYSA-N fluorescein Chemical compound O1C(=O)C2=CC=CC=C2C21C1=CC=C(O)C=C1OC1=CC(O)=CC=C21 GNBHRKFJIUUOQI-UHFFFAOYSA-N 0.000 description 1
- 229940124307 fluoroquinolone Drugs 0.000 description 1
- 230000004907 flux Effects 0.000 description 1
- 230000002538 fungal effect Effects 0.000 description 1
- 239000008273 gelatin Substances 0.000 description 1
- 229920000159 gelatin Polymers 0.000 description 1
- 235000019322 gelatine Nutrition 0.000 description 1
- 235000011852 gelatine desserts Nutrition 0.000 description 1
- 108091008053 gene clusters Proteins 0.000 description 1
- 230000004077 genetic alteration Effects 0.000 description 1
- 231100000118 genetic alteration Toxicity 0.000 description 1
- 238000009650 gentamicin protection assay Methods 0.000 description 1
- 239000008103 glucose Substances 0.000 description 1
- 235000013922 glutamic acid Nutrition 0.000 description 1
- 239000004220 glutamic acid Substances 0.000 description 1
- 229940093915 gynecological organic acid Drugs 0.000 description 1
- 229940095895 haldol Drugs 0.000 description 1
- 230000036541 health Effects 0.000 description 1
- 210000003494 hepatocyte Anatomy 0.000 description 1
- 230000001744 histochemical effect Effects 0.000 description 1
- 230000006801 homologous recombination Effects 0.000 description 1
- 238000002744 homologous recombination Methods 0.000 description 1
- 229920001477 hydrophilic polymer Polymers 0.000 description 1
- 208000013403 hyperactivity Diseases 0.000 description 1
- 238000005286 illumination Methods 0.000 description 1
- 238000003709 image segmentation Methods 0.000 description 1
- 238000002952 image-based readout Methods 0.000 description 1
- 210000000987 immune system Anatomy 0.000 description 1
- 238000003119 immunoblot Methods 0.000 description 1
- 102000018358 immunoglobulin Human genes 0.000 description 1
- 229940072221 immunoglobulins Drugs 0.000 description 1
- 238000012744 immunostaining Methods 0.000 description 1
- 230000002779 inactivation Effects 0.000 description 1
- 239000011261 inert gas Substances 0.000 description 1
- 230000028709 inflammatory response Effects 0.000 description 1
- 239000003978 infusion fluid Substances 0.000 description 1
- 230000015788 innate immune response Effects 0.000 description 1
- 150000002484 inorganic compounds Chemical class 0.000 description 1
- 229910010272 inorganic material Inorganic materials 0.000 description 1
- 229910052500 inorganic mineral Inorganic materials 0.000 description 1
- 230000002452 interceptive effect Effects 0.000 description 1
- 229940047124 interferons Drugs 0.000 description 1
- 230000006662 intracellular pathway Effects 0.000 description 1
- 238000001990 intravenous administration Methods 0.000 description 1
- 238000010253 intravenous injection Methods 0.000 description 1
- 229960003350 isoniazid Drugs 0.000 description 1
- QRXWMOHMRWLFEY-UHFFFAOYSA-N isoniazide Chemical compound NNC(=O)C1=CC=NC=C1 QRXWMOHMRWLFEY-UHFFFAOYSA-N 0.000 description 1
- 238000003064 k means clustering Methods 0.000 description 1
- TYQCGQRIZGCHNB-JLAZNSOCSA-N l-ascorbic acid Chemical compound OC[C@H](O)[C@H]1OC(O)=C(O)C1=O TYQCGQRIZGCHNB-JLAZNSOCSA-N 0.000 description 1
- 231100000518 lethal Toxicity 0.000 description 1
- 230000001665 lethal effect Effects 0.000 description 1
- GDBQQVLCIARPGH-ULQDDVLXSA-N leupeptin Chemical compound CC(C)C[C@H](NC(C)=O)C(=O)N[C@@H](CC(C)C)C(=O)N[C@H](C=O)CCCN=C(N)N GDBQQVLCIARPGH-ULQDDVLXSA-N 0.000 description 1
- 108010052968 leupeptin Proteins 0.000 description 1
- 229960003376 levofloxacin Drugs 0.000 description 1
- 230000029226 lipidation Effects 0.000 description 1
- 150000002632 lipids Chemical class 0.000 description 1
- 238000001638 lipofection Methods 0.000 description 1
- 239000002502 liposome Substances 0.000 description 1
- 238000011068 loading method Methods 0.000 description 1
- 230000004807 localization Effects 0.000 description 1
- 239000000314 lubricant Substances 0.000 description 1
- 210000004072 lung Anatomy 0.000 description 1
- 230000004142 macroautophagy Effects 0.000 description 1
- 239000003120 macrolide antibiotic agent Substances 0.000 description 1
- 229940041033 macrolides Drugs 0.000 description 1
- 239000000594 mannitol Substances 0.000 description 1
- 235000010355 mannitol Nutrition 0.000 description 1
- 230000008172 membrane trafficking Effects 0.000 description 1
- 229910052751 metal Inorganic materials 0.000 description 1
- 239000002184 metal Substances 0.000 description 1
- 108091070501 miRNA Proteins 0.000 description 1
- 239000002679 microRNA Substances 0.000 description 1
- 230000000813 microbial effect Effects 0.000 description 1
- 210000004688 microtubule Anatomy 0.000 description 1
- 206010027599 migraine Diseases 0.000 description 1
- 239000011707 mineral Substances 0.000 description 1
- 150000002772 monosaccharides Chemical class 0.000 description 1
- 210000001665 muscle stem cell Anatomy 0.000 description 1
- 238000002703 mutagenesis Methods 0.000 description 1
- 231100000350 mutagenesis Toxicity 0.000 description 1
- 208000029766 myalgic encephalomeyelitis/chronic fatigue syndrome Diseases 0.000 description 1
- 208000027531 mycobacterial infectious disease Diseases 0.000 description 1
- 229930014626 natural product Natural products 0.000 description 1
- 230000008693 nausea Effects 0.000 description 1
- 230000000926 neurological effect Effects 0.000 description 1
- 210000002569 neuron Anatomy 0.000 description 1
- 239000002858 neurotransmitter agent Substances 0.000 description 1
- 230000007935 neutral effect Effects 0.000 description 1
- 208000005346 nocturnal enuresis Diseases 0.000 description 1
- 239000002736 nonionic surfactant Substances 0.000 description 1
- 230000009437 off-target effect Effects 0.000 description 1
- 210000003463 organelle Anatomy 0.000 description 1
- 150000007524 organic acids Chemical class 0.000 description 1
- 235000005985 organic acids Nutrition 0.000 description 1
- 239000003960 organic solvent Substances 0.000 description 1
- 229960001687 orphenadrine citrate Drugs 0.000 description 1
- MMMNTDFSPSQXJP-UHFFFAOYSA-N orphenadrine citrate Chemical compound OC(=O)CC(O)(C(O)=O)CC(O)=O.C=1C=CC=C(C)C=1C(OCCN(C)C)C1=CC=CC=C1 MMMNTDFSPSQXJP-UHFFFAOYSA-N 0.000 description 1
- 229910052762 osmium Inorganic materials 0.000 description 1
- SYQBFIAQOQZEGI-UHFFFAOYSA-N osmium atom Chemical compound [Os] SYQBFIAQOQZEGI-UHFFFAOYSA-N 0.000 description 1
- 210000001672 ovary Anatomy 0.000 description 1
- VYNDHICBIRRPFP-UHFFFAOYSA-N pacific blue Chemical compound FC1=C(O)C(F)=C2OC(=O)C(C(=O)O)=CC2=C1 VYNDHICBIRRPFP-UHFFFAOYSA-N 0.000 description 1
- 229940055692 pamelor Drugs 0.000 description 1
- 229920002866 paraformaldehyde Polymers 0.000 description 1
- 230000036961 partial effect Effects 0.000 description 1
- 210000003024 peritoneal macrophage Anatomy 0.000 description 1
- 230000010399 physical interaction Effects 0.000 description 1
- 229920001983 poloxamer Polymers 0.000 description 1
- 229920000724 poly(L-arginine) polymer Polymers 0.000 description 1
- 108010011110 polyarginine Proteins 0.000 description 1
- 229920001223 polyethylene glycol Polymers 0.000 description 1
- 235000010482 polyoxyethylene sorbitan monooleate Nutrition 0.000 description 1
- 229920001184 polypeptide Polymers 0.000 description 1
- 229920000136 polysorbate Polymers 0.000 description 1
- 229920000053 polysorbate 80 Polymers 0.000 description 1
- 229940068965 polysorbates Drugs 0.000 description 1
- 239000001267 polyvinylpyrrolidone Substances 0.000 description 1
- 235000013855 polyvinylpyrrolidone Nutrition 0.000 description 1
- 229920000036 polyvinylpyrrolidone Polymers 0.000 description 1
- 239000003755 preservative agent Substances 0.000 description 1
- 230000002035 prolonged effect Effects 0.000 description 1
- 229960000918 protionamide Drugs 0.000 description 1
- 210000001938 protoplast Anatomy 0.000 description 1
- 238000001671 psychotherapy Methods 0.000 description 1
- 229960005206 pyrazinamide Drugs 0.000 description 1
- IPEHBUMCGVEMRF-UHFFFAOYSA-N pyrazinecarboxamide Chemical compound NC(=O)C1=CN=CC=N1 IPEHBUMCGVEMRF-UHFFFAOYSA-N 0.000 description 1
- 229940044551 receptor antagonist Drugs 0.000 description 1
- 239000002464 receptor antagonist Substances 0.000 description 1
- 230000015629 regulation of autophagy Effects 0.000 description 1
- 238000011160 research Methods 0.000 description 1
- 230000029058 respiratory gaseous exchange Effects 0.000 description 1
- 230000004044 response Effects 0.000 description 1
- 229960000885 rifabutin Drugs 0.000 description 1
- 238000004626 scanning electron microscopy Methods 0.000 description 1
- 210000002966 serum Anatomy 0.000 description 1
- 230000011664 signaling Effects 0.000 description 1
- 210000001057 smooth muscle myoblast Anatomy 0.000 description 1
- 239000011734 sodium Substances 0.000 description 1
- 229910052708 sodium Inorganic materials 0.000 description 1
- 239000000600 sorbitol Substances 0.000 description 1
- 230000007480 spreading Effects 0.000 description 1
- 238000003892 spreading Methods 0.000 description 1
- 238000013179 statistical model Methods 0.000 description 1
- WNIFXKPDILJURQ-UHFFFAOYSA-N stearyl glycyrrhizinate Natural products C1CC(O)C(C)(C)C2CCC3(C)C4(C)CCC5(C)CCC(C(=O)OCCCCCCCCCCCCCCCCCC)(C)CC5C4=CC(=O)C3C21C WNIFXKPDILJURQ-UHFFFAOYSA-N 0.000 description 1
- 238000011146 sterile filtration Methods 0.000 description 1
- 239000008174 sterile solution Substances 0.000 description 1
- 238000000547 structure data Methods 0.000 description 1
- 238000006467 substitution reaction Methods 0.000 description 1
- KDYFGRWQOYBRFD-UHFFFAOYSA-L succinate(2-) Chemical compound [O-]C(=O)CCC([O-])=O KDYFGRWQOYBRFD-UHFFFAOYSA-L 0.000 description 1
- 235000000346 sugar Nutrition 0.000 description 1
- 150000005846 sugar alcohols Chemical class 0.000 description 1
- 150000008163 sugars Chemical class 0.000 description 1
- 229960003967 suloctidil Drugs 0.000 description 1
- 239000013589 supplement Substances 0.000 description 1
- 208000024891 symptom Diseases 0.000 description 1
- 230000002195 synergetic effect Effects 0.000 description 1
- ODKYYBOHSVLGNU-IAGONARPSA-N terizidone Chemical compound O=C1NOCC1\N=C\C(C=C1)=CC=C1\C=N\C1C(=O)NOC1 ODKYYBOHSVLGNU-IAGONARPSA-N 0.000 description 1
- 229960003457 terizidone Drugs 0.000 description 1
- MPLHNVLQVRSVEE-UHFFFAOYSA-N texas red Chemical compound [O-]S(=O)(=O)C1=CC(S(Cl)(=O)=O)=CC=C1C(C1=CC=2CCCN3CCCC(C=23)=C1O1)=C2C1=C(CCC1)C3=[N+]1CCCC3=C2 MPLHNVLQVRSVEE-UHFFFAOYSA-N 0.000 description 1
- 238000002560 therapeutic procedure Methods 0.000 description 1
- 229960003231 thioacetazone Drugs 0.000 description 1
- SRVJKTDHMYAMHA-WUXMJOGZSA-N thioacetazone Chemical compound CC(=O)NC1=CC=C(\C=N\NC(N)=S)C=C1 SRVJKTDHMYAMHA-WUXMJOGZSA-N 0.000 description 1
- 150000003556 thioamides Chemical class 0.000 description 1
- 229960002784 thioridazine Drugs 0.000 description 1
- 231100000167 toxic agent Toxicity 0.000 description 1
- 238000002723 toxicity assay Methods 0.000 description 1
- 230000001052 transient effect Effects 0.000 description 1
- ARSRJFRKVXALTF-UHFFFAOYSA-N tricetin Chemical compound C=1C(O)=CC(O)=C(C(C=2)=O)C=1OC=2C1=CC(O)=C(O)C(O)=C1 ARSRJFRKVXALTF-UHFFFAOYSA-N 0.000 description 1
- CMPNIWQMRYYTMK-UHFFFAOYSA-O tricetinidin Natural products [O+]=1C2=CC(O)=CC(O)=C2C=CC=1C1=CC(O)=C(O)C(O)=C1 CMPNIWQMRYYTMK-UHFFFAOYSA-O 0.000 description 1
- 238000010246 ultrastructural analysis Methods 0.000 description 1
- 238000012418 validation experiment Methods 0.000 description 1
- 231100000889 vertigo Toxicity 0.000 description 1
- 229950001272 viomycin Drugs 0.000 description 1
- GXFAIFRPOKBQRV-GHXCTMGLSA-N viomycin Chemical compound N1C(=O)\C(=C\NC(N)=O)NC(=O)[C@H](CO)NC(=O)[C@H](CO)NC(=O)[C@@H](NC(=O)C[C@@H](N)CCCN)CNC(=O)[C@@H]1[C@@H]1NC(=N)N[C@@H](O)C1 GXFAIFRPOKBQRV-GHXCTMGLSA-N 0.000 description 1
- 230000003612 virological effect Effects 0.000 description 1
- 229930003231 vitamin Natural products 0.000 description 1
- 235000013343 vitamin Nutrition 0.000 description 1
- 239000011782 vitamin Substances 0.000 description 1
- 229940088594 vitamin Drugs 0.000 description 1
- 150000003722 vitamin derivatives Chemical class 0.000 description 1
- 230000001755 vocal effect Effects 0.000 description 1
- 238000005303 weighing Methods 0.000 description 1
- 239000000080 wetting agent Substances 0.000 description 1
Images


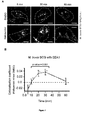


Classifications
-
- A—HUMAN NECESSITIES
- A61—MEDICAL OR VETERINARY SCIENCE; HYGIENE
- A61K—PREPARATIONS FOR MEDICAL, DENTAL OR TOILETRY PURPOSES
- A61K45/00—Medicinal preparations containing active ingredients not provided for in groups A61K31/00 - A61K41/00
- A61K45/06—Mixtures of active ingredients without chemical characterisation, e.g. antiphlogistics and cardiaca
-
- A—HUMAN NECESSITIES
- A61—MEDICAL OR VETERINARY SCIENCE; HYGIENE
- A61K—PREPARATIONS FOR MEDICAL, DENTAL OR TOILETRY PURPOSES
- A61K31/00—Medicinal preparations containing organic active ingredients
- A61K31/13—Amines
- A61K31/135—Amines having aromatic rings, e.g. ketamine, nortriptyline
-
- A—HUMAN NECESSITIES
- A61—MEDICAL OR VETERINARY SCIENCE; HYGIENE
- A61K—PREPARATIONS FOR MEDICAL, DENTAL OR TOILETRY PURPOSES
- A61K31/00—Medicinal preparations containing organic active ingredients
- A61K31/33—Heterocyclic compounds
- A61K31/395—Heterocyclic compounds having nitrogen as a ring hetero atom, e.g. guanethidine or rifamycins
- A61K31/435—Heterocyclic compounds having nitrogen as a ring hetero atom, e.g. guanethidine or rifamycins having six-membered rings with one nitrogen as the only ring hetero atom
- A61K31/44—Non condensed pyridines; Hydrogenated derivatives thereof
- A61K31/445—Non condensed piperidines, e.g. piperocaine
- A61K31/4515—Non condensed piperidines, e.g. piperocaine having a butyrophenone group in position 1, e.g. haloperidol
-
- A—HUMAN NECESSITIES
- A61—MEDICAL OR VETERINARY SCIENCE; HYGIENE
- A61K—PREPARATIONS FOR MEDICAL, DENTAL OR TOILETRY PURPOSES
- A61K31/00—Medicinal preparations containing organic active ingredients
- A61K31/33—Heterocyclic compounds
- A61K31/395—Heterocyclic compounds having nitrogen as a ring hetero atom, e.g. guanethidine or rifamycins
- A61K31/54—Heterocyclic compounds having nitrogen as a ring hetero atom, e.g. guanethidine or rifamycins having six-membered rings with at least one nitrogen and one sulfur as the ring hetero atoms, e.g. sulthiame
- A61K31/5415—Heterocyclic compounds having nitrogen as a ring hetero atom, e.g. guanethidine or rifamycins having six-membered rings with at least one nitrogen and one sulfur as the ring hetero atoms, e.g. sulthiame ortho- or peri-condensed with carbocyclic ring systems, e.g. phenothiazine, chlorpromazine, piroxicam
-
- A—HUMAN NECESSITIES
- A61—MEDICAL OR VETERINARY SCIENCE; HYGIENE
- A61P—SPECIFIC THERAPEUTIC ACTIVITY OF CHEMICAL COMPOUNDS OR MEDICINAL PREPARATIONS
- A61P31/00—Antiinfectives, i.e. antibiotics, antiseptics, chemotherapeutics
- A61P31/04—Antibacterial agents
- A61P31/06—Antibacterial agents for tuberculosis
-
- C—CHEMISTRY; METALLURGY
- C12—BIOCHEMISTRY; BEER; SPIRITS; WINE; VINEGAR; MICROBIOLOGY; ENZYMOLOGY; MUTATION OR GENETIC ENGINEERING
- C12Q—MEASURING OR TESTING PROCESSES INVOLVING ENZYMES, NUCLEIC ACIDS OR MICROORGANISMS; COMPOSITIONS OR TEST PAPERS THEREFOR; PROCESSES OF PREPARING SUCH COMPOSITIONS; CONDITION-RESPONSIVE CONTROL IN MICROBIOLOGICAL OR ENZYMOLOGICAL PROCESSES
- C12Q1/00—Measuring or testing processes involving enzymes, nucleic acids or microorganisms; Compositions therefor; Processes of preparing such compositions
- C12Q1/02—Measuring or testing processes involving enzymes, nucleic acids or microorganisms; Compositions therefor; Processes of preparing such compositions involving viable microorganisms
- C12Q1/18—Testing for antimicrobial activity of a material
-
- G—PHYSICS
- G01—MEASURING; TESTING
- G01N—INVESTIGATING OR ANALYSING MATERIALS BY DETERMINING THEIR CHEMICAL OR PHYSICAL PROPERTIES
- G01N2333/00—Assays involving biological materials from specific organisms or of a specific nature
- G01N2333/195—Assays involving biological materials from specific organisms or of a specific nature from bacteria
- G01N2333/35—Assays involving biological materials from specific organisms or of a specific nature from bacteria from Mycobacteriaceae (F)
Definitions
- the present invention relates to a compound capable of killing mycobacteria by activating host cellular mechanisms for use in treating tuberculosis, wherein the compound is selected from the group consisting of nortriptyline, haloperidol and prochlorperazine edisylate (PE). Furthermore, the present invention relates to a pharmaceutical composition comprising the compound of the invention, and optionally a pharmaceutically acceptable carrier. The invention further relates to a method of treating tuberculosis as well as a method of identifying a lead compound for the treatment of tuberculosis.
- Tuberculosis is a common, and in many cases lethal, contagious bacterial infection caused by various strains of mycobacteria, usually Mycobacterium tuberculosis (M. tuberculosis).
- the disease involves the lungs, but may also spread to other organs.
- Primary TB infection typically occurs by breathing in air droplets from a cough or sneeze of an infected person. Normally, most people recover from primary TB infection without further evidence of the disease, but the infection may stay inactive (dormant) for many years. In some people, the disease can reactivate or the disease may become active within weeks after the primary infection. In particular elderly people and infants but also people with a weakened immune system, e.g.
- MDR-TB multiple drug-resistant tuberculosis
- TB is characterized by an extensive array of interactions between mycobacteria and the host.
- mycobacteria influence a variety of fundamental host cell processes including apoptosis (Behar et al., 2010; Chen et al., 2006; Keane et al., 2000), autophagy (Gutierrez et al., 2004; Kumar et al., 2010), trafficking (Armstrong and Hart, 1971; Russell, 2001) and signalling (Koul et al., 2004). Therefore, a pharmacological modulation of the host cell mechanisms that are hijacked by the bacteria could, on the one hand, be used to explore the processes altered during the infection and, on the other hand, lead to development of novel classes of anti-TB compounds.
- the present invention relates to a compound capable of killing mycobacteria by activating host cellular mechanisms for use in treating tuberculosis, wherein the compound is selected from the group consisting of 3-(10,11-dihydro-5H-dibenzo[a,d] cyclohepten-5-ylidene)- N-methyl-1-propanamine (nortriptyline), 4-[4-(4-chlorophenyl)-4-hydroxy-1-piperidyl]-1-(4-fluorophenyl)-butan-1-one (haloperidol) and 2-chloro-10-[3-(4-methyl-1-piperazinyl)propyl]-10 H -phenothiazine (prochlorperazine edisylate;PE).
- the compound is selected from the group consisting of 3-(10,11-dihydro-5H-dibenzo[a,d] cyclohepten-5-ylidene)- N-methyl-1-
- compounds for the treatment of tuberculosis are provided that were not previously known to be suitable as active agents for the therapy of tuberculosis. These compounds are selected from the group consisting of nortriptyline, haloperidol and prochlorperazine edisylate (PE), all three of which have been shown in the appended examples as being capable of killing mycobacteria by activating host cellular mechanisms, in particular by restoring mycobacteria-arrested phagosome maturation.
- PE prochlorperazine edisylate
- Nortriptyline is a tricyclic antidepressant, the systematic (IUPAC) name of which is 3-(10,11-dihydro-5H-dibenzo[a,d] cyclohepten-5-ylidene)- N-methyl-1-propanamine. It is also marketed as the hydrochloride salt under the trade names Sensoval, Aventyl, Pamelor, Norpress, Allegron, Noritren and Nortrilen. Nortriptyline is used to treat symptoms of depression as well as childhood nocturnal enuresis. Sometimes it is also used for the treatment of chronic illnesses such as chronic fatigue syndrome, chronic pain and migraine, and labile affect in some neurological conditions.
- Haloperidol is a compound from the group of medications called conventional antipsychotics and has the systematic (IUPAC) name 4-[4-(4-chlorophenyl)-4-hydroxy-1-piperidyl]-1-(4-fluorophenyl)-butan-1-one.
- Haloperidol works by decreasing abnormal excitement in the brain and is used to treat psychotic disorders, but also to control motor tics and verbal tics in adults and children who have Tourette's disorder.
- Haloperidol is further used to treat severe behavioural problems such as explosive, aggressive behaviour or hyperactivity in children who cannot be treated with psychotherapy or with other medications.
- Haloperidol is sold under the trade names Aloperidin, Bioperidolo, Brotopon, Dozic, Duraperidol (Germany), Einalon S, Eukystol, Haldol (common tradename in the US and UK), Halosten, Keselan, Linton, Peluces, Serenace, Serenase, and Sigaperidol.
- Prochlorperazine edisylate has the systematic (IUPAC) name 2-chloro-10-[3-(4-methyl-1-piperazinyl)propyl]-10H-phenothiazine. It is also known under the names Compazine, Stemzine, Buccastem, Stemetil and Phenotil.
- PE is a dopamine (D2) receptor antagonist that is used for the antiemetic treatment of nausea and vertigo and is also a highly potent typical antipsychotic. It is also used to treat migraine headaches.
- Nortriptyline, haloperidol and prochlorperazine edisylate are commercially available and can for example be purchased from Sigma.
- the chemical synthesis of these compounds is well described, e.g. the synthesis of haloperidol has been described in US 3,438,991 , GB 895309 or BE577977 ; the synthesis of prochlorperazine edisylate has been described in US patent 2,902,484 and the synthesis of Nortriptyline has been described in Peters and Hennion, J. Med. Chem., 1964, 7 (3), pp 390-392 .
- mycobacteria alter host cell mechanisms in order to survive and proliferate.
- One of these host cell mechanisms is cellular phagosome maturation, which is blocked in the presence of mycobacteria (Armstrong and Hart, 1971; Pieters, 2008; Russell, 2001).
- novel pharmacological modulators of host cellular processes were identified that trigger killing of intracellular mycobacteria via restoring of the host cell phagosome maturation. Accordingly, these compounds act on (and restore) host cell mechanisms instead of targeting and killing mycobacteria directly, as is shown in the appended examples; see e.g.
- Figure 9 in particular Figures 9b showing the growth curve of mycobacteria in the presence of the compounds as well as Figure 9c showing an alamar blue assay for mycobacterial growth in the presence of compounds at different acidic pH.
- the present invention relates to a compound selected from the group consisting of nortriptyline, haloperidol and prochlorperazine edisylate (PE) for use in treating tuberculosis, wherein the compound is capable of restoring mycobacteria-arrested phagosome maturation.
- PE prochlorperazine edisylate
- the present invention further relates to a pharmaceutical composition
- a pharmaceutical composition comprising the compound of the invention, and optionally a pharmaceutically acceptable carrier.
- the pharmaceutical composition comprises the compound of the invention as the single active agent.
- the term "pharmaceutical composition” relates to a composition for administration to a patient, preferably a human patient.
- the pharmaceutical composition of the invention comprises at least one of the compounds of the invention, i.e. one or more of nortriptyline, haloperidol and prochlorperazine edisylate (PE), i.e.
- nortriptyline, haloperidol or prochlorperazine edisylate PE alone or a combination of either nortriptyline with haloperidol, nortriptyline with prochlorperazine edisylate (PE) or haloperidol with prochlorperazine edisylate (PE) or a combination of all three.
- the pharmaceutical composition of the present invention may, optionally and additionally, comprise a pharmaceutically acceptable carrier.
- pharmaceutically acceptable carrier is meant a non-toxic solid, semisolid or liquid filler, diluent, excipient, encapsulating material or formulation auxiliary of any type.
- suitable pharmaceutical carriers include sodium chloride solutions, phosphate buffered sodium chloride solutions, water, emulsions, such as oil/water emulsions, sterile solutions, organic solvents etc.
- Conventional excipients include binding agents, fillers, lubricants and various types of wetting agents.
- the carrier is a parenteral carrier, more preferably a solution that is isotonic with the blood of the recipient.
- parenteral refers to modes of administration, which include for example intravenous injection. These modes of administration, together with intranasal, oral, buccal, sublingual or intrabronchial administration, are preferred modes of administration in accordance with the present invention. Most preferred modes of administration in accordance with the present invention are oral and intravenous administration.
- the carrier optionally contains minor amounts of additives such as substances that enhance isotonicity and chemical stability.
- Such materials are non-toxic to recipients at the dosages and concentrations employed, and include buffers such as phosphate, citrate, succinate, acetic acid, and other organic acids or their salts; antioxidants such as ascorbic acid; low molecular weight (less than about ten residues) (poly)peptides, e.g., polyarginine or tripeptides; proteins, such as serum albumin, gelatin, or immunoglobulins; hydrophilic polymers such as polyvinylpyrrolidone; amino acids, such as glycine, glutamic acid, aspartic acid, or arginine; monosaccharides, disaccharides, and other carbohydrates including cellulose or its derivatives, glucose, mannose, or dextrins; chelating agents such as EDTA; sugar alcohols such as mannitol or sorbitol; counterions such as sodium; and/or nonionic surfactants such as polysorbates, poloxamers, or PEG.
- buffers such as phosphat
- compositions comprising such carriers can be formulated by well known conventional methods. Generally, the formulations are prepared by contacting the components of the pharmaceutical composition uniformly and intimately with liquid carriers or finely divided solid carriers or both. Then, if necessary, the product is shaped into the desired formulation.
- the pharmaceutical compositions can be administered to the subject at a suitable dose.
- the dosage regimen will be determined by the attending physician and clinical factors. As is well known in the medical arts, dosages for any one patient depend upon many factors, including the patient's size, body surface area, age, the particular compound to be administered, sex, time and route of administration, general health, and other drugs being administered concurrently. The therapeutically effective amount for a given situation will readily be determined by routine experimentation and is within the skills and judgment of the ordinary clinician or physician.
- the pharmaceutical composition may be for administration once or for a regular administration over a prolonged period of time. Generally, the administration of the pharmaceutical composition should be in the range of for example 10 ⁇ g/kg of body weight to 2g/kg of body weight for a single dose.
- a more preferred dosage might be in the range of 100 ⁇ g /kg to 1.5g/kg of body weight, even more preferably 1 mg/kg to 1 g/kg of body weight and even more preferably 5mg/kg to 500mg/kg of body weight for a single dose.
- the typically recommended dose for Haloperidol is between 0.5 to 20 mg/day ( Oosthuizen et al. (2001).
- the components of the pharmaceutical composition to be used for therapeutic administration must be sterile. Sterility is readily accomplished by filtration through sterile filtration membranes (e.g., 0.2 micron membranes), however, the present invention is not confined to this method of obtaining sterility.
- the pharmaceutical composition of the invention is formulated in accordance with national laws and regulatory requirements according to GMP standards.
- the components of the pharmaceutical composition ordinarily will be stored in unit or multi-dose containers, for example, sealed ampoules or vials, as an aqueous solution or as a lyophilized formulation for reconstitution.
- a lyophilized formulation 10-ml vials are filled with 5 ml of sterile-filtered 1% (w/v) aqueous solution, and the resulting mixture is lyophilized.
- the infusion solution is prepared, for example, by reconstituting the lyophilized compound(s) using bacteriostatic water-for-injection.
- Preservatives and other additives may also be present such as, for example, antimicrobials, anti oxidants, chelating agents, and inert gases and the like.
- the pharmaceutical composition may comprise further agents depending on the intended use of the pharmaceutical composition.
- further agents may be selected from agents known in the art to be suitable in the treatment of tuberculosis (as described below) or in the treatment of side effects associated with tuberculosis. Since the pharmaceutical composition of the present invention relies on the above mentioned active compounds, it is preferred that these further agents are only used as a supplement, i.e. at a reduced dose as compared to the recommended dose when used as the only drug, so as to e.g. reduce side effects conferred by the further agents.
- the compound or the pharmaceutical composition have admixed thereto or associated in a separate container one or more agents selected from the group consisting of antibiotic compounds, arginine, vitamin D and IFN- ⁇ .
- Antibiotic compounds are antimicrobial compounds, i.e. compounds capable of killing microbes or inhibiting their growth.
- the antibiotic compounds are antibacterial compounds.
- Non-limiting examples of antibiotics suitable for use in accordance with this preferred embodiment include existing first line anti-tuberculosis drugs such as isoniazid, ethambutol, rifampin, pyrazinamide; second line anti-tuberculosis drugs including aminoglycosides, such as e.g., amikacin (AMK), kanamycin (KM); polypeptides such as e.g., capreomycin, viomycin, enviomycin; fluoroquinolones such as e.g., ciprofloxacin (CIP), levofloxacin, moxifloxacin (MXF); thioamides such as e.g.
- ethionamide, prothionamide cycloserine such as e.g., closerin, terizidone as well as third-line anti- tuberculosis compounds like rifabutin macrolides such as e.g. clarithromycin (CLR); linezolid (LZD); thioacetazone (T); thioridazine; arginine or R207910.
- CLR clarithromycin
- LZD linezolid
- T thioacetazone
- arginine or R207910 Combination of the compound(s) of the present invention with antibiotic compounds is expected to provide the advantage of increasing positive therapeutic effects of different treatment approaches while minimizing the unwanted side effects by lowering the dose or treatment duration of each individual treatment approach.
- Arginine has been shown to be an effective adjuvant in the treatment against tuberculosis, possibly by enhancing NO levels ( Schön et al. (2003) Eur Respir J 2003;21:483-8 ). Later work by the same group suggested that this effect may be restricted to a sub-group of patients who are also HIV positive ( Schon et al. (2011), Tuberculosis (Edinb). Sep;91 (5):370-7 ). Thus, arginine may be of particular interest in a combination therapy for this patient group.
- Vitamin D in accordance with the present invention, refers to the Vitamin produced by sunlight. Tuberculosis patients given high doses of Vitamin D together with anti-tuberculosis drugs showed accelerated resolution of inflammatory responses as well as smear conversion in a randomized clinical trial ( Coussens et al. (2012), PNAS 109(38):15449-54 ).
- Interferon-gamma the only member of the type II class of interferons, is a dimerized soluble cytokine that is critical for innate and adaptive immunity against viral and intracellular bacterial infections and for tumor control.
- the amino acid sequence of IFN- ⁇ can be found in the UniProt database under P01579 or in the NCBI database under NP_000610.2.
- IFN- ⁇ is an established physiological inducer of autophagy (Gutierrez et al., 2004; Matsuzawa et al., 2012) and, as is shown in Example 6, Nortriptyline synergized strongly with IFN- ⁇ , supporting its role in autophagy induction. Additive or even synergistic activities of the pharmaceutical compounds with such antibiotic compounds, arginine, vitamin D and/or IFN- ⁇ may be exploited to yield more potent pharmacological interventions.
- the present invention also relates to a method of treating tuberculosis comprising administering a pharmaceutically effective amount of a compound capable of killing mycobacteria by activating host cellular mechanisms to a subject in need thereof, wherein the compound is selected from the group consisting of nortriptyline, haloperidol and prochlorperazine edisylate (PE).
- a pharmaceutically effective amount of a compound capable of killing mycobacteria by activating host cellular mechanisms to a subject in need thereof, wherein the compound is selected from the group consisting of nortriptyline, haloperidol and prochlorperazine edisylate (PE).
- the method further comprises the administration of one or more agents selected from the group consisting of antibiotic compounds, arginine, vitamin D and IFN- ⁇ .
- the pharmaceutically effective amount of the respective compound may be formulated as a pharmaceutical composition, as defined above.
- the subject is a mammal. More preferably, the subject is a human subject.
- the present invention further relates to a method of identifying a lead compound for the treatment of intracellular bacterial infections, the method comprising the steps of:
- the intracellular bacterial infection is a mycobacterial infection, even more preferably M. tuberculosis.
- the term “lead compound”, which is used herein interchangeably with the term “hit compound”, refers to a compound discovered by the method of the invention as being suitable for the treatment of an intracellular bacterial infection and which can e.g. be further optimized, in particular to be pharmaceutically more acceptable.
- any compound can be assayed as a test compound in this method according to the present invention.
- Compounds include small molecules, such as organic or inorganic molecules.
- Organic molecules relate or belong to the class of chemical compounds having a carbon basis, the carbon atoms linked together by carbon-carbon bonds, including biological entities such as e.g. proteins, sugars, nucleic acids, lipids.
- biological entities such as e.g. proteins, sugars, nucleic acids, lipids.
- Organic compounds can be natural or synthetic.
- Small organic molecules preferably have a molecular weight of about 500 Da or below.
- Inorganic compounds are derived from mineral sources and include all compounds without carbon atoms (except carbon dioxide, carbon monoxide and carbonates).
- compounds to be analysed may be synthesized by methods known in the art, or obtained from fractionating extracts obtained from natural sources, such as e.g. plants.
- the compounds to be tested as potential agents suitable for the treatment of tuberculosis can be dissolved in aqueous or organic, such as e.g., DMSO-based, solutions.
- Test compounds may be comprised in compound libraries of diverse or structurally similar compounds (e.g, combinatorial chemistry synthesized libraries).
- a plurality of test compounds in a library can be assayed simultaneously.
- test compounds derived from different libraries can be pooled for simultaneous evaluation.
- a library can comprise a random collection of molecules.
- a library can comprise a collection of molecules having a bias for a particular sequence, structure, or conformation.
- cells that are infected with bacteria are incubated with said test compound(s).
- Cells infected with bacteria may be obtained in a preceding step by infecting cells with a bacterial strain, such as e.g. a mycobacteria strain using methods well known in the art.
- a bacterial strain such as e.g. a mycobacteria strain using methods well known in the art.
- cells can be infected by incubating them with cell culture medium that contains a defined amount of bacteria. After a specified period of time (such as e.g. 1 hour), the bacteria containing media are removed and cells are washed extensively to remove the remaining bacteria.
- a non-pathogenic M.bovis expressing GFP can for example be employed, as described in the appended examples.
- pathogenic M. tuberculosis may be employed, such as e.g. the clinical strains CS1 or CS2, as also described in the appended examples with regard to the validation experiments.
- mycobacteria suitable for use in the methods of the present invention include, without being limiting M. marinum, M. ulcerans, M. avium, M. africanum, M. fortuitum, M. smegmatis.
- the cells suitable for use in the method of the present invention include all cells typically infected by bacteria, and in particular mycobacteria, such as e.g. macrophages, monocytes or dendritic cells.
- the cells may be primary cells, i.e. cells directly obtained from an organism, as well as stable, immortalized cell lines.
- Incubation with the test compound is performed under cell culture conditions suitable for the respective cell type. Such cell culture conditions are known in the art. Preferably, the cells are incubated with the test compound for at least 6 to 72 hours, such as e.g. 12 to 62 hours, more preferably 24 to 52 hours and most preferably for about 48 hours, as shown in the appended examples. Incubation can e.g. be carried out in high-throughput assays which are capable of screening up to several thousand compounds in parallel. High-throughput assays generally may be performed in wells of microtiter plates, wherein each plate may contain 96, 384 or 1536 wells.
- Handling of the plates, including incubation at temperatures other than ambient temperature, and bringing into contact of test compounds with the assay mixture is preferably affected by one or more computer-controlled robotic systems including pipetting devices.
- mixtures of, for example about or exactly 10, 20, 30, 40, 50 or 100 test compounds may be added to each well.
- said mixture of test compounds may be de-convoluted to identify the one or more test compounds in said mixture giving rise to said activity.
- the cells may be fixed by methods well established in the art, using e.g. fixatives commonly used in histo-chemical or fluorescence studies such as for example paraformaldehyde, such as 3.7% PFA.
- fixatives commonly used in histo-chemical or fluorescence studies such as for example paraformaldehyde, such as 3.7% PFA.
- the cells are stained with a suitable detectable marker probe or a detectable marker probe is introduced into the cell(s) in order to enhance the visibility of cellular and/or bacterial features.
- Detectable marker probes for staining or which can be introduced into the cell(s) are not particularly limited. They include, without being limiting, markers selected from the group consisting of fluorescent compounds, bioluminescent compounds, chemiluminescent compounds, radioisotopes, markers which can be detected by colorimetric methods, metal chelates and enzymes or compounds, such as proteins, labelled therewith.
- the detectable marker probe introduced into the cell(s) is a compound labelled with a fluorescent dye.
- a fluorescent dye in accordance with the present invention includes compounds which emit light of a particular wavelength when exposed to electromagnetic radiation of a shorter wavelength.
- fluorescent dyes are fluorescein, naphtofluorescein, the various known versions of GFPs, Rhodamin, Texas Red, Pacific Blue, Oregon Green, Alexa Fluor Dyes, Cy3 or Cy5.
- the cells are stained with a fluorescent dye.
- cells may be stained with 4',6-diamidino-2-phenylindole (DAPI), a fluorescent stain that binds strongly to A-T rich regions in DNA, for staining the nucleus and Cell Mask Blue (Invitrogen), which labels the cytoplasm of the cell.
- DAPI 4',6-diamidino-2-phenylindole
- Invitrogen Cell Mask Blue
- a detectable marker probe may be introduced into the cell via a transport protein, such as e.g. transferrin (Tfn), as described e.g. in Example 4 below.
- a transport protein such as e.g. transferrin (Tfn)
- antibodies for a specific target within the cell can be introduced, wherein said antibodies are detectably labelled, for example with a fluorescent dye.
- bi-specific antibodies wherein one antibody specificity is directed to a cellular compartment/target while the second antibody specificity is directed to a detectable protein or dye.
- a detectable marker probe may be introduced into the cell in form of an expressible nucleic acid molecule using any of the methods known in the art for introducing nucleic acid molecules into cells. Such methods include for example calcium phosphate-DNA coprecipitation, DEAE-dextran-mediated transfection, polybrene-mediated transfection, electroporation, microinjection, liposome fusion, lipofection, protoplast fusion, retroviral infection, and biolistics.
- said nucleic acid molecule(s) encoding the detectable marker probe is contained in a vector expressible in the cell. Suitable expression vectors are well known in the art.
- step (c) a multi-parametric phenotypic profile of host cell parameters and bacterial parameters is obtained.
- Multi-parametric phenotypic profiles are well known in the art and have been described in e.g. Collinet et al, Nature 2010 . Such profiles reflect the phenotype of e.g. a cell or population of cells based on a number of parameters, such as the parameters detailed herein below.
- This step includes acquiring images of the cells, for example using the automated spinning disk confocal Opera (Perkin Elmer) and analysing said images. Preferably, image analysis is carried out automatically.
- step (d) the multi-parametric phenotypic profile is clustered by using a new density-estimate-based clustering algorithm.
- a new density-based method for robust clustering of multi-dimensional phenotypes is employed herein.
- the density-based clustering algorithm of the present invention is similar to mean-shift, wherein the move along the steepest gradient over a continuous density estimate function is replaced by a discrete gradient ascent over a sequence of Gabriel graph neighbouring data points ( Gabriel, K. R.; Sokal, R.
- the clustering algorithm of the present invention begins in step (i) with computing a set of multi-parametric phenotype profiles into nodes of Gabriel graph where edges connect neighbouring nodes.
- step (ii) Subsequently spurious as well as 'long-range' edges are filtered out from the graph in step (ii). Then the density estimate for each node is computed in step (iii) using a kernel function that is chosen according to the selected distance measure (as detailed below). Then the modified Gabriel graph is converted in step (iv) into weighted directed acyclic graph (WDAG) by directing the edges between neighbour nodes such that they point towards the node with higher density estimate. In the ambiguous case of equal density estimate of two neighbour nodes, one node is randomly chosen and a small arbitrary value (0.0000001) is added to its density estimate. Edge weights are set proportional to the distance between neighbouring nodes.
- WDAG weighted directed acyclic graph
- the sinks of the graph are marked as modes (local maxima) of density in step (v). Those data points become cluster centres, and the remaining data points are assigned in step (vi) to the cluster centres based on the shortest weighted path in the directed neighbourhood graph.
- kernel density estimate simply is equal to the number of data points that fall into the hyper-sphere of radius h around the point x, normalized by the volume of this sphere.
- the bandwidth parameter h determines the degree of density smoothing.
- kernel function is primarily guided by the measure of distance between data points. In the case of Euclidian distance, a commonly chosen kernel is a multivariate Gaussian function in which the covariance matrix parameterizes the bandwidth.
- von Mises-Fisher probability function may be used as a kernel p vMF x ⁇
- the distribution has one concentration parameter K (kappa) that is analogous to inverse of variance in Gaussian.
- K defines the concentration (inverse bandwidth) of von Mises-Fisher kernel.
- the normalization constant is dependent on modified Bessel function of the first kind I of the order d 2 - 1 , where d is the number of dimensions.
- Gabriel graph is defined such that two points are connected by edges if and only if centre of the edge is closer to these points than to any other point in the set.
- the Gabriel neighbours x i and x j that connected by edge which central point distance to the third point of set ( x K ) is smaller than 1 2 ⁇ 1 + ⁇ ⁇ D x i ⁇ x j are filtered out as a spurious edges.
- the parameter ⁇ was set to 0.05 for all clustering shown in the appended examples.
- the density modes of two clusters could occur almost on the edge of clusters and in multidimensional space they may happen to be Gabriel neighbours of each other through 'long-range' connections. In this case the present algorithm cannot separate them. To rescue that situation, for every data point the set of its Gabriel neighbours were additionally filtered by taking intersection with sets of its nearest neighbours of an equal size. This procedure removes 'long-range' links that spans across empty regions of the feature space while keeping most of the links within the clusters. Further details of the algorithm in accordance with the present invention are provided in Example 8 below.
- (an) alteration(s) in bacterial parameters and a lack or substantial lack of alteration(s) of host cell parameters in the presence of the test compound indicate that the compound is suitable as a lead compound for the treatment of tuberculosis. Alterations can for example be observed by comparing the host cell and bacterial parameters in the presence of the test compound with the corresponding host cell and bacterial parameters in the absence of the test compound.
- the key feature of this intracellular mycobacterial survival assay is the multiplicity and reliability of parameters capturing various features of bacteria and host at high resolution.
- most compounds in the selected hit cluster (M5) were not directly detrimental to mycobacteria.
- M5 cluster showed very little overlap with the compounds which act directly on bacteria.
- the three selected compounds do not kill mycobacteria outside the host cell under the different conditions tested.
- they show similar effects on uninfected cells.
- Nortriptyline and PE can be reverted by inhibiting a host cellular process (autophagy).
- Fifth, Nortriptyline showed strong phenotypic correlation with a structural analogue, Amitriptyline, in mycobacteria as well as in the endocytosis and autophagy screens ( Figure 9F-I ).
- Sixth, Nortriptyline and PE enhance the acidity of lysosomes. This correlates with delivery of mycobacteria to lysosomes and their survival. Additionally, standard anti-mycobacterial drugs showed weaker phenotypes compared to the selected compounds.
- the cells are infected with mycobacteria that express a fluorescent protein marker.
- the fluorescent protein marker is green fluorescent protein (GFP).
- GFP green fluorescent protein
- the bacterial parameters are selected from parameters related to the number of bacteria, parameters related to signal intensity of the bacteria and/or parameters related to the shape of the bacteria.
- Parameters related to the number of bacteria include, without being limiting:
- number of bacteria within the infected cell refers to the total number of bacteria that are present within one infected cell, and averaged over all the infected cells for a given condition.
- mean, median and/or mode refer to standard measures of central tendencies of a dataset, i.e. "average” values that are well known in the art.
- mean refers to the arithmetic mean of a dataset
- median refers to the value that divides the dataset into upper and lower halves
- mode is the most frequently occurring value in the dataset.
- mean, median and mode coincide. However, this is not always the case. Parameter distributions are often skewed and have heavy tails.
- mode of the distribution provides information about the parameter value of the most abundant objects while mean and median reflect on different features of distribution. Accordingly, including all of mean, median and mode, rather than only mean, provides a better descriptive power for the entire distribution of the parameter. This allows describing more aspects, such as the possible presence of a second population of infected cells, or asymmetry in the distribution, long tails, etc.
- total number of bacteria per image is an absolute value that reflects the number of all bacteria identified in the image that is analysed, irrespective of the amount of host cells present. Only intracellular bacteria, i.e. bacteria found inside of host cells, are taken into consideration.
- number of bacteria per cell refers to the number of all bacteria in relation to the total number of host cells (infected and uninfected) present.
- the measure "(i) number of bacteria within the infected cell” is an averaged measure of the number of bacteria in a single infected cells
- the measure "(iii) number of bacteria per cell” is a measure of the overall number of bacteria in relation to the overall number of all host cells present, both infected and uninfected.
- total number of bacteria in infected cells refers to an absolute value representing the number of all bacteria found in infected cells, i.e. without correlating said number to the number of host cells present (as done in (iii)) or the number of host cells infected (as done in (i)).
- number of infected cells refers to an absolute value representing the number of all infected cells within the image taken. Where several images are taken and analysed, the data obtained are combined.
- Parameters related to signal intensity of the bacteria include, without being limiting:
- Integral intensity is defined as the integral (the sum pixel by pixel) of the intensity calculated on the fitted object, such as for example an individual bacterium.
- integrated vesicle intensity of bacteria within infected cell refers to the integral intensity of bacteria within all infected cells, i.e. it is the sum of all individual integral intensities.
- mean intensity refers to the average intensity within each identified object (i.e., bacteria) while the term “mean integral intensity” refers to the mean value of integral (i.e sum) intensity within the same identified object (i.e individual bacteria).
- the integral vesicle intensity of bacteria within infected cell is the total (i.e., sum) of all bacterial integral intensities, normalized by the area covered by cells.
- weighted (intensity) or “weighted (integral intensity)” refer to the fact that the respective parameter has been corrected for the factor recited in brackets, i.e. the term “mean integral intensity (weighted (integral intensity))” refers to the parameter “mean integral intensity”, wherein the measured mean integral intensity has been adjusted by the integral intensity .
- Weighting can reveal important biological features: measuring the mean parameter value gives information about whole population behaviour, including both bright (presumably intact) and dim (presumably partially degraded) bacteria at the same time; parameter weighted by intensity give information mostly about brighter (and presumably) bacteria. This approach extracts more comprehensive description of the phenotype from the same biological assay.
- Parameters related to the shape of the bacteria include, without being limiting, the mean area, either non-weighted median, or weighted (intensity) and/or weighted (integral intensity).
- mean area refers to the area in square micrometres enclosed by the contour of the segmented object.
- the host cell parameters are selected from parameters related to the morphology of the cell and/or parameters indicative of toxicity.
- Parameters related to the morphology of the host cell include, without being limiting:
- area in this regard, relates to the average area of the host cells in square micrometers.
- the term “compactness” relates to a measure of region non-smoothness, defined as the ration between the actual area and the area a circle with the same perimeter would have. Compactness is measured on the contour of the segmented host cell.
- segmented is a standard term used in the art. It refers to an image divided on segments, which correspond either to objects of interest or to the background.
- distalsion relates to a measure of region irregularity, defined as the ratio of the major chord length (maximum circle enclosing the region) to the area and is measured on the contour of the segmented host cell.
- the axes can be directly calculated through the eigenvector decomposition of the region contour.
- the corresponding eigenvalues are equal to the length of the ellipse axes.
- eigenvalues and eigenvectors are well known to the skilled person and are standard mathematical terms introduced in the early 19th century. Both eigenvalues and eigenvectors are widely used in linear algebra and geometry, and also find application in image analysis.
- solidity is a measure of segmented region tightness, defined as the ratio between the region area and the area of the convex hull of the same region. Solidity is measured on the contour of the segmented region which corresponds to the host cell.
- extent is a measure of region extension defined as the ratio between the area of the minimal rectangle (bounding box) that encloses the region and the actual region area. Extent is measured on the contour of the segmented host cells.
- Parameters indicative of toxicity include, without being limiting:
- Nucleus size relates to the average nuclei size in the image. Measurement of the size of nuclei is indicative of toxicity, since nuclear condensation is an initial signature of apoptotic cell death and a general sign of loss of cellular fitness (Galluzzi et al., 2009).
- number of nuclei relates to the number of nuclei per image.
- Number of cells relates to the number of cells per image. As all other parameters, this value is then averaged across all the images of the same experimental condition.
- nuclei contrast is used as a quality control parameter, as it estimates the correctness of focal position in the given image by measuring the difference in contrast between nuclear signal DAPI and nearby cytoplasmic pixels.
- At least six bacterial parameters and at least one host cell parameter are analysed.
- the term “at least six bacterial parameters” encompasses also at least 7, at least 8, at least 9, at least 10, at least 11, at least 12, at least 13, at least 14 parameters, such as at least 15, at least 16, at least 17, at least 18 parameters as well as all 19 bacterial parameters.
- the bacterial parameters comprise at least
- the method further comprises optimizing the pharmacological properties of the test compound identified as lead compound, thereby enabling the development of further modified and potentially improved compounds.
- the identified lead compounds may for example be optimized by modifying the compound to achieve: i) modified spectrum of activity, organ specificity, and/or ii) improved potency, and/or iii) decreased toxicity (improved therapeutic index), and/or iv) decreased side effects, and/or v) modified onset of therapeutic action, duration of effect, and/or vi) modified pharmacokinetic parameters (resorption, distribution, metabolism and excretion), and/or vii) modified physico-chemical parameters (solubility, hygroscopicity, colour, taste, odour, stability, state), and/or viii) improved general specificity, organ/tissue specificity, and/or ix) optimised application form and route by (a) esterification of carboxyl groups, or (b) esterification of hydroxyl groups with carboxylic acids, or (c) esterification of hydroxyl groups to, e.g.
- phosphates, pyrophosphates or sulfates or hemi-succinates or (d) formation of pharmaceutically acceptable salts, or (e) formation of pharmaceutically acceptable complexes, or (f) synthesis of pharmacologically active polymers, or (g) introduction of hydrophilic moieties, or (h) introduction/exchange of substituents on aromates or side chains, change of substituent pattern, or (i) modification by introduction of isosteric or bioisosteric moieties, or (j) synthesis of homologous compounds, or (k) introduction of branched side chains, or (I) conversion of alkyl substituents to cyclic analogues, or (m) derivatisation of hydroxyl groups to ketales, acetales, or (n) N-acetylation to amides, phenylcarbamates, or (o) synthesis of Mannich bases, imines, or (p) transformation of ketones or aldehydes to Schiff's bases, oxi
- the present invention further relates to a method of identifying the cellular pathway targeted by a test compound, the method comprising
- the cellular pathway that is targeted by a test compound is identified. Accordingly, it is investigated which intracellular pathway(s) is/are affected in the presence of the test compound.
- the test compound may be any test compound, such as the test compounds defined herein above.
- the test compound may be a compound identified by a method of the present invention of identifying a lead compound for the treatment of tuberculosis.
- a cell is treated with the test compound and a multi-parametric phenotypic profile of the cell after said treatment is obtained.
- the cell is simply contacted with the compound, which then either exerts its effects via binding and/or activation of surface molecules, such as e.g. receptors, or is internalised into the cell, for example by active transport through the cell membrane or endocytosis.
- the compound may also be introduced directly into the cell, such as e.g. by micro-injection.
- the cell in accordance with this method, may be any cell typically employed in research, such as e.g. prokaryotic or eukaryotic cells, including the cells defined herein above with regard to the method of obtaining a multi-parametric phenotypic profile of a cell infected with mycobacteria.
- suitable prokaryotic cells comprise e.g. bacteria of the species Escherichia, Bacillus, Streptomyces and Salmonella typhimurium and Mycobacteria sp.
- Suitable eukaryotic cells are e.g.
- yeasts such as Saccharomyces cerevisiae or Pichia pastoris or insect cells such as Drosophila S2 and Spodoptera Sf9 cells and plant cells as well as mammalian cells.
- Appropriate culture media and conditions for the above-described cells are known in the art.
- Mammalian cells that could be used include, human HeLa, HEK293, H9 and Jurkat cells, mouse NIH3T3 and C127 cells, Cos 1, Cos 7 and CV1, quail QC1-3 cells, mouse L cells and Chinese hamster ovary (CHO) cells.
- primary cells or primary cell lines are cells which are directly obtained from an organism.
- Suitable primary cells are, for example, human primary monocytes, human primary monocyte derived macrophages, mouse bone marrow macrophages, mouse peritoneal macrophages, mouse embryonic fibroblasts (MEF), mouse primary hepatocytes, cardiomyocytes and neuronal cells as well as mouse muscle stem cells (satellite cells) and stable, immortalized cell lines derived thereof.
- the cells are human HeLa cells.
- the multi-parametric phenotypic profile may be a profile of the entire cell or of specific cellular compartments or pathways. Multi-parametric phenotypic profiles and methods of obtaining same are well known in the art, as described herein above.
- One exemplary method of obtaining a multi-parametric phenotypic profile of a cell is described in detail herein above for the phenotypic profile of a cell infected with mycobacteria. Accordingly, all of the definitions and preferred embodiments recited herein above with regard to said method of obtaining a multi-parametric phenotypic profile of a cell apply mutatis mutandis also to this method of the invention.
- An alternative method of obtaining a multi-parametric phenotypic profile of a cell is shown in Example 4 below, where the effect of the tested compounds on endocytosis was analysed.
- the cells of interest such as e.g.
- HeLa cells are pre-treated with the test compounds prior to the internalization of fluorescently-labelled marker suitable to show the effect of the test compound on the cellular function to be analysed.
- fluorescently-labelled marker suitable to show the effect of the test compound on the cellular function to be analysed.
- the fluorescently-labelled markers were epidermal growth factor (EGF) and Transferrin (Tfn), which are known to be internalised in these cells by endocytosis.
- the multi-parametric profile may encompass any cellular parameters of interest, such as e.g. the host cellular parameters recited herein above.
- pathway-specific parameters can be analysed, such as e.g. the parameters shown in Table 3 below for endocytosis and autophagy pathways.
- the multi-parametric phenotypic profile of the cell after treatment with a test compound is then compared to a phenotypic profile obtained for the same cell type by introducing directed genetic perturbations to target genes of said cell.
- RNAi interfering nucleic acid molecule
- RNAi interfering nucleic acid molecule
- a phenotypic profile obtained by genetic perturbations of target genes can be established by the skilled person without further ado, for example as described in Collinet et al. 2010. Moreover, previously established data or published results of such phenotypic profiles obtained by genetic perturbations of target genes can be relied on.
- standard cell type refers to a cell being of the same origin as the cell of step (a) and that is - prior to treatment with any compounds, i.e. under normal culture conditions - identical in its phenotypic characteristics to the cell of (a). Furthermore, this term also encompasses cell populations, such as for example homogenous cell populations consisting of cells having identical characteristics, and, thus, is not restricted to single cell analyses.
- substantially identical relates to phenotypes that are not identical (i.e. do not correspond to each other to 100%) but do not differ significantly from each other.
- any known statistical approach may be employed. For example, the p-value of the null-hypothesis that the two profiles are the result of the same perturbation can be calculated. Means and methods for calculating the p-value are well known in the art. For example, if the number of parameters is higher than 10 and the measured correlation is below 0.9, then the chi-square approximation can be used for p-value calculation. In those cases where the number of parameters is less than 10 and/or for very high correlation (i.e.
- the calculation for the p-value can be done as for example described in the classical works of Fisher (see e.g. R. Fisher, "On the probable error of correlation coefficient deduced from a small sample set," Metron, v.1, pp.3-32 (1921 ) and ( R. Fisher, "Frequency Distribution of the Values of the Correlation Coefficient in Samples from an Indefinitely Large Population,” Biometrika, v.10(4), pp.507-521 (1915 )).
- Means and methods of comparing the phenotypic profiles in step (c) include, without being limiting, automated comparison e.g. using a computer program.
- profiles can be treated as vectors in multi-dimensional space and measure of similarity could be a cosine of angle between them. This cosine is equivalent to non-centred correlation of profiles.
- Another possible measure of phenotype similarity could be as described in Mahalanobis Distance ( Mahalanobis, P. C. "On the generalised distance in statistics". Proceedings of the National Institute of Sciences of India 2 (1): 49-55 (1936), http://en.wikipedia.org/wiki/Mahalanobis_distance ). The procedures for such computation are included in MatLab, R, and other standard mathematical and statistical packages.
- an integrated experimental and computational pipeline was developed to compare the multi-parametric profiles from the screen of the pharmacologically active compounds with the profiles from a previously established genome-wide siRNA screen for endocytosis (Collinet et al., 2010) to identify the cellular mechanisms underlying the anti-bacterial activities of the compounds identified herein.
- the predictions derived from said comparison on the three selected compounds could be verified and it was established that two of them modulate autophagy by distinct mechanisms and the third one accelerates endocytic trafficking.
- phenotypes were captured through QMPIA and, by integrating chemical and functional genomics datasets (Collinet et al., 2010), hit compounds of the mycobacteria screen described above were differentiated into distinct groups on the basis of their phenotypes on endocytosis.
- hit compounds of the mycobacteria screen described above were differentiated into distinct groups on the basis of their phenotypes on endocytosis.
- this strategy it was shown both computationally and experimentally that one of the groups is significantly enriched for modulators of autophagy, a well known anti-mycobacterial cell defence mechanism (Gutierrez et al., 2004; Kumar et al., 2010).
- autophagy phenotypes were thus identified using a general endocytosis assay.
- Nortriptyline and PE influence autophagy differently. Whereas Nortriptyline induces the formation of autophagosomes, PE slows down autophagic flux. The basal rate of autophagy may be sufficient to accumulate autophagosomes in the presence of PE. These autophagosomes progressively acidify over time and become competent for Mycobacteria degradation (Ponpuak et al., 2010). PE may act at different stages, e.g. on the fusion with lysosomes.
- Haloperidol as anti-mycobacterial compound provides proof of principle for the pharmacological modulation of endocytic trafficking as a means of boosting the host defence system to clear intracellular pathogens. Most importantly, these data imply that such an approach is feasible without inducing overt toxicity to cells. Haloperidol leads to faster degradation of cargo by accelerating transport from early to late endocytic compartments. Previous work has identified both general design principles and molecular details of the machinery underlying endosome biogenesis and progression that are relevant to the pharmacological properties of Haloperidol.
- LDL degradative route
- transport of cargo along the degradative route entails a conversion from Rab5- to Rab7-positive endosomes (Rink et al., 2005). Such conversion is based on a cut-out switch (Del Conte-Zerial et al., 2008) that requires the endosomal levels of Rab5 to pass a threshold value prior to triggering a feedback loop causing its removal and substitution with Rab7.
- the inventors' recent systems survey on endocytosis has revealed that the centripetal movement of endosomes previously observed by quantitative live cell imaging (Rink et al., 2005) is a master parameter that regulates several other properties of the early endosome network, including cargo progression (Collinet et al., 2010).
- Mycobacterium interferes with such a switch, keeping the phagosome in an arrested state.
- Haloperidol exerts a positive influence on both centripetal movement of endosomes and membrane recruitment of the Rab5 machinery.
- Haloperidol counteracts the fine balance between phagosome activity and maturation arrest, restoring its maturation.
- relatively subtle alterations in the general endocytic trafficking machinery are sufficient to cause dramatic effects on intracellular mycobacterial survival.
- step (a) further comprises introducing into the cell a detectable marker probe.
- Detectable marker probes which can be used in the context of the invention are not particularly limited, and have been defined herein above.
- the detectable marker probe is a compound labelled with a fluorescent dye, as defined herein above.
- the detectable marker probe may be selected from e.g. fluorescently labelled epidermal growth factor (EGF), transferrin or Low density lipoprotein (LDL).
- the directed genetic perturbations to target genes of the cell are introduced by use of RNAi. Even more preferred is that the directed genetic perturbations to target genes of the cell are introduced by use of siRNA.
- the RNAi-mediated genetic perturbation is a genome-wide endocytosis RNAi screen. More preferably, the RNAi-mediated genetic perturbation is a genome-wide RNAi screen, wherein RNAi directed to each gene is introduced individually.
- the method is carried out as a high-content assay.
- High-content assays generally may be performed in wells of microtiter plates, wherein each plate may contain, for example 96, 384 or 1536 wells. Handling of the plates, including incubation at temperatures other than ambient temperature, and bringing into contact of test compounds with the assay mixture is preferably affected by one or more computer-controlled robotic systems including pipetting devices. Where large libraries of test compounds are to be screened and/or screening is to be effected within short time, mixtures of, for example about or exactly 10, 20, 30, 40, 50 or 100 test compounds may be added to each well. In case a well exhibits biological activity, said mixture of test compounds may be de-convoluted to identify the one or more test compounds in said mixture giving rise to the observed biological activity.
- each embodiment mentioned in a dependent claim is combined with each embodiment of each claim (independent or dependent) said dependent claim depends from.
- a dependent claim 2 reciting 3 alternatives D, E and F and a claim 3 depending from claims 1 and 2 and reciting 3 alternatives G, H and I
- the specification unambiguously discloses embodiments corresponding to combinations A, D, G; A, D, H; A, D, I; A, E, G; A, E, H; A, E, I; A, F, G; A, F, H; A, F, I; B, D, G; B, D, H; B, D, I; B, E, G; B, E, H; B, E, I; B, F, G; B, F, H; B, F, I; C, D, G; C, D, H; C, D, I; C,
- Buffy coats were purchased from German Red Cross. Human primary monocytes were isolated from pooled buffy coats (3-4 donors per pool), seeded directly on assay plates (384 well, Greiner microclear) at a cell density of 15,000 per well and allowed to differentiate to macrophages by addition of 50 ng/ml hMCSF (peprotech). Media was exchanged after 3 days. Infection was done after 6 days. Imaging: Plates were sealed with aluminium tape and imaged using automated spinning disc confocal Opera (Evotec) with a 40x, 0.9 NA water objective. 30 images from each well (randomized intra well positions) were acquired in two channels with excitation filter at 405nm for host cell detection (DAPI/CMB) and 488nm to detect M.
- DAPI/CMB host cell detection
- nuclei regions are used as seeds and expanded till a predefined masked area, representing the area covered by cells.
- the masked area is identified based on automatic maximum entropy-based thresholding.
- the boundaries of neighbouring cells touching each other are placed in the area of intensity minima between the two cells, according to the watershed principle.
- the watershed algorithm is preceded by maxima imposition, so that no new local maxima are considered outside the nuclear region. Segmentation of cells thus allowed for reliable and accurate quantitation of intracellular bacteria in addition to assessment of changes to host cells upon perturbation.
- maxima imposition so that no new local maxima are considered outside the nuclear region.
- the image processing pipeline allowed to segment objects (bacteria and cells) from the images. Following this, quantitative multi-parametric image analysis algorithms calculated different statistical parameters describing multiple features for the two categories of objects (see complete list in Table 1). Parameters corresponding to bacteria were split into three groups, number-related, intensity-related and shape-related, giving information about different facets of intracellular bacteria. Number-related parameters report the numbers of bacteria within infected cells, number of bacteria within all cells, total number of bacteria in infected cells as well as the total number of infected cells. Intensity-related parameters compute the average as well as integral intensity of bacteria within infected cells. Integral intensity is defined as the integral (the sum pixel by pixel) of the intensity calculated on the fitted object, mean integral intensity is the mean value integral intensity of individual bacteria and total integral intensity is the sum of all bacterial integral intensities, normalized by the area covered by cells.
- parameters can be non-weighted, weighted by mean intensity or weighted by integral intensity. Weighting can reveal important biological features: measuring the mean parameter value gives us information about whole population behaviour, including both bright (presumably intact) and dim (presumably partially degraded) bacteria at the same time, parameter weighted by intensity gives us information mostly about brighter (and presumably) bacteria. This approach extracts more comprehensive description of the phenotype from the same biological assay.
- Standard anti-mycobacterial drugs did not fall into the hit cluster but were rather spread in different clusters. Additionally their phenotypes were weaker compared to the selected hit compounds. In order to understand this better, their activity was further characterized by improving the resolution of the assay, i.e. a detailed time course analysis of mycobacterial trafficking as well as survival was performed.
- the results show that the standard anti-mycobacterial drug Rifampin exhibited a phenotype with time. This phenotype corresponds to:
- the phenotype is weaker than that of the hit compounds for most time points.
- One possible reason could be that the read out is dependent on the GFP fluorescence from mycobacteria, which could be reduced at different rates, depending on whether the lysosomal degradation machinery is accelerated or not by host acting mechanisms.
- the hit compounds lead to a strong increase in the intensity of lysosomes, whereas Rifampin, that kills mycobacteria directly, does not show this effect ( Figure 8F ). This could lead to different rates of degradation of GFP from mycobacteria thus resulting in the different phenotypes seen.
- Multi-parametric profiles from the chemical screen were clustered using an algorithm based on modified Gabriel neighbourhood and density estimate using von Mises-Fisher kernel.
- This clustering algorithm has one free parameter, namely kernel bandwidth, which is inversion of von Mises-Fisher concentration parameter ⁇ .
- kernel bandwidth which is inversion of von Mises-Fisher concentration parameter ⁇ .
- ⁇ concentration parameter
- HeLa cells were treated with the compounds at a final concentration of 10 ⁇ M, incubated for 4 hr, fixed with 3.7% PFA and immunostained with anti-LC3 antibody (clone PM036, MBL labs). Cells were counterstained by DAPI and Cell Mask Blue, imaged and analyzed as described above.
- human primary monocyte-derived macrophages were infected with M. bovis BCG-GFP and treated with different doses of Nortryptyline (D) and Prochlorperazine edisylate (E) for 48 hrs and fixed.
- D Nortryptyline
- E Prochlorperazine edisylate
- autophagy assays the same preparation of cells was treated with the two compounds for 2 hrs, fixed and immunostained for LC3. Cells were imaged and analyzed as described.
- A431 cells stably expressing GFP-Rab5 were treated with 10 ⁇ M Haloperidol for 2 hr and imaged live using Zeiss Duo scan microscope at 0.098 sec /frame for 2 min. Individual endosomes were identified and tracked over time as described (Rink et al, 2005). To calculate mean square displacement, all endosomal tracks were first iteratively divided into non-overlapping equal time intervals from 0.1 to 70 sec and their displacements were computed for each interval. Next, the squares of displacement for all endosomal tracks for a given condition were averaged and plotted as a function of the time interval. In such a curve, early endosomes show a characteristic bi-phasic behavior, which is referred to as a short-time scale and long-time scale movements.
- Nortriptyline had a structurally related compound in the hit cluster, namely Amitriptyline (Tanimoto distance of 0.96).
- Nortriptyline and Amitriptyline showed highly correlated profiles in mycobacteria high content screen, as well as in endocytosis and autophagy screens ( Figure 9F to I ).
- structural analogs show similar host correlates, further confirming that the effect of these compounds on intracellular mycobacterial survival is by modulating the host.
- Example 2 High content chemical screen to identify intracellular modulators of mycobacteria
- FIG. 1A An integrated experimental and computational strategy was developed for screening, selecting and validating compounds endowed with anti-mycobacterial activity by acting on the host machinery.
- a high content assay was established in a human primary macrophage infection model. Briefly, cells were infected with M. bovis BCG expressing GFP (Dhandayuthapani et al., 1995), and incubated with chemicals for 48 hrs. Since the primary interest was to identify chemical modulators disrupting the host-mycobacteria equilibrium, chemical perturbations were introduced after the infection was established. Cells were then fixed, nuclei and cytoplasm stained, and imaged using an automated spinning disc confocal microscope.
- a QMPIA platform previously used was developed further to automatically identify cells, endosomes and nuclei (Collinet et al., 2010; Rink et al., 2005) by implementing automated algorithms to detect various features of intracellular bacteria and host cell simultaneously ( Figure 1B , Tables 1, 2).
- a bioactive library (Microsource Discovery Inc., Spectrum collection, 2000 compounds) comprising most FDA approved drugs was screened. The compounds produced reproducible alterations of various parameters such as bacterial number, intensity as well as bacterial and host cell morphology ( Figure 8A ).
- Cluster analysis was performed using the algorithm described above (see Example 8 for details). The compounds grouped into six distinct clusters, each with a distinct pattern, i.e. phenotypic profile ( Figure1C,D ). The strength of the phenotype of a compound is given by its Pattern-specific score (PSS) (not shown). Due to the multi-parametric nature of our screening output, each cluster was expected to capture distinct phenotypic features of mycobacteria and the host. Cluster M5 (containing 115 compounds shown in Table 4) was of particular interest as it was characterized by a strong reduction of bacterial parameters but relatively weak changes in host parameters reflecting toxicity, suggesting that the compounds in this cluster are detrimental to bacteria but not significantly toxic to the host.
- PSS Pattern-specific score
- CFU colony forming unit
- Example 4 Integration of multi-parametric chemical and genetic data-sets to identify cellular processes modulated by the compounds
- Multi-parametric profiles are specific signatures of either chemical or genetic perturbations because they capture multiple facets of a biological system. Since random matches between such profiles are unlikely, clues into the molecular processes targeted by the chemicals can be obtained in principle by systematically searching for genetic alterations that produce similar phenotypes.
- the two screens are not directly comparable due to their distinct characteristics, i.e.
- Nortriptyline and PE belong to sub-cluster E1 whereas Haloperidol belongs to E2. Consistent with the data of Figure 3C , Nortriptyline and PE, similar to Rapamycin or serum starvation (by HBSS), showed a strong effect on autophagy, whereas Haloperidol did not ( Figure 10B,C ). Human primary macrophages treated with Nortriptyline and PE resembled HeLa cells in showing an increase in both number and integral intensity of LC3 vesicles ( Figure 10D,E ), indicating that their effect of increasing autophagosomes is not cell type-restricted.
- Autophagy is a multi-step process consisting of autophagosome formation, maturation and eventual degradation by fusion with lysosomes (autophagolysosomes).
- the increase in autophagosomes mediated by Nortriptyline and PE could be either due to a higher rate of formation or a block in maturation and degradation (autophagic flux) (Klionsky et al., 2008).
- two different approaches were used. First, it was tested whether blockers of lysosomal degradation, e.g. inhibitors of acidification (BafilomycinAlor Chloroquine) that inhibit autophagic flux could have an additive effect with the compounds on autophagosome accumulation (Klionsky et al., 2008).
- HeLa cells were treated with Nortriptyline and PE in the presence or absence of BafilomycinA1, and LC3 lipidation (LC3-II band) was assessed by immunoblotting. Whereas both Nortriptyline and PE showed significant increase in the LC3-II band, additive effects of BafilomycinA1 were seen only upon Nortriptyline, but not PE treatment ( Figure 12A ).
- HeLa cells stably expressing LC3 fused to GFP (HeLa BAC LC3-GFP) under the control of the endogenous promoter were generated through BAC recombineering (Poser et al., 2008).
- the results ( Figure 12B,C ) confirmed that Nortriptyline, but not PE, had an additive effect with BafilomycinA1 and Chloroquine in increasing LC3-GFP vesicles.
- an established assay was used for measuring autophagic flux based on a tandem mRFP-GFP-LC3 construct (Kimura et al., 2007). Since GFP is quenched in the acidic environment of autophagolysosomes whereas mRFP remains stable, agents blocking autophagy flux display higher colocalization of mRFP and GFP compared to those inducing autophagy. HeLa cells stably expressing mRFP-GFP-LC3 (Settieri et al., 2011) were treated with the compounds and the co-localization between mRFP and GFP was quantified.
- Nortriptyline similar to starvation-induced autophagy (HBSS), showed a low mRFP to GFP co-localisation, whereas PE, similar to BafilomycinA1 and Chloroquine, yielded higher co-localisation ( Figure 5A , B ). Similar results were obtained for the co-localisation of LC3-GFP with LBPA in HeLa-LC3-GFP cells ( Figure 12D ). Based on previous studies (Klionsky et al., 2008), these results can be interpreted as indicating that Nortriptyline induces autophagy whereas PE inhibits autophagic flux.
- blockers of autophagy flux should not have a detrimental effect on mycobacteria. Indeed, inhibitors of autophagy flux that abrogate the function of lysosomes by blocking acidification did not affect the intensity of intracellular M. bovis BCG-GFP signal ( Figure 12E ). In order to determine whether PE has a similar effect on lysosomal pH, the intensity of the acidotropic dye Lysotracker red was quantified over time. Unlike classical blockers of autophagy flux, PE did not have a negative effect on the acidity of lysosomes, but quite the contrary, it significantly increased the acidity ( Figure 5C ). Moreover, this effect correlated with the presence of mycobacteria within the lysotracker red-positive vesicles ( Figure 5C ) and a concomitant reduction in bacterial intensity ( Figure 5D ).
- Haloperidol kills intracellular mycobacteria by a mechanism distinct from autophagy.
- Haloperidol belongs to sub-cluster E2 ( Figure 3B ).
- This sub-cluster is characterized by a strong alteration of the endocytic profile that can be summarized as an increase in EGF and Tfn content, increased co-localisation of EGF to Tfn (reduced sorting) and accumulation of EGF in large endosomes in the cell centre.
- the alterations observed argue for a faster degradation.
- HeLa cells stably expressing GFP-Rab5 from the endogenous promoter (HeLa BAC GFP-Rab5c) (Foret et al., 2012) were treated with Haloperidol and allowed to internalize LDL for different times prior to immunostaining with anti-Apolipoprotein B (ApoB) (to detect LDL) and LBPA antibodies.
- Haloperidol significantly increased the intensity of LDL in late, but not early endosomes ( Figure 6A , B ).
- LDL-containing late, but not early endosomes were larger, more numerous and closer to the cell centre in Haloperidol-treated compared to control cells ( Figure 13B-G ).
- Phagosome maturation depends on the fusion with early, late endosomes and lysosomes (Desjardins et al., 1994; Fairn and Grinstein, 2012) and is regulated by the motility of endocytic organelles along the cytoskeleton and the recruitment of the membrane tethering-fusion machinery. Both processes could be enhanced by Haloperidol. To address this, the influence of Haloperidol on endosome motility was tested. Increasing concentration of Rab5 and displacement of early endosomes towards cell centre are predictive of progression from early to late endosomes (Del Conte-Zerial et al., 2008; Rink et al., 2005).
- Endosome motility was therefore quantified in cells stably expressing GFP-Rab5, as previously described (Rink et al., 2005), and the velocity toward the cell centre (minus-end microtubule directed) and cell periphery (plus-end) was computed as a function of GFP-Rab5 intensity.
- Haloperidol-treated cells showed a much higher motility of early endosomes harboring high levels of Rab5 and this enhancement was higher toward the cell centre than the cell periphery ( Figure 6C,D ).
- the mean square displacement of endosomes was computed over time, an established way to characterize motility patterns (Caspi et al., 2002).
- Mycobacterial phagosomes contain Rab5, but not Rab7 (Alix et al., 2011; Russell, 2001) and lack PI(3)P (Vergne et al., 2005), which mediates the recruitment of various Rab5 effectors, including the membrane tethering factor Early Endosomal Antigen 1 (EEA1) (Christoforidis et al., 1999; Simonsen et al., 1998). Therefore, mycobacterial phagosomes lack EEA1 (Fratti et al., 2001). If Haloperidol could restore such machinery, one would expect to see a small, transient increase in EEA1 on mycobacterial phagosomes. M.
- EAA1 Early Endosomal Antigen 1
- the dataset was transformed into a Gabriel graph where edges connect neighbour data points (nodes). Then the density estimation for each node was performed using a kernel function that was chosen according to the selected distance measure (as detailed below).
- the Gabriel graph was converted to directed acyclic weighted graph (WDAG) by assigning direction to edges such that they point towards the nodes with higher density estimate. In the ambiguous case of equal density estimates of two neighbour nodes, one node was randomly chosen and a small arbitrary value (0.0000001) was added to its density estimate. Edge weights were set proportional to the distance between nodes that they connect.
- the sinks of the directed graph verices with no out-coming edges) were marked as modes (local maxima) of density. Those data points became cluster centers, and the remaining data points were assigned to the cluster centres based on the shortest weighted path in the directed neighbourhood graph.
- kernel density estimate simply is equal to the number of data points that fall into the hyper-sphere of radius h around the point x, normalized by the volume of this hyper-sphere.
- the bandwidth parameter h determines the degree of density smoothing.
- kernel function is primarily guided by the measure of distance between data points.
- Euclidian distance a commonly chosen kernel is a multivariate Gaussian function in which the covariance matrix parameterizes the bandwidth.
- von Mises-Fisher probability function may be used as a kernel.
- the distribution has one concentration parameter K (kappa) that is analogous to inverse of variance in Gaussian.
- K defines the concentration (inverse bandwidth) of von Mises-Fisher kernel.
- the normalization constant is dependent on the modified Bessel function of the first kind I of the order d 2 - 1 , where d is the number of dimensions.
- Gabriel graph is defined such that two points are connected by an edge if and only if the centre of the edge is closer to these points than to any other point in the set.
- An optimized search procedure for Gabriel graph search is as follows:
- the Gabriel graph was filtered to remove spurious edges.
- the neighbours x i and x j that connected by edge which distance of central point to the third point of set ( x K ) is smaller than 1 2 ⁇ 1 + ⁇ ⁇ D x i ⁇ x j are filtered out.
- ⁇ was chosen equal 0.05.
- the density modes of two clusters could occur almost on the edge of clusters and in multidimensional space they may happen to be Gabriel neighbours of each other through 'long-range' connections. These connections were filtered as well by taking intersection with sets of its nearest neighbours of an equal size. This procedure removes 'long-range' links that spans across empty regions of the feature space while keeping most of the links within the clusters.
- Density-shift is a clustering method that combines per-data point density estimate with a filtered Gabriel neighbourhood graph to perform robust mode seeking in the multidimensional space.
- the modes of density are identified as points that have density higher than any of their Gabriel neighbours. Other points are assigned to their respective modes following the discrete walk through a succession of Gabriel neighbours with monotonously increasing density estimate at each step.
- the algorithm details are as follows:
- PSS Pattern-specific score
- Pattern-specific score is a hit selection method that is based on a statistical model in which each measured feature vector r is a sum of two independent components.
- r ⁇ a ⁇ ⁇ ⁇ + n ⁇
- One component is a specific phenotype component that follows along the central direction ⁇ of its class and has an unknown amplitude a.
- the other component is a random noise component n that is drawn from the zero-centered multivariate normal distribution with the covariance matrix ⁇ .
- the covariance matrix ⁇ can be estimated either from the repeated negative control measurements, or, if unavailable, from the total set of measurements.
- the integration is performed numerically using the standard Newton-Cotes method.
- the grouping of the profiles into classes may be obtained from a clustering that is based on uncentered Pearson correlation, so that the mean (or mode) directions of the clusters can be taken as estimates of central directions of classes.
- the parameters of noise distribution (covariance matrix ⁇ ) can be estimated from a sufficient sample of negative control measurements.
- Hierarchical clustering was implemented using 1 - cos ⁇ as a distance measure, following standard practice ( Kittler, R. et al. Genome-scale RNAi profiling of cell division in human tissue culture cells. Nature cell biology 9, 140 1-12 (2007 )).
- K-means clustering with cosine similarity measure we implemented spherical K-means algorithm, where the data points and the cluster centroids are projected on a unity hyper-sphere by normalizing all vectors to have unity Euclidian length.
- Mean-shift was implemented following the description of Cheng ( Cheng, Y.
- Cluster Silhouette index was computed following the algorithm provided in Rousseeuw, P. J. Silhouettes: A graphical aid to the interpretation and validation of cluster analysis. Journal of Computational and Applied Mathematics 20, 53-65 (1987 ), using 1-cos ⁇ as a distance measure.
- a(i) which is the average distance other data points in its own cluster
- b(i) that is a minimum of average distance any other cluster.
- the average of Silhouette values over the whole dataset is the index that expresses the overall quality of a given clustering.
- the increase in free parameter setting in the compared algorithms is expected to yield more clusters.
- the clusters of the next level generally can be mapped in one-to-one or many-to-one fashion to the clusters of the previous level based on shared data points.
- Each cluster of the next level is mapped to a cluster of previous level in members of which it has the highest enrichment (lowest hypergeometric p-value).
- RNAi phenotypes Clustering of RNAi phenotypes is expected to group together genes that participate in the same functional modules. According to the definition of Hartwell and co-workers ( Hartwell, L. H., Hopfield, J. J., Leibler, S. & Murray, A. W. From molecular to modular cell biology. Nature 402, C47-52 (1999 )), a functional module is characterized by extensive physical interaction of the components. We designed a simple way to cross-validate the gene phenotypic clustering based on this definition by quantifying how much the gene clusters are enriched in protein-protein interactions.
- the human protein-protein interaction data was obtained from STRING 9.0 database (see the world wide web at string-db.org), where we extracted the interactions annotated as 'experimental' and 'databases' and having confidence index of at least 0.7.
- the sample included protein pairs where both phenotypic profiles were grouped in the same cluster and appeared within the top 10 th percentile of profiles in this clustering, ranked by a given scoring measure.
- Table 2 Description of the morphological parameters describing bacterial shape (see also Figure 9A) Parameter Description a. Median: Area Median area of bacteria estimated at half height of the fitting functions. b. Mean: Area: Weighted (Mean Intensity) Same as parameter a., but the mean area weighted by bacterial mean intensity is calculated. c. Mean: Area: Weighted (Integral Intensity) Same as parameter a., but the mean area weighted by bacterial integral intensity is calculated. d. Median: Elongation Median elongation of bacteria estimated at half height of the fitting functions. e.
- Mean Elongation: Weighted (Mean Intensity) Same as parameter d., but the mean area weighted by bacterial mean intensity is calculated.
- Mean Elongation: Weighted (Integral Intensity) Same as parameter d., but the mean area weighted by bacterial integral intensity is calculated.
- Mean Bacteria area Mean object area measured on the contour of the segmented bacterial.
- Mean Bacteria perimeter Mean object perimeter measured on the contour of the segmented bacteria.
- Compactness is a measure of region non-smoothness, defined as the ratio between the actual area and the area a circle with the same perimeter would have.
- Mean bacteria dispersion Mean object dispersion measured on the contour of the segmented bacteria. Dispersion is a measure of region irregularity, defined as the ratio of the major chord length (maximum circle enclosing the region) to the area.
- k. Bacteria relative dispersion Mean object relative dispersion measured on the contour of the segmented bacteria. Relative dispersion is a measure of region spreading, defined as the ratio of the maximal region radius and the minimal one.
- Mean Bacteria elongation Mean object elongation measured on the contour of the segmented bacteria.
- Elongation is another measure of region Irregularity, defined as the ratio of the actual perimeter and the perimeter a circle with the same area would have.
- n. Bacteria solidity Mean object solidity measured on the contour of the segmented bacteria.
- Solidity is a measure of region tightness, defined as the ratio between the region area and the area of the convex hull of the same region.
- Mean Bacteria extent Mean object extent measured on the contour of the segmented bacteria. Extent is a measure of region extension defined as the ratio between the area of the minimal rectangle (bounding box) that encloses and the actual region area.
- Table 4 Compounds from cluster M5 and their pattern-specific score (PSS) Compounds PSS 12A-HYDROXY-9-DEMETHYLMUNDUSERONE-8-CARBOXYLIC ACID 0.838688 3;7-EPOXYCARYOPHYLLAN-6-OL 0.719354 ACEPHATE 0.657407 ALBIZZIINE 0.538698 ALVERINE CITRATE 1 AMITRIPTYLINE HYDROCHLORIDE 1 AMOXAPINE 0.99999 ANTHRALIN 0.701373 APIGENIN TRIACETATE 0.413001 ARACHIDONIC ACID 0.936708 ARCAINE SULFATE 0.768613 ARTEMISININ 0.495906 ARTHONIOIC ACID 0.81887 ATENOLOL 0.683277 ATRACTYLOSIDE POTASSIUM 0.667684 AZELASTINE HYDROCHLORIDE 0.980104 BAICALEIN 0.928898 BENZAMIL HYDROCHLORIDE 0.963588 BENZ
Landscapes
- Health & Medical Sciences (AREA)
- Chemical & Material Sciences (AREA)
- Life Sciences & Earth Sciences (AREA)
- General Health & Medical Sciences (AREA)
- Animal Behavior & Ethology (AREA)
- Pharmacology & Pharmacy (AREA)
- Public Health (AREA)
- Veterinary Medicine (AREA)
- Medicinal Chemistry (AREA)
- Epidemiology (AREA)
- Organic Chemistry (AREA)
- Engineering & Computer Science (AREA)
- Zoology (AREA)
- Wood Science & Technology (AREA)
- Proteomics, Peptides & Aminoacids (AREA)
- Biotechnology (AREA)
- Bioinformatics & Cheminformatics (AREA)
- Immunology (AREA)
- Microbiology (AREA)
- Molecular Biology (AREA)
- Analytical Chemistry (AREA)
- Physics & Mathematics (AREA)
- Toxicology (AREA)
- Biochemistry (AREA)
- Biophysics (AREA)
- General Engineering & Computer Science (AREA)
- Genetics & Genomics (AREA)
- Pulmonology (AREA)
- Communicable Diseases (AREA)
- Oncology (AREA)
- Chemical Kinetics & Catalysis (AREA)
- General Chemical & Material Sciences (AREA)
- Nuclear Medicine, Radiotherapy & Molecular Imaging (AREA)
- Measuring Or Testing Involving Enzymes Or Micro-Organisms (AREA)
Abstract
The present invention relates to a compound capable of killing mycobacteria by activating host cellular mechanisms for use in treating tuberculosis, wherein the compound is selected from the group consisting of nortriptyline, haloperidol and prochlorperazine edisylate (PE). Furthermore, the present invention relates to a pharmaceutical composition comprising the compound of the invention, and optionally a pharmaceutically acceptable carrier. The invention further relates to a method of treating tuberculosis as well as a method of identifying a lead compound for the treatment of tuberculosis.
Description
- The present invention relates to a compound capable of killing mycobacteria by activating host cellular mechanisms for use in treating tuberculosis, wherein the compound is selected from the group consisting of nortriptyline, haloperidol and prochlorperazine edisylate (PE). Furthermore, the present invention relates to a pharmaceutical composition comprising the compound of the invention, and optionally a pharmaceutically acceptable carrier. The invention further relates to a method of treating tuberculosis as well as a method of identifying a lead compound for the treatment of tuberculosis.
- In this specification, a number of documents including patent applications and manufacturer's manuals are cited. The disclosure of these documents, while not considered relevant for the patentability of this invention, is herewith incorporated by reference in its entirety. More specifically, all referenced documents are incorporated by reference to the same extent as if each individual document was specifically and individually indicated to be incorporated by reference.
- Tuberculosis (TB) is a common, and in many cases lethal, contagious bacterial infection caused by various strains of mycobacteria, usually Mycobacterium tuberculosis (M. tuberculosis). The disease involves the lungs, but may also spread to other organs. Primary TB infection typically occurs by breathing in air droplets from a cough or sneeze of an infected person. Normally, most people recover from primary TB infection without further evidence of the disease, but the infection may stay inactive (dormant) for many years. In some people, the disease can reactivate or the disease may become active within weeks after the primary infection. In particular elderly people and infants but also people with a weakened immune system, e.g. due to AIDS, chemotherapy, diabetes or certain medications are at higher risk for active TB. Established treatment regimes require the administration of multiple antibiotics over a long period of time, however, antibiotic resistance increasingly presents a problem in multiple drug-resistant tuberculosis (MDR-TB) infections.
- TB is characterized by an extensive array of interactions between mycobacteria and the host. To maintain their intracellular niche, mycobacteria influence a variety of fundamental host cell processes including apoptosis (Behar et al., 2010; Chen et al., 2006; Keane et al., 2000), autophagy (Gutierrez et al., 2004; Kumar et al., 2010), trafficking (Armstrong and Hart, 1971; Russell, 2001) and signalling (Koul et al., 2004). Therefore, a pharmacological modulation of the host cell mechanisms that are hijacked by the bacteria could, on the one hand, be used to explore the processes altered during the infection and, on the other hand, lead to development of novel classes of anti-TB compounds. However, exploiting host processes to fight against infectious diseases is currently an under-explored approach. Yet, it presents several advantages. First, the host processes exploited by pathogens are well studied from both a mechanistic and physiological perspective (Dyer et al., 2008). Second, it could better prevent the emergence of drug resistant strains (Schwegmann and Brombacher, 2008). Additionally, critical host cellular responses are conserved across diverse mycobacterial strains, including drug-resistant ones (Kumar et al., 2010).
- Thus, despite the fact that a lot of effort has been invested into identifying antibacterial compounds for the treatment of tuberculosis, there is still a need to identify further compounds. Preferably, such compounds should target mycobacteria via mechanisms different from the mechanisms of action of established tuberculosis drugs. This need is addressed by the provision of the embodiments characterized in the claims.
- Accordingly, the present invention relates to a compound capable of killing mycobacteria by activating host cellular mechanisms for use in treating tuberculosis, wherein the compound is selected from the group consisting of 3-(10,11-dihydro-5H-dibenzo[a,d] cyclohepten-5-ylidene)- N-methyl-1-propanamine (nortriptyline), 4-[4-(4-chlorophenyl)-4-hydroxy-1-piperidyl]-1-(4-fluorophenyl)-butan-1-one (haloperidol) and 2-chloro-10-[3-(4-methyl-1-piperazinyl)propyl]-10H-phenothiazine (prochlorperazine edisylate;PE).
- In accordance with the present invention, compounds for the treatment of tuberculosis are provided that were not previously known to be suitable as active agents for the therapy of tuberculosis. These compounds are selected from the group consisting of nortriptyline, haloperidol and prochlorperazine edisylate (PE), all three of which have been shown in the appended examples as being capable of killing mycobacteria by activating host cellular mechanisms, in particular by restoring mycobacteria-arrested phagosome maturation.
- Nortriptyline is a tricyclic antidepressant, the systematic (IUPAC) name of which is 3-(10,11-dihydro-5H-dibenzo[a,d] cyclohepten-5-ylidene)- N-methyl-1-propanamine. It is also marketed as the hydrochloride salt under the trade names Sensoval, Aventyl, Pamelor, Norpress, Allegron, Noritren and Nortrilen. Nortriptyline is used to treat symptoms of depression as well as childhood nocturnal enuresis. Sometimes it is also used for the treatment of chronic illnesses such as chronic fatigue syndrome, chronic pain and migraine, and labile affect in some neurological conditions.
- Haloperidol is a compound from the group of medications called conventional antipsychotics and has the systematic (IUPAC) name 4-[4-(4-chlorophenyl)-4-hydroxy-1-piperidyl]-1-(4-fluorophenyl)-butan-1-one. Haloperidol works by decreasing abnormal excitement in the brain and is used to treat psychotic disorders, but also to control motor tics and verbal tics in adults and children who have Tourette's disorder. Haloperidol is further used to treat severe behavioural problems such as explosive, aggressive behaviour or hyperactivity in children who cannot be treated with psychotherapy or with other medications. Haloperidol is sold under the trade names Aloperidin, Bioperidolo, Brotopon, Dozic, Duraperidol (Germany), Einalon S, Eukystol, Haldol (common tradename in the US and UK), Halosten, Keselan, Linton, Peluces, Serenace, Serenase, and Sigaperidol.
- Prochlorperazine edisylate (PE) has the systematic (IUPAC) name 2-chloro-10-[3-(4-methyl-1-piperazinyl)propyl]-10H-phenothiazine. It is also known under the names Compazine, Stemzine, Buccastem, Stemetil and Phenotil. PE is a dopamine (D2) receptor antagonist that is used for the antiemetic treatment of nausea and vertigo and is also a highly potent typical antipsychotic. It is also used to treat migraine headaches.
- Nortriptyline, haloperidol and prochlorperazine edisylate (PE) are commercially available and can for example be purchased from Sigma. The chemical synthesis of these compounds is well described, e.g. the synthesis of haloperidol has been described in
US 3,438,991 ,GB 895309 BE577977 US patent 2,902,484 and the synthesis of Nortriptyline has been described in Peters and Hennion, J. Med. Chem., 1964, 7 (3), pp 390-392. - In accordance with the present invention, novel anti-mycobacterial properties for three existing drugs were revealed. Nortriptyline is known in the art and is employed as a second generation tricyclic antidepressant while PE and haloperidol, which are also well known in the art, are used as anti-psychotics. Neither of these compounds was previously known in the art to be suitable for the treatment of tuberculosis. The finding that three neuro-modulators are endowed with membrane trafficking and anti-mycobacterial activity suggests that compounds can exert diverse biological effects depending on the cellular context analyzed. Such influences are typically neglected in target-based screenings. Repurposing existing drugs for new applications could thus open new avenues and lead to rapid therapeutic advances (Huang et al., 2011).
- As detailed herein above, upon infection, mycobacteria alter host cell mechanisms in order to survive and proliferate. One of these host cell mechanisms is cellular phagosome maturation, which is blocked in the presence of mycobacteria (Armstrong and Hart, 1971; Pieters, 2008; Russell, 2001). Here, novel pharmacological modulators of host cellular processes were identified that trigger killing of intracellular mycobacteria via restoring of the host cell phagosome maturation. Accordingly, these compounds act on (and restore) host cell mechanisms instead of targeting and killing mycobacteria directly, as is shown in the appended examples; see e.g.
Figure 9 , in particularFigures 9b showing the growth curve of mycobacteria in the presence of the compounds as well asFigure 9c showing an alamar blue assay for mycobacterial growth in the presence of compounds at different acidic pH. These data therefore confirm that the compounds identified herein influence intracellular mycobacterial survival by modulating cellular processes at the host-pathogen interface rather than acting directly on the bacteria. - Accordingly, in a preferred embodiment, the present invention relates to a compound selected from the group consisting of nortriptyline, haloperidol and prochlorperazine edisylate (PE) for use in treating tuberculosis, wherein the compound is capable of restoring mycobacteria-arrested phagosome maturation.
- The present invention further relates to a pharmaceutical composition comprising the compound of the invention, and optionally a pharmaceutically acceptable carrier. Preferably, the pharmaceutical composition comprises the compound of the invention as the single active agent.
- In accordance with the present invention, the term "pharmaceutical composition" relates to a composition for administration to a patient, preferably a human patient. The pharmaceutical composition of the invention comprises at least one of the compounds of the invention, i.e. one or more of nortriptyline, haloperidol and prochlorperazine edisylate (PE), i.e. either nortriptyline, haloperidol or prochlorperazine edisylate (PE) alone or a combination of either nortriptyline with haloperidol, nortriptyline with prochlorperazine edisylate (PE) or haloperidol with prochlorperazine edisylate (PE) or a combination of all three.
- The pharmaceutical composition of the present invention may, optionally and additionally, comprise a pharmaceutically acceptable carrier. By "pharmaceutically acceptable carrier" is meant a non-toxic solid, semisolid or liquid filler, diluent, excipient, encapsulating material or formulation auxiliary of any type. Examples of suitable pharmaceutical carriers are well known in the art and include sodium chloride solutions, phosphate buffered sodium chloride solutions, water, emulsions, such as oil/water emulsions, sterile solutions, organic solvents etc. Conventional excipients include binding agents, fillers, lubricants and various types of wetting agents. Preferably the carrier is a parenteral carrier, more preferably a solution that is isotonic with the blood of the recipient. The term "parenteral" as used herein refers to modes of administration, which include for example intravenous injection. These modes of administration, together with intranasal, oral, buccal, sublingual or intrabronchial administration, are preferred modes of administration in accordance with the present invention. Most preferred modes of administration in accordance with the present invention are oral and intravenous administration. The carrier optionally contains minor amounts of additives such as substances that enhance isotonicity and chemical stability. Such materials are non-toxic to recipients at the dosages and concentrations employed, and include buffers such as phosphate, citrate, succinate, acetic acid, and other organic acids or their salts; antioxidants such as ascorbic acid; low molecular weight (less than about ten residues) (poly)peptides, e.g., polyarginine or tripeptides; proteins, such as serum albumin, gelatin, or immunoglobulins; hydrophilic polymers such as polyvinylpyrrolidone; amino acids, such as glycine, glutamic acid, aspartic acid, or arginine; monosaccharides, disaccharides, and other carbohydrates including cellulose or its derivatives, glucose, mannose, or dextrins; chelating agents such as EDTA; sugar alcohols such as mannitol or sorbitol; counterions such as sodium; and/or nonionic surfactants such as polysorbates, poloxamers, or PEG.
- Compositions comprising such carriers can be formulated by well known conventional methods. Generally, the formulations are prepared by contacting the components of the pharmaceutical composition uniformly and intimately with liquid carriers or finely divided solid carriers or both. Then, if necessary, the product is shaped into the desired formulation.
- The pharmaceutical compositions can be administered to the subject at a suitable dose. The dosage regimen will be determined by the attending physician and clinical factors. As is well known in the medical arts, dosages for any one patient depend upon many factors, including the patient's size, body surface area, age, the particular compound to be administered, sex, time and route of administration, general health, and other drugs being administered concurrently. The therapeutically effective amount for a given situation will readily be determined by routine experimentation and is within the skills and judgment of the ordinary clinician or physician. The pharmaceutical composition may be for administration once or for a regular administration over a prolonged period of time. Generally, the administration of the pharmaceutical composition should be in the range of for example 10µg/kg of body weight to 2g/kg of body weight for a single dose. However, a more preferred dosage might be in the range of 100µg /kg to 1.5g/kg of body weight, even more preferably 1 mg/kg to 1 g/kg of body weight and even more preferably 5mg/kg to 500mg/kg of body weight for a single dose. The typically recommended dose for Haloperidol is between 0.5 to 20 mg/day (Oosthuizen et al. (2001). Journal of Psychopharmacology 15 (4): 251-5.), for Nortriptyline between 10 to 150 mg/day (according to the world wide web at drugs.com/dosage/nortriptyline.html) and for Prochlorperazine edisylate between 5 to 40 mg/day (according to the world wide web at drugs.com/dosage/prochlorperazine.html). Adjustment of these dosages in case of combination of the agent of the present invention with further pharmaceutically active compounds, such as those described elsewhere herein, is within the skills and judgment of the ordinary clinician or physician.
- The components of the pharmaceutical composition to be used for therapeutic administration must be sterile. Sterility is readily accomplished by filtration through sterile filtration membranes (e.g., 0.2 micron membranes), however, the present invention is not confined to this method of obtaining sterility. The pharmaceutical composition of the invention is formulated in accordance with national laws and regulatory requirements according to GMP standards.
- The components of the pharmaceutical composition ordinarily will be stored in unit or multi-dose containers, for example, sealed ampoules or vials, as an aqueous solution or as a lyophilized formulation for reconstitution. As an example of a lyophilized formulation, 10-ml vials are filled with 5 ml of sterile-filtered 1% (w/v) aqueous solution, and the resulting mixture is lyophilized. The infusion solution is prepared, for example, by reconstituting the lyophilized compound(s) using bacteriostatic water-for-injection. Preservatives and other additives may also be present such as, for example, antimicrobials, anti oxidants, chelating agents, and inert gases and the like.
- The pharmaceutical composition may comprise further agents depending on the intended use of the pharmaceutical composition. For example, such further agents may be selected from agents known in the art to be suitable in the treatment of tuberculosis (as described below) or in the treatment of side effects associated with tuberculosis. Since the pharmaceutical composition of the present invention relies on the above mentioned active compounds, it is preferred that these further agents are only used as a supplement, i.e. at a reduced dose as compared to the recommended dose when used as the only drug, so as to e.g. reduce side effects conferred by the further agents.
- In a preferred embodiment of the invention, the compound or the pharmaceutical composition have admixed thereto or associated in a separate container one or more agents selected from the group consisting of antibiotic compounds, arginine, vitamin D and IFN-γ.
- Antibiotic compounds, in accordance with the present invention, are antimicrobial compounds, i.e. compounds capable of killing microbes or inhibiting their growth. Preferably, the antibiotic compounds are antibacterial compounds. Non-limiting examples of antibiotics suitable for use in accordance with this preferred embodiment include existing first line anti-tuberculosis drugs such as isoniazid, ethambutol, rifampin, pyrazinamide; second line anti-tuberculosis drugs including aminoglycosides, such as e.g., amikacin (AMK), kanamycin (KM); polypeptides such as e.g., capreomycin, viomycin, enviomycin; fluoroquinolones such as e.g., ciprofloxacin (CIP), levofloxacin, moxifloxacin (MXF); thioamides such as e.g. ethionamide, prothionamide; cycloserine such as e.g., closerin, terizidone as well as third-line anti- tuberculosis compounds like rifabutin macrolides such as e.g. clarithromycin (CLR); linezolid (LZD); thioacetazone (T); thioridazine; arginine or R207910. Combination of the compound(s) of the present invention with antibiotic compounds is expected to provide the advantage of increasing positive therapeutic effects of different treatment approaches while minimizing the unwanted side effects by lowering the dose or treatment duration of each individual treatment approach.
- Arginine has been shown to be an effective adjuvant in the treatment against tuberculosis, possibly by enhancing NO levels (Schön et al. (2003) Eur Respir J 2003;21:483-8). Later work by the same group suggested that this effect may be restricted to a sub-group of patients who are also HIV positive (Schon et al. (2011), Tuberculosis (Edinb). Sep;91 (5):370-7). Thus, arginine may be of particular interest in a combination therapy for this patient group.
- Vitamin D, in accordance with the present invention, refers to the Vitamin produced by sunlight. Tuberculosis patients given high doses of Vitamin D together with anti-tuberculosis drugs showed accelerated resolution of inflammatory responses as well as smear conversion in a randomized clinical trial (Coussens et al. (2012), PNAS 109(38):15449-54).
- Interferon-gamma (IFN-γ), the only member of the type II class of interferons, is a dimerized soluble cytokine that is critical for innate and adaptive immunity against viral and intracellular bacterial infections and for tumor control. The amino acid sequence of IFN-γ can be found in the UniProt database under P01579 or in the NCBI database under NP_000610.2. IFN-γ is an established physiological inducer of autophagy (Gutierrez et al., 2004; Matsuzawa et al., 2012) and, as is shown in Example 6, Nortriptyline synergized strongly with IFN-γ, supporting its role in autophagy induction. Additive or even synergistic activities of the pharmaceutical compounds with such antibiotic compounds, arginine, vitamin D and/or IFN-γ may be exploited to yield more potent pharmacological interventions.
- The present invention also relates to a method of treating tuberculosis comprising administering a pharmaceutically effective amount of a compound capable of killing mycobacteria by activating host cellular mechanisms to a subject in need thereof, wherein the compound is selected from the group consisting of nortriptyline, haloperidol and prochlorperazine edisylate (PE).
- All the definitions as well as the preferred embodiments provided herein above with regard to the compound or the pharmaceutical composition of the invention apply mutatis mutandis also to the embodiments relating to the method of treating tuberculosis as outlined above.
For example, in a preferred embodiment of this method of the invention, the method further comprises the administration of one or more agents selected from the group consisting of antibiotic compounds, arginine, vitamin D and IFN-γ. - The pharmaceutically effective amount of the respective compound may be formulated as a pharmaceutical composition, as defined above.
- In another preferred embodiment of the method of the invention, the subject is a mammal. More preferably, the subject is a human subject.
- The present invention further relates to a method of identifying a lead compound for the treatment of intracellular bacterial infections, the method comprising the steps of:
- (a) incubating cells infected with bacteria with a test compound;
- (b) staining the cells with (a) detectable marker probe or introducing into the cell a detectable marker probe;
- (c) obtaining a multi-parametric phenotypic profile of host cell parameters and bacterial parameters; and
- (d) clustering the multi-parametric phenotypic profile by using a clustering algorithm based on density estimate and modified Gabriel graph neighbourhood, which comprises:
- (i) computing multi-dimensional Gabriel neighbourhood graph over dataset, where nodes correspond to phenotypic profiles and edges determine the neighbourhood of nodes;
- (ii) filtering out spurious as well as 'long-range' edges from the Gabriel graph;
- (iii) computing the density estimate for each node of the Gabriel graph using a kernel function, wherein the kernel function is chosen according to the selected multi-parametric profile dissimilarity measure;
- (iv) converting the modified Gabriel graph into weighted directed acyclic graph (WDAG) by assigning directionality to edges such that their point from nodes with lower density estimate to nodes with higher density estimate and edge weights are set proportional to the distances (dissimilarity) between neighbouring nodes, or, in the ambiguous case of equal density estimates of two neighbour nodes, one node is randomly chosen and a small arbitrary value (0.0000001) is added to its density estimate;
- (v) marking the nodes of the graph with no out-coming edges, i.e. nodes having local maxima of density, as cluster centers; and
- (vi) assigning the remaining nodes to the cluster centers based on the shortest weighted path in the directed neighbourhood graph;
- Preferably, the intracellular bacterial infection is a mycobacterial infection, even more preferably M. tuberculosis.
- In accordance with the present invention, the term "lead compound", which is used herein interchangeably with the term "hit compound", refers to a compound discovered by the method of the invention as being suitable for the treatment of an intracellular bacterial infection and which can e.g. be further optimized, in particular to be pharmaceutically more acceptable.
- Essentially any compound can be assayed as a test compound in this method according to the present invention. Compounds include small molecules, such as organic or inorganic molecules. Organic molecules relate or belong to the class of chemical compounds having a carbon basis, the carbon atoms linked together by carbon-carbon bonds, including biological entities such as e.g. proteins, sugars, nucleic acids, lipids. The original definition of the term organic related to the source of chemical compounds, with organic compounds being those carbon-containing compounds obtained from plant or animal or microbial sources. Organic compounds can be natural or synthetic. Small organic molecules preferably have a molecular weight of about 500 Da or below. Inorganic compounds are derived from mineral sources and include all compounds without carbon atoms (except carbon dioxide, carbon monoxide and carbonates). There are many suppliers of such compounds, including Sigma (St. Louis, Mo.), Aldrich (St. Louis, Mo.), Sigma-Aldrich (St. Louis, Mo.), Fluka Chemika-Biochemica Analytika (Buchs, Switzerland), for example. In addition, compounds to be analysed may be synthesized by methods known in the art, or obtained from fractionating extracts obtained from natural sources, such as e.g. plants. The compounds to be tested as potential agents suitable for the treatment of tuberculosis can be dissolved in aqueous or organic, such as e.g., DMSO-based, solutions.
- Test compounds may be comprised in compound libraries of diverse or structurally similar compounds (e.g, combinatorial chemistry synthesized libraries). A plurality of test compounds in a library can be assayed simultaneously. Optionally, test compounds derived from different libraries can be pooled for simultaneous evaluation. A library can comprise a random collection of molecules. Alternatively, a library can comprise a collection of molecules having a bias for a particular sequence, structure, or conformation. Methods for preparing libraries containing diverse populations of various types of molecules are known in the art (Brenk, R. et al., Lessons Learnt from Assembling Screening Libraries for Drug Discovery for Neglected Diseases, , Quinn J.R. et al., Developing a Drug-like Natural Product Library, J. Nat. Prod. 2008, 71, 464-468). Numerous libraries are also commercially available.
- In a first step of this method of the invention (i.e. step (a) recited above), cells that are infected with bacteria, preferably mycobacteria, are incubated with said test compound(s). Cells infected with bacteria may be obtained in a preceding step by infecting cells with a bacterial strain, such as e.g. a mycobacteria strain using methods well known in the art. For example, cells can be infected by incubating them with cell culture medium that contains a defined amount of bacteria. After a specified period of time (such as e.g. 1 hour), the bacteria containing media are removed and cells are washed extensively to remove the remaining bacteria. A non-pathogenic M.bovis expressing GFP (BCG-GFP) can for example be employed, as described in the appended examples. Alternatively, pathogenic M. tuberculosis may be employed, such as e.g. the clinical strains CS1 or CS2, as also described in the appended examples with regard to the validation experiments. Further mycobacteria suitable for use in the methods of the present invention include, without being limiting M. marinum, M. ulcerans, M. avium, M. africanum, M. fortuitum, M. smegmatis.
- The cells suitable for use in the method of the present invention include all cells typically infected by bacteria, and in particular mycobacteria, such as e.g. macrophages, monocytes or dendritic cells. The cells may be primary cells, i.e. cells directly obtained from an organism, as well as stable, immortalized cell lines.
- Incubation with the test compound is performed under cell culture conditions suitable for the respective cell type. Such cell culture conditions are known in the art. Preferably, the cells are incubated with the test compound for at least 6 to 72 hours, such as e.g. 12 to 62 hours, more preferably 24 to 52 hours and most preferably for about 48 hours, as shown in the appended examples. Incubation can e.g. be carried out in high-throughput assays which are capable of screening up to several thousand compounds in parallel. High-throughput assays generally may be performed in wells of microtiter plates, wherein each plate may contain 96, 384 or 1536 wells. Handling of the plates, including incubation at temperatures other than ambient temperature, and bringing into contact of test compounds with the assay mixture is preferably affected by one or more computer-controlled robotic systems including pipetting devices. In case large libraries of test compounds are to be screened and/or screening is to be effected within short time, mixtures of, for example about or exactly 10, 20, 30, 40, 50 or 100 test compounds may be added to each well. In case a well exhibits biological activity, said mixture of test compounds may be de-convoluted to identify the one or more test compounds in said mixture giving rise to said activity.
- Subsequently, the cells may be fixed by methods well established in the art, using e.g. fixatives commonly used in histo-chemical or fluorescence studies such as for example paraformaldehyde, such as 3.7% PFA.
- Then, in step (b), the cells are stained with a suitable detectable marker probe or a detectable marker probe is introduced into the cell(s) in order to enhance the visibility of cellular and/or bacterial features. Detectable marker probes for staining or which can be introduced into the cell(s) are not particularly limited. They include, without being limiting, markers selected from the group consisting of fluorescent compounds, bioluminescent compounds, chemiluminescent compounds, radioisotopes, markers which can be detected by colorimetric methods, metal chelates and enzymes or compounds, such as proteins, labelled therewith. In a preferred embodiment of the method of the invention, the detectable marker probe introduced into the cell(s) is a compound labelled with a fluorescent dye. A fluorescent dye in accordance with the present invention includes compounds which emit light of a particular wavelength when exposed to electromagnetic radiation of a shorter wavelength. Non-limiting examples of fluorescent dyes are fluorescein, naphtofluorescein, the various known versions of GFPs, Rhodamin, Texas Red, Pacific Blue, Oregon Green, Alexa Fluor Dyes, Cy3 or Cy5. In another preferred embodiment of the method of the invention, the cells are stained with a fluorescent dye. For example, cells may be stained with 4',6-diamidino-2-phenylindole (DAPI), a fluorescent stain that binds strongly to A-T rich regions in DNA, for staining the nucleus and Cell Mask Blue (Invitrogen), which labels the cytoplasm of the cell.
- Means and methods for introducing a detectable marker probe into the cell are well known in the art. For example, a fluorescently labelled probe may be introduced into the cell via a transport protein, such as e.g. transferrin (Tfn), as described e.g. in Example 4 below. Alternatively, antibodies for a specific target within the cell can be introduced, wherein said antibodies are detectably labelled, for example with a fluorescent dye. Also envisaged herein is the use of bi-specific antibodies, wherein one antibody specificity is directed to a cellular compartment/target while the second antibody specificity is directed to a detectable protein or dye. Alternatively, a detectable marker probe may be introduced into the cell in form of an expressible nucleic acid molecule using any of the methods known in the art for introducing nucleic acid molecules into cells. Such methods include for example calcium phosphate-DNA coprecipitation, DEAE-dextran-mediated transfection, polybrene-mediated transfection, electroporation, microinjection, liposome fusion, lipofection, protoplast fusion, retroviral infection, and biolistics. Preferably, said nucleic acid molecule(s) encoding the detectable marker probe is contained in a vector expressible in the cell. Suitable expression vectors are well known in the art.
- Next, in step (c), a multi-parametric phenotypic profile of host cell parameters and bacterial parameters is obtained. "Multi-parametric phenotypic profiles" are well known in the art and have been described in e.g. Collinet et al, Nature 2010. Such profiles reflect the phenotype of e.g. a cell or population of cells based on a number of parameters, such as the parameters detailed herein below.
- This step includes acquiring images of the cells, for example using the automated spinning disk confocal Opera (Perkin Elmer) and analysing said images. Preferably, image analysis is carried out automatically.
- Finally, in step (d), the multi-parametric phenotypic profile is clustered by using a new density-estimate-based clustering algorithm. As high-content screening datasets have a complex distribution of multi-dimensional phenotypes, new clustering and hit-selection methods are required. Using a new density-based method for robust clustering of multi-dimensional phenotypes is employed herein.
The density-based clustering algorithm of the present invention is similar to mean-shift, wherein the move along the steepest gradient over a continuous density estimate function is replaced by a discrete gradient ascent over a sequence of Gabriel graph neighbouring data points (Gabriel, K. R.; Sokal, R. R., A new statistical approach to geographic variation analysis, Systematic Zoology (1969) v.18(3), pp.259-270). Such a design provides two main advantages. First, peculiar dependency of number of clusters as function of clustering free parameter (kernel bandwidth) which provides intrinsic criteria for free parameter selection and, second, it only needs to compute a density estimate at each data point and does not depend on the smoothness of density estimate function between data points, which decreases over-fragmentation in multi-dimensional space.
The clustering algorithm of the present invention begins in step (i) with computing a set of multi-parametric phenotype profiles into nodes of Gabriel graph where edges connect neighbouring nodes. Subsequently spurious as well as 'long-range' edges are filtered out from the graph in step (ii). Then the density estimate for each node is computed in step (iii) using a kernel function that is chosen according to the selected distance measure (as detailed below). Then the modified Gabriel graph is converted in step (iv) into weighted directed acyclic graph (WDAG) by directing the edges between neighbour nodes such that they point towards the node with higher density estimate. In the ambiguous case of equal density estimate of two neighbour nodes, one node is randomly chosen and a small arbitrary value (0.0000001) is added to its density estimate. Edge weights are set proportional to the distance between neighbouring nodes. The sinks of the graph (nodes with no out-coming edges) are marked as modes (local maxima) of density in step (v). Those data points become cluster centres, and the remaining data points are assigned in step (vi) to the cluster centres based on the shortest weighted path in the directed neighbourhood graph. - Kernel density estimate of the multivariate probability density function f̂(x) of a random variable x from an independent and identically-distributed sample x1,x2,.,xn is given by

- 1) K is a function of distance D(x,xi ) and is defined over the whole argument space;
- 2) K is monotonously non-increasing;
- 3) K has unity integral on the argument space.
- The simplest case is the so-called flat kernel, where K equals constant when D(x,xi) < h and 0 otherwise. In this case, kernel density estimate simply is equal to the number of data points that fall into the hyper-sphere of radius h around the point x, normalized by the volume of this sphere. The bandwidth parameter h determines the degree of density smoothing. In each particular case, the choice of kernel function is primarily guided by the measure of distance between data points. In the case of Euclidian distance, a commonly chosen kernel is a multivariate Gaussian function in which the covariance matrix parameterizes the bandwidth.
- In case of directional data, meaning that the similarity between two feature vectors is given by cosine of angle (uncentered Pearson correlation), von Mises-Fisher probability function may be used as a kernel

x that deviates from the central vectorµ by cos θ. The distribution has one concentration parameter K (kappa) that is analogous to inverse of variance in Gaussian. Hence K defines the concentration (inverse bandwidth) of von Mises-Fisher kernel. The normalization constant is dependent on modified Bessel function of the first kind I of the order
- In order to define data point neighbourhood in a nonparametric and locally adaptive way Gabriel graph is defined such that two points are connected by edges if and only if centre of the edge is closer to these points than to any other point in the set. According to the invention the Gabriel neighbours xi and xj, that connected by edge which central point distance to the third point of set (xK ) is smaller than

- In some cases the density modes of two clusters could occur almost on the edge of clusters and in multidimensional space they may happen to be Gabriel neighbours of each other through 'long-range' connections. In this case the present algorithm cannot separate them. To rescue that situation, for every data point the set of its Gabriel neighbours were additionally filtered by taking intersection with sets of its nearest neighbours of an equal size. This procedure removes 'long-range' links that spans across empty regions of the feature space while keeping most of the links within the clusters.
Further details of the algorithm in accordance with the present invention are provided in Example 8 below. - In accordance with this method of the invention, (an) alteration(s) in bacterial parameters and a lack or substantial lack of alteration(s) of host cell parameters in the presence of the test compound indicate that the compound is suitable as a lead compound for the treatment of tuberculosis. Alterations can for example be observed by comparing the host cell and bacterial parameters in the presence of the test compound with the corresponding host cell and bacterial parameters in the absence of the test compound.
- The key feature of this intracellular mycobacterial survival assay is the multiplicity and reliability of parameters capturing various features of bacteria and host at high resolution. Interestingly, most compounds in the selected hit cluster (M5) were not directly detrimental to mycobacteria. Although it cannot be ruled out completely that bacteria may be killed directly within infected cells, the inventors hypothesize - without wishing to be bound by theory - that the compounds act via activating the host's own defence mechanisms for the following reasons. First, the M5 cluster showed very little overlap with the compounds which act directly on bacteria. Second, the three selected compounds do not kill mycobacteria outside the host cell under the different conditions tested. Third, they show similar effects on uninfected cells. Fourth, the effect of Nortriptyline and PE can be reverted by inhibiting a host cellular process (autophagy). Fifth, Nortriptyline showed strong phenotypic correlation with a structural analogue, Amitriptyline, in mycobacteria as well as in the endocytosis and autophagy screens (
Figure 9F-I ). Sixth, Nortriptyline and PE enhance the acidity of lysosomes. This correlates with delivery of mycobacteria to lysosomes and their survival. Additionally, standard anti-mycobacterial drugs showed weaker phenotypes compared to the selected compounds. Most likely, this is because the assay as exemplified herein measures GFP fluorescence from mycobacteria that decays at different rates, depending on whether the host degradation machinery can be accelerated or not. In support of this, Rifampicin did not show enhanced lysosomal acidity. Thus, this screening platform has a bias for compounds that boost host defence mechanisms. Importantly, these data argue that such compounds are likely to be missed in a screen for anti-mycobacterial compounds outside the context of infected cells. - In a preferred embodiment of the method of the invention, the cells are infected with mycobacteria that express a fluorescent protein marker. Preferably, the fluorescent protein marker is green fluorescent protein (GFP).
- As is shown in the appended examples, using mycobacteria that express green fluorescent protein (GFP) render it easier to analyse and image bacterial parameters inside the cell.
- In a more preferred embodiment of the method of the invention, the bacterial parameters are selected from parameters related to the number of bacteria, parameters related to signal intensity of the bacteria and/or parameters related to the shape of the bacteria.
- Parameters related to the number of bacteria include, without being limiting:
- (i) number of bacteria within the infected cell (mean, median and/or mode),
- (ii) total number of bacteria per image,
- (iii) number of bacteria per cell (mean, median and/or mode),
- (iv) total number of bacteria in infected cells and
- (v) number of infected cells.
- The term "number of bacteria within the infected cell", as used herein, refers to the total number of bacteria that are present within one infected cell, and averaged over all the infected cells for a given condition.
- As used herein, the terms "mean, median and/or mode" refer to standard measures of central tendencies of a dataset, i.e. "average" values that are well known in the art. "Mean" refers to the arithmetic mean of a dataset, "median" refers to the value that divides the dataset into upper and lower halves, while "mode" is the most frequently occurring value in the dataset. In case of normal distribution of a parameter, the mean, median and mode coincide. However, this is not always the case. Parameter distributions are often skewed and have heavy tails. By using a combination of mean, median and mode, it is possible to summarize the main features of the distribution in a few values without making any assumption about distribution per se. For example, mode of the distribution provides information about the parameter value of the most abundant objects while mean and median reflect on different features of distribution. Accordingly, including all of mean, median and mode, rather than only mean, provides a better descriptive power for the entire distribution of the parameter. This allows describing more aspects, such as the possible presence of a second population of infected cells, or asymmetry in the distribution, long tails, etc.
The term "total number of bacteria per image", as used herein, is an absolute value that reflects the number of all bacteria identified in the image that is analysed, irrespective of the amount of host cells present. Only intracellular bacteria, i.e. bacteria found inside of host cells, are taken into consideration. - The term "number of bacteria per cell", as used herein, refers to the number of all bacteria in relation to the total number of host cells (infected and uninfected) present. Thus, whereas the measure "(i) number of bacteria within the infected cell" is an averaged measure of the number of bacteria in a single infected cells, the measure "(iii) number of bacteria per cell" is a measure of the overall number of bacteria in relation to the overall number of all host cells present, both infected and uninfected.
- As used herein, the term "total number of bacteria in infected cells" refers to an absolute value representing the number of all bacteria found in infected cells, i.e. without correlating said number to the number of host cells present (as done in (iii)) or the number of host cells infected (as done in (i)).
- The term "number of infected cells" refers to an absolute value representing the number of all infected cells within the image taken. Where several images are taken and analysed, the data obtained are combined.
- Parameters related to signal intensity of the bacteria include, without being limiting:
- (i) integral vesicle intensity of bacteria within infected cell,
- (ii) mean intensity (e.g. of the GFP signal in case of bacteria expressing GFP) (non-weighted median, weighted (intensity) and/or weighted (integral intensity)) and
- (iii) mean integral intensity (e.g. of the GFP signal in case of bacteria expressing GFP) (non-weighted median, weighted (intensity) and/or weighted (integral intensity)).
- Intensity-related parameters compute the average as well as integral intensity of bacteria within infected cells. Integral intensity is defined as the integral (the sum pixel by pixel) of the intensity calculated on the fitted object, such as for example an individual bacterium. The term "integral vesicle intensity of bacteria within infected cell", as used herein, refers to the integral intensity of bacteria within all infected cells, i.e. it is the sum of all individual integral intensities.
The term "mean intensity", as used herein, refers to the average intensity within each identified object (i.e., bacteria) while the term "mean integral intensity" refers to the mean value of integral (i.e sum) intensity within the same identified object (i.e individual bacteria).
The integral vesicle intensity of bacteria within infected cell is the total (i.e., sum) of all bacterial integral intensities, normalized by the area covered by cells. - The terms "weighted (intensity)" or "weighted (integral intensity)" refer to the fact that the respective parameter has been corrected for the factor recited in brackets, i.e. the term "mean integral intensity (weighted (integral intensity))" refers to the parameter "mean integral intensity", wherein the measured mean integral intensity has been adjusted by the integral intensity . These adjustments are well known in the art and can be carried out by the skilled person without further ado. For example, if a
certain parameter p is measured for two distinct bacteria, two measures (p1 and p2) are obtained. Two additional parameters are also measured for the same objects, the weighing parameters i1 and i2. In that case, the simple mean of the parameter p would be pavg = (p1 + p2) / 2, whereas the weighted mean would be pavg_w= (p1 * i1 + p2 * i2) / (i1 + i2). - Weighting can reveal important biological features: measuring the mean parameter value gives information about whole population behaviour, including both bright (presumably intact) and dim (presumably partially degraded) bacteria at the same time; parameter weighted by intensity give information mostly about brighter (and presumably) bacteria. This approach extracts more comprehensive description of the phenotype from the same biological assay.
- Parameters related to the shape of the bacteria include, without being limiting, the mean area, either non-weighted median, or weighted (intensity) and/or weighted (integral intensity).
- The term "mean area", as used herein with regard to the shape of bacteria refers to the area in square micrometres enclosed by the contour of the segmented object.
- In another preferred embodiment of the method of the invention, the host cell parameters are selected from parameters related to the morphology of the cell and/or parameters indicative of toxicity.
- Parameters related to the morphology of the host cell include, without being limiting:
- (i) area,
- (ii) compactness,
- (iii) dispersion,
- (iv) eccentricity,
- (v) solidity, and
- (vi) extent.
- The term "area", in this regard, relates to the average area of the host cells in square micrometers.
- As used herein, the term "compactness" relates to a measure of region non-smoothness, defined as the ration between the actual area and the area a circle with the same perimeter would have. Compactness is measured on the contour of the segmented host cell.
The term "segmented", as used herein, is a standard term used in the art. It refers to an image divided on segments, which correspond either to objects of interest or to the background. - The term "dispersion", as used herein, relates to a measure of region irregularity, defined as the ratio of the major chord length (maximum circle enclosing the region) to the area and is measured on the contour of the segmented host cell.
- The term "eccentricity", as used herein, is a measure of the elongation of the region, defined as:

- As used herein, the term "solidity" is a measure of segmented region tightness, defined as the ratio between the region area and the area of the convex hull of the same region. Solidity is measured on the contour of the segmented region which corresponds to the host cell..
- The term "extent", as used herein, is a measure of region extension defined as the ratio between the area of the minimal rectangle (bounding box) that encloses the region and the actual region area. Extent is measured on the contour of the segmented host cells.
- Parameters indicative of toxicity include, without being limiting:
- (i) nucleus size (median, median (weighted) and/or mean),
- (ii) number of nuclei, and
- (iii) number of cells.
- "Nucleus size", as used herein, relates to the average nuclei size in the image. Measurement of the size of nuclei is indicative of toxicity, since nuclear condensation is an initial signature of apoptotic cell death and a general sign of loss of cellular fitness (Galluzzi et al., 2009).
- As used herein, "number of nuclei" relates to the number of nuclei per image.
- "Number of cells", as used herein, relates to the number of cells per image. As all other parameters, this value is then averaged across all the images of the same experimental condition.
- These host cell parameters capture the dynamics of alterations in the host cell as a consequence of perturbation.
- Additionally, quality control and toxicity parameters are included. For example, "nuclei contrast" is used as a quality control parameter, as it estimates the correctness of focal position in the given image by measuring the difference in contrast between nuclear signal DAPI and nearby cytoplasmic pixels.
- A comprehensive description of several of these parameters is provided in
chapter 7 of the book "Feature Extraction & Image Processing for Computer Vision", Mark Nixon and Alberto S Aguado, ISBN: 978-0-12-396549-3 - Preferably, at least six bacterial parameters and at least one host cell parameter are analysed. The term "at least", as used herein, refers to the specifically recited amount or number but also to more than the specifically recited amount or number. For example, the term "at least six bacterial parameters" encompasses also at least 7, at least 8, at least 9, at least 10, at least 11, at least 12, at least 13, at least 14 parameters, such as at least 15, at least 16, at least 17, at least 18 parameters as well as all 19 bacterial parameters.
- In a particularly preferred embodiment of the method of the invention, the bacterial parameters comprise at least
- (i) number of bacteria per cell (mean);
- (ii) total number of bacteria (per image);
- (iii) integral vesicle intensity of bacteria within infected cell;
- (iv) mean intensity of bacteria (non-weighted median);
- (v) mean area of bacteria (non-weighted median); and
- (vi) number of infected cells;
- (a) number of cells.
- Even more preferably, all 19 bacterial parameters and all 11 host cell parameters recited herein above (and shown in Table 1) are analysed.
- As is shown in the appended examples, measuring different parameters gives a wealth of information related to bacteria as well as host cells in a high content screen, thereby describing the multiple facets of the biology of bacterial infection. Although one could consider only the integral intensity of bacteria within infected cell as a hallmark of infection, this would only be a very crude estimate of the intracellular bacteria status. It cannot distinguish between the possibilities where the bacteria are unchanged by perturbations from situations where the integral intensity of bacteria within the infected cell is unchanged, but the marker (GFP in the present examples) is distributed in many more, smaller objects. Hence, by considering several parameters, such as integral intensity of bacteria within infected cell, mean area, mean intensity and number of bacteria, or preferably the entire ensemble of bacterial parameters, one can better interpret the phenotype induced by perturbation. Moreover, since it is relevant to observe the effect on mycobacteria infection in the cellular context, it is also very important to monitor the status of the cell. In summary, using this approach, the multiple facets of phenotype space that are induced by the application of a test compound can be captured and compounds suitable for the intracellular targeting of bacterial infections can be identified.
- In a preferred embodiment, the method further comprises optimizing the pharmacological properties of the test compound identified as lead compound, thereby enabling the development of further modified and potentially improved compounds.
- The identified lead compounds may for example be optimized by modifying the compound to achieve: i) modified spectrum of activity, organ specificity, and/or ii) improved potency, and/or iii) decreased toxicity (improved therapeutic index), and/or iv) decreased side effects, and/or v) modified onset of therapeutic action, duration of effect, and/or vi) modified pharmacokinetic parameters (resorption, distribution, metabolism and excretion), and/or vii) modified physico-chemical parameters (solubility, hygroscopicity, colour, taste, odour, stability, state), and/or viii) improved general specificity, organ/tissue specificity, and/or ix) optimised application form and route by (a) esterification of carboxyl groups, or (b) esterification of hydroxyl groups with carboxylic acids, or (c) esterification of hydroxyl groups to, e.g. phosphates, pyrophosphates or sulfates or hemi-succinates, or (d) formation of pharmaceutically acceptable salts, or (e) formation of pharmaceutically acceptable complexes, or (f) synthesis of pharmacologically active polymers, or (g) introduction of hydrophilic moieties, or (h) introduction/exchange of substituents on aromates or side chains, change of substituent pattern, or (i) modification by introduction of isosteric or bioisosteric moieties, or (j) synthesis of homologous compounds, or (k) introduction of branched side chains, or (I) conversion of alkyl substituents to cyclic analogues, or (m) derivatisation of hydroxyl groups to ketales, acetales, or (n) N-acetylation to amides, phenylcarbamates, or (o) synthesis of Mannich bases, imines, or (p) transformation of ketones or aldehydes to Schiff's bases, oximes, acetales, ketales, enolesters, oxazolidines, thiazolidines or combinations thereof.
- The various steps recited above are generally known in the art. They include or rely on quantitative structure-action relationship (QSAR) analyses (Kubinyi, "Hausch-Analysis and Related Approaches", VCH Verlag, Weinheim, 1992), combinatorial biochemistry, classical chemistry and others (see, for example, Holzgrabe and Bechtold, Deutsche Apotheker Zeitung 140(8), 813-823, 2000).
- The present invention further relates to a method of identifying the cellular pathway targeted by a test compound, the method comprising
- (a) treating a cell with the test compound and obtaining a multi-parametric phenotypic profile of the cell after said treatment;
- (b) providing a phenotypic profile obtained for the same cell type by introducing directed genetic perturbations to target genes of said cell;
- (c) comparing the multi-parametric phenotypic profile obtained in (a) with the phenotypic profile provided in (b) and identifying the genes whose perturbation leads to an identical or substantially identical phenotypic profile as the test compound; and
- (d) identifying the cellular pathways involving the genes identified in (c).
- In accordance with this method of the invention, the cellular pathway that is targeted by a test compound is identified. Accordingly, it is investigated which intracellular pathway(s) is/are affected in the presence of the test compound. The test compound may be any test compound, such as the test compounds defined herein above. Moreover, the test compound may be a compound identified by a method of the present invention of identifying a lead compound for the treatment of tuberculosis.
- In a first step of this method of the invention, a cell is treated with the test compound and a multi-parametric phenotypic profile of the cell after said treatment is obtained.
Typically, the cell is simply contacted with the compound, which then either exerts its effects via binding and/or activation of surface molecules, such as e.g. receptors, or is internalised into the cell, for example by active transport through the cell membrane or endocytosis. However, it will be appreciated that the compound may also be introduced directly into the cell, such as e.g. by micro-injection. - The cell, in accordance with this method, may be any cell typically employed in research, such as e.g. prokaryotic or eukaryotic cells, including the cells defined herein above with regard to the method of obtaining a multi-parametric phenotypic profile of a cell infected with mycobacteria. Additionally, suitable prokaryotic cells comprise e.g. bacteria of the species Escherichia, Bacillus, Streptomyces and Salmonella typhimurium and Mycobacteria sp. Suitable eukaryotic cells are e.g. fungal cells, inter alia, yeasts such as Saccharomyces cerevisiae or Pichia pastoris or insect cells such as Drosophila S2 and Spodoptera Sf9 cells and plant cells as well as mammalian cells. Appropriate culture media and conditions for the above-described cells are known in the art. Mammalian cells that could be used include, human HeLa, HEK293, H9 and Jurkat cells, mouse NIH3T3 and C127 cells,
Cos 1,Cos 7 and CV1, quail QC1-3 cells, mouse L cells and Chinese hamster ovary (CHO) cells. Also within the scope of the present invention are primary cells or primary cell lines. Primary cells are cells which are directly obtained from an organism. Suitable primary cells are, for example, human primary monocytes, human primary monocyte derived macrophages, mouse bone marrow macrophages, mouse peritoneal macrophages, mouse embryonic fibroblasts (MEF), mouse primary hepatocytes, cardiomyocytes and neuronal cells as well as mouse muscle stem cells (satellite cells) and stable, immortalized cell lines derived thereof. Preferably, the cells are human HeLa cells. - The multi-parametric phenotypic profile may be a profile of the entire cell or of specific cellular compartments or pathways. Multi-parametric phenotypic profiles and methods of obtaining same are well known in the art, as described herein above.
- One exemplary method of obtaining a multi-parametric phenotypic profile of a cell is described in detail herein above for the phenotypic profile of a cell infected with mycobacteria. Accordingly, all of the definitions and preferred embodiments recited herein above with regard to said method of obtaining a multi-parametric phenotypic profile of a cell apply mutatis mutandis also to this method of the invention. An alternative method of obtaining a multi-parametric phenotypic profile of a cell is shown in Example 4 below, where the effect of the tested compounds on endocytosis was analysed. In short, the cells of interest, such as e.g. HeLa cells, are pre-treated with the test compounds prior to the internalization of fluorescently-labelled marker suitable to show the effect of the test compound on the cellular function to be analysed. In this example, the effect of the test compounds on endocytosis was analysed and, thus, the fluorescently-labelled markers were epidermal growth factor (EGF) and Transferrin (Tfn), which are known to be internalised in these cells by endocytosis.
- The multi-parametric profile may encompass any cellular parameters of interest, such as e.g. the host cellular parameters recited herein above. Moreover, pathway-specific parameters can be analysed, such as e.g. the parameters shown in Table 3 below for endocytosis and autophagy pathways.
- The multi-parametric phenotypic profile of the cell after treatment with a test compound is then compared to a phenotypic profile obtained for the same cell type by introducing directed genetic perturbations to target genes of said cell.
- Means and methods of introducing genetic perturbations to target genes of cells are well known in the art and include, without being limiting, the use of interfering nucleic acid molecule (RNAi) such as e.g. siRNA or miRNA as well as the targeted inactivation by methods such as homologous recombination, gene trapping or transposon-mediated mutagenesis. Such a phenotypic profile obtained by genetic perturbations of target genes can be established by the skilled person without further ado, for example as described in Collinet et al. 2010. Moreover, previously established data or published results of such phenotypic profiles obtained by genetic perturbations of target genes can be relied on.
- The term "same cell type", as used herein, refers to a cell being of the same origin as the cell of step (a) and that is - prior to treatment with any compounds, i.e. under normal culture conditions - identical in its phenotypic characteristics to the cell of (a). Furthermore, this term also encompasses cell populations, such as for example homogenous cell populations consisting of cells having identical characteristics, and, thus, is not restricted to single cell analyses.
- By comparison of the multi-parametric phenotypic profile obtained in the first step with the phenotypic profile obtained by genetic perturbations of target genes in the same cell type it is possible to identify those phenotypes that are identical or substantially identical in both data sets.
- The term "substantially identical" relates to phenotypes that are not identical (i.e. do not correspond to each other to 100%) but do not differ significantly from each other. In order to determine whether two profiles are substantially identical, any known statistical approach may be employed. For example, the p-value of the null-hypothesis that the two profiles are the result of the same perturbation can be calculated. Means and methods for calculating the p-value are well known in the art. For example, if the number of parameters is higher than 10 and the measured correlation is below 0.9, then the chi-square approximation can be used for p-value calculation. In those cases where the number of parameters is less than 10 and/or for very high correlation (i.e. above 0.9), the calculation for the p-value can be done as for example described in the classical works of Fisher (see e.g. R. Fisher, "On the probable error of correlation coefficient deduced from a small sample set," Metron, v.1, pp.3-32 (1921) and (R. Fisher, "Frequency Distribution of the Values of the Correlation Coefficient in Samples from an Indefinitely Large Population," Biometrika, v.10(4), pp.507-521 (1915)).
- Means and methods of comparing the phenotypic profiles in step (c) include, without being limiting, automated comparison e.g. using a computer program. For example, profiles can be treated as vectors in multi-dimensional space and measure of similarity could be a cosine of angle between them. This cosine is equivalent to non-centred correlation of profiles. Another possible measure of phenotype similarity could be as described in Mahalanobis Distance (Mahalanobis, P. C. "On the generalised distance in statistics". Proceedings of the National Institute of Sciences of India 2 (1): 49-55 (1936), http://en.wikipedia.org/wiki/Mahalanobis_distance). The procedures for such computation are included in MatLab, R, and other standard mathematical and statistical packages.
- Based on the thus identified identical (or substantially identical) phenotypes, it can then be analysed which genetic perturbations led to the said phenotype. The gene products affected by these genetic perturbations can then be analysed for their involvement in cellular pathways, for example based on KEGG pathways and GO terms as described in Example 4 below. These pathways are well known in the art.
- In accordance with the present invention, an integrated experimental and computational pipeline was developed to compare the multi-parametric profiles from the screen of the pharmacologically active compounds with the profiles from a previously established genome-wide siRNA screen for endocytosis (Collinet et al., 2010) to identify the cellular mechanisms underlying the anti-bacterial activities of the compounds identified herein. As is shown in the appended examples, the predictions derived from said comparison on the three selected compounds could be verified and it was established that two of them modulate autophagy by distinct mechanisms and the third one accelerates endocytic trafficking. These results demonstrate that trafficking pathways can be modulated pharmacologically to stimulate intracellular mycobacteria killing.
- Whereas cell-based high-content screens have several advantages over traditional target-based high-throughput screens, understanding the mechanism of action of the identified compounds is a critical bottleneck (Swinney and Anthony, 2011). One possible approach is to identify genes that when silenced produce a phenotype similar to that of small inhibitory molecules (Eggert et al., 2004). However, there are significant caveats to this approach: For example, small molecules usually act rapidly whereas the RNAi effect is gradual and requires longer times, possibly allowing the system to adapt to a new steady-state. Moreover, the biological activity of small molecules may result from the modulation of multiple target molecules (Imming et al., 2006) rather than specific targets as in RNAi, although these may be contaminated by off-target effects. Although it was considered difficult to identify targets of small molecules by comparing the phenotypic profiles of chemicals and silenced genes, this approach nevertheless allowed the identification of the cellular pathways targeted by small molecules. Accordingly, as shown in the appended examples, phenotypes were captured through QMPIA and, by integrating chemical and functional genomics datasets (Collinet et al., 2010), hit compounds of the mycobacteria screen described above were differentiated into distinct groups on the basis of their phenotypes on endocytosis. Using this strategy, it was shown both computationally and experimentally that one of the groups is significantly enriched for modulators of autophagy, a well known anti-mycobacterial cell defence mechanism (Gutierrez et al., 2004; Kumar et al., 2010). Remarkably, autophagy phenotypes were thus identified using a general endocytosis assay.
- Nortriptyline and PE influence autophagy differently. Whereas Nortriptyline induces the formation of autophagosomes, PE slows down autophagic flux. The basal rate of autophagy may be sufficient to accumulate autophagosomes in the presence of PE. These autophagosomes progressively acidify over time and become competent for Mycobacteria degradation (Ponpuak et al., 2010). PE may act at different stages, e.g. on the fusion with lysosomes.
- The identification of Haloperidol as anti-mycobacterial compound provides proof of principle for the pharmacological modulation of endocytic trafficking as a means of boosting the host defence system to clear intracellular pathogens. Most importantly, these data imply that such an approach is feasible without inducing overt toxicity to cells. Haloperidol leads to faster degradation of cargo by accelerating transport from early to late endocytic compartments. Previous work has identified both general design principles and molecular details of the machinery underlying endosome biogenesis and progression that are relevant to the pharmacological properties of Haloperidol. First, transport of cargo along the degradative route (LDL) entails a conversion from Rab5- to Rab7-positive endosomes (Rink et al., 2005). Such conversion is based on a cut-out switch (Del Conte-Zerial et al., 2008) that requires the endosomal levels of Rab5 to pass a threshold value prior to triggering a feedback loop causing its removal and substitution with Rab7. Second, the inventors' recent systems survey on endocytosis has revealed that the centripetal movement of endosomes previously observed by quantitative live cell imaging (Rink et al., 2005) is a master parameter that regulates several other properties of the early endosome network, including cargo progression (Collinet et al., 2010). Mycobacterium interferes with such a switch, keeping the phagosome in an arrested state. Remarkably, Haloperidol exerts a positive influence on both centripetal movement of endosomes and membrane recruitment of the Rab5 machinery. By shifting the molecular composition of the mycobacterial phagosome, Haloperidol counteracts the fine balance between phagosome activity and maturation arrest, restoring its maturation. Thus, relatively subtle alterations in the general endocytic trafficking machinery are sufficient to cause dramatic effects on intracellular mycobacterial survival.
- In a preferred embodiment of the method of the invention of identifying the cellular pathway targeted by a test compound, step (a) further comprises introducing into the cell a detectable marker probe. Detectable marker probes which can be used in the context of the invention are not particularly limited, and have been defined herein above. In a preferred embodiment of the method of the invention, the detectable marker probe is a compound labelled with a fluorescent dye, as defined herein above. For example, for the study of endocytosis as shown in the appended examples, the detectable marker probe may be selected from e.g. fluorescently labelled epidermal growth factor (EGF), transferrin or Low density lipoprotein (LDL).
- Means and methods for introducing a detectable marker probe into the cell are well known in the art and have been described herein above.
- In a preferred embodiment of the method of the invention of identifying the cellular pathway targeted by a test compound, the directed genetic perturbations to target genes of the cell are introduced by use of RNAi. Even more preferred is that the directed genetic perturbations to target genes of the cell are introduced by use of siRNA.
- In a more preferred embodiment, the RNAi-mediated genetic perturbation is a genome-wide endocytosis RNAi screen. More preferably, the RNAi-mediated genetic perturbation is a genome-wide RNAi screen, wherein RNAi directed to each gene is introduced individually.
- In a preferred embodiment of the methods of the present invention, the method is carried out as a high-content assay.
- High-content assays, generally may be performed in wells of microtiter plates, wherein each plate may contain, for example 96, 384 or 1536 wells. Handling of the plates, including incubation at temperatures other than ambient temperature, and bringing into contact of test compounds with the assay mixture is preferably affected by one or more computer-controlled robotic systems including pipetting devices. Where large libraries of test compounds are to be screened and/or screening is to be effected within short time, mixtures of, for example about or exactly 10, 20, 30, 40, 50 or 100 test compounds may be added to each well. In case a well exhibits biological activity, said mixture of test compounds may be de-convoluted to identify the one or more test compounds in said mixture giving rise to the observed biological activity.
- As regards the embodiments characterized in this specification, in particular in the claims, it is intended that each embodiment mentioned in a dependent claim is combined with each embodiment of each claim (independent or dependent) said dependent claim depends from. For example, in case of an
independent claim 1 reciting 3 alternatives A, B and C, adependent claim 2 reciting 3 alternatives D, E and F and aclaim 3 depending fromclaims - Similarly, and also in those cases where independent and/or dependent claims do not recite alternatives, it is understood that if dependent claims refer back to a plurality of preceding claims, any combination of subject-matter covered thereby is considered to be explicitly disclosed. For example, in case of an
independent claim 1, adependent claim 2 referring back toclaim 1, and adependent claim 3 referring back to bothclaims claims claims dependent claim 4 is present which refers to any one ofclaims 1 to 3, it follows that the combination of the subject-matter ofclaims claims claims claims - The figures show:
-
Figure 1 : High-content image-based screen for intracellular mycobacteria survival- A. Flowchart of the experimental and computational pipeline used in this study.
- B. a) Representative example of a human primary monocyte-derived macrophage infected with M. bovis BCG-GFP with cell contours (dashed line); b) Segmentation of macrophage: intensity distribution of nuclear and cytoplasmic regions used to draw the contours of the cell; c) Segmentation of bacteria: intensity distribution of bacteria in the region marked in the green square used for fitting the bacteria model;
- C. Heat map representation of the mycobacteria high-content chemical screen after clustering. Rows denote cluster IDs and number of compounds. Columns are parameters of the high-content assay (see also Table 1, and experimental procedures). M5 is the cluster analyzed in this study;
- D. Representative images from clusters M1-6.
-
Figure 2 : Validation of three selected compounds for intracellular mycobacterial survival- A-D. Representative images of infected cells treated with DMSO (A), Nortriptyline (B), Prochlorperazine edisylate (PE) (C) and Haloperidol (D) at a concentration of 10 µM for 48 hours after infection. Arrowheads indicate GFP-positive structures that are identified as 'bacteria' by the QMPIA. Scale bar=10 µm.
- E. Quantitative multi-parametric profiles of the phenotypes in A-D with the Z score (y-axis) of the parameters (1-30, Table 1) showing e.g. decrease in number and intensity of intracellular mycobacteria. Error bars represent SEM.
- F. CFU analysis of human primary monocyte-derived macrophages infected with virulent M. tuberculosis H37Rv and two different clinical isolates CS1 and CS2 and treated with the indicated compounds for 48 hrs (pooled data from two independent biological replicates with three technical replicates each). Error bars represent SD. D (DMSO 0.01%), Rf (Rifampin 2µM), Rp (Rapamycin, 5.5µM), PE (Prochlorperazine edisylate, 10µM), N (Nortriptyline, 10µM), H (Haloperidol, 10µM), H89 (H89, 10µM). p-values for all compounds tested (except H89) were < 0.0001 and < 0.01, for H37Rv and the two clinical strains, respectively.
- G. Colocalization of M. bovis BCG-GFP and LBPA in cells treated with the indicated drugs. Number of cells analyzed per condition is indicated. Error bars are SEM. Data are representative of at least two independent experiments. Abbreviations and concentrations are as in F.
-
Figure 3 : Integration of chemical and RNAi screen data-sets.- A. Scheme illustrating the integration of the primary chemical (left) and RNAi (right) screen data-sets via an intermediate screen on the chemicals from cluster M5.
- B. and C. Endocytosis (B) and autophagy (C) profiles of sub-clusters E1 and E2 from cluster M5. The profiles are average representations of Z scores of the individual compounds within each sub-cluster. Parameters are grouped into different phenotype classes (Table 3).
- D. to E. Dose response curves of mean integral intensities of M. bovis BCG-GFP (dark gray) and LC3 (light gray) for Nortryptyline (D) and Prochlorperazine edisylate (E). Error bars are SEM, number of images =25, data representative of at least two independent experiments.
- F. Summary of IC50 values calculated from curves D and E.
-
Figure 4 : Ultrastructural analysis of autophagy and intracellular mycobacterial survival.- A. to C. Electron micrographs of M. bovis BCG-GFP infected human primary monocyte-derived macrophages treated with DMSO (A), 10 µM N (B) or PE (C) for four hr. Black arrows indicate mycobacterial phagosomes, black and white arrowheads indicate autophagosomes with and without mycobacteria, respectively. Mitochondria (Mi), nucleus (Nuc), mycobacterial phagosome (MP), autophagosomes (AP), mycobacteria containing autophagosome (MAP).
- D. to F. Quantification of the number of autophagosomes (D) (n=30), autophagosome area as % of total cell area (E) and total cell area (F) (n=6) from the electron micrographs. D (DMSO, 0.01%), N (Nortriptyline, 10µM), PE (Prochlorperazine edisylate, 10 µM). Numbers denote p values in comparison to DMSO.
-
Figure 5 : Nortriptyline and PE modulate autophagy differently- A. Representative images of HeLa cells stably expressing mRFP- GFP-LC3 treated with the indicated chemicals for 2 hr. DAPI/CMB denotes the cell nucleus and cytoplasm. Scale bar=10 µm.
- B. Quantification of co-localization between the mRFP and GFP signals. The number of cells analyzed per condition is indicated. Results are representative of four experiments. Error bars are SEM. Abbreviations and concentrations as in A.
- C. and D. Quantification of integral intensity of lysotracker red-labeled vesicles (LTR) (C), and M. bovis BCG-GFP (D) in infected human primary macrophages treated with either DMSO or PE (10µM) for the indicated periods of time. Total and bacterial LTR refer to integral intensity of all acidic compartments and those containing bacteria, respectively. Data are averaged from 45 images/condition/time point and normalized to DMSO to represent fold change (representative of two independent experiments).
- E. Co-localisation between the mRFP and GFP signals in HeLa cells stably expressing mRFP-GFP-LC3 treated with the indicated drugs for different periods of time. Co-localization at a single threshold of 0.35 was used to generate the time response curves. Data are from 50 images per condition and aggregated from 4 experiments. For A, B and E, D (DMSO, 0.01 %); Hb (HBSS); N (Nortriptyline,10µM); ChQ (Chloroquine, 25 µM); Baf (BafilomycinA1,100nM); PE (10 µM).
- F. Mean integral intensity of M. bovis BCG-GFP upon treatment of infected human primary macrophages with different concentrations of IFN-γ for 4 hr prior to treatment with either 1µM or 10µM N or PE, for 48 hr. Significance was calculated by Student's t-test. NS p>0.05, *p<0.05, **p< 0.001,
- ***p<0.0001. Data are averaged from 16 images/condition and representative of 4 experiments. For B-F, error bars indicate SEM.
-
Figure 6 : Analysis of endocytosis trafficking by Haloperidol- A. and B. The kinetics of endocytic trafficking were quantified using a cell-based LDL trafficking assay. (A) Integral intensity of LDL in early endosomes and (B) late endosomes. Values are H treatment (10µM) subtracted from DMSO and derived from an average of 1200 cells/time point. Error bars are SEM of number of images (average of 40 per condition). Data are representative of two experiments.
- C. and D. A431 cells stably expressing Rab5-GFP were treated with either DMSO or H (10µM) for 2 hr and imaged live. Velocities of minus-end (towards cell centre) (C) and plus end-directed movement (away from cell centre) are shown for DMSO- (black line) and H-treated cells (grayline). For curves in B to D, the p value is for points denoted by asterisks (see Experimental Procedures). For C and D, error bars are standard deviations, n=37 (DMSO), n=29 (H).
- E. Mean square displacement curves for the movies (
Figures 6C, D ) were computed as described in Experimental Procedures. The second part of the bi-phasic curve indicating long time-scale movements was fitted using linear least square fit. Diffusion coefficient is derived from the slope of the fitted curves.
-
Figure 7 : Haloperidol induces alterations in intracellular mycobacterial trafficking- A. and C. Representative images of M. bovis BCG-GFP-infected human primary macrophages treated with 10µM H for the indicated times and immunostained for EEA1 (A) and LBPA (C). The outline of infected cells is shown in dashed lines. Scale bar=10µm. The presence of EEA1 and LBPA on mycobacterial phagosome, as indicated by arrows and arrowheads (at 20 min) respectively, is mutually exclusive.
- B. and D. Quantification of colocalization of M. bovis BCG-GFP with EEA1 (B) and LBPA (D). A stringency threshold of 0.35 was used. Data are averaged from about 1000 infected cells and are representative of at least two independent experiments. Error bars are SEM. The p value denotes significance for the consecutive points of the time series denoted by asterisks (see Experimental Procedures).
-
Figure 8 : Robustness of intracellular mycobacterial assay, enrichment analysis and standard anti-mycobacterial drugs in mycobacteria high content assay- A. Robustness of intracellular mycobacterial assay: Pearson correlation coefficients for the parameters were computed between the biological and technical replicates of human primary monocyte derived macrophages that were infected with M. bovis BCG-GFP and screened with MSD spectrum chemical library. Multiple parameters were extracted as described.
- B. Enrichment analysis: The MSD spectrum library collection is functionally annotated by the supplier (see the World Wide Web at msdiscovery.com/spectrum.html). These compounds were manually curated further to remove redundancies and to have uniform functional descriptors. Functional enrichment analysis of compounds from MSD spectrum chemical library was performed on the whole library as well as hits from the alamar blue screen and cluster M5 from the mycobacteria high content screen. The various functional categories are indicated in shades of grey in the chart. While compounds annotated as 'antibacterial' are represented by 11 % of the library compounds, they are enriched to 44.7 % in the hit list of Alamar blue screen. However, the mycobacteria cluster M5 showed a representation of only 5%.
- C. to F. Standard anti-mycobacterial drugs in mycobacteria high content assay: Human primary monocyte derived macrophages were infected with M. bovis BCG and treated with the indicated compounds for the specified periods of time. Images were analyzed as described earlier. Quantification of integral intensity of mycobacteria (C), colocalisation of mycobacteria with lysosomes, (D), integral intensity of lysosomes that contain mycobacteria (E) and integral intensity of total cellular lysosomes (F). For all the graphs (C-F), data are scaled to indicate fold change over DMSO at each time point. Data are average from 45 images per condition per time point and representative of two independent experiments. For panels C-F, the concentrations used: DMSO, 0.01%, Nortriptyline, 10 µM, Rifampin, 10 µM.
-
Figure 9 : Bacterial morphological parameters are indicative of intracellular 'fitness', effect of selected compounds on extracellular mycobacterial growth, quantitative colocalisation scoring and host correlates of structural analogues of selected hit compounds- A. Bacterial morphological parameters are indicative of intracellular 'fitness': The three selected hit compounds from the mycobacteria high content screen were analyzed for additional parameters reporting morphological features of bacteria (Table 3). Error bars are standard errors of measurement from an average of 20 images per condition.
- B. and C. Effect of selected compounds on extracellular mycobacterial growth:
- B. M. bovis BCG-GFP was grown in 7H9 liquid medium in the presence of indicated compounds (10 µM) and bacterial growth was monitored over time by measurement of OD600. Amikacin (200 µg/ml) was used as a positive control. The error bars are SD (n=6) and the results are representative of three experiments.
- C. M. bovis BCG-GFP was grown in liquid medium with different pH and incubated with indicated drugs at 10 µM concentration for 48 hours, followed by alamar blue assay. Error bars are SD of quadruplicate measurement and data representative of four experiments.
- D. and E. Scoring colocalisation quantitatively: Human primary monocyte derived macrophages were infected with M. bovis BCG-GFP and stained with lysotracker red. Mycobacteria and lysosomal objects were segmented as described. Typically, cells show a range of co-localisation between M. bovis BCG-GFP and lysotracker red, from complete non-colocalisation (A), partial colocalisation (B) to complete colocalisation (C). Quantitative co-localisaiton profiles of the individual cells (A, B or C) are shown in the colocalisation curve (D). The colocalisation coefficient shows stable results and a correct hierarchy over a wide range of colocalisation threshold. Typically, threshold values from 0.4 to 0.6 are considered in the analysis.
- F. to I. Host correlates of structural analogues of selected hit compounds:
- F. Structures of Nortriptyline and a similar compound, Amitriptyline, which was also represented in cluster M5 from mycobacterial high content screen.
- G. to I. Quantitative multi-parametric profiles of Nortriptyline (light gray) and Amitriptyline (dark gray) in mycobacteria (G), endocytosis (H) and autophagy (I) assays. Profiles are generated from high content data from the respective screens. See Tables 1 and 3 for description of parameters used in the different screens. Structural similarity was assessed by setting a Tanimoto distance threshold of 0.9 between compounds.
-
Figure 10 : Correlations between mycobacteria inhibition phenotype with autophagy parameters, Autophagy response of compounds validated for intracellular mycobacterial killing and Validation for autophagy in human primary macrophages- A. Correlations between mycobacteria inhibition phenotype with autophagy parameters:
- For the compounds in the endocytosis clusters, E1 and E2, the Pearson correlation coefficient was computed between the strength of the phenotype in the mycobacteria infection assay with three main autophagy parameters. The strength of the mycobacteria phenotype, which was calculated as an Euclidian length of the profile, showed a significant positive correlation to the autophagy parameters for E1, but not E2, cluster. This is consistent with the bioinformatics prediction that the compounds in E1 act predominantly by modulating autophagy. Absence of significant correlation to the number of cells indicates that mycobacteria inhibition is not result of cytotoxicity. p-values were computed using Fisher's z-transform.
- B. and C. Autophagy response of compounds validated for intracellular mycobacterial killing:
- B. Representative images from the autophagy screen showing HeLa cells treated with either controls for autophagy induction (Rapamycin, starvation induced by HBSS) or the compounds validated for intracellular killing of mycobacteria. Scale bar= 10 µm.
- C. Quantification of mean integral intensity of LC3 vesicles from the high content screen for the compounds indicated. Data are represented as Z scores with DMSO as negative control. Error bars represent SEM. 25 images per condition are used. For A and B, Rapamycin was used at 5.5 µM and the other compounds were used at 10µM.
- D. and E. Validation for autophagy in human primary macrophages:
- D. Human primary monocyte derived macrophages were treated with the indicated compounds for four hours and immunostained for LC3. Scale bar is 10µm.
- E. Quantification of the images as described earlier. Number and integral intensity of LC3 vesicles increase significantly with the addition of Nortryptiline and Prochloreperazine edisylate. The increase in LC3 intensity is specific to the vesicular population since the total cellular intensity of LC3 remains similar. The drugs are not toxic to cells at this concentration as seen in the stability of total cell numbers. The data are normalized to maximum value of each condition to bring them to the same scale. Error bars are SEMs. For panels B and D, Rapamycin was used at 5.5 µM, Nortriptyline and PE were used at 10µM.
- A. Correlations between mycobacteria inhibition phenotype with autophagy parameters:
-
Figure 11 : EM for Haloperidol and effect of autophagy inhibitor 3-MA on action of Nortriptyline and PE- A. EM for Haloperidol: Human primary macrophages were infected with M. bovis BCG-GFP and treated with Haloperidol (10µM) for 4 hours and processed for electron microscopy as described in methods. The images shown are representative of two independent experiments. Abbreviations: Nucleus (Nuc), mitochondria (Mi), lysosome (Ly), Mycobacterial phagosome (MP). Black arrow indicates mycobacterial phagosome and arrow head denotes phagosomal membrane.
- B. to D. Effect of autophagy inhibitor 3-MA on action of Nortriptyline and PE: Human primary monocyte derived macrophages were infected with M. bovis BCG-GFP and treated with Nortriptyline (10µM) and Prochlorperazine edisylate (5µM) in the presence of 3-MA (10mM) for four hours and processed for electron microscopy, as described in methods. The images are representative of two independent experiments. Black arrow heads indicate mycobacterial phagosomal membrane. Abbreviations used: MP (Mycobacterial phagosome), Mi (Mitochondira), Nu (Nucleus).
-
Figure 12 : Autophagy flux analysis, Colocalisation of autophagosomes with late endosomal marker LBPA and Effect of standard autophagy flux inhibitors on intracellular mycobacterial survival- A. Autophagy flux analysis:
- A. HeLa LC3-GFP BAC was treated with Nortriptyline (N) or Prochlorperazine edisylate (PE) in the presence or absence of BafilomycinA1 (Baf). DMSO (D) was used as negative control. Cells were lysed and immunoblotted for LC3. Tubulin was used as loading control. Result is representative of at least four independent experiments.
- B. Representative images from HeLa LC3-GFP BAC cells treated with Nortriptyline (N), Prochlorperazine edisylate (PE) or starvation induced (HBSS) with or without Chloroquine (ChQ) and BafilomycinA1 (Baf) for 4 hours, fixed and imaged using automated confocal microscopy. Scale bar=10 µm.
- C. Quantitation of autophagosome mean integral intensity for indicated conditions. Results are mean +/-SEM. (60 images per condition). Data are representative of two independent experiments.
For A, B and C, concentrations of compounds used were: DMSO, 0.01%, Nortriptyline, 10 µM, Prochlorperazine edisylate, 10 µM, Chloroquine, 25 µM and BafilomycinA1, 100nM. - D. Colocalisation of autophagosomes with late endosomal marker LBPA: HeLa LC3-GFP BAC cells were treated with the indicated drugs for 4 hrs and immunostained for LBPA. Colocalisation of LC3-GFP with LBPA were quantified over a range of colocalisation thresholds, as described in methods. Number of cells per condition is given in parenthesis. Error bars are SEM. Data are representative of two independent experiments. PE (Prochlorperazine edisylate, 10 µM), Baf (BafilomycinA1, 100nM), N (Nortriptyline, 10µM), D (DMSO, 0.01%), HBSS (Hans Balanced Salt Solution).
- E. Effect of standard autophagy flux inhibitors on intracellular mycobacterial survival: Human monocyte derived macrophages were infected with M. bovis BCG-GFP and treated with the indicated compounds for 48 hours. Cells were fixed, imaged and analyzed as described. Data are normalized to DMSO. Numbers above the bar graphs indicate p-values for the compounds. Data are aggregated from 60 images per condition and are representative of at least three experiments. Abbreviations and concentrations used are: D (DMSO, 0.01%), Am (Ammonium chloride, 10mM), Baf (Bafilomycin A1, 100nM), ChQ (Chloroquine, 25µM), LeuP (Leupeptin, 10µM), PE (Prochlorperazine edisylate, 10µM), N (Nortriptyline, 10µM).
- F. Human primary macrophages were infected with M. bovis BCG-GFP, treated with the indicated chemicals for 48 hours and stained for the acidotropic marker Lysotracker red. Co-localisation of M. bovis BCG-GFP with lysotracker red was quantified over a range of thresholds. Numbers in parenthesis indicate the number of infected cells analyzed. Data are representative of at least three independent experiments. Abbreviations and concentrations used PE (Prochlorperazine edisylate, 10 µM).
- A. Autophagy flux analysis:
-
Figure 13 : Schematic of LDL trafficking assay and Additional parameters for LDL trafficking assay- A. Schematic of LDL trafficking assay: HeLa-Rab5c-GFP-BAC cells were pre-treated with Haloperidol and pulsed with LDL for various times. Cells were then immunostained with ApoB and LBPA to visualize the cargo (LDL) and the compartment (late endosomes, lysosomes) respectively. Vesicles containing LDL and Rab5 but not LBPA were considered early endosomes, while vesicles containing LDL and LBPA but not Rab5 represented late endosomes in the following analysis.
- B. to G. Additional parameters for LDL trafficking assay: HeLa Rab5c-GFP-BAC cells were pretreated with 10 µM Haloperidol and pulsed with LDL for various times and various parameters such as number (B,C), size (D,E) and distance to center (F,G) calculated for LDL containing early (dark gray curves) and late endosomes (light gray curves). Curves are represented as values for Haloperidol treated cells subtracted from DMSO. All parameters show significant increase in late, but not early, endosomes showing that trafficking of LDL containing endosomes is accelerated along degradative pathway by Haloperidol. Values are derived from an average of 1200 cells per condition. Error bars are standard deviations of number of images (average of 40 per condition). Data are representative of two experiments. The p value indicating significance is calculated for the time series as indicated in supplementary methods. Asterisks indicate the consecutive points used to calculate p value.
- The examples illustrate the invention:
- Human primary monocyte-derived macrophages were infected with M. bovis BCG-GFP for 1 hr at MOI of 1:10, washed extensively (Biotec EL406). After adding the compounds (10µM) (Beckman Fxp automatic workstation), cells were incubated for 48 hr, fixed with 3.7% PFA (Sigma), stained with 1µg/ml DAPI, 3µg/ml Cell Mask Blue (Invitrogen) and imaged using the automated spinning disk confocal Opera (Perkin Elmer).
- Cells : Buffy coats were purchased from German Red Cross. Human primary monocytes were isolated from pooled buffy coats (3-4 donors per pool), seeded directly on assay plates (384 well, Greiner microclear) at a cell density of 15,000 per well and allowed to differentiate to macrophages by addition of 50 ng/ml hMCSF (peprotech). Media was exchanged after 3 days. Infection was done after 6 days. Imaging: Plates were sealed with aluminium tape and imaged using automated spinning disc confocal Opera (Evotec) with a 40x, 0.9 NA water objective. 30 images from each well (randomized intra well positions) were acquired in two channels with excitation filter at 405nm for host cell detection (DAPI/CMB) and 488nm to detect M. bovis BCG-GFP. Different cameras were used to image the different channels thus ensuring no bleed through of signals.
Image analysis: To correct for chromatic shifts due to the different cameras used, multi-colour beads were acquired with identical settings in each imaging session and were used to determine the correction factor for XY shift (Collinet et al. 2010). Chromatic and Illumination shift corrected images were then used for further analysis in a two step process. First, host cell nuclei and bacteria were identified from the images as described in Collinet et al.. Additionally, host cell boundaries were determined based on Cell Mask Blue staining by a watershed-based region growing algorithm (Parvati 2008; Roerdink 2000). Briefly, nuclei regions are used as seeds and expanded till a predefined masked area, representing the area covered by cells. The masked area is identified based on automatic maximum entropy-based thresholding. The boundaries of neighbouring cells touching each other are placed in the area of intensity minima between the two cells, according to the watershed principle. In order to avoid over-fragmentation, the watershed algorithm is preceded by maxima imposition, so that no new local maxima are considered outside the nuclear region. Segmentation of cells thus allowed for reliable and accurate quantitation of intracellular bacteria in addition to assessment of changes to host cells upon perturbation. In the second step of image analysis, multiple parameters relating to both bacteria and host cells were extracted (see Table 1 and details below). - Since the screening is based on quantitative image analysis, various quality control metrics were implemented to ensure the robustness of the results. The correlations of the results between replicates were measured. Towards this, a subset of MSD chemical library was screened in technical triplicates and the Pearson correlation coefficient was calculated for all parameters between the triplicates. The results (
Figure 8A ) show high level of correlation for all parameters groups with an average Pearson correlation coefficient of 0.631, indicating a high level of reproducibility. Since human primary monocyte derived macrophages were use, large variations between different preparations of the cells were anticipated. In order to quantify this, the MSD screen was performed in biological duplicates (different cells and infection) the Pearson correlation coefficient was calculated between the duplicates. The results (Figure 8A ) show that parameters relating to intensity of bacteria as well as host toxicity are well conserved, while those relating to number of bacteria are lower. - The image processing pipeline allowed to segment objects (bacteria and cells) from the images. Following this, quantitative multi-parametric image analysis algorithms calculated different statistical parameters describing multiple features for the two categories of objects (see complete list in Table 1). Parameters corresponding to bacteria were split into three groups, number-related, intensity-related and shape-related, giving information about different facets of intracellular bacteria. Number-related parameters report the numbers of bacteria within infected cells, number of bacteria within all cells, total number of bacteria in infected cells as well as the total number of infected cells. Intensity-related parameters compute the average as well as integral intensity of bacteria within infected cells. Integral intensity is defined as the integral (the sum pixel by pixel) of the intensity calculated on the fitted object, mean integral intensity is the mean value integral intensity of individual bacteria and total integral intensity is the sum of all bacterial integral intensities, normalized by the area covered by cells.
- These parameters are measured in multiple ways with different statistics (mean, median or mode) and different weighting: parameters can be non-weighted, weighted by mean intensity or weighted by integral intensity. Weighting can reveal important biological features: measuring the mean parameter value gives us information about whole population behaviour, including both bright (presumably intact) and dim (presumably partially degraded) bacteria at the same time, parameter weighted by intensity gives us information mostly about brighter (and presumably) bacteria. This approach extracts more comprehensive description of the phenotype from the same biological assay.
- In case of normal distribution of a parameter, the mean, median and mode coincide. However, this is not the case for most of the parameters in the present assay. Parameter distributions are skewed and have heavy tails. By using a combination of mean, median and mode, it is possible to summarize the main features of the distribution in a few values without making any assumption about distribution per se. For example, mode of the distribution tells us the parameter value of the most abundant objects while mean and median reflect on different features of distribution. Several of these parameters are closely related but computed in different ways (such as number of bacteria per infected cell and number of bacteria per cell), thereby also serving as measures of robustness and reliability of parameters and measurement.
- Several host cell parameters were also measured (Table 1). These parameters capture the dynamics of alterations in the host cell as a consequence of perturbation. Additionally, quality control and 'toxicity' parameters were included. 'Nuclei contrast' estimates the correctness of focal position in the given image by measuring the difference in contrast between nuclear signal DAPI and nearby cytoplasmic pixels. 'Number of cells' served as a first level measure for toxicity. For the following analyses, only those conditions with at least 5 images, each image containing more than 4 cells, were considered. Therefore, extremely toxic compounds, those that lead to cell death and hence no measurable nuclei, are automatically filtered out from analysis. As an additional level of toxicity assessment, area and size of nuclei were measured, since nuclear condensation is an initial signature of apoptotic cell death and a general sign of loss of cellular fitness (Galluzziet al. (2009); Parvati and Mariya Das (2008); Roerdink (2000). Indeed these measurements for toxicity correlate well with standard toxicity assays such as PI exclusion (data not shown).
- In order to correlate the phenotypic profiles of selected hit compounds with the intracellular 'fitness' of mycobacteria, additional parameters were calculated (Table 2), reporting morphological features of bacteria. The profiles (
Figure 9A ) show significant influence of the selected hit compounds on bacterial morphological features. All the parameters are significantly altered by the selected compounds. Taken together with the phenotypic profile from the screen, these alterations can be summarized as: fewer bacteria that are smaller, less intense, less elongated, more compact and circular. This could be interpreted as partially degraded bacteria with remaining GFP signals. These parameters could thus offer a metric for assessment of intracellular 'fitness' of mycobacteria. - Standard anti-mycobacterial drugs did not fall into the hit cluster but were rather spread in different clusters. Additionally their phenotypes were weaker compared to the selected hit compounds. In order to understand this better, their activity was further characterized by improving the resolution of the assay, i.e. a detailed time course analysis of mycobacterial trafficking as well as survival was performed. The results (
Figure 8C to F ) show that the standard anti-mycobacterial drug Rifampin exhibited a phenotype with time. This phenotype corresponds to: - a) Decreased mean integral intensity of bacteria
- b) Increased co-localisation of mycobacteria to lysosomes
- c) Increased intensity of lysosomes that contain bacteria.
- However, the phenotype is weaker than that of the hit compounds for most time points. One possible reason could be that the read out is dependent on the GFP fluorescence from mycobacteria, which could be reduced at different rates, depending on whether the lysosomal degradation machinery is accelerated or not by host acting mechanisms. In support of this, the hit compounds lead to a strong increase in the intensity of lysosomes, whereas Rifampin, that kills mycobacteria directly, does not show this effect (
Figure 8F ). This could lead to different rates of degradation of GFP from mycobacteria thus resulting in the different phenotypes seen. - Multi-parametric profiles from the chemical screen were clustered using an algorithm based on modified Gabriel neighbourhood and density estimate using von Mises-Fisher kernel. This clustering algorithm has one free parameter, namely kernel bandwidth, which is inversion of von Mises-Fisher concentration parameter κ. For every dataset, the number of clusters as function of kernel bandwidth has a pronounced plateau within a κ range of 10-150. Further increase of κ would not lead to an increase in the number of clusters. For each dataset, a cluster was manually selected at the first value of κ that produced clusters that were stable in number and size. κ values for mycobacteria and endocytosis screens were 30 and 90, respectively.
- Representative profiles of the endocytosis sub-clusters were generated by averaging the profiles of individual compounds in each sub-cluster. For these profiles, we assembled a list of genes from the endocytosis screen (Collinet et al., 2010) that had a PSS > 0.95 and a Pearson correlation of 0.7. These lists were subjected to gene annotation enrichment analysis using a standard hypergeometric test. Gene annotations were obtained from Gene Ontology and KEGG Pathway databases.
- Human primary monocyte-derived macrophages were infected with M. bovis BCG-GFP and stained for lysotracker red and LBPA as markers of late endosomes and lysosomes (Kobayashi et al., 1998; Schmid and Cullis, 1998). Co-localization was scored over a range of stringency thresholds varying from 0 (most relaxed) to 1 (most stringent).
- To mid log phase M. bovis BCG-GFP seeded into 384 well plates in a volume of 90 µl 7H9 [Is the term 7H9 sufficiently established in the art so that the skilled person knows what to use here?], compounds were added to a final concentration of 10µM DMSO and Amikacin (200 µg/ml) were included as negative and positive controls, respectively. Plates were incubated at 37°C for 4 days, followed by addition of 10µl of 1:1 mix of alamar blue (serotec) and 10% Tween-80. After 24hr at 37°C, fluorescence was read in the Tecan Pro (Ex 535 nm; Em 590 nm). Analysis was done per plate. Compounds with a Z score > 3 were considered hits. The screen was repeated twice (Z' factors are 0.85 and 0.9 for each run). Hits from both runs were combined.
- HeLa cells were treated with the compounds at a final concentration of 10µM, incubated for 4 hr, fixed with 3.7% PFA and immunostained with anti-LC3 antibody (clone PM036, MBL labs). Cells were counterstained by DAPI and Cell Mask Blue, imaged and analyzed as described above.
- To calculate IC50 for mycobacterial survival, human primary monocyte-derived macrophages were infected with M. bovis BCG-GFP and treated with different doses of Nortryptyline (D) and Prochlorperazine edisylate (E) for 48 hrs and fixed. For autophagy assays, the same preparation of cells was treated with the two compounds for 2 hrs, fixed and immunostained for LC3. Cells were imaged and analyzed as described.
- Human primary macrophages were infected with virulent M. tuberculosis strain H37Rv and two different clinical isolates (CS1 and CS2) for one hr at MOI 1:10, washed, treated with Amikacin (200µg/ml) for 45 min, washed again and treated with the compounds. Cells were lysed after 48 hrs with 0.05% SDS and plated in multiple dilutions on the standard mycobacterial growth medium Middlebrook 7H11 agar plates. Colonies were counted after incubation at 37°C for 3 weeks.
- Cells were fixed with 2.5% glutaraldehyde followed by post-fixation in Ferrocyanide reduced Osmium following standard protocols (Kamovsky, 1971) and embedded with epon. 70nm thin sections were cut on a Leica ultramicrotome, stained with Uranyl Acetate and Lead Citrate following classical procedures and imaged on a
100kV Tecnai 12 TEM microscope. For area measurements, several overlapping high magnification images covering the whole cell were acquired and a montage was generated using ImageJ. - A431 cells stably expressing GFP-Rab5 were treated with 10µM Haloperidol for 2 hr and imaged live using Zeiss Duo scan microscope at 0.098 sec /frame for 2 min. Individual endosomes were identified and tracked over time as described (Rink et al, 2005). To calculate mean square displacement, all endosomal tracks were first iteratively divided into non-overlapping equal time intervals from 0.1 to 70 sec and their displacements were computed for each interval. Next, the squares of displacement for all endosomal tracks for a given condition were averaged and plotted as a function of the time interval. In such a curve, early endosomes show a characteristic bi-phasic behavior, which is referred to as a short-time scale and long-time scale movements.
- It was further investigated if structurally similar compounds also clustered together in the mycobacteria and endocytosis screens. The structures were delivered in Structure Data format by the vendor and converted to the Chemical Development Kit (CDK) format for further similarity analysis. Standard fingerprint was generated for all compounds, and fingerprint similarity for each compound was calculated iteratively as the Tanimoto similarity coefficient with every compound of the library, resulting in a 2000 by 2000 matrix of similarity measures. All pairs of compounds with Tanimoto similarity coefficient higher than 0.9 were considered structurally related compounds, as suggested by Pubchem (see the world wide web at pubchem.ncbi.nlm.nih.gov/help.html#sAssayclustering/).
Of the three validated compounds, only Nortriptyline had a structurally related compound in the hit cluster, namely Amitriptyline (Tanimoto distance of 0.96). Nortriptyline and Amitriptyline showed highly correlated profiles in mycobacteria high content screen, as well as in endocytosis and autophagy screens (Figure 9F to I ). Thus structural analogs show similar host correlates, further confirming that the effect of these compounds on intracellular mycobacterial survival is by modulating the host. - The null-hypothesis tested is that deviation of a sequence of N measurements from zero is the result of normally distributed noise. Given that every measurement i in the series has a value Δi and
variance 

- An integrated experimental and computational strategy was developed for screening, selecting and validating compounds endowed with anti-mycobacterial activity by acting on the host machinery (
Figure 1A ). First, a high content assay was established in a human primary macrophage infection model. Briefly, cells were infected with M. bovis BCG expressing GFP (Dhandayuthapani et al., 1995), and incubated with chemicals for 48 hrs. Since the primary interest was to identify chemical modulators disrupting the host-mycobacteria equilibrium, chemical perturbations were introduced after the infection was established. Cells were then fixed, nuclei and cytoplasm stained, and imaged using an automated spinning disc confocal microscope. A QMPIA platform previously used was developed further to automatically identify cells, endosomes and nuclei (Collinet et al., 2010; Rink et al., 2005) by implementing automated algorithms to detect various features of intracellular bacteria and host cell simultaneously (Figure 1B , Tables 1, 2). A bioactive library (Microsource Discovery Inc., Spectrum collection, 2000 compounds) comprising most FDA approved drugs was screened. The compounds produced reproducible alterations of various parameters such as bacterial number, intensity as well as bacterial and host cell morphology (Figure 8A ). - Cluster analysis was performed using the algorithm described above (see Example 8 for details). The compounds grouped into six distinct clusters, each with a distinct pattern, i.e. phenotypic profile (
Figure1C,D ). The strength of the phenotype of a compound is given by its Pattern-specific score (PSS) (not shown). Due to the multi-parametric nature of our screening output, each cluster was expected to capture distinct phenotypic features of mycobacteria and the host. Cluster M5 (containing 115 compounds shown in Table 4) was of particular interest as it was characterized by a strong reduction of bacterial parameters but relatively weak changes in host parameters reflecting toxicity, suggesting that the compounds in this cluster are detrimental to bacteria but not significantly toxic to the host. - Since the primary interest was to identify compounds that act upon the host, counter-selection was carried out for those compounds directly killing mycobacteria. The MSD library was screened using the alamar blue assay (see methods) and, interestingly, it was found that only 6 compounds were shared with cluster M5, suggesting that most compounds in this cluster are not bacteriostatic. Additionally, compounds functionally annotated as 'anti-bacterial' were not enriched in cluster M5 despite scoring in the alamar blue screen (
Figure 8B ). Standard anti-mycobacterial drugs were not enriched in any particular cluster and yielded weaker phenotypes than other compounds (Figure 8C to F ). This is interpreted as being due to the specific characteristics of the cell-based assay that, by measuring the reduction in GFP fluorescence primarily reflects modulation of lysosomal degradation. Thus, the compounds of cluster M5 could modulate cellular processes at the host-pathogen interface rather than acting directly on the bacteria. - To validate the results from the screen, three compounds were selected from the cluster M5, namely Nortriptyline, Prochlorperazine edisylate (PE) and Haloperidol (
Figure 2B-D ), on the basis of - 1) amplitude of the phenotypes (
Figure 2E ,9A ), showing reduced bacterial intensity, fewer bacteria and infected cells; - 2) lack of effect in the alamar blue screen.
- To determine whether the phenotype observed on M. bovis BCG-GFP were reproducible on pathogenic M. tuberculosis, a colony forming unit (CFU) assay was performed on M. tuberculosis strain H37Rv as well as two clinical strains using the three selected compounds and the anti-mycobacterial drug Rifampin, Rapamycin (Gutierrez et al., 2004) and H89 (Kuijl et al., 2007) as controls. All three selected compounds caused a significant reduction in bacterial colonies in all the strains (
Figure 2F ), confirming that they impair intracellular survival of M. tuberculosis. - Since the aim was to identify compounds restoring mycobacteria-arrested phagosome maturation, the effects of the selected compounds on mycobacterial trafficking was explored. The co-localization of M. bovis BCG-GFP with Lyso-bisphosphatidic acid (LBPA), a marker of late endocytic compartments (Fratti et al., 2001; Kobayashi et al., 1998) was quantified at the level of single infected cells, . Briefly, individual objects are fitted as described earlier, and their levels of co-localisation between each other quantified over a range of stringency thresholds.
Figure 9D, E provides illustration of the variations observed in co-localisation between M. bovis BCG-GFP and lysosomal marker. Hence to obtain robust statistics, co-localisation events from a large number of individual infected cells are quantified. Infected cells treated with the selected compounds showed significantly higher colocalization than control cells (Figure 2G ), indicating that the arrest in phagosome maturation is reverted. - A significant challenge in phenotypic chemical screens is to gain insights into the mechanism of action of the selected compounds. Multi-parametric profiles are specific signatures of either chemical or genetic perturbations because they capture multiple facets of a biological system. Since random matches between such profiles are unlikely, clues into the molecular processes targeted by the chemicals can be obtained in principle by systematically searching for genetic alterations that produce similar phenotypes. Hence, it was the aim to match the multi-parametric profiles of the compounds from the mycobacteria screen with those of the siRNAs from an genome-wide endocytosis screen (Collinet et al., 2010). However, the two screens are not directly comparable due to their distinct characteristics, i.e. one being a chemical screen on intracellular mycobacterial survival in human primary macrophages and the other a functional genomics screen on endocytosis in HeLa cells. To overcome this problem the two data-sets were bridged via an intermediate screen, where the compounds from cluster M5 were screened on the endocytosis assay in HeLa cells (
Figure 3A ). HeLa cells were pre-treated with the compounds prior to the internalization of fluorescently-labeled epidermal growth factor (EGF) and Transferrin (Tfn) for 10 min (Collinet et al., 2010), imaged and multiple parameters extracted (Table 3). - Clustering separated the compounds into two sub-clusters E1 and E2 (
Figure 3B , Table 5), suggesting that the compounds may act by at least two distinct mechanisms. To identify them, the multi-parametric profiles of the sub-clusters E1 and E2 were compared to a genome-wide RNAi screen data-set (Collinet et al., 2010) and the sets of genes that are most likely to show similar phenotypes was identified (Experimental Procedures). Their representation in KEGG pathways and GO terms was computed and it was found that "mTOR regulation" and "Regulation of autophagy and mTOR" were significantly enriched in E1 (p=1.2*10-4 and 9*10-4, respectively) but not E2 (p=0.15 and 0.4, respectively) sub-clusters. - Autophagy is a key process regulated by mTOR (Laplante and Sabatini, 2012) and a known mediator of intracellular mycobacterial survival (Gutierrez et al., 2004; Kumar et al., 2010). The integration approach predicted that compounds from E1, but not E2, modulate autophagy. To test it, HeLa cells were treated with the compounds, immunostained for the autophagosome marker LC3 and multiple parameters reporting diverse facets of autophagosomes were extracted (Table 3).
The compounds of sub-cluster E1, but not E2, had a strong effect on autophagy (Figure 3C ,10A ), thus validating the prediction from the integration analysis. Of the three compounds validated in intracellular mycobacterial killing, Nortriptyline and PE belong to sub-cluster E1 whereas Haloperidol belongs to E2. Consistent with the data ofFigure 3C , Nortriptyline and PE, similar to Rapamycin or serum starvation (by HBSS), showed a strong effect on autophagy, whereas Haloperidol did not (Figure 10B,C ). Human primary macrophages treated with Nortriptyline and PE resembled HeLa cells in showing an increase in both number and integral intensity of LC3 vesicles (Figure 10D,E ), indicating that their effect of increasing autophagosomes is not cell type-restricted. - To determine whether the accumulation of autophagosomes is related to intracellular mycobacterial killing by Nortriptyline and PE, their IC50 values was first computed in the two assays. For both compounds, the IC50 values for increase in LC3 integral intensity correlated well with the decrease in M. bovis BCG-GFP (
Figure 3D-F ), arguing that the two phenotypes are linked. Second, if autophagy modulation is involved in intracellular mycobacterial killing, mycobacteria should be visualizable within autophagosomes. To test this, Mycobacteria-infected cells were analyzed by electron microscopy. Whereas in control cells mycobacteria resided within single-membrane phagosomes (Figure 4A ), cells treated with Nortriptyline and PE clearly showed the presence of mycobacteria within autophagosomes, defined as vesicles containing multiple membrane whorls and delimited by double membrane (Figure 4B-F ). Haloperidol treated cells, as expected, did not show this effect (Figure 11A ). - Finally, the effect of an inhibitor of autophagy, 3-Methyl Adenine (3MA)(Seglen and Gordon, 1982) was tested. Upon treatment with Nortriptyline and PE in the presence of 3-MA, mycobacteria were not observed in autophagosomes but in mycobacterial phagosomes (
Figure 11B-D ). Additionally, 3-MA reverted the effect of Nortriptyline on mycobacterial survival in both CFU and image-based assays (not shown), arguing that the effect of the compounds on mycobacteria is related to autophagy. - Autophagy is a multi-step process consisting of autophagosome formation, maturation and eventual degradation by fusion with lysosomes (autophagolysosomes). The increase in autophagosomes mediated by Nortriptyline and PE could be either due to a higher rate of formation or a block in maturation and degradation (autophagic flux) (Klionsky et al., 2008). To distinguish between these possibilities, two different approaches were used. First, it was tested whether blockers of lysosomal degradation, e.g. inhibitors of acidification (BafilomycinAlor Chloroquine) that inhibit autophagic flux could have an additive effect with the compounds on autophagosome accumulation (Klionsky et al., 2008). HeLa cells were treated with Nortriptyline and PE in the presence or absence of BafilomycinA1, and LC3 lipidation (LC3-II band) was assessed by immunoblotting. Whereas both Nortriptyline and PE showed significant increase in the LC3-II band, additive effects of BafilomycinA1 were seen only upon Nortriptyline, but not PE treatment (
Figure 12A ). In addition, HeLa cells stably expressing LC3 fused to GFP (HeLa BAC LC3-GFP) under the control of the endogenous promoter were generated through BAC recombineering (Poser et al., 2008). The results (Figure 12B,C ) confirmed that Nortriptyline, but not PE, had an additive effect with BafilomycinA1 and Chloroquine in increasing LC3-GFP vesicles. - Second, an established assay was used for measuring autophagic flux based on a tandem mRFP-GFP-LC3 construct (Kimura et al., 2007). Since GFP is quenched in the acidic environment of autophagolysosomes whereas mRFP remains stable, agents blocking autophagy flux display higher colocalization of mRFP and GFP compared to those inducing autophagy. HeLa cells stably expressing mRFP-GFP-LC3 (Settembre et al., 2011) were treated with the compounds and the co-localization between mRFP and GFP was quantified. Nortriptyline, similar to starvation-induced autophagy (HBSS), showed a low mRFP to GFP co-localisation, whereas PE, similar to BafilomycinA1 and Chloroquine, yielded higher co-localisation (
Figure 5A ,B ). Similar results were obtained for the co-localisation of LC3-GFP with LBPA in HeLa-LC3-GFP cells (Figure 12D ). Based on previous studies (Klionsky et al., 2008), these results can be interpreted as indicating that Nortriptyline induces autophagy whereas PE inhibits autophagic flux. - In principle, blockers of autophagy flux should not have a detrimental effect on mycobacteria. Indeed, inhibitors of autophagy flux that abrogate the function of lysosomes by blocking acidification did not affect the intensity of intracellular M. bovis BCG-GFP signal (
Figure 12E ). In order to determine whether PE has a similar effect on lysosomal pH, the intensity of the acidotropic dye Lysotracker red was quantified over time. Unlike classical blockers of autophagy flux, PE did not have a negative effect on the acidity of lysosomes, but quite the contrary, it significantly increased the acidity (Figure 5C ). Moreover, this effect correlated with the presence of mycobacteria within the lysotracker red-positive vesicles (Figure 5C ) and a concomitant reduction in bacterial intensity (Figure 5D ). - The increased acidification by PE is in apparent contradiction with the inhibition of autophagic flux. To solve this discrepancy, HeLa cells stably expressing mRFP-GFP- -LC3 were treated with the compounds for different periods of time. If autophagy flux were completely blocked, the co-localisation between mRFP and GFP (corresponding to non-acidic autophagosomes) should increase with time, whereas if the flux were slowed-down then the co-localisation would be expected to decrease (i.e. autophagosomes become acidic). The co-localisation of mRFP and GFP increased over time in cells treated with BafilomycinA1 (
Figure 5E ) or Chloroquine (not shown). In contrast, in PE-treated cells the colocalization increased within the first hr but then progressively decreased (Figure 5E ), showing that the autophagosomes acidify over time. - To further characterize the effects of Nortriptyline and PE on autophagy, it was investigated whether they could synergize with an established physiological inducer of autophagy, Interferon-gamma (IFN-γ) (Gutierrez et al., 2004; Matsuzawa et al., 2012). Infected cells were pre-activated with IFN-γ and assessed the effect of the compound addition on mycobacterial survival. The results were striking (
Figure 5F ) and showed that Nortriptyline synergized strongly with IFN-γ, supporting its role in autophagy induction. PE instead exerted a much weaker effect, providing additional evidence that the two compounds interact with the autophagy machinery differently. - Haloperidol kills intracellular mycobacteria by a mechanism distinct from autophagy. Haloperidol belongs to sub-cluster E2 (
Figure 3B ). This sub-cluster is characterized by a strong alteration of the endocytic profile that can be summarized as an increase in EGF and Tfn content, increased co-localisation of EGF to Tfn (reduced sorting) and accumulation of EGF in large endosomes in the cell centre. In accordance with the design principles of the endocytic system (Collinet et al., 2010; Rink et al., 2005), the alterations observed argue for a faster degradation. Hence, it was hypothesized that Haloperidol could positively modulate endocytic trafficking along the degradative route. To test this hypothesis, the kinetics of transport of low density lipoprotein (LDL) from early to late endosomes was monitored, using Rab5 (Bucci et al., 1992) and LBPA (Kobayashi et al., 1998) as markers, respectively (Figure 13A ). HeLa cells stably expressing GFP-Rab5 from the endogenous promoter (HeLa BAC GFP-Rab5c) (Foret et al., 2012) were treated with Haloperidol and allowed to internalize LDL for different times prior to immunostaining with anti-Apolipoprotein B (ApoB) (to detect LDL) and LBPA antibodies. Haloperidol significantly increased the intensity of LDL in late, but not early endosomes (Figure 6A ,B ). Similarly, LDL-containing late, but not early endosomes, were larger, more numerous and closer to the cell centre in Haloperidol-treated compared to control cells (Figure 13B-G ). These results confirm the prediction that Haloperidol leads to acceleration of trafficking along the degradative pathway. - Phagosome maturation depends on the fusion with early, late endosomes and lysosomes (Desjardins et al., 1994; Fairn and Grinstein, 2012) and is regulated by the motility of endocytic organelles along the cytoskeleton and the recruitment of the membrane tethering-fusion machinery. Both processes could be enhanced by Haloperidol. To address this, the influence of Haloperidol on endosome motility was tested. Increasing concentration of Rab5 and displacement of early endosomes towards cell centre are predictive of progression from early to late endosomes (Del Conte-Zerial et al., 2008; Rink et al., 2005). Endosome motility was therefore quantified in cells stably expressing GFP-Rab5, as previously described (Rink et al., 2005), and the velocity toward the cell centre (minus-end microtubule directed) and cell periphery (plus-end) was computed as a function of GFP-Rab5 intensity. Haloperidol-treated cells showed a much higher motility of early endosomes harboring high levels of Rab5 and this enhancement was higher toward the cell centre than the cell periphery (
Figure 6C,D ). Next, the mean square displacement of endosomes was computed over time, an established way to characterize motility patterns (Caspi et al., 2002). In Haloperidol-treated cells, long, but not short, time-scale movements of GFP-Rab5 endosomes were significantly accelerated (Figure 6E ). These data indicate that Haloperidol accelerates the centripetal movement of early endosomes.
Second, the hypothesis was tested that Haloperidol could lead to increased delivery of components of the membrane tethering and fusion machinery to the arrested mycobacterial phagosome. Mycobacterial phagosomes contain Rab5, but not Rab7 (Alix et al., 2011; Russell, 2001) and lack PI(3)P (Vergne et al., 2005), which mediates the recruitment of various Rab5 effectors, including the membrane tethering factor Early Endosomal Antigen 1 (EEA1) (Christoforidis et al., 1999; Simonsen et al., 1998). Therefore, mycobacterial phagosomes lack EEA1 (Fratti et al., 2001). If Haloperidol could restore such machinery, one would expect to see a small, transient increase in EEA1 on mycobacterial phagosomes. M. bovis BCG-infected cells were treated with Haloperidol for different times and the co-localization of mycobacteria with EEA1 and LBPA was quantified. Whereas in control cells, as expected, mycobacterial phagosomes were devoid of EEA1 at all times (Figure 7A , upper panels, 7B), Haloperidol-treated cells displayed a small, but significant, localization of EEA1 to mycobacterial phagosomes 20-30 minutes post-treatment (Figure 7A , lower panels, 7B). Such an effect was not observed in cells treated with Nortriptyline and PE (data not shown), indicating that it was specific for Haloperidol. Moreover, in Haloperidol-treated cells the co-localization of mycobacteria and LBPA increased with time (Figure 7C,D ). Taken together, these data indicate that Haloperidol restores the delivery of critical components of the membrane tethering machinery to the mycobacterial phagosomes, thereby delivering mycobacteria to lysosomes. - First the dataset was transformed into a Gabriel graph where edges connect neighbour data points (nodes). Then the density estimation for each node was performed using a kernel function that was chosen according to the selected distance measure (as detailed below). The Gabriel graph was converted to directed acyclic weighted graph (WDAG) by assigning direction to edges such that they point towards the nodes with higher density estimate. In the ambiguous case of equal density estimates of two neighbour nodes, one node was randomly chosen and a small arbitrary value (0.0000001) was added to its density estimate. Edge weights were set proportional to the distance between nodes that they connect. The sinks of the directed graph (vertices with no out-coming edges) were marked as modes (local maxima) of density. Those data points became cluster centers, and the remaining data points were assigned to the cluster centres based on the shortest weighted path in the directed neighbourhood graph.
- Kernel density estimate of the multivariate probability density function f̂(x) of a random variable x from an independent and identically-distributed sample x 1,x 2,.,xn is given by

- 1) K is a function of distance D(x, xi) and is defined over the whole argument space;
- 2) K is monotonously non-increasing;
- 3) K has unity integral on the argument space.
- The simplest case is the so-called flat kernel, where K equals constant when D(x,xi)<h and 0 otherwise. In this case, kernel density estimate simply is equal to the number of data points that fall into the hyper-sphere of radius h around the point x, normalized by the volume of this hyper-sphere. The bandwidth parameter h determines the degree of density smoothing. In each particular case, the choice of kernel function is primarily guided by the measure of distance between data points. In the case of Euclidian distance, a commonly chosen kernel is a multivariate Gaussian function in which the covariance matrix parameterizes the bandwidth.
- In case of directional data, meaning that the similarity between two feature vectors is given by cosine of angle (uncentered Pearson correlation), von Mises-Fisher probability function may be used as a kernel.

x that deviates from the central vectorµ by cosθ. The distribution has one concentration parameter K (kappa) that is analogous to inverse of variance in Gaussian. Hence K defines the concentration (inverse bandwidth) of von Mises-Fisher kernel. The normalization constant is dependent on the modified Bessel function of the first kind I of the order
- Gabriel graph is defined such that two points are connected by an edge if and only if the centre of the edge is closer to these points than to any other point in the set.
An optimized search procedure for Gabriel graph search is as follows: - 1. For each data point xi in dataset X:
- 1.1. Sort the data points in X in the ascending order of distance to xi using quicksort algorithm
- 1.2. Initialize the set of Gabriel neighbors G xi = Ø
For each xj :j ≠ i in the sorted list X:- 1.2.1. Construct the mid-point mij : D(mij, xi ) = D(mij, xj )
- 1.2.2. Find the nearest neighbor xn
1 of mid-point mij in the set of Gabriel neighbors Gxi discovered until now - 1.2.3. If D(xn
i , mij ) > D(xi, mij ) then find the nearest neighbor xn2 of mid-point mij in the total dataset X - 1.2.4. If D(xn
2 , mij ) > D(xi, mij ) then add xj to xj to Gxi - 1.2.5. Go to next j
- Then the Gabriel graph was filtered to remove spurious edges. For this the neighbours xi and xj, that connected by edge which distance of central point to the third point of set (xK ) is smaller than

- In some cases the density modes of two clusters could occur almost on the edge of clusters and in multidimensional space they may happen to be Gabriel neighbours of each other through 'long-range' connections. These connections were filtered as well by taking intersection with sets of its nearest neighbours of an equal size. This procedure removes 'long-range' links that spans across empty regions of the feature space while keeping most of the links within the clusters.
- Density-shift according to the present invention is a clustering method that combines per-data point density estimate with a filtered Gabriel neighbourhood graph to perform robust mode seeking in the multidimensional space. The modes of density are identified as points that have density higher than any of their Gabriel neighbours. Other points are assigned to their respective modes following the discrete walk through a succession of Gabriel neighbours with monotonously increasing density estimate at each step. The algorithm details are as follows:
- 1. Choose appropriate distance function D(xi, xj ) and a kernel function K(D(xi,xj ),h) with a pre-set bandwidth h.
- 2. Build Gabriel neighbour graph on the data points with given distance D(xi,xj );
- 3. Filter spurious edges from Gabriel graph: Gabriel neighbour nodes, xi and xj, that are connected by the edge whose distance from the central point of the edge to the third node of the graph xk is smaller than

- 4. Filter 'long-range' edges from Gabriel graph: for every node of Gabriel graph, its set of Gabriel neighbours intersects with set nearest neighbours of an equal size. This procedure removes 'long-range' links that spans across empty regions of the feature space while keeping most of the links within the clusters;
- 5. For each point (node) xi in the dataset compute the kernel density estimate f̂(xi )
- 6. Convert the modified Gabriel graph into weighed directed acyclic graph (WDAG) by directing every edge [xi, xj ] such that it points to nodes xj where f(xi ) >
f (xi ). Edge weights are given by K(D(xi,xj ),h). In the ambiguous case of equal density estimates of neighbour nodes one node is randomly chosen and a small arbitrary value (0.0000001) is added to its density estimate. - 7. The sink nodes of the WDAG , i.e. points with highest density among the neighbours are marked as a cluster centres.
- 8. Remaining data points are assigned to the cluster centres based on the shortest weighted path over WDAG.
- Pattern-specific score (PSS) is a hit selection method that is based on a statistical model in which each measured feature vector
r is a sum of two independent components.
- One component is a specific phenotype component that follows along the central direction
µ of its class and has an unknown amplitude a. The other component is a random noise componentn that is drawn from the zero-centered multivariate normal distribution with the covariance matrix Σ. - Given the fact that
r is fixed, for every possible value of α there is a unique corresponding random noise vectorn . The likelihood of α can be expressed through the noise vector probability:
- Then the probability that the specific component
r is above the threshold α 0 is
- The integration is performed numerically using the standard Newton-Cotes method.
- In practice, the grouping of the profiles into classes may be obtained from a clustering that is based on uncentered Pearson correlation, so that the mean (or mode) directions of the clusters can be taken as estimates of central directions of classes. The parameters of noise distribution (covariance matrix Σ) can be estimated from a sufficient sample of negative control measurements.
- To compare the performance of PSS and χ 2 on EEA1 hit selection, the covariance matrix of noise Σ from a set of negative control profiles was estimated and the same covariance matrix was used to compute both measures. χ 2 score was based on cumulative probability function of χ 2 distribution, under the assumption that negative control profiles are normally distributed. Thus, the squared Mahalonobis length of a negative control profile follows a χ 2 distribution with degrees of freedom equal to number of dimensions d, according to the following formula:

- In all examples a0 in PSS formula was set to 0.
- Datasets were clustered with our own parallelized Java implementations of average-linkage Hierarchical clustering, K-means, mean-shift and Gabriel neighbourhood-based density-shift. Hierarchical clustering was implemented using 1 - cos α as a distance measure, following standard practice (Kittler, R. et al. Genome-scale RNAi profiling of cell division in human tissue culture cells. )). For K-means clustering with cosine similarity measure we implemented spherical K-means algorithm, where the data points and the cluster centroids are projected on a unity hyper-sphere by normalizing all vectors to have unity Euclidian length. Mean-shift was implemented following the description of Cheng (Cheng, Y. Mean shift, mode seeking, and clustering. IEEE Transactions on Pattern Analysis and )), the clustering was stopped when minimal correlation of vectors between iterations was higher than 0.999 and the points that converged within 0.95 of each mode were grouped into clusters.
- Cluster Silhouette index was computed following the algorithm provided in Rousseeuw, P. J. Silhouettes: A graphical aid to the interpretation and validation of cluster analysis. Journal of Computational and ), using 1-cos α as a distance measure. In brief, for every i-th data point in the data set, two values are computed: a(i), which is the average distance other data points in its own cluster and b(i), that is a minimum of average distance any other cluster. Then silhouette of the i-th data point s(i)=(b(i)-a(i))/max(a(i),b(i)) is a value that lies between -1 and 1, higher values indicating better fitting of the data point into its own cluster. The average of Silhouette values over the whole dataset is the index that expresses the overall quality of a given clustering.
- For hierarchical clustering and K-means we fixed the free parameter by selecting a single clustering level that corresponded to a maximum of average Silhouette index. In case of Transitivity clustering the parameter was fixed following the protocol described in Wittkop, T. et al. Comprehensive cluster analysis with Transitivity Clustering. ). The selection is based on the analysis of distribution of inter- and intra-cluster distances between data points. The original publication on affinity propagation states that the free parameter (self-correspondence) can be set either to median or minimum of the data point similarity in the dataset, depending whether the user wishes many or few clusters. Since we clustered data based on cosine similarity, minimal possible similarity in the dataset is -1.0, while the median is close to 0.0.
- Generally, the increase in free parameter setting in the compared algorithms is expected to yield more clusters. Although only Hierarchical clustering guarantees that the clusters of the next level are nested in the clusters of previous level of parameter setting, the clusters of the next level generally can be mapped in one-to-one or many-to-one fashion to the clusters of the previous level based on shared data points. Each cluster of the next level is mapped to a cluster of previous level in members of which it has the highest enrichment (lowest hypergeometric p-value). By recursive mapping of consecutive levels we obtain a tree that is then visualized as a dendrogram, where clusters are represented with boxes of width proportional to the cluster size.
- Given the clustering and the gold standard classification, for each class one cluster was selected that contained the highest number of the given class members and amounted to at least 50% of the class. If there was no cluster that contained more than 50% of the class, the class was considered to be undetected. The classification performance was computed as the fraction of data points that were correctly assigned to their class based on the established cluster-class mapping.
- Clustering of RNAi phenotypes is expected to group together genes that participate in the same functional modules. According to the definition of Hartwell and co-workers (Hartwell, L. H., Hopfield, J. J., Leibler, S. & Murray, A. W. From molecular to modular cell biology. Nature 402, C47-52 (1999)), a functional module is characterized by extensive physical interaction of the components. We designed a simple way to cross-validate the gene phenotypic clustering based on this definition by quantifying how much the gene clusters are enriched in protein-protein interactions. The human protein-protein interaction data was obtained from STRING 9.0 database (see the world wide web at string-db.org), where we extracted the interactions annotated as 'experimental' and 'databases' and having confidence index of at least 0.7. As an enrichment measure we took minus logarithm of pvalue of the standard hypergeometric test that quantifies how likely is it to observe by chance a given or a higher number of interactions between selected protein pairs (sample), given the total number of interactions between all possible pairs of proteins in the dataset (population). The sample included protein pairs where both phenotypic profiles were grouped in the same cluster and appeared within the top 10th percentile of profiles in this clustering, ranked by a given scoring measure.
- The significance of enrichment of a cluster in a labelled subset of the total dataset was assessed using the standard hypergeometric test. Gene Ontology annotation was downloaded from the official website (see the world wide web at geneontology.org). The tests were performed without accounting for term interdependency or correcting for multiple hypothesis testing.
-
- Alix, E., Mukherjee, S., and Roy, C.R. (2011). Subversion of membrane transport pathways by vacuolar pathogens. J Cell Biol 195, 943-952.
- Armstrong, J.A., and Hart, P.D. (1971). Response of cultured macrophages to Mycobacterium tuberculosis, with observations on fusion of lysosomes with phagosomes. J Exp Med 134, 713-740.
- Bucci, C., Parton, R.G., Mather, I.H., Stunnenberg, H., Simons, K., Hoflack, B., and Zerial, M. (1992). The small GTPase rab5 functions as a regulatory factor in the early endocytic pathway. .
- Behar, S.M., Divangahi, M., and Remold, H.G. (2010). Evasion of innate immunity by Mycobacterium tuberculosis: is death an exit strategy? .
- Caspi, A., Granek, R., and Elbaum, M. (2002). Diffusion and directed motion in cellular transport. Phys Rev E Stat Nonlin Soft Matter Phys 66, 011916.
- Chen, M., Gan, H., and Remold, H.G. (2006). A mechanism of virulence: virulent Mycobacterium tuberculosis strain H37Rv, but not attenuated H37Ra, causes significant mitochondrial inner membrane disruption in macrophages leading to necrosis. J Immunol 176, 3707-3716.
- Christoforidis, S., McBride, H.M., Burgoyne, R.D., and Zerial, M. (1999). The Rab5 effector EEA1 is a core component of endosome docking. Nature 397, 621-625.
- Collinet, C., Stoter, M., Bradshaw, C.R., Samusik, N., Rink, J.C., Kenski, D., Habermann, B., Buchholz, F., Henschel, R., Mueller, M.S., et al. (2010). Systems survey of endocytosis by multiparametric image analysis. Nature 464, 243-249.
- Del Conte-Zerial, P., Brusch, L., Rink, J.C., Collinet, C., Kalaidzidis, Y., Zerial, M., and Deutsch, A. (2008). Membrane identity and GTPase cascades regulated by toggle and cut-out switches. .
- Desjardins, M., Huber, L.A., Parton, R.G., and Griffiths, G. (1994). Biogenesis of phagolysosomes proceeds through a sequential series of interactions with the endocytic apparatus. J Cell Biol 124, 677-688.
- Dhandayuthapani, S., Via, L.E., Thomas, C.A., Horowitz, P.M., Deretic, D., and Deretic, V. (1995). Green fluorescent protein as a marker for gene expression and cell biology of mycobacterial interactions with macrophages. .
- Dyer, M.D., Murali, T.M., and Sobral, B.W. (2008). The landscape of human proteins interacting with viruses and other pathogens. .
- Eggert, U.S., Kiger, A.A., Richter, C., Perlman, Z.E., Perrimon, N., Mitchison, T.J., and Field, C.M. (2004). Parallel chemical genetic and genome-wide RNAi screens identify cytokinesis inhibitors and targets. .
- Fairn, G.D., and Grinstein, S. (2012). How nascent phagosomes mature to become phagolysosomes. Trends Immunol.
- Foret, L., Dawson, J.E., Villasenor, R., Collinet, C., Deutsch, A., Brusch, L., Zerial, M., Kalaidzidis, Y., and Julicher, F. (2012). A general theoretical framework to infer endosomal network dynamics from quantitative image analysis. .
- Fratti, R.A., Backer, J.M., Gruenberg, J., Corvera, S., and Deretic, V. (2001). Role of phosphatidylinositol 3-kinase and Rab5 effectors in phagosomal biogenesis and mycobacterial phagosome maturation arrest. J Cell Biol 154, 631-644.
- Galluzzi, L., Aaronson, S.A., Abrams, J., Alnemri, E.S., Andrews, D.W., Baehrecke, E.H., Bazan, N.G., Blagosklonny, M.V., Blomgren, K., Borner, C., et al. (2009). Guidelines for the use and interpretation of assays for monitoring cell death in higher eukaryotes. Cell Death Differ 16, 1093-1107.
- Gutierrez, M.G., Master, S.S., Singh, S.B., Taylor, G.A., Colombo, M.I., and Deretic, V. (2004). Autophagy is a defense mechanism inhibiting BCG and Mycobacterium tuberculosis survival in infected macrophages. Cell 119, 753-766.
- Huang, R., Southall, N., Wang, Y., Yasgar, A., Shinn, P., Jadhav, A., Nguyen, D.T., and Austin, C.P. (2011). The NCGC pharmaceutical collection: a comprehensive resource of clinically approved drugs enabling repurposing and chemical genomics. .
- Imming, P., Sinning, C., and Meyer, A. (2006). Drugs, their targets and the nature and number of drug targets. Nat .
- Jayachandran, R., Sundaramurthy, V., Combaluzier, B., Mueller, P., Korf, H., Huygen, K., Miyazaki, T., Albrecht, I., Massner, J., and Pieters, J. (2007). Survival of mycobacteria in macrophages is mediated by coronin 1-dependent activation of calcineurin. .
- Jayaswal, S., Kamal, M.A., Dua, R., Gupta, S., Majumdar, T., Das, G., Kumar, D., and Rao, K.V. (2010). Identification of host-dependent survival factors for intracellular Mycobacterium tuberculosis through an siRNA screen. .
- Karnovsky, M. (1971). Use of ferrocyanide-reduced osmium tetroxide in electron microscopy.. In Proceedings of the Eleventh Annual Meeting of the American Society for Cell Biology.
- Keane, J., Remold, H.G., and Kornfeld, H. (2000). Virulent Mycobacterium tuberculosis strains evade apoptosis of infected alveolar macrophages. J Immunol 164, 2016-2020.
- Kimura, S., Noda, T., and Yoshimori, T. (2007). Dissection of the autophagosome maturation process by a novel reporter protein, tandem fluorescent-tagged LC3. .
- Klionsky, D.J., Abeliovich, H., Agostinis, P., Agrawal, D.K., Aliev, G., Askew, D.S., Baba, M., Baehrecke, E.H., Bahr, B.A., Ballabio, A., et al. (2008). Guidelines for the use and interpretation of assays for monitoring autophagy in higher eukaryotes. .
- Kobayashi, T., Stang, E., Fang, K.S., de Moerloose, P., Parton, R.G., and Gruenberg, J. (1998). A lipid associated with the antiphospholipid syndrome regulates endosome structure and function. Nature 392, 193-197.
- Koul, A., Herget, T., Klebl, B., and Ullrich, A. (2004). Interplay between mycobacteria and host signalling pathways. .
- Kuijl, C., Savage, N.D., Marsman, M., Tuin, A.W., Janssen, L., Egan, D.A., Ketema, M., van den Nieuwendijk, R., van den Eeden, S.J., Geluk, A., et al. (2007). Intracellular bacterial growth is controlled by a kinase network around PKB/AKT1. Nature 450, 725-730.
- Kumar, D., Nath, L., Kamal, M.A., Varshney, A., Jain, A., Singh, S., and Rao, K.V. (2010). Genome-wide analysis of the host intracellular network that regulates survival of Mycobacterium tuberculosis. .
- Laplante, M., and Sabatini, D.M. (2012). mTOR signaling in growth control and disease. Cell 149, 274-293.
- Matsuzawa, T., Kim, B.H., Shenoy, A.R., Kamitani, S., Miyake, M., and Macmicking, J.D. (2012). IFN-gamma elicits macrophage autophagy via the p38 MAPK signaling pathway. J Immunol 189, 813-818.
- Parvati K., Prakasa Rao B.S., and Mariya Das M.. (2008). Image Segmentation Using Gray-Scale Morphology and Marker-Controlled Watershed Transformation. Discrete Dynamics in Nature and Society 2008.
- Pieters, J. (2008). Mycobacterium tuberculosis and the macrophage: maintaining a balance. .
- Ponpuak, M., Davis, A.S., Roberts, E.A., Delgado, M.A., Dinkins, C., Zhao, Z., Virgin, H.W.t., Kyei, G.B., Johansen, T., Vergne, I., et al. (2010). Delivery of cytosolic components by autophagic adaptor protein p62 endows autophagosomes with unique antimicrobial properties. Immunity 32, 329-341.
- Poser, I., Sarov, M., Hutchins, J.R., Heriche, J.K., Toyoda, Y., Pozniakovsky, A., Weigl, D., Nitzsche, A., Hegemann, B., Bird, A.W., et al. (2008). BAC TransgeneOmics: a high-throughput method for exploration of protein function in mammals. .
- Regenthal, R., Krueger, M., Koeppel, C., and Preiss, R. (1999). Drug levels: therapeutic and toxic serum/plasma concentrations of common drugs. J .
- Rink, J., Ghigo, E., Kalaidzidis, Y., and Zerial, M. (2005). Rab conversion as a mechanism of progression from early to late endosomes. Cell 122, 735-749.
- Roerdink, A.M.a.J.B.T.M. (2000). The watershed transform: definitions, algorithms, and parallelization strategies. Fundamenta Informaticae 41, 187-228.
- Rossi, M., Munarriz, E.R., Bartesaghi, S., Milanese, M., Dinsdale, D., Guerra-Martin, M.A., Bampton, E.T., Glynn, P., Bonanno, G., Knight, R.A., et al. (2009). Desmethylclomipramine induces the accumulation of autophagy markers by blocking autophagic flux. J Cell Sci 122, 3330-3339.
- Russell, D.G. (2001). Mycobacterium tuberculosis: here today, and here tomorrow. Nat Rev .
- Schmid, S.L., and Cullis, P.R. (1998). Membrane sorting. Endosome marker is fat not fiction. Nature 392, 135-136.
- Schwegmann, A., and Brombacher, F. (2008). Host-directed drug targeting of factors hijacked by pathogens. .
- Seglen, P.O., and Gordon, P.B. (1982). 3-Methyladenine: specific inhibitor of autophagic/lysosomal protein degradation in isolated rat hepatocytes. Proc Natl Acad Sci U S A 79, 1889-1892.
- Settembre, C., Di Malta, C., Polito, V.A., Garcia Arencibia, M., Vetrini, F., Erdin, S., Erdin, S.U., Huynh, T., Medina, D., Colella, P., et al. (2011). TFEB links autophagy to lysosomal biogenesis. Science 332, 1429-1433.
- Shubin, H., Sherson, J., Pennes, E., Glaskin, A., and Sokmensuer, A. (1958). Prochlorperazine (compazine) as an aid in the treatment of pulmonary tuberculosis. Antibiotic .
- Simonsen, A., Lippe, R., Christoforidis, S., Gaullier, J.M., Brech, A., Callaghan, J., Toh, B.H., Murphy, C., Zerial, M., and Stenmark, H. (1998). EEA1 links PI(3)K function to Rab5 regulation of endosome fusion. Nature 394, 494-498.
- Swinney, D.C., and Anthony, J. (2011). How were new medicines discovered? Nat .
- Vergne, I., Chua, J., Lee, H.H., Lucas, M., Belisle, J., and Deretic, V. (2005). Mechanism of phagolysosome biogenesis block by viable Mycobacterium tuberculosis. Proc Natl Acad Sci U S A 102, 4033-4038.
- Zschocke, J., Zimmermann, N., Berning, B., Ganal, V., Holsboer, F., and Rein, T. (2011). Antidepressant drugs diversely affect autophagy pathways in astrocytes and neurons--dissociation from cholesterol homeostasis. Neuropsychopharmacology 36, 1754-1768.
-

Table 2: Description of the morphological parameters describing bacterial shape (see also Figure 9A) Parameter Description a. Median: Area Median area of bacteria estimated at half height of the fitting functions. b. Mean: Area: Weighted (Mean Intensity) Same as parameter a., but the mean area weighted by bacterial mean intensity is calculated. c. Mean: Area: Weighted (Integral Intensity) Same as parameter a., but the mean area weighted by bacterial integral intensity is calculated. d. Median: Elongation Median elongation of bacteria estimated at half height of the fitting functions. e. Mean: Elongation: Weighted (Mean Intensity) Same as parameter d., but the mean area weighted by bacterial mean intensity is calculated. f. Mean: Elongation: Weighted (Integral Intensity) Same as parameter d., but the mean area weighted by bacterial integral intensity is calculated. g. Mean: Bacteria area Mean object area measured on the contour of the segmented bacterial. h. Mean: Bacteria perimeter Mean object perimeter measured on the contour of the segmented bacteria. i. Mean: Bacteria compactness Mean object compactness measured on the contour of the segmented bacteria. Compactness is a measure of region non-smoothness, defined as the ratio between the actual area and the area a circle with the same perimeter would have. j. Mean: bacteria dispersion Mean object dispersion measured on the contour of the segmented bacteria. Dispersion is a measure of region irregularity, defined as the ratio of the major chord length (maximum circle enclosing the region) to the area. k. Mean: Bacteria relative dispersion Mean object relative dispersion measured on the contour of the segmented bacteria. Relative dispersion is a measure of region spreading, defined as the ratio of the maximal region radius and the minimal one. l. Mean: Bacteria elongation Mean object elongation measured on the contour of the segmented bacteria. Elongation is another measure of region Irregularity, defined as the ratio of the actual perimeter and the perimeter a circle with the same area would have. m. Mean: Bacteria eccentricity Mean object eccentricity measured on the contour of the segmented bacteria. Eccentricity is a measure of the elongation of the best fitting ellipse to the region, defined as 
n. Mean: Bacteria solidity Mean object solidity measured on the contour of the segmented bacteria. Solidity is a measure of region tightness, defined as the ratio between the region area and the area of the convex hull of the same region. o. Mean: Bacteria extent Mean object extent measured on the contour of the segmented bacteria. Extent is a measure of region extension defined as the ratio between the area of the minimal rectangle (bounding box) that encloses and the actual region area. 
Table 4: Compounds from cluster M5 and their pattern-specific score (PSS) Compounds PSS 12A-HYDROXY-9-DEMETHYLMUNDUSERONE-8-CARBOXYLIC ACID 0.838688 3;7-EPOXYCARYOPHYLLAN-6-OL 0.719354 ACEPHATE 0.657407 ALBIZZIINE 0.538698 ALVERINE CITRATE 1 AMITRIPTYLINE HYDROCHLORIDE 1 AMOXAPINE 0.99999 ANTHRALIN 0.701373 APIGENIN TRIACETATE 0.413001 ARACHIDONIC ACID 0.936708 ARCAINE SULFATE 0.768613 ARTEMISININ 0.495906 ARTHONIOIC ACID 0.81887 ATENOLOL 0.683277 ATRACTYLOSIDE POTASSIUM 0.667684 AZELASTINE HYDROCHLORIDE 0.980104 BAICALEIN 0.928898 BENZAMIL HYDROCHLORIDE 0.963588 BENZTROPINE 0.999999 BEPRIDIL HYDROCHLORIDE 1 BERGENIN 0.807155 BETULIN 0.924371 BUTAMBEN 0.580649 CARPROFEN 0.825904 CARYLOPHYLLENE OXIDE 0.578179 CEFADROXIL 0.671358 CEFDITORIN PIVOXIL 0.862599 CHAULMOOGRIC ACID; ETHYL ESTER 0.724781 CHLOROCRESOL 0.887429 CHLORPROMAZINE 0.999694 CHOLEST-5-EN-3-ONE 0.701001 CITICOLINE 0.50781 CLEMASTINE 1 CLOFOCTOL 0.941259 CLOMIPHENE CITRATE 0.999764 CLOMIPRAMINE HYDROCHLORIDE 0.999993 CLOPERASTINE HYDROCHLORIDE 0.999994 CYCLOBENZAPRINE HYDROCHLORIDE 0.999999 D;L-THREO-3-HYDROXYASPARTIC ACID 0.800381 DEOXYGUANOSINE 0.589927 DESIPRAMINE HYDROCHLORIDE 1 DEXTROMETHORPHAN HYDROBROMIDE 0.999996 DICYCLOMINE HYDROCHLORIDE 0.99985 DIENESTROL 0.592275 DIPHENYLPYRALINE HYDROCHLORIDE 0.992221 DOXEPIN HYDROCHLORIDE 0.984494 DROFENINE HYDROCHLORIDE 1 ENOXOLONE 0.42336 ETHOPROPAZINE HYDROCHLORIDE 1 ETHOXYQUIN 0.793273 FENDILINE HYDROCHLORIDE 1 FLUOROURACIL 0.775835 FLUOXETINE 0.999614 FLUPHENAZINE HYDROCHLORIDE 1 FORMONONETIN 0.522543 GLUCITOL-4-GUCOPYANOSIDE 0.883553 H89 0.963554 HALOPERIDOL 0.996028 HEDERAGENIN 0.62298 HEXETIDINE 0.961727 HIERACIN 0.316411 HYGROMYCIN B 1 IMIPRAMINE HYDROCHLORIDE 0.999999 IRIGENIN TRIMETHYL ETHER 0.790056 KETOCONAZOLE 0.831512 KETOTIFEN FUMARATE 0.991791 LOPERAMIDE HYDROCHLORIDE 0.999945 MAPROTILINE HYDROCHLORIDE 0.999816 MEBHYDROLIN NAPHTHALENESULFONATE 0.999885 MECLIZINE HYDROCHLORIDE 0.916186 MENTHYLBENZOATE 0.491647 METERGOLINE 0.98639 METHIOTHEPIN MALEATE 0.994122 N;N-DIMETHYLAMILORIDE 0.597645 NALBUPHINE HYDROCHLORIDE 0.832264 N-METHYL (-)EPHEDRINE 0.893618 NORSTICTIC ACID 0.531188 NORTRIPTYLINE 0.999856 OLMESARTAN MEDOXOMIL 0.564798 ORPHENADRINE CITRATE 0.873333 PEMPIDINE TARTRATE 0.847039 PENTOBARBITAL 0.57003 PERPHENAZINE 0.999998 PHYSOSTIGMINE SULFATE 0.750539 PIMETHIXENE MALEATE 1 PROCHLORPERAZINE EDISYLATE 0.999981 PROMAZINE HYDROCHLORIDE 0.999996 PROMETHAZINE HYDROCHLORIDE 0.999995 PROMETRYN 0.879264 PROPAFENONE HYDROCHLORIDE 0.999961 PYRVINIUM PAMOATE 0.855694 QUINALIZARIN 0.815755 ROFECOXIB 0.719237 RUTILANTINONE 0.97813 SERTRALINE HYDROCHLORIDE 1 SMILAGENIN 0.719768 SPAGLUMIC ACID 0.686382 SULOCTIDIL 0.999917 SUPROFEN METHYL ESTER 0.628898 TAMOXIFEN CITRATE 0.999925 TELITHROMYCIN 0.795677 THIAMPHENICOL 0.810423 THIOTEPA 0.887964 THIOTHIXENE 0.998498 TOTAROL ACETATE 0.790397 TRIFLUOPERAZINE HYDROCHLORIDE 0.999991 TRIFLUPROMAZINE HYDROCHLORIDE 0.990837 TRIHEXYPHENIDYL HYDROCHLORIDE 0.999994 TRIMEPRAZINE TARTRATE 1 TRIMIPRAMINE MALEATE 1 TUBOCURARINE CHLORIDE 0.794363 URSOCHOLANIC ACID 0.819147 VERATRIDINE 0.541782 XANTHOPTERIN 0.322306 XYLAZINE 0.901593 Table 5: List of compounds from the endocytosis clusters E1 and E2 Compounds from endocytosis cluster E1 Compounds from endocytosis cluster E2 ALBIZZIINE 3;7-EPOXYCARYOPHYLLAN-6-OL ALVERINE CITRATE ACEPHATE AMITRIPTYLINE HYDROCHLORIDE APIGENIN TRIACETATE AMOXAPINE ARTHONIOIC ACID ANTHRALIN ATENOLOL ARACHIDONIC ACID ATRACTYLOSIDE POTASSIUM ARCAINE SULFATE BENZAMIL HYDROCHLORIDE ARTEMISININ BERGENIN BAICALEIN CARPROFEN BETULIN CEFDITORIN PIVOXIL BUTAMBEN CHAULMOOGRIC ACID; ETHYL ESTER CEFADROXIL CHLOROCRESOL CHLORPROMAZINE CLOPERASTINE HYDROCHLORIDE CHOLEST-5-EN-3-ONE DEOXYGUANOSINE CITICOLINE DIENESTROL CLOFOCTOL FLUOROURACIL CLOMIPHENE CITRATE FLUOXETINE CLOMIPRAMINE HYDROCHLORIDE FLUPHENAZINE HYDROCHLORIDE CYCLOBENZAPRINE HYDROCHLORIDE GLUCITOL-4-GUCOPYANOSIDE DESIPRAMINE HYDROCHLORIDE HALOPERIDOL DEXTROMETHORPHAN HYDROBROMIDE HEDERAGENIN DIPHENYLPYRALINE HYDROCHLORIDE IRIGENIN TRIMETHYL ETHER DOXEPIN HYDROCHLORIDE KETOTIFEN FUMARATE ETHOPROPAZINE HYDROCHLORIDE METHIOTHEPIN MALEATE ETHOXYQUIN N;N-DIMETHYLAMILORIDE FORMONONETIN NALBUPHINE HYDROCHLORIDE HEXETIDINE NORSTICTIC ACID HYGROMYCIN B OLMESARTAN MEDOXOMIL IMIPRAMINE HYDROCHLORIDE PEMPIDINE TARTRATE KETOCONAZOLE PENTOBARBITAL LOPERAMIDE HYDROCHLORIDE PHYSOSTIGMINE SULFATE MAPROTILINE HYDROCHLORIDE PIMETHIXENE MALEATE MEBHYDROLIN NAPHTHALENESULFONATE PROMAZINE HYDROCHLORIDE MECLIZINE HYDROCHLORIDE PROMETHAZINE HYDROCHLORIDE MENTHYLBENZOATE PROMETRYN METERGOLINE PYRVINIUM PAMOATE NORIHIPTYLINE QUINALIZARIN PERPHENAZINE RUTILANTINONE PROCHLORPERAZINE EDISYLATE SPAGLUMIC ACID PROPAFENONE HYDROCHLORIDE SUPROFEN METHYL ESTER ROFECOXIB THIAMPHENICOL SERTRALINE HYDROCHLORIDE THIOTEPA SMILAGENIN THIOTHIXENE TAMOXIFEN CITRATE TOTAROL ACETATE TELITHROMYCIN TRIFLUOPERAZINE HYDROCHLORIDE TRIMEPRAZINE TARTRATE TRIFLUPROMAZINE HYDROCHLORIDE TRIMIPRAMINE MALEATE TRIHEXYPHENIDYL HYDROCHLORIDE XANTHOPTERIN TUBOCURARINE CHLORIDE URSOCHOLANIC ACID VERATRIDINE XYLAZINE
Claims (15)
- A compound capable of killing mycobacteria by activating host cellular mechanisms for use in treating tuberculosis, wherein the compound is selected from the group consisting of nortriptyline, haloperidol and prochlorperazine edisylate (PE).
- A pharmaceutical composition comprising as the single active agent the compound according to claim 1, and optionally a pharmaceutically acceptable carrier.
- The compound according to claim 1 or the pharmaceutical composition according to claim 2, having admixed thereto or associated in a separate container one or more agents selected from the group consisting of antibiotic compounds, arginine, vitamin D and IFN-γ.
- A method of treating tuberculosis comprising administering a pharmaceutically effective amount of a compound capable of killing mycobacteria by activating host cellular mechanisms to a subject in need thereof, wherein the compound is selected from the group consisting of nortriptyline, haloperidol and prochlorperazine edisylate (PE).
- The method according to claim 4, further comprising the administration of one or more agents selected from the group consisting of antibiotic compounds, arginine, vitamin D and IFN-γ.
- A method of identifying a lead compound for the treatment of tuberculosis, the method comprising the steps of:(a) incubating cells infected with mycobacteria with a test compound;(b) staining the cells with (a) detectable marker probe(s) or introducing into the cell a detectable marker probe;(c) obtaining a multi-parametric phenotypic profile of host cell parameters and bacterial parameters; and(d) clustering the multi-parametric phenotypic profile by using a modified Gabriel Neighbourhood and density estimate algorithm, which comprises:(i) computing multi-dimensional Gabriel neighbourhood graph over dataset, where nodes correspond to phenotypic profiles and edges determine the neighbourhood of nodes;(ii) filtering spurious as well as 'long-range' edges from the Gabriel graph;(iii) computing the density estimate for each node of the Gabriel graph using a kernel function, wherein the kernel function is chosen according to the selected multi-parametric profile dissimilarity measure;(iv) converting the modified Gabriel graph into weighted directed acyclic graph (WDAG) by assigning directionality to edges such that their point from nodes with lower density estimate to nodes with higher density estimate and edge weights are set proportional to the distances (dissimilarity) between neighbouring nodes, or, in the ambiguous case of equal density estimate of two neighbour nodes, one node is randomly chosen and a small arbitrary value (0.0000001) is added to its density estimate;(v) marking the nodes of the graph with no out-coming edges, ie. nodes having local maxima of density, as cluster centres; and(vi) assigning the remaining nodes to the cluster centers based on the shortest weighted path in the directed neighbourhood graph;wherein an alteration in bacterial parameters and a lack or substantial lack of alteration of host cell parameters in the presence of the test compound is indicative of a compound suitable as a lead compound for the treatment of tuberculosis.
- The method according to claim 6, wherein the cells are infected with mycobacteria that express a fluorescent protein marker.
- The method according to claim 6 or 7, wherein the bacterial parameters are selected from the group consisting of parameters related to the number of bacteria, parameters related to signal intensity of the bacteria and parameters related to the shape of the bacteria.
- The method according to any one of claims 6 to 8, wherein the host cell parameters are selected from the group consisting of parameters related to the morphology of the cell and parameters indicative of toxicity.
- The method according to any one of claims 6 to 9, wherein the bacterial parameters comprise at least(i) number of bacteria per cell (mean);(ii) total number of bacteria (per image);(iii) integral vesicle intensity of bacteria within infected cell;(iv) mean intensity of bacteria (non-weighted median);(v) mean area of bacteria (non-weighted median); and(vi) number of infected cells;and wherein the host cell parameters comprise at least(a) number of cells.
- The method of any one of claims 6 to 10, further comprising optimizing the pharmacological properties of the test compound identified as lead compound.
- The method of claim 11, wherein the optimization comprises modifying the test compound identified as lead compound to achieve:i) modified spectrum of activity, organ specificity, and/orii) improved potency, and/oriii) decreased toxicity (improved therapeutic index), and/oriv) decreased side effects, and/orv) modified onset of therapeutic action, duration of effect, and/orvi) modified pharmacokinetic parameters (resorption, distribution, metabolism and excretion), and/orvii) modified physico-chemical parameters (solubility, hygroscopicity, colour, taste, odour, stability, state), and/orviii) improved general specificity, organ/tissue specificity, and/orix) optimised application form and route
by(a) esterification of carboxyl groups, or(b) esterification of hydroxyl groups with carboxylic acids, or(c) esterification of hydroxyl groups to, e.g. phosphates, pyrophosphates or sulfates or hemi-succinates, or(d) formation of pharmaceutically acceptable salts, or(e) formation of pharmaceutically acceptable complexes, or(f) synthesis of pharmacologically active polymers, or(g) introduction of hydrophilic moieties, or(h) introduction/exchange of substituents on aromates or side chains, change of substituent pattern, or(i) modification by introduction of isosteric or bioisosteric moieties, or(j) synthesis of homologous compounds, or(k) introduction of branched side chains, or(l) conversion of alkyl substituents to cyclic analogues, or(m) derivatisation of hydroxyl groups to ketales, acetales, or(n) N-acetylation to amides, phenylcarbamates, or(o) synthesis of Mannich bases, imines, or(p) transformation of ketones or aldehydes to Schiffs bases, oximes, acetales, ketales, enolesters, oxazolidines, thiazolidinesor combinations thereof. - A method of identifying the cellular pathway targeted by a test compound, the method comprising(a) treating a cell with the test compound and obtaining a multi-parametric phenotypic profile of the cell after said treatment;(b) providing a phenotypic profile obtained for the same cell type by introducing directed genetic perturbations to target genes of said cell;(c) comparing the multi-parametric phenotypic profile obtained in (a) with the phenotypic profile provided in (b) and identifying the genes whose perturbation leads to an identical or substantially identical phenotypic profile as the test compound; and(d) identifying the cellular pathways involving the genes identified in (c).
- The method of claim 13, wherein the directed genetic perturbations to target genes of the cell are introduced by use of RNAi.
- The method of claim 14, wherein the RNAi-mediated genetic perturbation is a genome-wide RNAi screen.
Priority Applications (1)
| Application Number | Priority Date | Filing Date | Title |
|---|---|---|---|
| EP13155069.1A EP2767275A1 (en) | 2013-02-13 | 2013-02-13 | Nortriptyline, haloperidol or prochlorperazine edisylate for use in the treatment of tuberculosis as well as two screening methods |
Applications Claiming Priority (1)
| Application Number | Priority Date | Filing Date | Title |
|---|---|---|---|
| EP13155069.1A EP2767275A1 (en) | 2013-02-13 | 2013-02-13 | Nortriptyline, haloperidol or prochlorperazine edisylate for use in the treatment of tuberculosis as well as two screening methods |
Publications (1)
| Publication Number | Publication Date |
|---|---|
| EP2767275A1 true EP2767275A1 (en) | 2014-08-20 |
Family
ID=47709989
Family Applications (1)
| Application Number | Title | Priority Date | Filing Date |
|---|---|---|---|
| EP13155069.1A Withdrawn EP2767275A1 (en) | 2013-02-13 | 2013-02-13 | Nortriptyline, haloperidol or prochlorperazine edisylate for use in the treatment of tuberculosis as well as two screening methods |
Country Status (1)
| Country | Link |
|---|---|
| EP (1) | EP2767275A1 (en) |
Cited By (1)
| Publication number | Priority date | Publication date | Assignee | Title |
|---|---|---|---|---|
| CN113218848A (en) * | 2021-04-30 | 2021-08-06 | 天津深析智能科技发展有限公司 | Method for judging non-specific cell population |
Citations (6)
| Publication number | Priority date | Publication date | Assignee | Title |
|---|---|---|---|---|
| BE577977A (en) | 1958-04-22 | 1959-08-17 | Paul Adriaan Jan Janssen | Novel aroylpiperidine derivatives and process for their preparation. |
| US2902484A (en) | 1954-04-27 | 1959-09-01 | Rhone Poulenc Sa | Phenthiazine derivatives and processes for their preparation |
| GB895309A (en) | 1959-11-18 | 1962-05-02 | Res Lab Dr C Janssen Nv | Pyrrolidine and piperidine derivatives |
| US20060039869A1 (en) * | 2004-08-17 | 2006-02-23 | Daniel Wermeling | Intranasal delivery of antipsychotic drugs |
| US20100215730A1 (en) * | 2009-02-20 | 2010-08-26 | Intrepid Therapeutics, Inc. | Compositions for Nasal Administration of Phenothiazines |
| WO2012154944A2 (en) * | 2011-05-10 | 2012-11-15 | Stc.Unm | Methods of treating autophagy-associated disorders and related pharmaceutical compositions, diagnostics, screening techniques and kits |
-
2013
- 2013-02-13 EP EP13155069.1A patent/EP2767275A1/en not_active Withdrawn
Patent Citations (7)
| Publication number | Priority date | Publication date | Assignee | Title |
|---|---|---|---|---|
| US2902484A (en) | 1954-04-27 | 1959-09-01 | Rhone Poulenc Sa | Phenthiazine derivatives and processes for their preparation |
| BE577977A (en) | 1958-04-22 | 1959-08-17 | Paul Adriaan Jan Janssen | Novel aroylpiperidine derivatives and process for their preparation. |
| GB895309A (en) | 1959-11-18 | 1962-05-02 | Res Lab Dr C Janssen Nv | Pyrrolidine and piperidine derivatives |
| US3438991A (en) | 1959-11-18 | 1969-04-15 | Res Lab Dr C Janssen Nv | 1-aroylalkyl derivatives of arylhydroxypyrrolidines and arylhydroxy-piperidines |
| US20060039869A1 (en) * | 2004-08-17 | 2006-02-23 | Daniel Wermeling | Intranasal delivery of antipsychotic drugs |
| US20100215730A1 (en) * | 2009-02-20 | 2010-08-26 | Intrepid Therapeutics, Inc. | Compositions for Nasal Administration of Phenothiazines |
| WO2012154944A2 (en) * | 2011-05-10 | 2012-11-15 | Stc.Unm | Methods of treating autophagy-associated disorders and related pharmaceutical compositions, diagnostics, screening techniques and kits |
Non-Patent Citations (76)
| Title |
|---|
| ALIX, E.; MUKHERJEE, S.; ROY, C.R.: "Subversion of membrane transport pathways by vacuolar pathogens.", J CELL BIOL, vol. 195, 2011, pages 943 - 952 |
| ARMSTRONG, J.A.; HART, P.D.: "Response of cultured macrophages to Mycobacterium tuberculosis, with observations on fusion of lysosomes with phagosomes", J EXP MED, vol. 134, 1971, pages 713 - 740 |
| BEHAR, S.M.; DIVANGAHI, M.; REMOLD, H.G.: "Evasion of innate immunity by Mycobacterium tuberculosis: is death an exit strategy?", NAT REV MICROBIOL, vol. 8, 2010, pages 668 - 674 |
| BRENK, R. ET AL.: "Lessons Learnt from Assembling Screening Libraries for Drug Discovery for Neglected Diseases", CHEMMEDCHEM, vol. 3, 2008, pages 435 - 444 |
| BUCCI, C.; PARTON, R.G.; MATHER, I.H.; STUNNENBERG, H.; SIMONS, K.; HOFLACK, B.; ZERIAL, M.: "The small GTPase rab5 functions as a regulatory factor in the early endocytic pathway", CELL, vol. 70, 1992, pages 715 - 728 |
| CASPI, A.; GRANEK, R.; ELBAUM, M.: "Diffusion and directed motion in cellular transport.", PHYS REV E STAT NONLIN SOFT MATTER PHYS, vol. 66, 2002, pages 011916 |
| CHEN, M.; GAN, H.; REMOLD, H.G.: "A mechanism of virulence: virulent Mycobacterium tuberculosis strain H37Rv, but not attenuated H37Ra, causes significant mitochondrial inner membrane disruption in macrophages leading to necrosis", J IMMUNOL, vol. 176, 2006, pages 3707 - 3716 |
| CHENG, Y.; MEAN SHIFT: "mode seeking, and clustering", IEEE TRANSACTIONS ON PATTERN ANALYSIS AND MACHINE INTELLIGENCE, vol. 17, 1995, pages 790 - 799, XP000527671, DOI: doi:10.1109/34.400568 |
| CHRISTOFORIDIS, S.; MCBRIDE, H.M.; BURGOYNE, R.D.; ZERIAL, M.: "The Rab5 effector EEA1 is a core component of endosome docking", NATURE, vol. 397, 1999, pages 621 - 625, XP002153257, DOI: doi:10.1038/17618 |
| COLLINET ET AL., NATURE, 2010 |
| COLLINET, C.; STOTER, M.; BRADSHAW, C.R.; SAMUSIK, N.; RINK, J.C.; KENSKI, D.; HABERMANN, B.; BUCHHOLZ, F.; HENSCHEL, R.; MUELLER,: "Systems survey of endocytosis by multiparametric image analysis", NATURE, vol. 464, 2010, pages 243 - 249 |
| COUSSENS ET AL., PNAS, vol. 109, no. 38, 2012, pages 15449 - 54 |
| DEL CONTE-ZERIAL, P.; BRUSCH, L.; RINK, J.C.; COLLINET, C.; KALAIDZIDIS, Y.; ZERIAL, M.; DEUTSCH, A: "Membrane identity and GTPase cascades regulated by toggle and cut-out switches.", MOL SYST BIOL, vol. 4, 2008, pages 206 |
| DESJARDINS, M.; HUBER, L.A.; PARTON, R.G.; GRIFFITHS, G.: "Biogenesis of phagolysosomes proceeds through a sequential series of interactions with the endocytic apparatus", J CELL BIOL, vol. 124, 1994, pages 677 - 688 |
| DHANDAYUTHAPANI, S.; VIA, L.E.; THOMAS, C.A.; HOROWITZ, P.M.; DERETIC, D.; DERETIC, V.: "Green fluorescent protein as a marker for gene expression and cell biology of mycobacterial interactions with macrophages", MOL MICROBIOL, vol. 17, 1995, pages 901 - 912 |
| DYER, M.D.; MURALI, T.M.; SOBRAL, B.W.: "The landscape of human proteins interacting with viruses and other pathogens", PLOS PATHOG, vol. 4, 2008, pages E32 |
| EGGERT, U.S.; KIGER, A.A.; RICHTER, C.; PERLMAN, Z.E.; PERRIMON, N.; MITCHISON, T.J.; FIELD, C.M.: "Parallel chemical genetic and genome-wide RNAi screens identify cytokinesis inhibitors and targets.", PLOS BIOL, vol. 2, 2004, pages E379 |
| FAIRN, G.D.; GRINSTEIN, S.: "How nascent phagosomes mature to become phagolysosomes", TRENDS IMMUNOL., 2012 |
| FORET, L.; DAWSON, J.E.; VILLASENOR, R.; COLLINET, C.; DEUTSCH, A.; BRUSCH, L.; ZERIAL, M.; KALAIDZIDIS, Y.; JULICHER, F.: "A general theoretical framework to infer endosomal network dynamics from quantitative image analysis", CURR BIOL, vol. 22, 2012, pages 1381 - 1390 |
| FRATTI, R.A.; BACKER, J.M.; GRUENBERG, J.; CORVERA, S.; DERETIC, V.: "Role of phosphatidylinositol 3-kinase and Rab5 effectors in phagosomal biogenesis and mycobacterial phagosome maturation arrest", J CELL BIOL, vol. 154, 2001, pages 631 - 644 |
| GABRIEL, K. R.; SOKAL, R. R.: "A new statistical approach to geographic variation analysis", SYSTEMATIC ZOOLOGY, vol. 18, no. 3, 1969, pages 259 - 270 |
| GALLUZZI, L.; AARONSON, S.A.; ABRAMS, J.; ALNEMRI, E.S.; ANDREWS, D.W.; BAEHRECKE, E.H.; BAZAN, N.G.; BLAGOSKLONNY, M.V.; BLOMGREN: "Guidelines for the use and interpretation of assays for monitoring cell death in higher eukaryotes", CELL DEATH DIFFER, vol. 16, 2009, pages 1093 - 1107 |
| GUTIERREZ, M.G.; MASTER, S.S.; SINGH, S.B.; TAYLOR, G.A.; COLOMBO, M.I.; DERETIC, V.: "Autophagy is a defense mechanism inhibiting BCG and Mycobacterium tuberculosis survival in infected macrophages", CELL, vol. 119, 2004, pages 753 - 766 |
| HARTWELL, L. H.; HOPFIELD, J. J.; LEIBLER, S.; MURRAY, A. W.: "From molecular to modular cell biology", NATURE, vol. 402, 1999, pages C47 - 52 |
| HOLZGRABE; BECHTOLD, DEUTSCHE APOTHEKER ZEITUNG, vol. 140, no. 8, 2000, pages 813 - 823 |
| HUANG, R.; SOUTHALL, N.; WANG, Y.; YASGAR, A.; SHINN, P.; JADHAV, A.; NGUYEN, D.T.; AUSTIN, C.P.: "The NCGC pharmaceutical collection: a comprehensive resource of clinically approved drugs enabling repurposing and chemical genomics", SCI TRANSL MED, vol. 3, 2011, pages 80PS16 |
| IMMING, P.; SINNING, C.; MEYER, A.: "Drugs, their targets and the nature and number of drug targets.", NAT REV DRUG DISCOV, vol. 5, 2006, pages 821 - 834 |
| JAMES C SACCHETTINI ET AL: "Drugs versus bugs: in pursuit of the persistent predator Mycobacterium tuberculosis", NATURE REVIEWS. MICROBIOLOGY, NATURE PUBLISHING GROUP, GB, vol. 6, no. 1, 1 June 2008 (2008-06-01), pages 41 - 52, XP009168873, ISSN: 1740-1526 * |
| JAYACHANDRAN, R.; SUNDARAMURTHY, V.; COMBALUZIER, B.; MUELLER, P.; KORF, H.; HUYGEN, K.; MIYAZAKI, T.; ALBRECHT, I.; MASSNER, J.;: "Survival of mycobacteria in macrophages is mediated by coronin 1-dependent activation of calcineurin.", CELL, vol. 130, 2007, pages 37 - 50 |
| JAYASWAL, S.; KAMAL, M.A.; DUA, R.; GUPTA, S.; MAJUMDAR, T.; DAS, G.; KUMAR, D.; RAO, K.V.: "Identification of host-dependent survival factors for intracellular Mycobacterium tuberculosis through an siRNA screen", PLOS PATHOG, vol. 6, 2010, pages E1000839 |
| KARNOVSKY, M.: "Use of ferrocyanide-reduced osmium tetroxide in electron microscopy", PROCEEDINGS OF THE ELEVENTH ANNUAL MEETING OF THE AMERICAN SOCIETY FOR CELL BIOLOGY, 1971 |
| KEANE, J.; REMOLD, H.G.; KORNFELD, H.: "Virulent Mycobacterium tuberculosis strains evade apoptosis of infected alveolar macrophages", J IMMUNOL, vol. 164, 2000, pages 2016 - 2020 |
| KIMURA, S.; NODA, T.; YOSHIMORI, T.: "Dissection of the autophagosome maturation process by a novel reporter protein, tandem fluorescent-tagged LC3.", AUTOPHAGY, vol. 3, 2007, pages 452 - 460 |
| KITTLER, R. ET AL.: "Genome-scale RNAi profiling of cell division in human tissue culture cells", NATURE CELL BIOLOGY, vol. 9, no. 140, 2007, pages 1 - 12, XP055209518, DOI: doi:10.1038/ncb1659 |
| KLIONSKY, D.J.; ABELIOVICH, H.; AGOSTINIS, P.; AGRAWAL, D.K.; ALIEV, G.; ASKEW, D.S.; BABA, M.; BAEHRECKE, E.H.; BAHR, B.A.; BALLA: "Guidelines for the use and interpretation of assays for monitoring autophagy in higher eukaryotes", AUTOPHAGY, vol. 4, 2008, pages 151 - 175 |
| KOBAYASHI, T.; STANG, E.; FANG, K.S.; DE MOERLOOSE, P.; PARTON, R.G.; GRUENBERG, J.: "A lipid associated with the antiphospholipid syndrome regulates endosome structure and function", NATURE, vol. 392, 1998, pages 193 - 197 |
| KOUL, A.; HERGET, T.; KLEBL, B.; ULLRICH, A.: "Interplay between mycobacteria and host signalling pathways", NAT REV MICROBIOL, vol. 2, 2004, pages 189 - 202 |
| KUBINYI: "Hausch-Analysis and Related Approaches", 1992, VCH VERLAG |
| KUIJL, C.; SAVAGE, N.D.; MARSMAN, M.; TUIN, A.W.; JANSSEN, L.; EGAN, D.A.; KETEMA, M.; VAN DEN NIEUWENDIJK, R.; VAN DEN EEDEN, S.J: "Intracellular bacterial growth is controlled by a kinase network around PKB/AKT1", NATURE, vol. 450, 2007, pages 725 - 730 |
| KUMAR, D.; NATH, L.; KAMAL, M.A.; VARSHNEY, A.; JAIN, A.; SINGH, S.; RAO, K.V.: "Genome-wide analysis of the host intracellular network that regulates survival of Mycobacterium tuberculosis", CELL, vol. 140, 2010, pages 731 - 743 |
| LAPLANTE, M.; SABATINI, D.M.: "mTOR signaling in growth control and disease", CELL, vol. 149, 2012, pages 274 - 293 |
| MADRID ET AL: "Synthesis and antitubercular activity of phenothiazines with reduced binding to dopamine and serotonin receptors", BIOORGANIC & MEDICINAL CHEMISTRY LETTERS, PERGAMON, ELSEVIER SCIENCE, GB, vol. 17, no. 11, 10 May 2007 (2007-05-10), pages 3014 - 3017, XP022068384, ISSN: 0960-894X, DOI: 10.1016/J.BMCL.2007.03.064 * |
| MAHALANOBIS, P. C.: "On the generalised distance in statistics", PROCEEDINGS OF THE NATIONAL INSTITUTE OF SCIENCES OF INDIA, vol. 2, no. 1, 1936, pages 49 - 55, Retrieved from the Internet <URL:http://en.wikipedia.org/wiki/Mahalanobis_distance> |
| MARK NIXON; ALBERTO S AGUADO, FEATURE EXTRACTION & IMAGE PROCESSING FOR COMPUTER VISION |
| MATSUZAWA, T.; KIM, B.H.; SHENOY, A.R.; KAMITANI, S.; MIYAKE, M.; MACMICKING, J.D.: "IFN- gamma elicits macrophage autophagy via the p38 MAPK signaling pathway", J IMMUNOL, vol. 189, 2012, pages 813 - 818 |
| MEINDL W: "ANTIMYKOBAKTERIELLE ANTIHISTAMINIKA//ANTIMYCOBACTERIAL ANTIHISTAMINICS", ARCHIV DER PHARMAZIE, WILEY VERLAG, WEINHEIM, vol. 322, no. 8, 1 January 1989 (1989-01-01), pages 493 - 497, XP008023938, ISSN: 0365-6233 * |
| OOSTHUIZEN ET AL., JOURNAL OF PSYCHOPHARMACOLOGY, vol. 15, no. 4, 2001, pages 251 - 5 |
| PARVATI K.; PRAKASA RAO B.S.; MARIYA DAS M.: "Image Segmentation Using Gray-Scale Morphology and Marker-Controlled Watershed Transformation", DISCRETE DYNAMICS IN NATURE AND SOCIETY, 2008 |
| PETERS; HENNION, J. MED. CHEM., vol. 7, no. 3, 1964, pages 390 - 392 |
| PIETERS, J.: "Mycobacterium tuberculosis and the macrophage: maintaining a balance", CELL HOST MICROBE, vol. 3, 2008, pages 399 - 407 |
| PONPUAK, M.; DAVIS, A.S.; ROBERTS, E.A.; DELGADO, M.A.; DINKINS, C.; ZHAO, Z.; VIRGIN, H.W.T.; KYEI, G.B.; JOHANSEN, T.; VERGNE, I: "Delivery of cytosolic components by autophagic adaptor protein p62 endows autophagosomes with unique antimicrobial properties", IMMUNITY, vol. 32, 2010, pages 329 - 341 |
| POSER, I.; SAROV, M.; HUTCHINS, J.R.; HERICHE, J.K.; TOYODA, Y.; POZNIAKOVSKY, A.; WEIGL, D.; NITZSCHE, A.; HEGEMANN, B.; BIRD, A.: "BAC TransgeneOmics: a high-throughput method for exploration of protein function in mammals", NAT METHODS, vol. 5, 2008, pages 409 - 415 |
| QUINN J.R. ET AL.: "Developing a Drug-like Natural Product Library", J. NAT. PROD., vol. 71, 2008, pages 464 - 468 |
| R. FISHER: "Frequency Distribution of the Values of the Correlation Coefficient in Samples from an Indefinitely Large Population", BIOMETRIKA, vol. 10, no. 4, 1915, pages 507 - 521 |
| R. FISHER: "On the probable error of correlation coefficient deduced from a small sample set", METRON, vol. 1, 1921, pages 3 - 32 |
| REGENTHAL, R.; KRUEGER, M.; KOEPPEL, C.; PREISS, R.: "Drug levels: therapeutic and toxic serum/plasma concentrations of common drugs.", J CLIN MONIT COMPUT, vol. 15, 1999, pages 529 - 544 |
| RINK, J.; GHIGO, E.; KALAIDZIDIS, Y.; ZERIAL, M.: "Rab conversion as a mechanism of progression from early to late endosomes", CELL, vol. 122, 2005, pages 735 - 749 |
| ROERDINK, A.M.A.J.B.T.M.: "The watershed transform: definitions, algorithms, and parallelization strategies", FUNDAMENTA INFORMATICAE, vol. 41, 2000, pages 187 - 228, XP002343514 |
| ROSSI, M.; MUNARRIZ, E.R.; BARTESAGHI, S.; MILANESE, M.; DINSDALE, D.; GUERRA-MARTIN, M.A.; BAMPTON, E.T.; GLYNN, P.; BONANNO, G.;: "Desmethylclomipramine induces the accumulation of autophagy markers by blocking autophagic flux", J CELL SCI, vol. 122, 2009, pages 3330 - 3339 |
| ROUSSEEUW, P. J.: "Silhouettes: A graphical aid to the interpretation and validation of cluster analysis", JOURNAL OF COMPUTATIONAL AND APPLIED MATHEMATICS, vol. 20, 1987, pages 53 - 65, XP055004128, DOI: doi:10.1016/0377-0427(87)90125-7 |
| RUSSELL, D.G.: "Mycobacterium tuberculosis: here today, and here tomorrow", NAT REV MOL CELL BIOL, vol. 2, 2001, pages 569 - 577 |
| S. RAMON-GARCIA ET AL: "Synergistic Drug Combinations for Tuberculosis Therapy Identified by a Novel High-Throughput Screen", ANTIMICROBIAL AGENTS AND CHEMOTHERAPY, vol. 55, no. 8, 16 May 2011 (2011-05-16), pages 3861 - 3869, XP055059891, ISSN: 0066-4804, DOI: 10.1128/AAC.00474-11 * |
| SCHMID, S.L.; CULLIS, P.R.: "Membrane sorting. Endosome marker is fat not fiction", NATURE, vol. 392, 1998, pages 135 - 136 |
| SCHON ET AL., EUR RESPIR J, vol. 21, 2003, pages 483 - 8 |
| SCHON ET AL., TUBERCULOSIS (EDINB, vol. 91, no. 5, September 2011 (2011-09-01), pages 370 - 7 |
| SCHWEGMANN, A.; BROMBACHER, F.: "Host-directed drug targeting of factors hijacked by pathogens.", SCI SIGNAL, vol. 1, 2008, pages RE8 |
| SEGLEN, P.O.; GORDON, P.B.: "3-Methyladenine: specific inhibitor of autophagic/lysosomal protein degradation in isolated rat hepatocytes", PROC NATL ACAD SCI USA, vol. 79, 1982, pages 1889 - 1892 |
| SETTEMBRE, C.; DI MALTA, C.; POLITO, V.A.; GARCIA ARENCIBIA, M.; VETRINI, F.; ERDIN, S.; ERDIN, S.U.; HUYNH, T.; MEDINA, D.; COLEL: "TFEB links autophagy to lysosomal biogenesis", SCIENCE, vol. 332, 2011, pages 1429 - 1433, XP055026290, DOI: doi:10.1126/science.1204592 |
| SHUBIN H ET AL: "Prochlorperazine (compazine) as an aid in the treatment of pulmonary tuberculosis.", ANTIBIOTIC MEDICINE & CLINICAL THERAPY MAY 1958, vol. 5, no. 5, May 1958 (1958-05-01), pages 305 - 309, XP009168870, ISSN: 0570-3107 * |
| SHUBIN, H.; SHERSON, J.; PENNES, E.; GLASKIN, A.; SOKMENSUER, A.: "Prochlorperazine (compazine) as an aid in the treatment of pulmonary tuberculosis", ANTIBIOTIC MED CLIN THER, vol. 5, 1958, pages 305 - 309, XP009168870 |
| SIMONSEN, A.; LIPPE, R.; CHRISTOFORIDIS, S.; GAULLIER, J.M.; BRECH, A.; CALLAGHAN, J.; TOH, B.H.; MURPHY, C.; ZERIAL, M.; STENMARK: "EEA1 links PI(3)K function to Rab5 regulation of endosome fusion", NATURE, vol. 394, 1998, pages 494 - 498, XP002131751 |
| SWINNEY, D.C.; ANTHONY, J.: "How were new medicines discovered?", NAT REV DRUG DISCOV, vol. 10, 2011, pages 507 - 519, XP055196321, DOI: doi:10.1038/nrd3480 |
| VERGNE, I.; CHUA, J.; LEE, H.H.; LUCAS, M.; BELISLE, J.; DERETIC, V.: "Mechanism of phagolysosome biogenesis block by viable Mycobacterium tuberculosis", PROC NATL ACAD SCI USA, vol. 102, 2005, pages 4033 - 4038 |
| WITTKOP, T. ET AL.: "Comprehensive cluster analysis with Transitivity Clustering", NATURE PROTOCOLS, vol. 6, 2011, pages 285 - 95 |
| Y. LIN ET AL: "Identification of antituberculosis agents that target ribosomal protein interactions using a yeast two-hybrid system", PROCEEDINGS OF THE NATIONAL ACADEMY OF SCIENCES, vol. 109, no. 43, 8 October 2012 (2012-10-08), pages 17412 - 17417, XP055060094, ISSN: 0027-8424, DOI: 10.1073/pnas.1110271109 * |
| ZSCHOCKE, J.; ZIMMERMANN, N.; BERNING, B.; GANAL, V.; HOLSBOER, F.; REIN, T.: "Antidepressant drugs diversely affect autophagy pathways in astrocytes and neurons--dissociation from cholesterol homeostasis.", NEUROPSYCHOPHARMACOLOGY, vol. 36, 2011, pages 1754 - 1768 |
Cited By (2)
| Publication number | Priority date | Publication date | Assignee | Title |
|---|---|---|---|---|
| CN113218848A (en) * | 2021-04-30 | 2021-08-06 | 天津深析智能科技发展有限公司 | Method for judging non-specific cell population |
| CN113218848B (en) * | 2021-04-30 | 2022-08-12 | 天津深析智能科技发展有限公司 | Method for judging non-specific cell population |
Similar Documents
| Publication | Publication Date | Title |
|---|---|---|
| Ge et al. | An integrative drug repositioning framework discovered a potential therapeutic agent targeting COVID-19 | |
| Smallwood et al. | Targeting metabolic reprogramming by influenza infection for therapeutic intervention | |
| Heiser et al. | Identification of potential treatments for COVID-19 through artificial intelligence-enabled phenomic analysis of human cells infected with SARS-CoV-2 | |
| Solís‐Arias et al. | Onychomycosis in children. A review | |
| Fernandes et al. | N-Acetylcysteine in depressive symptoms and functionality: a systematic review and meta-analysis | |
| Irwin et al. | Bedaquiline and pyrazinamide treatment responses are affected by pulmonary lesion heterogeneity in Mycobacterium tuberculosis infected C3HeB/FeJ mice | |
| Brodaty et al. | Screening for dementia in primary care: a comparison of the GPCOG and the MMSE | |
| Juarez et al. | Loperamide restricts intracellular growth of Mycobacterium tuberculosis in lung macrophages | |
| Radke et al. | Evaluation of current and emerging antimalarial medicines for inhibition of Toxoplasma gondii growth in vitro | |
| Broadstock et al. | Systematic review of the effectiveness of pharmacological treatments for adolescents and adults with autism spectrum disorder | |
| Zukerman et al. | Glaucoma heritability: Molecular mechanisms of disease | |
| Alam et al. | Downregulation of organic anion transporting polypeptide (OATP) 1B1 transport function by lysosomotropic drug chloroquine: implication in OATP-mediated drug-drug interactions | |
| EP3193875A1 (en) | Levocetirizine and montelukast in the treatment of inflammation mediated conditions | |
| Jamabo et al. | Tackling sleeping sickness: Current and promising therapeutics and treatment strategies | |
| Mslati et al. | Comprehensive consensus analysis of SARS-CoV-2 drug repurposing campaigns | |
| De Rycker et al. | Setting our sights on infectious diseases | |
| Wolle et al. | Ocular Chlamydia trachomatis infection: elimination with mass drug administration | |
| Buonfiglio et al. | Immunomodulatory and antioxidant drugs in glaucoma treatment | |
| Yan et al. | C1q/TNF-related protein 3 prevents diabetic retinopathy via AMPK-dependent stabilization of blood–retinal barrier tight junctions | |
| US20230190745A1 (en) | Use of metabolic regulators for the treatment of covid-19 | |
| Inacio et al. | (−)-Epigallocatechin 3-O-gallate as a new approach for the treatment of visceral Leishmaniasis | |
| Kandilarova et al. | Effective connectivity between the orbitofrontal cortex and the precuneus differentiates major psychiatric disorders: Results from a transdiagnostic spectral DCM study | |
| Washington et al. | Homocysteine and glaucoma | |
| Brown et al. | Open-label administration of lisdexamfetamine dimesylate improves executive function impairments and symptoms of attention-deficit/hyperactivity disorder in adults | |
| Gupta et al. | Inhalable particles for “pincer therapeutics” targeting nitazoxanide as bactericidal and host-directed agent to macrophages in a mouse model of tuberculosis |
Legal Events
| Date | Code | Title | Description |
|---|---|---|---|
| PUAI | Public reference made under article 153(3) epc to a published international application that has entered the european phase |
Free format text: ORIGINAL CODE: 0009012 |
|
| 17P | Request for examination filed |
Effective date: 20130213 |
|
| AK | Designated contracting states |
Kind code of ref document: A1 Designated state(s): AL AT BE BG CH CY CZ DE DK EE ES FI FR GB GR HR HU IE IS IT LI LT LU LV MC MK MT NL NO PL PT RO RS SE SI SK SM TR |
|
| AX | Request for extension of the european patent |
Extension state: BA ME |
|
| STAA | Information on the status of an ep patent application or granted ep patent |
Free format text: STATUS: THE APPLICATION IS DEEMED TO BE WITHDRAWN |
|
| 18D | Application deemed to be withdrawn |
Effective date: 20140821 |