EP2738264A1 - A method and system for determining behavior of thyroid tumor - Google Patents
A method and system for determining behavior of thyroid tumor Download PDFInfo
- Publication number
- EP2738264A1 EP2738264A1 EP13194017.3A EP13194017A EP2738264A1 EP 2738264 A1 EP2738264 A1 EP 2738264A1 EP 13194017 A EP13194017 A EP 13194017A EP 2738264 A1 EP2738264 A1 EP 2738264A1
- Authority
- EP
- European Patent Office
- Prior art keywords
- measurement
- genes
- tumor
- measured
- expression
- Prior art date
- Legal status (The legal status is an assumption and is not a legal conclusion. Google has not performed a legal analysis and makes no representation as to the accuracy of the status listed.)
- Granted
Links
- 208000024770 Thyroid neoplasm Diseases 0.000 title claims abstract description 82
- 208000013076 thyroid tumor Diseases 0.000 title claims abstract description 77
- 238000000034 method Methods 0.000 title claims abstract description 62
- 230000006399 behavior Effects 0.000 claims abstract description 30
- 108090000623 proteins and genes Proteins 0.000 claims description 185
- 230000014509 gene expression Effects 0.000 claims description 173
- 201000011510 cancer Diseases 0.000 claims description 96
- 238000005259 measurement Methods 0.000 claims description 91
- 206010028980 Neoplasm Diseases 0.000 claims description 60
- 238000002493 microarray Methods 0.000 claims description 35
- 208000003200 Adenoma Diseases 0.000 claims description 25
- 208000030901 thyroid gland follicular carcinoma Diseases 0.000 claims description 25
- 201000004260 follicular adenoma Diseases 0.000 claims description 22
- 208000030878 follicular thyroid adenoma Diseases 0.000 claims description 22
- 230000003211 malignant effect Effects 0.000 claims description 19
- 238000003199 nucleic acid amplification method Methods 0.000 claims description 16
- 238000010837 poor prognosis Methods 0.000 claims description 16
- 210000001685 thyroid gland Anatomy 0.000 claims description 14
- 102100032921 ATP-dependent 6-phosphofructokinase, liver type Human genes 0.000 claims description 13
- 102100040344 Allograft inflammatory factor 1-like Human genes 0.000 claims description 13
- 102100040006 Annexin A1 Human genes 0.000 claims description 13
- 108010069176 Connexin 30 Proteins 0.000 claims description 13
- 102000001051 Connexin 30 Human genes 0.000 claims description 13
- 108010024682 Core Binding Factor Alpha 1 Subunit Proteins 0.000 claims description 13
- 102000015775 Core Binding Factor Alpha 1 Subunit Human genes 0.000 claims description 13
- 102100027417 Cytochrome P450 1B1 Human genes 0.000 claims description 13
- 102100023266 Dual specificity mitogen-activated protein kinase kinase 2 Human genes 0.000 claims description 13
- 102100023600 Fibroblast growth factor receptor 2 Human genes 0.000 claims description 13
- 101710182389 Fibroblast growth factor receptor 2 Proteins 0.000 claims description 13
- 101000730830 Homo sapiens ATP-dependent 6-phosphofructokinase, liver type Proteins 0.000 claims description 13
- 101000890921 Homo sapiens Allograft inflammatory factor 1-like Proteins 0.000 claims description 13
- 101000959738 Homo sapiens Annexin A1 Proteins 0.000 claims description 13
- 101000725164 Homo sapiens Cytochrome P450 1B1 Proteins 0.000 claims description 13
- 101001019588 Homo sapiens Interleukin-17 receptor D Proteins 0.000 claims description 13
- 101000669513 Homo sapiens Metalloproteinase inhibitor 1 Proteins 0.000 claims description 13
- 101001132841 Homo sapiens Mitochondrial ribosome-associated GTPase 1 Proteins 0.000 claims description 13
- 101000988395 Homo sapiens PDZ and LIM domain protein 4 Proteins 0.000 claims description 13
- 101001102154 Homo sapiens Phosphatidylserine synthase 2 Proteins 0.000 claims description 13
- 101001048849 Homo sapiens Protein FAM162B Proteins 0.000 claims description 13
- 101000707561 Homo sapiens Splicing factor 3A subunit 2 Proteins 0.000 claims description 13
- 101000667308 Homo sapiens WD repeat-containing protein 18 Proteins 0.000 claims description 13
- 102100035015 Interleukin-17 receptor D Human genes 0.000 claims description 13
- 108010068353 MAP Kinase Kinase 2 Proteins 0.000 claims description 13
- 102100039364 Metalloproteinase inhibitor 1 Human genes 0.000 claims description 13
- 102100033815 Mitochondrial ribosome-associated GTPase 1 Human genes 0.000 claims description 13
- 102100029178 PDZ and LIM domain protein 4 Human genes 0.000 claims description 13
- 102100039300 Phosphatidylserine synthase 2 Human genes 0.000 claims description 13
- 102100023775 Protein FAM162B Human genes 0.000 claims description 13
- 102100031712 Splicing factor 3A subunit 2 Human genes 0.000 claims description 13
- 108010078184 Trefoil Factor-3 Proteins 0.000 claims description 13
- 102100039145 Trefoil factor 3 Human genes 0.000 claims description 13
- 102100039743 WD repeat-containing protein 18 Human genes 0.000 claims description 13
- 201000009030 Carcinoma Diseases 0.000 claims description 12
- 101710088083 Glomulin Proteins 0.000 claims description 12
- 101000823449 Homo sapiens Membrane protein FAM174B Proteins 0.000 claims description 12
- 101001062772 Homo sapiens Protein FAM234B Proteins 0.000 claims description 12
- 102100022625 Membrane protein FAM174B Human genes 0.000 claims description 12
- 102100023832 Prolyl endopeptidase FAP Human genes 0.000 claims description 12
- 102100030561 Protein FAM234B Human genes 0.000 claims description 12
- 201000010198 papillary carcinoma Diseases 0.000 claims description 12
- 238000004364 calculation method Methods 0.000 claims description 11
- 101001047038 Homo sapiens Inward rectifier potassium channel 13 Proteins 0.000 claims description 9
- 101000957346 Homo sapiens Multivesicular body subunit 12A Proteins 0.000 claims description 9
- 102100022843 Inward rectifier potassium channel 13 Human genes 0.000 claims description 9
- 102100038747 Multivesicular body subunit 12A Human genes 0.000 claims description 9
- 238000004393 prognosis Methods 0.000 claims description 9
- 102100038080 B-cell receptor CD22 Human genes 0.000 claims description 8
- 102100040644 Beta-galactosidase-1-like protein 2 Human genes 0.000 claims description 8
- 102100024151 Cadherin-16 Human genes 0.000 claims description 8
- 102100031043 Coiled-coil domain-containing protein 8 Human genes 0.000 claims description 8
- 102100031806 Fas-binding factor 1 Human genes 0.000 claims description 8
- 101000884305 Homo sapiens B-cell receptor CD22 Proteins 0.000 claims description 8
- 101001039068 Homo sapiens Beta-galactosidase-1-like protein 2 Proteins 0.000 claims description 8
- 101000762246 Homo sapiens Cadherin-16 Proteins 0.000 claims description 8
- 101000777367 Homo sapiens Coiled-coil domain-containing protein 8 Proteins 0.000 claims description 8
- 101001065295 Homo sapiens Fas-binding factor 1 Proteins 0.000 claims description 8
- 101000615030 Homo sapiens Mesenteric estrogen-dependent adipogenesis protein Proteins 0.000 claims description 8
- 101000655403 Homo sapiens Transcription factor CP2-like protein 1 Proteins 0.000 claims description 8
- 101000798532 Homo sapiens Transmembrane protein 171 Proteins 0.000 claims description 8
- 101000743490 Homo sapiens V-set and immunoglobulin domain-containing protein 2 Proteins 0.000 claims description 8
- -1 LOC644613 Proteins 0.000 claims description 8
- 102100021078 Mesenteric estrogen-dependent adipogenesis protein Human genes 0.000 claims description 8
- 102100030108 Mitochondrial ornithine transporter 1 Human genes 0.000 claims description 8
- 108091006411 SLC25A15 Proteins 0.000 claims description 8
- 108091006306 SLC2A11 Proteins 0.000 claims description 8
- 102100039667 Solute carrier family 2, facilitated glucose transporter member 11 Human genes 0.000 claims description 8
- 102100032866 Transcription factor CP2-like protein 1 Human genes 0.000 claims description 8
- 102100032478 Transmembrane protein 171 Human genes 0.000 claims description 8
- 102100038295 V-set and immunoglobulin domain-containing protein 2 Human genes 0.000 claims description 8
- 102100037362 Fibronectin Human genes 0.000 claims description 7
- 101001027128 Homo sapiens Fibronectin Proteins 0.000 claims description 7
- 101000641956 Homo sapiens Villin-like protein Proteins 0.000 claims description 7
- 102100033418 Villin-like protein Human genes 0.000 claims description 7
- 208000037168 Papillary Follicular Carcinoma Diseases 0.000 claims description 6
- 208000010576 undifferentiated carcinoma Diseases 0.000 claims description 5
- 208000031513 cyst Diseases 0.000 claims description 4
- 230000009790 vascular invasion Effects 0.000 claims description 4
- 108091008053 gene clusters Proteins 0.000 description 60
- 239000000523 sample Substances 0.000 description 43
- 239000012472 biological sample Substances 0.000 description 23
- 102000039446 nucleic acids Human genes 0.000 description 23
- 108020004707 nucleic acids Proteins 0.000 description 23
- 150000007523 nucleic acids Chemical class 0.000 description 23
- 238000004458 analytical method Methods 0.000 description 21
- 238000007621 cluster analysis Methods 0.000 description 17
- 230000001575 pathological effect Effects 0.000 description 16
- 210000001519 tissue Anatomy 0.000 description 16
- 238000002372 labelling Methods 0.000 description 12
- 230000003287 optical effect Effects 0.000 description 12
- 238000004590 computer program Methods 0.000 description 10
- 239000000126 substance Substances 0.000 description 10
- 210000004027 cell Anatomy 0.000 description 9
- 238000006243 chemical reaction Methods 0.000 description 9
- 239000003550 marker Substances 0.000 description 9
- 201000002510 thyroid cancer Diseases 0.000 description 9
- 206010018498 Goitre Diseases 0.000 description 8
- 238000003556 assay Methods 0.000 description 7
- 239000002299 complementary DNA Substances 0.000 description 7
- 230000003325 follicular Effects 0.000 description 7
- 230000035945 sensitivity Effects 0.000 description 7
- 208000033781 Thyroid carcinoma Diseases 0.000 description 5
- 230000003321 amplification Effects 0.000 description 5
- 238000010586 diagram Methods 0.000 description 5
- 238000009396 hybridization Methods 0.000 description 5
- 239000000047 product Substances 0.000 description 5
- 239000000243 solution Substances 0.000 description 5
- 208000013077 thyroid gland carcinoma Diseases 0.000 description 5
- YBJHBAHKTGYVGT-ZKWXMUAHSA-N (+)-Biotin Chemical compound N1C(=O)N[C@@H]2[C@H](CCCCC(=O)O)SC[C@@H]21 YBJHBAHKTGYVGT-ZKWXMUAHSA-N 0.000 description 4
- 208000035269 cancer or benign tumor Diseases 0.000 description 4
- 238000004891 communication Methods 0.000 description 4
- 238000003745 diagnosis Methods 0.000 description 4
- 230000036210 malignancy Effects 0.000 description 4
- 230000002285 radioactive effect Effects 0.000 description 4
- 239000000941 radioactive substance Substances 0.000 description 4
- 230000002380 cytological effect Effects 0.000 description 3
- 230000006870 function Effects 0.000 description 3
- 239000002773 nucleotide Substances 0.000 description 3
- 125000003729 nucleotide group Chemical group 0.000 description 3
- 150000003839 salts Chemical class 0.000 description 3
- HEDRZPFGACZZDS-UHFFFAOYSA-N Chloroform Chemical compound ClC(Cl)Cl HEDRZPFGACZZDS-UHFFFAOYSA-N 0.000 description 2
- ZHNUHDYFZUAESO-UHFFFAOYSA-N Formamide Chemical compound NC=O ZHNUHDYFZUAESO-UHFFFAOYSA-N 0.000 description 2
- 238000007397 LAMP assay Methods 0.000 description 2
- 101150033052 MAS5 gene Proteins 0.000 description 2
- 206010027476 Metastases Diseases 0.000 description 2
- 238000002944 PCR assay Methods 0.000 description 2
- 101100344462 Saccharomyces cerevisiae (strain ATCC 204508 / S288c) YDJ1 gene Proteins 0.000 description 2
- FAPWRFPIFSIZLT-UHFFFAOYSA-M Sodium chloride Chemical compound [Na+].[Cl-] FAPWRFPIFSIZLT-UHFFFAOYSA-M 0.000 description 2
- DBMJMQXJHONAFJ-UHFFFAOYSA-M Sodium laurylsulphate Chemical compound [Na+].CCCCCCCCCCCCOS([O-])(=O)=O DBMJMQXJHONAFJ-UHFFFAOYSA-M 0.000 description 2
- AUYYCJSJGJYCDS-LBPRGKRZSA-N Thyrolar Chemical class IC1=CC(C[C@H](N)C(O)=O)=CC(I)=C1OC1=CC=C(O)C(I)=C1 AUYYCJSJGJYCDS-LBPRGKRZSA-N 0.000 description 2
- 238000003491 array Methods 0.000 description 2
- 229960002685 biotin Drugs 0.000 description 2
- 235000020958 biotin Nutrition 0.000 description 2
- 239000011616 biotin Substances 0.000 description 2
- 239000008280 blood Substances 0.000 description 2
- 210000004369 blood Anatomy 0.000 description 2
- 238000009534 blood test Methods 0.000 description 2
- 239000003153 chemical reaction reagent Substances 0.000 description 2
- 230000000875 corresponding effect Effects 0.000 description 2
- 238000006073 displacement reaction Methods 0.000 description 2
- 230000000694 effects Effects 0.000 description 2
- 238000012333 histopathological diagnosis Methods 0.000 description 2
- 230000003902 lesion Effects 0.000 description 2
- 238000004020 luminiscence type Methods 0.000 description 2
- 230000009401 metastasis Effects 0.000 description 2
- 239000011259 mixed solution Substances 0.000 description 2
- 239000000203 mixture Substances 0.000 description 2
- 238000000491 multivariate analysis Methods 0.000 description 2
- 238000002559 palpation Methods 0.000 description 2
- 238000010827 pathological analysis Methods 0.000 description 2
- 238000003752 polymerase chain reaction Methods 0.000 description 2
- 238000003753 real-time PCR Methods 0.000 description 2
- 229910001415 sodium ion Inorganic materials 0.000 description 2
- 239000000758 substrate Substances 0.000 description 2
- 239000006228 supernatant Substances 0.000 description 2
- 238000001356 surgical procedure Methods 0.000 description 2
- 230000001225 therapeutic effect Effects 0.000 description 2
- 239000005495 thyroid hormone Substances 0.000 description 2
- 229940036555 thyroid hormone Drugs 0.000 description 2
- 230000002103 transcriptional effect Effects 0.000 description 2
- 239000000439 tumor marker Substances 0.000 description 2
- 238000002604 ultrasonography Methods 0.000 description 2
- 238000010200 validation analysis Methods 0.000 description 2
- VZSRBBMJRBPUNF-UHFFFAOYSA-N 2-(2,3-dihydro-1H-inden-2-ylamino)-N-[3-oxo-3-(2,4,6,7-tetrahydrotriazolo[4,5-c]pyridin-5-yl)propyl]pyrimidine-5-carboxamide Chemical compound C1C(CC2=CC=CC=C12)NC1=NC=C(C=N1)C(=O)NCCC(N1CC2=C(CC1)NN=N2)=O VZSRBBMJRBPUNF-UHFFFAOYSA-N 0.000 description 1
- QKNYBSVHEMOAJP-UHFFFAOYSA-N 2-amino-2-(hydroxymethyl)propane-1,3-diol;hydron;chloride Chemical compound Cl.OCC(N)(CO)CO QKNYBSVHEMOAJP-UHFFFAOYSA-N 0.000 description 1
- 239000012099 Alexa Fluor family Substances 0.000 description 1
- 108090001008 Avidin Proteins 0.000 description 1
- 206010004412 Benign neoplasm of thyroid gland Diseases 0.000 description 1
- 206010006187 Breast cancer Diseases 0.000 description 1
- 208000026310 Breast neoplasm Diseases 0.000 description 1
- 102000055006 Calcitonin Human genes 0.000 description 1
- 108060001064 Calcitonin Proteins 0.000 description 1
- 108020004414 DNA Proteins 0.000 description 1
- SHIBSTMRCDJXLN-UHFFFAOYSA-N Digoxigenin Natural products C1CC(C2C(C3(C)CCC(O)CC3CC2)CC2O)(O)C2(C)C1C1=CC(=O)OC1 SHIBSTMRCDJXLN-UHFFFAOYSA-N 0.000 description 1
- 102000004190 Enzymes Human genes 0.000 description 1
- 108090000790 Enzymes Proteins 0.000 description 1
- 208000007054 Medullary Carcinoma Diseases 0.000 description 1
- 108020004711 Nucleic Acid Probes Proteins 0.000 description 1
- 108020005187 Oligonucleotide Probes Proteins 0.000 description 1
- 108700005081 Overlapping Genes Proteins 0.000 description 1
- ISWSIDIOOBJBQZ-UHFFFAOYSA-N Phenol Chemical compound OC1=CC=CC=C1 ISWSIDIOOBJBQZ-UHFFFAOYSA-N 0.000 description 1
- 208000009453 Thyroid Nodule Diseases 0.000 description 1
- 238000013019 agitation Methods 0.000 description 1
- 239000011324 bead Substances 0.000 description 1
- 230000000903 blocking effect Effects 0.000 description 1
- BBBFJLBPOGFECG-VJVYQDLKSA-N calcitonin Chemical compound N([C@H](C(=O)N[C@@H](CC(C)C)C(=O)NCC(=O)N[C@@H](CCCCN)C(=O)N[C@@H](CC(C)C)C(=O)N[C@@H](CO)C(=O)N[C@@H](CCC(N)=O)C(=O)N[C@@H](CCC(O)=O)C(=O)N[C@@H](CC(C)C)C(=O)N[C@@H](CC=1NC=NC=1)C(=O)N[C@@H](CCCCN)C(=O)N[C@@H](CC(C)C)C(=O)N[C@@H](CCC(N)=O)C(=O)N[C@@H]([C@@H](C)O)C(=O)N[C@@H](CC=1C=CC(O)=CC=1)C(=O)N1[C@@H](CCC1)C(=O)N[C@@H](CCCNC(N)=N)C(=O)N[C@@H]([C@@H](C)O)C(=O)N[C@@H](CC(N)=O)C(=O)N[C@@H]([C@@H](C)O)C(=O)NCC(=O)N[C@@H](CO)C(=O)NCC(=O)N[C@@H]([C@@H](C)O)C(=O)N1[C@@H](CCC1)C(N)=O)C(C)C)C(=O)[C@@H]1CSSC[C@H](N)C(=O)N[C@@H](CO)C(=O)N[C@@H](CC(N)=O)C(=O)N[C@@H](CC(C)C)C(=O)N[C@@H](CO)C(=O)N[C@@H]([C@@H](C)O)C(=O)N1 BBBFJLBPOGFECG-VJVYQDLKSA-N 0.000 description 1
- 229960004015 calcitonin Drugs 0.000 description 1
- 238000002512 chemotherapy Methods 0.000 description 1
- 230000000295 complement effect Effects 0.000 description 1
- 230000002596 correlated effect Effects 0.000 description 1
- 238000012258 culturing Methods 0.000 description 1
- QONQRTHLHBTMGP-UHFFFAOYSA-N digitoxigenin Natural products CC12CCC(C3(CCC(O)CC3CC3)C)C3C11OC1CC2C1=CC(=O)OC1 QONQRTHLHBTMGP-UHFFFAOYSA-N 0.000 description 1
- SHIBSTMRCDJXLN-KCZCNTNESA-N digoxigenin Chemical compound C1([C@@H]2[C@@]3([C@@](CC2)(O)[C@H]2[C@@H]([C@@]4(C)CC[C@H](O)C[C@H]4CC2)C[C@H]3O)C)=CC(=O)OC1 SHIBSTMRCDJXLN-KCZCNTNESA-N 0.000 description 1
- 201000010099 disease Diseases 0.000 description 1
- 208000037265 diseases, disorders, signs and symptoms Diseases 0.000 description 1
- 238000010195 expression analysis Methods 0.000 description 1
- 238000000605 extraction Methods 0.000 description 1
- MHMNJMPURVTYEJ-UHFFFAOYSA-N fluorescein-5-isothiocyanate Chemical compound O1C(=O)C2=CC(N=C=S)=CC=C2C21C1=CC=C(O)C=C1OC1=CC(O)=CC=C21 MHMNJMPURVTYEJ-UHFFFAOYSA-N 0.000 description 1
- 238000000265 homogenisation Methods 0.000 description 1
- 230000009545 invasion Effects 0.000 description 1
- 239000003446 ligand Substances 0.000 description 1
- 238000007834 ligase chain reaction Methods 0.000 description 1
- 210000002751 lymph Anatomy 0.000 description 1
- 239000000463 material Substances 0.000 description 1
- 238000000691 measurement method Methods 0.000 description 1
- 208000023356 medullary thyroid gland carcinoma Diseases 0.000 description 1
- 238000002844 melting Methods 0.000 description 1
- 230000008018 melting Effects 0.000 description 1
- 238000002156 mixing Methods 0.000 description 1
- 238000010369 molecular cloning Methods 0.000 description 1
- 239000002853 nucleic acid probe Substances 0.000 description 1
- 238000001668 nucleic acid synthesis Methods 0.000 description 1
- 239000002751 oligonucleotide probe Substances 0.000 description 1
- 230000007170 pathology Effects 0.000 description 1
- 239000000049 pigment Substances 0.000 description 1
- 210000002381 plasma Anatomy 0.000 description 1
- 102000040430 polynucleotide Human genes 0.000 description 1
- 108091033319 polynucleotide Proteins 0.000 description 1
- 239000002157 polynucleotide Substances 0.000 description 1
- 229910001414 potassium ion Inorganic materials 0.000 description 1
- 238000010882 preoperative diagnosis Methods 0.000 description 1
- 238000002360 preparation method Methods 0.000 description 1
- 238000012545 processing Methods 0.000 description 1
- 238000000746 purification Methods 0.000 description 1
- 238000010839 reverse transcription Methods 0.000 description 1
- 210000002966 serum Anatomy 0.000 description 1
- 239000011780 sodium chloride Substances 0.000 description 1
- NRHMKIHPTBHXPF-TUJRSCDTSA-M sodium cholate Chemical compound [Na+].C([C@H]1C[C@H]2O)[C@H](O)CC[C@]1(C)[C@@H]1[C@@H]2[C@@H]2CC[C@H]([C@@H](CCC([O-])=O)C)[C@@]2(C)[C@@H](O)C1 NRHMKIHPTBHXPF-TUJRSCDTSA-M 0.000 description 1
- 239000004094 surface-active agent Substances 0.000 description 1
- 208000024891 symptom Diseases 0.000 description 1
- 238000012360 testing method Methods 0.000 description 1
- 238000002525 ultrasonication Methods 0.000 description 1
- 238000005406 washing Methods 0.000 description 1
Images


Classifications
-
- C—CHEMISTRY; METALLURGY
- C12—BIOCHEMISTRY; BEER; SPIRITS; WINE; VINEGAR; MICROBIOLOGY; ENZYMOLOGY; MUTATION OR GENETIC ENGINEERING
- C12Q—MEASURING OR TESTING PROCESSES INVOLVING ENZYMES, NUCLEIC ACIDS OR MICROORGANISMS; COMPOSITIONS OR TEST PAPERS THEREFOR; PROCESSES OF PREPARING SUCH COMPOSITIONS; CONDITION-RESPONSIVE CONTROL IN MICROBIOLOGICAL OR ENZYMOLOGICAL PROCESSES
- C12Q1/00—Measuring or testing processes involving enzymes, nucleic acids or microorganisms; Compositions therefor; Processes of preparing such compositions
- C12Q1/68—Measuring or testing processes involving enzymes, nucleic acids or microorganisms; Compositions therefor; Processes of preparing such compositions involving nucleic acids
- C12Q1/6876—Nucleic acid products used in the analysis of nucleic acids, e.g. primers or probes
- C12Q1/6883—Nucleic acid products used in the analysis of nucleic acids, e.g. primers or probes for diseases caused by alterations of genetic material
- C12Q1/6886—Nucleic acid products used in the analysis of nucleic acids, e.g. primers or probes for diseases caused by alterations of genetic material for cancer
-
- C—CHEMISTRY; METALLURGY
- C12—BIOCHEMISTRY; BEER; SPIRITS; WINE; VINEGAR; MICROBIOLOGY; ENZYMOLOGY; MUTATION OR GENETIC ENGINEERING
- C12Q—MEASURING OR TESTING PROCESSES INVOLVING ENZYMES, NUCLEIC ACIDS OR MICROORGANISMS; COMPOSITIONS OR TEST PAPERS THEREFOR; PROCESSES OF PREPARING SUCH COMPOSITIONS; CONDITION-RESPONSIVE CONTROL IN MICROBIOLOGICAL OR ENZYMOLOGICAL PROCESSES
- C12Q2600/00—Oligonucleotides characterized by their use
- C12Q2600/158—Expression markers
Definitions
- the present invention relates to a method and a system for determining behavior of thyroid tumor.
- thyroid tumor A disease in which nodules (tumors) are formed in the thyroid is generally referred to as "thyroid tumor".
- Thyroid tumors are benign in many cases. However, among the cases, there is a case of a malignant tumor called “thyroid carcinoma”.
- the diagnosis of thyroid tumors the presence of thyroid tumors is confirmed by palpation, ultrasonography or the like.
- cells are collected from the tumors by fine-needle aspiration and cytological diagnosis is performed.
- the cytological diagnosis is performed based on the observation results of the cells and thus the determination results may vary depending on the experience and skill of a tester.
- follicular adenoma benign tumor
- follicular carcinoma malignant tumor
- thyroid carcinoma there is also a blood test for examining thyroid hormone or tumor markers in the blood.
- the thyroid carcinoma is medullary carcinoma, the value of calcitonin in thyroid hormone and the value of tumor marker CEA are increased.
- the value of the tumor marker is not always increased.
- thyroid carcinoma cannot be diagnosed only by the results of the blood test.
- specimens which are not determined to be either benign or malignant in cytodiagnosis are analyzed using Thyroid FNA Analysis to classify them into benignancy or suspicion of malignancy. Further, the classified results are compared with the results based on histopathological diagnosis. In the histopathological diagnosis, 85 specimens of 265 specimens are determined to be malignant. In the gene expression analysis, 78 specimens of the 85 specimens are determined to be suspicious of malignancy. That is, as the classification performance, the sensitivity is 92%, the specificity is 52%, the positive predictive value (PPV) is 47%, and the negative predictive value (NPV) is 93%.
- follicular neoplasms which are particularly difficult to determine are classified into a follicular adenoma (benign) and follicular carcinoma (malignant) in the cytological diagnosis is calculated, the sensitivity is 95%, the specificity is 48%, the PPV is 30%, and the NPV is 98%.
- Determining behavior of thyroid tumor based on the analysis results of the gene expression is an objective means and it is considered to be useful for the tumors which are difficult to determine.
- the specificity and PPV are very low as described above.
- the thyroid tumors are benign in many cases. Therefore, in the determination method in which the specificity and PPV are low, benign tumors in many subjects are mistakenly determined to be malignant in practice. As a result, there is a possibility of performing unnecessary medical treatment on the subjects with benign tumors.
- the present inventors have exhaustively analyzed the expression levels of genes in diseased tissues with follicular adenoma and diseased tissues with follicular carcinoma. As a result, the present inventors have identified a gene cluster in which the expression is increased in benign and malignant tumors as a novel marker set. The present inventors have found that it is possible to determine whether thyroid tumor is a benign or malignant tumor based on the measured expression level of the marker set and it is possible to determine whether the malignant tumor is a tumor with poor prognosis, and have completed the present invention.
- the present invention provides a system adapted to a method for determining behavior of thyroid tumor.
- the system comprises a processor, and a memory, under control of said processor, including software instructions adapted to enable the system to perform operations.
- the operations comprise:
- the present invention provides a computer program product for enabling a computer to determine behavior of thyroid tumor.
- the product comprises a computer readable medium, and software instructions, on the computer readable medium, for enabling the computer to perform predetermined operations.
- the operations comprises:
- the present invention provides a method for determining behavior of thyroid tumor.
- the method comprises:
- the method for determining behavior of thyroid tumor of the present invention (hereinafter, also referred to as “determination method”), it is possible to determine whether thyroid tumor is a benign or malignant tumor with high accuracy.
- the method for determining behavior of thyroid tumor of the present invention (hereinafter, also referred to as “determination method”), it is possible to determine whether thyroid tumor is a benign or malignant tumor with high accuracy.
- the expression levels of at least 6 genes selected from a first gene cluster, the expression levels of at least 7 genes selected from a second gene cluster, and the expression levels of at least 7 genes selected from a third gene cluster are measured.
- thyroid tumors used herein means nodules (tumors) formed in the thyroid and intends to include both benign and malignant tumors.
- thyroid tumors are also referred to as “thyroid nodules” or “adenomatous goiter”.
- determining behavior of thyroid tumor means determining whether the thyroid tumor is benign or malignant.
- the thyroid tumor can include determining whether the tumor is a malignant tumor with poor prognosis or a malignant tumor with good prognosis.
- malignant tumor with poor prognosis means a malignant tumor which has a high degree of malignancy and a high possibility of recurrence and/or metastasis among the malignant thyroid tumors and thus has a high mortality rate in patients.
- malignant tumor with good prognosis means a malignant tumor which has a low degree of malignancy and a low possibility of recurrence and/or metastasis among the malignant thyroid tumors and thus has a low mortality rate in patients.
- the malignant tumor with poor prognosis largely differs in therapeutic strategies from the malignant tumor with good prognosis. Consequently, distinction between the malignant tumor with poor prognosis and the malignant tumor with good prognosis becomes useful information in determination of therapeutic strategies.
- subjects with thyroid tumors used herein means subjects who are confirmed to have thyroid tumors or strongly suspected to have thyroid tumors by palpation or ultrasonography.
- the biological sample is not particularly limited as long as it is a sample derived from a living body which contains cells derived from the thyroid of the subject. Particularly, a sample derived from a living body which contains cells derived from the lesion site in the thyroid is preferred.
- the sample derived from a living body include blood, serum, plasma, lymph, cells collected by fine-needle aspiration, and tissues collected by surgery. Further, cultures obtained by culturing the cells and tissues extracted from subjects may also be used as a biological sample.
- gene cluster used herein means a group consisting of plural genes.
- the term "gene expression level" used herein means an amount of RNA transcribed from each gene or an amount of material reflecting the amount. Therefore, in the embodiment of the present invention, a nucleic acid (particularly RNA) is extracted from a biological sample. The amount of RNA derived from each gene contained in the nucleic acid or the amount of cRNA obtained by IVT-amplification of cDNA or cDNA obtained by reverse transcription of the RNA is measured as the gene expression level. The amount of RNA transcribed from each gene is small in many cases. Accordingly, it is preferable to measure the amount of cDNA obtained from the RNA or the amount of cRNA.
- RNA can be extracted from a biological sample by, for example, a method comprising mixing the biological sample with a treatment solution containing a surfactant which solubilizes cells or tissues (sodium cholate, sodium dodecyl sulfate etc.), physically treating (agitation, homogenization, ultrasonication etc.) the resulting mixture to release RNA contained in the biological sample into the mixed solution.
- a treatment solution containing a surfactant which solubilizes cells or tissues (sodium cholate, sodium dodecyl sulfate etc.), physically treating (agitation, homogenization, ultrasonication etc.) the resulting mixture to release RNA contained in the biological sample into the mixed solution.
- the mixed solution containing the released RNA is centrifuged to recover a supernatant, and the supernatant is extracted with phenol/chloroform to purify the RNA.
- the extraction and purification of RNA from the biological sample can be performed using a commercially available kit.
- the base sequences themselves of the respective genes are known. These base sequences can be obtained from, for example, a known database (http://www.ncbi.nlm.nih.gov/ (provided by National Center for Biotechnology Information (NCBI)). The NCBI Accession Nos and Probe IDs of the genes, and Seq ID Nos. of oligonucleotide probes included in each probe set are shown in Table 1. The IDs are up to date as of November 16, 2012. Probe ID is a number for identifying probes on GeneChip (registered trademark) Human Genome U133 Plus 2.0 Array (Affymetrix, Inc.). The base sequences of probes can be obtained from, for example, the website of Affymetrix, Inc.
- the 37 genes are a cluster of genes in which the fact that the expression in cases with benign and malignant tumors is increased is found out by the present inventors.
- the first gene cluster is a cluster of genes in which an increase in the expression of the cases with benign tumors is more than that of the cases with malignant tumors.
- the second and third gene clusters are a cluster of genes in which an increase in the expression of the cases with malignant tumors is more than that of the cases with benign tumors.
- the present inventors have found that the expression of the second gene cluster is increased, particularly in the cases of malignant tumors with poor prognosis, and the expression of the third gene cluster is increased, particularly in the cases of malignant tumors with good prognosis.
- the expression level of any of the genes of the first, second, and third gene clusters there is no particular restriction to measure the expression level of any of the genes of the first, second, and third gene clusters, and it can be arbitrarily selected.
- the determination method of the present invention is not limited to the example.
- the method for measuring the gene expression level is not particularly limited and it can be selected from any known method in the art.
- a measurement method using a microarray or a nucleic acid amplification method is preferred.
- the microarray used for the determination method of the present invention is not particularly limited as long as it is a chip in which a nucleic acid probe having about 20 to 25 nucleotides which can specifically hybridize to cDNA or cRNA derived from RNAs transcribed from the genes or the RNAs (hereinafter, also referred to as "target nucleic acid molecule") is immobilized on an appropriate substrate.
- the probe can be appropriately designed based on the base sequences of the genes.
- the microarray can be produced by any known method in the art. In the embodiment of the present invention, a commercially available microarray may be used as long as the probe which can specifically hybridize to the target nucleic acid molecule is mounted. Examples of the microarray include GeneChip (registered trademark, manufactured by Affymetrix, Inc.).
- the term "can specifically hybridize” means that a probe can hybridize to a target nucleic acid molecule under a stringent condition.
- stringent condition means a condition under which the probe can hybridize to the target nucleic acid molecule with a detectably higher extent than it does to a nucleic acid molecule other than the target nucleic acid molecule (e.g. more than at least two times of the background).
- the stringent condition generally depends on the sequences and varies depending on various circumstances. Generally, the stringent condition is selected so that it is about 5°C lower than a thermal melting point (Tm) of the specific sequence under a certain ionic strength and pH.
- Tm thermal melting point
- This Tm is a temperature at which 50% of the complementary probe hybridizes to the base sequence of the target nucleic acid molecule in equilibrium (under a certain ionic strength, pH and nucleic acid composition).
- Such condition may be those which are used in hybridization techniques between polynucleotides known in the art. Specifically, it may be a condition of pH 7.0 to 9.0, a salt concentration of lower than about 1.5 M Na-ion, more specifically about 0.01 to 1.0 M Na-ion concentration (or other salt), and a temperature of at least about 30°C.
- the stringent condition in a microarray technique includes the hybridization at 37°C in 50% formamide, 1 M NaCl, and 1% SDS; and washing at 60 to 65°C in 0.1 ⁇ SSC.
- the target nucleic acid molecule is preferably labeled with a labeling substance known in the art. Labeling of the target nucleic acid molecule facilitates measurement of a signal from a probe on a microarray.
- RNA extracted from a biological sample may be labeled.
- cDNA or cRNA derived from the RNA is labeled.
- the labeling substance include fluorescent substances, haptens such as biotin, and radioactive substances. Examples of the fluorescent substances include Cy3, Cy5, FITC, Alexa Fluor (trademark).
- a method for labeling RNA, cDNA, and cRNA with these labeling substances is known in the art.
- the gene expression level is obtained as a signal from a probe, such as fluorescence intensity, luminescence intensity or amount of current.
- a probe such as fluorescence intensity, luminescence intensity or amount of current.
- Each of the signals may be detected using a scanner installed in a general microarray analyzer. Examples of the scanner include GeneChip (registered trademark) Scanner 3000 7G (Affymetrix, Inc.) and Illumina (registered trademark) Bead Array Reader (Illumina).
- nucleic acid amplification method suitable for the determination method of the present invention examples include a polymerase-chain-reaction (PCR) assay, a strand displacement activity assay, a ligase-chain-reaction assay, and a transcriptional amplification method. These nucleic acid amplification methods themselves are known in the art.
- PCR assay for example, a real-time RT-PCR assay is listed.
- strand displacement activity assay for example, a real-time RT-LAMP assay (refer to, for example, US6410278 ) is listed.
- transcriptional amplification method for example, a TAS assay is listed. Among these methods, the real-time RT-PCR assay and the real-time RT-LAMP assay are preferred.
- the primer to be used for a nucleic acid amplification method is not particularly limited as long as it is a primer which can be amplified by specific hybridization to the target nucleic acid molecule.
- the stringent condition in the PCR assay may be a condition of pH 7.0 to 9.0, 0.01 to 0.1 M Tris HCl, 0.05 to 0.15 M K-ion concentration (or other salt), and a temperature of at least about 55°C.
- Such a primer can be appropriately designed based on the base sequences of the respective genes.
- the primer is preferably designed according to the type of the nucleic acid amplification method.
- the length of the primer is usually from 5 to 50 nucleotides, preferably from 10 to 40 nucleotides.
- the primer can be produced by any nucleic acid synthesis method known in the art.
- the primer may be labeled with any labeling substance known in the art. Labeling of the primer may be performed using radioactive elements or non-radioactive molecules. Examples of the radioactive isotope include 32 P, 33 P, 35 S, 3 H, and 125 I. Examples of the non-radioactive substance include ligands such as biotin, avidin, streptoavidin, and digoxigenin; hapten, pigment, and luminescent reagents such as chemiluminescent, bioluminescent, fluorescent and phosphorescent reagents.
- the reaction condition of the nucleic acid amplification method varies depending on the type of the nucleic acid amplification method and the base sequences of the primer, and it can be appropriately set with reference to, for example, a method described in Molecular Cloning: A Laboratory Manual (2nd ed.) (Sambrook, J. et al. Cold Spring Harbor Laboratory Press, New York (1989 )).
- the gene expression level is measured as described above, followed by determining whether the thyroid tumor in the subject with thyroid tumor is benign or malignant based on the measured expression levels of genes of the first, second, and third gene clusters in the determination method of the present invention.
- the benign tumor is not particularly limited as long as it is a thyroid tumor known to be benign in the art, and it preferably means at least one of follicular adenoma, adenomatous nodules, and cysts.
- the malignant tumor is not particularly limited as long as it is a thyroid tumor known to be malignant in the art, and it preferably means at least one of follicular carcinoma, papillary carcinoma, poorly-differentiated carcinoma, and undifferentiated carcinoma.
- the malignant tumor includes a malignant tumor with poor prognosis and a malignant tumor with good prognosis.
- the expression states of the gene clusters are compared based on the measured expression levels of genes of the first, second, and third gene clusters and the determination is performed based on the results. That is, when the expression state of the genes measured in the first measurement is more than or equal to the expression state of the genes measured in the second measurement, and when the expression state of the genes measured in the first measurement is more than or equal to the expression state of the genes measured in the third measurements, the thyroid tumor of the subject is determined to be benign. On the contrary, when the expression state of the genes measured in either the second or third measurement is more than the expression state of the genes measured in the first measurement, the thyroid tumor of the subject is determined to be malignant.
- the term "expression state of genes selected from the gene cluster” means an indicator of the level or tendency of the gene expression in a plurality of genes selected from predetermined gene clusters.
- a measure of central tendency of the expression levels (measured value) in a plurality of selected genes is listed.
- the measure of central tendency is not particularly limited as long as it is a statistics value which summarizes the distribution of the gene expression in a plurality of genes selected from predetermined gene clusters. Examples of the measure of central tendency include an average, a median, a maximum, and a mode. Among them, the average is particularly preferred.
- the expression state is increased means a measure of central tendency of the expression levels in a plurality of genes selected from certain gene clusters is higher than that of the expression levels in a plurality of genes selected from the remaining gene clusters. Therefore, when an average of the expression levels is used as an expression state of genes selected from a gene cluster, comparison of the expression states is performed as follows. As for biological samples of subjects, the sum of the expression levels of at least 6 genes selected from the first gene cluster is calculated. The calculated value is divided by the number of the selected genes to obtain an average. The same calculation is performed on at least 7 genes selected from the second and third gene clusters. Then, the obtained three averages are compared.
- the thyroid tumor of the subject is determined to be benign.
- the thyroid tumor of the subject is determined to be malignant.
- the expression state of genes selected from each of the gene clusters in biological samples of subjects may be obtained by using the expression level data previously obtained as for the cases with benign and malignant tumors in which behavior is determined by pathological diagnosis (control samples).
- control samples pathological diagnosis
- the multivariate analysis is performed using the expression level data previously obtained as for the control samples so that a formula which reflects or predicts the expression states of genes selected from the gene clusters can be obtained.
- the information on the expression states of the gene clusters in the biological samples of the subjects is obtained by using the obtained formula. Based on the information, the samples can be determined.
- Preferable examples of the multivariate analysis include discriminant analysis.
- the discriminant analysis examples include Fischer's linear discriminant analysis, Mahalanobis distance-based discriminant analysis, Euclid distance-based discriminant analysis, Multi-group discriminant analysis, variable selection, and canonical discriminant analysis. Among them, particularly the Euclid distance-based discriminant analysis is preferred.
- the Euclid distance shows similarity in gene expression patterns among the control samples and the biological samples of the subjects.
- the Euclid distance can be obtained as follows. Based on the expression level data of the control samples which is previously obtained, the control samples are first classified into three groups by the cluster analysis known in the art.
- the three groups are referred to as "Cluster 1" with predominant expression of genes selected from the first gene cluster, "Cluster 2" with predominant expression of genes selected from the second gene cluster, and "Cluster 3” with predominant expression of genes selected from the third gene cluster, respectively.
- the data of the expression levels of the groups is plotted to calculate an average of the groups. Then, as for the average of the groups and the expression level data obtained from the biological samples of the subjects, Euclid distances among the control samples and the biological samples of the subjects are calculated.
- the term "expression state is increased" means that a Euclid distance between data of a certain cluster and the data of the subject is closer than an Euclid distance between data of the remaining clusters and the data of the subject. Therefore, comparison of the expression states is performed as follows. Three Euclid distances calculated are compared. For example, when the distance from Cluster 1 is the closest, the thyroid tumor of the subject is determined to be benign. On the contrary, when the distance from Cluster 2 or Cluster 3 is the closest, the thyroid tumor of the subject is determined to be malignant.
- the expression states of genes selected from the gene clusters are compared based on the measured expression levels of genes of the first, second, and third gene clusters. Based on the results, behavior of thyroid tumor in a subject can be determined as follows.
- the thyroid tumor of the subject is determined to be benign.
- the thyroid tumor of the subject is determined to a first malignant tumor.
- the thyroid tumor of the subject is determined to a second malignant tumor.
- first malignant tumor used herein means a malignant tumor with poor prognosis and the term “second malignant tumor” means a malignant tumor with good prognosis.
- the malignant tumor with poor prognosis is not particularly limited as long as it is a malignant thyroid tumor which is known to be poor prognosis in the art.
- Preferable examples thereof include at least one of undifferentiated carcinoma, poorly-differentiated carcinoma, and follicular carcinoma with widely invasive and/or vascular invasion.
- the malignant tumor with poor prognosis is not particularly limited as long as it is a malignant thyroid tumor which is known to be poor prognosis in the art.
- Preferable examples thereof include at least one of papillary carcinoma and follicular carcinoma without widely invasive and vascular invasion.
- a marker set for determining behavior of thyroid tumor (hereinafter also referred to as “marker set”) is included in the scope of the present invention.
- the marker set of the present invention includes at least 6 genes selected from the first gene cluster, at least 7 genes selected from the second gene cluster, and at least 7 genes selected from the third gene cluster.
- the marker set of the present invention is not limited to the example.
- the expression levels of genes in a sample containing RNAs prepared from the biological sample collected from the subject is analyzed and the behavior of thyroid tumor in the subject can be determined based on the obtained expression levels.
- the measurement and analysis of the expression levels of the markers are the same as described above.
- kits for determining behavior of thyroid tumor are included in the scope of the present invention. That is, the present invention provides the kit for determining behavior of thyroid tumor including a probe set or primer set for measuring the expression levels of at least 6 genes selected from the first gene cluster composed of AIF1L, CDH16, FAM162B, FGFR2, GJB6, KCNJ13, KIAA1467, SLC25A15, TFCP2L1, TFF3, and TMEM171, the expression levels of at least 7 genes selected from the second gene cluster composed of C4orf10, CCDC8, CD22, FAM125A, FAM174B, FBF1, GLB1L2, LOC644613, MAP2K2, MTG1, PFKL, PTDSS2, SF3A2, SLC2A11, VILL, VSIG2, and WDR18, and the expression levels of at least 7 genes selected from the third gene cluster composed of ANXA1, C13orf33, CY
- the kit of the present invention can be suitably used for the determination method of the present invention.
- the probe and primer sets included in the kit of the present invention are the same described in the probe or primer which can specifically hybridize to the target nucleic acid molecule.
- the kit of the present invention may be in the form of microarray in which the probe is immobilized on an appropriate substrate.
- kits including a probe set or primer set for measuring at least the expression levels of AIF1L, FAM162B, FGFR2, GJB6, KIAA1467, and TFF3 of the first gene cluster, at least the expression levels of FAM174B, MAP2K2, MTG1, PFKL, PTDSS2, SF3A2, and WDR18 of the second gene cluster, and at least the expression levels of ANXA1, CYP1B1, FAP, IL17RD, PDLIM4, RUNX2, and TIMP1 of the third gene cluster is listed.
- the kit of the present invention is not limited to the example.
- the determination of behavior of thyroid tumor can be performed by, for example, the determination system 1 shown in Fig. 4 .
- the present invention will be more specifically described with reference to the attached drawings; however, the present invention is not limited to the embodiment.
- Fig. 1 is an outline explanatory view of a system according to one embodiment of the present invention.
- the determination system 1 shown in Fig. 1 includes a measurement device 2 and a computer system 3 connected to the measurement device 2.
- the measurement device 2 is a microarray scanner that detects a signal based on the hybridization of the probe and the target nucleic acid molecule on a microarray.
- the measurement device 2 detects signals corresponding to expression levels of genes selected from a first gene cluster, a second gene cluster, and a third gene cluster.
- the signals represent optical information.
- the optical information for example, a fluorescent signal is listed; however, the present invention is not limited only thereto.
- the measurement device 2 obtains optical information based on the target nucleic acid molecule bound to the probe on the microarray and sends the obtained optical information to the computer system 3.
- any microarray scanner may be used as long as it can detect a signal based on the target nucleic acid molecule.
- the signal varies depending on the labeling substance used for labeling cDNA or cRNA in the measurement sample.
- one suitable for detecting the signal from the labeling substance can be appropriately selected according to the type of the labeling substance.
- the labeling substance is a radioactive substance
- a microarray scanner which can detect radioactive rays from the radioactive substance can be used as the measurement device 2.
- the measurement device 2 may be a nucleic acid amplification detector.
- a reaction solution containing DNA from a biological sample, an enzyme for nucleic acid amplification, and a primer is set in the measurement device 2.
- the nucleic acid in the reaction solution is amplified by the nucleic acid amplification method.
- the measurement device 2 obtains optical information such as fluorescence generated from the reaction solution by the amplification reaction or turbidity of the reaction solution and sends the optical information to the computer system 3.
- the computer system 3 includes a computer main body 3a, an input device 3b, and a display unit 3c that displays specimen information, determination results, and the like.
- the computer system 3 receives optical information from the measurement device 2.
- the processor of the computer system 3 executes a program that determines behavior of thyroid tumor based on the optical information.
- Fig. 5 is a block diagram showing a functional configuration of the determination system shown in Fig. 4 .
- the computer system 3 comprises an acquisition unit 301, a memory unit 302, a calculation unit 303, a determination unit 304, and an output unit 305 as shown in Fig. 5 .
- the acquisition unit 301 is communicably connected to the measurement device 2 via a network.
- the calculation unit 303 and the determination unit 304 form a control unit 306.
- the acquisition unit 301 obtains information sent from the measurement device 2.
- the memory unit 302 stores a program that distinguishes behavior of thyroid tumor.
- the calculation unit 303 calculates fluorescence intensity etc. using information obtained by the acquisition unit 301 and analyzes the gene expression state. As described above, as the gene expression state, for example, a measure of central tendency of the expression levels (measured values) in a plurality of selected genes is listed.
- the determination unit 304 determines behavior of thyroid tumor based on the gene expression state analyzed by the calculation unit 303 and determination criteria stored in the memory unit 302.
- the output unit 305 outputs determination results by the determination unit 304.
- Fig. 6 is a block diagram showing a hardware configuration of the determination system shown in Fig. 4 .
- the computer main body 3a comprises a CPU (Central Processing Unit) 30, a ROM (Read Only Memory) 121, a ROM 32, a hard disk 33, an input/output interface 34, a read-out device 35, a communication interface 36, and an image output interface 37.
- the CPU 30, the ROM 31, the RAM (Random Access Memory) 32, the hard disk 33, the input/output interface 34, the read-out device 35, the communication interface 36, and the image output interface 37 are data-communicably connected by a bus 38.
- the CPU 30 is capable of executing the computer programs stored in the ROM 31 and the computer programs loaded in the ROM 32.
- the CPU 30 executes an application program to realize the blocking of the functions.
- the computer system functions as a terminal of a system for determining behavior of thyroid tumor.
- the ROM 31 is configured by mask ROM, PROM, EPROM, EEPROM, and the like. Computer programs to be executed by the CPU 30 and data used for the same are recorded in the ROM 31.
- the ROM 32 is configured by SRAM, DRAM, and the like.
- the ROM 32 is used to read out the computer programs recorded on the ROM 31 and the hard disc 33. In executing the computer program, the ROM 32 is used as a work region of the CPU 30.
- the hard disk 33 is installed with an operating system to be executed by the CPU 30, a computer program such as an application program (computer program for determining the presence or absence of sensitivity to preoperative chemotherapy on breast cancer), and data used to execute the computer program.
- a computer program such as an application program (computer program for determining the presence or absence of sensitivity to preoperative chemotherapy on breast cancer), and data used to execute the computer program.
- the read-out device 35 is configured by a flexible disk drive, a CD-ROM drive, a DVD-ROM drive, and the like.
- the read-out device 35 is able to read out computer programs or data recorded on a portable recording medium 40.
- the input/output interface 34 includes a serial interface such as USB, IEEE1394, and RS-232C; a parallel interface such as SCSI, IDE, and IEEE1284; and an analog interface such as D/A converter and A/D converter.
- the input/output interface 34 is connected to the input device 3b such as a keyboard and a mouse. Operators can use the input device 3b to input data into the computer main body 3a.
- the communication interface 36 is, for example, an Ethernet (registered trademark) interface.
- the computer system 3 can receive optical information from the measurement device 2 through the communication interface 36 and send print data to a printer.
- the image output interface 37 is connected to the display unit 3c configured by LCD, CRT, or the like.
- the display unit 3c can output an image signal corresponding to the image data provided from the CPU 30.
- the display unit 3c displays an image (screen) according to the input image signal.
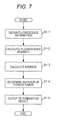
- Fig. 7 is a flow chart of the determination using the determination system shown in Fig. 4 .
- the present invention will be described using fluorescence information based on a nucleic acid being measured which is bound to a probe on a microarray and taking an example of the case where averages as "the expression states of genes selected from the gene clusters" are used to perform determination.
- the present invention is not limited only to the embodiment.
- step S1-1 the acquisition unit 301 of the determination system 1 first obtains fluorescence information from the measurement device 2.
- the calculation unit 303 calculates fluorescence intensity from the fluorescence information obtained by the acquisition unit 301 and sends it to the memory unit 302.
- step S1-3 the calculation unit 303 calculates an average of the expression levels of a plurality of selected genes based on the fluorescence intensity stored in the memory unit 302.
- step S1-4 the determination unit 304 determines behavior of thyroid tumor using an average calculated by the calculation unit 303 and determination criteria stored in the memory unit 302. The determination results are sent to the output unit 305.
- step S1-5 the output unit 305 outputs the determination results, allows the display unit 3c to display them, and allows the printer to print them.
- Fig. 8 is a view showing the method for determining behavior of thyroid tumor according to the determination of the present invention.
- determination results shown in the right column of Fig. 8 are obtained.
- an inequality sign ">" in Fig.8 means that the expression state shown on the left side is accelerated more than the expression state shown on the right side is.
- the biological samples obtained as follows were used. First, pathological diagnosis of thyroid lesion tissues extracted from patients with thyroid tumors by surgery was performed. These tissues were classified into one of the cases of adenomatous goiter, follicular adenoma, follicular carcinoma (including poorly-differentiated carcinoma), and papillary carcinoma. These tissues were used as biological samples and cryopreserved at -80°C.
- tissue specimens of 25 cases which was pathologically classified into follicular neoplasm 11 cases with follicular adenoma and 14 cases with follicular carcinoma
- RNAs 100 to 200 ng
- the amplified RNAs were added to GeneChip (registered trademark) Human Genome U133 Plus 2.0 Array (Affymetrix Inc.) to react them at 65°C for 16 hours.
- the RNAs were hybridized to probes on the array.
- the hybridized probes were stained using GeneChip (registered trademark) Hybridization, Wash, and Stain Kit (Affymetrix Inc.). Subsequently, the luminescence signals were detected using Genechip (registered trademark) Scanner 3000 (Affymetrix Inc.).
- the signal value data (CELL file) obtained by a microarray was normalized by MAS5 using Expression Console (Affymetrix Inc.). Thereafter, the probe whose function was not clear and which had no name was removed. As for probes having overlapping genes, probes other than the probe having the highest signal were removed. As for the signal values of the remaining probes, log-conversion in the base of 2 was performed to calculate CV values of the probes. The top 5000 genes with significant change among the 25 cases (11 cases with follicular adenoma and 14 cases with follicular carcinoma) were extracted. The 5000 genes were Z-scored.
- cluster 3.0 open source, obtained from the following web site; http://bonsai.hgc.jp/-mdehoon/software/cluster/). Specifically, the analysis procedure is as follows. The Cluster ring tab in the hierarchy of Cluster 3.0 was opened. The box of [Cluster] of [Genes] and the box of [Cluster] of [Arrays] were checked. As for Similarity Metric, the box of [Correlation(Centered)] in [Genes] and [Arrays] was selected. As for Clustering Method, the box of [Centroid linkage] was selected. Thus, the cluster analysis was conducted.
- Clusters 1, 2, and 3 The results of the cluster analysis were analyzed using Java Treeview (open source, obtained from the following web site; http://sourceforge.net/projects/jtreeview/). As a result of the cluster analysis using the 5000 genes, it is found that the 25 cases are classified into three groups (Clusters 1, 2, and 3).
- Cluster 1 in Cluster 1 the expressions of 11 genes: AIF1L, CDH16, FAM162B, FGFR2, GJB6, KCNJ13, KIAA1467, SLC25A15, TFCP2L1, TFF3, and TMEM171 are increased, in Cluster 2 the expressions of 17 genes: C4orf10, CCDC8, CD22, FAM125A, FAM174B, FBF1, GLB1L2, LOC644613, MAP2K2, MTG1, PFKL, PTDSS2, SF3A2, SLC2A11, VILL, VSIG2, and WDR18 are increased, and in Cluster 3 the expression of 9 genes: ANXA1, C13orf33, CYP1B1, FAP, FN1, IL17RD, PDLIM4, RUNX2, and TIMP1 are increased.
- first gene cluster in which the expression is increased in Clusters 1, 2, and 3 are referred to as "first gene cluster", "second gene cluster”, and "third gene cluster”, respectively
- Example 1 Twenty genes below were extracted from the 37 genes and the cluster analysis was performed in the same manner as in Example 1. As a result, 25 cases were classified into three groups in the same manner as in Example 1.
- Cluster 1 the expressions of 6 genes: AIF1L, FAM162B, FGFR2, GJB6, KCNJ13, and TFF3 are increased
- Cluster 2 the expressions of 7 genes: FAM125A, MAP2K2, MTG1, PFKL, PTDSS2, SF3A2, and WDR18 are increased
- Cluster 3 the expressions of 7 genes: ANXA1, CYP1B1, FAP, IL17RD, PDLIM4, RUNX2, and TIMP1 are increased.
- Example 1 It was examined whether the cluster was reproduced even when a specimen different from the tissue specimen used in Example 1 was used.
- tissue specimens in 71 cases different from the Learning set 33 cases with follicular adenoma, 38 cases with follicular carcinoma
- RNAs were extracted from the specimens and the expression levels of the 37 genes were measured using the microarray in the same manner as described in Example 1.
- the signal value data (CELL file) obtained by a microarray was normalized by MAS5 using Expression Console (Affymetrix Inc.).
- the signal values of the 37 genes selected in Example 1 were extracted.
- the resulting values were subjected to log-conversion in the base of 2 and further the log-converted values were Z-scored.
- RNAs were extracted from the tissue specimens and the expression levels of the 37 genes were measured using the microarray in the same manner as described in Example 1.
- the procedure of cluster analysis is the same as in Example 1. As a result, the 24 cases could be classified into three groups (refer to Fig. 3 ).
- Cluster analysis 37 genes Cluster 1 Cluster 2 Cluster 3 Benign tumor First malignant tumor Second malignant tumor Pathological classification Benign tumor 13 0 1 Malignant tumor 0 4 6
- Cluster 1 13 cases of 13 cases
- malignant tumors were concentrated in Clusters 2 and 3 (Cluster 2: 4 cases of 4 cases
- Cluster 3 6 cases of 7 cases).
- the 37 genes were used and thyroid tumors were classified into three groups. It was found that the cases classified into Cluster 1 were determined as benign tumor, and the cases classified into Cluster 2 or 3 were determined as malignant tumor.
- RNAs were extracted from the specimens and the expression levels of the 37 genes (signal values from probes) were measured using the microarray in the same manner as described in Example 1. The signal values were subjected to log-conversion in the base of 2. In this example, averages of the log-converted signal values as for the first, second, and third gene clusters were compared, and the determination formula for classifying each case into each Cluster was tried (hereinafter, also referred to as "determination formula (I)").
- the determination formula (I) was applied to all the 87 cases and the cluster classification was performed. As a result, among the 87 cases, 38 cases were classified into Cluster 1, 23 cases were classified into Cluster 2, and 26 cases were classified into Cluster 3. The results obtained by correlating the determination formula-based classification with the pathological classification are shown in Table 6. [Table 6] Determination formula (I) 37 genes Cluster 1 Cluster 2 Cluster 3 Benign tumor First malignant tumor Second malignant tumor Pathological classification Benign tumor 32 6 7 Malignant tumor 6 17 19
- Example 2 The 20 genes used in Example 2 were used and classifications of 45 cases with benign tumors (adenomatous goiter and follicular adenoma) and 42 cases with malignant tumors (papillary carcinoma and follicular carcinoma) were performed by the determination formula (I) in the same manner as described in Example 5. As a result, among the 87 cases, 43 cases were classified into Cluster 1, 25 cases were classified into Cluster 2, and 19 cases were classified into Cluster 3. The results obtained by correlating the determination formula-based classification with the pathological classification are shown in Table 7. [Table 7] Determination formula (I) 20 genes Cluster 1 Cluster 2 Cluster 3 Benign tumor First malignant tumor Second malignant tumor Pathological classification Benign tumor 34 7 4 Malignant tumor 9 18 15
- Example 5 it is intended to construct a determination formula different from that of Example 5.
- tissue specimens in 45 cases with benign tumor (adenomatous goiter and follicular adenoma) and 42 cases with malignant tumors (papillary carcinoma and follicular carcinoma) were used.
- RNAs were extracted from the specimens and the expression levels of the 37 genes (signal values from probes) were measured using the microarray in the same manner as described in Example 1.
- the determination formula to classify the genes based on the gene expression patterns of the cases calculated by the primary linear equation and distances from the three clusters classified in Example 1 was tried (hereinafter, the formula is referred to as "determination formula (II)").
- the procedure of determination by the determination formula (II) will be described.
- the signal values of the 37 genes as for the Learning set used in Example 1 were plotted. Differences among the expression levels for the respective clusters were used to classify the genes into three clusters. The three clusters are the same as Clusters 1, 2, and 3 in Example 1. Then, an average of signal values of the clusters was calculated. A Euclid distance between the average of the clusters and data of signal values of the 87 cases was calculated by the primary linear equation. The distances from the clusters in the respective cases were compared. The respective cases were classified into the cluster with the closest distance. As a result, among the 87 cases, 33 cases were classified into Cluster 1, 35 cases were classified into Cluster 2, and 19 cases were classified into Cluster 3.
- Example 2 The 20 genes used in Example 2 were used and classifications of 45 cases with benign tumors (adenomatous goiter and follicular adenoma) and 42 cases with malignant tumors (papillary carcinoma and follicular carcinoma) were performed by the determination formula (II) in the same manner as described in Example 7. As a result, among the 87 cases, 33 cases were classified into Cluster 1, 29 cases were classified into Cluster 2, and 25 cases were classified into Cluster 3. The results obtained by correlating the determination formula-based classification with the pathological classification are shown in Table 9. [Table 9] Determination formula (II) 20 genes Cluster 1 Cluster 2 Cluster 3 Benign tumor First malignant tumor Second malignant tumor Pathological classification Benign tumor 27 11 7 Malignant tumor 6 18 18 18
- Example 7 a difference between Cluster 2 and Cluster 3 was examined from the viewpoint of the prognosis in malignant tumor.
- follicular carcinoma poorly-differentiated carcinoma, widely invasive -type follicular carcinoma, and follicular carcinoma withvascular invasion are generally known as poor-prognostic malignant tumors.
- the cases used in Example 7 include 15 cases which are malignant tumors with poor prognosis of the cases. Then, it was examined into which Cluster these cases were classified in Example 7. The results are shown in Table 10.
- Table 10 Determination formula (II) 37 genes Cluster 1 Cluster 2 Cluster 3 Benign tumor First malignant tumor Second malignant tumor Pathological classification Benign tumor 0 0 0 Malignant tumor 0 11 4
Abstract
Description
- The present invention relates to a method and a system for determining behavior of thyroid tumor.
- A disease in which nodules (tumors) are formed in the thyroid is generally referred to as "thyroid tumor". Thyroid tumors are benign in many cases. However, among the cases, there is a case of a malignant tumor called "thyroid carcinoma". In the diagnosis of thyroid tumors, the presence of thyroid tumors is confirmed by palpation, ultrasonography or the like. When the presence of thyroid tumors can be confirmed, in order to determine behavior (whether the tumors are benign or malignant), cells are collected from the tumors by fine-needle aspiration and cytological diagnosis is performed. However, the cytological diagnosis is performed based on the observation results of the cells and thus the determination results may vary depending on the experience and skill of a tester. Like the cases of follicular adenoma (benign tumor) and follicular carcinoma (malignant tumor), there are cases which have difficulty in being determined by even a skilled tester.
- In the test for thyroid carcinoma, there is also a blood test for examining thyroid hormone or tumor markers in the blood. For example, it is known that when the thyroid carcinoma is medullary carcinoma, the value of calcitonin in thyroid hormone and the value of tumor marker CEA are increased. However, if the symptoms of thyroid carcinoma are shown, the value of the tumor marker is not always increased. Thus, thyroid carcinoma cannot be diagnosed only by the results of the blood test.
- On the other hand, methods based on gene expression information have been recently studied and developed as new methods for determining behavior of thyroid tumor. For example, a microarray called Afirma (registered trademark) Thyroid FNA Analysis from Veracyte, Inc. is currently commercially available. Further, Alexander EK. et al. (Preoperative Diagnosis of Benign Thyroid Nodules with Indeterminate Cytology. NEng J Med, 2012; 367: 705-715)) discloses the results obtained by determining behavior of thyroid tumor using the Thyroid FNA Analysis. Specifically, as for specimens which are not determined to be either benign or malignant in cytodiagnosis (n=265), expression information of 142 genes is analyzed using Thyroid FNA Analysis to classify them into benignancy or suspicion of malignancy. Further, the classified results are compared with the results based on histopathological diagnosis. In the histopathological diagnosis, 85 specimens of 265 specimens are determined to be malignant. In the gene expression analysis, 78 specimens of the 85 specimens are determined to be suspicious of malignancy. That is, as the classification performance, the sensitivity is 92%, the specificity is 52%, the positive predictive value (PPV) is 47%, and the negative predictive value (NPV) is 93%. If performance when follicular neoplasms which are particularly difficult to determine (n=105) are classified into a follicular adenoma (benign) and follicular carcinoma (malignant) in the cytological diagnosis is calculated, the sensitivity is 95%, the specificity is 48%, the PPV is 30%, and the NPV is 98%.
- Determining behavior of thyroid tumor based on the analysis results of the gene expression is an objective means and it is considered to be useful for the tumors which are difficult to determine. However, in the case of the determination using the currently commercially available Thyroid FNA Analysis, the specificity and PPV are very low as described above. On the other hand, the thyroid tumors are benign in many cases. Therefore, in the determination method in which the specificity and PPV are low, benign tumors in many subjects are mistakenly determined to be malignant in practice. As a result, there is a possibility of performing unnecessary medical treatment on the subjects with benign tumors.
- The scope of the present invention is defined solely by the appended claims, and is not affected to any degree by the statements within this summary.
- The present inventors have exhaustively analyzed the expression levels of genes in diseased tissues with follicular adenoma and diseased tissues with follicular carcinoma. As a result, the present inventors have identified a gene cluster in which the expression is increased in benign and malignant tumors as a novel marker set. The present inventors have found that it is possible to determine whether thyroid tumor is a benign or malignant tumor based on the measured expression level of the marker set and it is possible to determine whether the malignant tumor is a tumor with poor prognosis, and have completed the present invention.
- That is, the present invention provides a system adapted to a method for determining behavior of thyroid tumor. The system comprises a processor, and a memory, under control of said processor, including software instructions adapted to enable the system to perform operations. The operations comprise:
- determining whether a thyroid tumor in a subject is benign or malignant based on the results of first, second, and third measurements;
- wherein the expression levels of at least 6 genes selected from the group consisting of AIF1L, CDH16, FAM162B, FGFR2, GJB6, KCNJ13, KIAA1467, SLC25A15, TFCP2L1, TFF3, and TMEM171 in a sample collected from the subject are measured in the first measurement,
- the expression levels of at least 7 genes selected from the group consisting of C4orf10, CCDC8, CD22, FAM125A, FAM174B, FBF1, GLB1L2, LOC644613, MAP2K2, MTG1, PFKL, PTDSS2, SF3A2, SLC2A11, VILL, VSIG2, and WDR18 in the sample are measured in the second measurement, and
- the expression levels of at least 7 genes selected from the group consisting of ANXA1, C13orf33, CYP1B1, FAP, FN1, IL17RD, PDLIM4, RUNX2, and TIMP1 in the sample are measured in the third measurement.
- Further, the present invention provides a computer program product for enabling a computer to determine behavior of thyroid tumor. The product comprises a computer readable medium, and software instructions, on the computer readable medium, for enabling the computer to perform predetermined operations. The operations comprises:
- determining whether a thyroid tumor in a subject is benign or malignant based on the results of first, second, and third measurements, wherein
- the expression levels of at least 6 genes selected from the group consisting of AIF1L, CDH16, FAM162B, FGFR2, GJB6, KCNJ13, KIAA1467, SLC25A15, TFCP2L1, TFF3, and TMEM171 in a sample collected from the subject are measured in the first measurement,
- the expression levels of at least 7 genes selected from the group consisting of C4orf10, CCDC8, CD22, FAM125A, FAM174B, FBF1, GLB1L2, LOC644613, MAP2K2, MTG1, PFKL, PTDSS2, SF3A2, SLC2A11, VILL, VSIG2, and WDR18 in the sample are measured in the second measurement,
- and the expression levels of at least 7 genes selected from the group consisting of ANXA1, C13orf33, CYP1B1, FAP, FN1, IL17RD, PDLIM4, RUNX2, and TIMP1 in the sample are measured in the third measurement.
- Further, the present invention provides a method for determining behavior of thyroid tumor. The method comprises:
- applying a sample collected from a subject with a thyroid tumor to a microarray capable of measuring the expression levels of the following genes (a) to (c):
- (a) at least 6 genes selected from the group consisting of AIF1L, CDH16, FAM162B, FGFR2, GJB6, KCNJ13, KIAA1467, SLC25A15, TFCP2L1, TFF3, and TMEM171;
- (b) at least 7 genes selected from the group consisting of C4orf10, CCDC8, CD22, FAM125A, FAM174B, FBF1, GLB1L2, LOC644613, MAP2K2, MTG1, PFKL, PTDSS2, SF3A2, SLC2A11, VILL, VSIG2, and WDR18; and
- (c) at least 7 genes selected from the group consisting of ANXA1, C13orf33, CYP1B1, FAP, FN1, IL17RD, PDLIM4, RUNX2, and TIMP1;
- detecting optical information about the expression levels of the genes (a) to (c) obtained from the microarray using a microarray scanner after the applying step;
- sending the optical information detected in the detecting step to a CPU of a computer connected to the microarray scanner;
- calculating the expression levels of the genes (a) to (c), based on the optical information by the CPU; and
- determining whether the thyroid tumor in the subject is benign or malignant using the values calculated by the CPU in the calculating step.
- According to the method for determining behavior of thyroid tumor of the present invention (hereinafter, also referred to as "determination method"), it is possible to determine whether thyroid tumor is a benign or malignant tumor with high accuracy.
- According to the method for determining behavior of thyroid tumor of the present invention (hereinafter, also referred to as "determination method"), it is possible to determine whether thyroid tumor is a benign or malignant tumor with high accuracy.
-
-
Fig. 1 shows the results of cluster analysis of the expression levels of 37 genes obtained by measuring specimens with follicular neoplasm (Learning set) with a microarray; -
Fig. 2 shows the results of cluster analysis of the expression levels of 37 genes obtained by measuring specimens with follicular neoplasm (Validation set) with a microarray; -
Fig. 3 shows the results of cluster analysis of the expression levels of 37 genes obtained by measuring specimens with thyroid tumors other than follicular neoplasm with a microarray; -
Fig. 4 shows a determination system of this embodiment; -
Fig. 5 is a block diagram showing a functional configuration of the determination system shown inFig. 4 ; -
Fig. 6 is a block diagram showing a hardware configuration of the determination system shown inFig. 4 ; and -
Fig. 7 is a flow chart of the determination using the determination system shown inFig. 4 . -
Fig. 8 is a table showing the determination according to the present invention. - The preferred embodiments of the present invention will be described hereinafter with reference to the drawings.
- In the determination method of the present invention, as for biological samples collected from subjects with thyroid tumors, the expression levels of at least 6 genes selected from a first gene cluster, the expression levels of at least 7 genes selected from a second gene cluster, and the expression levels of at least 7 genes selected from a third gene cluster are measured.
- The term "thyroid tumors" used herein means nodules (tumors) formed in the thyroid and intends to include both benign and malignant tumors. In the art, the thyroid tumors are also referred to as "thyroid nodules" or "adenomatous goiter".
- The term "determining behavior of thyroid tumor" means determining whether the thyroid tumor is benign or malignant. When the thyroid tumor is malignant, it can include determining whether the tumor is a malignant tumor with poor prognosis or a malignant tumor with good prognosis.
- Here, the term "malignant tumor with poor prognosis" means a malignant tumor which has a high degree of malignancy and a high possibility of recurrence and/or metastasis among the malignant thyroid tumors and thus has a high mortality rate in patients. Further, the term "malignant tumor with good prognosis" means a malignant tumor which has a low degree of malignancy and a low possibility of recurrence and/or metastasis among the malignant thyroid tumors and thus has a low mortality rate in patients. The malignant tumor with poor prognosis largely differs in therapeutic strategies from the malignant tumor with good prognosis. Consequently, distinction between the malignant tumor with poor prognosis and the malignant tumor with good prognosis becomes useful information in determination of therapeutic strategies.
- The term "subjects with thyroid tumors" used herein means subjects who are confirmed to have thyroid tumors or strongly suspected to have thyroid tumors by palpation or ultrasonography.
- In this embodiment, the biological sample is not particularly limited as long as it is a sample derived from a living body which contains cells derived from the thyroid of the subject. Particularly, a sample derived from a living body which contains cells derived from the lesion site in the thyroid is preferred. Examples of the sample derived from a living body include blood, serum, plasma, lymph, cells collected by fine-needle aspiration, and tissues collected by surgery. Further, cultures obtained by culturing the cells and tissues extracted from subjects may also be used as a biological sample.
- The term "gene cluster" used herein means a group consisting of plural genes.
- The term "gene expression level" used herein means an amount of RNA transcribed from each gene or an amount of material reflecting the amount. Therefore, in the embodiment of the present invention, a nucleic acid (particularly RNA) is extracted from a biological sample. The amount of RNA derived from each gene contained in the nucleic acid or the amount of cRNA obtained by IVT-amplification of cDNA or cDNA obtained by reverse transcription of the RNA is measured as the gene expression level. The amount of RNA transcribed from each gene is small in many cases. Accordingly, it is preferable to measure the amount of cDNA obtained from the RNA or the amount of cRNA.
- A method for extracting a nucleic acid including RNA from a biological sample is known in the art. RNA can be extracted from a biological sample by, for example, a method comprising mixing the biological sample with a treatment solution containing a surfactant which solubilizes cells or tissues (sodium cholate, sodium dodecyl sulfate etc.), physically treating (agitation, homogenization, ultrasonication etc.) the resulting mixture to release RNA contained in the biological sample into the mixed solution. Preferably, the mixed solution containing the released RNA is centrifuged to recover a supernatant, and the supernatant is extracted with phenol/chloroform to purify the RNA. The extraction and purification of RNA from the biological sample can be performed using a commercially available kit.
- In the art, the base sequences themselves of the respective genes are known. These base sequences can be obtained from, for example, a known database (http://www.ncbi.nlm.nih.gov/ (provided by National Center for Biotechnology Information (NCBI)). The NCBI Accession Nos and Probe IDs of the genes, and Seq ID Nos. of oligonucleotide probes included in each probe set are shown in Table 1. The IDs are up to date as of November 16, 2012. Probe ID is a number for identifying probes on GeneChip (registered trademark) Human Genome U133 Plus 2.0 Array (Affymetrix, Inc.). The base sequences of probes can be obtained from, for example, the website of Affymetrix, Inc. (http://www.affymetrix.com/analysis/index.affx).
[Table 1] Symbol Gene IDs (NCBI) Probe Set ID Seq ID NOs AIF1L NM_031426 223075_s_at 1-11 CDH16 NM_004062 206517_at 12-22 FAM162B NM_001085480 228875_at 23-33 FGFR2 NM_000141, NM_001144913, NM_001144914, NM_001144915, NM_001144916, NM_001144917, NM_001144918, NM_001144919, NM_022970 203638_s_at 34-44 GJB6 NM_001110219, NM_001110220, NM_001110221, NM_006783 231771_at 45-55 KCNJ13 NM_001172416, M_001172417, NM_002242 210179_at 56-66 KIAA1467 NM_020853 213234_at 67-77 SLC25A15 NM_014252 218653_at 78-88 TFCP2L1 NM_014553 227642_at 89-99 TFF3 NM_003226 204623_at 100-110 TMEM171 NM_001161342.1, NM_173490 240770_at 111-121 C4orf10 NR_015453 214123_s_at 122-132 CCDC8 NM_032040 223495_at 133-143 CD22 M_001771 38521_at 144-159 FAM125A NM_138401 227864_s_at 160-170 FAM174B M_207446 51158_at 171-186 FBF1 NM_001080542 1555288_s_at 187-197 GLB1L2 NM_138342 213713_s_at 198-208 LOC644613 BC025792 1563426_a_at 209-219 MAP2K2 NM_030662 202424_at 220-230 MTG1 NM_138384 212767_at 231-241 PFKL NM_002626, NR_024108 211065_x_at 242-252 PTDSS2 NM_030783 221005_s_at 253-263 SF3A2 M_007165 37462_i_at 264-276 SLC2A11 NM_001024938, NM_001024939, NM_030807 232167_at 277-287 VILL NM_015873 209950_s_at 288-298 VSIG2 NM_014312 228232_s_at 299-309 WDR18 NM_024100 209461_x_at 310-320 ANXA1 NM_000700 201012_at 321-331 C13orf33 NM_032849 227058_at 332-342 CYP1B1 NM_000104 202437_s_at 343-353 FAP NM_004460 209955_s_at 354-364 FN1 NM_002026, NM_054034, NM_212474, M_212475, M_212476, NM_212478, NM_212482 211719_x_at 365-375 IL17RD NM_017563 227997_at 376-386 PDLIM4 NM_001131027, NM_003687 214175_x_at 387-397 RUNX2 NM_001015051, NM_001024630, NM_004348 232231_at 398-408 TIMP1 NM_003254 201666_at 409-419 - The 37 genes are a cluster of genes in which the fact that the expression in cases with benign and malignant tumors is increased is found out by the present inventors. Specifically, the first gene cluster is a cluster of genes in which an increase in the expression of the cases with benign tumors is more than that of the cases with malignant tumors. In addition, the second and third gene clusters are a cluster of genes in which an increase in the expression of the cases with malignant tumors is more than that of the cases with benign tumors. Further, the present inventors have found that the expression of the second gene cluster is increased, particularly in the cases of malignant tumors with poor prognosis, and the expression of the third gene cluster is increased, particularly in the cases of malignant tumors with good prognosis.
- In the embodiment of the present invention, there is no particular restriction to measure the expression level of any of the genes of the first, second, and third gene clusters, and it can be arbitrarily selected. As an example, a method for measuring the expression level of at least 6 genes: AIF1L, FAM162B, FGFR2, GJB6, KIAA1467, and TFF3 of the first gene cluster, the expression level of at least 7 genes: FAM174B, MAP2K2, MTG1, PFKL, PTDSS2, SF3A2, and WDR18 of the second gene cluster, and the expression level of at least 7 genes: ANXA1, CYP1B1, FAP, IL17RD, PDLIM4, RUNX2, and TIMP1 of the third gene cluster is listed. However, the determination method of the present invention is not limited to the example.
- In the embodiment of the present invention, the method for measuring the gene expression level is not particularly limited and it can be selected from any known method in the art. A measurement method using a microarray or a nucleic acid amplification method is preferred.
- The microarray used for the determination method of the present invention is not particularly limited as long as it is a chip in which a nucleic acid probe having about 20 to 25 nucleotides which can specifically hybridize to cDNA or cRNA derived from RNAs transcribed from the genes or the RNAs (hereinafter, also referred to as "target nucleic acid molecule") is immobilized on an appropriate substrate. The probe can be appropriately designed based on the base sequences of the genes. Further, the microarray can be produced by any known method in the art. In the embodiment of the present invention, a commercially available microarray may be used as long as the probe which can specifically hybridize to the target nucleic acid molecule is mounted. Examples of the microarray include GeneChip (registered trademark, manufactured by Affymetrix, Inc.).
- As used herein, the term "can specifically hybridize" means that a probe can hybridize to a target nucleic acid molecule under a stringent condition. The term "stringent condition" means a condition under which the probe can hybridize to the target nucleic acid molecule with a detectably higher extent than it does to a nucleic acid molecule other than the target nucleic acid molecule (e.g. more than at least two times of the background). The stringent condition generally depends on the sequences and varies depending on various circumstances. Generally, the stringent condition is selected so that it is about 5°C lower than a thermal melting point (Tm) of the specific sequence under a certain ionic strength and pH. This Tm is a temperature at which 50% of the complementary probe hybridizes to the base sequence of the target nucleic acid molecule in equilibrium (under a certain ionic strength, pH and nucleic acid composition). Such condition may be those which are used in hybridization techniques between polynucleotides known in the art. Specifically, it may be a condition of pH 7.0 to 9.0, a salt concentration of lower than about 1.5 M Na-ion, more specifically about 0.01 to 1.0 M Na-ion concentration (or other salt), and a temperature of at least about 30°C. For example, the stringent condition in a microarray technique includes the hybridization at 37°C in 50% formamide, 1 M NaCl, and 1% SDS; and washing at 60 to 65°C in 0.1×SSC.
- When the microarray technique is used, the target nucleic acid molecule is preferably labeled with a labeling substance known in the art. Labeling of the target nucleic acid molecule facilitates measurement of a signal from a probe on a microarray. In the embodiment of the present invention, RNA extracted from a biological sample may be labeled. Preferably, cDNA or cRNA derived from the RNA is labeled. Examples of the labeling substance include fluorescent substances, haptens such as biotin, and radioactive substances. Examples of the fluorescent substances include Cy3, Cy5, FITC, Alexa Fluor (trademark). A method for labeling RNA, cDNA, and cRNA with these labeling substances is known in the art.
- In the measurement using a microarray, the gene expression level is obtained as a signal from a probe, such as fluorescence intensity, luminescence intensity or amount of current. Each of the signals may be detected using a scanner installed in a general microarray analyzer. Examples of the scanner include GeneChip (registered trademark) Scanner 3000 7G (Affymetrix, Inc.) and Illumina (registered trademark) Bead Array Reader (Illumina).
- Examples of the nucleic acid amplification method suitable for the determination method of the present invention include a polymerase-chain-reaction (PCR) assay, a strand displacement activity assay, a ligase-chain-reaction assay, and a transcriptional amplification method. These nucleic acid amplification methods themselves are known in the art. As the PCR assay, for example, a real-time RT-PCR assay is listed. As the strand displacement activity assay, for example, a real-time RT-LAMP assay (refer to, for example,
US6410278 ) is listed. As the transcriptional amplification method, for example, a TAS assay is listed. Among these methods, the real-time RT-PCR assay and the real-time RT-LAMP assay are preferred. - The primer to be used for a nucleic acid amplification method is not particularly limited as long as it is a primer which can be amplified by specific hybridization to the target nucleic acid molecule. The stringent condition in the PCR assay may be a condition of pH 7.0 to 9.0, 0.01 to 0.1 M Tris HCl, 0.05 to 0.15 M K-ion concentration (or other salt), and a temperature of at least about 55°C. Such a primer can be appropriately designed based on the base sequences of the respective genes. Further, the primer is preferably designed according to the type of the nucleic acid amplification method. The length of the primer is usually from 5 to 50 nucleotides, preferably from 10 to 40 nucleotides. The primer can be produced by any nucleic acid synthesis method known in the art.
- The primer may be labeled with any labeling substance known in the art. Labeling of the primer may be performed using radioactive elements or non-radioactive molecules. Examples of the radioactive isotope include 32P, 33P, 35S, 3H, and 125I. Examples of the non-radioactive substance include ligands such as biotin, avidin, streptoavidin, and digoxigenin; hapten, pigment, and luminescent reagents such as chemiluminescent, bioluminescent, fluorescent and phosphorescent reagents.
- The reaction condition of the nucleic acid amplification method varies depending on the type of the nucleic acid amplification method and the base sequences of the primer, and it can be appropriately set with reference to, for example, a method described in Molecular Cloning: A Laboratory Manual (2nd ed.) (Sambrook, J. et al. Cold Spring Harbor Laboratory Press, New York (1989)).
- The gene expression level is measured as described above, followed by determining whether the thyroid tumor in the subject with thyroid tumor is benign or malignant based on the measured expression levels of genes of the first, second, and third gene clusters in the determination method of the present invention. Here, the benign tumor is not particularly limited as long as it is a thyroid tumor known to be benign in the art, and it preferably means at least one of follicular adenoma, adenomatous nodules, and cysts. Further, the malignant tumor is not particularly limited as long as it is a thyroid tumor known to be malignant in the art, and it preferably means at least one of follicular carcinoma, papillary carcinoma, poorly-differentiated carcinoma, and undifferentiated carcinoma. The malignant tumor includes a malignant tumor with poor prognosis and a malignant tumor with good prognosis.
- In the embodiment of the present invention, it is preferable that the expression states of the gene clusters are compared based on the measured expression levels of genes of the first, second, and third gene clusters and the determination is performed based on the results. That is, when the expression state of the genes measured in the first measurement is more than or equal to the expression state of the genes measured in the second measurement, and when the expression state of the genes measured in the first measurement is more than or equal to the expression state of the genes measured in the third measurements, the thyroid tumor of the subject is determined to be benign. On the contrary, when the expression state of the genes measured in either the second or third measurement is more than the expression state of the genes measured in the first measurement, the thyroid tumor of the subject is determined to be malignant.
- In the present invention, the term "expression state of genes selected from the gene cluster" means an indicator of the level or tendency of the gene expression in a plurality of genes selected from predetermined gene clusters. As the expression state, for example, a measure of central tendency of the expression levels (measured value) in a plurality of selected genes is listed. The measure of central tendency is not particularly limited as long as it is a statistics value which summarizes the distribution of the gene expression in a plurality of genes selected from predetermined gene clusters. Examples of the measure of central tendency include an average, a median, a maximum, and a mode. Among them, the average is particularly preferred. The term "the expression state is increased" means a measure of central tendency of the expression levels in a plurality of genes selected from certain gene clusters is higher than that of the expression levels in a plurality of genes selected from the remaining gene clusters. Therefore, when an average of the expression levels is used as an expression state of genes selected from a gene cluster, comparison of the expression states is performed as follows. As for biological samples of subjects, the sum of the expression levels of at least 6 genes selected from the first gene cluster is calculated. The calculated value is divided by the number of the selected genes to obtain an average. The same calculation is performed on at least 7 genes selected from the second and third gene clusters. Then, the obtained three averages are compared. For example, when the average in the genes selected from the first gene cluster is the highest, the thyroid tumor of the subject is determined to be benign. On the contrary, when the average in the genes selected from the second or third gene cluster is the highest, the thyroid tumor of the subject is determined to be malignant.
- In the embodiment of the present invention, the expression state of genes selected from each of the gene clusters in biological samples of subjects may be obtained by using the expression level data previously obtained as for the cases with benign and malignant tumors in which behavior is determined by pathological diagnosis (control samples). For example, the multivariate analysis is performed using the expression level data previously obtained as for the control samples so that a formula which reflects or predicts the expression states of genes selected from the gene clusters can be obtained. The information on the expression states of the gene clusters in the biological samples of the subjects is obtained by using the obtained formula. Based on the information, the samples can be determined. Preferable examples of the multivariate analysis include discriminant analysis. Examples of the discriminant analysis include Fischer's linear discriminant analysis, Mahalanobis distance-based discriminant analysis, Euclid distance-based discriminant analysis, Multi-group discriminant analysis, variable selection, and canonical discriminant analysis. Among them, particularly the Euclid distance-based discriminant analysis is preferred. The Euclid distance shows similarity in gene expression patterns among the control samples and the biological samples of the subjects. The Euclid distance can be obtained as follows. Based on the expression level data of the control samples which is previously obtained, the control samples are first classified into three groups by the cluster analysis known in the art. Conveniently the three groups are referred to as "
Cluster 1" with predominant expression of genes selected from the first gene cluster, "Cluster 2" with predominant expression of genes selected from the second gene cluster, and "Cluster 3" with predominant expression of genes selected from the third gene cluster, respectively. Subsequently, the data of the expression levels of the groups is plotted to calculate an average of the groups. Then, as for the average of the groups and the expression level data obtained from the biological samples of the subjects, Euclid distances among the control samples and the biological samples of the subjects are calculated. - When the Euclid distance is used, the term "expression state is increased" means that a Euclid distance between data of a certain cluster and the data of the subject is closer than an Euclid distance between data of the remaining clusters and the data of the subject. Therefore, comparison of the expression states is performed as follows. Three Euclid distances calculated are compared. For example, when the distance from
Cluster 1 is the closest, the thyroid tumor of the subject is determined to be benign. On the contrary, when the distance fromCluster 2 orCluster 3 is the closest, the thyroid tumor of the subject is determined to be malignant. - In another embodiment of the present invention, the expression states of genes selected from the gene clusters are compared based on the measured expression levels of genes of the first, second, and third gene clusters. Based on the results, behavior of thyroid tumor in a subject can be determined as follows.
- That is, when the expression state of the genes measured in the first measurement is more than or equal to the expression state of the genes measured in the second measurement, and when the expression state of the genes measured in the first measurement is more than or equal to the expression state of the genes measured in the third measurement, the thyroid tumor of the subject is determined to be benign.
- When the expression state of the genes measured in the second measurement is more than the genes measured in the first measurement, and when the expression state of the genes measured in the second measurement is more than or equal to the expression state of the genes measured in the third measurement, the thyroid tumor of the subject is determined to a first malignant tumor.
- When the expression state of the genes measured in the third measurement is more than the expression states of the genes measured in the first and second measurements, the thyroid tumor of the subject is determined to a second malignant tumor.
- The term "first malignant tumor" used herein means a malignant tumor with poor prognosis and the term "second malignant tumor" means a malignant tumor with good prognosis. The malignant tumor with poor prognosis is not particularly limited as long as it is a malignant thyroid tumor which is known to be poor prognosis in the art. Preferable examples thereof include at least one of undifferentiated carcinoma, poorly-differentiated carcinoma, and follicular carcinoma with widely invasive and/or vascular invasion. The malignant tumor with poor prognosis is not particularly limited as long as it is a malignant thyroid tumor which is known to be poor prognosis in the art. Preferable examples thereof include at least one of papillary carcinoma and follicular carcinoma without widely invasive and vascular invasion.
- A marker set for determining behavior of thyroid tumor (hereinafter also referred to as "marker set") is included in the scope of the present invention. The marker set of the present invention includes at least 6 genes selected from the first gene cluster, at least 7 genes selected from the second gene cluster, and at least 7 genes selected from the third gene cluster.
- In the embodiment of the present invention, there is no particular restriction to use any of the genes of the first, second, and third gene clusters as a marker, and it can be arbitrarily selected. As an example, a marker set including at least 6 genes: AIF1L, FAM162B, FGFR2, GJB6, KIAA1467, and TFF3 of the first gene cluster, at least 7 genes: FAM174B, MAP2K2, MTG1, PFKL, PTDSS2, SF3A2, and WDR18 of the second gene cluster, and at least 7 genes: ANXA1, CYP1B1, FAP, IL17RD, PDLIM4, RUNX2, and TIMP1 of the third gene cluster is listed. However, the marker set of the present invention is not limited to the example.
- In the embodiment of the present invention, the expression levels of genes in a sample containing RNAs prepared from the biological sample collected from the subject is analyzed and the behavior of thyroid tumor in the subject can be determined based on the obtained expression levels. The measurement and analysis of the expression levels of the markers are the same as described above.
- A kit for determining behavior of thyroid tumor (hereinafter, also referred to as "kit of the present invention") is included in the scope of the present invention. That is, the present invention provides the kit for determining behavior of thyroid tumor including a probe set or primer set for measuring the expression levels of at least 6 genes selected from the first gene cluster composed of AIF1L, CDH16, FAM162B, FGFR2, GJB6, KCNJ13, KIAA1467, SLC25A15, TFCP2L1, TFF3, and TMEM171, the expression levels of at least 7 genes selected from the second gene cluster composed of C4orf10, CCDC8, CD22, FAM125A, FAM174B, FBF1, GLB1L2, LOC644613, MAP2K2, MTG1, PFKL, PTDSS2, SF3A2, SLC2A11, VILL, VSIG2, and WDR18, and the expression levels of at least 7 genes selected from the third gene cluster composed of ANXA1, C13orf33, CYP1B1, FAP, FN1, IL17RD, PDLIM4, RUNX2, and TIMP1.
- The kit of the present invention can be suitably used for the determination method of the present invention. The probe and primer sets included in the kit of the present invention are the same described in the probe or primer which can specifically hybridize to the target nucleic acid molecule. The kit of the present invention may be in the form of microarray in which the probe is immobilized on an appropriate substrate.
- In the embodiment of the present invention, there is no particular restriction to include any of the probes or primer for measuring the gene expression in the kit, and it can be arbitrarily selected. As an example, a kit including a probe set or primer set for measuring at least the expression levels of AIF1L, FAM162B, FGFR2, GJB6, KIAA1467, and TFF3 of the first gene cluster, at least the expression levels of FAM174B, MAP2K2, MTG1, PFKL, PTDSS2, SF3A2, and WDR18 of the second gene cluster, and at least the expression levels of ANXA1, CYP1B1, FAP, IL17RD, PDLIM4, RUNX2, and TIMP1 of the third gene cluster is listed. However, the kit of the present invention is not limited to the example.
- The determination of behavior of thyroid tumor can be performed by, for example, the
determination system 1 shown inFig. 4 . Hereinafter, the present invention will be more specifically described with reference to the attached drawings; however, the present invention is not limited to the embodiment. -
Fig. 1 is an outline explanatory view of a system according to one embodiment of the present invention. Thedetermination system 1 shown inFig. 1 includes ameasurement device 2 and acomputer system 3 connected to themeasurement device 2. - In this embodiment, the
measurement device 2 is a microarray scanner that detects a signal based on the hybridization of the probe and the target nucleic acid molecule on a microarray. Themeasurement device 2 detects signals corresponding to expression levels of genes selected from a first gene cluster, a second gene cluster, and a third gene cluster. Specifically, in this embodiment, the signals represent optical information. As the optical information, for example, a fluorescent signal is listed; however, the present invention is not limited only thereto. In this case, when the microarray after contact with the target nucleic acid molecule is set in themeasurement device 2, themeasurement device 2 obtains optical information based on the target nucleic acid molecule bound to the probe on the microarray and sends the obtained optical information to thecomputer system 3. - Any microarray scanner may be used as long as it can detect a signal based on the target nucleic acid molecule. The signal varies depending on the labeling substance used for labeling cDNA or cRNA in the measurement sample. Thus, as the microarray scanner, one suitable for detecting the signal from the labeling substance can be appropriately selected according to the type of the labeling substance. For example, when the labeling substance is a radioactive substance, a microarray scanner which can detect radioactive rays from the radioactive substance can be used as the
measurement device 2. - When the gene expression level is detected by the nucleic acid amplification method, the
measurement device 2 may be a nucleic acid amplification detector. In this case, a reaction solution containing DNA from a biological sample, an enzyme for nucleic acid amplification, and a primer is set in themeasurement device 2. The nucleic acid in the reaction solution is amplified by the nucleic acid amplification method. Themeasurement device 2 obtains optical information such as fluorescence generated from the reaction solution by the amplification reaction or turbidity of the reaction solution and sends the optical information to thecomputer system 3. - The
computer system 3 includes a computermain body 3a, aninput device 3b, and adisplay unit 3c that displays specimen information, determination results, and the like. Thecomputer system 3 receives optical information from themeasurement device 2. The processor of thecomputer system 3 executes a program that determines behavior of thyroid tumor based on the optical information. -
Fig. 5 is a block diagram showing a functional configuration of the determination system shown inFig. 4 . - The
computer system 3 comprises anacquisition unit 301, amemory unit 302, acalculation unit 303, adetermination unit 304, and anoutput unit 305 as shown inFig. 5 . Theacquisition unit 301 is communicably connected to themeasurement device 2 via a network. Thecalculation unit 303 and thedetermination unit 304 form acontrol unit 306. - The
acquisition unit 301 obtains information sent from themeasurement device 2. - The
memory unit 302 stores a program that distinguishes behavior of thyroid tumor. - The
calculation unit 303 calculates fluorescence intensity etc. using information obtained by theacquisition unit 301 and analyzes the gene expression state. As described above, as the gene expression state, for example, a measure of central tendency of the expression levels (measured values) in a plurality of selected genes is listed. - The
determination unit 304 determines behavior of thyroid tumor based on the gene expression state analyzed by thecalculation unit 303 and determination criteria stored in thememory unit 302. - The
output unit 305 outputs determination results by thedetermination unit 304. -
Fig. 6 is a block diagram showing a hardware configuration of the determination system shown inFig. 4 . - As shown in
Fig. 6 , the computermain body 3a comprises a CPU (Central Processing Unit) 30, a ROM (Read Only Memory) 121, aROM 32, ahard disk 33, an input/output interface 34, a read-outdevice 35, acommunication interface 36, and animage output interface 37. TheCPU 30, theROM 31, the RAM (Random Access Memory) 32, thehard disk 33, the input/output interface 34, the read-outdevice 35, thecommunication interface 36, and theimage output interface 37 are data-communicably connected by abus 38. - The
CPU 30 is capable of executing the computer programs stored in theROM 31 and the computer programs loaded in theROM 32. TheCPU 30 executes an application program to realize the blocking of the functions. Thus, the computer system functions as a terminal of a system for determining behavior of thyroid tumor. - The
ROM 31 is configured by mask ROM, PROM, EPROM, EEPROM, and the like. Computer programs to be executed by theCPU 30 and data used for the same are recorded in theROM 31. - The
ROM 32 is configured by SRAM, DRAM, and the like. TheROM 32 is used to read out the computer programs recorded on theROM 31 and thehard disc 33. In executing the computer program, theROM 32 is used as a work region of theCPU 30. - The
hard disk 33 is installed with an operating system to be executed by theCPU 30, a computer program such as an application program (computer program for determining the presence or absence of sensitivity to preoperative chemotherapy on breast cancer), and data used to execute the computer program. - The read-out
device 35 is configured by a flexible disk drive, a CD-ROM drive, a DVD-ROM drive, and the like. The read-outdevice 35 is able to read out computer programs or data recorded on aportable recording medium 40. - The input/
output interface 34 includes a serial interface such as USB, IEEE1394, and RS-232C; a parallel interface such as SCSI, IDE, and IEEE1284; and an analog interface such as D/A converter and A/D converter. The input/output interface 34 is connected to theinput device 3b such as a keyboard and a mouse. Operators can use theinput device 3b to input data into the computermain body 3a. - The
communication interface 36 is, for example, an Ethernet (registered trademark) interface. Thecomputer system 3 can receive optical information from themeasurement device 2 through thecommunication interface 36 and send print data to a printer. - The
image output interface 37 is connected to thedisplay unit 3c configured by LCD, CRT, or the like. Thus, thedisplay unit 3c can output an image signal corresponding to the image data provided from theCPU 30. Thedisplay unit 3c displays an image (screen) according to the input image signal. - Subsequently, the determination procedure by the
determination system 1 will be described.Fig. 7 is a flow chart of the determination using the determination system shown inFig. 4 . Here, the present invention will be described using fluorescence information based on a nucleic acid being measured which is bound to a probe on a microarray and taking an example of the case where averages as "the expression states of genes selected from the gene clusters" are used to perform determination. However, the present invention is not limited only to the embodiment. - In step S1-1, the
acquisition unit 301 of thedetermination system 1 first obtains fluorescence information from themeasurement device 2. In step S1-2, thecalculation unit 303 calculates fluorescence intensity from the fluorescence information obtained by theacquisition unit 301 and sends it to thememory unit 302. - Subsequently, in step S1-3, the
calculation unit 303 calculates an average of the expression levels of a plurality of selected genes based on the fluorescence intensity stored in thememory unit 302. - Thereafter, in step S1-4, the
determination unit 304 determines behavior of thyroid tumor using an average calculated by thecalculation unit 303 and determination criteria stored in thememory unit 302. The determination results are sent to theoutput unit 305. - Thereafter, in step S1-5 the
output unit 305 outputs the determination results, allows thedisplay unit 3c to display them, and allows the printer to print them. -
Fig. 8 is a view showing the method for determining behavior of thyroid tumor according to the determination of the present invention. When the conditions shown in the left column ofFig. 8 are satisfied, determination results shown in the right column ofFig. 8 are obtained. In this regard, an inequality sign ">" inFig.8 means that the expression state shown on the left side is accelerated more than the expression state shown on the right side is. - The inequality sign with an equal sign "≥" shows that the expression state shown on the left side is accelerated more than or equal to the expression state shown on the right side.
- Hereinafter, the present invention is more specifically described with reference to Examples; however, the present invention is not limited thereto.
- In the following examples, the biological samples obtained as follows were used. First, pathological diagnosis of thyroid lesion tissues extracted from patients with thyroid tumors by surgery was performed. These tissues were classified into one of the cases of adenomatous goiter, follicular adenoma, follicular carcinoma (including poorly-differentiated carcinoma), and papillary carcinoma. These tissues were used as biological samples and cryopreserved at -80°C.
- As the Learning set, tissue specimens of 25 cases which was pathologically classified into follicular neoplasm (11 cases with follicular adenoma and 14 cases with follicular carcinoma) were used. RNAs (100 to 200 ng) extracted from the specimens were amplified with GeneChip (registered trademark) 3' IVT Express Kit (Affymetrix Inc.). The amplified RNAs were added to GeneChip (registered trademark) Human Genome U133 Plus 2.0 Array (Affymetrix Inc.) to react them at 65°C for 16 hours. The RNAs were hybridized to probes on the array. Thereafter, the hybridized probes were stained using GeneChip (registered trademark) Hybridization, Wash, and Stain Kit (Affymetrix Inc.). Subsequently, the luminescence signals were detected using Genechip (registered trademark) Scanner 3000 (Affymetrix Inc.).
- The signal value data (CELL file) obtained by a microarray was normalized by MAS5 using Expression Console (Affymetrix Inc.). Thereafter, the probe whose function was not clear and which had no name was removed. As for probes having overlapping genes, probes other than the probe having the highest signal were removed. As for the signal values of the remaining probes, log-conversion in the base of 2 was performed to calculate CV values of the probes. The top 5000 genes with significant change among the 25 cases (11 cases with follicular adenoma and 14 cases with follicular carcinoma) were extracted. The 5000 genes were Z-scored. On the basis of the results, unsupervised cluster analysis was performed using cluster 3.0 (open source, obtained from the following web site; http://bonsai.hgc.jp/-mdehoon/software/cluster/). Specifically, the analysis procedure is as follows. The Cluster ring tab in the hierarchy of Cluster 3.0 was opened. The box of [Cluster] of [Genes] and the box of [Cluster] of [Arrays] were checked. As for Similarity Metric, the box of [Correlation(Centered)] in [Genes] and [Arrays] was selected. As for Clustering Method, the box of [Centroid linkage] was selected. Thus, the cluster analysis was conducted. The results of the cluster analysis were analyzed using Java Treeview (open source, obtained from the following web site; http://sourceforge.net/projects/jtreeview/). As a result of the cluster analysis using the 5000 genes, it is found that the 25 cases are classified into three groups (
Clusters - Subsequently, in order to narrow down the genes, 37 genes were extracted as genes in which the expression of the genes is increased according to the tree diagram of the gene side. Then, the unsupervised cluster analysis was performed using only the 37 genes thus extracted, and the 25 cases could be classified into three groups. The results are shown in
Fig. 1 . As shown in the region surrounded by a square inFig. 1 , inCluster 1 the expressions of 11 genes: AIF1L, CDH16, FAM162B, FGFR2, GJB6, KCNJ13, KIAA1467, SLC25A15, TFCP2L1, TFF3, and TMEM171 are increased, inCluster 2 the expressions of 17 genes: C4orf10, CCDC8, CD22, FAM125A, FAM174B, FBF1, GLB1L2, LOC644613, MAP2K2, MTG1, PFKL, PTDSS2, SF3A2, SLC2A11, VILL, VSIG2, and WDR18 are increased, and inCluster 3 the expression of 9 genes: ANXA1, C13orf33, CYP1B1, FAP, FN1, IL17RD, PDLIM4, RUNX2, and TIMP1 are increased. Hereinafter, the gene clusters in which the expression is increased inClusters - Among the 25 cases, 9 cases were classified into
Cluster 1, 7 cases were classified intoCluster 2, and 9 cases were classified intoCluster 3. The gene expression-based classification was correlated with the pathology classification. As a result, it was found that follicular adenomas, i.e., benign tumors were concentrated in Cluster 1 (8 cases of 9 cases), and follicular carcinomas, i.e., malignant tumors were concentrated inClusters 2 and 3 (Cluster 2: 6 cases of 7 cases, Cluster 3: 7 cases of 9 cases). The results are shown in Table 2 (conveniently, the tumor of the case classified intoCluster 2 is referred to as "first malignant tumor", and the tumor of the case classified intoCluster 3 is referred to as "second malignant tumor").[Table 2] Cluster analysis 37 genes Cluster 1 Cluster 2Cluster 3Benign tumor First malignant tumor Second malignant tumor Pathological classification Follicular adenoma 8 1 2 Follicular carcinoma 1 6 7 - Accordingly, a total of 37 genes obtained by combining genes in which the expression was increased in
Clusters Cluster 1 were determined as follicular adenoma, and the cases classified intoCluster - Twenty genes below were extracted from the 37 genes and the cluster analysis was performed in the same manner as in Example 1. As a result, 25 cases were classified into three groups in the same manner as in Example 1. In
Cluster 1 the expressions of 6 genes: AIF1L, FAM162B, FGFR2, GJB6, KCNJ13, and TFF3 are increased, inCluster 2 the expressions of 7 genes: FAM125A, MAP2K2, MTG1, PFKL, PTDSS2, SF3A2, and WDR18 are increased, and inCluster 3 the expressions of 7 genes: ANXA1, CYP1B1, FAP, IL17RD, PDLIM4, RUNX2, and TIMP1 are increased. Among the 25 cases, 11 cases were classified intoCluster 1, 6 cases were classified intoCluster 2, and 8 cases were classified intoCluster 3. The results obtained by correlating the gene expression-based classification with the pathological classification are shown in Table 3.[Table 3] Cluster analysis 20 genes Cluster 1 Cluster 2Cluster 3Benign tumor First malignant tumor Second malignant tumor Pathological classification Follicular adenoma 8 1 2 Follicular carcinoma 3 5 6 - As shown in Table 3, it was found that follicular adenomas were concentrated in Cluster 1 (8 cases of 11 cases) and follicular carcinomas were concentrated in
Clusters 2 and 3 (Cluster 2: 5 cases of 6 cases, Cluster 3: 6 cases of 8 cases). Accordingly, a total of 20 genes obtained by combining genes in which the expression was increased inClusters Cluster 1 were determined as follicular adenoma, and the cases classified intoCluster - It was examined whether the cluster was reproduced even when a specimen different from the tissue specimen used in Example 1 was used. As the Validation set, tissue specimens in 71 cases different from the Learning set (33 cases with follicular adenoma, 38 cases with follicular carcinoma) were used. RNAs were extracted from the specimens and the expression levels of the 37 genes were measured using the microarray in the same manner as described in Example 1. The signal value data (CELL file) obtained by a microarray was normalized by MAS5 using Expression Console (Affymetrix Inc.). The signal values of the 37 genes selected in Example 1 were extracted. The resulting values were subjected to log-conversion in the base of 2 and further the log-converted values were Z-scored. On the basis of the results, unsupervised cluster analysis was performed using cluster 3.0. The procedure of cluster analysis is the same as in Example 1. As a result, the 71 cases could be classified into three groups (refer to
Fig. 2 ). Among the 71 cases, 27 cases were classified intoCluster Cluster 2, and 20 cases were classified intoCluster 3. The results obtained by correlating the gene expression-based classification with the pathological classification are shown in Table 4.[Table 4] Cluster analysis 37 genes Cluster 1 Cluster 2Cluster 3Benign tumor First malignant tumor Second malignant tumor Pathological classification Follicular adenoma 21 6 6 Follicular carcinoma 6 18 14 - As shown in Table 4, it was found that follicular adenomas were concentrated in Cluster 1 (21 cases of 27 cases) and follicular carcinomas were concentrated in
Clusters 2 and 3 (Cluster 2: 18 cases of 24 cases, Cluster 3: 14 cases of 20 cases). Thus, as for the determination of behavior of thyroid tumor based on the analysis of the expression levels of the 37 genes, good reproducibility was obtained. Even when the 20 genes were used, the same tendency was observed. - It was examined whether the cluster was reproduced even when adenomatous goiter and papillary carcinoma as specimens were added to follicular adenoma and follicular carcinoma. As for 14 cases with benign tumor (8 cases with adenomatous goiter and 6 cases with follicular adenoma) and 10 cases with malignant tumors (4 cases with papillary carcinoma and 6 cases with follicular carcinoma), RNAs were extracted from the tissue specimens and the expression levels of the 37 genes were measured using the microarray in the same manner as described in Example 1. The procedure of cluster analysis is the same as in Example 1. As a result, the 24 cases could be classified into three groups (refer to
Fig. 3 ). Among the 24 cases, 13 cases were classified intoCluster 1, 4 cases were classified intoCluster 2, and 7 cases were classified intoCluster 3. The results obtained by correlating the gene expression-based classification with the pathological classification are shown in Table 5.[Table 5] Cluster analysis 37 genes Cluster 1 Cluster 2Cluster 3Benign tumor First malignant tumor Second malignant tumor Pathological classification Benign tumor 13 0 1 Malignant tumor 0 4 6 - As shown in Table 5, it was found that benign tumors were concentrated in Cluster 1 (13 cases of 13 cases) and malignant tumors were concentrated in
Clusters 2 and 3 (Cluster 2: 4 cases of 4 cases, Cluster 3: 6 cases of 7 cases). Thus, even if tumor tissues of different types from those of the tumor tissues used when extracting the 37 genes were used as specimens, good reproducibility was obtained in the determination of behavior of thyroid tumor. Accordingly, the 37 genes were used and thyroid tumors were classified into three groups. It was found that the cases classified intoCluster 1 were determined as benign tumor, and the cases classified intoCluster - In this example, in order to perform cluster classification of each case (determination of behavior of tumor) more accurately, it is intended to construct a determination formula for the expression levels of the 37 genes. As biological samples, tissue specimens in 45 cases with benign tumor (adenomatous goiter and follicular adenoma) and 42 cases with malignant tumors (papillary carcinoma and follicular carcinoma) were used. RNAs were extracted from the specimens and the expression levels of the 37 genes (signal values from probes) were measured using the microarray in the same manner as described in Example 1. The signal values were subjected to log-conversion in the base of 2. In this example, averages of the log-converted signal values as for the first, second, and third gene clusters were compared, and the determination formula for classifying each case into each Cluster was tried (hereinafter, also referred to as "determination formula (I)").
- Here, the procedure of determination by the determination formula (I) will be described. First, an average of the signal values in each cluster of the first, second, and third gene clusters was calculated. Then, the resulting averages of the first, second, and third gene clusters were compared in the respective cases. The respective cases were classified into the cluster to which the gene cluster having the highest average (that is, the gene cluster in which the expression level is the most increased) belongs.
- The determination formula (I) was applied to all the 87 cases and the cluster classification was performed. As a result, among the 87 cases, 38 cases were classified into
Cluster 1, 23 cases were classified intoCluster 2, and 26 cases were classified intoCluster 3. The results obtained by correlating the determination formula-based classification with the pathological classification are shown in Table 6.[Table 6] Determination formula (I) 37 genes Cluster 1 Cluster 2Cluster 3Benign tumor First malignant tumor Second malignant tumor Pathological classification Benign tumor 32 6 7 Malignant tumor 6 17 19 - As shown in Table 6, it was found that benign tumors were concentrated in Cluster 1 (32 cases of 38 cases) and malignant tumors were concentrated in
Clusters 2 and 3 (Cluster 2: 17 cases of 23 cases, Cluster 3: 19 cases of 26 cases). As the performance of determination by the determination formula (I), a good performance such that the sensitivity was 86%, the specificity was 71%, the concordance rate was 78%, the PPV was 73%, and the NPV was 84% was obtained. The determination method using the 37 genes showed excellent specificity and PPV as compared with the determination method by the Afirma Thyroid FNA Analysis (a product commercially available from Veracyte, Inc.). - The 20 genes used in Example 2 were used and classifications of 45 cases with benign tumors (adenomatous goiter and follicular adenoma) and 42 cases with malignant tumors (papillary carcinoma and follicular carcinoma) were performed by the determination formula (I) in the same manner as described in Example 5. As a result, among the 87 cases, 43 cases were classified into
Cluster Cluster 2, and 19 cases were classified intoCluster 3. The results obtained by correlating the determination formula-based classification with the pathological classification are shown in Table 7.[Table 7] Determination formula (I) 20 genes Cluster 1 Cluster 2Cluster 3Benign tumor First malignant tumor Second malignant tumor Pathological classification Benign tumor 34 7 4 Malignant tumor 9 18 15 - As shown in Table 7, it was found that benign tumors were concentrated in Cluster 1 (34 cases of 43 cases) and malignant tumors were concentrated in
Clusters 2 and 3 (Cluster 2: 18 cases of 25 cases, Cluster 3: 15 cases of 19 cases). As the performance of determination by the determination formula (I), a good performance such that the sensitivity was 79%, the specificity was 76%, the concordance rate was 77%, the PPV was 75%, and the NPV was 79% was obtained. The determination method using the 20 genes showed excellent specificity and PPV as compared with the determination method by the Afirma Thyroid FNA Analysis (a product commercially available from Veracyte, Inc.). - In this example, it is intended to construct a determination formula different from that of Example 5. As biological samples, tissue specimens in 45 cases with benign tumor (adenomatous goiter and follicular adenoma) and 42 cases with malignant tumors (papillary carcinoma and follicular carcinoma) were used. RNAs were extracted from the specimens and the expression levels of the 37 genes (signal values from probes) were measured using the microarray in the same manner as described in Example 1. In this example, the determination formula to classify the genes based on the gene expression patterns of the cases calculated by the primary linear equation and distances from the three clusters classified in Example 1 was tried (hereinafter, the formula is referred to as "determination formula (II)").
- Here, the procedure of determination by the determination formula (II) will be described. In the determination formula (II), the signal values of the 37 genes as for the Learning set used in Example 1 were plotted. Differences among the expression levels for the respective clusters were used to classify the genes into three clusters. The three clusters are the same as
Clusters Cluster Cluster 2, and 19 cases were classified intoCluster 3. The results obtained by correlating the determination formula-based classification with the pathological classification are shown in Table 8.[Table 8] Determination formula (II) 37 genes Cluster 1 Cluster 2Cluster 3Benign tumor First malignant tumor Second malignant tumor Pathological classification Benign tumor 29 10 6 Malignant tumor 4 25 13 - As shown in Table 8, it was found that benign tumors were concentrated in Cluster 1 (29 cases of 33 cases) and malignant tumors were concentrated in
Clusters 2 and 3 (Cluster 2: 25 cases of 35 cases, Cluster 3: 13 cases of 19 cases). As the performance of determination by the determination formula (II), a good performance such that the sensitivity was 90%, the specificity was 64%, the concordance rate was 77%, the PPV was 70%, and the NPV was 88% was obtained. The determination method using the 37 genes showed excellent specificity and PPV as compared with the determination method by the Afirma Thyroid FNA Analysis (a product commercially available from Veracyte, Inc.). - The 20 genes used in Example 2 were used and classifications of 45 cases with benign tumors (adenomatous goiter and follicular adenoma) and 42 cases with malignant tumors (papillary carcinoma and follicular carcinoma) were performed by the determination formula (II) in the same manner as described in Example 7. As a result, among the 87 cases, 33 cases were classified into
Cluster 1, 29 cases were classified intoCluster Cluster 3. The results obtained by correlating the determination formula-based classification with the pathological classification are shown in Table 9.[Table 9] Determination formula (II) 20 genes Cluster 1 Cluster 2Cluster 3Benign tumor First malignant tumor Second malignant tumor Pathological classification Benign tumor 27 11 7 Malignant tumor 6 18 18 - As shown in Table 9, it was found that benign tumors were concentrated in Cluster 1 (27 cases of 33 cases) and malignant tumors were concentrated in
Clusters 2 and 3 (Cluster 2: 18 cases of 29 cases, Cluster 3: 18 cases of 25 cases). As the performance of determination by the determination formula (II), a good performance such that the sensitivity was 86%, the specificity was 60%, the concordance rate was 72%, the PPV was 67%, and the NPV was 82% was obtained. The determination method using the 20 genes showed excellent specificity and PPV as compared with the determination method by the Afirma Thyroid FNA Analysis (a product commercially available from Veracyte, Inc.). - In this example, a difference between
Cluster 2 andCluster 3 was examined from the viewpoint of the prognosis in malignant tumor. Among follicular carcinoma, poorly-differentiated carcinoma, widely invasive -type follicular carcinoma, and follicular carcinoma withvascular invasion are generally known as poor-prognostic malignant tumors. Here, the cases used in Example 7 include 15 cases which are malignant tumors with poor prognosis of the cases. Then, it was examined into which Cluster these cases were classified in Example 7. The results are shown in Table 10.[Table 10] Determination formula (II) 37 genes Cluster 1 Cluster 2Cluster 3Benign tumor First malignant tumor Second malignant tumor Pathological classification Benign tumor 0 0 0 Malignant tumor 0 11 4 - As shown in Table 10, the number of cases classified into
Cluster 1 was 0, the number of cases classified intoCluster 2 was 11, and the number of cases classified intoCluster 3 was 4. Thus, a greater number of cases with poor prognosis were concentrated inCluster 2. This suggested that the case classified into Cluster 2 (the first malignant tumor) had a higher possibility of being a malignant tumor with poor prognosis as compared with the case classified into Cluster 3 (the second malignant tumor).


Claims (15)
- A method for determining behavior of thyroid tumor of a subject, comprising:a first measurement step comprising measuring expression levels of at least 6 genes selected from the group consisting of AIF1L, CDH16, FAM162B, FGFR2, GJB6, KCNJ13, KIAA1467, SLC25A15, TFCP2L1, TFF3, and TMEM171 in a sample collected from the subject;a second measurement step comprising measureing expression levels of at least 7 genes selected from the group consisting of C4orf10, CCDC8, CD22, FAM125A, FAM174B, FBF1, GLB1L2, LOC644613, MAP2K2, MTG1, PFKL, PTDSS2, SF3A2, SLC2A11, VILL, VSIG2, and WDR18 in the sample;a third measurement step comprising expression levels of at least 7 genes selected from the group consisting of ANXA1, C13orf33, CYP1B1, FAP, FN1, IL17RD, PDLIM4, RUNX2, and TIMP1 in the sample; anddetermination step comprising determining whether a thyroid tumor in a subject is benign or malignant based on the results of first, second, and third measurements.
- The method according to claim 1, wherein in the determination step,
when the expression state of the genes measured in the first measurement is more than or equal to the expression state of the genes measured in the second measurement, and when the expression state of the genes measured in the first measurement is more than or equal to the expression state of the genes measured in the third measurements, the thyroid tumor of the subject is determined to be benign, and
when the expression state of the genes measured in either the second or third measurement is more than the expression state of the genes measured in the first measurement, the thyroid tumor of the subject is determined to be malignant. - The method according to claim 1, wherein in the determination step,
when the expression state of the genes measured in the first measurement is more than or equal to the expression state of the genes measured in the second measurement, and when the expression state of the genes measured in the first measurement is more than or equal to the expression state of the genes measured in the third measurement, the thyroid tumor of the subject is determined to be benign,
when the expression state of the genes measured in the second measurement is more than the genes measured in the first measurement, and when the expression state of the genes measured in the second measurement is more than or equal to the expression state of the genes measured in the third measurement, the thyroid tumor of the subject is determined to a first malignant tumor, and
when the expression state of the genes measured in the third measurement is more than the expression states of the genes measured in the first and second measurements, the thyroid tumor of the subject is determined to a second malignant tumor. - The method according to 1 or 2, wherein
the benign tumor is at least one of follicular adenoma, adenomatous nodules, and cysts, and
the malignant tumor is at least one of follicular carcinoma, papillary carcinoma, poorly-differentiated carcinoma, and undifferentiated carcinoma. - The method according to claim 3, wherein
the first malignant tumor is a malignant tumor with poor prognosis, and
the second malignant tumor is a malignant tumor with good prognosis. - The method according to 3 or 5, wherein
the benign tumor is at least one of follicular adenoma, adenomatous nodules, and cysts,
the first malignant tumor is at least one of undifferentiated carcinoma, poorly-differentiated carcinoma, and follicular carcinoma with widely invasive and/or vascular invasion, and
the second malignant tumor is at least one of papillary carcinoma and follicular carcinoma without widely invasive and vascular invasion. - The method according to any of claims 1 to 6, wherein
in the first measurement, the expression levels of at least 6 genes: AIF1L, FAM162B, FGFR2, GJB6, KIAA1467, and TFF3 are measured,
in the second measurement, the expression levels of at least 7 genes: FAM174B, MAP2K2, MTG1, PFKL, PTDSS2, SF3A2, and WDR18 are measured, and
in the third measurement, the expression levels of at least 7 genes: ANXA1, CYP1B1, FAP, IL17RD, PDLIM4, RUNX2, and TIMP1 are measured. - The method according to any of claims 1 to 7, wherein
a microarray or a nucleic acid amplification method is used to measure the gene expression levels in the first, second, and third measurements. - The method according to any of claims 1 to 8, wherein
the sample contains cells derived from the thyroid of the subject. - The method according to any of claims 1 to 9, further comprising
first calculation step comprising calculating a central tendency of expression levels of genes measured in the first measurement,
second calculation step comprising calculating a central tendency of expression levels of genes measured in the second measurement, and
third calculation step comprising calculating a central tendency of expression levels of genes measured in the third measurement. - The method according to claim 10, wherein
the central tendency is an average, a median, a maximum, or a mode. - A system adapted to a method for determining behavior of thyroid tumor, comprising:a processor, anda memory, under control of said processor, including software instructions adapted to enable the system to perform operations comprising:determining whether a thyroid tumor in a subject is benign or malignant based on the results of first, second, and third measurements;wherein the expression levels of at least 6 genes selected from the group consisting of AIF1L, CDH16, FAM162B, FGFR2, GJB6, KCNJ13, KIAA1467, SLC25A15, TFCP2L1, TFF3, and TMEM171 in a sample collected from the subject are measured in the first measurement,the expression levels of at least 7 genes selected from the group consisting of C4orf10, CCDC8, CD22, FAM125A, FAM174B, FBF1, GLB1L2, LOC644613, MAP2K2, MTG1, PFKL, PTDSS2, SF3A2, SLC2A11, VILL, VSIG2, and WDR18 in the sample are measured in the second measurement, andthe expression levels of at least 7 genes selected from the group consisting of ANXA1, C13orf33, CYP1B1, FAP, FN1, IL17RD, PDLIM4, RUNX2, and TIMP1 in the sample are measured in the third measurement.
- The system according to claim 12, wherein
in the operations,
when the expression state of the genes measured in the first measurement is more than or equal to the expression state of the genes measured in the second measurement, and when the expression state of the genes measured in the first measurement is more than or equal to the expression state of the genes measured in the third measurements, the thyroid tumor of the subject is determined to be benign, and
when the expression state of the genes measured in either the second or third measurement is more than the expression state of the genes measured in the first measurement, the thyroid tumor of the subject is determined to be malignant. - The system according to claim 12, wherein
in the operations,
when the expression state of the genes measured in the first measurement is more than or equal to the expression state of the genes measured in the second measurement, and when the expression state of the genes measured in the first measurement is more than or equal to the expression state of the genes measured in the third measurement, the thyroid tumor of the subject is determined to be benign,
when the expression state of the genes measured in the second measurement is more than the genes measured in the first measurement, and when the expression state of the genes measured in the second measurement is more than or equal to the expression state of the genes measured in the third measurement, the thyroid tumor of the subject is determined to a first malignant tumor, and
when the expression state of the genes measured in the third measurement is more than the expression states of the genes measured in the first and second measurements, the thyroid tumor of the subject is determined to a second malignant tumor. - The system according to any of claims 12 to 14, wherein
the benign tumor is at least one of follicular adenoma, adenomatous nodules, and cysts, and
the malignant tumor is at least one of follicular carcinoma, papillary carcinoma, poorly-differentiated carcinoma, and undifferentiated carcinoma.
Applications Claiming Priority (2)
| Application Number | Priority Date | Filing Date | Title |
|---|---|---|---|
| JP2012261300 | 2012-11-29 | ||
| JP2013229365A JP6200281B2 (en) | 2012-11-29 | 2013-11-05 | Method for assisting discrimination of properties of thyroid tumor and marker set used for the method |
Publications (2)
| Publication Number | Publication Date |
|---|---|
| EP2738264A1 true EP2738264A1 (en) | 2014-06-04 |
| EP2738264B1 EP2738264B1 (en) | 2016-01-20 |
Family
ID=49619850
Family Applications (1)
| Application Number | Title | Priority Date | Filing Date |
|---|---|---|---|
| EP13194017.3A Active EP2738264B1 (en) | 2012-11-29 | 2013-11-22 | A method and system for determining behavior of thyroid tumor |
Country Status (3)
| Country | Link |
|---|---|
| US (1) | US20140162895A1 (en) |
| EP (1) | EP2738264B1 (en) |
| JP (1) | JP6200281B2 (en) |
Cited By (1)
| Publication number | Priority date | Publication date | Assignee | Title |
|---|---|---|---|---|
| WO2016005916A1 (en) * | 2014-07-09 | 2016-01-14 | Azienda Ospedaliero-Universitaria Pisana | A method and kit for the detection of a biomarker of thyroid cancer in biological samples |
Families Citing this family (3)
| Publication number | Priority date | Publication date | Assignee | Title |
|---|---|---|---|---|
| WO2019235729A1 (en) * | 2018-06-04 | 2019-12-12 | 울산대학교 산학협력단 | Biomarker composition for predicting solid cancer prognosis comprising phosphorylated tfcp2l1 and use thereof |
| KR102171774B1 (en) * | 2018-06-04 | 2020-10-29 | 울산대학교 산학협력단 | Biomarker Composition for Prognosing Solid Cancer Comprising Phosphated TFCP2L1, and Uses thereof |
| KR20230162795A (en) * | 2021-03-30 | 2023-11-28 | 각꼬호우징 닛뽄 이까다이가꾸 | Thyroid follicular cancer specific marker |
Citations (4)
| Publication number | Priority date | Publication date | Assignee | Title |
|---|---|---|---|---|
| US6410278B1 (en) | 1998-11-09 | 2002-06-25 | Eiken Kagaku Kabushiki Kaisha | Process for synthesizing nucleic acid |
| WO2010030365A2 (en) * | 2008-09-12 | 2010-03-18 | Cornell Research Foundation, Inc. Wmc | Thyroid tumors identified |
| WO2010056374A2 (en) * | 2008-11-17 | 2010-05-20 | Veracyte, Inc. | Methods and compositions of molecular profiling for disease diagnostics |
| EP2366800A1 (en) * | 2010-03-01 | 2011-09-21 | Centrum Onkologii-Instytut im M. Sklodowskiej-Curie Oddzial w Gliwicach | Kit, method and use for the diagnosis of papillary thyroid cancer using a gene expression profile |
Family Cites Families (2)
| Publication number | Priority date | Publication date | Assignee | Title |
|---|---|---|---|---|
| JP4428932B2 (en) * | 2003-03-20 | 2010-03-10 | 徹 高野 | Thyroid tumor marker and molecular classification method of thyroid tumor. |
| JP2005168432A (en) * | 2003-12-12 | 2005-06-30 | Nara Institute Of Science & Technology | Method for collecting data for discriminating follicular carcinoma of thyroid from follicular adenoma of thyroid and kit for the same method |
-
2013
- 2013-11-05 JP JP2013229365A patent/JP6200281B2/en active Active
- 2013-11-22 EP EP13194017.3A patent/EP2738264B1/en active Active
- 2013-11-27 US US14/092,467 patent/US20140162895A1/en not_active Abandoned
Patent Citations (4)
| Publication number | Priority date | Publication date | Assignee | Title |
|---|---|---|---|---|
| US6410278B1 (en) | 1998-11-09 | 2002-06-25 | Eiken Kagaku Kabushiki Kaisha | Process for synthesizing nucleic acid |
| WO2010030365A2 (en) * | 2008-09-12 | 2010-03-18 | Cornell Research Foundation, Inc. Wmc | Thyroid tumors identified |
| WO2010056374A2 (en) * | 2008-11-17 | 2010-05-20 | Veracyte, Inc. | Methods and compositions of molecular profiling for disease diagnostics |
| EP2366800A1 (en) * | 2010-03-01 | 2011-09-21 | Centrum Onkologii-Instytut im M. Sklodowskiej-Curie Oddzial w Gliwicach | Kit, method and use for the diagnosis of papillary thyroid cancer using a gene expression profile |
Non-Patent Citations (3)
| Title |
|---|
| ALEXANDER EK ET AL.: "Preoperative Diagnosis of Benign Thyroid Nodules with Indeterminate Cytology", NENG J MED, vol. 367, 2012, pages 705 - 715 |
| FINLEY DAVID J ET AL: "Advancing the molecular diagnosis of thyroid nodules: defining benign lesions by molecular profiling", THYROID, MARY ANN LIEBERT, NEW YORK, NY, US, vol. 15, no. 6, 1 June 2005 (2005-06-01), pages 562 - 568, XP009087256, ISSN: 1050-7256, DOI: 10.1089/THY.2005.15.562 * |
| JARZAB B ET AL: "Gene expression profile of papillary thyroid cancer: sources of variability and diagnostic implications", CANCER RESEARCH, AMERICAN ASSOCIATION FOR CANCER RESEARCH, US, vol. 65, no. 4, 15 February 2005 (2005-02-15), pages 1587 - 1597, XP002465072, ISSN: 0008-5472, DOI: 10.1158/0008-5472.CAN-04-3078 * |
Cited By (1)
| Publication number | Priority date | Publication date | Assignee | Title |
|---|---|---|---|---|
| WO2016005916A1 (en) * | 2014-07-09 | 2016-01-14 | Azienda Ospedaliero-Universitaria Pisana | A method and kit for the detection of a biomarker of thyroid cancer in biological samples |
Also Published As
| Publication number | Publication date |
|---|---|
| JP6200281B2 (en) | 2017-09-20 |
| JP2014128260A (en) | 2014-07-10 |
| US20140162895A1 (en) | 2014-06-12 |
| EP2738264B1 (en) | 2016-01-20 |
Similar Documents
| Publication | Publication Date | Title |
|---|---|---|
| US11549148B2 (en) | Neuroendocrine tumors | |
| JP6369857B2 (en) | Method for obtaining information on hepatocellular carcinoma, and marker and kit for obtaining information on hepatocellular carcinoma | |
| EP1526186B1 (en) | Colorectal cancer prognostics | |
| JP2009528825A (en) | Molecular analysis to predict recurrence of Dukes B colorectal cancer | |
| US8642279B2 (en) | Method for predicting risk of metastasis | |
| MX2013013746A (en) | Biomarkers for lung cancer. | |
| EP2754720A1 (en) | Prostate cancer survival and recurrence | |
| US20150005184A1 (en) | Diagnosis of melanoma by nucleic acid analysis | |
| US20200109457A1 (en) | Chromosomal assessment to diagnose urogenital malignancy in dogs | |
| EP2738264A1 (en) | A method and system for determining behavior of thyroid tumor | |
| WO2014159425A1 (en) | Bladder cancer detection and monitoring | |
| US20180051342A1 (en) | Prostate cancer survival and recurrence | |
| US20110039723A1 (en) | Malignancy-risk signature from histologically normal breast tissue | |
| US20230072300A1 (en) | Chromosomal assessment to differentiate histiocytic malignancy from lymphoma and hemangiosarcoma in dogs | |
| US20150329911A1 (en) | Nucleic acid biomarkers for prostate cancer | |
| EP2034029B1 (en) | Test method for malt lymphoma and kit therefor | |
| JP2007135466A (en) | Gene set for forecasting relapse of lung adenocarcinoma | |
| WO2015121663A1 (en) | Biomarkers for prostate cancer | |
| WO2023004460A1 (en) | Methods of detecting and/or diagnosing pancreatic cancer | |
| JP2020167940A (en) | Method and kit for evaluating late-stage recurrence risk of breast cancer | |
| JP2007135465A (en) | Gene set for identifying lymph node metastasis of lung cancer | |
| JP2007006794A (en) | Gene set for discriminating pulmonary squamous cell carcinoma |
Legal Events
| Date | Code | Title | Description |
|---|---|---|---|
| PUAI | Public reference made under article 153(3) epc to a published international application that has entered the european phase |
Free format text: ORIGINAL CODE: 0009012 |
|
| 17P | Request for examination filed |
Effective date: 20131122 |
|
| AK | Designated contracting states |
Kind code of ref document: A1 Designated state(s): AL AT BE BG CH CY CZ DE DK EE ES FI FR GB GR HR HU IE IS IT LI LT LU LV MC MK MT NL NO PL PT RO RS SE SI SK SM TR |
|
| AX | Request for extension of the european patent |
Extension state: BA ME |
|
| R17P | Request for examination filed (corrected) |
Effective date: 20141104 |
|
| RBV | Designated contracting states (corrected) |
Designated state(s): AL AT BE BG CH CY CZ DE DK EE ES FI FR GB GR HR HU IE IS IT LI LT LU LV MC MK MT NL NO PL PT RO RS SE SI SK SM TR |
|
| 17Q | First examination report despatched |
Effective date: 20150219 |
|
| GRAP | Despatch of communication of intention to grant a patent |
Free format text: ORIGINAL CODE: EPIDOSNIGR1 |
|
| INTG | Intention to grant announced |
Effective date: 20150813 |
|
| GRAS | Grant fee paid |
Free format text: ORIGINAL CODE: EPIDOSNIGR3 |
|
| GRAA | (expected) grant |
Free format text: ORIGINAL CODE: 0009210 |
|
| AK | Designated contracting states |
Kind code of ref document: B1 Designated state(s): AL AT BE BG CH CY CZ DE DK EE ES FI FR GB GR HR HU IE IS IT LI LT LU LV MC MK MT NL NO PL PT RO RS SE SI SK SM TR |
|
| REG | Reference to a national code |
Ref country code: GB Ref legal event code: FG4D |
|
| REG | Reference to a national code |
Ref country code: CH Ref legal event code: EP |
|
| REG | Reference to a national code |
Ref country code: IE Ref legal event code: FG4D |
|
| REG | Reference to a national code |
Ref country code: AT Ref legal event code: REF Ref document number: 771759 Country of ref document: AT Kind code of ref document: T Effective date: 20160215 |
|
| REG | Reference to a national code |
Ref country code: DE Ref legal event code: R096 Ref document number: 602013004730 Country of ref document: DE |
|
| REG | Reference to a national code |
Ref country code: LT Ref legal event code: MG4D Ref country code: NL Ref legal event code: MP Effective date: 20160120 |
|
| REG | Reference to a national code |
Ref country code: AT Ref legal event code: MK05 Ref document number: 771759 Country of ref document: AT Kind code of ref document: T Effective date: 20160120 |
|
| PG25 | Lapsed in a contracting state [announced via postgrant information from national office to epo] |
Ref country code: NL Free format text: LAPSE BECAUSE OF FAILURE TO SUBMIT A TRANSLATION OF THE DESCRIPTION OR TO PAY THE FEE WITHIN THE PRESCRIBED TIME-LIMIT Effective date: 20160120 |
|
| PG25 | Lapsed in a contracting state [announced via postgrant information from national office to epo] |
Ref country code: HR Free format text: LAPSE BECAUSE OF FAILURE TO SUBMIT A TRANSLATION OF THE DESCRIPTION OR TO PAY THE FEE WITHIN THE PRESCRIBED TIME-LIMIT Effective date: 20160120 Ref country code: FI Free format text: LAPSE BECAUSE OF FAILURE TO SUBMIT A TRANSLATION OF THE DESCRIPTION OR TO PAY THE FEE WITHIN THE PRESCRIBED TIME-LIMIT Effective date: 20160120 Ref country code: ES Free format text: LAPSE BECAUSE OF FAILURE TO SUBMIT A TRANSLATION OF THE DESCRIPTION OR TO PAY THE FEE WITHIN THE PRESCRIBED TIME-LIMIT Effective date: 20160120 Ref country code: IT Free format text: LAPSE BECAUSE OF FAILURE TO SUBMIT A TRANSLATION OF THE DESCRIPTION OR TO PAY THE FEE WITHIN THE PRESCRIBED TIME-LIMIT Effective date: 20160120 Ref country code: GR Free format text: LAPSE BECAUSE OF FAILURE TO SUBMIT A TRANSLATION OF THE DESCRIPTION OR TO PAY THE FEE WITHIN THE PRESCRIBED TIME-LIMIT Effective date: 20160421 Ref country code: NO Free format text: LAPSE BECAUSE OF FAILURE TO SUBMIT A TRANSLATION OF THE DESCRIPTION OR TO PAY THE FEE WITHIN THE PRESCRIBED TIME-LIMIT Effective date: 20160420 |
|
| PG25 | Lapsed in a contracting state [announced via postgrant information from national office to epo] |
Ref country code: RS Free format text: LAPSE BECAUSE OF FAILURE TO SUBMIT A TRANSLATION OF THE DESCRIPTION OR TO PAY THE FEE WITHIN THE PRESCRIBED TIME-LIMIT Effective date: 20160120 Ref country code: SE Free format text: LAPSE BECAUSE OF FAILURE TO SUBMIT A TRANSLATION OF THE DESCRIPTION OR TO PAY THE FEE WITHIN THE PRESCRIBED TIME-LIMIT Effective date: 20160120 Ref country code: IS Free format text: LAPSE BECAUSE OF FAILURE TO SUBMIT A TRANSLATION OF THE DESCRIPTION OR TO PAY THE FEE WITHIN THE PRESCRIBED TIME-LIMIT Effective date: 20160520 Ref country code: LV Free format text: LAPSE BECAUSE OF FAILURE TO SUBMIT A TRANSLATION OF THE DESCRIPTION OR TO PAY THE FEE WITHIN THE PRESCRIBED TIME-LIMIT Effective date: 20160120 Ref country code: AT Free format text: LAPSE BECAUSE OF FAILURE TO SUBMIT A TRANSLATION OF THE DESCRIPTION OR TO PAY THE FEE WITHIN THE PRESCRIBED TIME-LIMIT Effective date: 20160120 Ref country code: PL Free format text: LAPSE BECAUSE OF FAILURE TO SUBMIT A TRANSLATION OF THE DESCRIPTION OR TO PAY THE FEE WITHIN THE PRESCRIBED TIME-LIMIT Effective date: 20160120 Ref country code: PT Free format text: LAPSE BECAUSE OF FAILURE TO SUBMIT A TRANSLATION OF THE DESCRIPTION OR TO PAY THE FEE WITHIN THE PRESCRIBED TIME-LIMIT Effective date: 20160520 Ref country code: LT Free format text: LAPSE BECAUSE OF FAILURE TO SUBMIT A TRANSLATION OF THE DESCRIPTION OR TO PAY THE FEE WITHIN THE PRESCRIBED TIME-LIMIT Effective date: 20160120 |
|
| REG | Reference to a national code |
Ref country code: FR Ref legal event code: PLFP Year of fee payment: 4 |
|
| REG | Reference to a national code |
Ref country code: DE Ref legal event code: R097 Ref document number: 602013004730 Country of ref document: DE |
|
| PG25 | Lapsed in a contracting state [announced via postgrant information from national office to epo] |
Ref country code: EE Free format text: LAPSE BECAUSE OF FAILURE TO SUBMIT A TRANSLATION OF THE DESCRIPTION OR TO PAY THE FEE WITHIN THE PRESCRIBED TIME-LIMIT Effective date: 20160120 Ref country code: DK Free format text: LAPSE BECAUSE OF FAILURE TO SUBMIT A TRANSLATION OF THE DESCRIPTION OR TO PAY THE FEE WITHIN THE PRESCRIBED TIME-LIMIT Effective date: 20160120 |
|
| PLBE | No opposition filed within time limit |
Free format text: ORIGINAL CODE: 0009261 |
|
| STAA | Information on the status of an ep patent application or granted ep patent |
Free format text: STATUS: NO OPPOSITION FILED WITHIN TIME LIMIT |
|
| PG25 | Lapsed in a contracting state [announced via postgrant information from national office to epo] |
Ref country code: SM Free format text: LAPSE BECAUSE OF FAILURE TO SUBMIT A TRANSLATION OF THE DESCRIPTION OR TO PAY THE FEE WITHIN THE PRESCRIBED TIME-LIMIT Effective date: 20160120 Ref country code: SK Free format text: LAPSE BECAUSE OF FAILURE TO SUBMIT A TRANSLATION OF THE DESCRIPTION OR TO PAY THE FEE WITHIN THE PRESCRIBED TIME-LIMIT Effective date: 20160120 Ref country code: CZ Free format text: LAPSE BECAUSE OF FAILURE TO SUBMIT A TRANSLATION OF THE DESCRIPTION OR TO PAY THE FEE WITHIN THE PRESCRIBED TIME-LIMIT Effective date: 20160120 Ref country code: RO Free format text: LAPSE BECAUSE OF FAILURE TO SUBMIT A TRANSLATION OF THE DESCRIPTION OR TO PAY THE FEE WITHIN THE PRESCRIBED TIME-LIMIT Effective date: 20160120 |
|
| 26N | No opposition filed |
Effective date: 20161021 |
|
| PG25 | Lapsed in a contracting state [announced via postgrant information from national office to epo] |
Ref country code: BE Free format text: LAPSE BECAUSE OF FAILURE TO SUBMIT A TRANSLATION OF THE DESCRIPTION OR TO PAY THE FEE WITHIN THE PRESCRIBED TIME-LIMIT Effective date: 20160120 |
|
| PG25 | Lapsed in a contracting state [announced via postgrant information from national office to epo] |
Ref country code: BG Free format text: LAPSE BECAUSE OF FAILURE TO SUBMIT A TRANSLATION OF THE DESCRIPTION OR TO PAY THE FEE WITHIN THE PRESCRIBED TIME-LIMIT Effective date: 20160420 Ref country code: SI Free format text: LAPSE BECAUSE OF FAILURE TO SUBMIT A TRANSLATION OF THE DESCRIPTION OR TO PAY THE FEE WITHIN THE PRESCRIBED TIME-LIMIT Effective date: 20160120 |
|
| REG | Reference to a national code |
Ref country code: CH Ref legal event code: PL |
|
| PG25 | Lapsed in a contracting state [announced via postgrant information from national office to epo] |
Ref country code: CH Free format text: LAPSE BECAUSE OF NON-PAYMENT OF DUE FEES Effective date: 20161130 Ref country code: LI Free format text: LAPSE BECAUSE OF NON-PAYMENT OF DUE FEES Effective date: 20161130 |
|
| REG | Reference to a national code |
Ref country code: IE Ref legal event code: MM4A |
|
| PG25 | Lapsed in a contracting state [announced via postgrant information from national office to epo] |
Ref country code: LU Free format text: LAPSE BECAUSE OF NON-PAYMENT OF DUE FEES Effective date: 20161130 |
|
| REG | Reference to a national code |
Ref country code: FR Ref legal event code: PLFP Year of fee payment: 5 |
|
| PG25 | Lapsed in a contracting state [announced via postgrant information from national office to epo] |
Ref country code: IE Free format text: LAPSE BECAUSE OF NON-PAYMENT OF DUE FEES Effective date: 20161122 |
|
| PG25 | Lapsed in a contracting state [announced via postgrant information from national office to epo] |
Ref country code: CY Free format text: LAPSE BECAUSE OF FAILURE TO SUBMIT A TRANSLATION OF THE DESCRIPTION OR TO PAY THE FEE WITHIN THE PRESCRIBED TIME-LIMIT Effective date: 20160120 Ref country code: HU Free format text: LAPSE BECAUSE OF FAILURE TO SUBMIT A TRANSLATION OF THE DESCRIPTION OR TO PAY THE FEE WITHIN THE PRESCRIBED TIME-LIMIT; INVALID AB INITIO Effective date: 20131122 |
|
| PG25 | Lapsed in a contracting state [announced via postgrant information from national office to epo] |
Ref country code: MC Free format text: LAPSE BECAUSE OF FAILURE TO SUBMIT A TRANSLATION OF THE DESCRIPTION OR TO PAY THE FEE WITHIN THE PRESCRIBED TIME-LIMIT Effective date: 20160120 Ref country code: MK Free format text: LAPSE BECAUSE OF FAILURE TO SUBMIT A TRANSLATION OF THE DESCRIPTION OR TO PAY THE FEE WITHIN THE PRESCRIBED TIME-LIMIT Effective date: 20160120 |
|
| PG25 | Lapsed in a contracting state [announced via postgrant information from national office to epo] |
Ref country code: MT Free format text: LAPSE BECAUSE OF NON-PAYMENT OF DUE FEES Effective date: 20161122 |
|
| REG | Reference to a national code |
Ref country code: FR Ref legal event code: PLFP Year of fee payment: 6 |
|
| PG25 | Lapsed in a contracting state [announced via postgrant information from national office to epo] |
Ref country code: TR Free format text: LAPSE BECAUSE OF FAILURE TO SUBMIT A TRANSLATION OF THE DESCRIPTION OR TO PAY THE FEE WITHIN THE PRESCRIBED TIME-LIMIT Effective date: 20160120 Ref country code: AL Free format text: LAPSE BECAUSE OF FAILURE TO SUBMIT A TRANSLATION OF THE DESCRIPTION OR TO PAY THE FEE WITHIN THE PRESCRIBED TIME-LIMIT Effective date: 20160120 |
|
| PGFP | Annual fee paid to national office [announced via postgrant information from national office to epo] |
Ref country code: GB Payment date: 20230928 Year of fee payment: 11 |
|
| PGFP | Annual fee paid to national office [announced via postgrant information from national office to epo] |
Ref country code: FR Payment date: 20230929 Year of fee payment: 11 |
|
| PGFP | Annual fee paid to national office [announced via postgrant information from national office to epo] |
Ref country code: DE Payment date: 20230929 Year of fee payment: 11 |