EP2704630B1 - System for tracking brain states during administration of anesthesia - Google Patents
System for tracking brain states during administration of anesthesia Download PDFInfo
- Publication number
- EP2704630B1 EP2704630B1 EP12781958.9A EP12781958A EP2704630B1 EP 2704630 B1 EP2704630 B1 EP 2704630B1 EP 12781958 A EP12781958 A EP 12781958A EP 2704630 B1 EP2704630 B1 EP 2704630B1
- Authority
- EP
- European Patent Office
- Prior art keywords
- patient
- drug
- phase
- eeg
- anesthesia
- Prior art date
- Legal status (The legal status is an assumption and is not a legal conclusion. Google has not performed a legal analysis and makes no representation as to the accuracy of the status listed.)
- Active
Links
- 206010002091 Anaesthesia Diseases 0.000 title description 54
- 230000037005 anaesthesia Effects 0.000 title description 53
- 210000004556 brain Anatomy 0.000 title description 23
- 238000000537 electroencephalography Methods 0.000 claims description 64
- 239000003814 drug Substances 0.000 claims description 41
- 229940079593 drug Drugs 0.000 claims description 39
- 230000000694 effects Effects 0.000 claims description 39
- 238000004458 analytical method Methods 0.000 claims description 26
- 230000003444 anaesthetic effect Effects 0.000 claims description 24
- 229960004134 propofol Drugs 0.000 claims description 16
- OLBCVFGFOZPWHH-UHFFFAOYSA-N propofol Chemical compound CC(C)C1=CC=CC(C(C)C)=C1O OLBCVFGFOZPWHH-UHFFFAOYSA-N 0.000 claims description 16
- 238000012544 monitoring process Methods 0.000 claims description 15
- 238000001228 spectrum Methods 0.000 claims description 14
- 230000003542 behavioural effect Effects 0.000 claims description 12
- 238000011084 recovery Methods 0.000 claims description 10
- 230000033764 rhythmic process Effects 0.000 claims description 10
- YQEZLKZALYSWHR-UHFFFAOYSA-N Ketamine Chemical compound C=1C=CC=C(Cl)C=1C1(NC)CCCCC1=O YQEZLKZALYSWHR-UHFFFAOYSA-N 0.000 claims description 9
- 229960003299 ketamine Drugs 0.000 claims description 9
- 230000008878 coupling Effects 0.000 claims description 8
- 238000010168 coupling process Methods 0.000 claims description 8
- 238000005859 coupling reaction Methods 0.000 claims description 8
- 229960004253 dexmedetomidine Drugs 0.000 claims description 8
- HRLIOXLXPOHXTA-NSHDSACASA-N dexmedetomidine Chemical compound C1([C@@H](C)C=2C(=C(C)C=CC=2)C)=CN=C[N]1 HRLIOXLXPOHXTA-NSHDSACASA-N 0.000 claims description 8
- DFEYYRMXOJXZRJ-UHFFFAOYSA-N sevoflurane Chemical compound FCOC(C(F)(F)F)C(F)(F)F DFEYYRMXOJXZRJ-UHFFFAOYSA-N 0.000 claims description 8
- 229960002078 sevoflurane Drugs 0.000 claims description 8
- PIWKPBJCKXDKJR-UHFFFAOYSA-N Isoflurane Chemical compound FC(F)OC(Cl)C(F)(F)F PIWKPBJCKXDKJR-UHFFFAOYSA-N 0.000 claims description 5
- 229960002725 isoflurane Drugs 0.000 claims description 5
- -1 Barbiturates Chemical compound 0.000 claims description 4
- 238000001647 drug administration Methods 0.000 claims description 4
- WEXRUCMBJFQVBZ-UHFFFAOYSA-N pentobarbital Chemical compound CCCC(C)C1(CC)C(=O)NC(=O)NC1=O WEXRUCMBJFQVBZ-UHFFFAOYSA-N 0.000 claims description 4
- DIWRORZWFLOCLC-HNNXBMFYSA-N (3s)-7-chloro-5-(2-chlorophenyl)-3-hydroxy-1,3-dihydro-1,4-benzodiazepin-2-one Chemical compound N([C@H](C(NC1=CC=C(Cl)C=C11)=O)O)=C1C1=CC=CC=C1Cl DIWRORZWFLOCLC-HNNXBMFYSA-N 0.000 claims description 2
- NZXKDOXHBHYTKP-UHFFFAOYSA-N Metohexital Chemical compound CCC#CC(C)C1(CC=C)C(=O)NC(=O)N(C)C1=O NZXKDOXHBHYTKP-UHFFFAOYSA-N 0.000 claims description 2
- IDBPHNDTYPBSNI-UHFFFAOYSA-N N-(1-(2-(4-Ethyl-5-oxo-2-tetrazolin-1-yl)ethyl)-4-(methoxymethyl)-4-piperidyl)propionanilide Chemical compound C1CN(CCN2C(N(CC)N=N2)=O)CCC1(COC)N(C(=O)CC)C1=CC=CC=C1 IDBPHNDTYPBSNI-UHFFFAOYSA-N 0.000 claims description 2
- IUJDSEJGGMCXSG-UHFFFAOYSA-N Thiopental Chemical compound CCCC(C)C1(CC)C(=O)NC(=S)NC1=O IUJDSEJGGMCXSG-UHFFFAOYSA-N 0.000 claims description 2
- 229960001391 alfentanil Drugs 0.000 claims description 2
- 229940125717 barbiturate Drugs 0.000 claims description 2
- 229940049706 benzodiazepine Drugs 0.000 claims description 2
- 150000001557 benzodiazepines Chemical class 0.000 claims description 2
- DPYMFVXJLLWWEU-UHFFFAOYSA-N desflurane Chemical compound FC(F)OC(F)C(F)(F)F DPYMFVXJLLWWEU-UHFFFAOYSA-N 0.000 claims description 2
- 229960003537 desflurane Drugs 0.000 claims description 2
- 229960003529 diazepam Drugs 0.000 claims description 2
- AAOVKJBEBIDNHE-UHFFFAOYSA-N diazepam Chemical compound N=1CC(=O)N(C)C2=CC=C(Cl)C=C2C=1C1=CC=CC=C1 AAOVKJBEBIDNHE-UHFFFAOYSA-N 0.000 claims description 2
- NPUKDXXFDDZOKR-LLVKDONJSA-N etomidate Chemical compound CCOC(=O)C1=CN=CN1[C@H](C)C1=CC=CC=C1 NPUKDXXFDDZOKR-LLVKDONJSA-N 0.000 claims description 2
- 229960001690 etomidate Drugs 0.000 claims description 2
- 229960002428 fentanyl Drugs 0.000 claims description 2
- PJMPHNIQZUBGLI-UHFFFAOYSA-N fentanyl Chemical compound C=1C=CC=CC=1N(C(=O)CC)C(CC1)CCN1CCC1=CC=CC=C1 PJMPHNIQZUBGLI-UHFFFAOYSA-N 0.000 claims description 2
- 229960004391 lorazepam Drugs 0.000 claims description 2
- 229960002683 methohexital Drugs 0.000 claims description 2
- DDLIGBOFAVUZHB-UHFFFAOYSA-N midazolam Chemical compound C12=CC(Cl)=CC=C2N2C(C)=NC=C2CN=C1C1=CC=CC=C1F DDLIGBOFAVUZHB-UHFFFAOYSA-N 0.000 claims description 2
- 229960003793 midazolam Drugs 0.000 claims description 2
- 229960001412 pentobarbital Drugs 0.000 claims description 2
- DDBREPKUVSBGFI-UHFFFAOYSA-N phenobarbital Chemical compound C=1C=CC=CC=1C1(CC)C(=O)NC(=O)NC1=O DDBREPKUVSBGFI-UHFFFAOYSA-N 0.000 claims description 2
- 229960002695 phenobarbital Drugs 0.000 claims description 2
- 231100000430 skin reaction Toxicity 0.000 claims description 2
- 229960004739 sufentanil Drugs 0.000 claims description 2
- GGCSSNBKKAUURC-UHFFFAOYSA-N sufentanil Chemical compound C1CN(CCC=2SC=CC=2)CCC1(COC)N(C(=O)CC)C1=CC=CC=C1 GGCSSNBKKAUURC-UHFFFAOYSA-N 0.000 claims description 2
- 229960003279 thiopental Drugs 0.000 claims description 2
- 230000036772 blood pressure Effects 0.000 claims 1
- 230000007177 brain activity Effects 0.000 claims 1
- 230000001747 exhibiting effect Effects 0.000 claims 1
- 238000003672 processing method Methods 0.000 claims 1
- 208000003443 Unconsciousness Diseases 0.000 description 48
- 230000010355 oscillation Effects 0.000 description 47
- 230000003595 spectral effect Effects 0.000 description 32
- 238000000034 method Methods 0.000 description 28
- 230000004044 response Effects 0.000 description 25
- 150000001875 compounds Chemical class 0.000 description 24
- 230000000875 corresponding effect Effects 0.000 description 17
- 230000006870 function Effects 0.000 description 15
- 230000008569 process Effects 0.000 description 15
- 230000007423 decrease Effects 0.000 description 14
- 230000007704 transition Effects 0.000 description 14
- 238000009826 distribution Methods 0.000 description 12
- 238000012935 Averaging Methods 0.000 description 11
- 239000011159 matrix material Substances 0.000 description 10
- 230000001755 vocal effect Effects 0.000 description 10
- 206010039897 Sedation Diseases 0.000 description 8
- 230000036280 sedation Effects 0.000 description 8
- 230000002123 temporal effect Effects 0.000 description 8
- 210000004761 scalp Anatomy 0.000 description 7
- 238000012806 monitoring device Methods 0.000 description 6
- 230000006998 cognitive state Effects 0.000 description 5
- 230000007246 mechanism Effects 0.000 description 5
- 238000010207 Bayesian analysis Methods 0.000 description 4
- RTZKZFJDLAIYFH-UHFFFAOYSA-N Diethyl ether Chemical compound CCOCC RTZKZFJDLAIYFH-UHFFFAOYSA-N 0.000 description 4
- 230000006399 behavior Effects 0.000 description 4
- 239000003193 general anesthetic agent Substances 0.000 description 4
- 238000012545 processing Methods 0.000 description 4
- 229940035674 anesthetics Drugs 0.000 description 3
- 238000012512 characterization method Methods 0.000 description 3
- 238000013461 design Methods 0.000 description 3
- 238000002474 experimental method Methods 0.000 description 3
- 238000002695 general anesthesia Methods 0.000 description 3
- 210000003128 head Anatomy 0.000 description 3
- 238000005457 optimization Methods 0.000 description 3
- 238000010183 spectrum analysis Methods 0.000 description 3
- 230000000007 visual effect Effects 0.000 description 3
- 230000008901 benefit Effects 0.000 description 2
- 238000001514 detection method Methods 0.000 description 2
- 230000003292 diminished effect Effects 0.000 description 2
- 230000004807 localization Effects 0.000 description 2
- 238000012423 maintenance Methods 0.000 description 2
- 230000036403 neuro physiology Effects 0.000 description 2
- 230000036407 pain Effects 0.000 description 2
- 230000002441 reversible effect Effects 0.000 description 2
- 230000001629 suppression Effects 0.000 description 2
- 238000001356 surgical procedure Methods 0.000 description 2
- 238000011282 treatment Methods 0.000 description 2
- 208000020401 Depressive disease Diseases 0.000 description 1
- 238000000342 Monte Carlo simulation Methods 0.000 description 1
- 229940035676 analgesics Drugs 0.000 description 1
- 230000003042 antagnostic effect Effects 0.000 description 1
- 239000000730 antalgic agent Substances 0.000 description 1
- 230000003466 anti-cipated effect Effects 0.000 description 1
- 238000013459 approach Methods 0.000 description 1
- 230000037007 arousal Effects 0.000 description 1
- 238000013476 bayesian approach Methods 0.000 description 1
- 238000013398 bayesian method Methods 0.000 description 1
- 238000004364 calculation method Methods 0.000 description 1
- 230000008859 change Effects 0.000 description 1
- 230000000052 comparative effect Effects 0.000 description 1
- 230000000295 complement effect Effects 0.000 description 1
- 230000001276 controlling effect Effects 0.000 description 1
- 230000002596 correlated effect Effects 0.000 description 1
- 238000000354 decomposition reaction Methods 0.000 description 1
- 230000003247 decreasing effect Effects 0.000 description 1
- 238000001914 filtration Methods 0.000 description 1
- 238000009472 formulation Methods 0.000 description 1
- 230000036541 health Effects 0.000 description 1
- 230000006698 induction Effects 0.000 description 1
- 238000013101 initial test Methods 0.000 description 1
- 238000012417 linear regression Methods 0.000 description 1
- 239000000203 mixture Substances 0.000 description 1
- 238000012986 modification Methods 0.000 description 1
- 230000004048 modification Effects 0.000 description 1
- 230000007170 pathology Effects 0.000 description 1
- 230000000737 periodic effect Effects 0.000 description 1
- 238000011422 pharmacological therapy Methods 0.000 description 1
- 230000006461 physiological response Effects 0.000 description 1
- 238000012805 post-processing Methods 0.000 description 1
- 238000004445 quantitative analysis Methods 0.000 description 1
- 238000005295 random walk Methods 0.000 description 1
- 238000010223 real-time analysis Methods 0.000 description 1
- 238000009877 rendering Methods 0.000 description 1
- 230000004043 responsiveness Effects 0.000 description 1
- 230000001020 rhythmical effect Effects 0.000 description 1
- 230000000630 rising effect Effects 0.000 description 1
- 238000005070 sampling Methods 0.000 description 1
- 230000007958 sleep Effects 0.000 description 1
- 230000037322 slow-wave sleep Effects 0.000 description 1
- 230000009897 systematic effect Effects 0.000 description 1
- 238000002560 therapeutic procedure Methods 0.000 description 1
- 238000009827 uniform distribution Methods 0.000 description 1
- 238000010200 validation analysis Methods 0.000 description 1
- 230000010356 wave oscillation Effects 0.000 description 1
Images


Classifications
-
- A—HUMAN NECESSITIES
- A61—MEDICAL OR VETERINARY SCIENCE; HYGIENE
- A61B—DIAGNOSIS; SURGERY; IDENTIFICATION
- A61B5/00—Measuring for diagnostic purposes; Identification of persons
- A61B5/48—Other medical applications
- A61B5/4821—Determining level or depth of anaesthesia
-
- A—HUMAN NECESSITIES
- A61—MEDICAL OR VETERINARY SCIENCE; HYGIENE
- A61B—DIAGNOSIS; SURGERY; IDENTIFICATION
- A61B5/00—Measuring for diagnostic purposes; Identification of persons
- A61B5/02—Detecting, measuring or recording pulse, heart rate, blood pressure or blood flow; Combined pulse/heart-rate/blood pressure determination; Evaluating a cardiovascular condition not otherwise provided for, e.g. using combinations of techniques provided for in this group with electrocardiography or electroauscultation; Heart catheters for measuring blood pressure
- A61B5/0205—Simultaneously evaluating both cardiovascular conditions and different types of body conditions, e.g. heart and respiratory condition
-
- A—HUMAN NECESSITIES
- A61—MEDICAL OR VETERINARY SCIENCE; HYGIENE
- A61B—DIAGNOSIS; SURGERY; IDENTIFICATION
- A61B5/00—Measuring for diagnostic purposes; Identification of persons
- A61B5/16—Devices for psychotechnics; Testing reaction times ; Devices for evaluating the psychological state
-
- A—HUMAN NECESSITIES
- A61—MEDICAL OR VETERINARY SCIENCE; HYGIENE
- A61B—DIAGNOSIS; SURGERY; IDENTIFICATION
- A61B5/00—Measuring for diagnostic purposes; Identification of persons
- A61B5/16—Devices for psychotechnics; Testing reaction times ; Devices for evaluating the psychological state
- A61B5/165—Evaluating the state of mind, e.g. depression, anxiety
-
- A—HUMAN NECESSITIES
- A61—MEDICAL OR VETERINARY SCIENCE; HYGIENE
- A61B—DIAGNOSIS; SURGERY; IDENTIFICATION
- A61B5/00—Measuring for diagnostic purposes; Identification of persons
- A61B5/24—Detecting, measuring or recording bioelectric or biomagnetic signals of the body or parts thereof
- A61B5/316—Modalities, i.e. specific diagnostic methods
- A61B5/369—Electroencephalography [EEG]
- A61B5/372—Analysis of electroencephalograms
- A61B5/374—Detecting the frequency distribution of signals, e.g. detecting delta, theta, alpha, beta or gamma waves
-
- A—HUMAN NECESSITIES
- A61—MEDICAL OR VETERINARY SCIENCE; HYGIENE
- A61B—DIAGNOSIS; SURGERY; IDENTIFICATION
- A61B5/00—Measuring for diagnostic purposes; Identification of persons
- A61B5/48—Other medical applications
- A61B5/4836—Diagnosis combined with treatment in closed-loop systems or methods
- A61B5/4839—Diagnosis combined with treatment in closed-loop systems or methods combined with drug delivery
-
- A—HUMAN NECESSITIES
- A61—MEDICAL OR VETERINARY SCIENCE; HYGIENE
- A61B—DIAGNOSIS; SURGERY; IDENTIFICATION
- A61B5/00—Measuring for diagnostic purposes; Identification of persons
- A61B5/72—Signal processing specially adapted for physiological signals or for diagnostic purposes
- A61B5/7235—Details of waveform analysis
- A61B5/7246—Details of waveform analysis using correlation, e.g. template matching or determination of similarity
-
- A—HUMAN NECESSITIES
- A61—MEDICAL OR VETERINARY SCIENCE; HYGIENE
- A61B—DIAGNOSIS; SURGERY; IDENTIFICATION
- A61B5/00—Measuring for diagnostic purposes; Identification of persons
- A61B5/72—Signal processing specially adapted for physiological signals or for diagnostic purposes
- A61B5/7235—Details of waveform analysis
- A61B5/7253—Details of waveform analysis characterised by using transforms
- A61B5/7257—Details of waveform analysis characterised by using transforms using Fourier transforms
-
- G—PHYSICS
- G06—COMPUTING; CALCULATING OR COUNTING
- G06F—ELECTRIC DIGITAL DATA PROCESSING
- G06F17/00—Digital computing or data processing equipment or methods, specially adapted for specific functions
- G06F17/10—Complex mathematical operations
- G06F17/18—Complex mathematical operations for evaluating statistical data, e.g. average values, frequency distributions, probability functions, regression analysis
-
- G—PHYSICS
- G16—INFORMATION AND COMMUNICATION TECHNOLOGY [ICT] SPECIALLY ADAPTED FOR SPECIFIC APPLICATION FIELDS
- G16H—HEALTHCARE INFORMATICS, i.e. INFORMATION AND COMMUNICATION TECHNOLOGY [ICT] SPECIALLY ADAPTED FOR THE HANDLING OR PROCESSING OF MEDICAL OR HEALTHCARE DATA
- G16H20/00—ICT specially adapted for therapies or health-improving plans, e.g. for handling prescriptions, for steering therapy or for monitoring patient compliance
- G16H20/10—ICT specially adapted for therapies or health-improving plans, e.g. for handling prescriptions, for steering therapy or for monitoring patient compliance relating to drugs or medications, e.g. for ensuring correct administration to patients
-
- G—PHYSICS
- G16—INFORMATION AND COMMUNICATION TECHNOLOGY [ICT] SPECIALLY ADAPTED FOR SPECIFIC APPLICATION FIELDS
- G16H—HEALTHCARE INFORMATICS, i.e. INFORMATION AND COMMUNICATION TECHNOLOGY [ICT] SPECIALLY ADAPTED FOR THE HANDLING OR PROCESSING OF MEDICAL OR HEALTHCARE DATA
- G16H40/00—ICT specially adapted for the management or administration of healthcare resources or facilities; ICT specially adapted for the management or operation of medical equipment or devices
- G16H40/60—ICT specially adapted for the management or administration of healthcare resources or facilities; ICT specially adapted for the management or operation of medical equipment or devices for the operation of medical equipment or devices
- G16H40/63—ICT specially adapted for the management or administration of healthcare resources or facilities; ICT specially adapted for the management or operation of medical equipment or devices for the operation of medical equipment or devices for local operation
-
- G—PHYSICS
- G16—INFORMATION AND COMMUNICATION TECHNOLOGY [ICT] SPECIALLY ADAPTED FOR SPECIFIC APPLICATION FIELDS
- G16H—HEALTHCARE INFORMATICS, i.e. INFORMATION AND COMMUNICATION TECHNOLOGY [ICT] SPECIALLY ADAPTED FOR THE HANDLING OR PROCESSING OF MEDICAL OR HEALTHCARE DATA
- G16H50/00—ICT specially adapted for medical diagnosis, medical simulation or medical data mining; ICT specially adapted for detecting, monitoring or modelling epidemics or pandemics
- G16H50/20—ICT specially adapted for medical diagnosis, medical simulation or medical data mining; ICT specially adapted for detecting, monitoring or modelling epidemics or pandemics for computer-aided diagnosis, e.g. based on medical expert systems
-
- G—PHYSICS
- G16—INFORMATION AND COMMUNICATION TECHNOLOGY [ICT] SPECIALLY ADAPTED FOR SPECIFIC APPLICATION FIELDS
- G16H—HEALTHCARE INFORMATICS, i.e. INFORMATION AND COMMUNICATION TECHNOLOGY [ICT] SPECIALLY ADAPTED FOR THE HANDLING OR PROCESSING OF MEDICAL OR HEALTHCARE DATA
- G16H50/00—ICT specially adapted for medical diagnosis, medical simulation or medical data mining; ICT specially adapted for detecting, monitoring or modelling epidemics or pandemics
- G16H50/70—ICT specially adapted for medical diagnosis, medical simulation or medical data mining; ICT specially adapted for detecting, monitoring or modelling epidemics or pandemics for mining of medical data, e.g. analysing previous cases of other patients
-
- G—PHYSICS
- G16—INFORMATION AND COMMUNICATION TECHNOLOGY [ICT] SPECIALLY ADAPTED FOR SPECIFIC APPLICATION FIELDS
- G16H—HEALTHCARE INFORMATICS, i.e. INFORMATION AND COMMUNICATION TECHNOLOGY [ICT] SPECIALLY ADAPTED FOR THE HANDLING OR PROCESSING OF MEDICAL OR HEALTHCARE DATA
- G16H70/00—ICT specially adapted for the handling or processing of medical references
- G16H70/40—ICT specially adapted for the handling or processing of medical references relating to drugs, e.g. their side effects or intended usage
-
- A—HUMAN NECESSITIES
- A61—MEDICAL OR VETERINARY SCIENCE; HYGIENE
- A61B—DIAGNOSIS; SURGERY; IDENTIFICATION
- A61B5/00—Measuring for diagnostic purposes; Identification of persons
- A61B5/02—Detecting, measuring or recording pulse, heart rate, blood pressure or blood flow; Combined pulse/heart-rate/blood pressure determination; Evaluating a cardiovascular condition not otherwise provided for, e.g. using combinations of techniques provided for in this group with electrocardiography or electroauscultation; Heart catheters for measuring blood pressure
-
- A—HUMAN NECESSITIES
- A61—MEDICAL OR VETERINARY SCIENCE; HYGIENE
- A61B—DIAGNOSIS; SURGERY; IDENTIFICATION
- A61B5/00—Measuring for diagnostic purposes; Identification of persons
- A61B5/24—Detecting, measuring or recording bioelectric or biomagnetic signals of the body or parts thereof
- A61B5/316—Modalities, i.e. specific diagnostic methods
- A61B5/369—Electroencephalography [EEG]
- A61B5/377—Electroencephalography [EEG] using evoked responses
- A61B5/38—Acoustic or auditory stimuli
-
- A—HUMAN NECESSITIES
- A61—MEDICAL OR VETERINARY SCIENCE; HYGIENE
- A61B—DIAGNOSIS; SURGERY; IDENTIFICATION
- A61B5/00—Measuring for diagnostic purposes; Identification of persons
- A61B5/72—Signal processing specially adapted for physiological signals or for diagnostic purposes
- A61B5/7235—Details of waveform analysis
- A61B5/7264—Classification of physiological signals or data, e.g. using neural networks, statistical classifiers, expert systems or fuzzy systems
-
- G—PHYSICS
- G06—COMPUTING; CALCULATING OR COUNTING
- G06F—ELECTRIC DIGITAL DATA PROCESSING
- G06F2218/00—Aspects of pattern recognition specially adapted for signal processing
-
- G—PHYSICS
- G06—COMPUTING; CALCULATING OR COUNTING
- G06F—ELECTRIC DIGITAL DATA PROCESSING
- G06F2218/00—Aspects of pattern recognition specially adapted for signal processing
- G06F2218/08—Feature extraction
-
- G—PHYSICS
- G06—COMPUTING; CALCULATING OR COUNTING
- G06F—ELECTRIC DIGITAL DATA PROCESSING
- G06F2218/00—Aspects of pattern recognition specially adapted for signal processing
- G06F2218/12—Classification; Matching
Definitions
- the present invention relates to systems for tracking brain states of a patient under anesthesia and, more particularly, to systems for correlating anticipated effects of a given anesthetic compound administered to a patient with characteristics of the patient's brain state during the administration of the given anesthetic compound to more accurately track the effects of the given anesthetic compound and the actual brain state of the patient.
- Obvious variables include physical attributes of the patient, such as age, state of general health, height, or weight, but also less obvious variables that are extrapolated, for example, based on prior experiences of the patient when under anesthesia.
- these variables are compounded with the variables of a given anesthesiologists' practices and the variables presented by a particular anesthetic compound or, more so, combination of anesthetic compounds, the proper and effective administration of anesthesia to a given patient can appear to be an art and a science.
- US 2011/0015538 A1 relates to a system and method for analyzing EEG data.
- the system comprises data from at least one or all of the 19 (or more) standard scalp locations, a computing device 100 operable to calculate deviance for the data, and a single score for each of a plurality of scalp sites based on the deviance.
- the present invention overcomes the aforementioned drawbacks by providing a system for determining the state of a patient's brain under anesthesia using readily-available monitoring information, such as from a patient's electroencephalography (EEG).
- EEG electroencephalography
- the present invention recognizes that anesthetic compounds induce different signatures in physiological characteristics of the patient under anesthesia and aids interpretation of such information.
- the present invention aids the correlation of the physiological characteristics and signatures to a state of the patient's brain.
- a system for monitoring a patient experiencing an administration of at least one drug having anesthetic properties according to independent claim 1 is disclosed.
- the present invention recognizes that anesthetic compounds induce different signatures in physiological characteristics of the patient under anesthesia and aids interpretation of physiological characteristics and signatures therein based on a selected anesthesia compound. Using the physiological characteristics and signatures associated with the selected anesthesia compound, the present invention aids the correlation of the physiological characteristics and signatures to a state of the patient's brain.
- a system 10 configured for use in accordance with the present invention includes a patient monitoring device 12, such as a physiological monitoring device, illustrated in Fig. 1 as an electroencephalography (EEG) electrode array.
- the patient monitoring device may also include mechanisms for monitoring galvanic skin response (GSR), for example, to measure arousal to external stimuli.
- GSR galvanic skin response
- One specific realization of this design utilizes a frontal Laplacian EEG electrode layout with additional electrodes to measure GSR.
- Another realization of this design incorporates a frontal array of electrodes that could be combined in post-processing to obtain any combination of electrodes found to optimally detect the EEG signatures described earlier, also with separate GSR electrodes.
- Another realization of this design utilizes a high-density layout sampling the entire scalp surface using between 64 to 256 sensors for the purpose of source localization, also with separate GSR electrodes.
- the patient monitoring device 12 is connected via a cable 14 to communicate with a monitoring system 16. Also, cable 14 and similar connections can be replaced by wireless connections between components. As illustrated, the monitoring system 16 may be further connected to a dedicated analysis system 18. Also, the monitoring system 16 and analysis system 18 may be integrated.
- the patient monitoring device 12 may be an EEG electrode array, for example, a 64-lead EEG electrode array.
- EEG electrode array for example, a 64-lead EEG electrode array.
- greater spatial accuracy can be achieved by increasing the number of electrodes from 64 to 128, 256, or even higher.
- the present invention can be implemented with substantially less electrodes.
- the monitoring system 16 may be configured to receive raw signals acquired by the EEG electrode array and assemble, and even display, the raw signals as EEG waveforms.
- the analysis system 18 may receive the EEG waveforms from the monitoring system 16 and, as will be described, analyze the EEG waveforms and signatures therein based on a selected anesthesia compound, determine a state of the patient based on the analyzed EEG waveforms and signatures, and generate a report, for example, as a printed report or, preferably, a real-time display of signature information and determined state.
- a report for example, as a printed report or, preferably, a real-time display of signature information and determined state.
- the functions of monitoring system 16 and analysis system 18 may be combined into a common system.
- a method for analysis and reporting begins at process block 200 with the selection of a desired drug, such as anesthesia compound or compounds, and/or a particular patient profile, such as a patient's age height, weight, gender, or the like. Such selection may be communicated through a user interface 20 of Fig. 1 .
- drug administration information such as timing, dose, rate, and the like, in conjunction with the above-described EEG data may be acquired and used to estimate and predict future patient states in accordance with the present invention.
- the present invention recognizes that the physiological responses to anesthesia vary based on the specific compound or compounds administered, as well as the patient profile.
- the present invention accounts for this variation between an elderly patient and a younger patient. Furthermore, the present invention recognizes that analyzing physiological data for signatures particular to a specific anesthetic compound or compounds administered and/or the profile of the patient substantially increases the ability to identify particular indicators of the patient's brain being in a particular state and the accuracy of state indicators and predictions based on those indicators.
- drugs are examples of drugs or anesthetic compounds that may be used with the present invention: Propofol, Etomidate, Barbiturates, Thiopental, Pentobarbital, Phenobarbital, Methohexital, Benzodiazepines, Midazolam, Diazepam, Lorazepam, Dexmedetomidine, Ketamine, Sevoflurane, Isoflurane, Desflurane, Remifenanil, Fentanyl, Sufentanil, Alfentanil, and the like.
- the present invention recognizes that each of these drugs, induces very different characteristics or signatures, for example, within EEG data or waveforms.
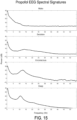
- Fig. 15 provides EEG data for one prominent drug, propofol, and associated states.
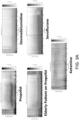
- Fig. 3A a plurality of spectrograms corresponding, as labeled, to patients having been administered Propofol, Dexmedetomidine, Sevoflurane, and Ketamine are illustrated.
- Fig. 3A shows a spectrogram of an elderly patient.
- the spectrograms vary substantially, so as to be visually distinct, based on the administered drug and/or patient profile. This is particularly true, for example, when multiple drugs are combined, such as illustrated in Fig. 3B .
- the present invention recognizes the substantial variation in physiological data acquired from a patient and the signatures contained therein.
- the present invention Based on a selected drug or drugs and/or the patient profile and, by taking this recognition into account, the present invention provides systems for tracking brain states during the administration of anesthesia that is greatly improved over traditional systems.
- a summary of exemplary "spectral templates" for each of a plurality of exemplary drugs is provided in the “examples” section. These "spectral templates” can be used to automatically identify a current or project a future state of the patient.
- EEG data EEG data
- Fig. 4 a series of EEG waveforms in the time domain are illustrated. As is clear in a side-by-side comparison such as illustrated in Fig. 4 , these EEG waveforms vary appreciably. For example, general categories of "awake” 400, “asleep” 402, and under “general anesthesia” 404 can be readily created.
- the present invention provides systems for analyzing acquired physiological information from a patient, analyzing the information and the key indicators included therein, and extrapolating information regarding a current and/or predicted future state of the patient.
- the physiological data is processed. Processing can be done in the electrode or sensor space or extrapolated to the locations in the brain. As will be described, the present invention enables the tracking of the spatiotemporal dynamics of the brain by combining spectrogram and global coherence analyses. As will be apparent, reference to “spectrogram” in may refer to a visual representation of frequency domain information, such as represented in, for example, Fig. 3A . However, a "spectrogram" within the context of the present invention need not be visually represented or displayed. Rather, within the context, for example, of processing and report generation, the spectrogram may be an intermediate processing step from which reports or visual representations are ultimately created.
- EEG waveforms in the time domain 500 have a spectrum 502 and can be translated into a spectrogram 504.
- Laplacian referencing can be performed at process block 208 to estimate radial current densities perpendicular to the scalp at each electrode site of, for example, the monitoring device 12 of Fig. 1 . Accordingly, though "spectrogram" processing is performed, a visual representation of the spectrogram need not be displayed.
- spectrograms at each electrode site are computed.
- spectrograms of the radial current density estimated at each of a plurality of electrode sites are illustrated.
- the spectrograms reflect, as illustrated in Fig. 7 , key signatures commonly identified or tracked in the time domain EEG waveforms.
- two time domain EEG waveforms and associated spectrograms are illustrated, one set 700 corresponding to light Dexmedetomine sedation and one set 702 corresponding to deep Dexmedetomine sedation.
- spindles 704 are visible and in the set 702 corresponding to deep Dexmedetomine sedation, strong slow wave oscillations 706 are visible.
- the local referencing is preferable so that distinct temporal patterns in the spectrogram at different electrode sites can be identified. This is in contrast to an average or single electrode referencing scheme, which would lead to an erroneous conclusion that approximately the same temporal pattern was present in the spectrogram at each electrode site.
- an eigenvalue decomposition can be computed of a cross-spectral matrix at each spectral frequency as a function of time.
- spectral and eigenvalue-based global coherence analyses can be used to track the spatiatemporal dynamics of the brain's anesthetic state.
- the global coherence analysis detects strong coordinated ⁇ activity in the occipital sites when the patient is awake that shifts to the frontal sites when the patient becomes unconscious.
- C X (f) is an N x N matrix of cross-spectra.
- U ( f ) H is chosen so that under the Karhunen-Loeve transform the cross-spectral matrix in the new basis:
- This ratio is called the global coherence.
- C Global (f) is close to 1.
- examining the contributions of different sites to the corresponding eigenvector by using the elements of the weight matrix provides a summary of coordinated activity at this frequency.
- These elements are row weights.
- the row weights can be obtained by the absolute value square of the elements of the row of U(f) H , which leads to the eigenvector with the highest eigenvalue.
- process blocks 208-212 yield two pieces of valuable information, namely, the spectrogram and global coherence information, which show different spatiotemporal activity at different states of the patient receiving anesthesia.
- the spectrograms will show strong occipital ⁇ activity.
- the spectrograms will show a loss of ⁇ activity and an increase in ⁇ activity in the occipital sites and strong ⁇ and ⁇ activity in the frontal sites.
- Increased power in the ⁇ , ⁇ , and ⁇ ranges in the frontal sites will occur after loss of consciousness, consistent with the well-known pattern of anteriorization.
- the coordinated activity over the occipital sites in the ⁇ range diminish.
- global coherence and weight matrices along with spectrograms provide a first level of data for determining a current state and predicting a future state of a patient's brain under anesthesia. Further details regarding initial testing and validation of such processes are provided in Cimenser A, Purdon PL, Pierce ET, Walsh JL, Salazar-Gomez AF, Harrell PG, Tavares-Stoeckel C, Habeeb K, Brown EN (2011) Tracking brain states under general anesthesia by using global coherence analysis. Proceedings of the National Academy of Sciences of the United States of America 108:8832-8837 .
- phase-amplitude analysis is performed that considers the amplitude of a given signal with respect to the phase of other signals and vice versa.
- spectral analysis of EEG recordings allows the present invention to track systematic changes in the power in specific frequency bands associated with administration of anesthesia, including changes in ⁇ (1-4 Hz), ⁇ (5-8 Hz), ⁇ (8-14 Hz), ⁇ (12-30 Hz), and ⁇ (30-80 Hz).
- spectral analysis treats oscillations within each frequency band independently, ignoring correlations in either phase or amplitude between rhythms at different frequencies.
- Power spectral measures are invariant with respect to changes in the complex phase of a signal's Fourier transform. It is thus natural to extend power spectral analysis by using measures that are sensitive to signal phase. Bispectral analysis can detect the presence of correlation in the phases of oscillation at different frequencies. Bispectrum-based statistics have been used in quantitative clinical depth-of-anesthesia monitors, in a manner that compares the bispectrum across broad low- and high-frequency ranges.
- phase-amplitude analysis instead of a traditional "cross-frequency correlation", phase-amplitude analysis, is used.
- phase-amplitude analysis the amplitude or envelope of activity in one frequency band is consistently largest at a particular phase of a lower frequency rhythm. For example, given two non-overlapping frequency bands, then in phase-amplitude coupling, the amplitude of the activity in the higher frequency band is consistently highest at a particular phase of the lower frequency rhythm.
- an analysis can be performed to measure phase-amplitude coupling in a time-resolved fashion to identify at least two distinct modes of phase-amplitude coupling corresponding to shallow and deep planes of anesthesia, respectively.
- a time-varying phase-amplitude modulogram M(t, ⁇ ) can be created that describes the relative ⁇ (or other) amplitude at a particular phase at each SO cycle.
- ultra-low-frequency drift is removed by subtracting a least-square errors spline fit to the signal with one knot for every 2 minutes (or other selected duration) of data.
- a band-pass filter may be applied to extract the rhythmic component within each frequency band of interest, x b (t), b ⁇ ⁇ ⁇ ,SO ⁇ .
- Symmetric finite impulse response filters designed using a least-squares approach SO: passband 0.1-1 Hz, transition bands 0.085-0.1 and 1- 1.15 Hz, ⁇ 17 dB attenuation in stop bands, order 2207 at 250 Hz; ⁇ : passband 8-13.9 Hz, transition bands 5.9-8 and 13.9-16 Hz, ⁇ 60 dB attenuation in stop bands, order 513) can be employed.
- and SO phase, ⁇ (t) arg[zso(t)].
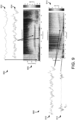
- Fig. 8 illustrates two distinct patterns of phase-amplitude modulation. Namely, a first phase-amplitude modulation is similar to slow wave sleep (peak-max -- i.e., high-frequency activity is highest at the peak of the low-frequency oscillation, corresponding to a low-frequency phase of 0), and a second phase-amplitude modulation foreshadows the return of consciousness (trough-max-- i.e., high-frequency activity is highest at the trough of the low-frequency oscillation, corresponding to a low-frequency phase of +/- ⁇ ).
- Slow oscillation phase modulates alpha/beta (8-14 Hz) amplitude, in relation to probability of response, can be studied and is reflected in Fig. 8 .
- a group behavioral curves 802 show the probability of response to click and verbal stimuli during induction in the first graph 804 and emergence in the second graph 806.
- a set of phase-amplitude histograms 808 show the relationship between the slow oscillation phase (y-axis, shown with reference sinusoid) and mean-normalized alpha/beta amplitude as a function of time (x-axis) relative to LOC 810 and ROC 812.
- a trough-max phase-amplitude relationship can be observed at the LOC/ROC transition points, where the amplitude of alpha is maximal at the slow oscillation troughs.
- a peak-max phase-amplitude relationship can be observed during the unconscious state, where the amplitude of alpha is maximal at slow oscillation peaks.
- trough-max and peak-max modulation patterns can be observed in raw EEG traces 814, which shows the trough-max and 816, which shows the peak-max, respectively.
- the trough-max pattern re-appears during emergence prior to ROC, illustrating that it can be used to predict when patients are able to regain consciousness during anesthesia.
- the trough-max relationship to predict when patients are likely to recover consciousness while emerging from anesthesia.
- the absence or loss of peak-max modulation could also be used to predict recovery of consciousness during emergence. More particularly, during emergence from propofol anesthesia, the peak-max modulation relationship between the phase of the slow oscillation and higher frequencies changes to the trough-max modulation relationship, and does so prior to the return of consciousness, with little change to the underlying power spectrum.
- the trough-max modulation has a frontal distribution, whereas the peak-max modulation is distributed approximately uniformly across the scalp.
- phase-amplitude information can provide a reliable indicator of a current or probable future patients state.
- the peak-max modulation pattern represents a state of unconsciousness that is more profound than that observed during trough-max modulation, but less profound than burst-suppression
- the peak-max modulation pattern could be used as a target for maintenance of a surgical level of anesthesia.
- the trough-max modulation represents a state of unconsciousness that is less profound than the peak-max modulation, one where patients can respond to external stimuli
- the trough-max modulation pattern could be used as a target for maintenance of sedation.
- elderly patients often exhibit diminished alpha waves or a lack of alpha waves.
- monitoring can also be performed by calculating slow oscillation phase-amplitude modulation across a broad-band frequency range including theta, alpha, beta, and gamma bands.
- the power spectrum and phase-amplitude coupling may be complementary sources of information about brain dynamics.
- a combination of both measures may reveal greater structure than either analysis alone.
- the EEG power spectrum during gradual administration of anesthesia shows a broad-band peak that begins in gamma frequencies, and decreases in frequency and bandwidth into the low-beta and alpha bands with increasing doses of anesthesia resulting in loss of consciousness.
- the gamma and beta range effects are associated with a reduced probability of response to external stimuli. Power within this traveling peak is strongest in frontal EEG channels. This reverses after recovery of consciousness.
- the traveling peak frequency can be quantified, for example, as the median between 2 and 40 Hz, and calculate the bandwidth using the interquartile range between the same limits.
- phase-amplitude modulation effect and systems and methods for monitoring thereof is best observed using a local average of several electrodes, such as the surface Laplacian. Otherwise, phase-amplitude modulation effect can be poorly resolved or not observable.
- a beamforming procedure may be used to improve estimation of phase-amplitude modulation.
- x ( t ) [ x 1 ( t ), x 2 ( t ), ... , x N ( t ) ] T denote the EEG time-series corresponding to N EEG channels for time 0 ⁇ t ⁇ T.
- the amplitude of the alpha rhythm is modulated by the phase of the slow oscillation during anesthesia, based on an analysis of single-channel Laplacian-derived EEG.
- the problem reduces to reconstructing a single phase-amplitude modulation relationship based on the observation through the multi-channel array of EEG sensors.
- a viable solution is given by beamforming.
- the idea of beamforming is to form a scalar signal based on the array observations in order to minimize an appropriate cost function representing the underlying system model.
- the function A ( ⁇ ;t) is clearly periodic with the full period defined as [- ⁇ , ⁇ ]. Assume that A ( ⁇ ;t) is stationary during the observation period [0, T ] and hence drop the dependence on t .
- a suitable model for estimating A W ( ⁇ ) is given by its truncated Fourier expansion to the first L terms, with L ⁇ 3. This reduced-order model enforces a smooth phase-amplitude modulation relation, which is consistent with empirical observations.
- the overall optimization procedure can be expressed as: min W min ⁇ , ⁇ k , b k R ⁇ T ⁇ , ⁇ k b k ′ w s . t . w _ . ⁇ w k ⁇ w ⁇ , ⁇ k
- the inner minimization can be carried out by linear regression and the resulting solution can be expressed explicitly in terms of A W ( t ) and ⁇ W ( t ).
- the outer minimization can be performed using standard optimization routines. In particular, since the constraints on w k form a convex set, the interior point method for the outer minimization stage can be employed.
- phase-amplitude modulation of frontal EEG under anesthesia undergoes two different patterns of modulation, corresponding to depth of anesthesia.
- the first pattern occurring before and after the loss of consciousness, consists of maximum alpha amplitude occurring at the trough (surface-negative) of the slow oscillation, which can be referred to as the "trough-max" pattern.
- trough-max maximum alpha amplitude occurring at the trough (surface-negative) of the slow oscillation
- peak-max the relationship reverses and maximum alpha amplitude occurs at the peak (surfacepositive) of the slow oscillation.
- the beamforming method produced the largest modulation depth, followed by the Laplacian method, with bipolar referencing showing the lowest modulation depth in both regimes.
- the beamforming method provides a means to obtain electrode weights that minimize the least-squares error in a parametric sinusoidal model of the phase-amplitude relationship. This optimal weighting of EEG electrodes allows for improved detection of phase-amplitude modulation across time and patients. This method could be useful in studies of phase-amplitude modulation in the EEG under anesthesia, as well as other conditions where this phenomenon might arise.
- process block 200 The above-described selection of an appropriate analysis context based on a selected drug or drugs (process block 204), the acquisition of data (process block 204), and the analysis of the acquired data (process blocks 206-214) set the stage for the new and substantially improved real-time analysis and reporting on the state of a patient's brain as an anesthetic or combination of anesthetics is being administered and the recovery from the administered anesthetic or combination of anesthetics occurs.
- the present invention provides a mechanism for considering each of these separate pieces of data and more to accurately indicate and/or report on a state of the patient under anesthesia and/or the indicators or signatures that indicate the state of the patient under anesthesia.
- any and all of the above-described analysis and/or results can be reported and, in addition, can be coupled with a precise statistical characterizations of behavioral dynamics. That is, behavioral dynamics, such as the points of loss-of-consciousness and recovery-of-consciousness can be precisely, and statistically calculated and indicated in accordance with the present invention. To do so, the present invention may use dynamic Bayesian methods that allow accurate alignment of the spectral and global coherence analyses relative to behavioral markers.
- a state-space model with two state variables representing a probability of response and a conditional probability of correct response can be used to correlate outcomes with a predicted future state. Probability densities of model parameters and the response probability are computed within a Bayesian framework to provide precise statistical characterizations of behavioral dynamics.
- the experiment consists of K stimulus trials. On any trial these are three possible outcomes for the response to the verbal stimulus; the subject may respond correctly, respond incorrectly or not respond.
- the observed data at trail k is the pair ( m k, n k ) which can assume the values ⁇ (1,1) , (1,0) , (0,0) ⁇ .
- the observation model at trail k is therefore: Pr m k , n k
- p k , q k p k q k 1 ⁇ n k m k 1 ⁇ p k 1 ⁇ m k
- ⁇ k and ⁇ k are zero-mean Gaussian random variables with variances ⁇ ⁇ 2 ⁇ k and ⁇ n 2 ⁇ k
- ⁇ k is the time elapsed between verbal stimulus trials k - 1 and k .
- the observation models (Eqs. 17-19, 22) define f ( M
- f ( ⁇ ) we chose the independent prior distributions for ( x v ,0 , z v , 0 ,x c, 0 , and z c 0 to be uniform distributions each on the interval [0,100].
- the set of free parameters includes all the x 0 and all the ⁇ 2 . These are computed using the Bayesian approach, which assumes that prior information about the parameters improves the parameter estimates. For all the x 0 , uniform prior distribution, uniform (a, b), can be chosen. For all the ⁇ 2 , the conjugate inverse gamma prior distribution, inverse gamma ( ⁇ , ⁇ ) can be chosen. Assuming values of 0 and 100 for a and b respectively to reflect the fact that the patient's behavior markers correlates perfectly at the beginning of tracking, ⁇ and ⁇ can be chosen to be 5 and 1, making the inverse gamma prior distribution non-informative.
- a Bayesian analysis implementation such as described in A. C. Smith, S. Wirth, W. A. Suzuki, and E. N. Brown, "Bayesian analysis of interleaved learning and response bias in behavioral experiments," Journal of Neurophysiology, vol. 97, pp. 2516-2524, 2007 , can be utilized.
- the result is a report that can be coupled with a precise statistical characterization of behavioral dynamics. That is, behavioral dynamics, such as the points of loss-of-consciousness and recovery-of-consciousness (or other selected states) can be precisely, and statistically calculated and indicated in accordance with the present invention. Specifically, this report can aid clinicians by allowing information that was previously unknown or incapable of being discerned from traditional monitoring systems to be identified and communicated and/or used by the clinician and/or monitoring system to identify particular states of a given patient.
- the report may serve as part of a "human in-the-loop" operational strategy, whereby the above-described systems automatically detects spectral features of interest and the report serves as a mechanism by which to highlight or communicate the spectral features and the information extrapolated therefrom to inform clinicians of a given or predicted future state and the reasoning therebehind.
- the report may include topographic maps of the patient's scalp or source localization maps on a brain image rendering to provide information relating to the location within the brain from which the EEG activity is being received.
- Fig. 9 provides two sets of time domain EEG waveforms and associated spectrograms acquired during clinical use of Propofol.
- a first set 900 illustrates two time domain EEG waveforms, a first EEG waveform demonstrating delta oscillation 902 and the second EEG waveform demonstrating delta-alpha oscillation 904.
- an associated spectrogram 906 displays the same delta oscillation and delta-alpha oscillation, but in form that is able to be more readily interpreted, particularly in real time.
- a second set 908 illustrates two time domain EEG waveforms, a first EEG waveform demonstrating delta-alpha oscillation 910 and the second EEG waveform demonstrating burst suppression 912. While simultaneously reading and interpreting the separate EEG waveforms 910, 912 is difficult, an associated spectrogram 914displays the same delta-alpha oscillation and burst suppression, but in form that is able to be more readily interpreted in real time.
- a substantial amount of new and important signatures that were previously difficult to consider or understand and/or were previously unknown or not understood as reliable without considering drug and/or patient-specific signature information can be reliably determined and used to track a current state of a patient.
- sevoflurane shows increased slow, delta, theta, and alpha power.
- the increase in theta power is pronounced and visible in the power spectrum.
- Slow oscillation phase-amplitude coupling shows that high frequency activity is greatest on the rising phase (- ⁇ /2) of the slow oscillation.
- power in beta and gamma bands increase.
- the two drugs act on the EEG in an antagonistic fashion. If enough ketamine is administered, it reduces or abolishes both slow and alpha power, and increases gamma power. Dexmedetomidine shows increased slow, delta, and sigma (12-16 Hz) power at lower doses consistent with sedation. At higher doses the EEG is dominated by slow oscillations.
- the above-referenced report can indicate, predict, and/or track onset of loss of consciousness and recovery of consciousness based on increased gamma (25 to 40Hz) and beta (12 to 25Hz) activity; transition to unconsciousness and in the unconscious state, and recovery of consciousness based on increased/decreased slow (0 to 1Hz), delta (1 to 4Hz), theta (4 to 8Hz), and alpha (8 to 12Hz) activity; anesthetic drug administration and loss of consciousness/recovery of consciousness based on reduced theta (4 to 8Hz) power; loss of consciousness and recovery of consciousness associated with changes in the ratio of alpha and delta (1 to 4 Hz) power in the occipital region of the scalp; states of profound unconsciousness by identifying strong global coherence in the alpha band; states of profound anesthesia based on strong association between global coherence and the state of anteriorization; profound unconsciousness based on strong modulation of the theta (4 to 8Hz), alpha (8 to 12Hz), beta (12 to 25Hz), and
- spectral templates for each of a plurality of exemplary drugs can be provided and used in accordance with the present invention.
- EEG data was acquired from operating room surgical cases during the administration of anesthesia. The data was separated into three age demographics: young (>35), middle-aged (36---59), and elderly ( ⁇ 60); and by drug: propofol, sevoflurane, isoflurane, dexmedetomidine, and ketamine. Spectrograms from each of the cases were analyzed to identify temporal intervals containing recurring spectral motifs correlated with putative unconscious and deep levels of anesthesia. These intervals were used to compute median spectra for each of the drug/demographic pairings.
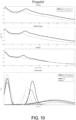
- propofol has studied.
- the spectral motifs for propofol included three salient spectral peaks: a low frequency ( ⁇ 1Hz) oscillation, a traveling peak (spanning gamma through alpha), and a broadband gamma.
- Fig. 11 provides information similar to that of Fig. 10 , in this case, with respect to sevoflurane.
- the spectral motifs for sevoflurane included two salient spectral peaks: a broad low frequency oscillation (spanning ⁇ 1Hz, delta, and theta bands), and a traveling peak.
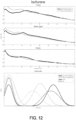
- Fig. 12 provides information similar to that of Figs. 10 and 11 , in this case, with respect to isoflurane.
- the spectral motifs for isoflurane included two salient spectral peaks: a broad low frequency oscillation (spanning ⁇ 1Hz, delta and theta bands), and a traveling peak.
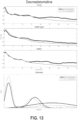
- Fig. 13 provides information similar to that of Figs. 10-12 , in this case, with respect to dexmedetomidine.
- the data for young and elderly patients were limited and showed spectral heterogeneity.
- the spectral motifs for dexmedetomidine included three salient spectral peaks: low frequency oscillation, a non---stationary "spindle" peak spanning alpha and sigma bands, and broadband gamma.
- Fig. 14 provides information similar to that of Figs. 10-13 , in this case, with respect to ketamine. Data was acquired from one middle aged patient. The effects, however, seem marked between putative unconscious and deep states of anesthesia. With respect to identified peaks, the spectral motifs for ketamine included three salient spectral peaks: the low frequency oscillation, and a non-stationary low gamma peak, and broadband high gamma (up to 150Hz).Overall dynamics during the transition from putative unconscious to deep states of anesthesia:
- the present system has ready use and clinical need in fields of medicine other than anesthesiology.
- other medical specialties either use or have interest in the use of drugs such as those described above and other similar drugs.
- the above-described systems are useful for managing drugs in a wide variety of situations.
- the present system can be used during pharmacological therapies to induce and maintain sedation.
- the present system can be particularly useful in the intensive care unit where intense therapies are administered and clinicians can benefit from additional monitoring and feedback.
- the present system can be of use in outpatient settings, including outpatient treatments involving pharmacologically-induced sleep, involving sedation, for example, using dexmedetomidine.
- the present system can be used in psychiatry settings to aid in the treatment of depression with ketamine, for example. These are but a few of the wide-variety of clinical and non-clinical settings where the present system can be readily applied.
Description
- The present invention relates to systems for tracking brain states of a patient under anesthesia and, more particularly, to systems for correlating anticipated effects of a given anesthetic compound administered to a patient with characteristics of the patient's brain state during the administration of the given anesthetic compound to more accurately track the effects of the given anesthetic compound and the actual brain state of the patient.
- Since 1846 and the first public uses of ether as a means to control pain during surgical procedures, anesthesia, analgesics, and other administered compounds to control pain have been a mainstay of medicine. However, while the use of the anesthetic and the number of compounds with anesthetic properties in clinical use have grown astronomically since the initial uses of ether, the scientific understanding of the operation of the body when under anesthesia is still developing. For example, a complete understanding of the effects of anesthesia on patients and operation of the patient's brain over the continuum of "levels" of anesthesia is still lacking. As such, anesthesiologists are trained to recognize the effects of anesthesia and extrapolate an estimate of the "level" of anesthetic influence on a given patient based on the identified effects of the administered anesthesia.
- Unfortunately, there are a great number of variables that can influence the effects, effectiveness, and, associated therewith, the "level" of anesthetic influence on a given patient. Obvious variables include physical attributes of the patient, such as age, state of general health, height, or weight, but also less obvious variables that are extrapolated, for example, based on prior experiences of the patient when under anesthesia. When these variables are compounded with the variables of a given anesthesiologists' practices and the variables presented by a particular anesthetic compound or, more so, combination of anesthetic compounds, the proper and effective administration of anesthesia to a given patient can appear to be an art and a science.
- Therefore, it would be desirable to have a system for reducing the unpredictability of administering anesthetic compounds to patients. More particularly, it would be desirable to have systems that aid an anesthesiologists or other clinician in recognizing, reducing, and/or controlling the number of variable presented to the clinician when administering anesthetic compounds to patients.
- "Invariant Reversible QEEG Effects of Anesthetics" by E.R. John at al. discloses the continuous recording of brain electrical activity from a group of 176 patients throughout surgical procedures using general anesthesia. Artefact-free data from the 19 electrodes of the International 10/20 System were subjected to quantitative analysis of the electroencephalogram.
- "Delta waves differently modulate high frequency components of EEG oscillations in various unconsciousness levels" by Molaee-Ardekani et al. investigate the modulation properties of high frequency EEG activities by delta waves during various depth of anesthesia.
-
US 2011/0015538 A1 relates to a system and method for analyzing EEG data. The system comprises data from at least one or all of the 19 (or more) standard scalp locations, acomputing device 100 operable to calculate deviance for the data, and a single score for each of a plurality of scalp sites based on the deviance. - The present invention overcomes the aforementioned drawbacks by providing a system for determining the state of a patient's brain under anesthesia using readily-available monitoring information, such as from a patient's electroencephalography (EEG). The present invention recognizes that anesthetic compounds induce different signatures in physiological characteristics of the patient under anesthesia and aids interpretation of such information. Using the physiological characteristics and signatures associated with the selected anesthetic compound, the present invention aids the correlation of the physiological characteristics and signatures to a state of the patient's brain.
- In accordance with the present invention, a system for monitoring a patient experiencing an administration of at least one drug having anesthetic properties according to
independent claim 1 is disclosed. - The foregoing and other advantages of the invention will appear from the following description. In the description, reference is made to the accompanying drawings which form a part hereof, and in which there is shown by way of illustration a preferred embodiment of the invention. Such embodiment does not necessarily represent the full scope of the invention, however, and reference is made therefore to the claims and herein for interpreting the scope of the invention.
-
-
Fig. 1 is a schematic illustration of a system for determining the state of a patients brain under anesthesia in accordance with the present invention. -
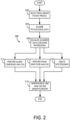
Fig. 2 is a flow chart setting forth the steps of a method for determining the state of a patient's brain under anesthesia. -
Fig. 3A is a series of spectrograms acquired under different drug or patient characteristics. -
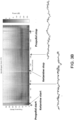
Fig. 3B is a spectrogram and associated EEG waveforms showing the overlapping influence of different drugs administered to a patient. -
Fig. 4 is a series of EEG waveforms collected to illustrate variations therein that can be observed as corresponding with respective patient states. -
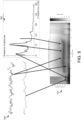
Fig. 5 is a collection of data readouts including EEG waveforms, a frequency analysis, and a spectrogram illustrating key markers within the data and reflected in each data readout. -
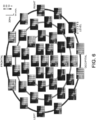
Fig. 6 is a collection of spectrograms of the radial current density estimated at each of a plurality of electrode sites. -
Fig. 7 is a collection of EEG waveforms and spectrograms illustrating key markers within the data and reflected in each data format. -
Fig. 8 is a set of graphs, phase-amplitude histograms, and EEG waveforms illustrating phase-amplitude analysis as a mechanism for determining and predicting future patient states. -
Fig. 9 is a collection of EEG waveforms and spectrograms illustrating key markers within the data and reflected in each data format. -
Figs. 10-15 are graphs, each figure corresponding to a different drug, that illustrate the ability to create "spectral templates" for each of a plurality of exemplary drugs, which can be used in accordance with the present invention. - The present invention recognizes that anesthetic compounds induce different signatures in physiological characteristics of the patient under anesthesia and aids interpretation of physiological characteristics and signatures therein based on a selected anesthesia compound. Using the physiological characteristics and signatures associated with the selected anesthesia compound, the present invention aids the correlation of the physiological characteristics and signatures to a state of the patient's brain.
- For example, turning to
Fig. 1 , asystem 10 configured for use in accordance with the present invention includes apatient monitoring device 12, such as a physiological monitoring device, illustrated inFig. 1 as an electroencephalography (EEG) electrode array. However, it is contemplated that the patient monitoring device may also include mechanisms for monitoring galvanic skin response (GSR), for example, to measure arousal to external stimuli. One specific realization of this design utilizes a frontal Laplacian EEG electrode layout with additional electrodes to measure GSR. Another realization of this design incorporates a frontal array of electrodes that could be combined in post-processing to obtain any combination of electrodes found to optimally detect the EEG signatures described earlier, also with separate GSR electrodes. Another realization of this design utilizes a high-density layout sampling the entire scalp surface using between 64 to 256 sensors for the purpose of source localization, also with separate GSR electrodes. - The
patient monitoring device 12 is connected via acable 14 to communicate with amonitoring system 16. Also,cable 14 and similar connections can be replaced by wireless connections between components. As illustrated, themonitoring system 16 may be further connected to adedicated analysis system 18. Also, themonitoring system 16 andanalysis system 18 may be integrated. - For example, as noted above, it is contemplated that the
patient monitoring device 12 may be an EEG electrode array, for example, a 64-lead EEG electrode array. However, as will be apparent below, greater spatial accuracy can be achieved by increasing the number of electrodes from 64 to 128, 256, or even higher. Similarly, the present invention can be implemented with substantially less electrodes. In any case, themonitoring system 16 may be configured to receive raw signals acquired by the EEG electrode array and assemble, and even display, the raw signals as EEG waveforms. Accordingly, theanalysis system 18 may receive the EEG waveforms from themonitoring system 16 and, as will be described, analyze the EEG waveforms and signatures therein based on a selected anesthesia compound, determine a state of the patient based on the analyzed EEG waveforms and signatures, and generate a report, for example, as a printed report or, preferably, a real-time display of signature information and determined state. However, it is also contemplated that the functions ofmonitoring system 16 andanalysis system 18 may be combined into a common system. - Referring to
Fig. 2 , a method for analysis and reporting begins atprocess block 200 with the selection of a desired drug, such as anesthesia compound or compounds, and/or a particular patient profile, such as a patient's age height, weight, gender, or the like. Such selection may be communicated through auser interface 20 ofFig. 1 . Furthermore, drug administration information, such as timing, dose, rate, and the like, in conjunction with the above-described EEG data may be acquired and used to estimate and predict future patient states in accordance with the present invention. As will be described, the present invention recognizes that the physiological responses to anesthesia vary based on the specific compound or compounds administered, as well as the patient profile. For example, elderly patients have a tendency to show lower amplitude alpha power under anesthesia, with some showing no visible alpha power in the unconscious state. The present invention accounts for this variation between an elderly patient and a younger patient. Furthermore, the present invention recognizes that analyzing physiological data for signatures particular to a specific anesthetic compound or compounds administered and/or the profile of the patient substantially increases the ability to identify particular indicators of the patient's brain being in a particular state and the accuracy of state indicators and predictions based on those indicators. - For example, the following drugs are examples of drugs or anesthetic compounds that may be used with the present invention: Propofol, Etomidate, Barbiturates, Thiopental, Pentobarbital, Phenobarbital, Methohexital, Benzodiazepines, Midazolam, Diazepam, Lorazepam, Dexmedetomidine, Ketamine, Sevoflurane, Isoflurane, Desflurane, Remifenanil, Fentanyl, Sufentanil, Alfentanil, and the like. However, the present invention recognizes that each of these drugs, induces very different characteristics or signatures, for example, within EEG data or waveforms. For example,
Fig. 15 provides EEG data for one prominent drug, propofol, and associated states. - More particularly, referring to
Fig. 3A , a plurality of spectrograms corresponding, as labeled, to patients having been administered Propofol, Dexmedetomidine, Sevoflurane, and Ketamine are illustrated. In addition,Fig. 3A shows a spectrogram of an elderly patient. When placed in proximity to one another, it is clear that the spectrograms vary substantially, so as to be visually distinct, based on the administered drug and/or patient profile. This is particularly true, for example, when multiple drugs are combined, such as illustrated inFig. 3B . As will be explained, the present invention recognizes the substantial variation in physiological data acquired from a patient and the signatures contained therein. Based on a selected drug or drugs and/or the patient profile and, by taking this recognition into account, the present invention provides systems for tracking brain states during the administration of anesthesia that is greatly improved over traditional systems. A summary of exemplary "spectral templates" for each of a plurality of exemplary drugs is provided in the "examples" section. These "spectral templates" can be used to automatically identify a current or project a future state of the patient. - With the proper drug or drugs and/or patient profile selected, acquisition of physiological data begins at
process block 204, for example, using a system such as described with respect toFig. 1 , where the acquired data is EEG data. Referring toFig. 4 , a series of EEG waveforms in the time domain are illustrated. As is clear in a side-by-side comparison such as illustrated inFig. 4 , these EEG waveforms vary appreciably. For example, general categories of "awake" 400, "asleep" 402, and under "general anesthesia" 404 can be readily created. In the side-by-side comparison with the associatedcategory titles category - To do so, rather than evaluate physiological data in the abstract, at
process block 206, the physiological data is processed. Processing can be done in the electrode or sensor space or extrapolated to the locations in the brain. As will be described, the present invention enables the tracking of the spatiotemporal dynamics of the brain by combining spectrogram and global coherence analyses. As will be apparent, reference to "spectrogram" in may refer to a visual representation of frequency domain information, such as represented in, for example,Fig. 3A . However, a "spectrogram" within the context of the present invention need not be visually represented or displayed. Rather, within the context, for example, of processing and report generation, the spectrogram may be an intermediate processing step from which reports or visual representations are ultimately created. For example, referring toFig. 5 , EEG waveforms in thetime domain 500 have aspectrum 502 and can be translated into aspectrogram 504. However, rather than simply analyzing the spectrum information of thespectrogram 504 or a givenspectrum 502 in the abstract, Laplacian referencing can be performed at process block 208 to estimate radial current densities perpendicular to the scalp at each electrode site of, for example, themonitoring device 12 ofFig. 1 . Accordingly, though "spectrogram" processing is performed, a visual representation of the spectrogram need not be displayed. - Surface Laplacian calculations can be determined by taking a difference between voltages recorded at an electrode site and an average of the voltage recorded at the electrode sites in a local neighborhood. Denoting the voltage recorded at the ith electrode relative to a reference electrode located close to the top of the head as Vi(t), the surface Laplacian of Vi(t) can be estimated as:

where Vi m(t) denotes the voltage recording at the mth closest electrode to electrode i. Thus, the EEG recorded at a particular location was locally referenced to an average of the EEG recorded at the neighbors. The choice of M depended on the nearest electrodes to ith electrode and on their locations' symmetry with respect to ith electrode. For the electrode on the top of the head, which had six symmetrically distributed nearest electrodes, M = 6. For the remaining electrodes it is possible to find four or five neighbors that are arranged in an approximately symmetric configuration. In this case, M can be chosen to be equal to 4 or 5, respectively. For the electrodes at the edge, for which such a symmetric configuration cannot be approximated, surface Laplacian can be uncalculated and radial current density estimates not made. Accordingly, more accurate estimates of radial current density can be computed by increasing the number of electrodes and by accounting for the curvature of the head in the neighborhood of each electrode site. - From these current density estimates, at
process block 210, spectrograms at each electrode site are computed. Referring toFig. 6 , spectrograms of the radial current density estimated at each of a plurality of electrode sites are illustrated. As explained above, the spectrograms reflect, as illustrated inFig. 7 , key signatures commonly identified or tracked in the time domain EEG waveforms. Specifically, two time domain EEG waveforms and associated spectrograms are illustrated, oneset 700 corresponding to light Dexmedetomine sedation and oneset 702 corresponding to deep Dexmedetomine sedation. In theset 700 corresponding to light Dexmedetomine sedation,spindles 704 are visible and in theset 702 corresponding to deep Dexmedetomine sedation, strongslow wave oscillations 706 are visible. - It is noted that the local referencing is preferable so that distinct temporal patterns in the spectrogram at different electrode sites can be identified. This is in contrast to an average or single electrode referencing scheme, which would lead to an erroneous conclusion that approximately the same temporal pattern was present in the spectrogram at each electrode site.
- The spectrum of the surface Laplacian at the location of the ith electrode site is estimated by averaging over K non-overlapping segments:

where
- To characterize the coordinated activity in the time-series of acquired data, an eigenvalue decomposition can be computed of a cross-spectral matrix at each spectral frequency as a function of time. Specifically, at
process block 212, spectral and eigenvalue-based global coherence analyses can be used to track the spatiatemporal dynamics of the brain's anesthetic state. Generally, for the example of propofol, the global coherence analysis detects strong coordinated α activity in the occipital sites when the patient is awake that shifts to the frontal sites when the patient becomes unconscious. - In particular, method-of-moments estimates of the ith element of the cross-spectral matrix at a frequency f can be computed as:

where

- An orthogonal basis can be obtained by performing a Karhunen-Loeve transform at each frequency, f:

where U(f) H is the adjoint of the matrix U(f) (that is, the complex conjugate transpose of U(f), U(f) H =(U(f)∗) T ) and a unitary matrix (that is, U(f) U(f) H =1). U(f) H is chosen so that under the Karhunen-Loeve transform the cross-spectral matrix in the new basis:

- is diagonal (that is,


- Sorting the eigenvalues,


- This ratio is called the global coherence. When the leading eigenvalue is large compared with the remaining ones, CGlobal(f) is close to 1. In this case, examining the contributions of different sites to the corresponding eigenvector by using the elements of the weight matrix provides a summary of coordinated activity at this frequency. These elements are row weights. The row weights can be obtained by the absolute value square of the elements of the row of U(f)H, which leads to the eigenvector with the highest eigenvalue.
- Estimates of the cross-spectral matrix as described above can be sensitive to noise. To make cross-spectral estimation more robust, the median can be used in place of the mean in
equation 5. The median is a robust estimator of centrality, and is much less sensitive to outliers than the mean. - Thus, process blocks 208-212 yield two pieces of valuable information, namely, the spectrogram and global coherence information, which show different spatiotemporal activity at different states of the patient receiving anesthesia. For example, for propofol, when patients are awake, the spectrograms will show strong occipital α activity. After loss of consciousness, the spectrograms will show a loss of α activity and an increase in δ activity in the occipital sites and strong α and δ activity in the frontal sites. Increased power in the α, β, and δ ranges in the frontal sites will occur after loss of consciousness, consistent with the well-known pattern of anteriorization. As patients lose responsiveness, the coordinated activity over the occipital sites in the α range diminish. When patients are unconscious, strong coordinated activity in the α range is observed broadly over the frontal electrode sites at which the spectrograms show the anteriorization pattern. Despite the overall high δ activity in the spectrograms, coordinated activity may only be observed in the α range. The relative power in the occipital α and δ ranges reliably track the patients' behavioral responses. For propofol, the occipital α power is greater than the δ power when the patient is awake, and the reverse is true when the patients are unconscious. The strong global coherence in the α range indicates highly coordinated activity in the frontal electrode sites. Thus, global coherence and weight matrices along with spectrograms provide a first level of data for determining a current state and predicting a future state of a patient's brain under anesthesia. Further details regarding initial testing and validation of such processes are provided in Cimenser A, Purdon PL, Pierce ET, Walsh JL, Salazar-Gomez AF, Harrell PG, Tavares-Stoeckel C, Habeeb K, Brown EN (2011) Tracking brain states under general anesthesia by using global coherence analysis. Proceedings of the National Academy of Sciences of the United States of America 108:8832-8837.
- At
process block 214, phase-amplitude analysis is performed that considers the amplitude of a given signal with respect to the phase of other signals and vice versa. As explained above, spectral analysis of EEG recordings allows the present invention to track systematic changes in the power in specific frequency bands associated with administration of anesthesia, including changes in δ (1-4 Hz), θ (5-8 Hz), α (8-14 Hz), β (12-30 Hz), and γ (30-80 Hz). However, spectral analysis treats oscillations within each frequency band independently, ignoring correlations in either phase or amplitude between rhythms at different frequencies. - Power spectral measures are invariant with respect to changes in the complex phase of a signal's Fourier transform. It is thus natural to extend power spectral analysis by using measures that are sensitive to signal phase. Bispectral analysis can detect the presence of correlation in the phases of oscillation at different frequencies. Bispectrum-based statistics have been used in quantitative clinical depth-of-anesthesia monitors, in a manner that compares the bispectrum across broad low- and high-frequency ranges.
- However, in accordance with the present invention, instead of a traditional "cross-frequency correlation", phase-amplitude analysis, is used. In phase-amplitude analysis, the amplitude or envelope of activity in one frequency band is consistently largest at a particular phase of a lower frequency rhythm. For example, given two non-overlapping frequency bands, then in phase-amplitude coupling, the amplitude of the activity in the higher frequency band is consistently highest at a particular phase of the lower frequency rhythm. In accordance with the present invention, an analysis can be performed to measure phase-amplitude coupling in a time-resolved fashion to identify at least two distinct modes of phase-amplitude coupling corresponding to shallow and deep planes of anesthesia, respectively.
- Specifically, to characterize coupling between the phase of the slow oscillation (SO; 0.1 - 1 Hz) and the amplitude of α (8 - 14 Hz) oscillations, a time-varying phase-amplitude modulogram M(t, Φ) can be created that describes the relative α (or other) amplitude at a particular phase at each SO cycle.
- Given an EEG signal, x(t), sampled at rate FS = 250 Hz, ultra-low-frequency drift is removed by subtracting a least-square errors spline fit to the signal with one knot for every 2 minutes (or other selected duration) of data. Next, a band-pass filter may be applied to extract the rhythmic component within each frequency band of interest, xb(t), b ∈ {α,SO}. Symmetric finite impulse response filters designed using a least-squares approach (SO: passband 0.1-1 Hz, transition bands 0.085-0.1 and 1- 1.15 Hz, ≥ 17 dB attenuation in stop bands, order 2207 at 250 Hz; α: passband 8-13.9 Hz, transition bands 5.9-8 and 13.9-16 Hz, ≥ 60 dB attenuation in stop bands, order 513) can be employed. A discrete Hilbert transform can be used to compute the complex analytic signal, zb(t), satisfying Re[zb(t)] = Xb(t). The analytic signal provides the instantaneous α amplitude A(t)=|zα(t)| and SO phase, Ψ(t)=arg[zso(t)].
- The modulogram is computed by assigning each temporal sample to one of, for example, 18 equally spaced phase bins based on the instantaneous value of ψ(t), then averaging the corresponding values of A(t) within, for example, a 2-minute epoch:

where δ(t) = 120s and δΦ = 2π/18. Note that
- For example,
Fig. 8 illustrates two distinct patterns of phase-amplitude modulation. Namely, a first phase-amplitude modulation is similar to slow wave sleep (peak-max -- i.e., high-frequency activity is highest at the peak of the low-frequency oscillation, corresponding to a low-frequency phase of 0), and a second phase-amplitude modulation foreshadows the return of consciousness (trough-max-- i.e., high-frequency activity is highest at the trough of the low-frequency oscillation, corresponding to a low-frequency phase of +/-π). Slow oscillation phase modulates alpha/beta (8-14 Hz) amplitude, in relation to probability of response, can be studied and is reflected inFig. 8 . Specifically, a group behavioral curves 802 show the probability of response to click and verbal stimuli during induction in thefirst graph 804 and emergence in thesecond graph 806. A set of phase-amplitude histograms 808 show the relationship between the slow oscillation phase (y-axis, shown with reference sinusoid) and mean-normalized alpha/beta amplitude as a function of time (x-axis) relative toLOC 810 andROC 812. A trough-max phase-amplitude relationship can be observed at the LOC/ROC transition points, where the amplitude of alpha is maximal at the slow oscillation troughs. A peak-max phase-amplitude relationship can be observed during the unconscious state, where the amplitude of alpha is maximal at slow oscillation peaks. These trough-max and peak-max modulation patterns can be observed in raw EEG traces 814, which shows the trough-max and 816, which shows the peak-max, respectively. The trough-max pattern re-appears during emergence prior to ROC, illustrating that it can be used to predict when patients are able to regain consciousness during anesthesia. - For example, because the transition to the trough-max pattern occurs reliably before return of consciousness, the trough-max relationship to predict when patients are likely to recover consciousness while emerging from anesthesia. In cases where trough-max modulation is absent, due to pathology that impairs alpha waves, or drug choice (e.g., sevoflurane), or where electrode placement makes detection of trough-max modulation difficult, the absence or loss of peak-max modulation could also be used to predict recovery of consciousness during emergence. More particularly, during emergence from propofol anesthesia, the peak-max modulation relationship between the phase of the slow oscillation and higher frequencies changes to the trough-max modulation relationship, and does so prior to the return of consciousness, with little change to the underlying power spectrum. The trough-max modulation has a frontal distribution, whereas the peak-max modulation is distributed approximately uniformly across the scalp.
- Thus, such phase-amplitude information can provide a reliable indicator of a current or probable future patients state. For example, since the peak-max modulation pattern represents a state of unconsciousness that is more profound than that observed during trough-max modulation, but less profound than burst-suppression, the peak-max modulation pattern could be used as a target for maintenance of a surgical level of anesthesia. Because the trough-max modulation represents a state of unconsciousness that is less profound than the peak-max modulation, one where patients can respond to external stimuli, the trough-max modulation pattern could be used as a target for maintenance of sedation. Furthermore, as described above, elderly patients often exhibit diminished alpha waves or a lack of alpha waves. Hence, in elderly patients who show diminished alpha waves, or who lack alpha waves, monitoring can also be performed by calculating slow oscillation phase-amplitude modulation across a broad-band frequency range including theta, alpha, beta, and gamma bands.
- To quantify the strength of modulation, a modulation index, MI(t) can be defined, as the Kullback-Leibler divergence, in bits, between M (t, φ) and a uniform phase distribution over the interval (-π, π):

- It is noted that the power spectrum and phase-amplitude coupling may be complementary sources of information about brain dynamics. Thus, a combination of both measures may reveal greater structure than either analysis alone.
- For example, the EEG power spectrum during gradual administration of anesthesia shows a broad-band peak that begins in gamma frequencies, and decreases in frequency and bandwidth into the low-beta and alpha bands with increasing doses of anesthesia resulting in loss of consciousness. The gamma and beta range effects are associated with a reduced probability of response to external stimuli. Power within this traveling peak is strongest in frontal EEG channels. This reverses after recovery of consciousness. The traveling peak frequency can be quantified, for example, as the median between 2 and 40 Hz, and calculate the bandwidth using the interquartile range between the same limits.
- It is further noted that the above-described phase-amplitude modulation effect and systems and methods for monitoring thereof is best observed using a local average of several electrodes, such as the surface Laplacian. Otherwise, phase-amplitude modulation effect can be poorly resolved or not observable.
- In accordance with one configuration of the present invention, a beamforming procedure may be used to improve estimation of phase-amplitude modulation. Let x(t):= [x 1(t), x2 (t),..., x N (t) ]T denote the EEG time-series corresponding to N EEG channels for
time 0 ≤ t ≤ T. Let α(t) := [ α1 (t), α2(t),···, α N(t)]T and s(t) := [ s 1(t), s2 (t),···sN (t)]T denote the alpha rhythm and slow oscillation time-series which are obtained by band-pass filtering x(t) in the frequency bands of 8-14Hz and 0.1-1Hz, respectively. Let


- Assuming that the phase-amplitude modulation arises from a unified and possibly spatially localized mechanism in the brain, the problem reduces to reconstructing a single phase-amplitude modulation relationship based on the observation through the multi-channel array of EEG sensors.
- A viable solution is given by beamforming. The idea of beamforming is to form a scalar signal based on the array observations in order to minimize an appropriate cost function representing the underlying system model. Let w := [w 1, w 2,···,w N]T denote a weight vector (beamforming vector) and consider the corresponding projection of the alpha rhythm and slow oscillation time series given by αW (t) := w T αH (t) , and s W(t) := w T sH (t), respectively. The amplitude of α W(t) and the phase (argument) of s W(t) are given by:


respectively. Suppose that for a given value of the phase of s W(t), denoted by θ, the amplitude of the alpha rhythm AW(t) has a distribution given by the density p w(A; θ). Then, the phase-amplitude modulation relation is defined as:

where the ensemble averaging E pw is with respect to the density p w(A; θ). The function A(θ;t) is clearly periodic with the full period defined as [-π, π]. Assume that A(θ;t) is stationary during the observation period [0, T] and hence drop the dependence on t. Assuming that the function AW(θ) has sufficient smoothness properties, it can be represented in the Fourier basis as follows:

where µ, a k, and b k denote the expansion coefficients. A suitable model for estimating AW(θ) is given by its truncated Fourier expansion to the first L terms, with L ≤ 3. This reduced-order model enforces a smooth phase-amplitude modulation relation, which is consistent with empirical observations. A suitable cost function for estimating AW(θ) is given by the following quadratic form:

- Since the densities p W(A; θ) are unknown, it is not possible to compute AW (θ;t) := Ep
W {AW (t) |θ}. Hence, an empirical quadratic cost function can be used for estimating AW(θ) by substituting the ensemble averaging operator Epw by the corresponding temporal averaging as follows:

where t W(θ) denotes the inverse function of θ W(t), p(θ) is the prior distribution of the slow oscillation phase and E t denotes temporal averaging. - Note, replacing ensemble averaging by temporal averaging implicitly assumes the ergodicity of the underlying processes during the observation period [0, T]. Since the prior p(θ) is unknown, the cost function can be further approximated by substituting the ensemble averaging over θ by the corresponding temporal averaging as follows:

- For a given beamformer w, it is possible to minimize the cost function over the parameters µ, a k, and b k. Then, the best such beamformer can be chosen by minimizing the resulting cost function over w. This, in fact, corresponds to a cost minimization formulation for estimating the reduced-order phase-amplitude modulation relation that is most consistent with the data (in the sense of the above quadratic cost function). Assuming that the beamformer elements are bounded as w ≤ w k ≤
w , for some constants w andw , the overall optimization procedure can be expressed as:

- The inner minimization can be carried out by linear regression and the resulting solution can be expressed explicitly in terms of A W(t) and θ W(t). The outer minimization can be performed using standard optimization routines. In particular, since the constraints on w k form a convex set, the interior point method for the outer minimization stage can be employed.
- Under the above-described process and with respect to, for example, propofol, it can be shown that the phase-amplitude modulation of frontal EEG under anesthesia undergoes two different patterns of modulation, corresponding to depth of anesthesia. The first pattern, occurring before and after the loss of consciousness, consists of maximum alpha amplitude occurring at the trough (surface-negative) of the slow oscillation, which can be referred to as the "trough-max" pattern. At deeper levels of anesthesia, the relationship reverses and maximum alpha amplitude occurs at the peak (surfacepositive) of the slow oscillation, which can be referred to as the "peak-max" pattern. In order to compute the electrode weights that would show both modes of the phase-amplitude modulation most clearly, equal-length segments of data from both modes were chosen and used to compute the optimal weights for each mode. These trough-max and peak-max data for the two patients were used to perform the averaging described in
equation 15. The data used in the optimization consisted of four-minute segments, chosen as periods during which the phase-amplitude modulation was relatively constant, based on phase-amplitude histograms computed using Laplacian-referenced data. Table I illustrates modulation depths for different methodologies.Patient 1Patient 2Trough-Max Peak-Max Trough-Max Peak-Max Bipolar 0.26 0.39 0.22 0.76 Laplacian 1.08 0.73 0.98 1.00 Optimized 1.23 0.91 1.33 1.67 - The beamforming method produced the largest modulation depth, followed by the Laplacian method, with bipolar referencing showing the lowest modulation depth in both regimes. Thus, The beamforming method provides a means to obtain electrode weights that minimize the least-squares error in a parametric sinusoidal model of the phase-amplitude relationship. This optimal weighting of EEG electrodes allows for improved detection of phase-amplitude modulation across time and patients. This method could be useful in studies of phase-amplitude modulation in the EEG under anesthesia, as well as other conditions where this phenomenon might arise.
- The above-described selection of an appropriate analysis context based on a selected drug or drugs (process block 200), the acquisition of data (process block 204), and the analysis of the acquired data (process blocks 206-214) set the stage for the new and substantially improved real-time analysis and reporting on the state of a patient's brain as an anesthetic or combination of anesthetics is being administered and the recovery from the administered anesthetic or combination of anesthetics occurs. That is, although, as explained above, particular indications or signatures related to the states of effectiveness of an administered anesthetic compound or anesthetic compounds can be determined from each of the above-described analyses (particularly, when adjusted for a particular selected drug or drugs), the present invention provides a mechanism for considering each of these separate pieces of data and more to accurately indicate and/or report on a state of the patient under anesthesia and/or the indicators or signatures that indicate the state of the patient under anesthesia.
- Specifically, referring to process block 216, any and all of the above-described analysis and/or results can be reported and, in addition, can be coupled with a precise statistical characterizations of behavioral dynamics. That is, behavioral dynamics, such as the points of loss-of-consciousness and recovery-of-consciousness can be precisely, and statistically calculated and indicated in accordance with the present invention. To do so, the present invention may use dynamic Bayesian methods that allow accurate alignment of the spectral and global coherence analyses relative to behavioral markers.
- To build the information needed to achieve this, a study was performed to correlate the behavior marks with EEG information. With respect to the points of loss of consciousness and recovery of consciousness and any other desired points, three possible behavioral outcomes may be defined: correct responses, incorrect responses, and no response. A state-space model with two state variables representing a probability of response and a conditional probability of correct response can be used to correlate outcomes with a predicted future state. Probability densities of model parameters and the response probability are computed within a Bayesian framework to provide precise statistical characterizations of behavioral dynamics.
- For example, assume the experiment consists of K stimulus trials. On any trial these are three possible outcomes for the response to the verbal stimulus; the subject may respond correctly, respond incorrectly or not respond. Let mk = 1 if the subject responds on trial k and 0 otherwise. If there is a response on trial k, let nk = 1 if it is correct and 0 otherwise. Let pk denote the probability of a response on trial k, i.e. that nk = 1, and let qk denote the probability of a response of a correct response, i.e. mk = 1. The observed data at trail k is the pair (mk,nk ) which can assume the values { (1,1) , (1,0) , (0,0) }. The observation model at trail k is therefore:

- Where we define pk and qk in terms of the cognitive state variables by the logistic relations:


- We define state model for the unobservable cognitive state variables as the random walk equations:


Where εk and ηk are zero-mean Gaussian random variables withvariances 

- Formulating the probability of response and the conditional probability of a correct response on each trial as a logistic function of the cognitive state variable ensures that these probabilities are properly defined between 0 and 1. The state model provides a continuity constraint so that the current cognitive state and hence, the probability of a response and the conditional probability of a correct response depend on the previous cognitive state and experience. We let

- We can use the same logic presented for the verbal stimuli to develop a state-space model for the clicks. The only exception is we rewrite the observation equation to follow for more than one click stimulus presentation per trial. In fact, for each verbal stimulus, there are four click stimuli. Hence the observation model for the clicks is:

- Where mk = 0,1, 2, 3, 4 is the number of responses and nk = 0,1,2,...,mk is the number of correct responses to the click stimuli, otherwise pk,qk,xk and zk are defined exactly as they were defined for the verbal state-space model. These are six possible outcomes in any click trial block. The unknown parameters are again

- Our objective is to develop a Bayesian procedure for state and model parameter estimation. We assume that there is a 2-dimensional state-space model for the verbal responses and a separate 2-dimensional state-space model for the verbal responses and a separate 2-dimensional state-space model for the click stimuli. We denote the unobserved state as X = (x v,1,...x v, K,z v,1,...,z v, k,x c,1.. .x c, K,z c,1 ,...,zc,K ), the model parameters as Θ =(θv ,θc ) and the observed data as M = (m v,1,...m v, K,n v,1,...,n v, k, m c,1.. .m c, K,n c,1 ,...,nc,K ), where the subscripts v and c have been added to denote the verbal and click components of the model respectively. If we assume that f(θ) is a prior distribution for (θ), then by Bayes' rule the posterior distribution for the parameters and the state is:

- The observation models (Eqs. 17-19, 22) define f(M|X,Θ) and the state-space models (Eqs. 20-21) define f(X|,Θ) and f(M) is the normalizing constant. To specify f(Θ)we chose the independent prior distributions for (x v,0, z v, 0,x c,0, and z c0 to be uniform distributions each on the interval [0,100]. For each of the variance parameters


- We need the WinBUGS software to compute by Bayesian Monte Carlo methods the posterior densities f(X,Θ|M) and the marginal posterior densities of the form:

where the inner integral is over the components of all values of Θ and the outer integral is over all components of X excluding xc,k. We computed the comparable marginal posterior densities for zc,k ,xv,k,zv,k and for each component of Θ. We report the median of each marginal posterior density as the estimate of a given state at a particular trial and a given parameter. We report that the uncertainty in any state or parameter estimate as the 95% or 90% credibility interval based on the Monte Carlo samples. The posterior densities were computed using 100,000 iterations after a 20,000 iteration burn-in period. A Bayesian analysis implementation such as described in A.C. Smith, S Wirth, W. A. Suzuki and E. N. Brown, Bayesian analysis of interleaved learning and response bias in behavioral experiments," Journal of Neurophysiology, vol 97, pp. 2516-2524, can be utilized. - The set of free parameters includes all the x0 and all the σ 2. These are computed using the Bayesian approach, which assumes that prior information about the parameters improves the parameter estimates. For all the x0, uniform prior distribution, uniform (a, b), can be chosen. For all the σ 2 , the conjugate inverse gamma prior distribution, inverse gamma (α,λ) can be chosen. Assuming values of 0 and 100 for a and b respectively to reflect the fact that the patient's behavior markers correlates perfectly at the beginning of tracking, α and λ can be chosen to be 5 and 1, making the inverse gamma prior distribution non-informative. A Bayesian analysis implementation, such as described in A. C. Smith, S. Wirth, W. A. Suzuki, and E. N. Brown, "Bayesian analysis of interleaved learning and response bias in behavioral experiments," Journal of Neurophysiology, vol. 97, pp. 2516-2524, 2007, can be utilized.
- The result is a report that can be coupled with a precise statistical characterization of behavioral dynamics. That is, behavioral dynamics, such as the points of loss-of-consciousness and recovery-of-consciousness (or other selected states) can be precisely, and statistically calculated and indicated in accordance with the present invention. Specifically, this report can aid clinicians by allowing information that was previously unknown or incapable of being discerned from traditional monitoring systems to be identified and communicated and/or used by the clinician and/or monitoring system to identify particular states of a given patient. The report may serve as part of a "human in-the-loop" operational strategy, whereby the above-described systems automatically detects spectral features of interest and the report serves as a mechanism by which to highlight or communicate the spectral features and the information extrapolated therefrom to inform clinicians of a given or predicted future state and the reasoning therebehind. Also, the report may include topographic maps of the patient's scalp or source localization maps on a brain image rendering to provide information relating to the location within the brain from which the EEG activity is being received.
- For example,
Fig. 9 provides two sets of time domain EEG waveforms and associated spectrograms acquired during clinical use of Propofol. Specifically, afirst set 900 illustrates two time domain EEG waveforms, a first EEG waveform demonstratingdelta oscillation 902 and the second EEG waveform demonstrating delta-alpha oscillation 904. While simultaneously reading and interpreting theseparate EEG waveforms spectrogram 906 displays the same delta oscillation and delta-alpha oscillation, but in form that is able to be more readily interpreted, particularly in real time. Similarly, asecond set 908 illustrates two time domain EEG waveforms, a first EEG waveform demonstrating delta-alpha oscillation 910 and the second EEG waveform demonstratingburst suppression 912. While simultaneously reading and interpreting theseparate EEG waveforms - Accordingly, using the present invention, a substantial amount of new and important signatures that were previously difficult to consider or understand and/or were previously unknown or not understood as reliable without considering drug and/or patient-specific signature information, can be reliably determined and used to track a current state of a patient. For example, in the unconscious state, sevoflurane shows increased slow, delta, theta, and alpha power. Compared to propofol, the increase in theta power is pronounced and visible in the power spectrum. Slow oscillation phase-amplitude coupling shows that high frequency activity is greatest on the rising phase (-π/2) of the slow oscillation. When ketamine is administered, power in beta and gamma bands increase. When it is administered alongside propofol, the two drugs act on the EEG in an antagonistic fashion. If enough ketamine is administered, it reduces or abolishes both slow and alpha power, and increases gamma power. Dexmedetomidine shows increased slow, delta, and sigma (12-16 Hz) power at lower doses consistent with sedation. At higher doses the EEG is dominated by slow oscillations.
- The above-referenced report, as an example with respect to propofol, can indicate, predict, and/or track onset of loss of consciousness and recovery of consciousness based on increased gamma (25 to 40Hz) and beta (12 to 25Hz) activity; transition to unconsciousness and in the unconscious state, and recovery of consciousness based on increased/decreased slow (0 to 1Hz), delta (1 to 4Hz), theta (4 to 8Hz), and alpha (8 to 12Hz) activity; anesthetic drug administration and loss of consciousness/recovery of consciousness based on reduced theta (4 to 8Hz) power; loss of consciousness and recovery of consciousness associated with changes in the ratio of alpha and delta (1 to 4 Hz) power in the occipital region of the scalp; states of profound unconsciousness by identifying strong global coherence in the alpha band; states of profound anesthesia based on strong association between global coherence and the state of anteriorization; profound unconsciousness based on strong modulation of the theta (4 to 8Hz), alpha (8 to 12Hz), beta (12 to 25Hz), and gamma (25 to 40Hz) activity by phase of slow and delta oscillations; transition to unconsciousness based on trough-max relationship between phase of slow oscillation and amplitude of alpha rhythm, where alpha amplitude is highest at the troughs (phase = +/- π) of the slow oscillation; profound unconsciousness based on peak-max relationship between phase of slow oscillation and amplitude of alpha rhythm, where alpha amplitude is highest at the peaks (phase = 0) of the slow oscillation; and profound states of loss of consciousness based on distinct behavior in the slow oscillation (0.1 to 1Hz) compared with the delta band (1 to 4Hz). Of course, many and different metrics, indicators, and signatures can be identified, tracked, and used to determine a patient's state and/or predict a future patient's state.
- As mentioned above, "spectral templates" for each of a plurality of exemplary drugs can be provided and used in accordance with the present invention. Specifically, to create the following "spectral templates," EEG data was acquired from operating room surgical cases during the administration of anesthesia. The data was separated into three age demographics: young (>35), middle-aged (36---59), and elderly (<60); and by drug: propofol, sevoflurane, isoflurane, dexmedetomidine, and ketamine. Spectrograms from each of the cases were analyzed to identify temporal intervals containing recurring spectral motifs correlated with putative unconscious and deep levels of anesthesia. These intervals were used to compute median spectra for each of the drug/demographic pairings.
- The following relates the results of this analysis. For each of the reported median power spectra from the drug/demographic pairings, the prominent spectral peaks were identified. For each set of spectral peaks, the peak frequency, peak power, and bandwidth were estimated as a function of putative unconscious (darker) and deep (lighter) states of anesthesia. Summary schematics of the state/demographic dynamics were generated along with tables relating the defining features of each spectral peak.
- Referring to
Fig. 10 , propofol has studied. The spectral motifs for propofol included three salient spectral peaks: a low frequency (<1Hz) oscillation, a traveling peak (spanning gamma through alpha), and a broadband gamma. - Overall dynamics during the transition from putative unconscious to deep states of anesthesia include:
- Low Frequency Oscillation:
- The peak frequency remains roughly constant. In some instances, a slight decrease in peak frequency may be seen.
- The peak power increases.
- The bandwidth remains roughly constant.
- Traveling Peak:
- The peak frequency decreases.
- The peak power decreases.
- The bandwidth remains roughly constant.
- Gamma:
- Broadband gamma with no clear spectral peak.
- The power decreases
- The effect of increasing age on the spectral motif dynamics during the transition from putative unconscious to deep states of anesthesia:
- Low Frequency Oscillation:
- Peak frequency and bandwidth remain roughly unchanged.
- The power of both unconscious and deep peaks are reduced and the difference between them increased with age.
- Traveling Peak:
- The peak frequency, power, and bandwidths of both unconscious and deep peaks are reduced with age.
- Gamma:
- The power of the broadband peaks is reduced such that there is no difference in power between them at ~40Hz.
-
Fig. 11 provides information similar to that ofFig. 10 , in this case, with respect to sevoflurane. The spectral motifs for sevoflurane included two salient spectral peaks: a broad low frequency oscillation (spanning <1Hz, delta, and theta bands), and a traveling peak. - Overall dynamics during the transition from putative unconscious to deep states of anesthesia:
- Broad Low Frequency Oscillation:
- The peak frequency remains roughly constant.
- The peak power increases.
- The bandwidth decreases slightly.
- Traveling Peak:
- The peak frequency, power, and bandwidths decrease.
- The effect of increasing age on the spectral motif dynamics during the transition from putative unconscious to deep states of anesthesia:
- Broad Low Frequency Oscillation:
- Peak frequency is roughly unchanged.
- The bandwidth is slightly reduced.
- The power of both unconscious and deep peaks are reduced, and the difference between is significantly reduced such that they have the same power across unconscious and deep states.
- Traveling Peak:
- The peak frequency, power, and bandwidth of both unconscious and deep peaks are reduced, and the differences between their values are increased.
-
Fig. 12 provides information similar to that ofFigs. 10 and11 , in this case, with respect to isoflurane. The spectral motifs for isoflurane included two salient spectral peaks: a broad low frequency oscillation (spanning <1Hz, delta and theta bands), and a traveling peak. - Overall dynamics during the transition from putative unconscious to deep states of anesthesia:
- Broad Low Frequency Oscillation:
- The peak frequency remains roughly constant.
- The peak power increases.
- The bandwidth decreases slightly.
- Traveling Peak:
- The peak frequency, power, and bandwidths decrease.
- The effect of increasing age on the spectral motif dynamics during the transition from putative unconscious to deep states of anesthesia:
- Broad Low Oscillation:
- Peak frequency is roughly unchanged.
- The bandwidth is slightly reduced.
- The power of both unconscious and deep peaks are reduced, and the difference between is significantly reduced such that they have the same power across unconscious and deep states.
- Traveling Peak:
- The peak frequency is reduced, and the differences between their values are increased.
- The power of both unconscious and deep peaks are reduced, and the difference between is significantly reduced such that they have the same power across unconscious and deep states.
- The bandwidth is slightly reduced.
-
Fig. 13 provides information similar to that ofFigs. 10-12 , in this case, with respect to dexmedetomidine. The data for young and elderly patients were limited and showed spectral heterogeneity. Thus, we report only the findings for the middle aged demographic. With respect to identified peaks, the spectral motifs for dexmedetomidine included three salient spectral peaks: low frequency oscillation, a non---stationary "spindle" peak spanning alpha and sigma bands, and broadband gamma. - Overall dynamics during the transition from putative unconscious to deep states of anesthesia:
- Slow Oscillation:
- The peak frequency remains roughly constant.
- The peak power increases.
- The bandwidth remains roughly constant.
- Spindle Peak:
- The peak frequency decreases though remains in high alpha/low sigma (spindle) range.
- The peak power decreases.
- The bandwidth remains roughly constant.
- Gamma:
- Broadband gamma with no clear spectral peak.
- The power decreases.
-
Fig. 14 provides information similar to that ofFigs. 10-13 , in this case, with respect to ketamine. Data was acquired from one middle aged patient. The effects, however, seem marked between putative unconscious and deep states of anesthesia. With respect to identified peaks, the spectral motifs for ketamine included three salient spectral peaks: the low frequency oscillation, and a non-stationary low gamma peak, and broadband high gamma (up to 150Hz).Overall dynamics during the transition from putative unconscious to deep states of anesthesia: - Low Frequency Oscillation:
- The peak frequency remains roughly constant.
- The peak power decreases.
- The bandwidth remains roughly constant.
- Low Gamma Peak:
- The peak frequency and power decrease.
- The bandwidth remains roughly constant.
- High Gamma:
- Broadband gamma with no clear spectral peak.
- The power increases.
- The present invention has been described in terms of one or more preferred embodiments, and it should be appreciated that many equivalents, alternatives, variations, and modifications, aside from those expressly stated, are possible and within the scope of the claims. Therefore, the invention should not be limited to a particular described embodiment.
- For example, the present system has ready use and clinical need in fields of medicine other than anesthesiology. For example, other medical specialties either use or have interest in the use of drugs such as those described above and other similar drugs. The above-described systems are useful for managing drugs in a wide variety of situations. For example, the present system can be used during pharmacological therapies to induce and maintain sedation. Also, the present system can be particularly useful in the intensive care unit where intense therapies are administered and clinicians can benefit from additional monitoring and feedback. Further still, the present system can be of use in outpatient settings, including outpatient treatments involving pharmacologically-induced sleep, involving sedation, for example, using dexmedetomidine. Also, the present system can be used in psychiatry settings to aid in the treatment of depression with ketamine, for example. These are but a few of the wide-variety of clinical and non-clinical settings where the present system can be readily applied.
Claims (11)
- A system for monitoring a patient experiencing an administration of at least one drug having anesthetic properties, the system comprising:a plurality of electroencephalogram (EEG) sensors configured to acquire physiological data from the patient;at least one processor configured to:assemble the physiological data into sets of time-series data using local referencing, wherein local referencing uses an average of the EEGs of several neighboring EEG sensors;transform each set of locally referenced time-series data into spectrum information;determine, using the sets of time-series data assembled using local referencing, global coherence information for at least one frequency, wherein the global coherence information is indicative of coordinated brain activity at the at least one frequency;identify signatures within at least one of the spectrum information and the global coherence information indicative of at least one of a current state and a predicted future state of the patient; andgenerate a report using the signatures including information regarding at least one of the current state and the predicted future state of the patient induced by the drug.
- The system of claim 1 wherein the report indicates spatiotemporal activity at different states of the patient receiving the drug.
- The system of claim 1 wherein the at least one processor is further configured to analyze an amplitude envelope of activity in at least one set of time-series data to identify a maxima at a selected frequency based on a phase of a lower frequency rhythm.
- The system of claim 1 wherein the processor is configured to perform a modulogram analysis to measure a phase-amplitude coupling in a time-resolved fashion to identify modes of phase-amplitude coupling corresponding to states of the patient receiving the drug.
- The system of claim 4 wherein the processor is further configured to determine at least one of a spatial and a local average of data acquired by several of the plurality of sensors to perform the modulogram analysis.
- The system of claim 1 wherein the processor is further configured to receive an indication of at least one of a characteristic of the patient and the at least one drug having anesthetic properties and identify the signatures based on the indication.
- The system of claim 6 wherein the indication includes at least one of an age of the patient, a drug selecting from the list consisting essentially of Propofol, Etomidate, Barbiturates, Thiopental, Pentobarbital, Phenobarbital, Methohexital, Benzodiazepines, Midazolam, Diazepam, Lorazepam, Dexmedetomidine, Ketamine, Sevoflurane, Isoflurane, Desflurane, Remifenanil, Fentanyl, Sufentanil, Alfentanil, and drug administration information including at least one of drug timing, drug dose, and drug administration rate.
- The system of claim 1 wherein the processor is configured to implement a dynamic Bayesian processing method to characterize the patient as exhibiting a predetermined behavioral dynamic based on the spectrum information and the global coherence information.
- The system of claim 8 wherein the behavioral dynamic includes at least one of a loss consciousness and recovery of consciousness.
- The system of claim 1 wherein the plurality of sensors further include at least one of heart rate monitors, blood pressure monitors, and sensors configured to monitor galvanic skin response (GSR).
- The system of claim 1 wherein the processor is further configured to transform each set of time-series data into a spectrogram and identify signatures within at least one of the spectrogram and the coherence information indicative of at least one of a current state and a predicted future state of the patient.
Applications Claiming Priority (2)
| Application Number | Priority Date | Filing Date | Title |
|---|---|---|---|
| US201161483483P | 2011-05-06 | 2011-05-06 | |
| PCT/US2012/036854 WO2012154701A1 (en) | 2011-05-06 | 2012-05-07 | System and method for tracking brain states during administration of anesthesia |
Publications (3)
| Publication Number | Publication Date |
|---|---|
| EP2704630A1 EP2704630A1 (en) | 2014-03-12 |
| EP2704630A4 EP2704630A4 (en) | 2014-10-15 |
| EP2704630B1 true EP2704630B1 (en) | 2023-07-26 |
Family
ID=47139581
Family Applications (1)
| Application Number | Title | Priority Date | Filing Date |
|---|---|---|---|
| EP12781958.9A Active EP2704630B1 (en) | 2011-05-06 | 2012-05-07 | System for tracking brain states during administration of anesthesia |
Country Status (5)
| Country | Link |
|---|---|
| US (2) | US20140187973A1 (en) |
| EP (1) | EP2704630B1 (en) |
| JP (1) | JP6109155B2 (en) |
| MX (1) | MX2013012933A (en) |
| WO (1) | WO2012154701A1 (en) |
Families Citing this family (218)
| Publication number | Priority date | Publication date | Assignee | Title |
|---|---|---|---|---|
| US6334065B1 (en) | 1998-06-03 | 2001-12-25 | Masimo Corporation | Stereo pulse oximeter |
| US6684090B2 (en) | 1999-01-07 | 2004-01-27 | Masimo Corporation | Pulse oximetry data confidence indicator |
| US6850787B2 (en) | 2001-06-29 | 2005-02-01 | Masimo Laboratories, Inc. | Signal component processor |
| US6697658B2 (en) | 2001-07-02 | 2004-02-24 | Masimo Corporation | Low power pulse oximeter |
| US7355512B1 (en) | 2002-01-24 | 2008-04-08 | Masimo Corporation | Parallel alarm processor |
| US6850788B2 (en) | 2002-03-25 | 2005-02-01 | Masimo Corporation | Physiological measurement communications adapter |
| US6920345B2 (en) | 2003-01-24 | 2005-07-19 | Masimo Corporation | Optical sensor including disposable and reusable elements |
| US7003338B2 (en) | 2003-07-08 | 2006-02-21 | Masimo Corporation | Method and apparatus for reducing coupling between signals |
| US7500950B2 (en) | 2003-07-25 | 2009-03-10 | Masimo Corporation | Multipurpose sensor port |
| US7483729B2 (en) | 2003-11-05 | 2009-01-27 | Masimo Corporation | Pulse oximeter access apparatus and method |
| US7415297B2 (en) | 2004-03-08 | 2008-08-19 | Masimo Corporation | Physiological parameter system |
| WO2006094171A1 (en) | 2005-03-01 | 2006-09-08 | Masimo Laboratories, Inc. | Multiple wavelength sensor drivers |
| EP1874178A4 (en) | 2005-04-13 | 2009-12-09 | Glucolight Corp | Method for data reduction and calibration of an oct-based blood glucose monitor |
| US7962188B2 (en) | 2005-10-14 | 2011-06-14 | Masimo Corporation | Robust alarm system |
| US8182443B1 (en) | 2006-01-17 | 2012-05-22 | Masimo Corporation | Drug administration controller |
| US8219172B2 (en) | 2006-03-17 | 2012-07-10 | Glt Acquisition Corp. | System and method for creating a stable optical interface |
| US7941199B2 (en) | 2006-05-15 | 2011-05-10 | Masimo Laboratories, Inc. | Sepsis monitor |
| US10188348B2 (en) | 2006-06-05 | 2019-01-29 | Masimo Corporation | Parameter upgrade system |
| US8457707B2 (en) | 2006-09-20 | 2013-06-04 | Masimo Corporation | Congenital heart disease monitor |
| US8840549B2 (en) | 2006-09-22 | 2014-09-23 | Masimo Corporation | Modular patient monitor |
| US8265723B1 (en) | 2006-10-12 | 2012-09-11 | Cercacor Laboratories, Inc. | Oximeter probe off indicator defining probe off space |
| US9861305B1 (en) | 2006-10-12 | 2018-01-09 | Masimo Corporation | Method and apparatus for calibration to reduce coupling between signals in a measurement system |
| US8280473B2 (en) | 2006-10-12 | 2012-10-02 | Masino Corporation, Inc. | Perfusion index smoother |
| US7880626B2 (en) | 2006-10-12 | 2011-02-01 | Masimo Corporation | System and method for monitoring the life of a physiological sensor |
| US8255026B1 (en) | 2006-10-12 | 2012-08-28 | Masimo Corporation, Inc. | Patient monitor capable of monitoring the quality of attached probes and accessories |
| US8600467B2 (en) | 2006-11-29 | 2013-12-03 | Cercacor Laboratories, Inc. | Optical sensor including disposable and reusable elements |
| JP5441707B2 (en) | 2006-12-09 | 2014-03-12 | マシモ コーポレイション | Plethysmograph variation processor |
| US8852094B2 (en) | 2006-12-22 | 2014-10-07 | Masimo Corporation | Physiological parameter system |
| US8652060B2 (en) | 2007-01-20 | 2014-02-18 | Masimo Corporation | Perfusion trend indicator |
| US8374665B2 (en) | 2007-04-21 | 2013-02-12 | Cercacor Laboratories, Inc. | Tissue profile wellness monitor |
| WO2009111542A2 (en) | 2008-03-04 | 2009-09-11 | Glucolight Corporation | Methods and systems for analyte level estimation in optical coherence tomography |
| JP5575752B2 (en) | 2008-05-02 | 2014-08-20 | マシモ コーポレイション | Monitor configuration system |
| US9107625B2 (en) | 2008-05-05 | 2015-08-18 | Masimo Corporation | Pulse oximetry system with electrical decoupling circuitry |
| EP2326239B1 (en) | 2008-07-03 | 2017-06-21 | Masimo Laboratories, Inc. | Protrusion for improving spectroscopic measurement of blood constituents |
| US8203438B2 (en) | 2008-07-29 | 2012-06-19 | Masimo Corporation | Alarm suspend system |
| US8515509B2 (en) | 2008-08-04 | 2013-08-20 | Cercacor Laboratories, Inc. | Multi-stream emitter for noninvasive measurement of blood constituents |
| SE532941C2 (en) | 2008-09-15 | 2010-05-18 | Phasein Ab | Gas sampling line for breathing gases |
| US8771204B2 (en) | 2008-12-30 | 2014-07-08 | Masimo Corporation | Acoustic sensor assembly |
| US8588880B2 (en) | 2009-02-16 | 2013-11-19 | Masimo Corporation | Ear sensor |
| US10032002B2 (en) | 2009-03-04 | 2018-07-24 | Masimo Corporation | Medical monitoring system |
| EP2404253B1 (en) | 2009-03-04 | 2019-09-18 | Masimo Corporation | Medical monitoring system |
| US10007758B2 (en) | 2009-03-04 | 2018-06-26 | Masimo Corporation | Medical monitoring system |
| US9323894B2 (en) | 2011-08-19 | 2016-04-26 | Masimo Corporation | Health care sanitation monitoring system |
| US8388353B2 (en) | 2009-03-11 | 2013-03-05 | Cercacor Laboratories, Inc. | Magnetic connector |
| WO2010135373A1 (en) | 2009-05-19 | 2010-11-25 | Masimo Corporation | Disposable components for reusable physiological sensor |
| US8571619B2 (en) | 2009-05-20 | 2013-10-29 | Masimo Corporation | Hemoglobin display and patient treatment |
| US8473020B2 (en) | 2009-07-29 | 2013-06-25 | Cercacor Laboratories, Inc. | Non-invasive physiological sensor cover |
| US9579039B2 (en) | 2011-01-10 | 2017-02-28 | Masimo Corporation | Non-invasive intravascular volume index monitor |
| US20110137297A1 (en) | 2009-09-17 | 2011-06-09 | Kiani Massi Joe E | Pharmacological management system |
| US20110082711A1 (en) | 2009-10-06 | 2011-04-07 | Masimo Laboratories, Inc. | Personal digital assistant or organizer for monitoring glucose levels |
| US8523781B2 (en) | 2009-10-15 | 2013-09-03 | Masimo Corporation | Bidirectional physiological information display |
| EP3735899B1 (en) | 2009-10-15 | 2023-11-29 | Masimo Corporation | Acoustic respiratory monitoring sensor having multiple sensing elements |
| WO2011047216A2 (en) | 2009-10-15 | 2011-04-21 | Masimo Corporation | Physiological acoustic monitoring system |
| US10463340B2 (en) | 2009-10-15 | 2019-11-05 | Masimo Corporation | Acoustic respiratory monitoring systems and methods |
| US9839381B1 (en) | 2009-11-24 | 2017-12-12 | Cercacor Laboratories, Inc. | Physiological measurement system with automatic wavelength adjustment |
| US8801613B2 (en) | 2009-12-04 | 2014-08-12 | Masimo Corporation | Calibration for multi-stage physiological monitors |
| US9153112B1 (en) | 2009-12-21 | 2015-10-06 | Masimo Corporation | Modular patient monitor |
| WO2011091059A1 (en) | 2010-01-19 | 2011-07-28 | Masimo Corporation | Wellness analysis system |
| GB2490832B (en) | 2010-03-01 | 2016-09-21 | Masimo Corp | Adaptive alarm system |
| US8584345B2 (en) | 2010-03-08 | 2013-11-19 | Masimo Corporation | Reprocessing of a physiological sensor |
| US9307928B1 (en) | 2010-03-30 | 2016-04-12 | Masimo Corporation | Plethysmographic respiration processor |
| US8666468B1 (en) | 2010-05-06 | 2014-03-04 | Masimo Corporation | Patient monitor for determining microcirculation state |
| US9408542B1 (en) | 2010-07-22 | 2016-08-09 | Masimo Corporation | Non-invasive blood pressure measurement system |
| US20130310422A1 (en) | 2010-09-01 | 2013-11-21 | The General Hospital Corporation | Reversal of general anesthesia by administration of methylphenidate, amphetamine, modafinil, amantadine, and/or caffeine |
| US8821397B2 (en) | 2010-09-28 | 2014-09-02 | Masimo Corporation | Depth of consciousness monitor including oximeter |
| US9211095B1 (en) | 2010-10-13 | 2015-12-15 | Masimo Corporation | Physiological measurement logic engine |
| US20120226117A1 (en) | 2010-12-01 | 2012-09-06 | Lamego Marcelo M | Handheld processing device including medical applications for minimally and non invasive glucose measurements |
| WO2012109671A1 (en) | 2011-02-13 | 2012-08-16 | Masimo Corporation | Medical characterization system |
| US9066666B2 (en) | 2011-02-25 | 2015-06-30 | Cercacor Laboratories, Inc. | Patient monitor for monitoring microcirculation |
| US11786132B2 (en) | 2011-05-06 | 2023-10-17 | The General Hospital Corporation | Systems and methods for predicting arousal to consciousness during general anesthesia and sedation |
| US9986919B2 (en) | 2011-06-21 | 2018-06-05 | Masimo Corporation | Patient monitoring system |
| US9532722B2 (en) | 2011-06-21 | 2017-01-03 | Masimo Corporation | Patient monitoring system |
| US11439329B2 (en) | 2011-07-13 | 2022-09-13 | Masimo Corporation | Multiple measurement mode in a physiological sensor |
| US9782077B2 (en) | 2011-08-17 | 2017-10-10 | Masimo Corporation | Modulated physiological sensor |
| EP2765909B1 (en) | 2011-10-13 | 2019-06-26 | Masimo Corporation | Physiological acoustic monitoring system |
| US9808188B1 (en) | 2011-10-13 | 2017-11-07 | Masimo Corporation | Robust fractional saturation determination |
| US9436645B2 (en) | 2011-10-13 | 2016-09-06 | Masimo Corporation | Medical monitoring hub |
| US9943269B2 (en) | 2011-10-13 | 2018-04-17 | Masimo Corporation | System for displaying medical monitoring data |
| US9778079B1 (en) | 2011-10-27 | 2017-10-03 | Masimo Corporation | Physiological monitor gauge panel |
| US9392945B2 (en) | 2012-01-04 | 2016-07-19 | Masimo Corporation | Automated CCHD screening and detection |
| US11172890B2 (en) | 2012-01-04 | 2021-11-16 | Masimo Corporation | Automated condition screening and detection |
| US10149616B2 (en) | 2012-02-09 | 2018-12-11 | Masimo Corporation | Wireless patient monitoring device |
| US9195385B2 (en) | 2012-03-25 | 2015-11-24 | Masimo Corporation | Physiological monitor touchscreen interface |
| JP6490577B2 (en) | 2012-04-17 | 2019-03-27 | マシモ・コーポレイション | How to operate a pulse oximeter device |
| GB201209638D0 (en) * | 2012-05-30 | 2012-07-11 | Isis Innovation | Perception loss detection |
| WO2013184965A1 (en) | 2012-06-07 | 2013-12-12 | Masimo Corporation | Depth of consciousness monitor |
| US9697928B2 (en) | 2012-08-01 | 2017-07-04 | Masimo Corporation | Automated assembly sensor cable |
| US9877650B2 (en) | 2012-09-20 | 2018-01-30 | Masimo Corporation | Physiological monitor with mobile computing device connectivity |
| US9955937B2 (en) | 2012-09-20 | 2018-05-01 | Masimo Corporation | Acoustic patient sensor coupler |
| US9749232B2 (en) | 2012-09-20 | 2017-08-29 | Masimo Corporation | Intelligent medical network edge router |
| US9717458B2 (en) | 2012-10-20 | 2017-08-01 | Masimo Corporation | Magnetic-flap optical sensor |
| US9560996B2 (en) | 2012-10-30 | 2017-02-07 | Masimo Corporation | Universal medical system |
| US9787568B2 (en) | 2012-11-05 | 2017-10-10 | Cercacor Laboratories, Inc. | Physiological test credit method |
| US9724025B1 (en) | 2013-01-16 | 2017-08-08 | Masimo Corporation | Active-pulse blood analysis system |
| US9965946B2 (en) | 2013-03-13 | 2018-05-08 | Masimo Corporation | Systems and methods for monitoring a patient health network |
| US9936917B2 (en) | 2013-03-14 | 2018-04-10 | Masimo Laboratories, Inc. | Patient monitor placement indicator |
| EP2988666A1 (en) * | 2013-04-23 | 2016-03-02 | The General Hospital Corporation | System and method for monitoring anesthesia and sedation using measures of brain coherence and synchrony |
| WO2014176441A1 (en) * | 2013-04-24 | 2014-10-30 | The General Hospital Corporation | System and method for monitoring level of dexmedatomidine-induced sedation |
| WO2014176436A1 (en) * | 2013-04-24 | 2014-10-30 | The General Hospital Corporation | System and method for estimating high time-frequency resolution eeg spectrograms to monitor patient state |
| JP6446030B2 (en) | 2013-04-24 | 2018-12-26 | フレゼニウス カービ ドイチュラント ゲーエムベーハー | Method of operating a control device for controlling a drug injection device |
| US10314503B2 (en) | 2013-06-27 | 2019-06-11 | The General Hospital Corporation | Systems and methods for tracking non-stationary spectral structure and dynamics in physiological data |
| US10383574B2 (en) | 2013-06-28 | 2019-08-20 | The General Hospital Corporation | Systems and methods to infer brain state during burst suppression |
| US9891079B2 (en) | 2013-07-17 | 2018-02-13 | Masimo Corporation | Pulser with double-bearing position encoder for non-invasive physiological monitoring |
| WO2015009877A1 (en) | 2013-07-17 | 2015-01-22 | The Regents Of The University Of California | Method for focused recording and stimulation electrode array |
| US10555678B2 (en) | 2013-08-05 | 2020-02-11 | Masimo Corporation | Blood pressure monitor with valve-chamber assembly |
| WO2015038683A2 (en) | 2013-09-12 | 2015-03-19 | Cercacor Laboratories, Inc. | Medical device management system |
| JP6586093B2 (en) * | 2013-09-13 | 2019-10-02 | ザ ジェネラル ホスピタル コーポレイション | System for improved brain monitoring during general anesthesia and sedation |
| US11147518B1 (en) | 2013-10-07 | 2021-10-19 | Masimo Corporation | Regional oximetry signal processor |
| EP3054849B1 (en) | 2013-10-07 | 2022-03-16 | Masimo Corporation | Regional oximetry sensor |
| US10832818B2 (en) | 2013-10-11 | 2020-11-10 | Masimo Corporation | Alarm notification system |
| US10828007B1 (en) | 2013-10-11 | 2020-11-10 | Masimo Corporation | Acoustic sensor with attachment portion |
| US10279247B2 (en) | 2013-12-13 | 2019-05-07 | Masimo Corporation | Avatar-incentive healthcare therapy |
| WO2015108908A2 (en) * | 2014-01-14 | 2015-07-23 | The General Hospital Corporation | System and method for characterizing brain states during general anesthesia and sedation using phase-amplitude modulation |
| US11259745B2 (en) | 2014-01-28 | 2022-03-01 | Masimo Corporation | Autonomous drug delivery system |
| US10086138B1 (en) | 2014-01-28 | 2018-10-02 | Masimo Corporation | Autonomous drug delivery system |
| US10123729B2 (en) | 2014-06-13 | 2018-11-13 | Nanthealth, Inc. | Alarm fatigue management systems and methods |
| US10231670B2 (en) | 2014-06-19 | 2019-03-19 | Masimo Corporation | Proximity sensor in pulse oximeter |
| US10111591B2 (en) | 2014-08-26 | 2018-10-30 | Nanthealth, Inc. | Real-time monitoring systems and methods in a healthcare environment |
| WO2016036985A1 (en) | 2014-09-04 | 2016-03-10 | Masimo Corportion | Total hemoglobin index system |
| US10383520B2 (en) | 2014-09-18 | 2019-08-20 | Masimo Semiconductor, Inc. | Enhanced visible near-infrared photodiode and non-invasive physiological sensor |
| US10111617B2 (en) * | 2014-09-22 | 2018-10-30 | Covidien Lp | Systems and methods for EEG monitoring |
| WO2016057553A1 (en) | 2014-10-07 | 2016-04-14 | Masimo Corporation | Modular physiological sensors |
| CN107405108B (en) | 2015-01-23 | 2020-10-23 | 迈心诺瑞典公司 | Nasal/oral intubation system and manufacture |
| KR102609605B1 (en) | 2015-02-06 | 2023-12-05 | 마시모 코오퍼레이션 | Fold flex circuit for optical probes |
| CN113054464B (en) | 2015-02-06 | 2023-04-07 | 迈心诺公司 | Connector and sensor assembly |
| US10568553B2 (en) | 2015-02-06 | 2020-02-25 | Masimo Corporation | Soft boot pulse oximetry sensor |
| US10702208B2 (en) * | 2015-03-31 | 2020-07-07 | Cerenion Oy | Apparatus and method for electroencephalographic examination |
| US10524738B2 (en) | 2015-05-04 | 2020-01-07 | Cercacor Laboratories, Inc. | Noninvasive sensor system with visual infographic display |
| WO2016191307A1 (en) | 2015-05-22 | 2016-12-01 | Cercacor Laboratories, Inc. | Non-invasive optical physiological differential pathlength sensor |
| US10448871B2 (en) | 2015-07-02 | 2019-10-22 | Masimo Corporation | Advanced pulse oximetry sensor |
| WO2017027621A1 (en) | 2015-08-11 | 2017-02-16 | Masimo Corporation | Medical monitoring analysis and replay including indicia responsive to light attenuated by body tissue |
| JP6940483B2 (en) | 2015-08-31 | 2021-09-29 | マシモ・コーポレイション | Wireless patient monitoring system and method |
| US11504066B1 (en) | 2015-09-04 | 2022-11-22 | Cercacor Laboratories, Inc. | Low-noise sensor system |
| US11679579B2 (en) | 2015-12-17 | 2023-06-20 | Masimo Corporation | Varnish-coated release liner |
| US10537285B2 (en) | 2016-03-04 | 2020-01-21 | Masimo Corporation | Nose sensor |
| US10993662B2 (en) | 2016-03-04 | 2021-05-04 | Masimo Corporation | Nose sensor |
| US11191484B2 (en) | 2016-04-29 | 2021-12-07 | Masimo Corporation | Optical sensor tape |
| WO2018009612A1 (en) | 2016-07-06 | 2018-01-11 | Patient Doctor Technologies, Inc. | Secure and zero knowledge data sharing for cloud applications |
| US10617302B2 (en) | 2016-07-07 | 2020-04-14 | Masimo Corporation | Wearable pulse oximeter and respiration monitor |
| WO2018071715A1 (en) | 2016-10-13 | 2018-04-19 | Masimo Corporation | Systems and methods for patient fall detection |
| US10786168B2 (en) | 2016-11-29 | 2020-09-29 | The General Hospital Corporation | Systems and methods for analyzing electrophysiological data from patients undergoing medical treatments |
| US11504058B1 (en) | 2016-12-02 | 2022-11-22 | Masimo Corporation | Multi-site noninvasive measurement of a physiological parameter |
| WO2018119239A1 (en) | 2016-12-22 | 2018-06-28 | Cercacor Laboratories, Inc | Methods and devices for detecting intensity of light with translucent detector |
| US10721785B2 (en) | 2017-01-18 | 2020-07-21 | Masimo Corporation | Patient-worn wireless physiological sensor with pairing functionality |
| US11086609B2 (en) | 2017-02-24 | 2021-08-10 | Masimo Corporation | Medical monitoring hub |
| US11024064B2 (en) | 2017-02-24 | 2021-06-01 | Masimo Corporation | Augmented reality system for displaying patient data |
| US20180247712A1 (en) | 2017-02-24 | 2018-08-30 | Masimo Corporation | System for displaying medical monitoring data |
| WO2018156648A1 (en) | 2017-02-24 | 2018-08-30 | Masimo Corporation | Managing dynamic licenses for physiological parameters in a patient monitoring environment |
| US10388120B2 (en) | 2017-02-24 | 2019-08-20 | Masimo Corporation | Localized projection of audible noises in medical settings |
| US10327713B2 (en) | 2017-02-24 | 2019-06-25 | Masimo Corporation | Modular multi-parameter patient monitoring device |
| US11185262B2 (en) | 2017-03-10 | 2021-11-30 | Masimo Corporation | Pneumonia screener |
| WO2018194992A1 (en) | 2017-04-18 | 2018-10-25 | Masimo Corporation | Nose sensor |
| US10918281B2 (en) | 2017-04-26 | 2021-02-16 | Masimo Corporation | Medical monitoring device having multiple configurations |
| USD835285S1 (en) | 2017-04-28 | 2018-12-04 | Masimo Corporation | Medical monitoring device |
| USD835282S1 (en) | 2017-04-28 | 2018-12-04 | Masimo Corporation | Medical monitoring device |
| WO2018201078A1 (en) | 2017-04-28 | 2018-11-01 | Masimo Corporation | Spot check measurement system |
| USD835284S1 (en) | 2017-04-28 | 2018-12-04 | Masimo Corporation | Medical monitoring device |
| USD835283S1 (en) | 2017-04-28 | 2018-12-04 | Masimo Corporation | Medical monitoring device |
| KR102559598B1 (en) | 2017-05-08 | 2023-07-25 | 마시모 코오퍼레이션 | A system for pairing a medical system to a network controller using a dongle |
| EP3634211A4 (en) | 2017-06-07 | 2021-03-17 | Covidien LP | Systems and methods for detecting strokes |
| US11026604B2 (en) | 2017-07-13 | 2021-06-08 | Cercacor Laboratories, Inc. | Medical monitoring device for harmonizing physiological measurements |
| USD890708S1 (en) | 2017-08-15 | 2020-07-21 | Masimo Corporation | Connector |
| USD906970S1 (en) | 2017-08-15 | 2021-01-05 | Masimo Corporation | Connector |
| CN111031908B (en) | 2017-08-15 | 2023-07-14 | 梅西莫股份有限公司 | Waterproof connector for noninvasive patient monitor |
| JP2021500128A (en) | 2017-10-19 | 2021-01-07 | マシモ・コーポレイション | Display configuration of medical monitoring system |
| USD925597S1 (en) | 2017-10-31 | 2021-07-20 | Masimo Corporation | Display screen or portion thereof with graphical user interface |
| EP3703566B1 (en) | 2017-10-31 | 2023-07-26 | Masimo Corporation | System for displaying oxygen state indications |
| CN107811619B (en) * | 2017-12-08 | 2021-10-19 | 西安科技大学 | Portable pulse diagnosis instrument and analysis method thereof |
| US11766198B2 (en) | 2018-02-02 | 2023-09-26 | Cercacor Laboratories, Inc. | Limb-worn patient monitoring device |
| US11406316B2 (en) * | 2018-02-14 | 2022-08-09 | Cerenion Oy | Apparatus and method for electroencephalographic measurement |
| WO2019204368A1 (en) | 2018-04-19 | 2019-10-24 | Masimo Corporation | Mobile patient alarm display |
| US11883129B2 (en) | 2018-04-24 | 2024-01-30 | Cercacor Laboratories, Inc. | Easy insert finger sensor for transmission based spectroscopy sensor |
| US10939878B2 (en) | 2018-06-06 | 2021-03-09 | Masimo Corporation | Opioid overdose monitoring |
| US10779098B2 (en) | 2018-07-10 | 2020-09-15 | Masimo Corporation | Patient monitor alarm speaker analyzer |
| EP3823527A4 (en) * | 2018-07-16 | 2022-04-20 | The General Hospital Corporation | System and method for monitoring neural signals |
| US11872156B2 (en) | 2018-08-22 | 2024-01-16 | Masimo Corporation | Core body temperature measurement |
| USD916135S1 (en) | 2018-10-11 | 2021-04-13 | Masimo Corporation | Display screen or portion thereof with a graphical user interface |
| US11389093B2 (en) | 2018-10-11 | 2022-07-19 | Masimo Corporation | Low noise oximetry cable |
| USD998630S1 (en) | 2018-10-11 | 2023-09-12 | Masimo Corporation | Display screen or portion thereof with a graphical user interface |
| USD917564S1 (en) | 2018-10-11 | 2021-04-27 | Masimo Corporation | Display screen or portion thereof with graphical user interface |
| USD917550S1 (en) | 2018-10-11 | 2021-04-27 | Masimo Corporation | Display screen or portion thereof with a graphical user interface |
| USD998631S1 (en) | 2018-10-11 | 2023-09-12 | Masimo Corporation | Display screen or portion thereof with a graphical user interface |
| USD999246S1 (en) | 2018-10-11 | 2023-09-19 | Masimo Corporation | Display screen or portion thereof with a graphical user interface |
| CA3115776A1 (en) | 2018-10-11 | 2020-04-16 | Masimo Corporation | Patient connector assembly with vertical detents |
| US11406286B2 (en) | 2018-10-11 | 2022-08-09 | Masimo Corporation | Patient monitoring device with improved user interface |
| US11272839B2 (en) | 2018-10-12 | 2022-03-15 | Ma Simo Corporation | System for transmission of sensor data using dual communication protocol |
| USD897098S1 (en) | 2018-10-12 | 2020-09-29 | Masimo Corporation | Card holder set |
| US11464410B2 (en) | 2018-10-12 | 2022-10-11 | Masimo Corporation | Medical systems and methods |
| US11684296B2 (en) | 2018-12-21 | 2023-06-27 | Cercacor Laboratories, Inc. | Noninvasive physiological sensor |
| AU2020259445A1 (en) | 2019-04-17 | 2021-12-02 | Masimo Corporation | Patient monitoring systems, devices, and methods |
| USD919094S1 (en) | 2019-08-16 | 2021-05-11 | Masimo Corporation | Blood pressure device |
| USD921202S1 (en) | 2019-08-16 | 2021-06-01 | Masimo Corporation | Holder for a blood pressure device |
| USD917704S1 (en) | 2019-08-16 | 2021-04-27 | Masimo Corporation | Patient monitor |
| USD985498S1 (en) | 2019-08-16 | 2023-05-09 | Masimo Corporation | Connector |
| USD919100S1 (en) | 2019-08-16 | 2021-05-11 | Masimo Corporation | Holder for a patient monitor |
| US11832940B2 (en) | 2019-08-27 | 2023-12-05 | Cercacor Laboratories, Inc. | Non-invasive medical monitoring device for blood analyte measurements |
| US11445960B2 (en) * | 2019-10-09 | 2022-09-20 | Trustees Of Boston University | Electrography system employing layered electrodes for improved spatial resolution |
| WO2021072405A1 (en) * | 2019-10-11 | 2021-04-15 | The Trustees Of Columbia University In The City Of New York | System, method and computer-accessible medium for anesthesia monitoring using electroencephalographic monitoring |
| KR102502880B1 (en) * | 2019-10-11 | 2023-02-23 | 연세대학교 산학협력단 | Method for bayesian maximum entropy model estimation and brain function dynamic characteristics evaluation |
| US20210117525A1 (en) | 2019-10-18 | 2021-04-22 | Masimo Corporation | Display layout and interactive objects for patient monitoring |
| USD927699S1 (en) | 2019-10-18 | 2021-08-10 | Masimo Corporation | Electrode pad |
| WO2021081504A1 (en) * | 2019-10-24 | 2021-04-29 | The Trustees Of Columbia University In The City Of New York | System, method, and computer-accessible medium for visualization and analysis of electroencephalogram oscillations in the alpha band |
| CN115176155A (en) | 2019-10-25 | 2022-10-11 | 塞卡科实验室有限公司 | Indicator compounds, devices including indicator compounds, and methods of making and using the same |
| US11721105B2 (en) | 2020-02-13 | 2023-08-08 | Masimo Corporation | System and method for monitoring clinical activities |
| US11879960B2 (en) | 2020-02-13 | 2024-01-23 | Masimo Corporation | System and method for monitoring clinical activities |
| US20210296008A1 (en) | 2020-03-20 | 2021-09-23 | Masimo Corporation | Health monitoring system for limiting the spread of an infection in an organization |
| USD933232S1 (en) | 2020-05-11 | 2021-10-12 | Masimo Corporation | Blood pressure monitor |
| USD979516S1 (en) | 2020-05-11 | 2023-02-28 | Masimo Corporation | Connector |
| EP4157445A1 (en) * | 2020-05-27 | 2023-04-05 | Attune Neurosciences, Inc. | Ultrasound systems and associated devices and methods for modulating brain activity |
| USD980091S1 (en) | 2020-07-27 | 2023-03-07 | Masimo Corporation | Wearable temperature measurement device |
| USD974193S1 (en) | 2020-07-27 | 2023-01-03 | Masimo Corporation | Wearable temperature measurement device |
| USD946598S1 (en) | 2020-09-30 | 2022-03-22 | Masimo Corporation | Display screen or portion thereof with graphical user interface |
| USD946596S1 (en) | 2020-09-30 | 2022-03-22 | Masimo Corporation | Display screen or portion thereof with graphical user interface |
| USD946597S1 (en) | 2020-09-30 | 2022-03-22 | Masimo Corporation | Display screen or portion thereof with graphical user interface |
| JP2022059140A (en) | 2020-10-01 | 2022-04-13 | 株式会社Agama-X | Information processing device and program |
| US11769595B2 (en) * | 2020-10-01 | 2023-09-26 | Agama-X Co., Ltd. | Information processing apparatus and non-transitory computer readable medium |
| USD997365S1 (en) | 2021-06-24 | 2023-08-29 | Masimo Corporation | Physiological nose sensor |
| USD1000975S1 (en) | 2021-09-22 | 2023-10-10 | Masimo Corporation | Wearable temperature measurement device |
Citations (1)
| Publication number | Priority date | Publication date | Assignee | Title |
|---|---|---|---|---|
| US20110015538A1 (en) * | 2009-07-17 | 2011-01-20 | Matthews Jr Thomas Virgil | System and method for analyzing electroencephalography data |
Family Cites Families (13)
| Publication number | Priority date | Publication date | Assignee | Title |
|---|---|---|---|---|
| US6067467A (en) * | 1994-02-07 | 2000-05-23 | New York University | EEG operative and post-operative patient monitoring method |
| US6016444A (en) * | 1997-12-10 | 2000-01-18 | New York University | Automatic control of anesthesia using quantitative EEG |
| US6631291B2 (en) | 2001-05-18 | 2003-10-07 | Instrumentarium Corp. | Closed loop drug administration method and apparatus using EEG complexity for control purposes |
| RU2330607C2 (en) * | 2001-06-13 | 2008-08-10 | Компьюмедикс Лимитед | Methods and device for consciousness monitoring |
| US7089927B2 (en) * | 2002-10-23 | 2006-08-15 | New York University | System and method for guidance of anesthesia, analgesia and amnesia |
| US20060009733A1 (en) * | 2004-07-07 | 2006-01-12 | Martin James F | Bis closed loop anesthetic delivery |
| US7865235B2 (en) * | 2005-09-12 | 2011-01-04 | Tan Thi Thai Le | Method and system for detecting and classifying the mental state of a subject |
| US7725174B2 (en) * | 2006-06-28 | 2010-05-25 | The University Of Utah Research Foundation | Distinguishing different drug effects from the electroencephalogram |
| JP4978860B2 (en) | 2007-01-24 | 2012-07-18 | 株式会社国際電気通信基礎技術研究所 | Action prediction method and action prediction apparatus |
| AU2009217184B2 (en) * | 2008-02-20 | 2015-03-19 | Digital Medical Experts Inc. | Expert system for determining patient treatment response |
| US20110118620A1 (en) * | 2008-04-15 | 2011-05-19 | Christopher Scheib | Method and system for monitoring and displaying physiological conditions |
| RU95243U1 (en) * | 2010-02-12 | 2010-06-27 | Российская Федерация, от имени которой выступает Федеральное Агентство по науке и инновациям | DEVICE FOR ANESTHESIA LEVEL CONTROL |
| US9980662B2 (en) * | 2010-05-25 | 2018-05-29 | Neurowave Systems Inc. | Method and system for electrode impedance measurement |
-
2012
- 2012-05-07 MX MX2013012933A patent/MX2013012933A/en active IP Right Grant
- 2012-05-07 JP JP2014510399A patent/JP6109155B2/en active Active
- 2012-05-07 US US14/115,682 patent/US20140187973A1/en not_active Abandoned
- 2012-05-07 WO PCT/US2012/036854 patent/WO2012154701A1/en active Application Filing
- 2012-05-07 EP EP12781958.9A patent/EP2704630B1/en active Active
-
2018
- 2018-10-19 US US16/165,580 patent/US11751770B2/en active Active
Patent Citations (1)
| Publication number | Priority date | Publication date | Assignee | Title |
|---|---|---|---|---|
| US20110015538A1 (en) * | 2009-07-17 | 2011-01-20 | Matthews Jr Thomas Virgil | System and method for analyzing electroencephalography data |
Also Published As
| Publication number | Publication date |
|---|---|
| WO2012154701A1 (en) | 2012-11-15 |
| US11751770B2 (en) | 2023-09-12 |
| EP2704630A4 (en) | 2014-10-15 |
| US20140187973A1 (en) | 2014-07-03 |
| EP2704630A1 (en) | 2014-03-12 |
| US20190117085A1 (en) | 2019-04-25 |
| MX2013012933A (en) | 2014-02-27 |
| JP6109155B2 (en) | 2017-04-05 |
| JP2014515954A (en) | 2014-07-07 |
Similar Documents
| Publication | Publication Date | Title |
|---|---|---|
| US11751770B2 (en) | System and method for tracking brain states during administration of anesthesia | |
| Frauscher et al. | High‐frequency oscillations: the state of clinical research | |
| US20190374158A1 (en) | System and method for monitoring and controlling a state of a patient during and after administration of anesthetic compound | |
| US20200170575A1 (en) | Systems and methods to infer brain state during burst suppression | |
| US20140316217A1 (en) | System and method for monitoring anesthesia and sedation using measures of brain coherence and synchrony | |
| Ku et al. | Preferential inhibition of frontal-to-parietal feedback connectivity is a neurophysiologic correlate of general anesthesia in surgical patients | |
| EP2498676B1 (en) | Brain activity as a marker of disease | |
| US20140323898A1 (en) | System and Method for Monitoring Level of Dexmedatomidine-Induced Sedation | |
| EP2906112B1 (en) | System and method for monitoring and controlling a state of a patient during and after administration of anesthetic compound | |
| US20160324446A1 (en) | System and method for determining neural states from physiological measurements | |
| US20170231556A1 (en) | Systems and methods for predicting arousal to consciousness during general anesthesia and sedation | |
| Bernabei et al. | Quantitative approaches to guide epilepsy surgery from intracranial EEG | |
| Mari et al. | Continuous high‐frequency activity in mesial temporal lobe structures | |
| Gavaret et al. | EEG: Current relevance and promising quantitative analyses | |
| Meesters et al. | Modeling of intracerebral interictal epileptic discharges: evidence for network interactions | |
| Bandarabadi et al. | Robust and low complexity algorithms for seizure detection | |
| US20220142554A1 (en) | System and method for monitoring neural signals | |
| US20190142336A1 (en) | Systems and methods for determining response to anesthetic and sedative drugs using markers of brain function | |
| Demuru et al. | To resect or not to resect? Unbiased performances of single and combined biomarkers in intra-operative corticography for tailoring during epilepsy surgery | |
| US11786132B2 (en) | Systems and methods for predicting arousal to consciousness during general anesthesia and sedation | |
| Han et al. | Features and futures: seizure detection in partial epilepsies | |
| Lioi | EEG connectivity measures and their application to assess the depth of anaesthesia and sleep | |
| Wang | EEG-based automated seizure detection in patients with intellectual disability | |
| Avramov | The use of bispectral analysis in patients undergoing intravenous sedation for third molar extractions |
Legal Events
| Date | Code | Title | Description |
|---|---|---|---|
| PUAI | Public reference made under article 153(3) epc to a published international application that has entered the european phase |
Free format text: ORIGINAL CODE: 0009012 |
|
| 17P | Request for examination filed |
Effective date: 20131126 |
|
| AK | Designated contracting states |
Kind code of ref document: A1 Designated state(s): AL AT BE BG CH CY CZ DE DK EE ES FI FR GB GR HR HU IE IS IT LI LT LU LV MC MK MT NL NO PL PT RO RS SE SI SK SM TR |
|
| DAX | Request for extension of the european patent (deleted) | ||
| A4 | Supplementary search report drawn up and despatched |
Effective date: 20140915 |
|
| RIC1 | Information provided on ipc code assigned before grant |
Ipc: A61B 5/048 20060101ALI20140909BHEP Ipc: A61B 5/0476 20060101AFI20140909BHEP Ipc: G06F 19/00 20110101ALI20140909BHEP Ipc: A61B 5/00 20060101ALN20140909BHEP Ipc: A61B 5/02 20060101ALN20140909BHEP Ipc: A61B 5/0484 20060101ALN20140909BHEP |
|
| STAA | Information on the status of an ep patent application or granted ep patent |
Free format text: STATUS: EXAMINATION IS IN PROGRESS |
|
| 17Q | First examination report despatched |
Effective date: 20171005 |
|
| STAA | Information on the status of an ep patent application or granted ep patent |
Free format text: STATUS: EXAMINATION IS IN PROGRESS |
|
| STAA | Information on the status of an ep patent application or granted ep patent |
Free format text: STATUS: EXAMINATION IS IN PROGRESS |
|
| REG | Reference to a national code |
Ref country code: DE Ref legal event code: R079 Ref document number: 602012079882 Country of ref document: DE Free format text: PREVIOUS MAIN CLASS: A61B0005047600 Ipc: A61B0005372000 Ref country code: DE Ref legal event code: R079 Free format text: PREVIOUS MAIN CLASS: A61B0005047600 Ipc: A61B0005372000 |
|
| RIC1 | Information provided on ipc code assigned before grant |
Ipc: A61B 5/00 20060101ALN20221220BHEP Ipc: A61B 5/372 20210101AFI20221220BHEP |
|
| GRAP | Despatch of communication of intention to grant a patent |
Free format text: ORIGINAL CODE: EPIDOSNIGR1 |
|
| STAA | Information on the status of an ep patent application or granted ep patent |
Free format text: STATUS: GRANT OF PATENT IS INTENDED |
|
| RIC1 | Information provided on ipc code assigned before grant |
Ipc: A61B 5/00 19680901ALN20230110BHEP Ipc: A61B 5/372 20210101AFI20230110BHEP |
|
| INTG | Intention to grant announced |
Effective date: 20230207 |
|
| GRAS | Grant fee paid |
Free format text: ORIGINAL CODE: EPIDOSNIGR3 |
|
| GRAA | (expected) grant |
Free format text: ORIGINAL CODE: 0009210 |
|
| STAA | Information on the status of an ep patent application or granted ep patent |
Free format text: STATUS: THE PATENT HAS BEEN GRANTED |
|
| P01 | Opt-out of the competence of the unified patent court (upc) registered |
Effective date: 20230528 |
|
| AK | Designated contracting states |
Kind code of ref document: B1 Designated state(s): AL AT BE BG CH CY CZ DE DK EE ES FI FR GB GR HR HU IE IS IT LI LT LU LV MC MK MT NL NO PL PT RO RS SE SI SK SM TR |
|
| REG | Reference to a national code |
Ref country code: CH Ref legal event code: EP |
|
| REG | Reference to a national code |
Ref country code: IE Ref legal event code: FG4D |
|
| REG | Reference to a national code |
Ref country code: DE Ref legal event code: R096 Ref document number: 602012079882 Country of ref document: DE |
|
| REG | Reference to a national code |
Ref country code: LT Ref legal event code: MG9D |
|
| REG | Reference to a national code |
Ref country code: NL Ref legal event code: MP Effective date: 20230726 |
|
| REG | Reference to a national code |
Ref country code: AT Ref legal event code: MK05 Ref document number: 1590986 Country of ref document: AT Kind code of ref document: T Effective date: 20230726 |
|
| PG25 | Lapsed in a contracting state [announced via postgrant information from national office to epo] |
Ref country code: NL Free format text: LAPSE BECAUSE OF FAILURE TO SUBMIT A TRANSLATION OF THE DESCRIPTION OR TO PAY THE FEE WITHIN THE PRESCRIBED TIME-LIMIT Effective date: 20230726 |
|
| PG25 | Lapsed in a contracting state [announced via postgrant information from national office to epo] |
Ref country code: GR Free format text: LAPSE BECAUSE OF FAILURE TO SUBMIT A TRANSLATION OF THE DESCRIPTION OR TO PAY THE FEE WITHIN THE PRESCRIBED TIME-LIMIT Effective date: 20231027 |
|
| PG25 | Lapsed in a contracting state [announced via postgrant information from national office to epo] |
Ref country code: IS Free format text: LAPSE BECAUSE OF FAILURE TO SUBMIT A TRANSLATION OF THE DESCRIPTION OR TO PAY THE FEE WITHIN THE PRESCRIBED TIME-LIMIT Effective date: 20231126 |
|
| PG25 | Lapsed in a contracting state [announced via postgrant information from national office to epo] |
Ref country code: SE Free format text: LAPSE BECAUSE OF FAILURE TO SUBMIT A TRANSLATION OF THE DESCRIPTION OR TO PAY THE FEE WITHIN THE PRESCRIBED TIME-LIMIT Effective date: 20230726 Ref country code: RS Free format text: LAPSE BECAUSE OF FAILURE TO SUBMIT A TRANSLATION OF THE DESCRIPTION OR TO PAY THE FEE WITHIN THE PRESCRIBED TIME-LIMIT Effective date: 20230726 Ref country code: PT Free format text: LAPSE BECAUSE OF FAILURE TO SUBMIT A TRANSLATION OF THE DESCRIPTION OR TO PAY THE FEE WITHIN THE PRESCRIBED TIME-LIMIT Effective date: 20231127 Ref country code: NO Free format text: LAPSE BECAUSE OF FAILURE TO SUBMIT A TRANSLATION OF THE DESCRIPTION OR TO PAY THE FEE WITHIN THE PRESCRIBED TIME-LIMIT Effective date: 20231026 Ref country code: LV Free format text: LAPSE BECAUSE OF FAILURE TO SUBMIT A TRANSLATION OF THE DESCRIPTION OR TO PAY THE FEE WITHIN THE PRESCRIBED TIME-LIMIT Effective date: 20230726 Ref country code: LT Free format text: LAPSE BECAUSE OF FAILURE TO SUBMIT A TRANSLATION OF THE DESCRIPTION OR TO PAY THE FEE WITHIN THE PRESCRIBED TIME-LIMIT Effective date: 20230726 Ref country code: IS Free format text: LAPSE BECAUSE OF FAILURE TO SUBMIT A TRANSLATION OF THE DESCRIPTION OR TO PAY THE FEE WITHIN THE PRESCRIBED TIME-LIMIT Effective date: 20231126 Ref country code: HR Free format text: LAPSE BECAUSE OF FAILURE TO SUBMIT A TRANSLATION OF THE DESCRIPTION OR TO PAY THE FEE WITHIN THE PRESCRIBED TIME-LIMIT Effective date: 20230726 Ref country code: GR Free format text: LAPSE BECAUSE OF FAILURE TO SUBMIT A TRANSLATION OF THE DESCRIPTION OR TO PAY THE FEE WITHIN THE PRESCRIBED TIME-LIMIT Effective date: 20231027 Ref country code: FI Free format text: LAPSE BECAUSE OF FAILURE TO SUBMIT A TRANSLATION OF THE DESCRIPTION OR TO PAY THE FEE WITHIN THE PRESCRIBED TIME-LIMIT Effective date: 20230726 Ref country code: AT Free format text: LAPSE BECAUSE OF FAILURE TO SUBMIT A TRANSLATION OF THE DESCRIPTION OR TO PAY THE FEE WITHIN THE PRESCRIBED TIME-LIMIT Effective date: 20230726 |
|
| PG25 | Lapsed in a contracting state [announced via postgrant information from national office to epo] |
Ref country code: PL Free format text: LAPSE BECAUSE OF FAILURE TO SUBMIT A TRANSLATION OF THE DESCRIPTION OR TO PAY THE FEE WITHIN THE PRESCRIBED TIME-LIMIT Effective date: 20230726 |