EP2681932B1 - Audio processor for generating a reverberated signal from a direct signal and method therefor - Google Patents
Audio processor for generating a reverberated signal from a direct signal and method therefor Download PDFInfo
- Publication number
- EP2681932B1 EP2681932B1 EP12706815.3A EP12706815A EP2681932B1 EP 2681932 B1 EP2681932 B1 EP 2681932B1 EP 12706815 A EP12706815 A EP 12706815A EP 2681932 B1 EP2681932 B1 EP 2681932B1
- Authority
- EP
- European Patent Office
- Prior art keywords
- signal
- reverberation
- loudness
- signal component
- direct
- Prior art date
- Legal status (The legal status is an assumption and is not a legal conclusion. Google has not performed a legal analysis and makes no representation as to the accuracy of the status listed.)
- Active
Links
- 238000000034 method Methods 0.000 title claims description 35
- 230000005284 excitation Effects 0.000 claims description 18
- 230000008447 perception Effects 0.000 claims description 11
- 230000007246 mechanism Effects 0.000 claims description 9
- 238000004590 computer program Methods 0.000 claims description 8
- 238000001914 filtration Methods 0.000 claims description 8
- 230000004044 response Effects 0.000 claims description 6
- 230000002123 temporal effect Effects 0.000 claims description 6
- 238000012546 transfer Methods 0.000 claims description 5
- 238000006243 chemical reaction Methods 0.000 claims description 2
- 230000036961 partial effect Effects 0.000 description 35
- 239000000203 mixture Substances 0.000 description 31
- 238000012360 testing method Methods 0.000 description 23
- 230000006870 function Effects 0.000 description 13
- 238000012545 processing Methods 0.000 description 11
- 230000035807 sensation Effects 0.000 description 11
- 238000013459 approach Methods 0.000 description 10
- 230000000873 masking effect Effects 0.000 description 10
- 238000002474 experimental method Methods 0.000 description 9
- 230000000694 effects Effects 0.000 description 8
- 230000005236 sound signal Effects 0.000 description 8
- 238000012549 training Methods 0.000 description 8
- 230000013707 sensory perception of sound Effects 0.000 description 7
- 230000003247 decreasing effect Effects 0.000 description 6
- 230000010354 integration Effects 0.000 description 6
- 230000000875 corresponding effect Effects 0.000 description 5
- 230000007423 decrease Effects 0.000 description 5
- 238000012986 modification Methods 0.000 description 5
- 230000004048 modification Effects 0.000 description 5
- 230000007480 spreading Effects 0.000 description 5
- 230000001276 controlling effect Effects 0.000 description 4
- 230000001419 dependent effect Effects 0.000 description 4
- 238000011156 evaluation Methods 0.000 description 4
- 230000000763 evoking effect Effects 0.000 description 4
- 230000001965 increasing effect Effects 0.000 description 4
- 230000008569 process Effects 0.000 description 4
- 101100377797 Arabidopsis thaliana ABCC1 gene Proteins 0.000 description 3
- 238000012935 Averaging Methods 0.000 description 3
- 101150025806 Est1 gene Proteins 0.000 description 3
- 101000655352 Homo sapiens Telomerase reverse transcriptase Proteins 0.000 description 3
- 102100032938 Telomerase reverse transcriptase Human genes 0.000 description 3
- 238000004364 calculation method Methods 0.000 description 3
- 238000010586 diagram Methods 0.000 description 3
- 238000011835 investigation Methods 0.000 description 3
- 238000012417 linear regression Methods 0.000 description 3
- 238000003775 Density Functional Theory Methods 0.000 description 2
- 238000005094 computer simulation Methods 0.000 description 2
- 238000012937 correction Methods 0.000 description 2
- 238000009795 derivation Methods 0.000 description 2
- 230000002452 interceptive effect Effects 0.000 description 2
- 230000000670 limiting effect Effects 0.000 description 2
- 230000007774 longterm Effects 0.000 description 2
- 230000003595 spectral effect Effects 0.000 description 2
- 102000003712 Complement factor B Human genes 0.000 description 1
- 108090000056 Complement factor B Proteins 0.000 description 1
- 101710097688 Probable sphingosine-1-phosphate lyase Proteins 0.000 description 1
- 101710105985 Sphingosine-1-phosphate lyase Proteins 0.000 description 1
- 101710122496 Sphingosine-1-phosphate lyase 1 Proteins 0.000 description 1
- 238000007792 addition Methods 0.000 description 1
- 239000000654 additive Substances 0.000 description 1
- 230000000996 additive effect Effects 0.000 description 1
- 238000013528 artificial neural network Methods 0.000 description 1
- 230000008859 change Effects 0.000 description 1
- 230000002596 correlated effect Effects 0.000 description 1
- 238000002790 cross-validation Methods 0.000 description 1
- 230000001934 delay Effects 0.000 description 1
- 239000006185 dispersion Substances 0.000 description 1
- 210000000883 ear external Anatomy 0.000 description 1
- 210000000959 ear middle Anatomy 0.000 description 1
- 230000007613 environmental effect Effects 0.000 description 1
- 238000009499 grossing Methods 0.000 description 1
- 238000010606 normalization Methods 0.000 description 1
- 238000005192 partition Methods 0.000 description 1
- 238000011160 research Methods 0.000 description 1
- 238000005070 sampling Methods 0.000 description 1
- 238000005204 segregation Methods 0.000 description 1
- 238000011410 subtraction method Methods 0.000 description 1
- 230000001629 suppression Effects 0.000 description 1
- 230000002194 synthesizing effect Effects 0.000 description 1
- 238000011144 upstream manufacturing Methods 0.000 description 1
- 238000010200 validation analysis Methods 0.000 description 1
- 238000012795 verification Methods 0.000 description 1
- 238000011179 visual inspection Methods 0.000 description 1
Images


Classifications
-
- G—PHYSICS
- G10—MUSICAL INSTRUMENTS; ACOUSTICS
- G10K—SOUND-PRODUCING DEVICES; METHODS OR DEVICES FOR PROTECTING AGAINST, OR FOR DAMPING, NOISE OR OTHER ACOUSTIC WAVES IN GENERAL; ACOUSTICS NOT OTHERWISE PROVIDED FOR
- G10K15/00—Acoustics not otherwise provided for
- G10K15/08—Arrangements for producing a reverberation or echo sound
-
- H—ELECTRICITY
- H04—ELECTRIC COMMUNICATION TECHNIQUE
- H04S—STEREOPHONIC SYSTEMS
- H04S5/00—Pseudo-stereo systems, e.g. in which additional channel signals are derived from monophonic signals by means of phase shifting, time delay or reverberation
- H04S5/005—Pseudo-stereo systems, e.g. in which additional channel signals are derived from monophonic signals by means of phase shifting, time delay or reverberation of the pseudo five- or more-channel type, e.g. virtual surround
-
- H—ELECTRICITY
- H04—ELECTRIC COMMUNICATION TECHNIQUE
- H04S—STEREOPHONIC SYSTEMS
- H04S5/00—Pseudo-stereo systems, e.g. in which additional channel signals are derived from monophonic signals by means of phase shifting, time delay or reverberation
-
- G—PHYSICS
- G10—MUSICAL INSTRUMENTS; ACOUSTICS
- G10K—SOUND-PRODUCING DEVICES; METHODS OR DEVICES FOR PROTECTING AGAINST, OR FOR DAMPING, NOISE OR OTHER ACOUSTIC WAVES IN GENERAL; ACOUSTICS NOT OTHERWISE PROVIDED FOR
- G10K15/00—Acoustics not otherwise provided for
- G10K15/08—Arrangements for producing a reverberation or echo sound
- G10K15/12—Arrangements for producing a reverberation or echo sound using electronic time-delay networks
-
- H—ELECTRICITY
- H04—ELECTRIC COMMUNICATION TECHNIQUE
- H04R—LOUDSPEAKERS, MICROPHONES, GRAMOPHONE PICK-UPS OR LIKE ACOUSTIC ELECTROMECHANICAL TRANSDUCERS; DEAF-AID SETS; PUBLIC ADDRESS SYSTEMS
- H04R29/00—Monitoring arrangements; Testing arrangements
-
- H—ELECTRICITY
- H04—ELECTRIC COMMUNICATION TECHNIQUE
- H04S—STEREOPHONIC SYSTEMS
- H04S7/00—Indicating arrangements; Control arrangements, e.g. balance control
- H04S7/30—Control circuits for electronic adaptation of the sound field
-
- H—ELECTRICITY
- H04—ELECTRIC COMMUNICATION TECHNIQUE
- H04S—STEREOPHONIC SYSTEMS
- H04S2400/00—Details of stereophonic systems covered by H04S but not provided for in its groups
- H04S2400/13—Aspects of volume control, not necessarily automatic, in stereophonic sound systems
-
- H—ELECTRICITY
- H04—ELECTRIC COMMUNICATION TECHNIQUE
- H04S—STEREOPHONIC SYSTEMS
- H04S2420/00—Techniques used stereophonic systems covered by H04S but not provided for in its groups
- H04S2420/07—Synergistic effects of band splitting and sub-band processing
Definitions
- the present application is related to audio signal processing and, particularly, to audio processing usable in artificial reverberators.
- the determination of a measure for a perceived level of reverberation is, for example, desired for applications where an artificial reverberation processor is operated in an automated way and needs to adapt its parameters to the input signal such that the perceived level of the reverberation matches a target value. It is noted that the term reverberance while alluding to the same theme, does not appear to have a commonly accepted definition which makes it difficult to use as a quantitative measure in a listening test and prediction scenario.
- Artificial reverberation processors are often implemented as linear time-invariant systems and operated in a send-return signal path, as depicted in Fig. 6 , with pre-delay d, reverberation impulse response (RIR) and a scaling factor g for controlling the direct-to-reverberation ratio (DRR).
- RIR reverberation impulse response
- DRR direct-to-reverberation ratio
- parametric reverberation processors feature a variety of parameters, e.g. for controlling the shape and the density of the RIR, and the inter-channel coherence (ICC) of the RIRs for multi-channel processors in one or more frequency bands.
- Fig. 6 shows a direct signal x [ k ] input at an input 600, and this signal is forwarded to an adder 602 for adding this signal to a reverberation signal component r [ k ] output from a weighter 604, which receives, at its first input, a signal output by a reverberation filter 606 and which receives, at its second input, a gain factor g .
- the reverberation filter 606 may have an optional delay stage 608 connected upstream of the reverberation filter 606, but due to the fact that the reverberation filter 606 will include some delay by itself, the delay in block 608 can be included in the reverberation filter 606 so that the upper branch in Fig.
- a reverberation signal component is output by the filter 606 and this reverberation signal component can be modified by the multiplier 606 in response to the gain factor g in order to obtain the manipulated reverberation signal component r [ k ] which is then combined with the direct signal component input at 600 in order to finally obtain the mix signal m [ k ] at the output of the adder 602.
- reverberation filter refers to common implementations of artificial reverberations (either as convolution which is equivalent to FIR filtering, or as implementations using recursive structures, such as Feedback Delay Networks or networks of allpass filters and feedback comb filters or other recursive filters), but designates a general processing which produces a reverberant signal. Such processings may involve non-linear processes or time varying processes such as low-frequent modulations of signal amplitudes or delay lengths. In these cases the term “reverberation filter” would not apply in a strict technical sense of an Linear Time Invariant (LTI) system. In fact, the "reverberation filter” refers to a processing which outputs a reverberant signal, possibly including a mechanism for reading a computed or recorded reverberant signal from memory.
- LTI Linear Time Invariant
- the perceived characteristics of the reverberation depend on the temporal and spectral characteristics of the input signal [1]. Focusing on a very important sensation, namely loudness, it can be observed that the loudness of the perceived reverberation is monotonically related to the non-stationarity of the input signal. Intuitively speaking, an audio signal with large variations in its envelope excites the reverberation at high levels and allows it to become audible at lower levels. In a typical scenario where the long-term DRR expressed in decibels is positive, the direct signal can mask the reverberation signal almost completely at time instances where its energy envelope increases.
- the previously excited reverberation tail becomes apparent in gaps exceeding a minimum duration determined by the slope of the post-masking (at maximum 200 ms) and the integration time of the auditory system (at maximum 200 ms for moderate levels).
- Fig. 4a shows the time signal envelopes of a synthetic audio signal and of an artificially generated reverberation signal
- Fig. 4b shows predicted loudness and partial loudness functions computed with a computational model of loudness.
- An RIR with a short pre-delay of 50 ms is used here, omitting early reflections and synthesizing the late part of the reverberation with exponentially decaying white noise [2].
- the input signal has been generated from a harmonic wide-band signal and an envelope function such that one event with a short decay and a second event with a long decay are perceived. While the long event produces more total reverberation energy, it comes to no surprise that it is the short sound which is perceived as being more reverberant.
- Tsilfidis and Mourjopoulus investigated the use of a loudness model for the suppression of the late reverberation in single-channel recordings.
- An estimate of the direct signal is computed from the reverberant input signal using a spectral subtraction method, and a reverberation masking index is derived by means of a computational auditory masking model, which controls the reverberation processing.
- the generated reverberation is an artificial signal which when added to the signal at to low level is barely audible and when added at to high level leads to unnatural and unpleasant sounding final mixed signal.
- a certain reverberation filter might work very well for one kind of signals, but may have no audible effect or, even worse, can generate serious audible artifacts for a different kind of signals.
- reverberation is intended for the ear of an entity or individual, such as a human being and the final goal of generating a mix signal having a direct signal component and a reverberation signal component is that the entity perceives this mixed signal or "reverberated signal" as sounding well or as sounding natural.
- the auditory perception mechanism or the mechanism how sound is actually perceived by an individual is strongly non-linear, not only with respect to the bands in which the human hearing works, but also with respect to the processing of signals within the bands.
- the human perception of sound is not so much directed by the sound pressure level which can be calculated by, for example, squaring digital samples, but the perception is more controlled by a sense of loudness.
- the sensation of the loudness of the reverberation component depends not only on the kind of direct signal component, but also on the level or loudness of the direct signal component.
- D. GRIESINGER "Further investigation into the loudness of running reverberation", PROC. OF THE INSTITUTE OF ACOUSTICS (UK) CONFERENCE, (1995 ), discloses a calculation of the running reverberation (RR) as a log function of a quotient of a reverberation signal loudness and a direct signal loudness.
- Reverberant loudness depends on a ratio of the loudness of an event stream which contains musical notes being the direct stream and the stream which represents the background, i.e., the noise and reverberation.
- An object of the present invention is, therefore, to provide an audio processor or a method of processing an audio signal with improved characteristics. This object is achieved by an audio processor in accordance with claim 1, a method of generating a reverberated signal in accordance with claim 12 or a computer program in accordance with claim 13.
- the present invention is based on the finding that the measure for a perceived level of reverberation in a signal is determined by a loudness model processor comprising a perceptual filter stage for filtering a direct signal component, a reverberation signal component or a mix signal component using a perceptual filter in order to model an auditory perception mechanism of an entity.
- a loudness estimator estimates a first loudness measure using the filtered direct signal and a second loudness measure using the filtered reverberation signal or the filtered mix signal.
- a combiner combines the first measure and the second measure to obtain a measure for the perceived level of reverberation.
- a way of combining two different loudness measures preferably by calculating difference provides a quantitative value or a measure of how strong a sensation of the reverberation is compared to the sensation of the direct signal or the mix signal.
- the absolute loudness measures can be used and, particularly, the absolute loudness measures of the direct signal, the mixed signal or the reverberation signal.
- the partial loudness can also be calculated where the first loudness measure is determined by using the direct signal as the stimulus and the reverberation signal as noise in the loudness model and the second loudness measure is calculated by using the reverberation signal as the stimulus and the direct signal as the noise. Particularly, by combining these two measures in the combiner, a useful measure for a perceived level of reverberation is obtained.
- the loudness model processor provides a time/frequency conversion and acknowledges the ear transfer function together with the excitation pattern actually occurring in human hearing and modeled by hearing models.
- the measure for the perceived level of reverberation is forwarded to a predictor which actually provides the perceived level of reverberation in a useful scale such as the Sone-scale.
- This predictor is preferably trained by listening test data and the predictor parameters for a preferred linear predictor comprise a constant term and a scaling factor.
- the constant term preferably depends on the characteristic of the actually used reverberation filter and, in one embodiment of the reverberation filter characteristic parameter T 60 , which can be given for straightforward well-known reverberation filters used in artificial reverberators. Even when, however, this characteristic is not known, for example, when the reverberation signal component is not separately available, but has been separated from the mix signal before processing in the inventive apparatus, an estimation for the constant term can be derived.
- the perceived level of reverberation depends on both the input audio signal and the impulse response.
- Embodiments of the invention aim at quantifying this observation and predicting the perceived level of late reverberation based on separate signal paths of direct and reverberant signals, as they appear in digital audio effects.
- An approach to the problem is developed and subsequently extended by considering the impact of the reverberation time on the prediction result. This leads to a linear regression model with two input variables which is able to predict the perceived level with high accuracy, as shown on experimental data derived from listening tests. Variations of this model with different degrees of sophistication and computational complexity are compared regarding their accuracy.
- Applications include the control of digital audio effects for automatic mixing of audio signals.
- Embodiments of the present invention are not only useful for predicting the perceived level of reverberation in speech and music when the direct signal and the reverberation impulse response (RIR) are separately available.
- the present invention in which a reverberated signal occurs, can be applied as well.
- a direct/ambience or direct/reverberation separator would be included to separate the direct signal component and the reverberated signal component from the mix signal.
- Such an audio processor would then be useful to change the direct/reverberation ratio in this signal in order to generate a better sounding reverberated signal or better sounding mix signal.
- Fig. 1 illustrates an apparatus for determining a measure for a perceived level of reverberation in a mix signal comprising a direct signal component or dry signal component 100 and a reverberation signal component 102.
- the dry signal component 100 and the reverberation signal component 102 are input into a loudness model processor 104.
- the loudness model processor is configured for receiving the direct signal component 100 and the reverberation signal component 102 and is furthermore comprising a perceptual filter stage 104a and a subsequently connected loudness calculator 104b as illustrated in Fig. 2a .
- the loudness model processor generates, at its output, a first loudness measure 106 and a second loudness measure 108.
- Both loudness measures are input into a combiner 110 for combining the first loudness measure 106 and the second loudness measure 108 to finally obtain a measure 112 for the perceived level of reverberation.
- the measure for the perceived level 112 can be input into a predictor 114 for predicting the perceived level of reverberation based on an average value of at least two measures for the perceived loudness for different signal frames as will be discussed in the context of Fig. 9 .
- the predictor 114 in Fig. 1 is optional and actually transforms the measure for the perceived level into a certain value range or unit range such as the Sone-unit range which is useful for giving quantitative values related to loudness.
- the measure for the perceived level 112 which is not processed by the predictor 114 can be used as well, for example, in the audio processor of Fig. 8 , which does not necessarily have to rely on a value output by the predictor 114, but which can also directly process the measure for the perceived level 112, either in a direct form or preferably in a kind of a smoothed form where smoothing over time is preferred in order to not have strongly changing level corrections of the reverberated signal or, as discussed later on, of the gain factor g illustrated in Fig. 6 or illustrated in Fig. 8 .
- the perceptual filter stage is configured for filtering the direct signal component, the reverberation signal component or the mix signal component, wherein the perceptual filter stage is configured for modeling an auditory perception mechanism of an entity such as a human being to obtain a filtered direct signal, a filtered reverberation signal or a filtered mix signal.
- the perceptual filter stage may comprise two filters operating in parallel or can comprise a storage and a single filter since one and the same filter can actually be used for filtering each of the three signals, i.e., the reverberation signal, the mix signal and the direct signal.
- Fig. 2a illustrates n filters modeling the auditory perception mechanism, actually two filters will be enough or a single filter filtering two signals out of the group comprising the reverberation signal component, the mix signal component and the direct signal component.
- the loudness calculator 104b or loudness estimator is configured for estimating the first loudness-related measure using the filtered direct signal and for estimating the second loudness measure using the filtered reverberation signal or the filtered mix signal, where the mix signal is derived from a super position of the direct signal component and the reverberation signal component.
- Fig. 2c illustrates four preferred modes of calculating the measure for the perceived level of reverberation.
- Embodiment 1 relies on the partial loudness where both, the direct signal component x and the reverberation signal component r are used in the loudness model processor, but where, in order to determine the first measure EST1, the reverberation signal is used as the stimulus and the direct signal is used as the noise.
- the measure for the perceived level of correction generated by the combiner is a difference between the first loudness measure EST1 and the second loudness measure EST2.
- the loudness model processor 104 is operating in the frequency domain as discussed in more detail in Fig. 3 .
- the loudness model processor and, particularly, the loudness calculator 104b provides a first measure and a second measure for each band. These first measures over all n bands are subsequently added or combined together in an adder 104c for the first branch and 104d for the second branch in order to finally obtain a first measure for the broadband signal and a second measure for the broadband signal.
- Fig. 3 illustrates the preferred embodiment of the loudness model processor which has already been discussed in some aspects with respect to the Figs. 1 , 2a, 2b, 2c .
- the perceptual filter stage 104a comprises a time-frequency converter 300 for each branch, where, in the Fig. 3 embodiment, x [ k ] indicates the stimulus and n [ k ] indicates the noise.
- the time/frequency converted signal is forwarded into an ear transfer function block 302 (Please note that the ear transfer function can alternatively be computed prior to the time-frequency converter with similar results, but higher computational load) and the output of this block 302 is input into a compute excitation pattern block 304 followed by a temporal integration block 306.
- block 308 the specific loudness in this embodiment is calculated, where block 308 corresponds to the loudness calculator block 104b in Fig. 2a .
- an integration over frequency in block 310 is performed, where block 310 corresponds to the adder already described as 104c and 104d in Fig. 2b .
- block 310 generates the first measure for a first set of stimulus and noise and the second measure for a second set of stimulus and noise.
- the stimulus for calculating the first measure is the reverberation signal and the noise is the direct signal while, for calculating the second measure, the situation is changed and the stimulus is the direct signal component and the noise is the reverberation signal component.
- This section describes the implementation of a model of partial loudness, the listening test data that was used as ground truth for the computational prediction of the perceived level of reverberation, and a proposed prediction method which is based on the partial loudness model.
- Fig. 4b illustrates the total loudness and the partial loudness of its components of the example signal shown in Fig. 4a , computed with the loudness model used here.
- FIG. 3 A block diagram of the loudness model is shown in Fig. 3 .
- the input signals are processed in the frequency domain using a Short-time Fourier transform (STFT).
- STFT Short-time Fourier transform
- 6 DFTs of different lengths are used in order to obtain a good match for the frequency resolution and the temporal resolution to that of the human auditory system at all frequencies.
- only one DFT length is used for the sake of computational efficiency, with a frame length of 21 ms at a sampling rate of 48 kHz, 50% overlap and a Hann window function.
- the transfer through the outer and middle ear is simulated with a fixed filter.
- the excitation function is computed for 40 auditory filter bands spaced on the equivalent rectangular bandwidth (ERB) scale using a level dependent excitation pattern.
- ERB equivalent rectangular bandwidth
- a recursive integration is implemented with a time constant of 25 ms, which is only active at times where the excitation signal decays.
- Fig. 10 illustrates equations 17, 18, 19, 20 of the publication " A Model for the Prediction of Thresholds, Loudness and Partial Loudness", B.C.J. Moore, B.R. Glasberg, T. Baer, J. Audio Eng. Soc., Vol. 45, No. 4, April 1997 .
- This reference describes the case of a signal presented together with a background sound.
- the background may be any type of sound, it is referred to as “noise” in this reference to distinguish it from the signal whose loudness is to be judged.
- the presence of the noise reduces the loudness of the signal, an effect called partial masking.
- the loudness of the signal grows very rapidly when its level is increased from a threshold value to a value 20-30dB above threshold.
- N TOT ′ C E SIG + E NOISE G + A a ⁇ A a
- N TOT ′ N SIG ′ + N NOISE .
- N NOISE ′ C E NOISE G + A a ⁇ A a .
- N SIG ′ C E SIG + E NOISE G + A a ⁇ A a ⁇ C E NOISE G + A a ⁇ A a
- E THRN denote the peak excitation evoked by a sinusoidal signal when it is at its masked threshold in the background noise.
- E SIG is well below E THRN
- all the specific loudness is assigned to the noise, and the partial specific loudness of the signal approaches zero.
- E NOISE is well below E THRQ
- the partial specific loudness approaches the value it would have for a signal in quiet.
- the signal is at its masked threshold, with excitation E THRN , it is assumed that the partial specific loudness is equal to the value that would occur for a signal at the absolute threshold.
- the loudness of the signal approaches its unmasked value. Therefore, the partial specific loudness of the signal also approaches its unmasked value.
- N SIG ′ C ( E SIG + E NOISE ) G + A a ⁇ A a ⁇ C E THRN + E NOISE G + A a ⁇ E THRQ G + A a .
- N SIG ′ C E SIG + E NOISE G + A a ⁇ A a ⁇ C E NOISE 1 + K + E THRQ G + A a ⁇ E THRQ G + A a
- E SIG ⁇ E THRN the specific loudness would approach the value given in Equation 17 in Fig. 10 .
- E SIG is decreased to a value well below E THRN
- the specific loudness should rapidly become very small. This is achieved by Equation 18 in Fig. 10 .
- the first term in parenthesis determines the rate at which a specific loudness decreases as E SIG is decreased below E THRN . This describes the relationship between specific loudness and excitation for a signal in quiet when E SIG ⁇ E THRQ , except that E THRN has been substituted in Equation 18.
- the first term in braces ensures that the specific loudness approaches the value defined by Equation 17 of Fig. 10 as E SIG approaches E THRN .
- each listening test consisted of multiple graphical user interface screens which presented mixtures of different direct signals with different conditions of artificial reverberation. The listeners were asked to rate this perceived amount of reverberation on a scale from 0 to 100 points. In addition, two anchor signals were presented at 10 points and at 90 points. The listeners were asked to rate the perceived amount of reverberation on a scale from 0 to 100 points. In addition, two anchor signals were presented at 10 points and at 90 points. The anchor signals were created from the same direct signal with different conditions of reverberation.
- the direct signals used for creating the test items were monophonic recordings of speech, individual instruments and music of different genres with a length of about 4 seconds each. The majority of the items originated from anechoic recordings but also commercial recordings with a small amount of original reverberation were used.
- the RIRs represent late reverberation and were generated using exponentially decaying white noise with frequency dependent decay rates.
- the decay rates are chosen such that the reverberation time decreases from low to high frequencies, starting at a base reverberation time T 60 . Early reflections were neglected in this work.
- the reverberation signal r [ k ] and the direct signal x [ k ] were scaled and added such that the ratio of their average loudness measure according to ITU-R BS.1770 [16] matches a desired DRR and such that all test signal mixtures have equal long-term loudness. All participants in the tests were working in the field of audio and had experience with subjective listening tests.
- the ground truth data used for the training and the verification / testing of the prediction method were taken from two listening tests and are denoted by A and B, respectively.
- the data set A consisted of ratings of 14 listeners for 54 signals. The listeners repeated the test once and the mean rating was obtained from all of the 28 ratings for each item.
- the 54 signals were generated by combining 6 different direct signals and 9 stereophonic reverberation conditions, with T 60 ⁇ ⁇ 1,1.6,2.4 ⁇ s and DRR ⁇ ⁇ 3,7.5,12 ⁇ dB, and no pre-delay.
- the data in B were obtained from ratings of 14 listeners for 60 signals.
- the signals were generated using 15 direct signals and 36 reverberation conditions.
- the reverberation conditions sampled four parameters, namely T 60 , DRR, pre-delay, and ICC.
- T 60 time to which the signals were generated.
- DRR reverberation conditions were sampled.
- pre-delay a parameter that samples four parameters, namely T 60 , DRR, pre-delay, and ICC.
- ICC pre-delay
- the basic input feature for the prediction method is computed from the difference of the partial loudness N r,x [ k ] of the reverberation signal r [ k ] (with the direct signal x [ k ] being the interferer) and the loudness N x,r [ k ] of x [ k ] (where r [ k ] is the interferer), according to Equation 2.
- N r , x k N r , x k ⁇ N x , r k
- Equation (2) The rationale behind Equation (2) is that the difference ⁇ N r,x [ k ] is a measure of how strong the sensation of the reverberation is compared to the sensation of the direct signal. Taking the difference was also found to make the prediction result approximately invariant with respect to the playback level.
- the playback level has an impact on the investigated sensation [17, 8], but to a more subtle extent than reflected by the increase of the partial loudness N r,x with increasing playback level.
- musical recordings sound more reverberant at moderate to high levels (starting at about 75-80 dB SPL) than at about 12 to 20 dB lower levels. This effect is especially obvious in cases where the DRR is positive, which is valid "for nearly all recorded music" [18], but not in all cases for concert music where "listeners are often well beyond the critical distance" [6].
- the decrease of the perceived level of the reverberation with decreasing playback level is best explained by the fact that the dynamic range of reverberation is smaller than that of the direct sounds (or, a time-frequency representation of reverberation is more dense whereas a time-frequency representation of direct sounds is more sparse [19]). In such a scenario, the reverberation signal is more likely to fall below the threshold of hearing than the direct sounds do.
- equation (2) describes, as the combination operation, a difference between the two loudness measures N r,x [ k ] and N x,r [ k ]
- other combinations can be performed as well such as multiplications, divisions or even additions.
- the two alternatives indicated by the two loudness measures are combined in order to have influences of both alternatives in the result.
- the experiments have shown that the difference results in the best values from the model, i.e. in the results of the model which fit with the listening tests to a good extent, so that the difference is the preferred way of combining.
- the prediction methods described in the following are linear and use a least squares fit for the computation of the model coefficients.
- the simple structure of the predictor is advantageous in situations where the size of the data sets for training and testing the predictor is limited, which could lead to overfitting of the model when using regression methods with more degrees of freedom, e.g. neural networks.
- the model has only one independent variable, i.e. the mean of ⁇ N r,x [ k ] .
- the computation of the mean can be approximated using a leaky integrator.
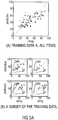
- Fig. 5a depicts the predicted sensations for data set A. It can be seen that the predictions are moderately correlated with the mean listener ratings with a correlation coefficient of 0.71. Please note that the choice of the regression coefficients does not affect this correlation. As shown in the lower plot, for each mixture generated by the same direct signals, the points exhibit a characteristic shape centered close to the diagonal. This shape indicates that although the baseline model R ⁇ b is able to predict R to some degree, it does not reflect the influence of T 60 on the ratings. The visual inspection of the data points suggests a linear dependency on T 60 .
- the results are shown in Fig. 5b separately for each of the data sets. The evaluation of the results is described in more detail in the next section.
- an averaging over more or less blocks can be performed as long as an averaging over at least two blocks takes place, although, due to the theory of linear equation, the best results may be obtained, when an averaging over the whole music piece up to a certain frame is performed.
- Fig. 9 additionally illustrates that the constant term is defined by a 0 and a 2 ⁇ T 60 .
- the second term a 2 ⁇ T60 has been selected in order to be in the position to apply this equation not only to a single reverberator, i.e., to a situation in which the filter 600 of Fig. 6 is not changed.
- This equation which, of course, is a constant term, but which depends on the actually used reverberation filters 606 of Fig. 6 provides, therefore, the flexibility to use exactly the same equation for other reverberation filters having other values of T 60 .
- T 60 is a parameter describing a certain reverberation filter and, particularly means that the reverberation energy has been decreased by 60dB from an initial maximum reverberation energy value.
- reverberation curves are decreasing with time and, therefore, T 60 indicates a time period, in which a reverberation energy generated by a signal excitation has decreased by 60dB.
- Similar results in terms of prediction accuracy are obtained by replacing T 60 by parameters representing similar information (that of the length of the RIR), e.g. T 30 .
- the models are evaluated using the correlation coefficient r, the mean absolute error ( MAE ) and the root mean squared error (RMSE ) between the mean listener ratings and the predicted sensation.
- the experiments are performed as two-fold cross-validation, i.e. the predictor is trained with data set A and tested with data set B, and the experiment is repeated with B for training and A for testing.
- the evaluation metrics obtained from both runs are averaged, separately for the training and the testing.
- the results are shown in Table 1 for the prediction models R ⁇ b and R ⁇ e . .
- the predictor R ⁇ e yields accurate results with an RMSE of 10.6 points.
- the comparison to the RMSE indicates that R ⁇ e is at least as accurate as the average listener in the listening test.
- Equation (5) is based on the assumption that the perceived level of the reverberation signal can be expressed as the difference (increase) in overall loudness which is caused by adding the reverb to the dry signal.
- Equation (2) loudness features using the differences of total loudness of the reverberation signal and the mixture signal or the direct signal, respectively, are defined in Equations (6) and (7).
- the measure for predicting the sensation is derived from as the loudness of the reverberation signal when listened to separately, with subtractive terms for modelling the partial masking and for normalization with respect to playback level derived from the mixture signal or the direct signal, respectively.
- Table 2 shows the results obtained with the features based on the total loudness and reveals that in fact two of them, ⁇ N m,x [ k ] and ⁇ N r-x [ k ] , yield predictions with nearly the same accuracy as R ⁇ e . But as shown in Table 2, even ⁇ N r-n [ k ] provides use for results.
- equations (5), (6) and (7) which indicate embodiments 2, 3, 4 of Fig. 2c illustrate that even without partial loudnesses, but with total loudnesses, for different combinations of signal components or signals, good values or measures for the perceived level of reverberation in a mix signal are obtained as well.
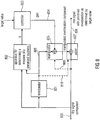
- Fig. 8 illustrates an embodiment of an audio processor for generating a reverberated signal from a direct signal component input at an input 800.
- the direct or dry signal component is input into a reverberator 801, which can be similar to the reverberator 606 in Fig. 6 .
- the dry signal component of input 800 is additionally input into an apparatus 802 for determining the measure for a perceived loudness which can be implemented as discussed in the context of Fig. 1 , Fig. 2a and 2c , 3 , 9 and 10 .
- the output of the apparatus 802 is the measure R for a perceived level of reverberation in a mix signal which is input into a controller 803.
- the controller 803 receives, at a further input, a target value for the measure of the perceived level of reverberation and calculates, from this target value and the actual value R again a value on output 804.
- This gain value is input into a manipulator 805 which is configured for manipulating, in this embodiment, the reverberation signal component 806 output by the reverberator 801.
- the apparatus 802 additionally receives the reverberation signal component 806 as discussed in the context of Fig. 1 and the other Figs. describing the apparatus for determining a measure of a perceived loudness.
- the output of the manipulator 805 is input into an adder 807, where the output of the manipulator comprises in the Fig. 8 embodiment the manipulated reverberation component and the output of the adder 807 indicates a mix signal 808 with a perceived reverberation as determined by the target value.
- the controller 803 can be configured to implement any of the control rules as defined in the art for feedback controls where the target value is a set value and the value R generated by the apparatus is an actual value and the gain 804 is selected so that the actual value R approaches the target value input into the controller 803.
- Fig. 8 is illustrated in that the reverberation signal is manipulated by the gain in the manipulator 805 which particularly comprises a multiplier or weighter, other implementations can be performed as well.
- One other implementation, for example, is that not the reverberation signal 806 but the dry signal component is manipulated by the manipulator as indicated by optional line 809.
- the non-manipulated reverberation signal component as output by the reverberator 801 would be input into the adder 807 as illustrated by optional line 810.
- a manipulation of the dry signal component and the reverberation signal component could be performed in order to introduce or set a certain measure of perceived loudness of the reverberation in the mix signal 808 output by the adder 807.
- the present invention provides a simple and robust prediction of the perceived level of reverberation and, specifically, late reverberation in speech and music using loudness models of varying computational complexity.
- the prediction modules have been trained and evaluated using subjective data derived from three listening tests.
- the use of a partial loudness model has lead to a prediction model with high accuracy when the T 60 of the RIR 606 of Fig. 6 is known.
- This result is also interesting from the perceptual point of view, when it is considered that the model of partial loudness was not originally developed with stimuli of direct and reverberant sound as discussed in the context of Fig. 10 .
- aspects have been described in the context of an apparatus, it is clear that these aspects also represent a description of the corresponding method, where a block or device corresponds to a method step or a feature of a method step. Analogously, aspects described in the context of a method step also represent a description of a corresponding block or item or feature of a corresponding apparatus.
- embodiments of the invention can be implemented in hardware or in software.
- the implementation can be performed using a digital storage medium, for example a floppy disk, a DVD, a CD, a ROM, a PROM, an EPROM, an EEPROM or a FLASH memory, having electronically readable control signals stored thereon, which cooperate (or are capable of cooperating) with a programmable computer system such that the respective method is performed.
- a digital storage medium for example a floppy disk, a DVD, a CD, a ROM, a PROM, an EPROM, an EEPROM or a FLASH memory, having electronically readable control signals stored thereon, which cooperate (or are capable of cooperating) with a programmable computer system such that the respective method is performed.
- Some embodiments according to the invention comprise a non-transitory or tangible data carrier having electronically readable control signals, which are capable of cooperating with a programmable computer system, such that one of the methods described herein is performed.
- embodiments of the present invention can be implemented as a computer program product with a program code, the program code being operative for performing one of the methods when the computer program product runs on a computer.
- the program code may for example be stored on a machine readable carrier.
- inventions comprise the computer program for performing one of the methods described herein, stored on a machine readable carrier.
- an embodiment of the inventive method is, therefore, a computer program having a program code for performing one of the methods described herein, when the computer program runs on a computer.
- a further embodiment of the inventive methods is, therefore, a data carrier (or a digital storage medium, or a computer-readable medium) comprising, recorded thereon, the computer program for performing one of the methods described herein.
- a programmable logic device for example a field programmable gate array
- a field programmable gate array may cooperate with a microprocessor in order to perform one of the methods described herein.
- the methods are preferably performed by any hardware apparatus.
Description
- The present application is related to audio signal processing and, particularly, to audio processing usable in artificial reverberators.
- The determination of a measure for a perceived level of reverberation is, for example, desired for applications where an artificial reverberation processor is operated in an automated way and needs to adapt its parameters to the input signal such that the perceived level of the reverberation matches a target value. It is noted that the term reverberance while alluding to the same theme, does not appear to have a commonly accepted definition which makes it difficult to use as a quantitative measure in a listening test and prediction scenario.
- Artificial reverberation processors are often implemented as linear time-invariant systems and operated in a send-return signal path, as depicted in
Fig. 6 , with pre-delay d, reverberation impulse response (RIR) and a scaling factor g for controlling the direct-to-reverberation ratio (DRR). When implemented as parametric reverberation processors, they feature a variety of parameters, e.g. for controlling the shape and the density of the RIR, and the inter-channel coherence (ICC) of the RIRs for multi-channel processors in one or more frequency bands. -
Fig. 6 shows a direct signal x[k] input at aninput 600, and this signal is forwarded to anadder 602 for adding this signal to a reverberation signal component r[k] output from aweighter 604, which receives, at its first input, a signal output by areverberation filter 606 and which receives, at its second input, a gain factor g. Thereverberation filter 606 may have anoptional delay stage 608 connected upstream of thereverberation filter 606, but due to the fact that thereverberation filter 606 will include some delay by itself, the delay inblock 608 can be included in thereverberation filter 606 so that the upper branch inFig. 6 can only comprise a single filter incorporating the delay and the reverberation or only incorporate the reverberation without any additional delay. A reverberation signal component is output by thefilter 606 and this reverberation signal component can be modified by themultiplier 606 in response to the gain factor g in order to obtain the manipulated reverberation signal component r[k] which is then combined with the direct signal component input at 600 in order to finally obtain the mix signal m[k] at the output of theadder 602. It is noted that the term "reverberation filter" refers to common implementations of artificial reverberations (either as convolution which is equivalent to FIR filtering, or as implementations using recursive structures, such as Feedback Delay Networks or networks of allpass filters and feedback comb filters or other recursive filters), but designates a general processing which produces a reverberant signal. Such processings may involve non-linear processes or time varying processes such as low-frequent modulations of signal amplitudes or delay lengths. In these cases the term "reverberation filter" would not apply in a strict technical sense of an Linear Time Invariant (LTI) system. In fact, the "reverberation filter" refers to a processing which outputs a reverberant signal, possibly including a mechanism for reading a computed or recorded reverberant signal from memory. - These parameters have an impact on the resulting audio signal in terms of perceived level, distance, room size, coloration and sound quality. Furthermore, the perceived characteristics of the reverberation depend on the temporal and spectral characteristics of the input signal [1]. Focusing on a very important sensation, namely loudness, it can be observed that the loudness of the perceived reverberation is monotonically related to the non-stationarity of the input signal. Intuitively speaking, an audio signal with large variations in its envelope excites the reverberation at high levels and allows it to become audible at lower levels. In a typical scenario where the long-term DRR expressed in decibels is positive, the direct signal can mask the reverberation signal almost completely at time instances where its energy envelope increases. On the other hand, whenever the signal ends, the previously excited reverberation tail becomes apparent in gaps exceeding a minimum duration determined by the slope of the post-masking (at maximum 200 ms) and the integration time of the auditory system (at maximum 200 ms for moderate levels).
- To illustrate this,
Fig. 4a shows the time signal envelopes of a synthetic audio signal and of an artificially generated reverberation signal, andFig. 4b shows predicted loudness and partial loudness functions computed with a computational model of loudness. An RIR with a short pre-delay of 50 ms is used here, omitting early reflections and synthesizing the late part of the reverberation with exponentially decaying white noise [2]. The input signal has been generated from a harmonic wide-band signal and an envelope function such that one event with a short decay and a second event with a long decay are perceived. While the long event produces more total reverberation energy, it comes to no surprise that it is the short sound which is perceived as being more reverberant. Where the decaying slope of the longer event masks the reverberation, the short sound already disappeared before the reverberation has built up and thereby a gap is open in which the reverberation is perceived. Please note that the definition of masking used here includes both complete and partial masking [3]. - Although such observations have been made many times [4, 5, 6], it is still worth emphasizing them because it illustrates qualitatively why models of partial loudness can be applied in the context of this work. In fact, it has been pointed out that the perception of reverberation arises from stream segregation processes in the auditory system [4, 5, 6] and is influenced by the partial masking of the reverberation due to the direct sound.
- The considerations above motivate the use of loudness models. Related investigations were performed by Lee et al. and focus on the prediction of the subjective decay rate of RIRs when listening to them directly [7] and on the effect of the playback level on reverberance [8]. A predictor for reverberance using loudness-based early decay times is proposed in [9]. In contrast to this work, the prediction methods proposed here process the direct signal and the reverberation signal with a computational model of partial loudness (and with simplified versions of it in the quest for low-complexity implementations) and thereby consider the influence of the input (direct) signal on the sensation. Recently, Tsilfidis and Mourjopoulus [10] investigated the use of a loudness model for the suppression of the late reverberation in single-channel recordings. An estimate of the direct signal is computed from the reverberant input signal using a spectral subtraction method, and a reverberation masking index is derived by means of a computational auditory masking model, which controls the reverberation processing.
- It is a feature of a multi-channel synthesizers and other devices to add reverberation in order to make the sound better from a perceptual point of view. On the other hand, the generated reverberation is an artificial signal which when added to the signal at to low level is barely audible and when added at to high level leads to unnatural and unpleasant sounding final mixed signal. What makes things even worse is that, as discussed in the context of
Fig. 4a and4b that the perceived level of reverberation is strongly signal-dependent and, therefore, a certain reverberation filter might work very well for one kind of signals, but may have no audible effect or, even worse, can generate serious audible artifacts for a different kind of signals. - An additional problem related to reverberation is that the reverberated signal is intended for the ear of an entity or individual, such as a human being and the final goal of generating a mix signal having a direct signal component and a reverberation signal component is that the entity perceives this mixed signal or "reverberated signal" as sounding well or as sounding natural. However, the auditory perception mechanism or the mechanism how sound is actually perceived by an individual is strongly non-linear, not only with respect to the bands in which the human hearing works, but also with respect to the processing of signals within the bands. Additionally, it is known that the human perception of sound is not so much directed by the sound pressure level which can be calculated by, for example, squaring digital samples, but the perception is more controlled by a sense of loudness. Additionally, for mixed signals, which include a direct component and a reverberation signal component, the sensation of the loudness of the reverberation component depends not only on the kind of direct signal component, but also on the level or loudness of the direct signal component.
- Therefore, there exists a need for determining a measure for a perceived level of reverberation in a signal consisting of a direct signal component and a reverberation signal component in order to cope with the above problems related with the auditory perception mechanism of an entity.
- D. GRIESINGER, "Further investigation into the loudness of running reverberation", PROC. OF THE INSTITUTE OF ACOUSTICS (UK) CONFERENCE, (1995), discloses a calculation of the running reverberation (RR) as a log function of a quotient of a reverberation signal loudness and a direct signal loudness. Reverberant loudness depends on a ratio of the loudness of an event stream which contains musical notes being the direct stream and the stream which represents the background, i.e., the noise and reverberation. MOORE B C J ET AL, "A MODEL FOR THE PREDICTION OF THRESHOLDS, LOUDNESS, AND PARTIAL LOUDNESS", JOURNAL OF THE AUDIO ENGINEERING SOCIETY, AUDIO ENGINEERING SOCIETY, NEW YORK, NY, US, (19970401), vol. 45, no. 4, ISSN 1549-4950, pages 224 - 240, discloses a loudness model for steady state sounds.
- An object of the present invention is, therefore, to provide an audio processor or a method of processing an audio signal with improved characteristics. This object is achieved by an audio processor in accordance with
claim 1, a method of generating a reverberated signal in accordance with claim 12 or a computer program in accordance with claim 13. - The present invention is based on the finding that the measure for a perceived level of reverberation in a signal is determined by a loudness model processor comprising a perceptual filter stage for filtering a direct signal component, a reverberation signal component or a mix signal component using a perceptual filter in order to model an auditory perception mechanism of an entity. Based on the perceptually filtered signals, a loudness estimator estimates a first loudness measure using the filtered direct signal and a second loudness measure using the filtered reverberation signal or the filtered mix signal. Then, a combiner combines the first measure and the second measure to obtain a measure for the perceived level of reverberation. Particularly, a way of combining two different loudness measures preferably by calculating difference provides a quantitative value or a measure of how strong a sensation of the reverberation is compared to the sensation of the direct signal or the mix signal.
- For calculating the loudness measures, the absolute loudness measures can be used and, particularly, the absolute loudness measures of the direct signal, the mixed signal or the reverberation signal. Alternatively, the partial loudness can also be calculated where the first loudness measure is determined by using the direct signal as the stimulus and the reverberation signal as noise in the loudness model and the second loudness measure is calculated by using the reverberation signal as the stimulus and the direct signal as the noise. Particularly, by combining these two measures in the combiner, a useful measure for a perceived level of reverberation is obtained. It has been found out by the inventors that such useful measure cannot be determined alone by generating a single loudness measure, for example, by using the direct signal alone or the mix signal alone or the reverberation signal alone. Instead, due to the inter-dependencies in human hearing, combining measures which are derived differently from either of these three signals, the perceived level of reverberation in a signal can be determined or modeled with a high degree of accuracy.
- Preferably, the loudness model processor provides a time/frequency conversion and acknowledges the ear transfer function together with the excitation pattern actually occurring in human hearing and modeled by hearing models.
- In a preferred embodiment, the measure for the perceived level of reverberation is forwarded to a predictor which actually provides the perceived level of reverberation in a useful scale such as the Sone-scale. This predictor is preferably trained by listening test data and the predictor parameters for a preferred linear predictor comprise a constant term and a scaling factor. The constant term preferably depends on the characteristic of the actually used reverberation filter and, in one embodiment of the reverberation filter characteristic parameter T60, which can be given for straightforward well-known reverberation filters used in artificial reverberators. Even when, however, this characteristic is not known, for example, when the reverberation signal component is not separately available, but has been separated from the mix signal before processing in the inventive apparatus, an estimation for the constant term can be derived.
- Subsequently, preferred embodiments of the present invention are described with respect to the accompanying drawings, in which:
- Fig. 1
- is a block diagram for an apparatus or method for determining a measure for a perceived level of reverberation;
- Fig. 2a
- is an illustration of a loudness model processor used in a preferred embodiment of the invention;
- Fig. 2b
- illustrates a further preferred implementation of the loudness model processor;
- Fig. 3
- illustrates a further preferred implementation of the loudness model processor;
- Fig. 4a,b
- illustrate examples of time signal envelopes and a corresponding loudness and partial loudness;
- Fig. 5a,b
- illustrate information on experimental data for training the predictor;
- Fig. 6
- illustrates a block diagram of an artificial reverberation processor;
- Fig. 7
- illustrates three tables for indicating evaluation metrics for embodiments of the invention;
- Fig. 8
- illustrates an audio signal processor implemented for using the measure for a perceived level of reverberation for the purpose of artificial reverberation in accordance with an embodiment of the present invention;
- Fig. 9
- illustrates a preferred implementation of the predictor relying on time-averaged perceived levels of reverberation; and
- Fig. 10
- illustrates the equations from the Moore Glasberg, Baer publication of 1997 used in a preferred embodiment for calculating the specific loudness.
- The perceived level of reverberation depends on both the input audio signal and the impulse response. Embodiments of the invention aim at quantifying this observation and predicting the perceived level of late reverberation based on separate signal paths of direct and reverberant signals, as they appear in digital audio effects. An approach to the problem is developed and subsequently extended by considering the impact of the reverberation time on the prediction result. This leads to a linear regression model with two input variables which is able to predict the perceived level with high accuracy, as shown on experimental data derived from listening tests. Variations of this model with different degrees of sophistication and computational complexity are compared regarding their accuracy. Applications include the control of digital audio effects for automatic mixing of audio signals.
- Embodiments of the present invention are not only useful for predicting the perceived level of reverberation in speech and music when the direct signal and the reverberation impulse response (RIR) are separately available. In other embodiments, in which a reverberated signal occurs, the present invention can be applied as well. In this instance, however, a direct/ambience or direct/reverberation separator would be included to separate the direct signal component and the reverberated signal component from the mix signal. Such an audio processor would then be useful to change the direct/reverberation ratio in this signal in order to generate a better sounding reverberated signal or better sounding mix signal.
-
Fig. 1 illustrates an apparatus for determining a measure for a perceived level of reverberation in a mix signal comprising a direct signal component ordry signal component 100 and areverberation signal component 102. Thedry signal component 100 and thereverberation signal component 102 are input into aloudness model processor 104. The loudness model processor is configured for receiving thedirect signal component 100 and thereverberation signal component 102 and is furthermore comprising aperceptual filter stage 104a and a subsequently connectedloudness calculator 104b as illustrated inFig. 2a . The loudness model processor generates, at its output, afirst loudness measure 106 and asecond loudness measure 108. Both loudness measures are input into acombiner 110 for combining thefirst loudness measure 106 and thesecond loudness measure 108 to finally obtain ameasure 112 for the perceived level of reverberation. Depending on the implementation, the measure for the perceivedlevel 112 can be input into apredictor 114 for predicting the perceived level of reverberation based on an average value of at least two measures for the perceived loudness for different signal frames as will be discussed in the context ofFig. 9 . However, thepredictor 114 inFig. 1 is optional and actually transforms the measure for the perceived level into a certain value range or unit range such as the Sone-unit range which is useful for giving quantitative values related to loudness. However, other usages for the measure for the perceivedlevel 112 which is not processed by thepredictor 114 can be used as well, for example, in the audio processor ofFig. 8 , which does not necessarily have to rely on a value output by thepredictor 114, but which can also directly process the measure for the perceivedlevel 112, either in a direct form or preferably in a kind of a smoothed form where smoothing over time is preferred in order to not have strongly changing level corrections of the reverberated signal or, as discussed later on, of the gain factor g illustrated inFig. 6 or illustrated inFig. 8 . - Particularly, the perceptual filter stage is configured for filtering the direct signal component, the reverberation signal component or the mix signal component, wherein the perceptual filter stage is configured for modeling an auditory perception mechanism of an entity such as a human being to obtain a filtered direct signal, a filtered reverberation signal or a filtered mix signal. Depending on the implementation, the perceptual filter stage may comprise two filters operating in parallel or can comprise a storage and a single filter since one and the same filter can actually be used for filtering each of the three signals, i.e., the reverberation signal, the mix signal and the direct signal. In this context, however, it is to be noted that, although
Fig. 2a illustrates n filters modeling the auditory perception mechanism, actually two filters will be enough or a single filter filtering two signals out of the group comprising the reverberation signal component, the mix signal component and the direct signal component. - The
loudness calculator 104b or loudness estimator is configured for estimating the first loudness-related measure using the filtered direct signal and for estimating the second loudness measure using the filtered reverberation signal or the filtered mix signal, where the mix signal is derived from a super position of the direct signal component and the reverberation signal component. -
Fig. 2c illustrates four preferred modes of calculating the measure for the perceived level of reverberation.Embodiment 1 relies on the partial loudness where both, the direct signal component x and the reverberation signal component r are used in the loudness model processor, but where, in order to determine the first measure EST1, the reverberation signal is used as the stimulus and the direct signal is used as the noise. For determining the second loudness measure EST2, the situation is changed, and the direct signal component is used as a stimulus and the reverberation signal component is used as the noise. Then, the measure for the perceived level of correction generated by the combiner is a difference between the first loudness measure EST1 and the second loudness measure EST2. - However, other computationally efficient embodiments additionally exist which are indicated at
lines Fig. 2c . These more computationally efficient measures rely on calculating the total loudness of three signals comprising the mix signal m, the direct signal x and the reverberation signal r. Depending on the required calculation performed by the combiner indicated in the last column ofFig. 2c , the first loudness measure EST1 is the total loudness of the mix signal or the reverberation signal and the second loudness measure EST2 is the total loudness of the direct signal component x or the mix signal component m, where the actual combinations are as illustrated inFig. 2c . - In a further embodiment, the
loudness model processor 104 is operating in the frequency domain as discussed in more detail inFig. 3 . In such a situation, the loudness model processor and, particularly, theloudness calculator 104b provides a first measure and a second measure for each band. These first measures over all n bands are subsequently added or combined together in anadder 104c for the first branch and 104d for the second branch in order to finally obtain a first measure for the broadband signal and a second measure for the broadband signal. -
Fig. 3 illustrates the preferred embodiment of the loudness model processor which has already been discussed in some aspects with respect to theFigs. 1 ,2a, 2b, 2c . Particularly, theperceptual filter stage 104a comprises a time-frequency converter 300 for each branch, where, in theFig. 3 embodiment, x[k] indicates the stimulus and n[k] indicates the noise. The time/frequency converted signal is forwarded into an ear transfer function block 302 (Please note that the ear transfer function can alternatively be computed prior to the time-frequency converter with similar results, but higher computational load) and the output of thisblock 302 is input into a compute excitation pattern block 304 followed by atemporal integration block 306. Then, inblock 308, the specific loudness in this embodiment is calculated, where block 308 corresponds to theloudness calculator block 104b inFig. 2a . Subsequently, an integration over frequency inblock 310 is performed, where block 310 corresponds to the adder already described as 104c and 104d inFig. 2b . It is to be noted thatblock 310 generates the first measure for a first set of stimulus and noise and the second measure for a second set of stimulus and noise. Particularly, whenFig. 2b is considered, the stimulus for calculating the first measure is the reverberation signal and the noise is the direct signal while, for calculating the second measure, the situation is changed and the stimulus is the direct signal component and the noise is the reverberation signal component. Hence, for generating two different loudness measures, the procedure illustrated inFig. 3 has been performed twice. However, changes in the calculation only occur inblock 308 which operates differently as discussed furthermore in the context ofFig. 10 , so that the steps illustrated byblocks 300 to 306 only have to be performed once, and the result of thetemporal integration block 306 can be stored in order to compute the first estimated loudness and the second estimated loudness forembodiment 1 inFig. 2c . It is to be noted that, for theother embodiments Fig. 3 , block 308 is replaced by an individual block "compute total loudness" for each branch, where, in this embodiment it is indifferent, whether one signal is considered to be a stimulus or a noise. - Subsequently, the loudness model illustrated in
Fig. 3 is discussed in more detail. - The implementation of the loudness model in
Fig. 3 follows the descriptions in [11, 12] with modifications as detailed later on. The training and the validation of the prediction uses data from listening tests described in [13] and briefly summarized later. The application of the loudness model for predicting the perceived level of late reverberation is described later on as well. Experimental results follow. - This section describes the implementation of a model of partial loudness, the listening test data that was used as ground truth for the computational prediction of the perceived level of reverberation, and a proposed prediction method which is based on the partial loudness model.
- The loudness model computes the partial loudness Nx,n [k] of a signal x[k] when presented simultaneously with a masking signal n[k]

- Although early models have dealt with the perception of loudness in steady background noise, some work exists on loudness perception in backgrounds of co-modulated random noise [14], complex environmental sounds [12], and music signals [15].
Fig. 4b illustrates the total loudness and the partial loudness of its components of the example signal shown inFig. 4a , computed with the loudness model used here. - The model used in this work is similar to the models in [11, 12] which itself drew on earlier research by Fletcher, Munson, Stevens, and Zwicker, with some modifications as described in the following. A block diagram of the loudness model is shown in
Fig. 3 . The input signals are processed in the frequency domain using a Short-time Fourier transform (STFT). In [12], 6 DFTs of different lengths are used in order to obtain a good match for the frequency resolution and the temporal resolution to that of the human auditory system at all frequencies. In this work, only one DFT length is used for the sake of computational efficiency, with a frame length of 21 ms at a sampling rate of 48 kHz, 50% overlap and a Hann window function. The transfer through the outer and middle ear is simulated with a fixed filter. The excitation function is computed for 40 auditory filter bands spaced on the equivalent rectangular bandwidth (ERB) scale using a level dependent excitation pattern. In addition to the temporal integration due to the windowing of the STFT, a recursive integration is implemented with a time constant of 25 ms, which is only active at times where the excitation signal decays. - The specific partial loudness, i.e., the partial loudness evoked in each of the auditory filter band, is computed from the excitation levels from the signal of interest (the stimulus) and the interfering noise according to Equations (17)-(20) in [11], illustrated in
Fig. 10 . These equations cover the four cases where the signal is above the hearing threshold in noise or not, and where the excitation of the mixture signal is less than 100 dB or not. If no interfering signal is fed into the model, i.e. n[k] = 0, the result equals the total loudness Nx [k] of the stimulus x[k]. - Particularly,
Fig. 10 illustratesequations 
- It is assumed that the listener can partition a specific loudness at a given center frequency between the specific loudness of the signal and that of the noise, but in a way that prefers the total specific loudness.

- This assumption is consistent, since in most experiments measuring partial masking, the listener hears first the noise alone and then the noise plus signal. The specific loudness for the noise alone, assuming that it is above threshold, is

- Hence, if the specific loudness of the signal were derived simply by subjecting the specific loudness of the noise from the total specific loudness, the result would be

- In practice, the way that specific loudness is partitioned between signal and noise appears to vary depending on the relative excitation of the signal and the noise.
- Four situations are considered that indicate how specific loudness is assigned at different signal levels. Let E THRN denote the peak excitation evoked by a sinusoidal signal when it is at its masked threshold in the background noise. When E SIG is well below E THRN, all the specific loudness is assigned to the noise, and the partial specific loudness of the signal approaches zero. Second, when E NOISE is well below E THRQ, the partial specific loudness approaches the value it would have for a signal in quiet. Third, when the signal is at its masked threshold, with excitation E THRN, it is assumed that the partial specific loudness is equal to the value that would occur for a signal at the absolute threshold. Finally, when a signal is centered in narrow-band noise is well above its masked threshold, the loudness of the signal approaches its unmasked value. Therefore, the partial specific loudness of the signal also approaches its unmasked value.
- Consider the implications of these various boundary conditions. At masked threshold, the specific loudness equal that for a signal at threshold in quiet. This specific loudness is less than it would be predicted from the above equation, presumably because some of the specific loudness of the signal is assigned to the noise. In order to obtain the correct specific loudness for the signal, it is assumed that the specific loudness assigned to the noise is increased by the factor B, where

- Applying this factor to the second term in the above equation for N'SIG gives

- It is assumed that when the signal is at masked threshold, its peak excitation E THRN is equal to KE NOISE+E THRQ, where K is the signal-to-noise ratio at the output of the auditory filter required for threshold at higher masker levels. Recent estimates of K, obtained for masking experiments using notched noise, suggest that K increases markedly at very low frequencies, becoming greater than unity. In the reference, the value of K is estimated as a function of frequency. The value decreases from high levels at low frequencies to constant low levels at higher frequencies. Unfortunately, there are no estimates for K for center frequencies below 100 Hz, so values from 50 to 100 Hz substituting E THRN in the above equation results in:

- When E SIG=E THRN, this equation specifies the peak specific loudness for a signal at the absolute threshold in quiet.
- When the signal is well above its masked threshold, that is, when E SIG>>E THRN, the specific loudness of the signal approaches the value that it would have when no background noise is present. This means that the specific loudness assigned to the noise becomes vanishingly small. To accommodate this, the above equation is modified by introducing an extra term which depends on the ratio E THRN / E SIG. This term decreases as E E SIG is increased above the value corresponding to masked threshold. Hence, the above equation becomes
equation 17 onFig. 10 . - This is the final equation for

- Subsequently, the situation is considered where E SIG<E THRN. In the limiting case where E SIG is just below E THRN, the specific loudness would approach the value given in
Equation 17 inFig. 10 . When E SIG is decreased to a value well below E THRN, the specific loudness should rapidly become very small. This is achieved byEquation 18 inFig. 10 . The first term in parenthesis determines the rate at which a specific loudness decreases as E SIG is decreased below E THRN. This describes the relationship between specific loudness and excitation for a signal in quiet when E SIG<E THRQ, except that E THRN has been substituted inEquation 18. The first term in braces ensures that the specific loudness approaches the value defined byEquation 17 ofFig. 10 as E SIG approaches E THRN. - The equations for partial loudness described so far apply when E SIG+E NOISE<1010. By applying the same reasoning as used for the derivation of equation (17) of
Fig. 10 , any equation can be derived for the case E NOISE≥E THRN and E SIG+E NOISE>1010 as outlined inequation 19 inFig. 10 . C2=C/(1.04x106)0.5. Similarly, by applying the same reasoning as used for the derivation of equation (18) ofFig. 10 , an equation can be derived for the case where E SIG<E THRN and E SIG+E NOISE>1010 as outlined inequation 20 inFig. 10 . - The following points are to be noted. This prior art model is applied for the present invention where, in a first run, SIG corresponds to for example, the direct signal as the "stimulus" and Noise corresponds to for example the reverberation signal or the mix signal as the "noise". In the second run as discussed in the context of the first embodiment in
Fig. 2c , SIG would then correspond to the reverberation signal as the "stimulus" and "noise" would correspond to the direct signal. Then, the two loudness measures are obtained which are then combined by the combiner preferably by forming a difference. - In order to assess the suitability of the described loudness model for the task of predicting the perceived level of the late reverberation, a corpus of ground truth generated from listener responses is preferred. To this end, data from an investigation featuring several listening test [13] is used in this paper which is briefly summarized in the following. Each listening test consisted of multiple graphical user interface screens which presented mixtures of different direct signals with different conditions of artificial reverberation. The listeners were asked to rate this perceived amount of reverberation on a scale from 0 to 100 points. In addition, two anchor signals were presented at 10 points and at 90 points. The listeners were asked to rate the perceived amount of reverberation on a scale from 0 to 100 points. In addition, two anchor signals were presented at 10 points and at 90 points. The anchor signals were created from the same direct signal with different conditions of reverberation.
- The direct signals used for creating the test items were monophonic recordings of speech, individual instruments and music of different genres with a length of about 4 seconds each. The majority of the items originated from anechoic recordings but also commercial recordings with a small amount of original reverberation were used.
- The RIRs represent late reverberation and were generated using exponentially decaying white noise with frequency dependent decay rates. The decay rates are chosen such that the reverberation time decreases from low to high frequencies, starting at a base reverberation time T 60. Early reflections were neglected in this work. The reverberation signal r[k] and the direct signal x[k] were scaled and added such that the ratio of their average loudness measure according to ITU-R BS.1770 [16] matches a desired DRR and such that all test signal mixtures have equal long-term loudness. All participants in the tests were working in the field of audio and had experience with subjective listening tests.
- The ground truth data used for the training and the verification / testing of the prediction method were taken from two listening tests and are denoted by A and B, respectively. The data set A consisted of ratings of 14 listeners for 54 signals. The listeners repeated the test once and the mean rating was obtained from all of the 28 ratings for each item. The 54 signals were generated by combining 6 different direct signals and 9 stereophonic reverberation conditions, with T 60 ∈ {1,1.6,2.4} s and DRR ∈ {3,7.5,12} dB, and no pre-delay.
- The data in B were obtained from ratings of 14 listeners for 60 signals. The signals were generated using 15 direct signals and 36 reverberation conditions. The reverberation conditions sampled four parameters, namely T 60, DRR, pre-delay, and ICC. For each
direct signal 4 RIRs were chosen such that two had no pre-delay and two had a short pre-delay of 50 ms, and two were monophonic and two were stereophonic. - Subsequently, further features of a preferred embodiment of the
combiner 110 inFig. 1 are discussed. - The basic input feature for the prediction method is computed from the difference of the partial loudness Nr,x [k] of the reverberation signal r[k] (with the direct signal x[k] being the interferer) and the loudness Nx,r [k] of x[k] (where r[k] is the interferer), according to
Equation 2.
- The rationale behind Equation (2) is that the difference ΔNr,x [k] is a measure of how strong the sensation of the reverberation is compared to the sensation of the direct signal. Taking the difference was also found to make the prediction result approximately invariant with respect to the playback level. The playback level has an impact on the investigated sensation [17, 8], but to a more subtle extent than reflected by the increase of the partial loudness Nr,x with increasing playback level. Typically, musical recordings sound more reverberant at moderate to high levels (starting at about 75-80 dB SPL) than at about 12 to 20 dB lower levels. This effect is especially obvious in cases where the DRR is positive, which is valid "for nearly all recorded music" [18], but not in all cases for concert music where "listeners are often well beyond the critical distance" [6].
- The decrease of the perceived level of the reverberation with decreasing playback level is best explained by the fact that the dynamic range of reverberation is smaller than that of the direct sounds (or, a time-frequency representation of reverberation is more dense whereas a time-frequency representation of direct sounds is more sparse [19]). In such a scenario, the reverberation signal is more likely to fall below the threshold of hearing than the direct sounds do.
- Although equation (2) describes, as the combination operation, a difference between the two loudness measures Nr,x [k] and Nx,r [k], other combinations can be performed as well such as multiplications, divisions or even additions. In any case, it is sufficient that the two alternatives indicated by the two loudness measures are combined in order to have influences of both alternatives in the result. However, the experiments have shown that the difference results in the best values from the model, i.e. in the results of the model which fit with the listening tests to a good extent, so that the difference is the preferred way of combining.
- Subsequently, details of the
predictor 114 illustrated inFig. 1 are described, where these details refer to a preferred embodiment. - The prediction methods described in the following are linear and use a least squares fit for the computation of the model coefficients. The simple structure of the predictor is advantageous in situations where the size of the data sets for training and testing the predictor is limited, which could lead to overfitting of the model when using regression methods with more degrees of freedom, e.g. neural networks. The baseline predictor R̂b is derived by the linear regression according to Equation (3) with coefficients a1, with K being the length of the signal in frames,

- The model has only one independent variable, i.e. the mean of ΔNr,x [k]. To track changes and to be able to implement a real-time processing, the computation of the mean can be approximated using a leaky integrator. The model parameters derived when using data set A for the training are a 0 = 48.2 and a 1 = 14.0, where a 0 equals the mean rating for all listeners and items.
-
Fig. 5a depicts the predicted sensations for data set A. It can be seen that the predictions are moderately correlated with the mean listener ratings with a correlation coefficient of 0.71. Please note that the choice of the regression coefficients does not affect this correlation. As shown in the lower plot, for each mixture generated by the same direct signals, the points exhibit a characteristic shape centered close to the diagonal. This shape indicates that although the baseline model R̂b is able to predict R to some degree, it does not reflect the influence of T 60 on the ratings. The visual inspection of the data points suggests a linear dependency on T 60. If the value of T 60 is known, as is the case when controlling an audio effect, it can be easily incorporated into the linear regression model to derive an enhanced prediction
- The model parameters derived from the data set A are a 0 = 48.2, a 1 = 12.9, a 2 = 10.2. The results are shown in
Fig. 5b separately for each of the data sets. The evaluation of the results is described in more detail in the next section. - Alternatively, an averaging over more or less blocks can be performed as long as an averaging over at least two blocks takes place, although, due to the theory of linear equation, the best results may be obtained, when an averaging over the whole music piece up to a certain frame is performed. However, for real time applications, it is preferred to reduce the number of frames over which is averaged depending on the actual application.
-
Fig. 9 additionally illustrates that the constant term is defined by a0 and a2·T60. The second term a2·T60 has been selected in order to be in the position to apply this equation not only to a single reverberator, i.e., to a situation in which thefilter 600 ofFig. 6 is not changed. This equation which, of course, is a constant term, but which depends on the actually usedreverberation filters 606 ofFig. 6 provides, therefore, the flexibility to use exactly the same equation for other reverberation filters having other values of T60. As known in the art, T60 is a parameter describing a certain reverberation filter and, particularly means that the reverberation energy has been decreased by 60dB from an initial maximum reverberation energy value. Typically, reverberation curves are decreasing with time and, therefore, T60 indicates a time period, in which a reverberation energy generated by a signal excitation has decreased by 60dB. Similar results in terms of prediction accuracy are obtained by replacing T60 by parameters representing similar information (that of the length of the RIR), e.g. T30. - In the following, the models are evaluated using the correlation coefficient r, the mean absolute error (MAE) and the root mean squared error (RMSE) between the mean listener ratings and the predicted sensation. The experiments are performed as two-fold cross-validation, i.e. the predictor is trained with data set A and tested with data set B, and the experiment is repeated with B for training and A for testing. The evaluation metrics obtained from both runs are averaged, separately for the training and the testing.
- The results are shown in Table 1 for the prediction models R̂b and R̂ e. . The predictor R̂e yields accurate results with an RMSE of 10.6 points. The average of the standard deviation of the individual listener ratings per item are given as a measure for the dispersion from the mean (of the ratings of all listeners per item) as
σA = 13.4 for data set A andσB =13.6 for data set B. The comparison to the RMSE indicates that R̂e is at least as accurate as the average listener in the listening test. - The accuracies of the predictions for the data sets differ slightly, e.g. for R̂e both MAE and RMSE are approximately one point below the mean value (as listed in the table) when testing with data set A and one point above average when testing with data set B. The fact that the evaluation metrics for training and test are comparable indicates that overfitting of the predictor has been avoided.
- In order to facilitate an economic implementation of such prediction models, the following experiments investigate how the use of loudness features with less computational complexity influence the precision of the prediction result. The experiments focus on replacing the partial loudness computation by estimates of total loudness and on simplified implementations of the excitation pattern.
- Instead of using the partial loudness difference ΔNr,x [k], three differences of total loudness estimates are examined, with the loudness of the direct signal Nx [k], the loudness of the reverberation Nr [k], and the loudness of the mixture signal Nm [k], as shown in Equations (5)-(7), respectively.

- Equation (5) is based on the assumption that the perceived level of the reverberation signal can be expressed as the difference (increase) in overall loudness which is caused by adding the reverb to the dry signal.
- Following a similar rationale as for the partial loudness difference in Equation (2), loudness features using the differences of total loudness of the reverberation signal and the mixture signal or the direct signal, respectively, are defined in Equations (6) and (7). The measure for predicting the sensation is derived from as the loudness of the reverberation signal when listened to separately, with subtractive terms for modelling the partial masking and for normalization with respect to playback level derived from the mixture signal or the direct signal, respectively.


- Table 2 shows the results obtained with the features based on the total loudness and reveals that in fact two of them, ΔNm,x [k] and ΔNr-x [k], yield predictions with nearly the same accuracy as R̂e . But as shown in Table 2, even ΔNr-n [k] provides use for results.
- Finally, in an additional experiment, the influence of the implementation of the spreading function is investigated. This is of particular significance for many application scenarios, because the use of the level dependent excitation patterns demands implementations of high computational complexity. The experiments with a similar processing as for R̂e but using one loudness model without spreading and one loudness model with level-invariant spreading function led to the results shown in Table 2. The influence of the spreading seems to be negligible.
- Therefore, equations (5), (6) and (7) which indicate
embodiments Fig. 2c illustrate that even without partial loudnesses, but with total loudnesses, for different combinations of signal components or signals, good values or measures for the perceived level of reverberation in a mix signal are obtained as well. - Subsequently, a preferred application of the determination of measures for a perceived level of reverberation are discussed in the context of
Fig. 8. Fig. 8 illustrates an embodiment of an audio processor for generating a reverberated signal from a direct signal component input at aninput 800. The direct or dry signal component is input into areverberator 801, which can be similar to thereverberator 606 inFig. 6 . The dry signal component ofinput 800 is additionally input into anapparatus 802 for determining the measure for a perceived loudness which can be implemented as discussed in the context ofFig. 1 ,Fig. 2a and 2c ,3 ,9 and10 . The output of theapparatus 802 is the measure R for a perceived level of reverberation in a mix signal which is input into acontroller 803. Thecontroller 803 receives, at a further input, a target value for the measure of the perceived level of reverberation and calculates, from this target value and the actual value R again a value onoutput 804. - This gain value is input into a
manipulator 805 which is configured for manipulating, in this embodiment, thereverberation signal component 806 output by thereverberator 801. As illustratedFig. 8 , theapparatus 802 additionally receives thereverberation signal component 806 as discussed in the context ofFig. 1 and the other Figs. describing the apparatus for determining a measure of a perceived loudness. The output of themanipulator 805 is input into anadder 807, where the output of the manipulator comprises in theFig. 8 embodiment the manipulated reverberation component and the output of theadder 807 indicates amix signal 808 with a perceived reverberation as determined by the target value. Thecontroller 803 can be configured to implement any of the control rules as defined in the art for feedback controls where the target value is a set value and the value R generated by the apparatus is an actual value and thegain 804 is selected so that the actual value R approaches the target value input into thecontroller 803. AlthoughFig. 8 is illustrated in that the reverberation signal is manipulated by the gain in themanipulator 805 which particularly comprises a multiplier or weighter, other implementations can be performed as well. One other implementation, for example, is that not thereverberation signal 806 but the dry signal component is manipulated by the manipulator as indicated byoptional line 809. In this case, the non-manipulated reverberation signal component as output by thereverberator 801 would be input into theadder 807 as illustrated byoptional line 810. Naturally, even a manipulation of the dry signal component and the reverberation signal component could be performed in order to introduce or set a certain measure of perceived loudness of the reverberation in themix signal 808 output by theadder 807. One other implementation, for example, is that the reverberation time T60 is manipulated. - The present invention provides a simple and robust prediction of the perceived level of reverberation and, specifically, late reverberation in speech and music using loudness models of varying computational complexity. The prediction modules have been trained and evaluated using subjective data derived from three listening tests. As a starting point, the use of a partial loudness model has lead to a prediction model with high accuracy when the T60 of the
RIR 606 ofFig. 6 is known. This result is also interesting from the perceptual point of view, when it is considered that the model of partial loudness was not originally developed with stimuli of direct and reverberant sound as discussed in the context ofFig. 10 . Subsequent modifications of the computation of the input features for the prediction method leads to a series of simplified models which were shown to achieve comparable performance for the data sets at hand. These modifications included the use of total loudness models and simplified spreading functions. The embodiments of the present invention are also applicable for more diverse RIRs including early reflections and larger pre-delays. The present invention is also useful for determining and controlling the perceived loudness contribution of other types of additive or reverberant audio effects. - Although some aspects have been described in the context of an apparatus, it is clear that these aspects also represent a description of the corresponding method, where a block or device corresponds to a method step or a feature of a method step. Analogously, aspects described in the context of a method step also represent a description of a corresponding block or item or feature of a corresponding apparatus.
- Depending on certain implementation requirements, embodiments of the invention can be implemented in hardware or in software. The implementation can be performed using a digital storage medium, for example a floppy disk, a DVD, a CD, a ROM, a PROM, an EPROM, an EEPROM or a FLASH memory, having electronically readable control signals stored thereon, which cooperate (or are capable of cooperating) with a programmable computer system such that the respective method is performed.
- Some embodiments according to the invention comprise a non-transitory or tangible data carrier having electronically readable control signals, which are capable of cooperating with a programmable computer system, such that one of the methods described herein is performed.
- Generally, embodiments of the present invention can be implemented as a computer program product with a program code, the program code being operative for performing one of the methods when the computer program product runs on a computer. The program code may for example be stored on a machine readable carrier.
- Other embodiments comprise the computer program for performing one of the methods described herein, stored on a machine readable carrier.
- In other words, an embodiment of the inventive method is, therefore, a computer program having a program code for performing one of the methods described herein, when the computer program runs on a computer.
- A further embodiment of the inventive methods is, therefore, a data carrier (or a digital storage medium, or a computer-readable medium) comprising, recorded thereon, the computer program for performing one of the methods described herein.
- In some embodiments, a programmable logic device (for example a field programmable gate array) may be used to perform some or all of the functionalities of the methods described herein. In some embodiments, a field programmable gate array may cooperate with a microprocessor in order to perform one of the methods described herein. Generally, the methods are preferably performed by any hardware apparatus.
- The above described embodiments are merely illustrative for the principles of the present invention. It is understood that modifications and variations of the arrangements and the details described herein will be apparent to others skilled in the art. It is the intent, therefore, to be limited only by the scope of the impending patent claims and not by the specific details presented by way of description and explanation of the embodiments herein.
-
- [1] A. Czyzewski, "A method for artificial reverberation quality testing," J. Audio Eng. Soc., vol. 38, pp. 129-141, 1990.
- [2] J.A. Moorer, "About this reverberation business," Computer Music Journal, vol. 3, 1979.
- [3] B. Scharf, "Fundamentals of auditory masking," Audiology, vol. 10, pp. 30-40, 1971.
- [4] W.G. Gardner and D. Griesinger, "Reverberation level matching experiments," in Proc. of the Sabine Centennial Symposium, Acoust. Soc. of Am., 1994.
- [5] D. Griesinger, "How loud is my reverberation," in Proc. Of the AES 98th Conv., 1995.
- [6] D. Griesinger, "Further investigation into the loudness of running reverberation," in Proc. of the Institute of Acoustics (UK) Conference, 1995.
- [7] D. Lee and D. Cabrera, "Effect of listening level and background noise on the subjective decay rate of room impulse responses: Using time varying-loudness to model reverberance," Applied Acoustics, vol. 71, pp. 801-811, 2010.
- [8] D. Lee, D. Cabrera, and W.L. Martens, "Equal reverberance matching of music," Proc. of Acoustics, 2009.
- [9] D. Lee, D. Cabrera, and W.L. Martens, "Equal reverberance matching of running musical stimuli having various reverberation times and SPLs," in Proc. of the 20th International Congress on Acoustics, 2010.
- [10] A. Tsilfidis and J. Mourjopoulus, "Blind single-channel suppression of late reverberation based on perceptual reverberation modeling," J. Acoust. Soc. Am, vol. 129, pp. 1439-1451,2011.
- [11] B.C.J. Moore, B.R. Glasberg, and T. Baer, "A model for the prediction of threshold, loudness, and partial loudness," J. Audio Eng. Soc., vol. 45, pp. 224-240, 1997.
- [12] B.R. Glasberg and B.C.J. Moore, "Development and evaluation of a model for predicting the audibility of time varying sounds in the presence of the background sounds," J. Audio Eng. Soc., vol. 53, pp. 906-918, 2005.
- [13] J. Paulus, C. Uhle, and J. Herre, "Perceived level of late reverberation in speech and music," in Proc. of the AES 130th Conv., 2011.
- [14] J.L. Verhey and S.J. Heise, "Einfluss der Zeitstruktur des Hintergrundes auf die Tonhaltigkeit und Lautheit des tonalen Vordergrundes (in German)," in Proc. of DAGA, 2010.
- [15] C. Bradter and K. Hobohm, "Loudness calculation for individual acoustical objects within complex temporally variable sounds," in Proc. of the AES 124th Conv., 2008.
- [16] International Telecommunication Union, Radiocommunication Assembly, "Algorithms to measure audio programme loudness and true-peak audio level," Recommendation ITU-R BS. 1770, 2006, Geneva, Switzerland.
- [17] S. Hase, A. Takatsu, S. Sato, H. Sakai, and Y. Ando, "Reverberance of an existing hall in relation to both subsequent reverberation time and SPL," J. Sound Vib., vol. 232, pp. 149-155, 2000.
- [18] D. Griesinger, "The importance of the direct to reverberant ratio in the perception of distance, localization, clarity, and envelopment," in Proc. of the AES 126th Conv., 2009.
- [19] C. Uhle, A. Walther, O. Hellmuth, and J. Herre, "Ambience separation from mono recordings using Non-negative Matrix Factorization," in Proc. of the AES 30th Conf., 2007.
Claims (13)
- Audio processor for generating a reverberated signal (808) from a direct signal component (100, 800), comprising:a reverberator (801) for reverberating the direct signal component (100, 800) to obtain a reverberation signal component (806, 102);an apparatus for determining a measure (112) for a perceived level of reverberation in a mix signal comprising the direct signal component (100, 800) and the reverberation signal component (806, 102), the apparatus comprising:a loudness model processor (104) comprising a perceptual filter stage (104a) for filtering the direct signal component (100, 800), the reverberation signal component (806, 102) or the mix signal, wherein the perceptual filter stage (104a) is configured for modeling an auditory perception mechanism of an entity to obtain a filtered direct signal, a filtered reverberation signal or a filtered mix signal;a loudness estimator (104b) for estimating a first loudness measure (106) using the filtered direct signal and for estimating a second loudness measure (108) using the filtered reverberation signal or the filtered mix signal, where the filtered mix signal is derived from a superposition of the direct signal component (100, 800) and the reverberation signal component (806, 102); anda combiner (110) for combining the first loudness measure (106) and the second loudness measure (108) to obtain the measure (112) for the perceived level of reverberation;a controller (803) for receiving the measure (112) for the perceived level of reverberation, and for generating a control signal (804) in accordance with the perceived level of reverberation and a target value;a manipulator (805) for manipulating the direct signal component (100, 800) to obtain a manipulated direct signal component or for manipulating the reverberation signal component (806, 102) to obtain a manipulated reverberation signal component in accordance with the control signal (804); anda combiner (807) for combining the manipulated direct signal component and the manipulated reverberation signal component, or for combining the direct signal component (100, 800) and the manipulated reverberation signal component, or for combining the manipulated direct signal component and the reverberation signal component (806, 102) to obtain the reverberated signal (808).
- Audio processor in accordance with claim 1, in which the manipulator (805) comprises a weighter for weighting the reverberation signal component (806, 102) by a gain value, the gain value being determined by the control signal (804), or
in which the reverberator (801) comprises a variable filter, the variable filter being variable in response to the control signal (804). - Audio processor in accordance with claim 2,
in which the reverberator (801) has a fixed filter, and
in which the combiner (807) is configured for adding the direct signal component (100, 800) and the manipulated reverberation signal component (806, 102) to obtain the reverberated signal (808). - Audio processor in accordance with claim 1, in which the loudness estimator (104b) is configured to estimate the first loudness measure (106) so that the filtered direct signal is considered to be a stimulus and the filtered reverberation signal is considered to be a noise, or to estimate the second loudness measure (108) so that the filtered reverberation signal is considered to be a stimulus and the filtered direct signal is considered to be a noise.
- Audio processor in accordance with claim 1 or 4, in which the loudness estimator (104b) is configured to calculate the first loudness measure (106) as a loudness of the filtered direct signal or to calculate the second loudness measure (108) as a loudness of the filtered reverberation signal or the mix signal.
- Audio processor in accordance with one of the preceding claims, in which the combiner (110) is configured to calculate a difference using the first loudness measure (106) and the second loudness measure (108).
- Audio processor in accordance with claim 1, further comprising:
a predictor (114) for predicting the perceived level of reverberation based on an average value (904) of at least two measures for the perceived loudness for different signal frames (k). - Audio processor in accordance with claim 7, in which the predictor (114) is configured to use, in a prediction (900) a constant term (901, 903), a linear term depending on the average value (904) and a scaling factor (902).
- Audio processor in accordance with claim 7 or 8, in which the constant term (903) depends on the reverberation parameter describing the reverberation filter (606) used for generating the reverberation signal in an artificial reverberator.
- Audio processor in accordance with one of the preceding claims, in which the perceptual filter stage (104a) comprises a time-frequency conversion stage (300),
wherein the loudness estimator (104b) is configured to sum (104c, 104d) results obtained for a plurality of bands to derive the first loudness measure (106) and the second loudness measure (108) for a broadband mix signal comprising the direct signal component (100, 800) and the reverberation signal component. - Audio processor in accordance with one of the preceding claims, in which the perceptual filter stage (104a) comprises:
an ear transfer filter (302), an excitation pattern calculator (304), and a temporal integrator (306) to derive the filtered direct signal or the filtered reverberation signal or the filtered mix signal. - Method of generating a reverberated signal (808) from a direct signal component (100, 800), comprising:reverberating (801) the direct signal component (100, 800) to obtain a reverberation signal component (806, 102);a method of determining a measure (112) for a perceived level of reverberation in a mix signal comprising the direct signal component (100, 800) and the reverberation signal component (806, 102), the method of determining comprising:filtering (104) the direct signal component (100, 800), the reverberation signal component (806, 102) or the mix signal, wherein the filtering (104) is performed using a perceptual filter stage (104a) being configured for modeling an auditory perception mechanism of an entity to obtain a filtered direct signal, a filtered reverberation signal or a filtered mix signal;estimating a first loudness measure (106) using the filtered direct signal;estimating a second loudness measure (108) using the filtered reverberation signal or the filtered mix signal, where the filtered mix signal is derived from a superposition of the direct signal component (100, 800) and the reverberation signal component (806, 102); andcombining (110) the first loudness measure (106) and the second loudness measure (108) to obtain the measure (112) for the perceived level of reverberation;receiving the measure (112) for the perceived level of reverberation ;generating (803) a control signal (804) in accordance with the perceived level of reverberation and a target value;manipulating (805) the direct signal component (100, 800) to obtain a manipulated direct signal component or manipulating (805) the reverberation signal component (806, 102) to obtain a manipulated reverberation signal component in accordance with the control signal (804); andcombining (807) the manipulated direct signal component and the manipulated reverberation signal component, or combining the direct signal component (100, 800) and the manipulated reverberation signal component, or combining the manipulated direct signal component and the reverberation signal component (806, 102) to obtain the reverberated signal (808).
- Computer program having a program code for performing, when running on a computer, the method of claim 12.
Priority Applications (1)
| Application Number | Priority Date | Filing Date | Title |
|---|---|---|---|
| EP12706815.3A EP2681932B1 (en) | 2011-03-02 | 2012-02-24 | Audio processor for generating a reverberated signal from a direct signal and method therefor |
Applications Claiming Priority (4)
| Application Number | Priority Date | Filing Date | Title |
|---|---|---|---|
| US201161448444P | 2011-03-02 | 2011-03-02 | |
| EP11171488A EP2541542A1 (en) | 2011-06-27 | 2011-06-27 | Apparatus and method for determining a measure for a perceived level of reverberation, audio processor and method for processing a signal |
| PCT/EP2012/053193 WO2012116934A1 (en) | 2011-03-02 | 2012-02-24 | Apparatus and method for determining a measure for a perceived level of reverberation, audio processor and method for processing a signal |
| EP12706815.3A EP2681932B1 (en) | 2011-03-02 | 2012-02-24 | Audio processor for generating a reverberated signal from a direct signal and method therefor |
Publications (2)
| Publication Number | Publication Date |
|---|---|
| EP2681932A1 EP2681932A1 (en) | 2014-01-08 |
| EP2681932B1 true EP2681932B1 (en) | 2021-07-28 |
Family
ID=46757373
Family Applications (2)
| Application Number | Title | Priority Date | Filing Date |
|---|---|---|---|
| EP11171488A Withdrawn EP2541542A1 (en) | 2011-03-02 | 2011-06-27 | Apparatus and method for determining a measure for a perceived level of reverberation, audio processor and method for processing a signal |
| EP12706815.3A Active EP2681932B1 (en) | 2011-03-02 | 2012-02-24 | Audio processor for generating a reverberated signal from a direct signal and method therefor |
Family Applications Before (1)
| Application Number | Title | Priority Date | Filing Date |
|---|---|---|---|
| EP11171488A Withdrawn EP2541542A1 (en) | 2011-03-02 | 2011-06-27 | Apparatus and method for determining a measure for a perceived level of reverberation, audio processor and method for processing a signal |
Country Status (14)
| Country | Link |
|---|---|
| US (1) | US9672806B2 (en) |
| EP (2) | EP2541542A1 (en) |
| JP (1) | JP5666023B2 (en) |
| KR (1) | KR101500254B1 (en) |
| CN (1) | CN103430574B (en) |
| AR (1) | AR085408A1 (en) |
| AU (1) | AU2012222491B2 (en) |
| BR (1) | BR112013021855B1 (en) |
| CA (1) | CA2827326C (en) |
| ES (1) | ES2892773T3 (en) |
| MX (1) | MX2013009657A (en) |
| RU (1) | RU2550528C2 (en) |
| TW (1) | TWI544812B (en) |
| WO (1) | WO2012116934A1 (en) |
Families Citing this family (28)
| Publication number | Priority date | Publication date | Assignee | Title |
|---|---|---|---|---|
| US9055374B2 (en) * | 2009-06-24 | 2015-06-09 | Arizona Board Of Regents For And On Behalf Of Arizona State University | Method and system for determining an auditory pattern of an audio segment |
| WO2014171791A1 (en) | 2013-04-19 | 2014-10-23 | 한국전자통신연구원 | Apparatus and method for processing multi-channel audio signal |
| US10075795B2 (en) | 2013-04-19 | 2018-09-11 | Electronics And Telecommunications Research Institute | Apparatus and method for processing multi-channel audio signal |
| EP2830043A3 (en) | 2013-07-22 | 2015-02-18 | Fraunhofer-Gesellschaft zur Förderung der angewandten Forschung e.V. | Method for Processing an Audio Signal in accordance with a Room Impulse Response, Signal Processing Unit, Audio Encoder, Audio Decoder, and Binaural Renderer |
| EP2840811A1 (en) | 2013-07-22 | 2015-02-25 | Fraunhofer-Gesellschaft zur Förderung der angewandten Forschung e.V. | Method for processing an audio signal; signal processing unit, binaural renderer, audio encoder and audio decoder |
| US9319819B2 (en) | 2013-07-25 | 2016-04-19 | Etri | Binaural rendering method and apparatus for decoding multi channel audio |
| ES2932422T3 (en) | 2013-09-17 | 2023-01-19 | Wilus Inst Standards & Tech Inc | Method and apparatus for processing multimedia signals |
| EP3062534B1 (en) | 2013-10-22 | 2021-03-03 | Electronics and Telecommunications Research Institute | Method for generating filter for audio signal and parameterizing device therefor |
| WO2015099424A1 (en) | 2013-12-23 | 2015-07-02 | 주식회사 윌러스표준기술연구소 | Method for generating filter for audio signal, and parameterization device for same |
| CN107770717B (en) * | 2014-01-03 | 2019-12-13 | 杜比实验室特许公司 | Generating binaural audio by using at least one feedback delay network in response to multi-channel audio |
| EP4294055A1 (en) | 2014-03-19 | 2023-12-20 | Wilus Institute of Standards and Technology Inc. | Audio signal processing method and apparatus |
| CN106165454B (en) | 2014-04-02 | 2018-04-24 | 韦勒斯标准与技术协会公司 | Acoustic signal processing method and equipment |
| US9407738B2 (en) * | 2014-04-14 | 2016-08-02 | Bose Corporation | Providing isolation from distractions |
| EP2980789A1 (en) | 2014-07-30 | 2016-02-03 | Fraunhofer-Gesellschaft zur Förderung der angewandten Forschung e.V. | Apparatus and method for enhancing an audio signal, sound enhancing system |
| PL3311379T3 (en) | 2015-06-17 | 2023-03-20 | Fraunhofer-Gesellschaft zur Förderung der angewandten Forschung e.V. | Loudness control for user interactivity in audio coding systems |
| US9590580B1 (en) | 2015-09-13 | 2017-03-07 | Guoguang Electric Company Limited | Loudness-based audio-signal compensation |
| GB201615538D0 (en) * | 2016-09-13 | 2016-10-26 | Nokia Technologies Oy | A method , apparatus and computer program for processing audio signals |
| EP3389183A1 (en) | 2017-04-13 | 2018-10-17 | Fraunhofer-Gesellschaft zur Förderung der angewandten Forschung e.V. | Apparatus for processing an input audio signal and corresponding method |
| GB2561595A (en) * | 2017-04-20 | 2018-10-24 | Nokia Technologies Oy | Ambience generation for spatial audio mixing featuring use of original and extended signal |
| US9820073B1 (en) | 2017-05-10 | 2017-11-14 | Tls Corp. | Extracting a common signal from multiple audio signals |
| EP3460795A1 (en) * | 2017-09-21 | 2019-03-27 | Fraunhofer-Gesellschaft zur Förderung der angewandten Forschung e.V. | Signal processor and method for providing a processed audio signal reducing noise and reverberation |
| CN117475983A (en) * | 2017-10-20 | 2024-01-30 | 索尼公司 | Signal processing apparatus, method and storage medium |
| JP7294135B2 (en) | 2017-10-20 | 2023-06-20 | ソニーグループ株式会社 | SIGNAL PROCESSING APPARATUS AND METHOD, AND PROGRAM |
| JP2021129145A (en) | 2020-02-10 | 2021-09-02 | ヤマハ株式会社 | Volume control device and volume control method |
| US11670322B2 (en) * | 2020-07-29 | 2023-06-06 | Distributed Creation Inc. | Method and system for learning and using latent-space representations of audio signals for audio content-based retrieval |
| US20220322022A1 (en) * | 2021-04-01 | 2022-10-06 | United States Of America As Represented By The Administrator Of Nasa | Statistical Audibility Prediction(SAP) of an Arbitrary Sound in the Presence of Another Sound |
| GB2614713A (en) * | 2022-01-12 | 2023-07-19 | Nokia Technologies Oy | Adjustment of reverberator based on input diffuse-to-direct ratio |
| EP4247011A1 (en) * | 2022-03-16 | 2023-09-20 | Fraunhofer-Gesellschaft zur Förderung der angewandten Forschung e.V. | Apparatus and method for an automated control of a reverberation level using a perceptional model |
Family Cites Families (12)
| Publication number | Priority date | Publication date | Assignee | Title |
|---|---|---|---|---|
| US7583805B2 (en) * | 2004-02-12 | 2009-09-01 | Agere Systems Inc. | Late reverberation-based synthesis of auditory scenes |
| US7644003B2 (en) | 2001-05-04 | 2010-01-05 | Agere Systems Inc. | Cue-based audio coding/decoding |
| US7949141B2 (en) * | 2003-11-12 | 2011-05-24 | Dolby Laboratories Licensing Corporation | Processing audio signals with head related transfer function filters and a reverberator |
| US7495166B2 (en) | 2004-08-25 | 2009-02-24 | Pioneer Corporation | Sound processing apparatus, sound processing method, sound processing program and recording medium which records sound processing program |
| KR100619082B1 (en) * | 2005-07-20 | 2006-09-05 | 삼성전자주식회사 | Method and apparatus for reproducing wide mono sound |
| EP1761110A1 (en) * | 2005-09-02 | 2007-03-07 | Ecole Polytechnique Fédérale de Lausanne | Method to generate multi-channel audio signals from stereo signals |
| JP4175376B2 (en) * | 2006-03-30 | 2008-11-05 | ヤマハ株式会社 | Audio signal processing apparatus, audio signal processing method, and audio signal processing program |
| JP4668118B2 (en) * | 2006-04-28 | 2011-04-13 | ヤマハ株式会社 | Sound field control device |
| US8036767B2 (en) * | 2006-09-20 | 2011-10-11 | Harman International Industries, Incorporated | System for extracting and changing the reverberant content of an audio input signal |
| WO2009039897A1 (en) | 2007-09-26 | 2009-04-02 | Fraunhofer - Gesellschaft Zur Förderung Der Angewandten Forschung E.V. | Apparatus and method for extracting an ambient signal in an apparatus and method for obtaining weighting coefficients for extracting an ambient signal and computer program |
| EP2154911A1 (en) * | 2008-08-13 | 2010-02-17 | Fraunhofer-Gesellschaft zur Förderung der angewandten Forschung e.V. | An apparatus for determining a spatial output multi-channel audio signal |
| US8965000B2 (en) * | 2008-12-19 | 2015-02-24 | Dolby International Ab | Method and apparatus for applying reverb to a multi-channel audio signal using spatial cue parameters |
-
2011
- 2011-06-27 EP EP11171488A patent/EP2541542A1/en not_active Withdrawn
-
2012
- 2012-02-24 WO PCT/EP2012/053193 patent/WO2012116934A1/en active Application Filing
- 2012-02-24 ES ES12706815T patent/ES2892773T3/en active Active
- 2012-02-24 CN CN201280011192.5A patent/CN103430574B/en active Active
- 2012-02-24 BR BR112013021855-0A patent/BR112013021855B1/en active IP Right Grant
- 2012-02-24 JP JP2013555829A patent/JP5666023B2/en active Active
- 2012-02-24 KR KR1020137025852A patent/KR101500254B1/en active IP Right Grant
- 2012-02-24 AU AU2012222491A patent/AU2012222491B2/en active Active
- 2012-02-24 TW TW101106353A patent/TWI544812B/en active
- 2012-02-24 RU RU2013144058/08A patent/RU2550528C2/en active
- 2012-02-24 CA CA2827326A patent/CA2827326C/en active Active
- 2012-02-24 AR ARP120100622A patent/AR085408A1/en active IP Right Grant
- 2012-02-24 MX MX2013009657A patent/MX2013009657A/en active IP Right Grant
- 2012-02-24 EP EP12706815.3A patent/EP2681932B1/en active Active
-
2013
- 2013-08-31 US US14/016,066 patent/US9672806B2/en active Active
Non-Patent Citations (1)
| Title |
|---|
| None * |
Also Published As
| Publication number | Publication date |
|---|---|
| BR112013021855B1 (en) | 2021-03-09 |
| ES2892773T3 (en) | 2022-02-04 |
| CN103430574A (en) | 2013-12-04 |
| KR20130133016A (en) | 2013-12-05 |
| CA2827326A1 (en) | 2012-09-07 |
| BR112013021855A2 (en) | 2018-09-11 |
| US9672806B2 (en) | 2017-06-06 |
| MX2013009657A (en) | 2013-10-28 |
| AU2012222491B2 (en) | 2015-01-22 |
| RU2013144058A (en) | 2015-04-10 |
| RU2550528C2 (en) | 2015-05-10 |
| EP2681932A1 (en) | 2014-01-08 |
| CN103430574B (en) | 2016-05-25 |
| JP5666023B2 (en) | 2015-02-04 |
| AR085408A1 (en) | 2013-10-02 |
| TWI544812B (en) | 2016-08-01 |
| EP2541542A1 (en) | 2013-01-02 |
| WO2012116934A1 (en) | 2012-09-07 |
| CA2827326C (en) | 2016-05-17 |
| TW201251480A (en) | 2012-12-16 |
| JP2014510474A (en) | 2014-04-24 |
| AU2012222491A1 (en) | 2013-09-26 |
| KR101500254B1 (en) | 2015-03-06 |
| US20140072126A1 (en) | 2014-03-13 |
Similar Documents
| Publication | Publication Date | Title |
|---|---|---|
| EP2681932B1 (en) | Audio processor for generating a reverberated signal from a direct signal and method therefor | |
| Kates et al. | Coherence and the speech intelligibility index | |
| US10242692B2 (en) | Audio coherence enhancement by controlling time variant weighting factors for decorrelated signals | |
| KR101670313B1 (en) | Signal separation system and method for selecting threshold to separate sound source | |
| RU2569346C2 (en) | Device and method of generating output signal using signal decomposition unit | |
| RU2663345C2 (en) | Apparatus and method for centre signal scaling and stereophonic enhancement based on signal-to-downmix ratio | |
| Zotter et al. | Efficient phantom source widening | |
| Cecchi et al. | Low-complexity implementation of a real-time decorrelation algorithm for stereophonic acoustic echo cancellation | |
| Uhle et al. | Predicting the perceived level of late reverberation using computational models of loudness | |
| Buchholz | A quantitative analysis of spectral mechanisms involved in auditory detection of coloration by a single wall reflection | |
| Lee et al. | Equal reverberance contours for synthetic room impulse responses listened to directly: Evaluation of reverberance in terms of loudness decay parameters | |
| Lee et al. | Development of a clarity parameter using a time-varying loudness model | |
| Laback et al. | Simultaneous masking additivity for short Gaussian-shaped tones: Spectral effects | |
| Weber et al. | Automated Control of Reverberation Level Using a Perceptional Model | |
| KR20210030860A (en) | Input signal decorrelation | |
| Aichinger et al. | Investigation of psychoacoustic principles for automatic mixdown algorithms |
Legal Events
| Date | Code | Title | Description |
|---|---|---|---|
| PUAI | Public reference made under article 153(3) epc to a published international application that has entered the european phase |
Free format text: ORIGINAL CODE: 0009012 |
|
| 17P | Request for examination filed |
Effective date: 20130814 |
|
| AK | Designated contracting states |
Kind code of ref document: A1 Designated state(s): AL AT BE BG CH CY CZ DE DK EE ES FI FR GB GR HR HU IE IS IT LI LT LU LV MC MK MT NL NO PL PT RO RS SE SI SK SM TR |
|
| DAX | Request for extension of the european patent (deleted) | ||
| REG | Reference to a national code |
Ref country code: HK Ref legal event code: DE Ref document number: 1193525 Country of ref document: HK |
|
| 17Q | First examination report despatched |
Effective date: 20150414 |
|
| RIC1 | Information provided on ipc code assigned before grant |
Ipc: H04S 5/00 20060101AFI20180221BHEP Ipc: G10K 15/12 20060101ALI20180221BHEP Ipc: G10K 15/08 20060101ALI20180221BHEP Ipc: H04S 7/00 20060101ALI20180221BHEP |
|
| STAA | Information on the status of an ep patent application or granted ep patent |
Free format text: STATUS: EXAMINATION IS IN PROGRESS |
|
| STAA | Information on the status of an ep patent application or granted ep patent |
Free format text: STATUS: EXAMINATION IS IN PROGRESS |
|
| REG | Reference to a national code |
Ref country code: DE Ref legal event code: R079 Ref document number: 602012076210 Country of ref document: DE Free format text: PREVIOUS MAIN CLASS: H04S0005000000 Ipc: H04S0007000000 |
|
| GRAP | Despatch of communication of intention to grant a patent |
Free format text: ORIGINAL CODE: EPIDOSNIGR1 |
|
| STAA | Information on the status of an ep patent application or granted ep patent |
Free format text: STATUS: GRANT OF PATENT IS INTENDED |
|
| RIC1 | Information provided on ipc code assigned before grant |
Ipc: H04S 7/00 20060101AFI20210204BHEP Ipc: H04S 5/00 20060101ALI20210204BHEP |
|
| INTG | Intention to grant announced |
Effective date: 20210224 |
|
| GRAS | Grant fee paid |
Free format text: ORIGINAL CODE: EPIDOSNIGR3 |
|
| GRAA | (expected) grant |
Free format text: ORIGINAL CODE: 0009210 |
|
| STAA | Information on the status of an ep patent application or granted ep patent |
Free format text: STATUS: THE PATENT HAS BEEN GRANTED |
|
| AK | Designated contracting states |
Kind code of ref document: B1 Designated state(s): AL AT BE BG CH CY CZ DE DK EE ES FI FR GB GR HR HU IE IS IT LI LT LU LV MC MK MT NL NO PL PT RO RS SE SI SK SM TR |
|
| REG | Reference to a national code |
Ref country code: GB Ref legal event code: FG4D |
|
| REG | Reference to a national code |
Ref country code: CH Ref legal event code: EP |
|
| REG | Reference to a national code |
Ref country code: DE Ref legal event code: R096 Ref document number: 602012076210 Country of ref document: DE |
|
| REG | Reference to a national code |
Ref country code: AT Ref legal event code: REF Ref document number: 1415835 Country of ref document: AT Kind code of ref document: T Effective date: 20210815 |
|
| REG | Reference to a national code |
Ref country code: IE Ref legal event code: FG4D |
|
| REG | Reference to a national code |
Ref country code: LT Ref legal event code: MG9D |
|
| REG | Reference to a national code |
Ref country code: NL Ref legal event code: MP Effective date: 20210728 |
|
| REG | Reference to a national code |
Ref country code: AT Ref legal event code: MK05 Ref document number: 1415835 Country of ref document: AT Kind code of ref document: T Effective date: 20210728 |
|
| PG25 | Lapsed in a contracting state [announced via postgrant information from national office to epo] |
Ref country code: NO Free format text: LAPSE BECAUSE OF FAILURE TO SUBMIT A TRANSLATION OF THE DESCRIPTION OR TO PAY THE FEE WITHIN THE PRESCRIBED TIME-LIMIT Effective date: 20211028 Ref country code: PT Free format text: LAPSE BECAUSE OF FAILURE TO SUBMIT A TRANSLATION OF THE DESCRIPTION OR TO PAY THE FEE WITHIN THE PRESCRIBED TIME-LIMIT Effective date: 20211129 Ref country code: RS Free format text: LAPSE BECAUSE OF FAILURE TO SUBMIT A TRANSLATION OF THE DESCRIPTION OR TO PAY THE FEE WITHIN THE PRESCRIBED TIME-LIMIT Effective date: 20210728 Ref country code: NL Free format text: LAPSE BECAUSE OF FAILURE TO SUBMIT A TRANSLATION OF THE DESCRIPTION OR TO PAY THE FEE WITHIN THE PRESCRIBED TIME-LIMIT Effective date: 20210728 Ref country code: FI Free format text: LAPSE BECAUSE OF FAILURE TO SUBMIT A TRANSLATION OF THE DESCRIPTION OR TO PAY THE FEE WITHIN THE PRESCRIBED TIME-LIMIT Effective date: 20210728 Ref country code: BG Free format text: LAPSE BECAUSE OF FAILURE TO SUBMIT A TRANSLATION OF THE DESCRIPTION OR TO PAY THE FEE WITHIN THE PRESCRIBED TIME-LIMIT Effective date: 20211028 Ref country code: AT Free format text: LAPSE BECAUSE OF FAILURE TO SUBMIT A TRANSLATION OF THE DESCRIPTION OR TO PAY THE FEE WITHIN THE PRESCRIBED TIME-LIMIT Effective date: 20210728 Ref country code: LT Free format text: LAPSE BECAUSE OF FAILURE TO SUBMIT A TRANSLATION OF THE DESCRIPTION OR TO PAY THE FEE WITHIN THE PRESCRIBED TIME-LIMIT Effective date: 20210728 Ref country code: HR Free format text: LAPSE BECAUSE OF FAILURE TO SUBMIT A TRANSLATION OF THE DESCRIPTION OR TO PAY THE FEE WITHIN THE PRESCRIBED TIME-LIMIT Effective date: 20210728 Ref country code: SE Free format text: LAPSE BECAUSE OF FAILURE TO SUBMIT A TRANSLATION OF THE DESCRIPTION OR TO PAY THE FEE WITHIN THE PRESCRIBED TIME-LIMIT Effective date: 20210728 |
|
| REG | Reference to a national code |
Ref country code: ES Ref legal event code: FG2A Ref document number: 2892773 Country of ref document: ES Kind code of ref document: T3 Effective date: 20220204 |
|
| PG25 | Lapsed in a contracting state [announced via postgrant information from national office to epo] |
Ref country code: PL Free format text: LAPSE BECAUSE OF FAILURE TO SUBMIT A TRANSLATION OF THE DESCRIPTION OR TO PAY THE FEE WITHIN THE PRESCRIBED TIME-LIMIT Effective date: 20210728 Ref country code: LV Free format text: LAPSE BECAUSE OF FAILURE TO SUBMIT A TRANSLATION OF THE DESCRIPTION OR TO PAY THE FEE WITHIN THE PRESCRIBED TIME-LIMIT Effective date: 20210728 Ref country code: GR Free format text: LAPSE BECAUSE OF FAILURE TO SUBMIT A TRANSLATION OF THE DESCRIPTION OR TO PAY THE FEE WITHIN THE PRESCRIBED TIME-LIMIT Effective date: 20211029 |
|
| RAP4 | Party data changed (patent owner data changed or rights of a patent transferred) |
Owner name: FRAUNHOFER-GESELLSCHAFT ZUR FOERDERUNG DER ANGEWANDTEN FORSCHUNG E.V. |
|
| PG25 | Lapsed in a contracting state [announced via postgrant information from national office to epo] |
Ref country code: DK Free format text: LAPSE BECAUSE OF FAILURE TO SUBMIT A TRANSLATION OF THE DESCRIPTION OR TO PAY THE FEE WITHIN THE PRESCRIBED TIME-LIMIT Effective date: 20210728 |
|
| REG | Reference to a national code |
Ref country code: DE Ref legal event code: R097 Ref document number: 602012076210 Country of ref document: DE |
|
| PG25 | Lapsed in a contracting state [announced via postgrant information from national office to epo] |
Ref country code: SM Free format text: LAPSE BECAUSE OF FAILURE TO SUBMIT A TRANSLATION OF THE DESCRIPTION OR TO PAY THE FEE WITHIN THE PRESCRIBED TIME-LIMIT Effective date: 20210728 Ref country code: SK Free format text: LAPSE BECAUSE OF FAILURE TO SUBMIT A TRANSLATION OF THE DESCRIPTION OR TO PAY THE FEE WITHIN THE PRESCRIBED TIME-LIMIT Effective date: 20210728 Ref country code: RO Free format text: LAPSE BECAUSE OF FAILURE TO SUBMIT A TRANSLATION OF THE DESCRIPTION OR TO PAY THE FEE WITHIN THE PRESCRIBED TIME-LIMIT Effective date: 20210728 Ref country code: EE Free format text: LAPSE BECAUSE OF FAILURE TO SUBMIT A TRANSLATION OF THE DESCRIPTION OR TO PAY THE FEE WITHIN THE PRESCRIBED TIME-LIMIT Effective date: 20210728 Ref country code: CZ Free format text: LAPSE BECAUSE OF FAILURE TO SUBMIT A TRANSLATION OF THE DESCRIPTION OR TO PAY THE FEE WITHIN THE PRESCRIBED TIME-LIMIT Effective date: 20210728 Ref country code: AL Free format text: LAPSE BECAUSE OF FAILURE TO SUBMIT A TRANSLATION OF THE DESCRIPTION OR TO PAY THE FEE WITHIN THE PRESCRIBED TIME-LIMIT Effective date: 20210728 |
|
| PLBE | No opposition filed within time limit |
Free format text: ORIGINAL CODE: 0009261 |
|
| STAA | Information on the status of an ep patent application or granted ep patent |
Free format text: STATUS: NO OPPOSITION FILED WITHIN TIME LIMIT |
|
| 26N | No opposition filed |
Effective date: 20220429 |
|
| PG25 | Lapsed in a contracting state [announced via postgrant information from national office to epo] |
Ref country code: MC Free format text: LAPSE BECAUSE OF FAILURE TO SUBMIT A TRANSLATION OF THE DESCRIPTION OR TO PAY THE FEE WITHIN THE PRESCRIBED TIME-LIMIT Effective date: 20210728 |
|
| REG | Reference to a national code |
Ref country code: CH Ref legal event code: PL |
|
| REG | Reference to a national code |
Ref country code: BE Ref legal event code: MM Effective date: 20220228 |
|
| PG25 | Lapsed in a contracting state [announced via postgrant information from national office to epo] |
Ref country code: LU Free format text: LAPSE BECAUSE OF NON-PAYMENT OF DUE FEES Effective date: 20220224 |
|
| PG25 | Lapsed in a contracting state [announced via postgrant information from national office to epo] |
Ref country code: LI Free format text: LAPSE BECAUSE OF NON-PAYMENT OF DUE FEES Effective date: 20220228 Ref country code: IE Free format text: LAPSE BECAUSE OF NON-PAYMENT OF DUE FEES Effective date: 20220224 Ref country code: CH Free format text: LAPSE BECAUSE OF NON-PAYMENT OF DUE FEES Effective date: 20220228 |
|
| PG25 | Lapsed in a contracting state [announced via postgrant information from national office to epo] |
Ref country code: BE Free format text: LAPSE BECAUSE OF NON-PAYMENT OF DUE FEES Effective date: 20220228 |
|
| PGFP | Annual fee paid to national office [announced via postgrant information from national office to epo] |
Ref country code: FR Payment date: 20230220 Year of fee payment: 12 Ref country code: ES Payment date: 20230317 Year of fee payment: 12 |
|
| PGFP | Annual fee paid to national office [announced via postgrant information from national office to epo] |
Ref country code: TR Payment date: 20230223 Year of fee payment: 12 Ref country code: IT Payment date: 20230228 Year of fee payment: 12 Ref country code: GB Payment date: 20230221 Year of fee payment: 12 Ref country code: DE Payment date: 20230216 Year of fee payment: 12 |
|
| P01 | Opt-out of the competence of the unified patent court (upc) registered |
Effective date: 20230516 |
|
| PG25 | Lapsed in a contracting state [announced via postgrant information from national office to epo] |
Ref country code: HU Free format text: LAPSE BECAUSE OF FAILURE TO SUBMIT A TRANSLATION OF THE DESCRIPTION OR TO PAY THE FEE WITHIN THE PRESCRIBED TIME-LIMIT; INVALID AB INITIO Effective date: 20120224 |
|
| PGFP | Annual fee paid to national office [announced via postgrant information from national office to epo] |
Ref country code: ES Payment date: 20240319 Year of fee payment: 13 |