EP2659409B1 - Computergestütztes system zur überwachung und steuerung eines geräts zur erzeugung von physikalischen daten - Google Patents
Computergestütztes system zur überwachung und steuerung eines geräts zur erzeugung von physikalischen daten Download PDFInfo
- Publication number
- EP2659409B1 EP2659409B1 EP11852387.7A EP11852387A EP2659409B1 EP 2659409 B1 EP2659409 B1 EP 2659409B1 EP 11852387 A EP11852387 A EP 11852387A EP 2659409 B1 EP2659409 B1 EP 2659409B1
- Authority
- EP
- European Patent Office
- Prior art keywords
- data
- points
- period
- physical data
- physical
- Prior art date
- Legal status (The legal status is an assumption and is not a legal conclusion. Google has not performed a legal analysis and makes no representation as to the accuracy of the status listed.)
- Active
Links
Images














Classifications
-
- G—PHYSICS
- G06—COMPUTING OR CALCULATING; COUNTING
- G06N—COMPUTING ARRANGEMENTS BASED ON SPECIFIC COMPUTATIONAL MODELS
- G06N5/00—Computing arrangements using knowledge-based models
- G06N5/02—Knowledge representation; Symbolic representation
-
- G—PHYSICS
- G05—CONTROLLING; REGULATING
- G05B—CONTROL OR REGULATING SYSTEMS IN GENERAL; FUNCTIONAL ELEMENTS OF SUCH SYSTEMS; MONITORING OR TESTING ARRANGEMENTS FOR SUCH SYSTEMS OR ELEMENTS
- G05B23/00—Testing or monitoring of control systems or parts thereof
- G05B23/02—Electric testing or monitoring
- G05B23/0205—Electric testing or monitoring by means of a monitoring system capable of detecting and responding to faults
- G05B23/0218—Electric testing or monitoring by means of a monitoring system capable of detecting and responding to faults characterised by the fault detection method dealing with either existing or incipient faults
- G05B23/0243—Electric testing or monitoring by means of a monitoring system capable of detecting and responding to faults characterised by the fault detection method dealing with either existing or incipient faults model based detection method, e.g. first-principles knowledge model
- G05B23/0254—Electric testing or monitoring by means of a monitoring system capable of detecting and responding to faults characterised by the fault detection method dealing with either existing or incipient faults model based detection method, e.g. first-principles knowledge model based on a quantitative model, e.g. mathematical relationships between inputs and outputs; functions: observer, Kalman filter, residual calculation, Neural Networks
-
- G—PHYSICS
- G06—COMPUTING OR CALCULATING; COUNTING
- G06F—ELECTRIC DIGITAL DATA PROCESSING
- G06F2218/00—Aspects of pattern recognition specially adapted for signal processing
- G06F2218/08—Feature extraction
- G06F2218/10—Feature extraction by analysing the shape of a waveform, e.g. extracting parameters relating to peaks
Definitions
- the present invention relates generally to control systems and more particularly to feedback-providing control systems.
- PDM Phase Dispersion Minimalization
- US7024335B1 relates to a method to assess the condition of a device including receiving signals from a sensor that makes electrical measurements of the device. An expected response of the device is estimated in accordance with the received signals, and a measured response of the device is established in accordance with the received signals. An output residual is calculated according to the expected response and the measured response. The condition of the device is assessed by identifying a fault of the device in accordance with the output residual.
- US2010152925A1 relates to a detection device comprising means for estimating, with the aid of a model, a reference position of an airfoil, as well as the values of parameters of said model making it possible to update it, and means for detecting an oscillatory fault with the aid of this reference position.
- Certain embodiments of the present invention seek to provide a method for detecting anomalies in any periodic or semi-periodic data.
- Certain embodiments of the present invention seek to provide a method for finding, fitting and subtracting periodic signals in order to identify and supply a real time alert on anomalous episodes.
- Certain embodiments of the present invention seek to provide a method for finding one or more periodicities of data e.g. using the Power Spectrum (Fourier Transform) or the PDM (Phase Dispersion Minimalization) technique, fitting the data with this period e.g. using the least squares method, and subtracting the fit from the data to show anomalies e.g. by utilizing the standard deviation of the residual data to define or determine the significance of an anomalous data-point.
- the Power Spectrum Freourier Transform
- PDM Phase Dispersion Minimalization
- Certain embodiments of the present invention seek to provide a method for finding anomalies and supplying a suitable alert, e.g. in real time, each anomaly including a sequence of anomalous points such that the probabilityof randomly obtaining such an anomaly are cumulative and thus very low.
- Certain embodiments of the present invention are applicable to data with multiple periodicities, multiple semi-periods or a combination of both, and to data in which the periodic variation appears less than all the time, e.g. daily between 8-10 am.
- a method wherein the monitoring includes subtracting each predicted data point from a corresponding physical data point thereby to generate a sequence of residual data points.
- a method comprising generating the predetermined information from previously physical data points.
- a method comprising displaying the residual data points to a user.
- the periodic variations include multi-periodic variations which are taken into account when identifying wayward points.
- a method wherein at least one period characterizing the periodic variations is found using a phase dispersion minimalization method.
- the physical data comprises data generated by a satellite.
- the physical data comprises GPS system data.
- a method wherein the physical data comprises north-finding system data.
- a method wherein the physical data comprises particle accelerator data.
- a method wherein the physical data comprises cardiac data.
- a method wherein the physical data comprises brain activity (EEG) data.
- EEG brain activity
- a method wherein the physical data comprises atomic clock data.
- a method wherein the physical data comprises oscillator data.
- a method wherein the physical data comprises pendulum data.
- the physical data comprises solar energy data having periodicity depending on the sun's periodicity.
- a method wherein the physical data comprises temperature data.
- a method wherein the physical data comprises electrical equipment data.
- a method wherein the physical data comprises computer component data.
- a computerized system for monitoring physical data for anomalies, which physical data are predictable given predetermined information comprising: a predetermined information data point generator operative to compute a sequence of model data points which the physical data, given predetermined information, can be expected to duplicate at each of a corresponding sequence of temporal sampling points; a wayward point monitor including a processor operative for monitoring the physical data including identifying wayward points within the physical data that are incongruous with the predetermined information; and, typically, an anomalous episode-prompted alarm generator operative for identifying anomalous episodes each including a cluster of wayward points satisfying predefined anomalous episode-defining criteria and generating, for each anomalous episode identified, an alarm including, typically, the statistical significance of the anomalous episode.
- a method wherein the physical system action comprises computerized generation of an anomaly event alert for a human operator.
- the physical system action comprises a computerized change in at least one operating parameter of equipment associated with the physical data.
- a method wherein the physical system action comprises computerized suspension of operation of equipment associated with the physical data, due to an anomaly alert.
- a method wherein the physical system action comprises a computerized initiation of a data back-up process, for data associated with the physical data.
- a method wherein the physical system action comprises computerized launching of an emergency procedure.
- a method wherein the physical system action comprises computerized initiation of re-calibration for equipment associated with the data.
- a method wherein the physical system action comprises computerized initiation of at least one predetermined test to diagnose reasons for anomaly.
- a method wherein the characteristics comprises a probability of at least the individual anomalous episode occurring by chance.
- a method wherein the physical system action comprises computerized generation of an anomaly event alert for an external system.
- the physical data comprises ambient temperature data generated by the satellite.
- a method comprising using the physical data generator to generate the physical data generator.
- a method comprising identifying as wayward points, those points within the sequence of residual data points whose divergence from zero conforms to a waywardness criterion.
- a method comprising identifying as wayward points, those points within the sequence of residual data points which diverge, at a level exceeding a threshold value, from the standard deviation of the residual data.
- a method wherein the threshold value is determined based on the number of points in the physical data.
- the physical data includes N points and wherein the monitoring includes subtracting each predicted data point from a corresponding physical data point thereby to generate a sequence of residual data points defining noise and identifying as wayward points, those points which diverge from noise by M standard deviations of the residual data, where M is higher than expected given N.
- the residual data points each define a divergence from zero and wherein the waywardness criterion comprises divergence from zero, of a point within the sequence of residual data points, which is larger, by a threshold amount, than most other residual data points' divergences from zero.
- a computer program product comprising a computer usable medium having a computer readable program code embodied therein, the computer readable program code adapted to be executed to implement any of the methods shown and described herein.
- the data are visually inspected to decide which of the methods shown herein to employ, or whether to employ a suitable combination of such methods.
- the visual inspection may for example be employed by a human user to determine how many periods to use and whether there is a semi-period, or perhaps a few, and which method to employ.
- the visual inspection step may be wholly or partially automated.
- the fit is effected simultaneously:
- the raw data are fitted with n periods simultaneously so as to obtain the best fit.
- the method does not, therefore, say, fit p1, subtract it, and fit p2 to the residual data, but instead, the method typically includes finding p1, initially subtracting it from the residual data so as to conclude that there is also p2, and then simultaneously fitting p1 and p2 to the raw data for a better fit. Nonetheless, in certain applications, the first, non-simultaneous, alternative may be employed.
- Semi-frequency inverse of the period parameter of a semi-period (1/period)
- a computer program product comprising a computer usable medium or computer readable storage medium, typically tangible, having a computer readable program code embodied therein, the computer readable program code adapted to be executed to implement any or all of the methods shown and described herein. It is appreciated that any or all of the computational steps shown and described herein may be computer-implemented. The operations in accordance with the teachings herein may be performed by a computer specially constructed for the desired purposes or by a general purpose computer specially configured for the desired purpose by a computer program stored in a computer readable storage medium.
- Any suitable processor, display and input means may be used to process, display e.g. on a computer screen or other computer output device, store, and accept information such as information used by or generated by any of the methods and apparatus shown and described herein; the above processor, display and input means including computer programs, in accordance with some or all of the embodiments of the present invention.
- processors workstation or other programmable device or computer or electronic computing device, either general-purpose or specifically constructed, used for processing; a computer display screen and/or printer and/or speaker for displaying; machine-readable memory such as optical disks, CDROMs, magnetic-optical discs or other discs; RAMs, ROMs, EPROMs, EEPROMs, magnetic or optical or other cards, for storing, and keyboard or mouse for accepting.
- processor includes a single processing unit or a plurality of distributed or remote such units.
- the above devices may communicate via any conventional wired or wireless digital communication means, e.g. via a wired or cellular telephone network or a computer network such as the Internet.
- the apparatus of the present invention may include, according to certain embodiments of the invention, machine readable memory containing or otherwise storing a program of instructions which, when executed by the machine, implements some or all of the apparatus, methods, features and functionalities of the invention shown and described herein.
- the apparatus of the present invention may include, according to certain embodiments of the invention, a program as above which may be written in any conventional programming language, and optionally a machine for executing the program such as but not limited to a general purpose computer which may optionally be configured or activated in accordance with the teachings of the present invention. Any of the teachings incorporated herein may wherever suitable operate on signals representative of physical objects or substances.
- computer and the term “computerized” should be broadly construed to cover any kind of electronic device with data processing capabilities, including, by way of non-limiting example, personal computers, servers, computing systems, communication devices, processors (e.g. digital signal processor (DSP), microcontrollers, field programmable gate array (FPGA), application specific integrated circuit (ASIC), etc.) and other electronic computing devices or devices with an embedded processor.
- processors e.g. digital signal processor (DSP), microcontrollers, field programmable gate array (FPGA), application specific integrated circuit (ASIC), etc.
- DSP digital signal processor
- FPGA field programmable gate array
- ASIC application specific integrated circuit
- Any suitable input device such as but not limited to a sensor, may be used to generate or otherwise provide information received by the apparatus and methods shown and described herein.
- Any suitable output device or display may be used to display or output information generated by the apparatus and methods shown and described herein.
- Any suitable processor may be employed to compute or generate information as described herein e.g. by providing one or more modules in the processor to perform functionalities described herein.
- Any suitable computerized data storage e.g. computer memory may be used to store information received by or generated by the systems shown and described herein.
- Functionalities shown and described herein may be divided between a server computer and a plurality of client computers. These or any other computerized components shown and described herein may communicate between themselves via a suitable computer network.
- FIG. 1 is a simplified flowchart illustration of a method for computerized monitoring of a system to be monitored, using data with at least one periodic component, all in accordance with certain embodiments of the present invention.
- the method of Fig. 1 typically comprises some or all of the following steps, suitably ordered e.g. as shown:
- the physical operation/s performed in step 70 are application specific and depend on the physical apparatus generating the data; it is appreciated that the data may for example include satellite data, GPS system data, north-finding system data (an example of a North finding system is described in United States Patent 5060392 ); particle accelerator data, cardiac data, brain data (EEG), atomic clock data; oscillator data; pendulum data; solar energy data having periodicity depending on the sun's periodicity; temperature data; electrical equipment data; computer component data.
- the alert may be accompanied by an indication of its statistical significance.
- decisions re operations to be initiated may be made in advance based inter alia on statistical significance. For example, if there is a problem with the temperature (say, 5 degrees too hot), with a significance level of 99.9999%, then shut down operation of satellite.
- Alert characteristics may indicate the significance e.g. an alarm that beeps louder when significance is higher.
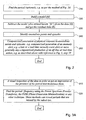
- Fig. 2 is a simplified flowchart illustration of a method for identifying anomalies in data having a single period.
- Fig. 2 ( Figs. 11A , 12 - 13 , 14 - 19 ).
- the method of Fig. 2 typically comprises some or all of the following steps, suitably ordered e.g. as shown: Step 210.
- this preliminary step may be manually done once, although it can also be performed automatically. It is noted that usually the periodic nature of the data is known in advance, i.e. a 1-day period caused by the rotation of the Earth, or a 90-minutes satellite period etc. If the period is known and stable then this step can be omitted.
- Step 220 Build a model (M)
- Step 230 Subtract the model (also termed herein "fit") from the data (D) and get the residual data (R).
- Step 240 Identify anomalous points and episodes
- Step 250 computerized generation of physical response to anomalous points and episodes e.g. computerized generation of an anomaly alert, e.g. a late or a real time anomaly event alert.
- the statistical threshold for an alert can be set in advance according to application-specific requirements. For example, a client may request more alerts, say anything that is higher than 95% significance, in which case 1 out of 20 cases will beep on average. Or, the client may request less alerts, say anything above 99.9999% significance in which case 1 out of 1 million cases will beep on average.
- the model that fits existing data can clearly be extrapolated in time and yield predictions for future data and thus supply real time alerts.
- Fig. 3A is a simplified flowchart illustration of a method for performing step 210 in the method of Fig. 2 , in accordance with certain embodiments of the present invention.
- the method of Fig. 3 typically comprises some or all of the following steps, suitably ordered e.g. as shown:
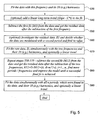
- Fig. 3B is a simplified flowchart illustration of a method for performing step 220 in the method of Fig. 2 , in accordance with certain embodiments of the present invention.
- the method of Fig. 3B typically comprises some or all of the following steps, suitably ordered e.g. as shown: Step 330.
- Fit the data with this frequency and its 10 (e.g.) harmonics: M A 0 + A 1 * sin 1 wt + ⁇ 1 + A 2 * sin 2 wt + ⁇ 2 + ... + A 10 * sin 10 wt + ⁇ 10
- the number of harmonics can be determined as per application-specific criteria e.g. reduced for variations that have a sinusoidal-like shape and for faster computing times, or increased for a better fit and sufficient computing resources. So, the number of harmonics need not be 10, this value being stipulated herein merely by way of example. Generally, the number of harmonicsit may be suitably determined e.g. as per application-specific criteria as described above, at a preliminary stage or decided automatically according to the fit e.g. by stopping as soon as adding more harmonics only slightly improves the fit. Quality of fit may for example be quantified as STD of the raw data minus the model and may be compared to a fixed pre-defined threshold value or to a predetermined ratio of the STD of the raw data e.g. 1% as described herein.
- an alternative equivalent model can be constructed from the mean shape of the periodic variation, simply by folding the data onto the frequency. The model is then several identical cycles of this mean shape, which may change over time.
- the following method may be employed: The subtraction of the fit yields the STD (standard deviation) of the residual data.
- STD standard deviation
- the process may be stopped once one goes below some limiting STD. For example:
- Figs. 14 (other than top panel) and 16 are relevant to this method of finding a suitable number of harmonics.
- a criterion for the presence of a linear trend can be determined in advance - i.e. use a trend only if the slope constant is larger that 0.001* A 1 .
- the decision can be manually made by a visual inspection of the data at step 1. It is noted that the linear fit and the fit of the frequency and its harmonic can be separately done (i.e. subtracting first the linear trend and then fitting the residual data with the period), but a better fit would be achieved when the two are combined in a single fit.
- MATLAB's polyfit function which fits a linear trend (aX+b) and yields data constants 'a' & 'b'.
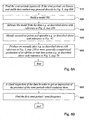
- Fig. 3C is a simplified flowchart illustration of a method for performing step 240 in the method of Fig. 2 , in accordance with certain embodiments of the present invention.
- the method of Fig. 3C typically comprises some or all of the following steps, suitably ordered e.g. as shown:
- an "episode” may be defined by receiving an application-specific e.g. user-selected significance threshold and selecting a suitable number of points to "fit" that significance. The higher the requested significance, the less points/episodes/alerts are generated. In 100,000 points, 99.999% significance means a single point on average, whereas 99.5% means 500 points on average.
- Fig. 4A is a simplified flowchart illustration of a method for computerized monitoring of a system to be monitored, using multi-periodic data generated by the system, in accordance with certain embodiments of the present invention.
- the method of Fig. 4A typically comprises some or all of the following steps, suitably ordered e.g. as shown: 4A: multi-periodic ( Figs. 29 - 34 ).
- Step 410 Find the periods (optional). For stable periods, i.e. periods which do not change over time, this preliminary step should be best manually done once, although it can also be performed automatically by fixing the maximum number of periods allowed for the model.
- Step 420 Build the model (M)
- Step 430 Subtract the model from the data e.g. as described above with reference to Fig. 2 , step 230
- Step 440 Identify anomalous points and episodes e.g. as described above with reference to Fig. 3C
- Step 450 Produce an anomaly alert e.g. as described above with reference to Fig. 2 , step 250
- Fig. 4B is a simplified flowchart illustration of a method for performing step 410 in the method of Fig. 4A , in accordance with certain embodiments of the present invention.
- the method of Fig. 4B typically comprises some or all of the following steps, suitably ordered e.g. as shown:
- steps 480 and 490 may include, if desired, checking whether more than one e.g. several periods are present, and if so, skipping appropriate steps in Fig. 4A .
- Fig. 5 is a simplified flowchart illustration of a method for performing step 420 in the method of Fig. 4A , in accordance with certain embodiments of the present invention.
- the method of Fig. 5 typically comprises some or all of the following steps, suitably ordered e.g. as shown: Step 530.
- Fit the data with this frequency and its 10 harmonics: M 1 A 0 + A 1 * sin 1 w 1 t + ⁇ 1 + A 2 * sin 2 w 1 t + ⁇ 2 + ... + A 10 * sin 10 w 1 t + ⁇ 10
- the number of harmonics can be reduced for variations that have a sinusoidal-like shape and for faster computing times, or increased for a better fit and sufficient computing resources.
- the optimal number of harmonics can be determined at a preliminary stage or decided automatically according to the fit - simply stop once adding more harmonics only slightly improves the fit.
- an alternative equivalent model can be constructed from the mean shape of the periodic variation, simply by folding the data onto the frequency. The model is then several identical cycles of this mean shape, which may change over time.
- a criterion for the presence of a linear trend can be determined in advance - i.e. use a trend only if the slope constant is larger that 0.001* A 1 .
- the decision can be manually made by a visual inspection of the data at step 1. It is noted that the linear fit and the fit of the frequency and its harmonic can be separately done (i.e. subtracting first the linear trend and then fitting the residual data with the period), but a better fit would be achieved when the two are combined in a single fit.
- the time input is kept intact, and the residual data are the differences between the raw data points and the first model at same time dots.
- Step 560 (optional) Investigate the residual data, R 1 and decide whether the data are modulated with a second period and find its value. This can be done by a visual inspection and by performing the methods listed in step 2 above, but this time on the residual data, R 1 , rather than the raw data, D.
- a successful fit should be defined according to the standard deviation of the residual data, or to the ratio between the standard deviation of the residual data and the standard deviation of the raw data.
- Fig. 6 is a simplified flowchart illustration of a method for computerized monitoring of a system to be monitored, using semi-periodic data generated by the system, e.g. as described below with reference to Figs. 20 - 24 , in accordance with certain embodiments of the present invention.
- the method of Fig. 6 typically comprises some or all of the following steps, suitably ordered e.g. as shown: Step 610: Find the semi-period (optional) e.g. as per Fig. 7A
- This preliminary step should be best manually done once, although it can also be performed automatically once the nature of the semi period is known - for example if the periodic variation appears only during certain time intervals of the day.
- This step and corresponding steps in other methods can be skipped, if the semi-period value and its semi-periodic nature (type of semi-period and parameters of that type) are known.
- This step can be performed automatically by pre-defining a type of semi-period to be identified in a particular application. For example, it may be desired to identify a semi-period that appears only during 3 successive hours of the day.
- the semi-period may be found automatically, particularly its type and parameters of its type are known in advance. For example, if the semi-period occurs only between 2-4 am, then a period search is conducted on only these data. However, a standard period search may also be fruitful even if the nature of the semi-period is unknown.
- Step 620 Build the model (M) e.g. as per Fig. 7B
- Step 630 Subtract the model from the data e.g. as per step 230 in Fig. 2
- Step 650 Produce an anomaly alert e.g. as per step 250 in Fig. 2
- Fig. 7A is a simplified flowchart illustration of a method for performing step 610 in the method of Fig. 6 , in accordance with certain embodiments of the present invention.
- the method of Fig. 7A typically comprises some or all of the following steps, suitably ordered e.g. as shown:
- Fig. 7B is a simplified flowchart illustration of a method for performing step 620 in the method of Fig. 6 , in accordance with certain embodiments of the present invention.
- the method of Fig. 7B typically comprises some or all of the following steps, suitably ordered e.g. as shown:
- Fig. 8A is a simplified flowchart illustration of a method for computerized monitoring of a system to be monitored, using multiple semi-periodic data (e.g. data, having multiple semi-periods) generated by the system, in accordance with certain embodiments of the present invention.
- the method of Fig. 8A typically comprises some or all of the following steps, suitably ordered e.g. as shown:
- Fig. 8B is a simplified flowchart illustration of a method for performing step 810 in the method of Fig. 8A , in accordance with certain embodiments of the present invention.
- the method of Fig. 8B typically comprises some or all of the following steps, suitably ordered e.g. as shown:
- Fig. 9 is a simplified flowchart illustration of a method for performing step 820 in the method of Fig. 8A , in accordance with certain embodiments of the present invention.
- the method of Fig. 9 typically comprises some or all of the following steps, suitably ordered e.g. as shown:
- one-period variations are typically handled, e.g. as per the method of Fig. 2 , before semi-periodic variations are handled, e.g. as per the method of Fig. 6 , unless the amplitudes of the former are very small compared with the amplitudes of the latter in which case semi-periodic variations may be handled first.
- the final fit is done for all periods and semi-periods together.
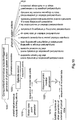
- Fig. 10 is a simplified functional block diagram illustration of a computerized data monitor system useful in performing certain methods shown and described herein such as the method of Fig. 1 .
- the system of Fig. 10 typically includes a Model data point generator 1010 which typically generates a sequence of predicted data points e.g., if a computational model is used for prediction, model data points.
- a physical data generator 1015 - one possible example being a satellite - generates a corresponding sequence of physical data which typically includes a very long sequence of data which may include hundreds, millions or even hundreds of millions and more of data elements.
- a Wayward point monitor processor 1020 receives and processes the corresponding sequences and identifies wayward temporal locations (wayward points e.g.) at which the physical data deviates from the model data points.
- An episode seeker 1030 uses predefined e.g. system-defined or user-defined anomalous episode defining criteria to generate an output indication of anomalous episodes.
- a computerized anomalous episode-triggered generator 1040 of physical system actions generates at least one physical system action responsive to the output indication of anomalous episodes generated by episode seeker 1030.
- the system action so generated may for example include one or more of the following: computerized generation of anomaly event alert for human operators; computerized generation of anomaly event alert for external systems, computerized change in operating parameters of equipment generating data, computer-initiated pause in equipment operation e.g. if episodes found are indicative of dangerous malfunction, computerized initiation of data back-up, computerized launching of emergency procedure e.g. if episodes found are indicative of danger which requires such procedures, computerized initiation of re-calibration for equipment generating data e.g. automatic control equipment associated therewith e.g. if episodes found are indicative of a need for re-calibration, computerized initiation of predetermined tests to diagnose reasons for anomaly, or computerized progress to a subsequent stage in a multi-stage procedure.
- the wayward points may be those at which the physical data strays to more than a predetermined extent, from the model data predicted by the model.
- the system of Fig. 10 may be operative to identify onset of one or more special events whose effect on the physical data is at least partly or even completely known to the system, but whose onset or onsets, are not known.
- the system might identify onset of occurrence of at least one route modification from a library of known route modifications which are partially or entirely known other than time of onset.
- the system may act upon detected onsets of special events, in accordance with a pre-determined logical schedule of physical actions contingent upon data analysis for identifying special events in accordance with the methods shown and described herein, mutatis mutandis.
- At least one predicted data point, of at least one of said special events may be subtracted from a corresponding physical data point thereby to generate a sequence of residual data points defining noise. Points which diverge from the noise by M standard deviations of the residual data, where M is higher than expected given N, may then be identified as wayward points.
- Fig. 10 may if desired be employed to operate upon a sequence of physical data which is not periodic but nonetheless is predictable in the sense that the data exhibits a known behavior which is not periodic.
- Figs. 11A - 19 are examples of an application of the method of Fig. 2 to satellite data.
- Fig. 11A is a graph of a first stream of data vs. time which is almost completely sinusoidal.
- Fig. 11B is a power spectrum (power vs. frequency) graph for the data of Fig. 11A showing a strong first harmonic at a one day period and a second weaker harmonic having a 0.5 day period
- Fig. 12 is a set of 5 graphs respectively showing the data of Fig. 11A , first harmonic fit, residuals from the first harmonic fit, second harmonic fit and residuals from the second harmonic fit.
- the standard deviation of the residual data is indicated, in this figure and in similar figures described herein, on the relevant panels (graphs).
- Fig. 13 is a set of 4 graphs respectively showing a 10-harmonic fit to the data of Fig. 11A , the residuals thereof, a 20-harmonic fit to the data of Fig. 11A , and the residuals thereof. It is appreciated that as harmonics are added, the standard deviation decreases, as shown.
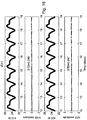
- Fig. 14 is a set of 5 graphs respectively showing a second stream of data which is less sinusoidal than the data of Fig. 11A ; a first harmonic fit thereto which is less successful than the first harmonic fit of Fig. 12 , residuals from the first harmonic fit to the second stream of data, second harmonic fit to the second stream of data, and residuals from the second harmonic fit.
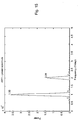
- Fig. 15 is a power spectrum (power vs. frequency) graph for the data of Fig. 14 showing a second harmonic which, since the data are less sinusoidal, is much stronger than the second harmonic of Fig. 11B , relative to the first harmonic.
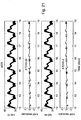
- Fig. 16 is a set of 4 graphs respectively showing a 10-harmonic fit to the second data stream of Fig. 14 , the residuals thereof, a 20-harmonic fit to the data of Fig. 14 , and the residuals thereof. It is appreciated that as harmonics are added, the standard deviation decreases, as shown.
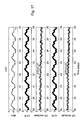
- Fig. 17 is a set of 5 graphs respectively showing a third stream of data; a first harmonic fit thereto, residuals from the first harmonic fit to the second stream of data, second harmonic fit to the fourth stream of data, and residuals from the second harmonic fit.
- Fig. 18 is a set of 4 graphs respectively showing a 10-harmonic fit to the third data stream of Fig. 17 , the residuals thereof, a 20-harmonic fit to the data of Fig. 17 , and the residuals thereof, which show a slope which remains after all 20 harmonics have been fitted. It is appreciated that as harmonics are added, the standard deviation decreases, as shown. The residual data still is characterized by a slope.
- Fig. 19 is a set of 5 graphs in which a first degree polynomial, with a slope as determined from the last graph of Fig. 18 , is first subtracted from the third data stream of Fig. 17 , and using the difference data, graphs of a 10-harmonic fit, the residuals thereof, a 20-harmonic fit, and the residuals thereof, are shown.
- the residual data have no slope and the final standard deviation (0.073, in the illustrated example) after subtracting the slope is significantly lower than without this term, as shown in Fig. 18 .
- Figs. 20 - 24 are examples of an application of the method of Fig. 6 .
- Fig. 20 is a set of 5 graphs respectively showing a fourth data stream, first harmonic fit, residuals from the first harmonic fit, second harmonic fit and residuals from the second harmonic fit.
- Fig. 21 is a set of 4 graphs respectively showing a 10-harmonic fit to the fourth data stream of Fig. 20 , the residuals thereof, a 20-harmonic fit to the data of Fig. 17 , and the residuals thereof. It is appreciated that as harmonics are added, the standard deviation decreases as shown.
- Fig. 22 is a set of 4 graphs respectively showing a 10-harmonic fit to a fifth data stream, the residuals thereof, a 20-harmonic fit, and the residuals thereof.
- Fig. 23 is a set of 4 graphs respectively showing a 10-harmonic fit to a sixth data stream, the residuals thereof, a 20-harmonic fit, and the residuals thereof.
- Fig. 24 shows an enlarged view of the seixth data stream of Fig. 23 , showing that the data are modulated with a 1-day period, but in addition, there is also a semi-period that only appears during certain hours of the day and is inactive at other times.
- Figs. 20 - 24 are examples of operation of steps 310 and 320 of Fig. 3A pertaining to visual inspection of data and period and semi-period finding, respectively.
- steps 310 and 320 of Fig. 3A pertaining to visual inspection of data and period and semi-period finding, respectively.
- To find a semi period that only appears during certain cycles of a, say, 1-day period it is possible to determine, automatically or by inspection, when the semi-period is active, use only these data to find the value of the semi period, and build a model where the semi period is active only during activity hours, and zero elsewhere.
- visual or automated inspection of Figs. 23 and 24 may yield that the data has two semi periods, one at the beginning of the day, and one at the end.
- the mean shape of the 1-d variation may be subtracted to achieve a good fit.
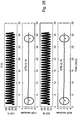
- Fig. 25 is a set of 5 graphs respectively showing a seventh data stream, first harmonic fit, residuals from the first harmonic fit, second harmonic fit and residuals from the second harmonic fit. Two anomalous episodes in the first data sequence are clearly identifiable in the residuals from the second harmonic fit and are indicated by bubbles.
- Fig. 26 is a set of 4 graphs respectively showing a 10-harmonic fit to the data of Fig. 25 , the residuals thereof, a 20-harmonic fit to the data of Fig. 11A , and the residuals thereof.
- Fig. 27 is a set of 5 graphs respectively showing an eighth data stream, first harmonic fit, residuals from the first harmonic fit, second harmonic fit and residuals from the second harmonic fit. Two anomalous episodes in the first data sequence are clearly identifiable in the residuals from the second harmonic fit and are indicated by bubbles.
- Fig. 28 is a set of 4 graphs respectively showing a 10-harmonic fit to the data of Fig. 27 , the residuals thereof, a 20-harmonic fit to the data of Fig. 11A , and the residuals thereof.
- anomalous episodes rise higher above the noise as more harmonics are subtracted.
- Figs. 29 -34 are an example of an application of the method of Fig. 4A .
- Fig. 29 is a pair of graphs including (top panel) a ninth data stream, which spans over a full year. A half-year period may be identified automatically or by a visual inspection, and the first harmonic fit is shown. The bottom panel shows a zoom into the first month, in which a one-day period is seen to occur. The presence of the half-year period is, of course, not apparent since the bottom graph's domain is only 30 days.
- Fig. 30 is a power spectrum (power vs. frequency) graph for the data of Fig. 29 , including a top graph with a one-day period and a bottom graph, which is a zoom into small frequencies, as shown on the left side of the top panel, with a half year period, which shows a large error.
- Fig. 31 is a graph of a 6-harmony fit for the two periods of the ninth data stream. It is appreciated that the long, half-year period is not entirely stable as is apparent from the truncated crest of the second peak (at about 220 - 300 days).
- Fig. 32 is an enlargement of the graph of Fig. 31 , over only 30 days vs. the one year domain of the graph of Fig. 31 .
- Fig. 33 is a set of graphs each showing 5 days-worth of the data of Fig. 31 . Adjacent graphs are 2 months apart.
- Fig. 34 is a graph of a sixth-harmonic residual of the ninth data stream; in which anomalous episodes are identifiable, although the residual has a greater variance than the residuals, say in Figs. 12 - 14 and 16 .
- Fig. 29 corresponds to step 480.
- the visual inspection of the data shows that there are two periods. The presence of the two periods is evident by a visual inspection. The presence of the second period may only be apparent a by visual inspection of the residuals or even only by analyzing the power spectrum of the residual data.
- Fig. 30 corresponds to step 490 of Fig. 4A . Inspection of the power spectrum shows that there are two periods, such that the residual data after the subtraction of the first period need not be checked in order to identify presence of the second period.
- Fig. 31 corresponds to step 570, showing the fit.
- Fig. 34 corresponds to steps 430 and 440 in which the model is subtracted from the data and anomalous points and episodes are identified; significance computations are not shown.
- system monitoring based on at least semi-periodic data may be entirely computerized, e.g. by providing preliminary definitions of a maximum number of periods and/or semi-periods to use, and pre-defining range of allowed periods (e.g. 0.1 - 100 day) and/or maximum number of harmonics which may be used; and/or minimum threshold level of noise to achieve, and possibly other parameters.
- the periodic, semi-periodic, multi-periodic methods shown herein may be provided as user-selectable operation modes of a monitoring system in which case the user, based on visual inspection of the data, would select a suitable mode and would even parameterize e.g. might key in one or more of:
- a human user might key in information indicating that there is a period of ⁇ 1 day, which is very sinusoidal, so few harmonics need be employed, and the monitoring system would select and parameterize a method accordingly.
- a human user might key in information indicating that there is a period of ⁇ 1 day, which is somewhat sinusoidal, so a medium number of harmonics may be employed.
- the monitoring system would select and parameterize a method accordingly.
- a human user might key in information indicating that there is a period of ⁇ 1 day, which is somewhat sinusoidal, so a medium number of harmonics may be employed. A human user may also determine that a linear trend is present.
- the monitoring system may receive this information via a suitable user interface and may select and parameterize a method accordingly.
- a human user might key in information indicating that there is a period of ⁇ 1 day, and a semi-period of ⁇ 0.1 day that appears during certain hours of the day.
- a user's visual inspection of Fig. 22 may show that in addition to the 1-d period, there is a shorter period (rough estimate by eye ⁇ 0.05 day) that appears only between phases ⁇ 0.25 - ⁇ 0.75 (rough estimate by eye) of the 1-day cycle.
- the monitoring system would select and parameterize a method accordingly (e.g. would use the method of Fig. 4A rather than, say, the method of Fig. 2 ).
- the following analysis may be performed: find the cycle intervals where the semi-period is active and check only these data. Compute the power spectrum to find the semi-period value, and then build the semi-period fit only for these intervals, using zero for the time intervals where it is inactive. This may be done automatically, if suitable parameters are defined in advance. Alternatively, check whether a mean shape of the 1-day period is a good fit to the data and subtract it to find anomalies.
- a human user might key in information indicating that there is a period of ⁇ 1 day, which is very sinusoidal, so few harmonics are needed.
- the monitoring system would select and parameterize a method accordingly.
- a human user might key in information indicating that there are two periods of ⁇ 1 day & ⁇ 180 day.
- the monitoring system would select and parameterize a method accordingly.
- the monitoring system may provide a "trial run" to check that a user-selected model works, before reverting to automatic monitoring mode.
- anomalous points when identifying wayward points, also termed herein “anomalous points", the average of the residual data, which should be zero or very near zero for a poor fit, is typically not used as a criterion in order to find the anomalous points. Instead the standard deviation (STD) of the data is thresholded to identify these points. Since the residual points are typically normally distributed around zero, with positive as well as negative points, the more points available, the higher the chance to find points at the edge of the distribution, and this typically determines the threshold which is used to identify wayward points. Specifically, assuming normal distribution, about 70% of all points are found within one STD (-1sigma - +1sigma). About 99% of all points are found within ⁇ 2 STD (-2sigma - +2sigma), etc.
- STD standard deviation
- software components of the present invention including programs and data may, if desired, be implemented in ROM (read only memory) form including CDROMs, EPROMs and EEPROMs, or may be stored in any other suitable computer-readable medium such as but not limited to disks of various kinds, cards of various kinds and RAMs.
- ROM read only memory
- EEPROM electrically erasable programmable read-only memory
- Components described herein as software may, alternatively, be implemented wholly or partly in hardware, if desired, using conventional techniques.
- components described herein as hardware may, alternatively, be implemented wholly or partly in software, if desired, using conventional techniques.
- Any computer-readable or machine-readable media described herein is intended to include non-transitory computer- or machine-readable media.
- Any computations or other forms of analysis described herein may be performed by a suitable computerized method. Any step described herein may be computer-implemented.
- the invention shown and described herein may include (a) using a computerized method to identify a solution to any of the problems or for any of the objectives described herein, the solution optionally include at least one of a decision, an action, a product, a service or any other information described herein that impacts, in a positive manner, a problem or objectives described herein; and (b) outputting the solution.
Landscapes
- Engineering & Computer Science (AREA)
- Physics & Mathematics (AREA)
- Artificial Intelligence (AREA)
- Evolutionary Computation (AREA)
- Mathematical Physics (AREA)
- General Physics & Mathematics (AREA)
- Theoretical Computer Science (AREA)
- Automation & Control Theory (AREA)
- Data Mining & Analysis (AREA)
- Computing Systems (AREA)
- General Engineering & Computer Science (AREA)
- Software Systems (AREA)
- Computational Linguistics (AREA)
- Alarm Systems (AREA)
- Testing And Monitoring For Control Systems (AREA)
Claims (17)
- Computer-implementiertes Verfahren zur Überwachung physikalischer Daten, die von einem physikalischen Datengenerator generiert werden, auf Anomalien, wobei die physikalischen Daten in Abhängigkeit von vorherbestimmten Informationen prädizierbar sind, die den physikalischen Datengenerator charakterisieren, wobei das Verfahren umfasst:Verwenden der vorherbestimmten Informationen, um eine Sequenz prädizierter Datenpunkte zu berechnen, von denen erwartet werden kann, dass die physikalischen Daten, aufgrund der vorherbestimmten Informationen, diese an jedem von einer entsprechenden Sequenz zeitlicher Abtastpunkte duplizieren; undEmpfangen der physikalischen Daten und Identifizieren abweichender Punkte innerhalb der physikalischen Daten, die inkongruent mit den vorherbestimmten Informationen sind;dadurch gekennzeichnet, dass die physikalischen Daten umfassen, die von einem Satelliten generiert werden, und ferner dadurch gekennzeichnet, dass der Schritt des Verwendens der vorherbestimmten Informationen umfasst:Finden (10) von Periodizitäten periodischer, semi-periodischer, multi-periodischer, mehrfacher semi-periodischer oder multi-periodischer und mehrfacher semi-periodischer Daten; undAnpassen (20) der Daten mit den Periodizitäten; undSubtrahieren (30) der Anpassung von den Daten, um Restdaten zu generieren; undwobei das Identifizieren abweichender Punkte ein Identifizieren (40) abnormaler Punkte über einem bestimmten Niveau von Standardabweichungen in den Restdaten umfasst.
- Verfahren nach Anspruch 1, wobei die Daten durch periodische Variationen gekennzeichnet sind, und die periodischen Variationen berücksichtigt werden, wenn abweichende Punkte identifiziert werden.
- Verfahren nach Anspruch 2, wobei mindestens eine Periode, welche die periodischen Variationen kennzeichnet, unter Verwendung einer FFT-basierten Methode gefunden wird.
- Verfahren nach Anspruch 2, wobei mindestens eine Periode, welche die periodischen Variationen kennzeichnet, unter Verwendung einer Phasendispersionminimierung gefunden wird.
- Verfahren nach Anspruch 1, und auch umfassend ein Identifizieren abnormaler Episoden, welche jeweils einen Cluster der abweichenden Punkte umfassen, die vordefinierte abnormale episodendefinierende Kriterien erfüllen, und unter Verwendung eines Prozessors, um eine physikalische Systemaktion ansprechend auf mindestens eine identifizierte abnormale Episode auszulösen.
- Verfahren nach Anspruch 5, wobei die physikalische Systemaktion mindestens eine umfasst von:einer computerisierten Änderung in mindestens einem Betriebsparameter von Ausrüstung, die mit den physikalischen Daten assoziiert ist;einer computerisierten Betriebsaussetzung von Ausrüstung, die mit den physikalischen Daten assoziiert ist; undeiner computerisierten Initiierung mindestens eines von:einem Daten-Back-up-Prozess für Daten, die mit den physikalischen Daten assoziiert sind;einer Rekalibrierung für Ausrüstung, die mit den physikalischen Daten assoziiert ist; undmindestens einem vorherbestimmten Test, um Gründe für die Anomalie zu diagnostizieren.
- Verfahren nach Anspruch 5, wobei die physikalische Systemaktion ein computerisiertes Starten einer Notfallprozedur umfasst.
- Verfahren nach Anspruch 5, wobei die physikalische Systemaktion eine computerisierte Generierung mindestens eines umfasst von:einem Anomalieereignisalarm für ein externes System; undeinem Anomalieereignisalarm für einen menschlichen Bediener.
- Verfahren nach Anspruch 1, wobei eine Anpassung gleichzeitig bewirkt wird durch das Anpassen von Rohdaten mit n Perioden gleichzeitig, um so die beste Anpassung zu erhalten, umfassend: Finden einer ersten Periode, anfängliches Subtrahieren der ersten Periode von den Restdaten, um so zu dem Schluss zu kommen, dass auch eine zweite Periode vorliegt, und dann gleichzeitiges Anpassen der ersten und zweiten Periode an die Rohdaten, so dass einmal die Anzahl von Perioden bestimmt wird.
- Verfahren nach Anspruch 1, und auch umfassend ein Identifizieren, als abweichende Punkte, jener Punkte innerhalb der Sequenz von Restdatenpunkten, deren Divergenz von Null mit einem Abweichungskriterium konform ist.
- Verfahren nach Anspruch 1, und auch umfassend ein Identifizieren, als abweichende Punkte, jener Punkte innerhalb der Sequenz von Restdatenpunkten, die, auf einem Niveau, das einen Schwellenwert überschreitet, von der Standardabweichung der Restdaten divergieren.
- Verfahren nach Anspruch 9, wobei die Restdatenpunkte jeweils eine Divergenz von Null definieren, und wobei das Abweichungskriterium eine Divergenz von Null umfasst, eines Punkts innerhalb der Sequenz von Restdatenpunkten, der größer ist, um einen Schwellenbetrag, als die meisten anderen Restdatenpunktdivergenzen von Null.
- Verfahren nach Anspruch 1, und auch umfassend:
Identifizieren des Beginns mindestens eines speziellen Ereignisses, dessen Effekt auf die physikalischen Daten mindestens teilweise bekannt ist, dessen Beginn jedoch nicht bekannt ist, wobei das Verfahren umfasst:Subtrahieren mindestens eines prädizierten Datenpunkts, mindestens eines der speziellen Ereignisse, von einem entsprechenden physikalischen Datenpunkt, um dadurch eine Sequenz von Restdatenpunkten zu generieren, die ein Rauschen definieren; undIdentifizieren, als abweichende Punkte, jener Punkte, die von dem Rauschen um M Standardabweichungen der Restdaten divergieren, wobei M höher ist als erwartet gegenüber N. - Computerisiertes System zur Überwachung physikalischer Daten auf Anomalien, wobei die physikalischen Daten in Abhängigkeit von vorherbestimmten Informationen prädizierbar sind, wobei das System umfasst:einen vorherbestimmten Informationsdatenpunkt-Generator, der betreibbar ist, eine Sequenz von Modelldatenpunkten (M) zu berechnen, von denen erwartet werden kann, dass die physikalischen Daten, aufgrund vorherbestimmter Informationen, diese an jedem von einer entsprechenden Sequenz zeitlicher Abtastpunkte duplizieren;einen Abweichungspunktmonitor, welcher einen Prozessor umfasst, der zur Überwachung der physikalischen Daten betreibbar ist, umfassend ein Identifizieren abweichender Punkte innerhalb der physikalischen Daten, die inkongruent mit den vorherbestimmten Informationen sind; undeinen durch ein anomales Ereignis ausgelösten Alarmgenerator, der betreibbar ist, anomale Episoden zu identifizieren, welche jeweils einen Cluster von abweichenden Punkten umfassen, die vordefinierte anomale Episoden definierende Kriterien erfüllen, und einen Alarm für jede identifizierte anomale Episode zu generieren;dadurch gekennzeichnet, dass die physikalischen Daten umfassen, die von einem Satelliten generiert werden; undferner dadurch gekennzeichnet, dassüber eine Benutzerschnittstelle, ein menschlicher Benutzer Eingaben in die Systeminformationen vornimmt, die anzeigen, dass eine Periode oder Semi-Periode mit einer gegebenen Dauer vorhanden ist, oder die das Vorliegen eines linearen Trends anzeigen, wenn eine Semi-Periode angezeigt wird, wobei das System betreibbar ist, Zyklusintervalle zu finden, wo die Semi-Periode aktiv ist, und nur diese Daten zu prüfen, ein Energiespektrum zu berechnen, um den Wert der Semi-Periode zu finden, und die die Semi-Periodenanpassung nur für die Intervalle aufzubauen, unter Verwendung von Null für Intervalle, wo die Semi-Periode inaktiv ist.
- System nach Anspruch 14, wobei das Modell eine 90-Minuten-Satellitenperiode umfasst.
- System nach Anspruch 14, wobei das Modell die Umdrehungsperiode eines Tages der Erde umfasst.
- Computerprogrammprodukt, umfassend ein auf einem Computer verwendbares Medium mit einem darin verkörperten computerlesbaren Programmcode, wobei der computerlesbare Programmcode geeignet ist, ausgeführt zu werden, um ein computerisiertes Verfahren zur Überwachung physikalischer Daten, die von einem physikalischen Datengenerator generiert werden, auf Anomalien zu implementieren, wobei die physikalischen Daten in Abhängigkeit von vorherbestimmten Informationen prädizierbar sind, die den physikalischen Datengenerator charakterisieren, wobei das Verfahren umfasst:Verwenden der vorherbestimmten Informationen, um eine Sequenz prädizierter Datenpunkte zu berechnen, von denen erwartet werden kann, dass die physikalischen Daten, aufgrund der vorherbestimmten Informationen, diese an jedem von einer entsprechenden Sequenz zeitlicher Abtastpunkte duplizieren; undEmpfangen der physikalischen Daten und Identifizieren abweichender Punkte innerhalb der physikalischen Daten, die inkongruent mit den vorherbestimmten Informationen sind;dadurch gekennzeichnet, dass die physikalischen Daten umfassen, die von einem Satelliten generiert werden, undferner dadurch gekennzeichnet, dass das computerisierte Verfahren zur Überwachung einen Versuchslauf bereitstellt, um zu prüfen, dass ein von einem Bediener ausgewähltes Modell arbeitet, bevor auf einen automatischen Überwachungsmodus zurückgegriffen wird.
Applications Claiming Priority (2)
| Application Number | Priority Date | Filing Date | Title |
|---|---|---|---|
| IL210358A IL210358A (en) | 2010-12-29 | 2010-12-29 | A computerized system for monitoring and controlling physical devices that generate information |
| PCT/IL2011/050067 WO2012090199A2 (en) | 2010-12-29 | 2011-12-19 | Computerized system for monitoring and controlling physical data-producing apparatus |
Publications (3)
| Publication Number | Publication Date |
|---|---|
| EP2659409A2 EP2659409A2 (de) | 2013-11-06 |
| EP2659409A4 EP2659409A4 (de) | 2017-08-23 |
| EP2659409B1 true EP2659409B1 (de) | 2019-03-20 |
Family
ID=44262501
Family Applications (1)
| Application Number | Title | Priority Date | Filing Date |
|---|---|---|---|
| EP11852387.7A Active EP2659409B1 (de) | 2010-12-29 | 2011-12-19 | Computergestütztes system zur überwachung und steuerung eines geräts zur erzeugung von physikalischen daten |
Country Status (4)
| Country | Link |
|---|---|
| US (1) | US8805763B2 (de) |
| EP (1) | EP2659409B1 (de) |
| IL (1) | IL210358A (de) |
| WO (1) | WO2012090199A2 (de) |
Families Citing this family (2)
| Publication number | Priority date | Publication date | Assignee | Title |
|---|---|---|---|---|
| US11321164B2 (en) | 2020-06-29 | 2022-05-03 | International Business Machines Corporation | Anomaly recognition in information technology environments |
| CN112380044B (zh) * | 2020-12-04 | 2024-05-28 | 腾讯科技(深圳)有限公司 | 数据异常检测方法、装置、计算机设备和存储介质 |
Family Cites Families (21)
| Publication number | Priority date | Publication date | Assignee | Title |
|---|---|---|---|---|
| US4204225A (en) | 1978-05-16 | 1980-05-20 | Wisconsin Alumni Research Foundation | Real-time digital X-ray subtraction imaging |
| US5060392A (en) | 1990-07-09 | 1991-10-29 | Allied-Signal Inc. | North finding system |
| US6850252B1 (en) * | 1999-10-05 | 2005-02-01 | Steven M. Hoffberg | Intelligent electronic appliance system and method |
| US20050192727A1 (en) * | 1994-05-09 | 2005-09-01 | Automotive Technologies International Inc. | Sensor Assemblies |
| US6768944B2 (en) * | 2002-04-09 | 2004-07-27 | Intelligent Technologies International, Inc. | Method and system for controlling a vehicle |
| US6904110B2 (en) | 1997-07-31 | 2005-06-07 | Francois Trans | Channel equalization system and method |
| US7024335B1 (en) * | 1998-04-15 | 2006-04-04 | The Texas A&M University System | Condition assessment and life expectancy prediction for devices |
| AU4690899A (en) | 1998-06-18 | 2000-01-05 | Kline & Walker Llc | Automated devices to control equipment and machines with remote control and accountability worldwide |
| EP1620676A4 (de) * | 2003-05-05 | 2011-03-23 | Philips Solid State Lighting | Beleuchtungsverfahren und -systeme |
| US7222302B2 (en) * | 2003-06-05 | 2007-05-22 | International Business Machines Corporation | Method and apparatus for generating it level executable solution artifacts from the operational specification of a business |
| CN101442712B (zh) * | 2003-11-07 | 2013-07-17 | 株式会社日立制作所 | 无线通信系统、基站、无线终端以及无线通信方法 |
| US7646029B2 (en) * | 2004-07-08 | 2010-01-12 | Philips Solid-State Lighting Solutions, Inc. | LED package methods and systems |
| EP1787220A2 (de) | 2004-08-09 | 2007-05-23 | Verix Ltd. | Verfahren und system zum analysieren mehrdimensionaler daten |
| US8423125B2 (en) | 2004-11-09 | 2013-04-16 | Spectrum Dynamics Llc | Radioimaging |
| US7558622B2 (en) | 2006-05-24 | 2009-07-07 | Bao Tran | Mesh network stroke monitoring appliance |
| WO2008003148A1 (en) | 2006-07-06 | 2008-01-10 | Biorics Nv | Real-time monitoring and control of physical and arousal status of individual organisms |
| US7885976B2 (en) * | 2007-02-23 | 2011-02-08 | International Business Machines Corporation | Identification, notification, and control of data access quantity and patterns |
| FR2925182B1 (fr) | 2007-12-18 | 2021-07-02 | Airbus France | Procede et dispositif de detection de pannes oscillatoires dans une chaine d'asservissement en position d'une gouverne d'aeronef. |
| GB0807775D0 (en) * | 2008-04-29 | 2008-06-04 | Romax Technology Ltd | Methods for model-based diagnosis of gearbox |
| FR2939170B1 (fr) * | 2008-11-28 | 2010-12-31 | Snecma | Detection d'anomalie dans un moteur d'aeronef. |
| JP4599449B2 (ja) * | 2009-04-15 | 2010-12-15 | 株式会社東芝 | 電子機器及び通信制御方法 |
-
2010
- 2010-12-29 IL IL210358A patent/IL210358A/en active IP Right Grant
-
2011
- 2011-12-19 EP EP11852387.7A patent/EP2659409B1/de active Active
- 2011-12-19 WO PCT/IL2011/050067 patent/WO2012090199A2/en not_active Ceased
- 2011-12-19 US US13/977,344 patent/US8805763B2/en not_active Expired - Fee Related
Non-Patent Citations (1)
| Title |
|---|
| None * |
Also Published As
| Publication number | Publication date |
|---|---|
| US20130325785A1 (en) | 2013-12-05 |
| EP2659409A4 (de) | 2017-08-23 |
| WO2012090199A3 (en) | 2013-10-17 |
| US8805763B2 (en) | 2014-08-12 |
| IL210358A (en) | 2016-09-29 |
| EP2659409A2 (de) | 2013-11-06 |
| WO2012090199A2 (en) | 2012-07-05 |
| IL210358A0 (en) | 2011-06-30 |
Similar Documents
| Publication | Publication Date | Title |
|---|---|---|
| US11165799B2 (en) | Anomaly detection and processing for seasonal data | |
| Orchard et al. | A particle filtering-based framework for real-time fault diagnosis and failure prognosis in a turbine engine | |
| Hu et al. | Online performance assessment method for a model-based prognostic approach | |
| US6567752B2 (en) | General method for tracking the evolution of hidden damage or other unwanted changes in machinery components and predicting remaining useful life | |
| Mathew et al. | Failure mechanisms based prognostics | |
| US20090281735A1 (en) | Method, apparatus and computer program product for determining a future time of a component | |
| Wen et al. | Bearing remaining useful life prediction based on a nonlinear wiener process model | |
| Hongxia et al. | Study on predictive maintenance strategy | |
| EP2941640A1 (de) | Probabilistische modellierung und ordnung von eingebetteten fehlern in zerstörungsfreien inspektionen zur prognose von ermüdungsschäden und zur bewertung einer strukturellen integrität | |
| JP2002509324A (ja) | センサおよびプロセスの超高感度監視 | |
| US20170038280A1 (en) | Analyzing equipment degradation for maintaining equipment | |
| US9933353B2 (en) | Method for assessing corroded pipeline defect growth from partial inspection data and devices thereof | |
| US20200019153A1 (en) | Real-Time Automation for Monitor and Control of Electro-Mechanical System | |
| US20160097698A1 (en) | Estimating remaining usage of a component or device | |
| Bechhoefer et al. | Generalized prognostics algorithm using Kalman smoother | |
| Catelani et al. | Toward a new definition of FMECA approach | |
| US20250133099A1 (en) | Sequential event modeling from multivariate categorical sensor data | |
| Vayyasi | Optimizing factory maintenance and downtime prediction through Java-driven AI pipelines | |
| Mauša et al. | Multivariate logistic regression prediction of fault-proneness in software modules | |
| EP2659409B1 (de) | Computergestütztes system zur überwachung und steuerung eines geräts zur erzeugung von physikalischen daten | |
| Cui et al. | Intermittent failure process and false alarm interaction modelling of threshold-based monitoring built-in tests (BITs) | |
| Gurrapu et al. | A Machine Learning Framework for Fault Detection in IoT Enabled Smart Sensor Networks | |
| US20220058075A1 (en) | Identifying faults in system data | |
| US20160170395A1 (en) | Case management linkage of updates, evidence, and triggers | |
| US11320813B2 (en) | Industrial asset temporal anomaly detection with fault variable ranking |
Legal Events
| Date | Code | Title | Description |
|---|---|---|---|
| PUAI | Public reference made under article 153(3) epc to a published international application that has entered the european phase |
Free format text: ORIGINAL CODE: 0009012 |
|
| 17P | Request for examination filed |
Effective date: 20130729 |
|
| AK | Designated contracting states |
Kind code of ref document: A2 Designated state(s): AL AT BE BG CH CY CZ DE DK EE ES FI FR GB GR HR HU IE IS IT LI LT LU LV MC MK MT NL NO PL PT RO RS SE SI SK SM TR |
|
| R17D | Deferred search report published (corrected) |
Effective date: 20131017 |
|
| RIC1 | Information provided on ipc code assigned before grant |
Ipc: G01C 21/34 20060101AFI20140502BHEP |
|
| DAX | Request for extension of the european patent (deleted) | ||
| REG | Reference to a national code |
Ref country code: DE Ref legal event code: R079 Ref document number: 602011057420 Country of ref document: DE Free format text: PREVIOUS MAIN CLASS: G06F0019000000 Ipc: G01C0021340000 |
|
| A4 | Supplementary search report drawn up and despatched |
Effective date: 20170724 |
|
| RIC1 | Information provided on ipc code assigned before grant |
Ipc: G05B 23/02 20060101ALI20170718BHEP Ipc: G01C 21/34 20060101AFI20170718BHEP |
|
| GRAP | Despatch of communication of intention to grant a patent |
Free format text: ORIGINAL CODE: EPIDOSNIGR1 |
|
| STAA | Information on the status of an ep patent application or granted ep patent |
Free format text: STATUS: GRANT OF PATENT IS INTENDED |
|
| INTG | Intention to grant announced |
Effective date: 20181123 |
|
| GRAS | Grant fee paid |
Free format text: ORIGINAL CODE: EPIDOSNIGR3 |
|
| GRAA | (expected) grant |
Free format text: ORIGINAL CODE: 0009210 |
|
| STAA | Information on the status of an ep patent application or granted ep patent |
Free format text: STATUS: THE PATENT HAS BEEN GRANTED |
|
| AK | Designated contracting states |
Kind code of ref document: B1 Designated state(s): AL AT BE BG CH CY CZ DE DK EE ES FI FR GB GR HR HU IE IS IT LI LT LU LV MC MK MT NL NO PL PT RO RS SE SI SK SM TR |
|
| REG | Reference to a national code |
Ref country code: GB Ref legal event code: FG4D |
|
| REG | Reference to a national code |
Ref country code: CH Ref legal event code: EP |
|
| REG | Reference to a national code |
Ref country code: DE Ref legal event code: R096 Ref document number: 602011057420 Country of ref document: DE |
|
| REG | Reference to a national code |
Ref country code: AT Ref legal event code: REF Ref document number: 1111013 Country of ref document: AT Kind code of ref document: T Effective date: 20190415 |
|
| REG | Reference to a national code |
Ref country code: IE Ref legal event code: FG4D |
|
| REG | Reference to a national code |
Ref country code: NL Ref legal event code: MP Effective date: 20190320 |
|
| PG25 | Lapsed in a contracting state [announced via postgrant information from national office to epo] |
Ref country code: LT Free format text: LAPSE BECAUSE OF FAILURE TO SUBMIT A TRANSLATION OF THE DESCRIPTION OR TO PAY THE FEE WITHIN THE PRESCRIBED TIME-LIMIT Effective date: 20190320 Ref country code: FI Free format text: LAPSE BECAUSE OF FAILURE TO SUBMIT A TRANSLATION OF THE DESCRIPTION OR TO PAY THE FEE WITHIN THE PRESCRIBED TIME-LIMIT Effective date: 20190320 Ref country code: SE Free format text: LAPSE BECAUSE OF FAILURE TO SUBMIT A TRANSLATION OF THE DESCRIPTION OR TO PAY THE FEE WITHIN THE PRESCRIBED TIME-LIMIT Effective date: 20190320 Ref country code: NO Free format text: LAPSE BECAUSE OF FAILURE TO SUBMIT A TRANSLATION OF THE DESCRIPTION OR TO PAY THE FEE WITHIN THE PRESCRIBED TIME-LIMIT Effective date: 20190620 |
|
| REG | Reference to a national code |
Ref country code: LT Ref legal event code: MG4D |
|
| PG25 | Lapsed in a contracting state [announced via postgrant information from national office to epo] |
Ref country code: NL Free format text: LAPSE BECAUSE OF FAILURE TO SUBMIT A TRANSLATION OF THE DESCRIPTION OR TO PAY THE FEE WITHIN THE PRESCRIBED TIME-LIMIT Effective date: 20190320 Ref country code: GR Free format text: LAPSE BECAUSE OF FAILURE TO SUBMIT A TRANSLATION OF THE DESCRIPTION OR TO PAY THE FEE WITHIN THE PRESCRIBED TIME-LIMIT Effective date: 20190621 Ref country code: BG Free format text: LAPSE BECAUSE OF FAILURE TO SUBMIT A TRANSLATION OF THE DESCRIPTION OR TO PAY THE FEE WITHIN THE PRESCRIBED TIME-LIMIT Effective date: 20190620 Ref country code: HR Free format text: LAPSE BECAUSE OF FAILURE TO SUBMIT A TRANSLATION OF THE DESCRIPTION OR TO PAY THE FEE WITHIN THE PRESCRIBED TIME-LIMIT Effective date: 20190320 Ref country code: RS Free format text: LAPSE BECAUSE OF FAILURE TO SUBMIT A TRANSLATION OF THE DESCRIPTION OR TO PAY THE FEE WITHIN THE PRESCRIBED TIME-LIMIT Effective date: 20190320 Ref country code: LV Free format text: LAPSE BECAUSE OF FAILURE TO SUBMIT A TRANSLATION OF THE DESCRIPTION OR TO PAY THE FEE WITHIN THE PRESCRIBED TIME-LIMIT Effective date: 20190320 |
|
| REG | Reference to a national code |
Ref country code: AT Ref legal event code: MK05 Ref document number: 1111013 Country of ref document: AT Kind code of ref document: T Effective date: 20190320 |
|
| PG25 | Lapsed in a contracting state [announced via postgrant information from national office to epo] |
Ref country code: PT Free format text: LAPSE BECAUSE OF FAILURE TO SUBMIT A TRANSLATION OF THE DESCRIPTION OR TO PAY THE FEE WITHIN THE PRESCRIBED TIME-LIMIT Effective date: 20190720 Ref country code: ES Free format text: LAPSE BECAUSE OF FAILURE TO SUBMIT A TRANSLATION OF THE DESCRIPTION OR TO PAY THE FEE WITHIN THE PRESCRIBED TIME-LIMIT Effective date: 20190320 Ref country code: AL Free format text: LAPSE BECAUSE OF FAILURE TO SUBMIT A TRANSLATION OF THE DESCRIPTION OR TO PAY THE FEE WITHIN THE PRESCRIBED TIME-LIMIT Effective date: 20190320 Ref country code: EE Free format text: LAPSE BECAUSE OF FAILURE TO SUBMIT A TRANSLATION OF THE DESCRIPTION OR TO PAY THE FEE WITHIN THE PRESCRIBED TIME-LIMIT Effective date: 20190320 Ref country code: RO Free format text: LAPSE BECAUSE OF FAILURE TO SUBMIT A TRANSLATION OF THE DESCRIPTION OR TO PAY THE FEE WITHIN THE PRESCRIBED TIME-LIMIT Effective date: 20190320 Ref country code: SK Free format text: LAPSE BECAUSE OF FAILURE TO SUBMIT A TRANSLATION OF THE DESCRIPTION OR TO PAY THE FEE WITHIN THE PRESCRIBED TIME-LIMIT Effective date: 20190320 Ref country code: CZ Free format text: LAPSE BECAUSE OF FAILURE TO SUBMIT A TRANSLATION OF THE DESCRIPTION OR TO PAY THE FEE WITHIN THE PRESCRIBED TIME-LIMIT Effective date: 20190320 |
|
| PG25 | Lapsed in a contracting state [announced via postgrant information from national office to epo] |
Ref country code: PL Free format text: LAPSE BECAUSE OF FAILURE TO SUBMIT A TRANSLATION OF THE DESCRIPTION OR TO PAY THE FEE WITHIN THE PRESCRIBED TIME-LIMIT Effective date: 20190320 Ref country code: SM Free format text: LAPSE BECAUSE OF FAILURE TO SUBMIT A TRANSLATION OF THE DESCRIPTION OR TO PAY THE FEE WITHIN THE PRESCRIBED TIME-LIMIT Effective date: 20190320 |
|
| PG25 | Lapsed in a contracting state [announced via postgrant information from national office to epo] |
Ref country code: IS Free format text: LAPSE BECAUSE OF FAILURE TO SUBMIT A TRANSLATION OF THE DESCRIPTION OR TO PAY THE FEE WITHIN THE PRESCRIBED TIME-LIMIT Effective date: 20190720 Ref country code: AT Free format text: LAPSE BECAUSE OF FAILURE TO SUBMIT A TRANSLATION OF THE DESCRIPTION OR TO PAY THE FEE WITHIN THE PRESCRIBED TIME-LIMIT Effective date: 20190320 |
|
| REG | Reference to a national code |
Ref country code: DE Ref legal event code: R097 Ref document number: 602011057420 Country of ref document: DE |
|
| PLBE | No opposition filed within time limit |
Free format text: ORIGINAL CODE: 0009261 |
|
| STAA | Information on the status of an ep patent application or granted ep patent |
Free format text: STATUS: NO OPPOSITION FILED WITHIN TIME LIMIT |
|
| PG25 | Lapsed in a contracting state [announced via postgrant information from national office to epo] |
Ref country code: DK Free format text: LAPSE BECAUSE OF FAILURE TO SUBMIT A TRANSLATION OF THE DESCRIPTION OR TO PAY THE FEE WITHIN THE PRESCRIBED TIME-LIMIT Effective date: 20190320 |
|
| 26N | No opposition filed |
Effective date: 20200102 |
|
| PG25 | Lapsed in a contracting state [announced via postgrant information from national office to epo] |
Ref country code: SI Free format text: LAPSE BECAUSE OF FAILURE TO SUBMIT A TRANSLATION OF THE DESCRIPTION OR TO PAY THE FEE WITHIN THE PRESCRIBED TIME-LIMIT Effective date: 20190320 |
|
| PG25 | Lapsed in a contracting state [announced via postgrant information from national office to epo] |
Ref country code: TR Free format text: LAPSE BECAUSE OF FAILURE TO SUBMIT A TRANSLATION OF THE DESCRIPTION OR TO PAY THE FEE WITHIN THE PRESCRIBED TIME-LIMIT Effective date: 20190320 |
|
| REG | Reference to a national code |
Ref country code: CH Ref legal event code: PL |
|
| REG | Reference to a national code |
Ref country code: BE Ref legal event code: MM Effective date: 20191231 |
|
| PG25 | Lapsed in a contracting state [announced via postgrant information from national office to epo] |
Ref country code: MC Free format text: LAPSE BECAUSE OF FAILURE TO SUBMIT A TRANSLATION OF THE DESCRIPTION OR TO PAY THE FEE WITHIN THE PRESCRIBED TIME-LIMIT Effective date: 20190320 |
|
| PG25 | Lapsed in a contracting state [announced via postgrant information from national office to epo] |
Ref country code: IE Free format text: LAPSE BECAUSE OF NON-PAYMENT OF DUE FEES Effective date: 20191219 Ref country code: LU Free format text: LAPSE BECAUSE OF NON-PAYMENT OF DUE FEES Effective date: 20191219 |
|
| PG25 | Lapsed in a contracting state [announced via postgrant information from national office to epo] |
Ref country code: LI Free format text: LAPSE BECAUSE OF NON-PAYMENT OF DUE FEES Effective date: 20191231 Ref country code: CH Free format text: LAPSE BECAUSE OF NON-PAYMENT OF DUE FEES Effective date: 20191231 Ref country code: BE Free format text: LAPSE BECAUSE OF NON-PAYMENT OF DUE FEES Effective date: 20191231 |
|
| PG25 | Lapsed in a contracting state [announced via postgrant information from national office to epo] |
Ref country code: CY Free format text: LAPSE BECAUSE OF FAILURE TO SUBMIT A TRANSLATION OF THE DESCRIPTION OR TO PAY THE FEE WITHIN THE PRESCRIBED TIME-LIMIT Effective date: 20190320 |
|
| PG25 | Lapsed in a contracting state [announced via postgrant information from national office to epo] |
Ref country code: HU Free format text: LAPSE BECAUSE OF FAILURE TO SUBMIT A TRANSLATION OF THE DESCRIPTION OR TO PAY THE FEE WITHIN THE PRESCRIBED TIME-LIMIT; INVALID AB INITIO Effective date: 20111219 Ref country code: MT Free format text: LAPSE BECAUSE OF FAILURE TO SUBMIT A TRANSLATION OF THE DESCRIPTION OR TO PAY THE FEE WITHIN THE PRESCRIBED TIME-LIMIT Effective date: 20190320 |
|
| PG25 | Lapsed in a contracting state [announced via postgrant information from national office to epo] |
Ref country code: MK Free format text: LAPSE BECAUSE OF FAILURE TO SUBMIT A TRANSLATION OF THE DESCRIPTION OR TO PAY THE FEE WITHIN THE PRESCRIBED TIME-LIMIT Effective date: 20190320 |
|
| PGFP | Annual fee paid to national office [announced via postgrant information from national office to epo] |
Ref country code: DE Payment date: 20251104 Year of fee payment: 15 |
|
| PGFP | Annual fee paid to national office [announced via postgrant information from national office to epo] |
Ref country code: GB Payment date: 20251114 Year of fee payment: 15 |
|
| PGFP | Annual fee paid to national office [announced via postgrant information from national office to epo] |
Ref country code: IT Payment date: 20251121 Year of fee payment: 15 |
|
| PGFP | Annual fee paid to national office [announced via postgrant information from national office to epo] |
Ref country code: FR Payment date: 20251117 Year of fee payment: 15 |