EP2639313A1 - High-resolution transcriptome of human macrophages - Google Patents
High-resolution transcriptome of human macrophages Download PDFInfo
- Publication number
- EP2639313A1 EP2639313A1 EP12159479.0A EP12159479A EP2639313A1 EP 2639313 A1 EP2639313 A1 EP 2639313A1 EP 12159479 A EP12159479 A EP 12159479A EP 2639313 A1 EP2639313 A1 EP 2639313A1
- Authority
- EP
- European Patent Office
- Prior art keywords
- macrophages
- seq
- cell surface
- rna
- genes
- Prior art date
- Legal status (The legal status is an assumption and is not a legal conclusion. Google has not performed a legal analysis and makes no representation as to the accuracy of the status listed.)
- Withdrawn
Links
- 210000002540 macrophage Anatomy 0.000 title claims abstract description 227
- 238000000034 method Methods 0.000 claims abstract description 32
- 108090000623 proteins and genes Proteins 0.000 claims description 113
- 210000004027 cell Anatomy 0.000 claims description 44
- 239000003550 marker Substances 0.000 claims description 26
- 102100025877 Complement component C1q receptor Human genes 0.000 claims description 23
- 101000933665 Homo sapiens Complement component C1q receptor Proteins 0.000 claims description 23
- 102100033733 Tumor necrosis factor receptor superfamily member 1B Human genes 0.000 claims description 23
- 102100038077 CD226 antigen Human genes 0.000 claims description 22
- 101000884298 Homo sapiens CD226 antigen Proteins 0.000 claims description 22
- 101000801232 Homo sapiens Tumor necrosis factor receptor superfamily member 1B Proteins 0.000 claims description 19
- 102100029198 SLAM family member 7 Human genes 0.000 claims description 18
- 239000002458 cell surface marker Substances 0.000 claims description 17
- 150000007523 nucleic acids Chemical class 0.000 claims description 16
- 108020004707 nucleic acids Proteins 0.000 claims description 14
- 102000039446 nucleic acids Human genes 0.000 claims description 14
- 239000000523 sample Substances 0.000 claims description 12
- 238000009396 hybridization Methods 0.000 claims description 8
- 238000001514 detection method Methods 0.000 claims description 7
- 230000003321 amplification Effects 0.000 claims description 6
- 239000003153 chemical reaction reagent Substances 0.000 claims description 6
- 238000003199 nucleic acid amplification method Methods 0.000 claims description 6
- 238000001943 fluorescence-activated cell sorting Methods 0.000 claims description 4
- MHMNJMPURVTYEJ-UHFFFAOYSA-N fluorescein-5-isothiocyanate Chemical compound O1C(=O)C2=CC(N=C=S)=CC=C2C21C1=CC=C(O)C=C1OC1=CC(O)=CC=C21 MHMNJMPURVTYEJ-UHFFFAOYSA-N 0.000 claims description 3
- 108091028043 Nucleic acid sequence Proteins 0.000 claims description 2
- 239000002773 nucleotide Substances 0.000 claims description 2
- 125000003729 nucleotide group Chemical group 0.000 claims description 2
- 101000633784 Homo sapiens SLAM family member 7 Proteins 0.000 claims 5
- 101000831567 Homo sapiens Toll-like receptor 2 Proteins 0.000 claims 5
- 102100024333 Toll-like receptor 2 Human genes 0.000 claims 5
- 238000012512 characterization method Methods 0.000 abstract description 7
- 238000002955 isolation Methods 0.000 abstract description 3
- 238000003559 RNA-seq method Methods 0.000 description 98
- 230000014509 gene expression Effects 0.000 description 75
- 230000010287 polarization Effects 0.000 description 37
- 238000002493 microarray Methods 0.000 description 25
- 238000010208 microarray analysis Methods 0.000 description 24
- 238000011529 RT qPCR Methods 0.000 description 23
- 230000002441 reversible effect Effects 0.000 description 19
- 101001134647 Homo sapiens PDZ and LIM domain protein 7 Proteins 0.000 description 18
- 102100033337 PDZ and LIM domain protein 7 Human genes 0.000 description 18
- 238000002474 experimental method Methods 0.000 description 17
- 238000004458 analytical method Methods 0.000 description 16
- 108010017213 Granulocyte-Macrophage Colony-Stimulating Factor Proteins 0.000 description 15
- 102100039620 Granulocyte-macrophage colony-stimulating factor Human genes 0.000 description 15
- 102100026122 High affinity immunoglobulin gamma Fc receptor I Human genes 0.000 description 13
- 101000913074 Homo sapiens High affinity immunoglobulin gamma Fc receptor I Proteins 0.000 description 13
- 101000946889 Homo sapiens Monocyte differentiation antigen CD14 Proteins 0.000 description 13
- 102100035877 Monocyte differentiation antigen CD14 Human genes 0.000 description 13
- 101710083287 SLAM family member 7 Proteins 0.000 description 13
- 101000878605 Homo sapiens Low affinity immunoglobulin epsilon Fc receptor Proteins 0.000 description 12
- 102100038007 Low affinity immunoglobulin epsilon Fc receptor Human genes 0.000 description 12
- 210000001616 monocyte Anatomy 0.000 description 12
- 101000934372 Homo sapiens Macrosialin Proteins 0.000 description 11
- 102000008228 Toll-like receptor 2 Human genes 0.000 description 11
- 108010060888 Toll-like receptor 2 Proteins 0.000 description 11
- 108091032973 (ribonucleotides)n+m Proteins 0.000 description 10
- 108010046938 Macrophage Colony-Stimulating Factor Proteins 0.000 description 10
- 102100028123 Macrophage colony-stimulating factor 1 Human genes 0.000 description 10
- 102100025136 Macrosialin Human genes 0.000 description 10
- 238000000692 Student's t-test Methods 0.000 description 10
- 108020004999 messenger RNA Proteins 0.000 description 10
- 238000012552 review Methods 0.000 description 10
- 238000012163 sequencing technique Methods 0.000 description 10
- 108700024394 Exon Proteins 0.000 description 9
- 108700009124 Transcription Initiation Site Proteins 0.000 description 9
- 108091092195 Intron Proteins 0.000 description 8
- 102100040247 Tumor necrosis factor Human genes 0.000 description 8
- 230000008859 change Effects 0.000 description 8
- 238000005516 engineering process Methods 0.000 description 8
- 238000000684 flow cytometry Methods 0.000 description 8
- MZOFCQQQCNRIBI-VMXHOPILSA-N (3s)-4-[[(2s)-1-[[(2s)-1-[[(1s)-1-carboxy-2-hydroxyethyl]amino]-4-methyl-1-oxopentan-2-yl]amino]-5-(diaminomethylideneamino)-1-oxopentan-2-yl]amino]-3-[[2-[[(2s)-2,6-diaminohexanoyl]amino]acetyl]amino]-4-oxobutanoic acid Chemical compound OC[C@@H](C(O)=O)NC(=O)[C@H](CC(C)C)NC(=O)[C@H](CCCN=C(N)N)NC(=O)[C@H](CC(O)=O)NC(=O)CNC(=O)[C@@H](N)CCCCN MZOFCQQQCNRIBI-VMXHOPILSA-N 0.000 description 7
- 102100037850 Interferon gamma Human genes 0.000 description 7
- 108010074328 Interferon-gamma Proteins 0.000 description 7
- 108060008682 Tumor Necrosis Factor Proteins 0.000 description 7
- 230000001965 increasing effect Effects 0.000 description 7
- 102100031181 Glyceraldehyde-3-phosphate dehydrogenase Human genes 0.000 description 6
- 101001046686 Homo sapiens Integrin alpha-M Proteins 0.000 description 6
- 102100022338 Integrin alpha-M Human genes 0.000 description 6
- 108090000978 Interleukin-4 Proteins 0.000 description 6
- 108020004445 glyceraldehyde-3-phosphate dehydrogenase Proteins 0.000 description 6
- 102100030762 Apolipoprotein L1 Human genes 0.000 description 5
- 101100323521 Homo sapiens APOL1 gene Proteins 0.000 description 5
- 230000004069 differentiation Effects 0.000 description 5
- 238000011223 gene expression profiling Methods 0.000 description 5
- 230000022532 regulation of transcription, DNA-dependent Effects 0.000 description 5
- 210000001519 tissue Anatomy 0.000 description 5
- 238000011222 transcriptome analysis Methods 0.000 description 5
- 238000012800 visualization Methods 0.000 description 5
- YBJHBAHKTGYVGT-ZKWXMUAHSA-N (+)-Biotin Chemical compound N1C(=O)N[C@@H]2[C@H](CCCCC(=O)O)SC[C@@H]21 YBJHBAHKTGYVGT-ZKWXMUAHSA-N 0.000 description 4
- 101000984198 Homo sapiens Leukocyte immunoglobulin-like receptor subfamily A member 1 Proteins 0.000 description 4
- 102100025587 Leukocyte immunoglobulin-like receptor subfamily A member 1 Human genes 0.000 description 4
- 108091034117 Oligonucleotide Proteins 0.000 description 4
- 108010029485 Protein Isoforms Proteins 0.000 description 4
- 102000001708 Protein Isoforms Human genes 0.000 description 4
- 101710187830 Tumor necrosis factor receptor superfamily member 1B Proteins 0.000 description 4
- JLCPHMBAVCMARE-UHFFFAOYSA-N [3-[[3-[[3-[[3-[[3-[[3-[[3-[[3-[[3-[[3-[[3-[[5-(2-amino-6-oxo-1H-purin-9-yl)-3-[[3-[[3-[[3-[[3-[[3-[[5-(2-amino-6-oxo-1H-purin-9-yl)-3-[[5-(2-amino-6-oxo-1H-purin-9-yl)-3-hydroxyoxolan-2-yl]methoxy-hydroxyphosphoryl]oxyoxolan-2-yl]methoxy-hydroxyphosphoryl]oxy-5-(5-methyl-2,4-dioxopyrimidin-1-yl)oxolan-2-yl]methoxy-hydroxyphosphoryl]oxy-5-(6-aminopurin-9-yl)oxolan-2-yl]methoxy-hydroxyphosphoryl]oxy-5-(6-aminopurin-9-yl)oxolan-2-yl]methoxy-hydroxyphosphoryl]oxy-5-(6-aminopurin-9-yl)oxolan-2-yl]methoxy-hydroxyphosphoryl]oxy-5-(6-aminopurin-9-yl)oxolan-2-yl]methoxy-hydroxyphosphoryl]oxyoxolan-2-yl]methoxy-hydroxyphosphoryl]oxy-5-(5-methyl-2,4-dioxopyrimidin-1-yl)oxolan-2-yl]methoxy-hydroxyphosphoryl]oxy-5-(4-amino-2-oxopyrimidin-1-yl)oxolan-2-yl]methoxy-hydroxyphosphoryl]oxy-5-(5-methyl-2,4-dioxopyrimidin-1-yl)oxolan-2-yl]methoxy-hydroxyphosphoryl]oxy-5-(5-methyl-2,4-dioxopyrimidin-1-yl)oxolan-2-yl]methoxy-hydroxyphosphoryl]oxy-5-(6-aminopurin-9-yl)oxolan-2-yl]methoxy-hydroxyphosphoryl]oxy-5-(6-aminopurin-9-yl)oxolan-2-yl]methoxy-hydroxyphosphoryl]oxy-5-(4-amino-2-oxopyrimidin-1-yl)oxolan-2-yl]methoxy-hydroxyphosphoryl]oxy-5-(4-amino-2-oxopyrimidin-1-yl)oxolan-2-yl]methoxy-hydroxyphosphoryl]oxy-5-(4-amino-2-oxopyrimidin-1-yl)oxolan-2-yl]methoxy-hydroxyphosphoryl]oxy-5-(6-aminopurin-9-yl)oxolan-2-yl]methoxy-hydroxyphosphoryl]oxy-5-(4-amino-2-oxopyrimidin-1-yl)oxolan-2-yl]methyl [5-(6-aminopurin-9-yl)-2-(hydroxymethyl)oxolan-3-yl] hydrogen phosphate Polymers Cc1cn(C2CC(OP(O)(=O)OCC3OC(CC3OP(O)(=O)OCC3OC(CC3O)n3cnc4c3nc(N)[nH]c4=O)n3cnc4c3nc(N)[nH]c4=O)C(COP(O)(=O)OC3CC(OC3COP(O)(=O)OC3CC(OC3COP(O)(=O)OC3CC(OC3COP(O)(=O)OC3CC(OC3COP(O)(=O)OC3CC(OC3COP(O)(=O)OC3CC(OC3COP(O)(=O)OC3CC(OC3COP(O)(=O)OC3CC(OC3COP(O)(=O)OC3CC(OC3COP(O)(=O)OC3CC(OC3COP(O)(=O)OC3CC(OC3COP(O)(=O)OC3CC(OC3COP(O)(=O)OC3CC(OC3COP(O)(=O)OC3CC(OC3COP(O)(=O)OC3CC(OC3COP(O)(=O)OC3CC(OC3COP(O)(=O)OC3CC(OC3CO)n3cnc4c(N)ncnc34)n3ccc(N)nc3=O)n3cnc4c(N)ncnc34)n3ccc(N)nc3=O)n3ccc(N)nc3=O)n3ccc(N)nc3=O)n3cnc4c(N)ncnc34)n3cnc4c(N)ncnc34)n3cc(C)c(=O)[nH]c3=O)n3cc(C)c(=O)[nH]c3=O)n3ccc(N)nc3=O)n3cc(C)c(=O)[nH]c3=O)n3cnc4c3nc(N)[nH]c4=O)n3cnc4c(N)ncnc34)n3cnc4c(N)ncnc34)n3cnc4c(N)ncnc34)n3cnc4c(N)ncnc34)O2)c(=O)[nH]c1=O JLCPHMBAVCMARE-UHFFFAOYSA-N 0.000 description 4
- 239000002299 complementary DNA Substances 0.000 description 4
- 230000000694 effects Effects 0.000 description 4
- 239000012634 fragment Substances 0.000 description 4
- 230000006698 induction Effects 0.000 description 4
- 230000003834 intracellular effect Effects 0.000 description 4
- 238000003012 network analysis Methods 0.000 description 4
- 238000000513 principal component analysis Methods 0.000 description 4
- 102000004169 proteins and genes Human genes 0.000 description 4
- 230000002103 transcriptional effect Effects 0.000 description 4
- 102100030761 Apolipoprotein L2 Human genes 0.000 description 3
- 102100030766 Apolipoprotein L3 Human genes 0.000 description 3
- 102100037325 Apolipoprotein L6 Human genes 0.000 description 3
- 102000004127 Cytokines Human genes 0.000 description 3
- 108090000695 Cytokines Proteins 0.000 description 3
- 108020004414 DNA Proteins 0.000 description 3
- 101000793430 Homo sapiens Apolipoprotein L2 Proteins 0.000 description 3
- 101000793443 Homo sapiens Apolipoprotein L3 Proteins 0.000 description 3
- 101000806784 Homo sapiens Apolipoprotein L6 Proteins 0.000 description 3
- 101000984196 Homo sapiens Leukocyte immunoglobulin-like receptor subfamily A member 5 Proteins 0.000 description 3
- 101000984192 Homo sapiens Leukocyte immunoglobulin-like receptor subfamily B member 3 Proteins 0.000 description 3
- 108010017736 Leukocyte Immunoglobulin-like Receptor B1 Proteins 0.000 description 3
- 102100025574 Leukocyte immunoglobulin-like receptor subfamily A member 5 Human genes 0.000 description 3
- 102100025584 Leukocyte immunoglobulin-like receptor subfamily B member 1 Human genes 0.000 description 3
- 102100025582 Leukocyte immunoglobulin-like receptor subfamily B member 3 Human genes 0.000 description 3
- 101100495925 Schizosaccharomyces pombe (strain 972 / ATCC 24843) chr3 gene Proteins 0.000 description 3
- 230000008901 benefit Effects 0.000 description 3
- 230000033228 biological regulation Effects 0.000 description 3
- 238000006243 chemical reaction Methods 0.000 description 3
- 230000006870 function Effects 0.000 description 3
- 230000036039 immunity Effects 0.000 description 3
- 230000028709 inflammatory response Effects 0.000 description 3
- 238000011835 investigation Methods 0.000 description 3
- 210000000265 leukocyte Anatomy 0.000 description 3
- 230000007246 mechanism Effects 0.000 description 3
- 210000003819 peripheral blood mononuclear cell Anatomy 0.000 description 3
- 238000011002 quantification Methods 0.000 description 3
- 102000005962 receptors Human genes 0.000 description 3
- 108020003175 receptors Proteins 0.000 description 3
- 230000008672 reprogramming Effects 0.000 description 3
- 108010025643 Apolipoproteins L Proteins 0.000 description 2
- 102000013971 Apolipoproteins L Human genes 0.000 description 2
- 102100031584 Cell division cycle-associated 7-like protein Human genes 0.000 description 2
- 102100021396 Cell surface glycoprotein CD200 receptor 1 Human genes 0.000 description 2
- 102100025064 Cellular tumor antigen p53 Human genes 0.000 description 2
- 108010012236 Chemokines Proteins 0.000 description 2
- 102100031086 Coiled-coil domain-containing protein 17 Human genes 0.000 description 2
- 108010083068 Dual Oxidases Proteins 0.000 description 2
- 102100030771 Ferrochelatase, mitochondrial Human genes 0.000 description 2
- 241000282412 Homo Species 0.000 description 2
- 101000777638 Homo sapiens Cell division cycle-associated 7-like protein Proteins 0.000 description 2
- 101000969553 Homo sapiens Cell surface glycoprotein CD200 receptor 1 Proteins 0.000 description 2
- 101000721661 Homo sapiens Cellular tumor antigen p53 Proteins 0.000 description 2
- 101000777413 Homo sapiens Coiled-coil domain-containing protein 17 Proteins 0.000 description 2
- 101000843611 Homo sapiens Ferrochelatase, mitochondrial Proteins 0.000 description 2
- 101000975509 Homo sapiens Jun dimerization protein 2 Proteins 0.000 description 2
- 101000984197 Homo sapiens Leukocyte immunoglobulin-like receptor subfamily A member 2 Proteins 0.000 description 2
- 101000984200 Homo sapiens Leukocyte immunoglobulin-like receptor subfamily A member 3 Proteins 0.000 description 2
- 101000969812 Homo sapiens Multidrug resistance-associated protein 1 Proteins 0.000 description 2
- 101000637977 Homo sapiens Neuronal calcium sensor 1 Proteins 0.000 description 2
- 101000870953 Homo sapiens RAS guanyl-releasing protein 4 Proteins 0.000 description 2
- 101001112424 Homo sapiens RB1-inducible coiled-coil protein 1 Proteins 0.000 description 2
- 101000926086 Homo sapiens Rap1 GTPase-GDP dissociation stimulator 1 Proteins 0.000 description 2
- 101000633186 Homo sapiens Sorting nexin-16 Proteins 0.000 description 2
- 101001067250 Homo sapiens Transcription cofactor HES-6 Proteins 0.000 description 2
- 101000649030 Homo sapiens Triple QxxK/R motif-containing protein Proteins 0.000 description 2
- 101000851357 Homo sapiens Troponin T, slow skeletal muscle Proteins 0.000 description 2
- 101000607626 Homo sapiens Ubiquilin-1 Proteins 0.000 description 2
- 108090001005 Interleukin-6 Proteins 0.000 description 2
- 102000004889 Interleukin-6 Human genes 0.000 description 2
- 102100023976 Jun dimerization protein 2 Human genes 0.000 description 2
- -1 LPSu Proteins 0.000 description 2
- 102100025586 Leukocyte immunoglobulin-like receptor subfamily A member 2 Human genes 0.000 description 2
- 102100025556 Leukocyte immunoglobulin-like receptor subfamily A member 3 Human genes 0.000 description 2
- 101001083117 Microbacterium liquefaciens Hydantoin permease Proteins 0.000 description 2
- 102100021339 Multidrug resistance-associated protein 1 Human genes 0.000 description 2
- 102100032077 Neuronal calcium sensor 1 Human genes 0.000 description 2
- 102100033445 RAS guanyl-releasing protein 4 Human genes 0.000 description 2
- 102100023588 RB1-inducible coiled-coil protein 1 Human genes 0.000 description 2
- 102100033975 Ran-binding protein 3 Human genes 0.000 description 2
- 101150020444 Ranbp3 gene Proteins 0.000 description 2
- 102100034329 Rap1 GTPase-GDP dissociation stimulator 1 Human genes 0.000 description 2
- 102100029594 Sorting nexin-16 Human genes 0.000 description 2
- 210000001744 T-lymphocyte Anatomy 0.000 description 2
- 102100034424 Transcription cofactor HES-6 Human genes 0.000 description 2
- 102100028097 Triple QxxK/R motif-containing protein Human genes 0.000 description 2
- 102100036860 Troponin T, slow skeletal muscle Human genes 0.000 description 2
- 102100039934 Ubiquilin-1 Human genes 0.000 description 2
- 239000011543 agarose gel Substances 0.000 description 2
- 239000000427 antigen Substances 0.000 description 2
- 108091007433 antigens Proteins 0.000 description 2
- 102000036639 antigens Human genes 0.000 description 2
- 108091061436 apolipoprotein L family Proteins 0.000 description 2
- 238000013459 approach Methods 0.000 description 2
- 238000003556 assay Methods 0.000 description 2
- 210000003719 b-lymphocyte Anatomy 0.000 description 2
- 239000011324 bead Substances 0.000 description 2
- 229960002685 biotin Drugs 0.000 description 2
- 235000020958 biotin Nutrition 0.000 description 2
- 239000011616 biotin Substances 0.000 description 2
- 210000004369 blood Anatomy 0.000 description 2
- 239000008280 blood Substances 0.000 description 2
- 230000024245 cell differentiation Effects 0.000 description 2
- 210000004443 dendritic cell Anatomy 0.000 description 2
- 238000010586 diagram Methods 0.000 description 2
- 230000007613 environmental effect Effects 0.000 description 2
- 238000013467 fragmentation Methods 0.000 description 2
- 238000006062 fragmentation reaction Methods 0.000 description 2
- 230000004927 fusion Effects 0.000 description 2
- 230000028993 immune response Effects 0.000 description 2
- 230000002757 inflammatory effect Effects 0.000 description 2
- 230000010354 integration Effects 0.000 description 2
- 210000004698 lymphocyte Anatomy 0.000 description 2
- 238000012737 microarray-based gene expression Methods 0.000 description 2
- 238000013508 migration Methods 0.000 description 2
- 230000005012 migration Effects 0.000 description 2
- 210000000066 myeloid cell Anatomy 0.000 description 2
- 210000000822 natural killer cell Anatomy 0.000 description 2
- 244000052769 pathogen Species 0.000 description 2
- 210000005259 peripheral blood Anatomy 0.000 description 2
- 239000011886 peripheral blood Substances 0.000 description 2
- 230000008569 process Effects 0.000 description 2
- 230000002829 reductive effect Effects 0.000 description 2
- 230000001105 regulatory effect Effects 0.000 description 2
- 238000011160 research Methods 0.000 description 2
- 238000012216 screening Methods 0.000 description 2
- 230000011664 signaling Effects 0.000 description 2
- 238000012085 transcriptional profiling Methods 0.000 description 2
- 101150052384 50 gene Proteins 0.000 description 1
- 101150003382 57 gene Proteins 0.000 description 1
- 102100030089 ATP-dependent RNA helicase DHX8 Human genes 0.000 description 1
- 102000007469 Actins Human genes 0.000 description 1
- 108010085238 Actins Proteins 0.000 description 1
- 108010071619 Apolipoproteins Proteins 0.000 description 1
- 102000007592 Apolipoproteins Human genes 0.000 description 1
- 101100451506 Arabidopsis thaliana HSP90-2 gene Proteins 0.000 description 1
- 102100030907 Aryl hydrocarbon receptor nuclear translocator Human genes 0.000 description 1
- 208000023275 Autoimmune disease Diseases 0.000 description 1
- 101100237637 Bos taurus APOL gene Proteins 0.000 description 1
- 102100023701 C-C motif chemokine 18 Human genes 0.000 description 1
- 102100025248 C-X-C motif chemokine 10 Human genes 0.000 description 1
- 102100025279 C-X-C motif chemokine 11 Human genes 0.000 description 1
- 102100036170 C-X-C motif chemokine 9 Human genes 0.000 description 1
- 102100028667 C-type lectin domain family 4 member A Human genes 0.000 description 1
- 102000049320 CD36 Human genes 0.000 description 1
- 108010045374 CD36 Antigens Proteins 0.000 description 1
- 101000690445 Caenorhabditis elegans Aryl hydrocarbon receptor nuclear translocator homolog Proteins 0.000 description 1
- 101710167800 Capsid assembly scaffolding protein Proteins 0.000 description 1
- 241000251477 Chimaera Species 0.000 description 1
- 102100028717 Cytosolic 5'-nucleotidase 3A Human genes 0.000 description 1
- 102000004594 DNA Polymerase I Human genes 0.000 description 1
- 108010017826 DNA Polymerase I Proteins 0.000 description 1
- 102100021218 Dual oxidase 1 Human genes 0.000 description 1
- 102100021217 Dual oxidase 2 Human genes 0.000 description 1
- 102100036654 Dynactin subunit 1 Human genes 0.000 description 1
- 102000004190 Enzymes Human genes 0.000 description 1
- 108090000790 Enzymes Proteins 0.000 description 1
- 102100033399 Eukaryotic translation initiation factor 4E transporter Human genes 0.000 description 1
- 108060002716 Exonuclease Proteins 0.000 description 1
- 102100035688 Guanylate-binding protein 1 Human genes 0.000 description 1
- 102100028533 Guanylate-binding protein 7 Human genes 0.000 description 1
- 102000006354 HLA-DR Antigens Human genes 0.000 description 1
- 108010058597 HLA-DR Antigens Proteins 0.000 description 1
- 102100026119 High affinity immunoglobulin gamma Fc receptor IB Human genes 0.000 description 1
- 102000018713 Histocompatibility Antigens Class II Human genes 0.000 description 1
- 101000864666 Homo sapiens ATP-dependent RNA helicase DHX8 Proteins 0.000 description 1
- 101000793115 Homo sapiens Aryl hydrocarbon receptor nuclear translocator Proteins 0.000 description 1
- 101000978371 Homo sapiens C-C motif chemokine 18 Proteins 0.000 description 1
- 101000858088 Homo sapiens C-X-C motif chemokine 10 Proteins 0.000 description 1
- 101000858060 Homo sapiens C-X-C motif chemokine 11 Proteins 0.000 description 1
- 101000947172 Homo sapiens C-X-C motif chemokine 9 Proteins 0.000 description 1
- 101000766908 Homo sapiens C-type lectin domain family 4 member A Proteins 0.000 description 1
- 101000915170 Homo sapiens Cytosolic 5'-nucleotidase 3A Proteins 0.000 description 1
- 101000929626 Homo sapiens Dynactin subunit 1 Proteins 0.000 description 1
- 101000800021 Homo sapiens Eukaryotic translation initiation factor 4E transporter Proteins 0.000 description 1
- 101001001336 Homo sapiens Guanylate-binding protein 1 Proteins 0.000 description 1
- 101001058844 Homo sapiens Guanylate-binding protein 7 Proteins 0.000 description 1
- 101000913077 Homo sapiens High affinity immunoglobulin gamma Fc receptor IB Proteins 0.000 description 1
- 101001016841 Homo sapiens Histamine H1 receptor Proteins 0.000 description 1
- 101001033249 Homo sapiens Interleukin-1 beta Proteins 0.000 description 1
- 101000852980 Homo sapiens Interleukin-23 subunit alpha Proteins 0.000 description 1
- 101001037246 Homo sapiens Interleukin-27 receptor subunit alpha Proteins 0.000 description 1
- 101000925453 Homo sapiens Isoaspartyl peptidase/L-asparaginase Proteins 0.000 description 1
- 101000917858 Homo sapiens Low affinity immunoglobulin gamma Fc region receptor III-A Proteins 0.000 description 1
- 101000917839 Homo sapiens Low affinity immunoglobulin gamma Fc region receptor III-B Proteins 0.000 description 1
- 101001039696 Homo sapiens Lysophospholipid acyltransferase 7 Proteins 0.000 description 1
- 101001111250 Homo sapiens NADH dehydrogenase [ubiquinone] 1 subunit C1, mitochondrial Proteins 0.000 description 1
- 101000973259 Homo sapiens Neurogranin Proteins 0.000 description 1
- 101000992387 Homo sapiens Oxysterol-binding protein-related protein 9 Proteins 0.000 description 1
- 101000760646 Homo sapiens Phosphatidylserine lipase ABHD16A Proteins 0.000 description 1
- 101001086519 Homo sapiens Pseudouridylate synthase 7 homolog-like protein Proteins 0.000 description 1
- 101000687634 Homo sapiens SWI/SNF-related matrix-associated actin-dependent regulator of chromatin subfamily D member 3 Proteins 0.000 description 1
- 101000713602 Homo sapiens T-box transcription factor TBX21 Proteins 0.000 description 1
- 101000596334 Homo sapiens TSC22 domain family protein 1 Proteins 0.000 description 1
- 101000594296 Homo sapiens Transcription termination factor 2, mitochondrial Proteins 0.000 description 1
- 101000611183 Homo sapiens Tumor necrosis factor Proteins 0.000 description 1
- 101000982054 Homo sapiens Unconventional myosin-Ib Proteins 0.000 description 1
- 101001098858 Homo sapiens cGMP-dependent 3',5'-cyclic phosphodiesterase Proteins 0.000 description 1
- 206010061218 Inflammation Diseases 0.000 description 1
- 102100034343 Integrase Human genes 0.000 description 1
- 101710203526 Integrase Proteins 0.000 description 1
- 102100039065 Interleukin-1 beta Human genes 0.000 description 1
- 102100036705 Interleukin-23 subunit alpha Human genes 0.000 description 1
- 102100040066 Interleukin-27 receptor subunit alpha Human genes 0.000 description 1
- 102100033903 Isoaspartyl peptidase/L-asparaginase Human genes 0.000 description 1
- 241000222722 Leishmania <genus> Species 0.000 description 1
- 102100029185 Low affinity immunoglobulin gamma Fc region receptor III-B Human genes 0.000 description 1
- 102100040986 Lysophospholipid acyltransferase 7 Human genes 0.000 description 1
- 210000004322 M2 macrophage Anatomy 0.000 description 1
- 108091054438 MHC class II family Proteins 0.000 description 1
- 102100023953 NADH dehydrogenase [ubiquinone] 1 subunit C1, mitochondrial Human genes 0.000 description 1
- 102100022159 Neurogranin Human genes 0.000 description 1
- 102100032162 Oxysterol-binding protein-related protein 9 Human genes 0.000 description 1
- 102000000470 PDZ domains Human genes 0.000 description 1
- 108050008994 PDZ domains Proteins 0.000 description 1
- 206010057249 Phagocytosis Diseases 0.000 description 1
- 102100024634 Phosphatidylserine lipase ABHD16A Human genes 0.000 description 1
- 101710130420 Probable capsid assembly scaffolding protein Proteins 0.000 description 1
- 102100032779 Pseudouridylate synthase 7 homolog-like protein Human genes 0.000 description 1
- 238000012181 QIAquick gel extraction kit Methods 0.000 description 1
- 238000002123 RNA extraction Methods 0.000 description 1
- 239000013614 RNA sample Substances 0.000 description 1
- 239000012980 RPMI-1640 medium Substances 0.000 description 1
- 108091006482 SLC25A45 Proteins 0.000 description 1
- 102100024837 SWI/SNF-related matrix-associated actin-dependent regulator of chromatin subfamily D member 3 Human genes 0.000 description 1
- 101710204410 Scaffold protein Proteins 0.000 description 1
- 101100144630 Scheffersomyces stipitis (strain ATCC 58785 / CBS 6054 / NBRC 10063 / NRRL Y-11545) LRA2 gene Proteins 0.000 description 1
- 102100032117 Solute carrier family 25 member 45 Human genes 0.000 description 1
- 102100036840 T-box transcription factor TBX21 Human genes 0.000 description 1
- 102100024219 T-cell surface glycoprotein CD1a Human genes 0.000 description 1
- 102100035051 TSC22 domain family protein 1 Human genes 0.000 description 1
- 102000002689 Toll-like receptor Human genes 0.000 description 1
- 108020000411 Toll-like receptor Proteins 0.000 description 1
- 108091023040 Transcription factor Proteins 0.000 description 1
- 102000040945 Transcription factor Human genes 0.000 description 1
- 102100035550 Transcription termination factor 2, mitochondrial Human genes 0.000 description 1
- 206010052779 Transplant rejections Diseases 0.000 description 1
- 102000015098 Tumor Suppressor Protein p53 Human genes 0.000 description 1
- 108010078814 Tumor Suppressor Protein p53 Proteins 0.000 description 1
- 102100033732 Tumor necrosis factor receptor superfamily member 1A Human genes 0.000 description 1
- 101710187743 Tumor necrosis factor receptor superfamily member 1A Proteins 0.000 description 1
- 102100026776 Unconventional myosin-Ib Human genes 0.000 description 1
- 238000002835 absorbance Methods 0.000 description 1
- 230000004913 activation Effects 0.000 description 1
- 230000006978 adaptation Effects 0.000 description 1
- 230000006154 adenylylation Effects 0.000 description 1
- 230000003466 anti-cipated effect Effects 0.000 description 1
- 230000030741 antigen processing and presentation Effects 0.000 description 1
- 102000041268 apolipoprotein L family Human genes 0.000 description 1
- 238000003782 apoptosis assay Methods 0.000 description 1
- 238000007622 bioinformatic analysis Methods 0.000 description 1
- 230000007321 biological mechanism Effects 0.000 description 1
- 230000031018 biological processes and functions Effects 0.000 description 1
- 230000015572 biosynthetic process Effects 0.000 description 1
- 238000010804 cDNA synthesis Methods 0.000 description 1
- 238000010805 cDNA synthesis kit Methods 0.000 description 1
- 102100038953 cGMP-dependent 3',5'-cyclic phosphodiesterase Human genes 0.000 description 1
- 150000001768 cations Chemical class 0.000 description 1
- 230000022131 cell cycle Effects 0.000 description 1
- 230000030833 cell death Effects 0.000 description 1
- 230000003915 cell function Effects 0.000 description 1
- 230000001413 cellular effect Effects 0.000 description 1
- 238000005119 centrifugation Methods 0.000 description 1
- 210000003690 classically activated macrophage Anatomy 0.000 description 1
- 239000003086 colorant Substances 0.000 description 1
- 238000004891 communication Methods 0.000 description 1
- 230000001276 controlling effect Effects 0.000 description 1
- 230000001461 cytolytic effect Effects 0.000 description 1
- 210000004292 cytoskeleton Anatomy 0.000 description 1
- 238000007405 data analysis Methods 0.000 description 1
- 238000011161 development Methods 0.000 description 1
- 230000018109 developmental process Effects 0.000 description 1
- 201000010099 disease Diseases 0.000 description 1
- 208000037265 diseases, disorders, signs and symptoms Diseases 0.000 description 1
- 229940079593 drug Drugs 0.000 description 1
- 239000003814 drug Substances 0.000 description 1
- 239000003596 drug target Substances 0.000 description 1
- 239000012636 effector Substances 0.000 description 1
- 230000003511 endothelial effect Effects 0.000 description 1
- 230000002708 enhancing effect Effects 0.000 description 1
- 210000003527 eukaryotic cell Anatomy 0.000 description 1
- 102000013165 exonuclease Human genes 0.000 description 1
- 238000001914 filtration Methods 0.000 description 1
- GNBHRKFJIUUOQI-UHFFFAOYSA-N fluorescein Chemical compound O1C(=O)C2=CC=CC=C2C21C1=CC=C(O)C=C1OC1=CC(O)=CC=C21 GNBHRKFJIUUOQI-UHFFFAOYSA-N 0.000 description 1
- 108091008053 gene clusters Proteins 0.000 description 1
- 239000003102 growth factor Substances 0.000 description 1
- 210000003958 hematopoietic stem cell Anatomy 0.000 description 1
- 238000012165 high-throughput sequencing Methods 0.000 description 1
- 230000002519 immonomodulatory effect Effects 0.000 description 1
- 238000000338 in vitro Methods 0.000 description 1
- 230000001939 inductive effect Effects 0.000 description 1
- 208000015181 infectious disease Diseases 0.000 description 1
- 230000004054 inflammatory process Effects 0.000 description 1
- 230000002401 inhibitory effect Effects 0.000 description 1
- 230000000977 initiatory effect Effects 0.000 description 1
- 230000003993 interaction Effects 0.000 description 1
- 210000000936 intestine Anatomy 0.000 description 1
- 238000010212 intracellular staining Methods 0.000 description 1
- 238000002372 labelling Methods 0.000 description 1
- 230000000670 limiting effect Effects 0.000 description 1
- 206010025135 lupus erythematosus Diseases 0.000 description 1
- 230000002101 lytic effect Effects 0.000 description 1
- 238000002826 magnetic-activated cell sorting Methods 0.000 description 1
- 238000004519 manufacturing process Methods 0.000 description 1
- 238000013507 mapping Methods 0.000 description 1
- 239000000463 material Substances 0.000 description 1
- 230000001404 mediated effect Effects 0.000 description 1
- 239000002609 medium Substances 0.000 description 1
- 230000002297 mitogenic effect Effects 0.000 description 1
- 239000000203 mixture Substances 0.000 description 1
- 230000009456 molecular mechanism Effects 0.000 description 1
- 238000011527 multiparameter analysis Methods 0.000 description 1
- 238000010606 normalization Methods 0.000 description 1
- 230000008520 organization Effects 0.000 description 1
- VYNDHICBIRRPFP-UHFFFAOYSA-N pacific blue Chemical compound FC1=C(O)C(F)=C2OC(=O)C(C(=O)O)=CC2=C1 VYNDHICBIRRPFP-UHFFFAOYSA-N 0.000 description 1
- 230000037361 pathway Effects 0.000 description 1
- 102000007863 pattern recognition receptors Human genes 0.000 description 1
- 108010089193 pattern recognition receptors Proteins 0.000 description 1
- 210000001539 phagocyte Anatomy 0.000 description 1
- 230000008782 phagocytosis Effects 0.000 description 1
- 230000034190 positive regulation of NF-kappaB transcription factor activity Effects 0.000 description 1
- 238000002360 preparation method Methods 0.000 description 1
- 230000005522 programmed cell death Effects 0.000 description 1
- 230000035755 proliferation Effects 0.000 description 1
- 238000000746 purification Methods 0.000 description 1
- 238000003753 real-time PCR Methods 0.000 description 1
- 230000009467 reduction Effects 0.000 description 1
- 230000004044 response Effects 0.000 description 1
- 230000028327 secretion Effects 0.000 description 1
- 238000005204 segregation Methods 0.000 description 1
- 230000035945 sensitivity Effects 0.000 description 1
- 238000007619 statistical method Methods 0.000 description 1
- 230000004083 survival effect Effects 0.000 description 1
- 230000009897 systematic effect Effects 0.000 description 1
- 101150115978 tbx5 gene Proteins 0.000 description 1
- 230000030968 tissue homeostasis Effects 0.000 description 1
- 230000003827 upregulation Effects 0.000 description 1
- XLYOFNOQVPJJNP-UHFFFAOYSA-N water Substances O XLYOFNOQVPJJNP-UHFFFAOYSA-N 0.000 description 1
Images
Classifications
-
- C—CHEMISTRY; METALLURGY
- C12—BIOCHEMISTRY; BEER; SPIRITS; WINE; VINEGAR; MICROBIOLOGY; ENZYMOLOGY; MUTATION OR GENETIC ENGINEERING
- C12Q—MEASURING OR TESTING PROCESSES INVOLVING ENZYMES, NUCLEIC ACIDS OR MICROORGANISMS; COMPOSITIONS OR TEST PAPERS THEREFOR; PROCESSES OF PREPARING SUCH COMPOSITIONS; CONDITION-RESPONSIVE CONTROL IN MICROBIOLOGICAL OR ENZYMOLOGICAL PROCESSES
- C12Q1/00—Measuring or testing processes involving enzymes, nucleic acids or microorganisms; Compositions therefor; Processes of preparing such compositions
- C12Q1/68—Measuring or testing processes involving enzymes, nucleic acids or microorganisms; Compositions therefor; Processes of preparing such compositions involving nucleic acids
- C12Q1/6876—Nucleic acid products used in the analysis of nucleic acids, e.g. primers or probes
- C12Q1/6888—Nucleic acid products used in the analysis of nucleic acids, e.g. primers or probes for detection or identification of organisms
-
- C—CHEMISTRY; METALLURGY
- C12—BIOCHEMISTRY; BEER; SPIRITS; WINE; VINEGAR; MICROBIOLOGY; ENZYMOLOGY; MUTATION OR GENETIC ENGINEERING
- C12N—MICROORGANISMS OR ENZYMES; COMPOSITIONS THEREOF; PROPAGATING, PRESERVING, OR MAINTAINING MICROORGANISMS; MUTATION OR GENETIC ENGINEERING; CULTURE MEDIA
- C12N5/00—Undifferentiated human, animal or plant cells, e.g. cell lines; Tissues; Cultivation or maintenance thereof; Culture media therefor
- C12N5/06—Animal cells or tissues; Human cells or tissues
- C12N5/0602—Vertebrate cells
- C12N5/0634—Cells from the blood or the immune system
- C12N5/0645—Macrophages, e.g. Kuepfer cells in the liver; Monocytes
-
- C—CHEMISTRY; METALLURGY
- C12—BIOCHEMISTRY; BEER; SPIRITS; WINE; VINEGAR; MICROBIOLOGY; ENZYMOLOGY; MUTATION OR GENETIC ENGINEERING
- C12Q—MEASURING OR TESTING PROCESSES INVOLVING ENZYMES, NUCLEIC ACIDS OR MICROORGANISMS; COMPOSITIONS OR TEST PAPERS THEREFOR; PROCESSES OF PREPARING SUCH COMPOSITIONS; CONDITION-RESPONSIVE CONTROL IN MICROBIOLOGICAL OR ENZYMOLOGICAL PROCESSES
- C12Q1/00—Measuring or testing processes involving enzymes, nucleic acids or microorganisms; Compositions therefor; Processes of preparing such compositions
- C12Q1/68—Measuring or testing processes involving enzymes, nucleic acids or microorganisms; Compositions therefor; Processes of preparing such compositions involving nucleic acids
- C12Q1/6876—Nucleic acid products used in the analysis of nucleic acids, e.g. primers or probes
- C12Q1/6883—Nucleic acid products used in the analysis of nucleic acids, e.g. primers or probes for diseases caused by alterations of genetic material
- C12Q1/6886—Nucleic acid products used in the analysis of nucleic acids, e.g. primers or probes for diseases caused by alterations of genetic material for cancer
-
- G—PHYSICS
- G01—MEASURING; TESTING
- G01N—INVESTIGATING OR ANALYSING MATERIALS BY DETERMINING THEIR CHEMICAL OR PHYSICAL PROPERTIES
- G01N33/00—Investigating or analysing materials by specific methods not covered by groups G01N1/00 - G01N31/00
- G01N33/48—Biological material, e.g. blood, urine; Haemocytometers
- G01N33/50—Chemical analysis of biological material, e.g. blood, urine; Testing involving biospecific ligand binding methods; Immunological testing
- G01N33/5005—Chemical analysis of biological material, e.g. blood, urine; Testing involving biospecific ligand binding methods; Immunological testing involving human or animal cells
- G01N33/5008—Chemical analysis of biological material, e.g. blood, urine; Testing involving biospecific ligand binding methods; Immunological testing involving human or animal cells for testing or evaluating the effect of chemical or biological compounds, e.g. drugs, cosmetics
- G01N33/5044—Chemical analysis of biological material, e.g. blood, urine; Testing involving biospecific ligand binding methods; Immunological testing involving human or animal cells for testing or evaluating the effect of chemical or biological compounds, e.g. drugs, cosmetics involving specific cell types
- G01N33/5047—Cells of the immune system
- G01N33/5055—Cells of the immune system involving macrophages
-
- C—CHEMISTRY; METALLURGY
- C12—BIOCHEMISTRY; BEER; SPIRITS; WINE; VINEGAR; MICROBIOLOGY; ENZYMOLOGY; MUTATION OR GENETIC ENGINEERING
- C12Q—MEASURING OR TESTING PROCESSES INVOLVING ENZYMES, NUCLEIC ACIDS OR MICROORGANISMS; COMPOSITIONS OR TEST PAPERS THEREFOR; PROCESSES OF PREPARING SUCH COMPOSITIONS; CONDITION-RESPONSIVE CONTROL IN MICROBIOLOGICAL OR ENZYMOLOGICAL PROCESSES
- C12Q2600/00—Oligonucleotides characterized by their use
- C12Q2600/112—Disease subtyping, staging or classification
-
- C—CHEMISTRY; METALLURGY
- C12—BIOCHEMISTRY; BEER; SPIRITS; WINE; VINEGAR; MICROBIOLOGY; ENZYMOLOGY; MUTATION OR GENETIC ENGINEERING
- C12Q—MEASURING OR TESTING PROCESSES INVOLVING ENZYMES, NUCLEIC ACIDS OR MICROORGANISMS; COMPOSITIONS OR TEST PAPERS THEREFOR; PROCESSES OF PREPARING SUCH COMPOSITIONS; CONDITION-RESPONSIVE CONTROL IN MICROBIOLOGICAL OR ENZYMOLOGICAL PROCESSES
- C12Q2600/00—Oligonucleotides characterized by their use
- C12Q2600/158—Expression markers
-
- G—PHYSICS
- G01—MEASURING; TESTING
- G01N—INVESTIGATING OR ANALYSING MATERIALS BY DETERMINING THEIR CHEMICAL OR PHYSICAL PROPERTIES
- G01N2333/00—Assays involving biological materials from specific organisms or of a specific nature
- G01N2333/435—Assays involving biological materials from specific organisms or of a specific nature from animals; from humans
- G01N2333/705—Assays involving receptors, cell surface antigens or cell surface determinants
- G01N2333/70596—Molecules with a "CD"-designation not provided for elsewhere in G01N2333/705
Definitions
- the invention is based on the finding of specific surface markers for M1-like and M2-like macrophages and provides for a method for the identification, characterization and isolation of M1-like (classically activated) and M2-like (alternatively activated) macrophages based on the abundance of said surface markers and for means for performing such method.
- Macrophages represent resident phagocytic cells in the tissue and are involved in tissue homeostasis and induction of inflammatory reaction towards pathogens by use of their broad range of pattern-recognition receptors ( Geissmann F. et al., Science 327(5966):656-661 (2010 )).
- macrophages are polarized to specific functional properties, often referred to as M1-like and M2-like phenotype.
- Classically polarized M1-like macrophages can be induced by IFN- ⁇ alone or together with LPS or TNF- ⁇ using M-CSF or GM-CSF ( Martinez F.O.
- M1-like macrophages are effector cells of classical inflammatory immune responses exerting an IL-12 high , IL-23 high and IL-10 low phenotype with secretion of inflammatory cytokines IL-1 ⁇ , IL-6 and TNF- ⁇ . They display a phenotype characterized by the expression of CD86, CD64, and CD16 ( Biswas S.K., Mantovani A., Nat Immunol. 11(10):889-896 (2010 ); Mantovani A., Sica A., Curr Opin Immunol. 22(2):231-237 (2010 )).
- macrophages that are activated by other mechanisms than IFN- ⁇ /LPS/TNF- ⁇ are grouped in the alternatively activated M2-like macrophage subset.
- Non-classically activated macrophages can be induced by cytokines including IL-4 and IL-13, but other stimuli have been described as well ( Biswas S.K., Mantovani A., Nat Immunol. 11(10):889-896 (2010 ); Mantovani A., Sica A., Curr Opin Immunol. 22(2):231-237 (2010 )). These cells share an IL-12 low and IL-23 low phenotype and express CD23.
- RNA sequencing RNA-seq
- the invention thus provides
- Macrophages are dynamic cells integrating signals from their microenvironment to develop specific functional responses.
- Microarray-based transcriptional profiling has established transcriptional reprogramming as an important mechanism for signal integration and cell function of macrophages yet current knowledge on transcriptional regulation is far from complete.
- RNA sequencing (RNA-seq) is ideally suited to fill this need but also to discover novel marker genes, an area of great need particularly in human macrophage biology. Applying RNA-seq, a high-resolution transcriptome profile of human macrophages under classical (M1-like) and alternative (M2-like) polarization conditions is provided and shows a dynamic range exceeding observations obtained by previous technologies, resulting in a more comprehensive understanding of the transcriptome of human macrophages.
- RNA-seq based high-resolution transcriptome data can be utilized to better understand the biology of macrophage polarization.
- RNA-seq data uncovered novel aspects of macrophage biology, which was illustrated by the recognition of differential expression of numerous family members of two gene families, namely the apolipoprotein L family and leukocyte immunoglobulin-like receptors.
- APOLs constitute a new class of apolipoproteins expressed by macrophages as they serve as lytic factors against invading pathogens, e.g. African trypanosomes inducing programmed cell death as well as inhibiting intracellular infection by Leishmania ( Pays E., Vanhollebeke B., Curr Opin Immunol. 21(5):493-498 (2009 ); Samanovic M.
- an intracellular scaffold protein that contains a PDZ domain and three LIM domains linked to mitogenic signaling through actin cytoskeleton organization ( Nakagawa N. et al., Biochemical and biophysical research communications 272(2):505-512 (2000 )), regulating Tbx5 transcriptional activity ( Camarata T. et al., Developmental biology 337(2):233-245 (2010 )), and suppressing p53 activity ( Jung C.R.
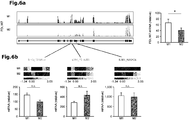
- RNA-seq revealed significant differences in splice variant usage for M1- and M2-like macrophages potentially linking p53 regulation with macrophage polarization ( Matas D. et al., Cell death and differentiation 11(4):458-467 (2004 )). Usage of splice variant-specific qPCR reactions supported these findings while this differential regulation was not revealed by microarray analysis.
- RNA-seq data revealed larger differences between M1-like and M2-like cells when compared to microarray data. Nevertheless, some genes only reached significant differential expression in the array data clearly pointing toward the necessity to include a large enough number of biological replicates also when applying RNA-seq. On the other hand, a subset of genes showed the well-known background noise effect in the microarray data resulting in non-significant differences between the two cell types.
- the relative abundance of the M1-associated cell surface markers is higher in M1-like macrophages than in M2-like macrophages and the relative abundance of the M2-associated cell surface markers is higher in M2-like macrophages than in M1-like macrophages.It is preferred that the abundance of the cell surface marker in the respective M1-like or M2-like macrophage is at least 30%, more preferably at least 50 % and most preferably at least 70 % higher than in the other macrophage type.
- the one or more primers employed in the amplification/resequencing employed in the method of aspect (2) of the invention are derived from the respective marker gene.
- said primers have at least 12, more preferably at least 15, most preferably at least 19 contiguous nucleotides of the respective marker nucleic acid sequence.
- the one or more probes employed in the method of aspect (3) of the invention are derived from the respective marker gene.
- said probes have a length that allows for a selective hybridization to the marker nucleic acid.
- the probe may also be labeled with a suitable marker molecule (e.g. with a fluorescence marker) to allow the detection of the resulting probe-surface marker nucleic acid complex.
- Such probes may also be utilized in a hybridization array of aspect (4) of the invention.
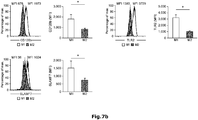
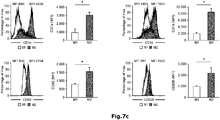
- the binding molecules utilized in aspect (5) of the invention include antibodies, preferably monoclonal antibodies. Moreover said binding molecules may be labeled with maker molecules, preferably fluorescence markers. Particular preferred binding molecules include the FITC-labeled CD1b, CD93, CD226 and anti-TLR2, PE-labeled CD120b and anti-SLAMF7, and PE-Cy5-labeled CD1a monoclonal antibodies. Further it is preferred that the method of aspect (5), notably if it is utilized to isolate the M1-like macrophages or M2-like macrophages, is performed on a FACS sorter.
- TNFR2 CD120b
- T cells Faustman D., Davis M., Nat Rev Drug Discov. 9(6):482-493 (2010 )
- TNFR2 preferentially leads to NF ⁇ B activation. Whether this is true in myeloid cells as well requires further investigation.
- SLAMF7 was originally identified as a NK cell-associated surface molecule ( Boles K.S. et al., Immunol Rev. 181:234-249 (2001 )). Subsequently, it was shown to be expressed on lymphocytes and monocytes ( Murphy J.J. et al., Biochem J. 361(Pt 3):431-436 (2002 )). More recently, a reduced expression on monocytes and NK cells with a simultaneous increase of SLAMF7 on B cells was observed in patients with lupus erythematosus ( Kim J.R. et al., Clin Exp Immunol. 160(3):348-358 (2010 )).
- CD1a and CD1b two cell surface molecules that are mainly studied in context of antigen presentation by dendritic cells.
- Previous reports suggested upregulation of CD1 proteins on human monocytes by GM-CSF ( Kasinrerk W. et al., J Immunol. 150(2):579-584 (1993 )).
- CD93 which was originally identified to be expressed on early hematopoietic stem cells and B cells ( Greenlee-Wacker M.C. et al., Curr Drug Targets. (2011 )). CD93 is involved in biological processes such as adhesion, migration, and phagocytosis ( McGreal E.P. et al., J Immunol.
- CD93 expressed on myeloid cells can be shed from the cell surface and the soluble form seems to be involved in differentiation of monocytes towards a macrophage phenotype ( Jeon J.W. et al., J Immunol. 185(8):4921-4927 (2010 )). Since soluble CD93 has been implicated in inflammatory responses, it will be important to further elucidate how polarization-induced differential expression of CD93 contributes to specific inflammatory responses.
- CD226 has additional functions including the regulation of monocyte migration through endothelial junctions ( Reymond N. et al., J Exp Med. 199(10):1331-1341 (2004 )). Similar to the other M2-associated markers, so far little is known about CD226 on polarized macrophages. Since CD226 expression levels on lymphocytes have been implicated in autoimmune diseases ( Sinha S. et al., PLoS One. 6(7):e21868 (2011 )) further research is necessary to understand its role in the myeloid compartment during such processes.
- RNA-seq we introduce a high-resolution transcriptome analysis of human macrophages unraveling novel insights into macrophage polarization. While previously established transcriptome datasets addressing macrophage biology are still very suitable to assess important biological and medical questions, a deeper understanding of transcriptional regulation during macrophage polarization will require higher resolution that is provided by current and future RNA-seq technologies. Moreover, the novel cell surface markers will help to better understand macrophage programs and functions in human disease.
- LPSu ultrapure LPS
- GEP gene expression profiling
- PCA principle component analysis
- RNA-seq RNA sequencing technologies
- MFI mean fluorescence intensity
- EGAN exploratory gene association network
- RPKM Reads Per Kilobase of exon model per Million mapped reads
- FC fold change
- TSS transcription start sites
- CDS coding sequences.
- PBMC Peripheral blood mononuclear cells
- Pancoll Pancoll
- Density centrifugation from buffy coats from healthy donors obtained following protocols accepted by the institutional review board at the University of Bonn (local ethics vote no. 045/09).
- CD14 + monocytes were isolated from PBMC using CD14-specific MACS beads (Miltenyi Biotec) according to the manufacturers protocol (routinely >95% purity).
- CD14 + monocytes were cultured in 6-well plates in RPMI1640 medium containing 10% FCS and differentiated into immature macrophages using GM-CSF (500 U/ml) or M-CSF (100 U/ml) for 3 days. Growth-factor containing medium was exchanged on day 3 and cells were polarized for 3 days with the following stimuli: IFN- ⁇ (200 U/ml), TNF- ⁇ (800 U/ml), ultrapure LPS (LPSu, 10 ⁇ g/ml), IL-4 (1,000 U/ml), IL-13 (100 U/ml), or combinations thereof (all from Immunotools, Friesoythe, Germany).
- Monoclonal antibodies and flow cytometry Cells were stained after FcR blockade incubating cells in PBS with 20% FCS for 10 minutes at 4°C using the following monoclonal antibodies (all from Becton Dickinson (BD), BioLegend, or eBioscience): FITC-labeled CD1b, CD23, CD93, CD226, anti-HLA-DR, anti-TLR2; PE-labeled CD64, CD68, CD120b, anti-SLAMF7; PE-Cy5-labeled CD1a; PerCP-Cy5.5-labeled CD209; APC-labeled CD86; Pacific Blue-labeled CD11b; and APC-Cy7-labeled CD14 with matched isotype antibodies as controls.
- monoclonal antibodies all from Becton Dickinson (BD), BioLegend, or eBioscience
- RNA isolation 5x10 6 -2x10 7 macrophages were harvested, subsequently lysed in TRIZOL (Invitrogen) and total RNA was extracted according to the manufactures' protocol. The precipitated RNA was solved in RNAse free water. The quality of the RNA was assessed by measuring the ratio of absorbance at 260 nm and 280 nm using a Nanodrop 2000 Spectrometer (Thermo Scientific) as well as by visualization the integrity of the 28S and 18S band on an agarose gel.
- Microarray-based transcriptional profiling and bioinformatic analysis of microarray data Isolated RNA was further purified using the MinElute Reaction Cleanup Kit (Qiagen). Biotin labeled cRNA was generated using the TargetAmp Nano-g Biotin-aRNA Labeling Kit (Epicentre). Biotin labeled cRNA was hybridized to Human HT-12V3 Beadchips (Illumina) and scanned on an Illumina HiScanSQ system. Raw intensity data were exported with BeadStudio 3.1.1.0 (Illumina) and subsequently analysed using R (R Development Core Team. R: A Language and Environment for Statistical Computing (2011)).
- RNA-seq and data analysis Sequencing and analysis were performed individually on M1-like and M2-like macrophages from 3 independent donors. Total RNA was converted into libraries of double stranded cDNA molecules as a template for high throughput sequencing using the Illumina CBot station and HiScanSQ following the manufacturer's recommendations using the Illumina TruSeq RNA Sample Preparation Kit. Shortly, mRNA was purified from 5-10 ⁇ g of total RNA using poly-T oligo-attached magnetic beads. Fragmentation was carried out using divalent cations under elevated temperature in Illumina proprietary fragmentation buffer. First strand cDNA was synthesized using random oligonucleotides and SuperScript II.
- Second strand cDNA synthesis was subsequently performed using DNA Polymerase I and RNase H. Remaining overhangs were converted into blunt ends via exonuclease/polymerase activities and enzymes were removed. After adenylation of 3' ends of DNA fragments, Illumina PE adapter oligonucleotides were ligated to prepare for hybridization. In order to select cDNA fragments of preferentially 200 bp in length the library fragments were separated on a 2% (w/v) agarose gel. The corresponding gel-fraction for each library was excised and purified using the QIAquick gel extraction kit (Qiagen).
- DNA fragments with ligated adapter molecules were selectively enriched using Illumina PCR primer PE1.0 and PE2.0 in a 15 cycle PCR reaction. Products were purified (QIAquick PCR purification kit) and quantified using the Agilent high sensitivity DNA assay on a Bioanalyzer 2100 system (Agilent). After cluster generation, 100 bp paired-end reads were generated and analyzed using CASAVA 1.8. Alignment to the human reference genome hg19 from UCSC was performed stepwise. First, all reads passing the chastity filter were aligned to the reference genome. Next, reads were aligned to the RNA reference transcriptome.
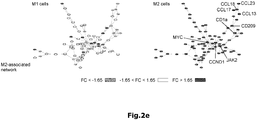
- a priori information-based network analysis using EGAN software To visualize connectivity between genes in high-throughput datasets contextual network graphs were generated based on a priori knowledge stored in literature, pathway, interaction, or annotation term databases by EGAN (exploratory gene association network) Paquette J., Tokuyasu T., Bioinformatics 26(2):285-286 (2010 ). To visualize the transcriptional regulation of genes enriched in M1 respectively M2, array data were used and fold change differences calculated using unpolarized macrophages as comparison. Genes with a FC > 2 for M1 and FC > 1.65 for M2 were visualized; represented is the major network.
- Example 1 Generation of human M1- and M2-like macrophages as a model system.
- M1-like classical (M1-like) and alternative (M2-like) polarization of human macrophages as a model system. Since both M-CSF and GM-CSF have been described to differentiate macrophages from blood-derived CD14 + monocytes, we first compared the two different stimuli in respect to macrophage polarization and used expression of well-known macrophage markers as the initial readout ( Martinez F.O. et al., The Journal of Immunology 177(10):7303-7311 (2006 ); Hamilton J.A., Nat Rev Immunol.
- Example 2 Characterization of M1- and M2-like macrophages by microarray-based gene expression profiling. Most recently it has been suggested that assessment of macrophage polarization in humans cannot solely rely on few cell surface markers but should be accommodated by gene expression profiling ( Murray P.J., Wynn T.A., Nature reviews Immunology 11(11):723-737 (2011 )). Using one of the most recent array generations, gene expression profiling was performed on unpolarized and polarized macrophages derived from seven healthy donors. To determine sample relationships, PCA ( Figure 2a ) and hierarchical clustering ( Figure 2b ) based on variable genes were performed and showed segregation of the samples by polarization state.
- Example 3 Increase in overall transcriptome information by RNA-seq.
- Gene expression profiling using microarrays has recently been suggested to be inferior to newer sequencing based technologies in providing genome-wide transcriptome information ( Wang Z. et al., Nature reviews Genetics 10(1):57-63 (2009 )).
- RNA-seq was performed on in vitro generated M1- and M2-like macrophages. After quality filtering, we obtained 15.0 ⁇ 2.8 million and 20.4 ⁇ 9.2 million reads for the M1- and M2-like macrophage cDNA libraries (Table 1). Consistent with RNA-seq data obtained from other eukaryotic cells ( Ramskold D.
- RPKMs are measures of individual transcript abundance in RNA-seq datasets and have been shown to be highly accurate across multiple cell types ( Mortazavi A. et al., Nature methods 5(7):621-628 (2008 )). We used CASAVA to assign RPKMs.
- RNA-seq and microarray data we cross-annotated RNA-seq and microarray data using HGNC symbols.
- 11317 and 11466 Refseq genes were expressed applying a previously defined optimal threshold (0.3 RPKM) for gene expression ( Figure 3a ) ( Ramskold D. et al., PLoS computational biology 5(12):e1000598 (2009 )).
- RNA-seq reveals differential expression at significantly higher resolution. RNA-seq showed a significantly increased dynamic range over background mainly due to significantly lower background levels. This suggested that the assessment of differential expression using RNA-seq might lead to an improved resolution in comparison to array-based data.
- Applying standard filter criteria (FC ⁇ 1.5, p ⁇ 0.05, RPKM ⁇ 0.3) revealed a total of 1736 genes elevated in M1- versus M2-like macrophages by RNA-seq, while 834 genes were recognized by array analysis ( Figure 3c ).
- 822 genes were identified as being elevated in M2- versus M1-like macrophages by RNA-seq, while 786 genes were detected by array analysis ( Figure 3d ).
- RNA-seq data clearly revealed up to 4-fold more genes with FC > 4 for M1- and M2-associated genes ( Figure 3c and d ), which was similarly true for M1-associated genes at lower levels (1.5 ⁇ FC ⁇ 4).
- FC-FC plotting correlating RNA-seq and array-based data for individual genes ( Figure 3e ). The majority of genes showed similar behavior in both RNA-seq and microarray experiments, albeit the relative differences were higher in RNA-seq data ( Figure 3e ).
- RNA-seq Exon resolution transcriptome analysis of known macrophage markers. Another advantage of RNA-seq is to resolve gene expression on the exon level ( Figure 4 ).
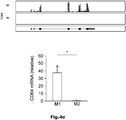
- macrophage related genes CD68 ( Figure 4a-d ), CD64 ( Figure 4e-h ) and CD23 ( Figure 4i-l ), RNA-seq data were visualized for the genomic loci of the respective genes and compared with array, qPCR, and FACS data.
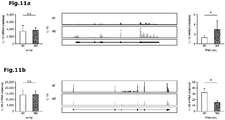
- CD68 RNA-seq data revealed similarly high expression for M1 and M2 macrophages for all exons with little variance in expression levels between donors ( Figures 4a and 11 ).
- RNA-seq revealed complete absence of expression for all exons in M2-like macrophages with high expression in M1-like macrophages ( Figure 4e ), which was similarly observed by other technologies ( Figure 4f-h ).
- protein data suggest significantly elevated expression on M2-like macrophages with low level expression on M1-like macrophages ( Figure 4l ), a result which was also observed for RNA-seq data ( Figure 4i ) as well as array ( Figure 4j ) and qPCR ( Figure 4k ).
- RNA-seq ameliorates network-based analysis in M1- and M2-like macrophages.
- RNA-seq would also enhance the understanding of biological principles of macrophage polarization we applied network analysis based on a priori information assessing the information content of RNA-seq data in comparison to array data.
- FC > 2 genes at a lower level of differential expression (FC > 2) were included 73% of the network was revealed in the array data and central hubs of the network were also categorized as being highly (FC > 4) differentially expressed.
- FC > 4 genes at a lower level of differential expression (FC > 2) were included 73% of the network was revealed in the array data and central hubs of the network were also categorized as being highly (FC > 4) differentially expressed.
- RNA-seq data revealed two gene clusters of immunomodulating proteins highly enriched in the M1 network, namely apolipoproteins L (APOL) ( Figures 5a and 12 ) and the leukocyte immunoglobulin-like receptor (LILR) family ( Figures 5a and 13 ) ( Pays E., Vanhollebeke B., Curr Opin Immunol. 21(5):493-498 (2009 ); Samanovic M. et al., PLoS Pathog.
- APOL apolipoproteins L
- LILR leukocyte
- Example 7 Identification of splice variants and RNA chimaera in differentially stimulated human macrophages. It has recently been suggested that cell differentiation can result in usage of alternative gene transcripts or isoform switching ( Trapnell C. et al., Nature biotechnology 28(5):511-515 (2010 )). We applied Cufflinks and Cuffdiff to illuminate switches in dominant promoter usage, transcription start sites (TSS), and coding sequences (CDS) ( Trapnell C. et al., Nature biotechnology 28(5):511-515 (2010 )). This analysis revealed 9 genes with alternative promoters (Table 4), 28 genes using alternative TSS (Table 5), and 20 genes with different CDS in M1- and M2-like macrophages (Table 6).
- RNA-Seq M1 M2 reads (x10 6 ) percentage (%) reads (x10 6 ) percentage (%) Total 15.0 ⁇ 2.8 20.4 ⁇ 9.2 Exons 11.8 ⁇ 2.2 78.4 ⁇ 1.1 16.1 ⁇ 7.4 79.4 ⁇ 2.0 Exon-Intron boundaries 0.4 ⁇ 0.1 2.5 ⁇ 0.1 0.5 ⁇ 0.2 2.4 ⁇ 0.2 Introns 2.1 ⁇ 0.5 14.1 ⁇ 1.0 2.7 ⁇ 1.3 13.2 ⁇ 1.6 Intergenic regions 0.8 ⁇ 0.1 5.0 ⁇ 0.2 1.0 ⁇ 0.5 5.0 ⁇ 0.3 Table 2 qPCR oligonucleotides CD68 Forward 5'-GTCCACCTCGACCTGCTCT-3' CD68 Reverse 5'-CACTGGGGCAGGAGAAACT-3' CD64 Forward 5'
Landscapes
- Health & Medical Sciences (AREA)
- Life Sciences & Earth Sciences (AREA)
- Chemical & Material Sciences (AREA)
- Engineering & Computer Science (AREA)
- Immunology (AREA)
- Organic Chemistry (AREA)
- Biomedical Technology (AREA)
- Wood Science & Technology (AREA)
- Zoology (AREA)
- Analytical Chemistry (AREA)
- Proteomics, Peptides & Aminoacids (AREA)
- Bioinformatics & Cheminformatics (AREA)
- Genetics & Genomics (AREA)
- Biotechnology (AREA)
- Biochemistry (AREA)
- General Health & Medical Sciences (AREA)
- Microbiology (AREA)
- Molecular Biology (AREA)
- Hematology (AREA)
- Cell Biology (AREA)
- Pathology (AREA)
- General Engineering & Computer Science (AREA)
- Physics & Mathematics (AREA)
- Urology & Nephrology (AREA)
- Biophysics (AREA)
- Gastroenterology & Hepatology (AREA)
- Hospice & Palliative Care (AREA)
- Toxicology (AREA)
- Tropical Medicine & Parasitology (AREA)
- Oncology (AREA)
- Food Science & Technology (AREA)
- Medicinal Chemistry (AREA)
- General Physics & Mathematics (AREA)
- Measuring Or Testing Involving Enzymes Or Micro-Organisms (AREA)
Abstract
The invention is based on the finding of specific surface markers for M1-like (classically activated) and M2-like (alternatively activated) macrophages and provides for a method for the identification, characterization and isolation of M1-like and M2-like macrophages based on the abundance of said surface markers and for means for performing such method.
Description
- The invention is based on the finding of specific surface markers for M1-like and M2-like macrophages and provides for a method for the identification, characterization and isolation of M1-like (classically activated) and M2-like (alternatively activated) macrophages based on the abundance of said surface markers and for means for performing such method.
- Macrophages represent resident phagocytic cells in the tissue and are involved in tissue homeostasis and induction of inflammatory reaction towards pathogens by use of their broad range of pattern-recognition receptors (Geissmann F. et al., Science 327(5966):656-661 (2010)). In context of the respective immune response, macrophages are polarized to specific functional properties, often referred to as M1-like and M2-like phenotype. Classically polarized M1-like macrophages can be induced by IFN-γ alone or together with LPS or TNF-α using M-CSF or GM-CSF (Martinez F.O. et al., The Journal of Immunology 177(10):7303-7311 (2006)). M1-like macrophages are effector cells of classical inflammatory immune responses exerting an IL-12 high, IL-23high and IL-10low phenotype with secretion of inflammatory cytokines IL-1β, IL-6 and TNF-α. They display a phenotype characterized by the expression of CD86, CD64, and CD16 (Biswas S.K., Mantovani A., Nat Immunol. 11(10):889-896 (2010); Mantovani A., Sica A., Curr Opin Immunol. 22(2):231-237 (2010)). In contrast, macrophages that are activated by other mechanisms than IFN-γ/LPS/TNF-α are grouped in the alternatively activated M2-like macrophage subset. Non-classically activated macrophages can be induced by cytokines including IL-4 and IL-13, but other stimuli have been described as well (Biswas S.K., Mantovani A., Nat Immunol. 11(10):889-896 (2010); Mantovani A., Sica A., Curr Opin Immunol. 22(2):231-237 (2010)). These cells share an IL-12low and IL-23low phenotype and express CD23. Over the last decade, phenotypic adaptations of macrophages to environmental stimuli have been linked to radical changes in transcriptional regulation mainly by applying microarray-based gene expression profiling (Martinez F.O. et al., The Journal of Immunology 177(10):7303-7311 (2006); Gustafsson C, Mjosberg J, Matussek A. et al., PLoS One. 3(4):e2078 (2008); Lehtonen A. et al., J Leukoc Biol. 82(3):710-720 (2007); Nau G.J. et al., Proc Natl Acad Sci U S A 99(3): 1503-1508 (2002)). In fact, a large amount of data covering transcriptional reprogramming of macrophages has been accumulated, albeit not always systematic (Martinez F.O. et al., The Journal of Immunology 177(10):7303-7311 (2006); Gustafsson C. et al., PLoS One. 3(4):e2078 (2008); Lehtonen A. et al., J Leukoc Biol. 82(3):710-720 (2007); Nau G.J. et al., Proc Natl Acad Sci U S A 99(3):1503-1508 (2002); Heng T.S. et al., Nat Immunol. 9(10):1091-1094 (2008)). However, molecular mechanisms controlling transcriptional reprogramming in macrophages are far from understood and it has been suggested that integrative analyses of epigenomic and transcriptomic data will be required to better understand how macrophages integrate the information they receive from their respective microenvironment (Lawrence T., Natoli G., Nat Rev Immunol. 11(11):750-761 (2011)), enabling the identification of specific transcription factor combinations being responsible for cellular macrophage programs.
- The introduction of RNA sequencing (RNA-seq) to interrogate whole transcriptomes has challenged previously established gene expression profiling studies (Ozsolak F., Milos P.M., Nature reviews Genetics 12(2):87-98 (2011); Wang Z, Gerstein M, Snyder M., Nature reviews Genetics 10(1):57-63 (2009); Marioni J.C. et al., Genome Res. 18(9):1509-1517 (2008)). Advantages assigned to RNA-seq over microarray analysis include increases in transcript quantity and quality, improved detection of alternative splicing events and gene fusion transcripts, and a larger dynamic range of detection (Ozsolak F., Milos P.M., Nature reviews Genetics 12(2):87-98 (2011); Wang Z. et al., Nature reviews Genetics 10(1):57-63 (2009); Marioni J.C. et al., Genome Res. 18(9):1509-1517 (2008)).
- To better understand polarization and integration of environmental signals by macrophages and to identify more specific markers for different functional states, high-resolution transcriptome data have been asked for (Murray P.J., Wynn T.A., Nat Rev Immunol. 11(11):723-737 (2011)). Using M1 and M2 polarization as models we applied RNA-seq and compared the information content with data derived by microarray analysis. We provide new insights into human macrophage biology and determine several new markers associated with classical and alternative macrophage polarization in humans.
- The invention thus provides
- (1) a method for identifying of, distinguishing between and isolating of M1-like (classically activated) and M2-like (alternatively activated) macrophages which comprises characterizing the macrophages based on the relative abundance of one or more of the specific M1-associated cell surface markers CD120b, TLR2 and SLAMF7, or of one or more of the specific M2-associated cell surface markers CD1a, CD1b, CD93 and CD226, respectively;
- (2) a preferred embodiment of aspect (1) above, wherein the identifying of and distinguishing between the M1-like and M2-like macrophages is performed by an amplification or by a targeted resequencing of one or more of the specific M1-associated cell surface marker nucleic acids CD120b, TLR2 and SLAMF7 (SEQ ID NOs: 1, 3 and 5), or of one or more of the specific M2-associated cell surface marker nucleic acids CD1a, CD1b, CD93 and CD226 (SEQ ID NOs: 7, 9, 11 and 13), respectively, of the macrophage, notably by utilizing one or more primers derived from each of the marker genes, and a subsequent detection of the amplification/resequencing product;
- (3) a preferred embodiment of aspect (1) above, wherein the identifying of and distinguishing between the M1-like and M2-like macrophages comprises hybridizing one or more probes selective for one of the specific M1-associated cell surface marker nucleic acids CD120b, TLR2 and SLAMF7 (SEQ ID NOs: 1, 3 and 5), or for one of the specific M2-associated cell surface marker nucleic acids CD1a, CD1b, CD93 and CD226 (SEQ ID NOs: 7, 9, 11 and 13), respectively, of the macrophage;
- (4) a preferred embodiment of aspect (3) above, wherein the hybridization is performed on a hybridization array;
- (5) a preferred embodiment of aspect (1) above, wherein the identifying of, distinguishing between and isolating of the M1-like and M2-like macrophages comprises contacting the macrophages with one or more binding molecules directed against the specific M1-associated cell surface marker protein CD120b, TLR2 and SLAMF7 (SEQ ID NOs: 2, 4 and 6), or with one or more binding molecules directed the specific M2-associated cell surface marker nucleic acids CD1a, CD1b, CD93 and CD226 (SEQ ID NOs: 8, 10, 12 and 14), respectively;
- (6) a kit for performing the method according to (1) to (5) above, which comprises at least one reagent for identifying of, distinguishing between and isolating of M1-like macrophages and/or at least one reagent for identifying of, distinguishing between and isolating of M2-like macrophages, said reagents being selected from
- (i) one or more primers derived from the marker genes as defined in (2) above,
- (ii) one or more probes selective for the cell surface marker nucleic acids as defined in (3) above,
- (iii) a hybridization array as defined in (4) above, or
- (iv) one or more binding molecule as defined in (5) above;
- (7) the use of antibodies selected from CD120b, TLR2 and SLAMF7 antibodies for identifying, characterizing and isolating M1-like macrophages;
- (8) the use of antibodies selected from CD1a, CD1b, CD93 and CD226 antibodies for identifying, characterizing and isolating M2-like macrophages;
- (9) a population of M1-like macrophages isolated by the method of (5) above; and
- (10) a population of M2-like macrophages isolated by the method of (5) above.
-
-
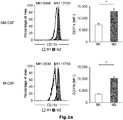
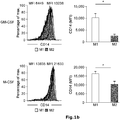
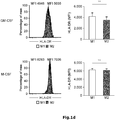
Figure 1 : Phenotypic characterization of human M1- and M2-like macrophages derived from CD14+ peripheral blood monocytes. Expression of typical macrophage lineage markers was determined by flow cytometry (left) of M1- and M2-like macrophages generated in the presence of GM-CSF (upper panel) or M-CSF (lower panel) with quantification shown in the graph at the right. Expression of (a) CD11b, (b) CD14, (c) CD68, (d) HLA-DR, (e) CD64, (f) CD86, and (g) CD23, respectively. *P < 0.05 (Student's t-test). Numbers in plots indicate mean fluorescence intensity. Data are representative of nine independent experiments (a,b,d,e,f,g; mean and s.e.m.) or eight independent experiments (c; mean and s.e.m.), each with cells derived from a different donor. -
Figure 2 : Microarray-based RNA fingerprinting of human M1- and M2-like macrophages. (a) Principle component analysis of human unpolarized (M0) and polarized (M1, M2) macrophages. (b) Unsupervised hierarchical clustering of human M0, M1-, and M2-like macrophages. (c) Visualization of known markers for human M1- and M2-like macrophages as a heatmap. Data were z-score normalized. (d) Left: network of genes highly expressed in M1-like macrophages (fold-change >2.0) in comparison to M0 macrophages identified by microarray analysis. Right: data for the comparison of M2-like versus M0 macrophages were loaded into the M1-network. (e) Right: network of genes highly expressed in M2-like macrophages (fold-change >1.65) in comparison to M0 macrophages identified by microarray analysis. Left: data for the comparison of M1-like versus M0 macrophages were loaded into the M2-network. All networks were generated using EGAN. -
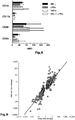
Figure 3 : Comparison of RNA-seq and microarray analysis. (a) Number of genes expressed in human M1- (left) and M2-like macrophages (right) as detected using RNA-Seq (black) and microarray analysis (white). (b) Correlation (Spearman) of mean expression values of M1- (left) and M2-like macrophages (right) using RNA-Seq and microarray analysis. (c-d) Comparison of differentially expressed genes detected using RNA-seq or microarray analysis (p <0.05). Differentially expressed genes as assessed by RNA-seq (black) or microarray analysis (white) were divided into groups by their relative expression in (c) M1 versus M2 or (d) M2 versus M1. (e) Gene expression in M1- versus M2-like macrophages as fold change versus fold change plot comparing microarray analysis with RNA-seq using all Refseq genes differentially expressed in RNA-seq. (f) Venn-diagram of differentially expressed genes between M1- and M2-like macrophages in RNA-seq (blue) and microarray analysis (red), (FC > 2 p-value < 0.05, diff > 100 for microarray data). Fold-change-rank plots of genes detected as differentially expressed between M1- and M2-like macrophages (g) by microarray analysis (red) with overlay of values obtained by RNA-seq (blue) or (h) by RNA-seq (blue) with overlay of values obtained by microarray analysis (red). (i) Visualization of known markers for human M1- and M2-like macrophages fromFigure 2c as a heatmap using RNA-seq. Data were z-score normalized. -
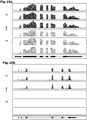
Figure 4 : Correlation of RNA-seq, microarray, qPCR, and flow cytometric analysis. (a-d) CD68, (e-h) CD64, and (i-I) CD23 expression in human M1- and M2-like macrophages. (a, e, i) Left, representative images of sequencing reads across the genomic loci of genes expressed in human macrophages. Pictures taken from the Integrative Genomics Viewer (IGV). The height of bars represents the relative accumulated number of 100-bp reads spanning a particular sequence. Gene maps (bottom portion of each panel, oriented 5'-3' direction) are represented by thick (exons) and thin (introns) lines. Right, RPKM values by RNA-seq in M1- and M2-like macrophages. (b, f, j) Left, heatmaps presenting microarray results from M1- and M2-like macrophages from seven donors. Data were z-score normalized. Right, relative mRNA expression. (c, g, k) Relative mRNA expression by qPCR in M1- and M2-like macrophages. (d, h, l) Protein expression was determined by flow cytometry in human M1- and M2-like macrophages. Data are representative of three experiments (RNA-seq, mean and s.e.m.), seven experiments (microarray, mean and s.e.m.), at least seven experiments (qPCR; mean and s.e.m.), and nine experiments (flow cytometry), each with cells derived from a different donor. *P < 0.05 (Student's t-test) -
Figure 5 : Network analysis of RNA-seq data. (a) Network of genes highly expressed in M1-like macrophages (fold-change >4.0) identified by RNA-seq. (b) Data generated by microarray analysis were loaded into the M1-network established using RNA-seq. (c) Network of genes highly expressed in M2-like macrophages (fold-change >2.5) identified by RNA-seq. (d) Data generated by microarray analysis were loaded into the M2-network established using RNA-seq. All networks were generated using EGAN. (e) APOL1 and (f) LILRA1 expression in human M1- and M2-like macrophages. Left, representative images of sequencing reads across genes expressed in human macrophages as described inFigure 4 . Right, relative mRNA expression by qPCR in M1- and M2-like macrophages. Data are representative of three experiments (RNA-seq and qPCR; mean and s.e.m.) each with cells derived from a different donor. *P < 0.05 (Student's t-test) -
Figure 6 : Detection of alternative splicing in human macrophages. (a) Summarized expression of all PDLIM7 transcripts in human M1- and M2-like macrophages. Left, representative images of sequencing reads across genes expressed in human macrophages as described inFigure 4 . Right, RPKM values for PDLIM7 by RNA-seq in M1- and M2-like macrophages. (b) Expression of PDLIM7 as determined by microarray analysis using 3 different probes recognizing different parts of the PDLIM7 transcripts as depicted in (a). (c) Upper panel: representation of the 3 different mRNA transcripts from Refseq. Lower panel: abundance of the different transcripts as determined using Cuffdiff. (d) qPCR for the 3 different mRNA transcripts from Refseq in human M1- and M2-like macrophages. Data are representative of three experiments (RNA-seq), seven experiments (microarray analysis) or at least ten experiments (qPCR; mean and s.e.m.), each with cells derived from a different donor. *P < 0.05 (Student's t-test) -
Figure 7 : Identification of new macrophage polarization markers based on combined transcriptome analysis. Differentially expressed genes between M1- and M2-like macrophages of the human surfaceome were visualized as heatmaps for RNA-seq (left) and microarray analysis (right). Data were z-score normalized. (b-c) Expression of novel macrophage markers was determined by flow cytometry (left) of M1- and M2-like macrophages generated in the presence of GM-CSF with quantification shown in the graph at the right. Expression of (b) CD120b, TLR2, and SLAM7 as well as (c) CD1a, CD1b, CD93, and CD226. *P < 0.05 (Student's t-test). Numbers in plots indicate mean fluorescence intensity. Data are representative of nine independent experiments (b,c; mean and s.e.m.) each with cells derived from a different donor. -
Figure 8 : Phenotypic characterization of human M1-like macrophages derived from CD14+ peripheral blood monocytes. Expression of classical M1 markers after polarization of GM-CSF generated macrophages with IFN-γ, LPSu, TNF-α or IFN-γ and LPSu. Surface expression of lineage markers CD14 and CD11b as well as surface expression of the typical M1 markers CD86 and CD64 was assessed by flow cytometry. -
Figure 9 : Comparison of RNA-seq and microarray analysis. Gene expression in M1- versus M2-like macrophages as fold change versus fold change plot comparing microarray analysis with RNA-seq using only Refseq genes differentially expressed in microarrays. -
Figure 10 : Analysis of classical macrophage markers. (a) CD68, (b), CD64, and (c) CD23 expression in human M1- and M2-like macrophages. Representative images of sequencing reads across genes expressed in human macrophages for all three donors analyzed. Pictures taken from the Integrative Genomics Viewer (IGV). The height of bars represents the relative accumulated number of 100-bp reads spanning a particular sequence. Gene maps (bottom portion of each panel, oriented 5'-3' direction) are represented by thick (exons) and thin (introns) lines. -
Figure 11 : Detection of classical macrophage genes by RNA-seq. (a) IL-10 and (b) IL-18 expression in human M1- and M2-like macrophages. Left, expression as determined by microarray analysis using; middle, representative images of sequencing reads across genes expressed in human macrophages. Pictures taken from the Integrative Genomics Viewer (IGV). The height of bars represents the relative accumulated number of 100-bp reads spanning a particular sequence. Gene maps (bottom portion of each panel, oriented 5'-3' direction) are represented by thick (exons) and thin (introns) lines. Right, relative mRNA expression by RNA-seq in M1- and M2-like macrophages. Data are representative of seven (microarrays, mean and s.d.) or three experiments (RNA-seq, mean and s.d.) each with cells derived from a different donor. *P < 0.05 (Student's t-test), n.s. = not significant. -
Figure 12 : Analysis of the apolipoprotein L family genes in M1- and M2-like macrophages. (a) APOL2, (b) APOL3, and (c) APOL6 expression in human M1- and M2-like macrophages. Left, relative expression as determined by RNA-seq; middle, representative images of sequencing reads across genes expressed in human macrophages. Pictures taken from the Integrative Genomics Viewer (IGV). The height of bars represents the relative accumulated number of 100-bp reads spanning a particular sequence. Gene maps (bottom portion of each panel, oriented 5'-3' direction) are represented by thick (exons) and thin (introns) lines. Right, relative mRNA expression by qPCR in M1- and M2-like macrophages. Data are representative of three experiments (RNA-seq, mean and s.d. and qPCR, mean and s.e.m.) each with cells derived from a different donor. *P < 0.05 (Student's t-test). -
Figure 13 : Analysis of the leukocyte immunoglobulin-like receptor family genes in M1- and M2-like macrophages. (a) LILRA2, (b) LILRA3, (c) LILRA5, (d) LILRB1, and (c) LILRB3 expression in human M1- and M2-like macrophages. Left, relative expression as determined by RNA-seq; middle, representative images of sequencing reads across genes expressed in human macrophages. Pictures taken from the Integrative Genomics Viewer (IGV). The height of bars represents the relative accumulated number of 100-bp reads spanning a particular sequence. Gene maps (bottom portion of each panel, oriented 5'-3' direction) are represented by thick (exons) and thin (introns) lines. Right, relative mRNA expression by qPCR in M1- and M2-like macrophages. Data are representative of three experiments (RNA-seq, mean and s.d. and qPCR, mean and s.e.m.) each with cells derived from a different donor. *P < 0.05 (Student's t-test). -
Figure 14 : Identification of new macrophage polarization markers based on combined transcriptome analysis. (a-b) Expression of novel M1- and M2-like macrophage markers on CD11b+CD14+ macrophages was determined by flow cytometry (left) of M1- and M2-like macrophages generated in the presence of M-CSF with quantification shown in the graph at the right. Expression of (a) CD120b, TLR2, and SLAM7 as well as (b) CD1a, CD1b, CD93, and CD226. *P < 0.05 (Student's t-test). Numbers in plots indicate mean fluorescence intensity. Data are representative of nine independent experiments (b,c; mean and s.e.m.) each with cells derived from a different donor. - Macrophages are dynamic cells integrating signals from their microenvironment to develop specific functional responses. Microarray-based transcriptional profiling has established transcriptional reprogramming as an important mechanism for signal integration and cell function of macrophages yet current knowledge on transcriptional regulation is far from complete. RNA sequencing (RNA-seq) is ideally suited to fill this need but also to discover novel marker genes, an area of great need particularly in human macrophage biology. Applying RNA-seq, a high-resolution transcriptome profile of human macrophages under classical (M1-like) and alternative (M2-like) polarization conditions is provided and shows a dynamic range exceeding observations obtained by previous technologies, resulting in a more comprehensive understanding of the transcriptome of human macrophages. In addition, differential promoter usage, alternative transcription start sites, and different coding sequences for 57 gene loci in human macrophages were detected. Moreover, this approach led to the identification of novel M1-associated (CD120b, TLR2, SLAMF7) as well as M2- associated (CD1a, CD1b, CD93, CD226) cell surface markers.
- Because of the enormous plasticity of human macrophages, the classification of polarization states on the basis of few cell surface markers will remain a substantial challenge (Murray P.J., Wynn T.A., Nat Rev Immunol. 11(11):723-737 (2011)). Here, we addressed how RNA-seq based high-resolution transcriptome data can be utilized to better understand the biology of macrophage polarization. We observed a significant increase in dynamic range in RNA-seq data resulting in a significantly higher number of genes determined to be significantly differentially expressed. This was true despite the fact that we used seven biological replicates for array analysis but only three samples for RNA-seq. A priori information based network analysis further supported that the increased information content of RNA-seq data uncovered novel aspects of macrophage biology, which was illustrated by the recognition of differential expression of numerous family members of two gene families, namely the apolipoprotein L family and leukocyte immunoglobulin-like receptors. APOLs constitute a new class of apolipoproteins expressed by macrophages as they serve as lytic factors against invading pathogens, e.g. African trypanosomes inducing programmed cell death as well as inhibiting intracellular infection by Leishmania (Pays E., Vanhollebeke B., Curr Opin Immunol. 21(5):493-498 (2009); Samanovic M. et al., PLoS Pathog. 5(1):e1000276 (2009)). LILRs have been associated with balancing the effects of Toll-like receptor signaling, suggesting an important role of LILRs both in the initiation but also cessation of inflammatory responses mediated by macrophages (Brown D. et al., Tissue Antigens. 64(3):215-225 (2004)). Another aspect enhancing our knowledge about the polarization biology of macrophages was the identification of several genes with differential usage of alternative promoters and transcription start sites as well as differential splicing variants between M1- and M2-like macrophages. As visualized for PDLIM7, an intracellular scaffold protein that contains a PDZ domain and three LIM domains linked to mitogenic signaling through actin cytoskeleton organization (Nakagawa N. et al., Biochemical and biophysical research communications 272(2):505-512 (2000)), regulating Tbx5 transcriptional activity (Camarata T. et al., Developmental biology 337(2):233-245 (2010)), and suppressing p53 activity (Jung C.R. et al., The Journal of clinical investigation 120(12):4493-4506 (2010)), RNA-seq revealed significant differences in splice variant usage for M1- and M2-like macrophages potentially linking p53 regulation with macrophage polarization (Matas D. et al., Cell death and differentiation 11(4):458-467 (2004)). Usage of splice variant-specific qPCR reactions supported these findings while this differential regulation was not revealed by microarray analysis. Altogether we detected differential promoter usage, transcription start site usage and splice variant usage in over 50 gene loci, a number that was surprisingly low taking into account that such mechanisms of transcriptional regulation have been suggested for the majority of gene loci in mammalian genomes (Kapranov P. et al., Nature reviews Genetics 8(6):413-423 (2007)).
- While studies in other cell systems suggested that RNA-seq data will further improve cell characterization (Ozsolak F., Milos P.M., Nature reviews Genetics 12(2):87-98 (2011); Wang Z. et al., Nature reviews Genetics 10(1):57-63 (2009); Marioni J.C. et al., Genome Res. 18(9):1509-1517 (2008)), the direct assessment of the new technology in macrophage polarization was necessary to estimate its potential information gain. Both, increased dynamic range and the identification of transcripts that were missed by microarray analysis were major reasons for the discovery of novel genes associated with either M1- or M2-polarization. Nevertheless, despite a lower number of informative transcripts in the microarray data, 73% of the major M1-network was still revealed - at least when using transcripts defined to be enriched in M1-like macrophages. However, this rate dropped to only 54% in the M2-network and major hubs like MYC and TP53 where only revealed by RNA-seq data in M2-like macrophages. Overall these findings point towards an advantage of RNA-seq data, when the endpoint of the analysis is the identification of novel biological mechanisms.
- An important aspect of genomic characterization is the identification of novel marker genes in macrophage polarization (Murray P.J., Wynn T.A., Nat Rev Immunol. 11(11):723-737 (2011)). When focusing on genes being part of the human surfaceome in most cases RNA-seq data revealed larger differences between M1-like and M2-like cells when compared to microarray data. Nevertheless, some genes only reached significant differential expression in the array data clearly pointing toward the necessity to include a large enough number of biological replicates also when applying RNA-seq. On the other hand, a subset of genes showed the well-known background noise effect in the microarray data resulting in non-significant differences between the two cell types. Irrespective of these different shortcomings of the two technologies, the overall differences between the two techniques in this defined gene space were less obvious suggesting that both technologies are well suited for cell surface marker identification. Taken together, we introduced several new marker genes for which we established FACS assays that can be used to distinguish between M1 and M2 polarization of macrophages and that can be combined with the analysis of common macrophage markers.
- In the method of aspect (1) of the invention, the relative abundance of the M1-associated cell surface markers is higher in M1-like macrophages than in M2-like macrophages and the relative abundance of the M2-associated cell surface markers is higher in M2-like macrophages than in M1-like macrophages.It is preferred that the abundance of the cell surface marker in the respective M1-like or M2-like macrophage is at least 30%, more preferably at least 50 % and most preferably at least 70 % higher than in the other macrophage type.
- The one or more primers employed in the amplification/resequencing employed in the method of aspect (2) of the invention are derived from the respective marker gene. Preferably said primers have at least 12, more preferably at least 15, most preferably at least 19 contiguous nucleotides of the respective marker nucleic acid sequence.
- Similarly, the one or more probes employed in the method of aspect (3) of the invention are derived from the respective marker gene. Preferably said probes have a length that allows for a selective hybridization to the marker nucleic acid. The probe may also be labeled with a suitable marker molecule (e.g. with a fluorescence marker) to allow the detection of the resulting probe-surface marker nucleic acid complex.
- Such probes may also be utilized in a hybridization array of aspect (4) of the invention.
- The binding molecules utilized in aspect (5) of the invention include antibodies, preferably monoclonal antibodies. Moreover said binding molecules may be labeled with maker molecules, preferably fluorescence markers. Particular preferred binding molecules include the FITC-labeled CD1b, CD93, CD226 and anti-TLR2, PE-labeled CD120b and anti-SLAMF7, and PE-Cy5-labeled CD1a monoclonal antibodies. Further it is preferred that the method of aspect (5), notably if it is utilized to isolate the M1-like macrophages or M2-like macrophages, is performed on a FACS sorter.
- The identification of novel marker genes distinguishing human M1-like and M2-like macrophages opens new avenues towards understanding the biology of differentially polarized macrophages. One of the M1-marker identified in this study, namely CD120b (TNFR2) has been linked to cell survival, activation and even proliferation in other cell types such as T cells (Faustman D., Davis M., Nat Rev Drug Discov. 9(6):482-493 (2010)). In contrast to TNFR1, TNFR2 preferentially leads to NFκB activation. Whether this is true in myeloid cells as well requires further investigation. However, earlier studies already suggested that production of TNF-α in macrophages might be interpreted as a phenotype-stabilizing feed-forward loop (Popov A. et al., The Journal of clinical investigation. 116(12):3160-3170 (2006)) and TNFR2 might actually play an important role in such a process.
- SLAMF7 was originally identified as a NK cell-associated surface molecule (Boles K.S. et al., Immunol Rev. 181:234-249 (2001)). Subsequently, it was shown to be expressed on lymphocytes and monocytes (Murphy J.J. et al., Biochem J. 361(Pt 3):431-436 (2002)). More recently, a reduced expression on monocytes and NK cells with a simultaneous increase of SLAMF7 on B cells was observed in patients with lupus erythematosus (Kim J.R. et al., Clin Exp Immunol. 160(3):348-358 (2010)). The strongest link to SLAMF7 as an M1 marker gene comes from observations in intestine allograft rejection, demonstrating that tissue macrophages derived from patients rejecting the graft showed elevated levels of SLAMF7 (Ashokkumar C. et al., Am J Pathol. 179(4):1929-1938 (2011)). It would be interesting to see if macrophages in other settings of transplant rejection are also enriched for this novel M1 marker gene. Considering the identification of single specific marker genes for macrophage polarization our findings clearly point to the necessity for multi-parameter analysis instead. This can be exemplified by the differential expression of CD1a and CD1b, two cell surface molecules that are mainly studied in context of antigen presentation by dendritic cells (Porcelli S.A., Modlin R.L., Annu Rev Immunol. 17:297-329 (1999)). Previous reports suggested upregulation of CD1 proteins on human monocytes by GM-CSF (Kasinrerk W. et al., J Immunol. 150(2):579-584 (1993)). However, we clearly present evidence that expression is induced in both M-CSF and GM-CSF driven macrophages and polarization towards M2-like macrophages is significantly increasing expression of CD1a and CD1b suggesting that they might be up-regulated on tissue macrophages in an M2-driving environment. This is similarly true for CD93, which was originally identified to be expressed on early hematopoietic stem cells and B cells (Greenlee-Wacker M.C. et al., Curr Drug Targets. (2011)). CD93 is involved in biological processes such as adhesion, migration, and phagocytosis (McGreal E.P. et al., J Immunol. 168(10):5222-5232 (2002); Nepomuceno R.R. et al., J Immunol. 162(6):3583-3589 (1999)). CD93 expressed on myeloid cells can be shed from the cell surface and the soluble form seems to be involved in differentiation of monocytes towards a macrophage phenotype (Jeon J.W. et al., J Immunol. 185(8):4921-4927 (2010)). Since soluble CD93 has been implicated in inflammatory responses, it will be important to further elucidate how polarization-induced differential expression of CD93 contributes to specific inflammatory responses. Another surprising finding is the differential expression of CD226 between human M1- and M2-like macrophages, a molecule initially shown to be involved in cytolytic function of T cells (Shibuya A. et al., Immunity. 4(6):573-581 (1996)). Subsequently, it could be shown that CD226 has additional functions including the regulation of monocyte migration through endothelial junctions (Reymond N. et al., J Exp Med. 199(10):1331-1341 (2004)). Similar to the other M2-associated markers, so far little is known about CD226 on polarized macrophages. Since CD226 expression levels on lymphocytes have been implicated in autoimmune diseases (Sinha S. et al., PLoS One. 6(7):e21868 (2011)) further research is necessary to understand its role in the myeloid compartment during such processes.
- Overall, by using RNA-seq we introduce a high-resolution transcriptome analysis of human macrophages unraveling novel insights into macrophage polarization. While previously established transcriptome datasets addressing macrophage biology are still very suitable to assess important biological and medical questions, a deeper understanding of transcriptional regulation during macrophage polarization will require higher resolution that is provided by current and future RNA-seq technologies. Moreover, the novel cell surface markers will help to better understand macrophage programs and functions in human disease.
- The Invention is further described in the following non-limiting Examples.
- Abbrevations: LPSu, ultrapure LPS; GEP, gene expression profiling; PCA, principle component analysis; RNA-seq, RNA sequencing technologies; MFI, mean fluorescence intensity; EGAN, exploratory gene association network; RPKM, Reads Per Kilobase of exon model per Million mapped reads; FC, fold change; TSS, transcription start sites; CDS, coding sequences.
- Cell isolation from healthy blood donors: Peripheral blood mononuclear cells (PBMC) were obtained by Pancoll (PAN-Biotech, Aidenbach, Germany) density centrifugation from buffy coats from healthy donors obtained following protocols accepted by the institutional review board at the University of Bonn (local ethics vote no. 045/09). Informed consent was provided for each specimen according to the Declaration of Helsinki. CD14+ monocytes were isolated from PBMC using CD14-specific MACS beads (Miltenyi Biotec) according to the manufacturers protocol (routinely >95% purity).
- Generation of macrophages: CD14+ monocytes were cultured in 6-well plates in RPMI1640 medium containing 10% FCS and differentiated into immature macrophages using GM-CSF (500 U/ml) or M-CSF (100 U/ml) for 3 days. Growth-factor containing medium was exchanged on day 3 and cells were polarized for 3 days with the following stimuli: IFN-γ (200 U/ml), TNF-α (800 U/ml), ultrapure LPS (LPSu, 10 µg/ml), IL-4 (1,000 U/ml), IL-13 (100 U/ml), or combinations thereof (all from Immunotools, Friesoythe, Germany).
- Monoclonal antibodies and flow cytometry: Cells were stained after FcR blockade incubating cells in PBS with 20% FCS for 10 minutes at 4°C using the following monoclonal antibodies (all from Becton Dickinson (BD), BioLegend, or eBioscience): FITC-labeled CD1b, CD23, CD93, CD226, anti-HLA-DR, anti-TLR2; PE-labeled CD64, CD68, CD120b, anti-SLAMF7; PE-Cy5-labeled CD1a; PerCP-Cy5.5-labeled CD209; APC-labeled CD86; Pacific Blue-labeled CD11b; and APC-Cy7-labeled CD14 with matched isotype antibodies as controls. Intracellular staining of CD68 was performed using the BD Cytofix/Cytoperm kit (BD). Data were acquired on a LSR II (BD) and analyzed using FlowJo software (Tree Star). RNA isolation: 5x10⁶-2x10⁷ macrophages were harvested, subsequently lysed in TRIZOL (Invitrogen) and total RNA was extracted according to the manufactures' protocol. The precipitated RNA was solved in RNAse free water. The quality of the RNA was assessed by measuring the ratio of absorbance at 260 nm and 280 nm using a Nanodrop 2000 Spectrometer (Thermo Scientific) as well as by visualization the integrity of the 28S and 18S band on an agarose gel. Quantitative PCR conditions and primer sequences: 500 ng RNA was reverse transcribed using the Transcriptor First Strand cDNA Synthesis Kit (Roche Diagnostics). qPCR was performed using the LightCyclerTaqman master kit with GAPDH as reference on a LightCycler 480 II (Roche). qPCR primer sequences are summarized in Table 2.
- Isoform specific PCR to identify alternative splicing events were performed using the Maxima SYBR Green/Fluorescein qPCR Master Mix (Fermentas). The relative enrichment of each isoform relative to GAPDH was calculated using the 2-ΔΔVCT method. qPCR primer sequences are listed in Table 3.
- Microarray-based transcriptional profiling and bioinformatic analysis of microarray data: Isolated RNA was further purified using the MinElute Reaction Cleanup Kit (Qiagen). Biotin labeled cRNA was generated using the TargetAmp Nano-g Biotin-aRNA Labeling Kit (Epicentre). Biotin labeled cRNA was hybridized to Human HT-12V3 Beadchips (Illumina) and scanned on an Illumina HiScanSQ system. Raw intensity data were exported with BeadStudio 3.1.1.0 (Illumina) and subsequently analysed using R (R Development Core Team. R: A Language and Environment for Statistical Computing (2011)). After quantile normalization non-informative genes (coefficient of variation < 0.5) were excluded. From the resulting data sets we extracted a list of genes with a significant different expression in macrophage subtypes. Variable genes were plotted as heatmaps with hierarchical clustering using the correlation coefficient as a distance measure for the samples and the average of each cluster for cluster formation of the genes. Expression values are visualized with colors ranging from red (high expression) over white (indermediate expression) to blue (low expression). Principal component analysis (PCA) was performed using the "pcurve" package in R. Microarray data can be accessed under GSE35449.
- RNA-seq and data analysis: Sequencing and analysis were performed individually on M1-like and M2-like macrophages from 3 independent donors. Total RNA was converted into libraries of double stranded cDNA molecules as a template for high throughput sequencing using the Illumina CBot station and HiScanSQ following the manufacturer's recommendations using the Illumina TruSeq RNA Sample Preparation Kit. Shortly, mRNA was purified from 5-10 µg of total RNA using poly-T oligo-attached magnetic beads. Fragmentation was carried out using divalent cations under elevated temperature in Illumina proprietary fragmentation buffer. First strand cDNA was synthesized using random oligonucleotides and SuperScript II. Second strand cDNA synthesis was subsequently performed using DNA Polymerase I and RNase H. Remaining overhangs were converted into blunt ends via exonuclease/polymerase activities and enzymes were removed. After adenylation of 3' ends of DNA fragments, Illumina PE adapter oligonucleotides were ligated to prepare for hybridization. In order to select cDNA fragments of preferentially 200 bp in length the library fragments were separated on a 2% (w/v) agarose gel. The corresponding gel-fraction for each library was excised and purified using the QIAquick gel extraction kit (Qiagen). DNA fragments with ligated adapter molecules were selectively enriched using Illumina PCR primer PE1.0 and PE2.0 in a 15 cycle PCR reaction. Products were purified (QIAquick PCR purification kit) and quantified using the Agilent high sensitivity DNA assay on a Bioanalyzer 2100 system (Agilent). After cluster generation, 100 bp paired-end reads were generated and analyzed using CASAVA 1.8. Alignment to the human reference genome hg19 from UCSC was performed stepwise. First, all reads passing the chastity filter were aligned to the reference genome. Next, reads were aligned to the RNA reference transcriptome. Based on these alignments the numbers of reads aligning to intragenic regions, or intergenic regions, respectively, were calculated. In addition the numbers of reads mapping to exonic and intronic regions as well as to splice sites were calculated based on the UCSC annotation file. Reads per kilobase of exon model per million mapped reads (RPKM) values for Refseq genes were established using CASAVA 1.8. In order to identify reads spanning altered splicing events or gene fusion breakpoints we also analyzed reads using TopHat and Bowtie. Results were further processed using Cufflinks and Cuffdiff (Trapnell C. et al., Nature biotechnology 28(5):511-515 (2010)).
- A priori information-based network analysis using EGAN software: To visualize connectivity between genes in high-throughput datasets contextual network graphs were generated based on a priori knowledge stored in literature, pathway, interaction, or annotation term databases by EGAN (exploratory gene association network) Paquette J., Tokuyasu T., Bioinformatics 26(2):285-286 (2010). To visualize the transcriptional regulation of genes enriched in M1 respectively M2, array data were used and fold change differences calculated using unpolarized macrophages as comparison. Genes with a FC > 2 for M1 and FC > 1.65 for M2 were visualized; represented is the major network. Using the network topology established for M1-like macrophages the expression values for M2-like macrophages were plotted and vice versa. For comparison of network components and density between RNA-seq and array data, the network was first visualized for the RNA-seq data (FC > 4 for M1 and FC > 2.5 for M2). Keeping the network topology, genes were marked according to their fold change when visualizing the array-based network. Graphs for genes enriched in M1 respectively in M2 were generated independently.
- Statistical analysis: Student's t-tests were performed with SPSS 19.0 software.
- Example 1: Generation of human M1- and M2-like macrophages as a model system. To establish a high-resolution transcriptome of human macrophages as a result of specific polarization signals, we used classical (M1-like) and alternative (M2-like) polarization of human macrophages as a model system. Since both M-CSF and GM-CSF have been described to differentiate macrophages from blood-derived CD14+ monocytes, we first compared the two different stimuli in respect to macrophage polarization and used expression of well-known macrophage markers as the initial readout (Martinez F.O. et al., The Journal of Immunology 177(10):7303-7311 (2006); Hamilton J.A., Nat Rev Immunol. 8(7):533-544 (2008)). For classical polarization we primarily used IFN-γ as the model stimulus and IL-4 for alternative polarization. When assessing the macrophage surface marker CD11b, the total percentage of CD11b+ cells under M1 and M2 polarization conditions was similar while the MFI was slightly higher in M2-like macrophages independent of the usage of GM-CSF or M-CSF (
Figure 1a ). Further, we observed high expression of CD14 on all cells under M1 and M2 polarizing conditions irrespective of GM-CSF or M-CSF differentiation with a higher CD14 expression in M1-like macrophages (Figure 1b ). For both classical macrophage markers CD68 and MHC class II molecules (Figure 1c and1d ) we observed no differences in all four conditions tested. Of note, when the IL-4 signal was provided to monocytes from the beginning of the differentiation period, immature dendritic cells were generated with a typical loss of macrophage markers such as CD14 or CD68 (data not shown). - When assessing markers previously associated with M1 or M2 polarization (Mantovani A. et al., Trends Immunol. 23(11):549-555 (2002)), a selective induction of the M1 marker CD64 in M1-like macrophages was observed in cultures differentiated with both GM-CSF and M-CSF (
Figure 1e ) while CD86 only showed an M1-specific expression in GM-CSF differentiated cells (Figure 1f ). Assessment of these markers following other M1-associated polarization signals, e.g. LPS, TNF-α or combinations thereof resulted in comparable results (Figure 8 ). Inversely, strong induction of the M2-marker CD23 was observed in IL-4 polarized macrophages with significantly higher induction in GM-CSF polarized M2-like macrophages (Figure 1g ). For further experiments we therefore differentiated monocytes with GM-CSF for 3 days prior to polarization with either IFN-γ or IL-4 as the model signals. - Example 2: Characterization of M1- and M2-like macrophages by microarray-based gene expression profiling. Most recently it has been suggested that assessment of macrophage polarization in humans cannot solely rely on few cell surface markers but should be accommodated by gene expression profiling (Murray P.J., Wynn T.A., Nature reviews Immunology 11(11):723-737 (2011)). Using one of the most recent array generations, gene expression profiling was performed on unpolarized and polarized macrophages derived from seven healthy donors. To determine sample relationships, PCA (
Figure 2a ) and hierarchical clustering (Figure 2b ) based on variable genes were performed and showed segregation of the samples by polarization state. Comparing our data with publically available datasets from M1- and M2-like macrophages generated with earlier array versions we observed concordant gene expression patterns (data not shown) (Martinez F.O. et al., The Journal of Immunology 177(10):7303-7311 (2006)). Heatmap visualization of known M1- and M2-like macrophage markers (Figure 2c ) further demonstrated that the genes encoding for the surface molecules FCGR1A and FCGR1B (both representing CD64) and CD86, the cytokine/chemokine genes CXCL10, CXCL9, IL-1B, IL-6, CXCL11, TNF, IL-23A, and the genes encoding for the intracellular protein GBP1 were increased in M1-like macrophages, results similar to what has been previously reported for M1 polarization (Martinez F.O. et al., The Journal of Immunology 177(10):7303-7311 (2006); Mantovani A. et al., Immunity 23(4):344-346 (2005); Mosser D.M., Edwards J.P., Nat Rev Immunol. 8(12):958-969 (2008)). Inversely, M2-associated genes encoding for the surface molecules FCER2 (CD23), IL27RA, and CLEC4A, the chemokine genes CCL22, CCL18, and CCL17, and the intracellular protein F13A1 were increased in the M2-like macrophages (Mantovani A. et al., Immunity 23(4):344-346 (2005); Mosser D.M., Edwards J.P., Nat Rev Immunol. 8(12):958-969 (2008); Wirnsberger G. et al., Eur J Immunol. 36(7):1882-1891 (2006)). - To further illustrate differential macrophage polarization, we generated a priori knowledge based M1-associated (
Figure 2d ) and M2-associated (Figure 2e ) networks applying EGAN (Paquette J., Tokuyasu T., Bioinformatics 26(2):285-286 (2010)) using genes significantly upregulated in M1- (FC > 2) respectively M2-polarized cells (FC > 1.65). When applying expression values from the comparison of M2-like with M0 macrophages on the M1-associated network, the vast majority of genes showed either no change or even a reduction in expression, likely to represent an active repression of M1-associated genes in M2-like macrophages (Figure 2d ). Only few genes showed a simultaneous increase in expression, and these genes represented common cell cycle associated genes. Similarly, members of the M2-associated network were mostly not changed or even reduced in M1-like macrophages (Figure 2e ). - Example 3: Increase in overall transcriptome information by RNA-seq. Gene expression profiling using microarrays has recently been suggested to be inferior to newer sequencing based technologies in providing genome-wide transcriptome information (Wang Z. et al., Nature reviews Genetics 10(1):57-63 (2009)). To address the potential information increase for macrophages, RNA-seq was performed on in vitro generated M1- and M2-like macrophages. After quality filtering, we obtained 15.0 ± 2.8 million and 20.4 ± 9.2 million reads for the M1- and M2-like macrophage cDNA libraries (Table 1). Consistent with RNA-seq data obtained from other eukaryotic cells (Ramskold D. et al., PLoS computational biology 5(12):e1000598(2009)) the majority of sequencing reads for M1- and M2-like macrophages mapped to annotated exons (Refseq transcripts). The remaining reads mapped to exon-intron boundaries, introns, or other uncharacterized intergenic regions (Table 1). RPKMs are measures of individual transcript abundance in RNA-seq datasets and have been shown to be highly accurate across multiple cell types (Mortazavi A. et al., Nature methods 5(7):621-628 (2008)). We used CASAVA to assign RPKMs. To compare RNA-seq and microarray data we cross-annotated RNA-seq and microarray data using HGNC symbols. In human M1- and M2-like macrophages, 11317 and 11466 Refseq genes were expressed applying a previously defined optimal threshold (0.3 RPKM) for gene expression (
Figure 3a ) (Ramskold D. et al., PLoS computational biology 5(12):e1000598 (2009)). The present call rate for Refseq genes for M1-(n=10155) and M2-like macrophages (n=10418) was only slightly lower when using microarrays (Figure 3a ). Furthermore, when assessing the levels of mRNA expression on a global scale a high correlation between RNA-seq and microarray data - similar to other cells (Mortazavi A. et al., Nature methods. 5(7):621-628 (2008)) - was observed for M1- and M2-like macrophages (Figure 3b ). - Example 4: RNA-seq reveals differential expression at significantly higher resolution. RNA-seq showed a significantly increased dynamic range over background mainly due to significantly lower background levels. This suggested that the assessment of differential expression using RNA-seq might lead to an improved resolution in comparison to array-based data. Applying standard filter criteria (FC ≥ 1.5, p < 0.05, RPKM ≥ 0.3) revealed a total of 1736 genes elevated in M1- versus M2-like macrophages by RNA-seq, while 834 genes were recognized by array analysis (
Figure 3c ). Similarly, 822 genes were identified as being elevated in M2- versus M1-like macrophages by RNA-seq, while 786 genes were detected by array analysis (Figure 3d ). More importantly, when categorizing differentially expressed genes according to their level of differential expression, RNA-seq data clearly revealed up to 4-fold more genes with FC > 4 for M1- and M2-associated genes (Figure 3c and d ), which was similarly true for M1-associated genes at lower levels (1.5 < FC < 4). To reveal potential reasons for this difference on the single-gene level we utilized FC-FC plotting, correlating RNA-seq and array-based data for individual genes (Figure 3e ). The majority of genes showed similar behavior in both RNA-seq and microarray experiments, albeit the relative differences were higher in RNA-seq data (Figure 3e ). Altogether, we observed a considerable increase in the dynamic range of fold-differences in RNA-seq data with differences spanning six orders of magnitude in contrast to only four orders of magnitude in the microarray data (Figures 3e and9 ). In addition, there was a significant number of genes showing differential expression in RNA-seq data (e.g. DUOX1, DUOX2, TBX21, GBP7) but not in the array data suggesting that the array data are not informative for this class of genes. As anticipated, when using Venn diagrams with a defined cutoff (-2 ≥ FC ≥ 2, p < 0.05, RPKM ≥ 0.3) for data presentation (Figure 3f ), both RNA-seq and array data revealed 595 genes to be differentially expressed, but RNA-seq revealed 900 additional genes. Surprisingly, 308 genes were classified as being differentially expressed by array analysis alone (Figure 3f ). When further assessing these genes, it became apparent that these genes show a similar trend in the RNA-seq data but these differences did not yet reach statistical significance (Figure 3g ). In contrast, genes only identified by RNA-seq, clearly showed no differences when assessed by array analysis (Figure 3h ). Visualization of typical marker genes as depicted for array data inFigure 2c demonstrated a comparable differentiation of M1- and M2-like macrophages when assessed by RNA-seq (Figure 3i ). - Example 5: Exon resolution transcriptome analysis of known macrophage markers. Another advantage of RNA-seq is to resolve gene expression on the exon level (
Figure 4 ). For the macrophage related genes CD68 (Figure 4a-d ), CD64 (Figure 4e-h ) and CD23 (Figure 4i-l ), RNA-seq data were visualized for the genomic loci of the respective genes and compared with array, qPCR, and FACS data. For CD68, RNA-seq data revealed similarly high expression for M1 and M2 macrophages for all exons with little variance in expression levels between donors (Figures 4a and11 ). Slightly higher variance was observed for both microarray (Figure 4b ) and qPCR data (Figure 4c ) while protein levels showed equal expression in all samples analyzed (Figure 4d ). For CD64, RNA-seq revealed complete absence of expression for all exons in M2-like macrophages with high expression in M1-like macrophages (Figure 4e ), which was similarly observed by other technologies (Figure 4f-h ). For CD23, protein data suggest significantly elevated expression on M2-like macrophages with low level expression on M1-like macrophages (Figure 4l ), a result which was also observed for RNA-seq data (Figure 4i ) as well as array (Figure 4j ) and qPCR (Figure 4k ). Similar results were obtained for other marker genes (data not shown). Additionally, we were able to detect classical M1/M2-markers not accessible using microarrays (Figure 11 ), suggesting that high-resolution RNA-seq data are predestined for exploration of genes not detectable using microarrays, novel marker genes, as well as biological principles of macrophage polarization. - Example 6: RNA-seq ameliorates network-based analysis in M1- and M2-like macrophages. To understand if RNA-seq would also enhance the understanding of biological principles of macrophage polarization we applied network analysis based on a priori information assessing the information content of RNA-seq data in comparison to array data. Genes expressed at elevated levels in M1 RNA-seq data (FC > 4) were used for network generation (
Figure 5a ). This primary RNA-seq based M1 network was subsequently used to visualize array-based gene expression (Figure 5b ). When genes at a lower level of differential expression (FC > 2) were included 73% of the network was revealed in the array data and central hubs of the network were also categorized as being highly (FC > 4) differentially expressed. However, only RNA-seq data revealed two gene clusters of immunomodulating proteins highly enriched in the M1 network, namely apolipoproteins L (APOL) (Figures 5a and12 ) and the leukocyte immunoglobulin-like receptor (LILR) family (Figures 5a and13 ) (Pays E., Vanhollebeke B., Curr Opin Immunol. 21(5):493-498 (2009); Samanovic M. et al., PLoS Pathog. 5(1):e1000276 (2009); Brown D. et al., Tissue Antigens. 64(3):215-225 (2004)). As exemplified for LILRA1 and APOL1 both genes were clearly identified by RNA-seq and qRT-PCR (Figure 5e and f ) but not by microarray analysis (data not shown). Applying the RNA-seq data-based M2 network (Figure 5c ) to the array data (Figure 5d ) revealed only 54% elevated genes and major network hubs were not revealed at all. Taken together, RNA-seq data were clearly enriched for biological a priori information in both M1 and M2 polarization. - Example 7: Identification of splice variants and RNA chimaera in differentially stimulated human macrophages. It has recently been suggested that cell differentiation can result in usage of alternative gene transcripts or isoform switching (Trapnell C. et al., Nature biotechnology 28(5):511-515 (2010)). We applied Cufflinks and Cuffdiff to illuminate switches in dominant promoter usage, transcription start sites (TSS), and coding sequences (CDS) (Trapnell C. et al., Nature biotechnology 28(5):511-515 (2010)). This analysis revealed 9 genes with alternative promoters (Table 4), 28 genes using alternative TSS (Table 5), and 20 genes with different CDS in M1- and M2-like macrophages (Table 6). We analyzed one of these genes in greater detail. For the gene encoding PDZ and LIM domain 7 (enigma) (PDLIM7) we observed a slight but significant increase in M1-like macrophages for the complete locus in RNA-seq data (
Figure 6a ) while the probes on the microarray revealed no significant changes (Figure 6b ). Previous screening projects suggested three different CDS for PDLIM7. Applying Cufflinks and Cuffdiff to M1 and M2 RNA-seq data clearly revealed differential expression of individual CDS (Figure 6c ). While PDLIM7 v1 was mainly expressed by M1-like macrophages, M2-like macrophages mainly expressed PDLIM7 v2, while no difference was observed for PDLIM7 v4. We validated the usage of these variants by version-specific qPCR (Figure 6d ). Taken together, these new findings might open new avenues towards the role of alternative splicing in macrophages potentially linking alternative transcript usage with macrophage polarization. Example 8: New markers for M1- and M2-like macrophages identified by combined transcriptome analysis. In light of the still limited number of cell surface markers clearly distinguishing human M1- from M2-like macrophages, we interrogated the genes of the human surfaceome (da Cunha J.P. et al., Proceedings of the National Academy of Sciences of the United States of America 106(39): 16752-16757 (2009)) for differential expression between M1- and M2-like macrophages. By this approach 475 surface molecules were found to be differentially expressed (Figure 7a ). As visualized inFigure 7b , the cell surface molecules CD120b, TLR2, and SLAMF7 showed preferential expression in M1-like macrophages, which was true irrespective of differentiation of macrophages by GM-CSF or M-CSF (Figure 14a ). Several surface molecules, including CD1a, CD1b, CD93 and CD226 were significantly increased in expression in M2-like macrophages (Figures 7c and14b ). Taken together, screening higher-resolution transcriptome data established by RNA-seq allows for the identification of novel genes related to specific polarization programs in macrophages.Tables Table 1 RNA-Seq M1 M2 reads (x106) percentage (%) reads (x106) percentage (%) Total 15.0 ± 2.8 20.4 ± 9.2 Exons 11.8 ± 2.2 78.4 ± 1.1 16.1 ± 7.4 79.4 ± 2.0 Exon-Intron boundaries 0.4 ± 0.1 2.5 ± 0.1 0.5 ± 0.2 2.4 ± 0.2 Introns 2.1 ± 0.5 14.1 ± 1.0 2.7 ± 1.3 13.2 ± 1.6 Intergenic regions 0.8 ± 0.1 5.0 ± 0.2 1.0 ± 0.5 5.0 ± 0.3 Table 2 qPCR oligonucleotides CD68 Forward 5'-GTCCACCTCGACCTGCTCT-3' CD68 Reverse 5'-CACTGGGGCAGGAGAAACT-3' CD64 Forward 5'-TGGGAAAGCATCGCTACAC-3' CD64 Reverse 5'-GCACTGGAGCTGGAAATAGC-3' CD23 Forward 5'-GGGAGAATCCAAGCAGGAC-3' CD23 Reverse 5'-GGAAGCTCCTCGATCTCTGA-3' LILRA1 Forward 5'-TCGCTGTTTCTACGGTAGCC-3' LILRA1 Reverse 5'-GGGTGGGTTTGATGTAGGC-3' LILRA2 Forward 5'-CAGCCACAATCACTCATCAGA-3' LI LRA2 Reverse 5'-AGGGTGGGTTTGCTGTAGG-3' LILRA3 Forward 5'-GGAGCTCGTGGTCTCAGG-3' LI LRA3 Reverse 5'-CTTGGAGTCGGACTTGTTTTG-3' LILRA5 Forward 5'-GCACCATGGTCTCATCCAT-3' LILRA5 Reverse 5'-GTGGCTTTGGAGAGGTTCC-3' LILRB1 Forward 5'-GGAGCTCGTGGTCTCAGG-3' LILRB1 Reverse 5'-GGGTTTGATGTAGGCTCCTG-3' LILRB3 Forward 5'-GGAGATACCGCTGCCACTAT-3' LILRB3 Reverse 5'-GGTGGGTTTGCTGTAGGC-3' APOL1 Forward 5'-TTCGAATTCCTCGGTATATCTTG-3' APOL1 Reverse 5'-CACCTCCAGTTATGCGTCTG-3' APOL2 Forward 5'-ATGATGAAGCCTGGAATGGA-3' APOL2 Reverse 5'-TCAGAGCTTTACGGAGCTCAT-3' APOL3 Forward 5'-GCCTGGAAGAGATTCGTGAC-3' APOL3 Reverse 5'-CTTCAGAGCTTCGTAGAGAGCA-3' APOL6 Forward 5'-AAGTGAGGCTGGTGTTGGTT-3' APOL6 Reverse 5'-CGTCTTGTAGCTCCACGTCTT-3' GAPDH Forward 5'-AGCCACATCGCTCAGACAC-3' GAPDH Reverse 5'-GCCCAATACGACCAAATCC-3' Table 3 Isoform specific qPCR oligonucleotides PDLIM7 v1 Forward 5'-CCGCAGCAGAATGGACAG-3' PDLIM7 v1 Reverse 5'-GCTCCTGGGGTGTAGATG-3' PDLIM7 v2 Forward 5'-ACCGCAGAAGGTGCAGAC-3' PDLIM7 v2 Reverse 5'-CTGGCTTGATTTCTTCAGGTG-3' PDLIM7 v4 Forward 5'-CCGCAGCAGAATGGACAG-3' PDLIM7 v4 Reverse 5'-GCAGGAGGAACAGAAAGAG-3' GAPDH Forward 5'-AGCCACATCGCTCAGACAC-3' GAPDH Reverse 5'-GCCCAATACGACCAAATCC-3' Table 4 Alternative promoter usage C8orf83 chr8:93895757-93978372 EIF4ENIF1 chr22:31835344-31885874 HRH1 chr3:11178778-11304939 JDP2 chr14:75894508-75939404 NCS1 chr9:132934856-132999583 PDE2A chr11:72287184-72385494 PUS7L chr12:44122409-44152596 SMARCD3 chr7:150936058-150974231 TSC22D1 chr13:45007654-45154568 Table 5 Alternative TSS usage WFS1 chr4:6271576-6304992 ARNT chr1:150768686-150849186 ASRGL1 chr11:62104773-62160887 OSBPL9 chr1:52082546-52344609 GBA chr1:155204238-155214653 HES6 chr2:239146907-239148681 BAT5 chr6:31654725-31671137 DCTN1 chr2:74588280-74621008 RASGRP4 chr19:38893774-38916945 SNX16 chr8:82711817-82754521 NDUFC1 chr4:140211070-140311935 CCDC17 chr1:46085715-46089731 CD200R1 chr3:112641531-112693937 FECH chr18:55212072-55253969 NRGN chr11:124609828-124617102 RB1CC1 chr8:53535017-53627026 UBQLN1 chr9:86274877-86323168 MTERFD3 chr12:107371068-107380929 MBOAT7 chr19:54677105-54693733 RANBP3 chr19:5914192-5978320 RAP1GDS1 chr4:99182526-99365012 TNNT1 chr19:55644160-55660606 ABCC1 chr16:16043433-16236931 CDCA7L chr7:21582832-21985542 HYI chr1:43888796-43919660 C8orf83 chr8:93895757-93978372 CD36 chr7:80231503-80308593 NT5C3 chr7:33053741-33102409 Table 6 Alternative CDS usage ABCC1 chr16:16043433-16236931 CCDC17 chr1:46085715-46089731 CD200R1 chr3:112641531-112693937 CDCA7L chr7:21582832-21985542 FECH chr18:55212072-55253969 HES6 chr2:239146907-239148681 HYI chr1:43888796-43919660 JDP2 chr14:75894508-75939404 MYO1B chr2:192110106-192290115 NCS1 chr9:132934856-132999583 PDLIM7 chr5:176910394-176924602 RANBP3 chr19:5914192-5978320 RAP1GDS1 chr4:99182526-99365012 RASGRP4 chr19:38893774-38916945 RB1CC1 chr8:53535017-53627026 RP6-213H19.1 chrX:131157244-131209971 SLC25A45 chr11:65142662-65150142 SNX16 chr8:82711817-82754521 TNNT1 chr19:55644160-55660606 UBQLN1 chr9:86274877-86323168 Sequence Listing, Free Text SEQ ID NO: Description 1/2 tumor necrosis factor receptor superfamily, member 1B (CD120b) 3/4 toll-like receptor 2 (TLR2) 5/6 SLAM family member 7 (SLAMF7) 7/8 CD1a 9/10 CD1b 11/12 CD93 14/15 CD226 16-50 primer
Claims (15)
- A method for identifying of, distinguishing between and isolating of M1-like and M2-like macrophages which comprises characterizing the macrophages based on the relative abundance of one or more of the specific M1-associated cell surface markers CD120b, TLR2 and SLAMF7, or of one or more of the specific M2-associated cell surface markers CD1a, CD1b, CD93 and CD226, respectively.
- The method of claim 1, wherein the relative abundance of the M1-associated cell surface markers is higher in M1-like macrophages than in M2-like macrophages and the relative abundance of the M2-associated cell surface markers is higher in M2-like macrophages than in M1-like macrophages, preferably the abundance of the cell surface marker in the respective M1-like or M2-like macrophage is at least 30%, more preferably at least 50 % and most preferably at least 70 % higher than in the other macrophage type.
- The method of claim 1 or 2, wherein the identifying of and distinguishing between the M1-like and M2-like macrophages is performed by an amplification or by a targeted resequencing of one or more of the specific M1-associated cell surface marker nucleic acids CD120b, TLR2 and SLAMF7 (SEQ ID NOs: 1, 3 and 5), or of one or more of the specific M2-associated cell surface marker nucleic acids CD1a, CD1b, CD93 and CD226 (SEQ ID NOs: 7, 9, 11 and 13), respectively, of the macrophage, and a subsequent detection of the amplification/resequencing product.
- The method of claim 3, wherein the amplification/resequencing employs one or more primers derived from each of the marker genes, preferably said primers have at least 12, preferably at least 15, most preferably at least 19 contiguous nucleotides of the respective marker nucleic acid sequence.
- The method of claim 1 or 2, wherein the identifying of and distinguishing between the M1-like and M2-like macrophages comprises hybridizing one or more probes selective for one of the specific M1-associated cell surface marker nucleic acids CD120b, TLR2 and SLAMF7 (SEQ ID NOs: 1, 3 and 5), or for one of the specific M2-associated cell surface marker nucleic acids CD1a, CD1b, CD93 and CD226 (SEQ ID NOs: 7, 9, 11 and 13), respectively, of the macrophage.
- The method of claim 5, which is performed on a hybridization array.
- The method of claim 1 or 2, wherein the identifying of, distinguishing between and isolating of the M1-like and M2-like macrophages comprises contacting the macrophages with one or more binding molecules directed against the specific M1-associated cell surface marker protein CD120b, TLR2 and SLAMF7 (SEQ ID NOs: 2, 4 and 6), or with one or more binding molecules directed the specific M2-associated cell surface marker nucleic acids CD1a, CD1b, CD93 and CD226 (SEQ ID NOs: 8, 10, 12 and 14), respectively.
- The method of claim 7, wherein the binding molecules(i) are antibodies, preferably monoclonal antibodies; and/or(ii) are labeled with maker molecules, preferably fluorescence markers.
- The method of claim 8, wherein the binding molecules are selected from FITC-labeled CD1b, CD93, CD226 and anti-TLR2; PE-labeled CD120b and anti-SLAMF7; PE-Cy5-labeled CD1a monoclonal antibodies.
- The method according to one or more of claims 7 to 9, which is performed on a FACS sorter.
- A kit for performing the method according to any one of claims 1 to 10, which comprises at least one reagent for identifying of, distinguishing between and isolating of M1-like macrophages and at least one reagent for identifying of, distinguishing between and isolating of M2-like macrophages, said reagents being selected from(i) one or more primers derived from the marker genes as defined in claim 4,(ii) one or more probes selective for the cell surface marker nucleic acids as defined in claim 5,(iii) a hybridization array as defined in claim 6, or(iv) one or more binding molecule as defined in claims 7 to 9.
- The use of antibodies selected from CD120b, TLR2 and SLAMF7 antibodies for identifying, characterizing and isolating M1-like macrophages.
- The use of antibodies selected from CD1a, CD1b, CD93 and CD226 antibodies for identifying, characterizing and isolating M2-like macrophages.
- A population of M1-like macrophages isolated by the method of claims 7 to 10.
- A population of M2-like macrophages isolated by the method of claims 7 to 10.
Priority Applications (5)
| Application Number | Priority Date | Filing Date | Title |
|---|---|---|---|
| EP12159479.0A EP2639313A1 (en) | 2012-03-14 | 2012-03-14 | High-resolution transcriptome of human macrophages |
| EP13709109.6A EP2825664B1 (en) | 2012-03-14 | 2013-03-13 | High-resolution transcriptome of human macrophages |
| PCT/EP2013/055159 WO2013135775A1 (en) | 2012-03-14 | 2013-03-13 | High-resolution transcriptome of human macrophages |
| US14/385,180 US20150057161A1 (en) | 2012-03-14 | 2013-03-13 | High-resolution transcriptome of human macrophages |
| ES13709109T ES2745695T3 (en) | 2012-03-14 | 2013-03-13 | High resolution transcriptome of human macrophages |
Applications Claiming Priority (1)
| Application Number | Priority Date | Filing Date | Title |
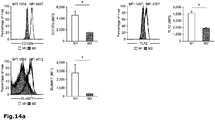
|---|---|---|---|
| EP12159479.0A EP2639313A1 (en) | 2012-03-14 | 2012-03-14 | High-resolution transcriptome of human macrophages |
Publications (1)
| Publication Number | Publication Date |
|---|---|
| EP2639313A1 true EP2639313A1 (en) | 2013-09-18 |
Family
ID=47878044
Family Applications (2)
| Application Number | Title | Priority Date | Filing Date |
|---|---|---|---|
| EP12159479.0A Withdrawn EP2639313A1 (en) | 2012-03-14 | 2012-03-14 | High-resolution transcriptome of human macrophages |
| EP13709109.6A Active EP2825664B1 (en) | 2012-03-14 | 2013-03-13 | High-resolution transcriptome of human macrophages |
Family Applications After (1)
| Application Number | Title | Priority Date | Filing Date |
|---|---|---|---|
| EP13709109.6A Active EP2825664B1 (en) | 2012-03-14 | 2013-03-13 | High-resolution transcriptome of human macrophages |
Country Status (4)
| Country | Link |
|---|---|
| US (1) | US20150057161A1 (en) |
| EP (2) | EP2639313A1 (en) |
| ES (1) | ES2745695T3 (en) |
| WO (1) | WO2013135775A1 (en) |
Cited By (1)
| Publication number | Priority date | Publication date | Assignee | Title |
|---|---|---|---|---|
| WO2015081253A1 (en) * | 2013-11-26 | 2015-06-04 | Biomet Biologics, Llc | Methods of mediating macrophage phenotypes |
Families Citing this family (10)
| Publication number | Priority date | Publication date | Assignee | Title |
|---|---|---|---|---|
| US20170151281A1 (en) | 2015-02-19 | 2017-06-01 | Batu Biologics, Inc. | Chimeric antigen receptor dendritic cell (car-dc) for treatment of cancer |
| US10209212B2 (en) * | 2016-02-15 | 2019-02-19 | Infineon Technologies Ag | Sensor arrangement for particle analysis and a method for particle analysis |
| WO2020097193A1 (en) | 2018-11-06 | 2020-05-14 | The Regents Of The University Of California | Chimeric antigen receptors for phagocytosis |
| US11026973B2 (en) | 2019-04-30 | 2021-06-08 | Myeloid Therapeutics, Inc. | Engineered phagocytic receptor compositions and methods of use thereof |
| CN114981409A (en) | 2019-09-03 | 2022-08-30 | 美洛德生物医药公司 | Methods and compositions for genomic integration |
| US10980836B1 (en) | 2019-12-11 | 2021-04-20 | Myeloid Therapeutics, Inc. | Therapeutic cell compositions and methods of manufacturing and use thereof |
| EP4240367A4 (en) | 2020-11-04 | 2024-10-16 | Myeloid Therapeutics, Inc. | MANIPULATED CHIMERIC FUSION PROTEIN COMPOSITIONS AND METHODS OF USE THEREOF |
| WO2022197949A2 (en) | 2021-03-17 | 2022-09-22 | Myeloid Therapeutics, Inc. | Engineered chimeric fusion protein compositions and methods of use thereof |
| BR112023023642A2 (en) | 2021-05-11 | 2024-01-30 | Myeloid Therapeutics Inc | METHODS AND COMPOSITIONS FOR GENOMIC INTEGRATION |
| GB202314087D0 (en) | 2023-09-14 | 2023-11-01 | Macomics Ltd | Biomarker for cancer |
Citations (1)
| Publication number | Priority date | Publication date | Assignee | Title |
|---|---|---|---|---|
| WO2011106521A1 (en) * | 2010-02-25 | 2011-09-01 | Abt Holding Company | Modulation of macrophage activation |
-
2012
- 2012-03-14 EP EP12159479.0A patent/EP2639313A1/en not_active Withdrawn
-
2013
- 2013-03-13 EP EP13709109.6A patent/EP2825664B1/en active Active
- 2013-03-13 WO PCT/EP2013/055159 patent/WO2013135775A1/en not_active Ceased
- 2013-03-13 US US14/385,180 patent/US20150057161A1/en not_active Abandoned
- 2013-03-13 ES ES13709109T patent/ES2745695T3/en active Active
Patent Citations (1)
| Publication number | Priority date | Publication date | Assignee | Title |
|---|---|---|---|---|
| WO2011106521A1 (en) * | 2010-02-25 | 2011-09-01 | Abt Holding Company | Modulation of macrophage activation |
Non-Patent Citations (60)
| Title |
|---|
| ASHOKKUMAR C. ET AL., AM J PATHOL., vol. 179, no. 4, 2011, pages 1929 - 1938 |
| BISWAS S.K.; MANTOVANI A., NAT IMMUNOL., vol. 11, no. 10, 2010, pages 889 - 896 |
| BOLES K.S. ET AL., IMMUNOL REV., vol. 181, 2001, pages 234 - 249 |
| BROWN D. ET AL., TISSUE ANTIGENS., vol. 64, no. 3, 2004, pages 215 - 225 |
| CAMARATA T. ET AL., DEVELOPMENTAL BIOLOGY, vol. 337, no. 2, 2010, pages 233 - 245 |
| DA CUNHA J.P. ET AL., PROCEEDINGS OF THE NATIONAL ACADEMY OF SCIENCES OF THE UNITED STATES OF AMERICA, vol. 106, no. 39, 2009, pages 16752 - 16757 |
| FAUSTMAN D.; DAVIS M., NAT REV DRUG DISCOV., vol. 9, no. 6, 2010, pages 482 - 493 |
| GEISSMANN F. ET AL., SCIENCE, vol. 327, no. 5966, 2010, pages 656 - 661 |
| GREENLEE-WACKER M.C. ET AL., CURR DRUG TARGETS., 2011 |
| GUSTAFSSON C. ET AL., PLOS ONE., vol. 3, no. 4, 2008, pages E2078 |
| GUSTAFSSON C; MJOSBERG J; MATUSSEK A. ET AL., PLOS ONE., vol. 3, no. 4, 2008, pages E2078 |
| HAMILTON J.A., NAT REV IMMUNOL., vol. 8, no. 7, 2008, pages 533 - 544 |
| HENG T.S. ET AL., NAT IMMUNOL., vol. 9, no. 10, 2008, pages 1091 - 1094 |
| JEON J.W. ET AL., J IMMUNOL., vol. 185, no. 8, 2010, pages 4921 - 4927 |
| JUNG C.R. ET AL., THE JOURNAL OF CLINICAL INVESTIGATION, vol. 120, no. 12, 2010, pages 4493 - 4506 |
| KAPRANOV P. ET AL., NATURE REVIEWS GENETICS, vol. 8, no. 6, 2007, pages 413 - 423 |
| KASINRERK W. ET AL., J IMMUNOL., vol. 150, no. 2, 1993, pages 579 - 584 |
| KIM J.R. ET AL., CLIN EXP IMMUNOL., vol. 160, no. 3, 2010, pages 348 - 358 |
| LAWRENCE T.; NATOLI G., NAT REV IMMUNOL., vol. 11, no. 11, 2011, pages 750 - 761 |
| LAWRENCE TOBY ET AL: "Transcriptional regulation of macrophage polarization: enabling diversity with identity", NATURE REVIEWS IMMUNOLOGY, vol. 11, no. 11, November 2011 (2011-11-01), pages 750 - 761 URL, XP009160964 * |
| LEHTONEN A. ET AL., J LEUKOC BIOL., vol. 82, no. 3, 2007, pages 710 - 720 |
| MANTOVANI A ET AL: "Macrophages, innate immunity and cancer: balance, tolerance, and diversity", CURRENT OPINION IN IMMUNOLOGY, ELSEVIER, OXFORD, GB, vol. 22, no. 2, 1 April 2010 (2010-04-01), pages 231 - 237, XP027020479, ISSN: 0952-7915, [retrieved on 20100209] * |
| MANTOVANI A. ET AL., IMMUNITY, vol. 23, no. 4, 2005, pages 344 - 346 |
| MANTOVANI A. ET AL., TRENDS IMMUNOL., vol. 23, no. 11, 2002, pages 549 - 555 |
| MANTOVANI A.; SICA A., CURR OPIN IMMUNOL., vol. 22, no. 2, 2010, pages 231 - 237 |
| MARIONI J.C. ET AL., GENOME RES., vol. 18, no. 9, 2008, pages 1509 - 1517 |
| MARTINEZ F.O. ET AL., THE JOURNAL OF IMMUNOLOGY, vol. 177, no. 10, 2006, pages 7303 - 7311 |
| MARTINEZ FERNANDO O ET AL: "Transcriptional profiling of the human monocyte-to-macrophage differentiation and polarization: New molecules and patterns of gene expression", JOURNAL OF IMMUNOLOGY, AMERICAN ASSOCIATION OF IMMUNOLOGISTS, US, vol. 177, no. 10, 15 November 2006 (2006-11-15), pages 7303 - 7311, XP009160929, ISSN: 0022-1767 * |
| MATAS D. ET AL., CELL DEATH AND DIFFERENTIATION, vol. 11, no. 4, 2004, pages 458 - 467 |
| MCGREAL E.P. ET AL., J IMMUNOL., vol. 168, no. 10, 2002, pages 5222 - 5232 |
| MORTAZAVI A. ET AL., NATURE METHODS, vol. 5, no. 7, 2008, pages 621 - 628 |
| MORTAZAVI A. ET AL., NATURE METHODS., vol. 5, no. 7, 2008, pages 621 - 628 |
| MOSSER D.M.; EDWARDS J.P, NAT REV IMMUNOL., vol. 8, no. 12, 2008, pages 958 - 969 |
| MOSSER D.M.; EDWARDS J.P., NAT REV IMMUNOL., vol. 8, no. 12, 2008, pages 958 - 969 |
| MURPHY J.J. ET AL., BIOCHEM J., vol. 361, 2002, pages 431 - 436 |
| MURRAY P.J.; WYNN T.A., NAT REV IMMUNOL., vol. 11, no. 11, 2011, pages 723 - 737 |
| MURRAY P.J.; WYNN T.A., NATURE REVIEWS IMMUNOLOGY, vol. 11, no. 11, 2011, pages 723 - 737 |
| MURRAY PETER J ET AL: "Obstacles and opportunities for understanding macrophage polarization", JOURNAL OF LEUKOCYTE BIOLOGY, vol. 89, no. 4, April 2011 (2011-04-01), pages 557 - 563, XP009160896, ISSN: 0741-5400 * |
| NAKAGAWA N. ET AL., BIOCHEMICAL AND BIOPHYSICAL RESEARCH COMMUNICATIONS, vol. 272, no. 2, 2000, pages 505 - 512 |
| NAU G.J. ET AL., PROC NATL ACAD SCI U S A, vol. 99, no. 3, 2002, pages 1503 - 1508 |
| NEPOMUCENO R.R. ET AL., J IMMUNOL., vol. 162, no. 6, 1999, pages 3583 - 3589 |
| OZSOLAK F.; MILOS P.M., NATURE REVIEWS GENETICS, vol. 12, no. 2, 2011, pages 87 - 98 |
| OZSOLAK FATIH ET AL: "Transcriptome profiling using single-molecule direct RNA sequencing.", METHODS IN MOLECULAR BIOLOGY (CLIFTON, N.J.) 2011 LNKD- PUBMED:21431762, vol. 733, 2011, pages 51 - 61, XP009160895, ISSN: 1940-6029 * |
| PAQUETTE J.; TOKUYASU T., BIOINFORMATICS, vol. 26, no. 2, 2010, pages 285 - 286 |
| PAYS E.; VANHOLLEBEKE B., CURR OPIN IMMUNOL., vol. 21, no. 5, 2009, pages 493 - 498 |
| POPOV A. ET AL., THE JOURNAL OF CLINICAL INVESTIGATION., vol. 116, no. 12, 2006, pages 3160 - 3170 |
| PORCELLI S.A.; MODLIN R.L., ANNU REV IMMUNOL., vol. 17, 1999, pages 297 - 329 |
| RAMSKOLD D. ET AL., PLOS COMPUTATIONAL BIOLOGY, vol. 5, no. 12, 2009, pages E1000598 |
| RAMSKOLD D. ET AL., PLOS COMPUTATIONAL BIOLOGY, vol. 5, no. 12, 2009, pages EL000598 |
| REYMOND N. ET AL., J EXP MED., vol. 199, no. 10, 2004, pages 1331 - 1341 |
| SAMANOVIC M. ET AL., PLOS PATHOG, vol. 5, no. 1, 2009, pages 1000276 |
| SAMANOVIC M. ET AL., PLOS PATHOG., vol. 5, no. 1, 2009, pages E1000276 |
| SHIBUYA A. ET AL., IMMUNITY, vol. 4, no. 6, 1996, pages 573 - 581 |
| SICA A ET AL: "Macrophage polarization in tumour progression", SEMINARS IN CANCER BIOLOGY, SAUNDERS SCIENTIFIC PUBLICATIONS, PHILADELPHIA, PA, US, vol. 18, no. 5, 1 October 2008 (2008-10-01), pages 349 - 355, XP023519773, ISSN: 1044-579X, [retrieved on 20080326], DOI: 10.1016/J.SEMCANCER.2008.03.004 * |
| SINHA S. ET AL., PLOS ONE., vol. 6, no. 7, 2011, pages E21868 |
| TRAPNELL C. ET AL., NATURE BIOTECHNOLOGY, vol. 28, no. 5, 2010, pages 511 - 515 |
| WANG YAO-CHUN ET AL: "Notch Signaling Determines the M1 versus M2 Polarization of Macrophages in Antitumor Immune Responses", CANCER RESEARCH, vol. 70, no. 12, June 2010 (2010-06-01), pages 4840 - 4849, XP009160889, ISSN: 0008-5472 * |
| WANG Z. ET AL., NATURE REVIEWS GENETICS, vol. 10, no. 1, 2009, pages 57 - 63 |
| WANG Z; GERSTEIN M; SNYDER M., NATURE REVIEWS GENETICS, vol. 10, no. 1, 2009, pages 57 - 63 |
| WIRNSBERGER G. ET AL., EUR J IMMUNOL., vol. 36, no. 7, 2006, pages 1882 - 1891 |
Cited By (4)
| Publication number | Priority date | Publication date | Assignee | Title |
|---|---|---|---|---|
| WO2015081253A1 (en) * | 2013-11-26 | 2015-06-04 | Biomet Biologics, Llc | Methods of mediating macrophage phenotypes |
| US9833474B2 (en) | 2013-11-26 | 2017-12-05 | Biomet Biologies, LLC | Methods of mediating macrophage phenotypes |
| US10946043B2 (en) | 2013-11-26 | 2021-03-16 | Biomet Biologics, Llc | Methods of mediating macrophage phenotypes |
| US12378524B2 (en) | 2013-11-26 | 2025-08-05 | Biomet Manufacturing, Llc | Methods of mediating macrophage phenotypes |
Also Published As
| Publication number | Publication date |
|---|---|
| WO2013135775A1 (en) | 2013-09-19 |
| US20150057161A1 (en) | 2015-02-26 |
| EP2825664B1 (en) | 2019-05-15 |
| ES2745695T3 (en) | 2020-03-03 |
| EP2825664A1 (en) | 2015-01-21 |
Similar Documents
| Publication | Publication Date | Title |
|---|---|---|
| EP2825664B1 (en) | High-resolution transcriptome of human macrophages | |
| Beyer et al. | High-resolution transcriptome of human macrophages | |
| Garner et al. | Single-cell analysis of human MAIT cell transcriptional, functional and clonal diversity | |
| Milner et al. | Heterogenous populations of tissue-resident CD8+ T cells are generated in response to infection and malignancy | |
| Christ et al. | Western diet triggers NLRP3-dependent innate immune reprogramming | |
| Corridoni et al. | Inflammatory bowel disease through the lens of single-cell RNA-seq technologies | |
| Engel et al. | Innate-like functions of natural killer T cell subsets result from highly divergent gene programs | |
| Rodríguez-Ubreva et al. | Single-cell Atlas of common variable immunodeficiency shows germinal center-associated epigenetic dysregulation in B-cell responses | |
| Gandoura et al. | Gene-and exon-expression profiling reveals an extensive LPS-induced response in immune cells in patients with cirrhosis | |
| Funk et al. | Aged intestinal stem cells propagate cell-intrinsic sources of inflammaging in mice | |
| Taylor et al. | Single cell transcriptomics of Atlantic salmon (Salmo salar L.) liver reveals cellular heterogeneity and immunological responses to challenge by Aeromonas salmonicida | |
| Despins et al. | Modulation of the host cell transcriptome and epigenome by Fusobacterium nucleatum | |
| Imran et al. | Epigenetic programming underpins B‐cell dysfunction in peanut and multi‐food allergy | |
| Liu et al. | Regulation of T helper cell differentiation by the interplay between histone modification and chromatin interaction | |
| Rashmi et al. | Multiplexed droplet single-cell sequencing (Mux-Seq) of normal and transplant kidney | |
| Rigamonti et al. | Distinct responses of newly identified monocyte subsets to advanced gastrointestinal cancer and COVID-19 | |
| Bento et al. | Bone marrow monocytes and derived dendritic cells from myelodysplastic patients have functional abnormalities associated with defective response to bacterial infection | |
| Perik-Zavodskaia et al. | Multi-omic analysis identifies erythroid cells as the major population in mouse placentas expressing genes for antigen presentation in MHC class II, chemokines, and antibacterial immune response | |
| Ramírez-Sánchez et al. | Gene expression and eQTL analysis reflect the heterogeneity in the inflammatory status of the duodenal epithelial lining in coeliac disease | |
| Hou et al. | Multiplexed analysis of gene expression and chromatin accessibility of human umbilical cord blood using scRNA-Seq and scATAC-Seq | |
| Auer et al. | Trajectories from single-cells to PAX5-driven leukemia reveal PAX5-MYC interplay in vivo: ACUTE LYMPHOBLASTIC LEUKEMIA | |
| Jayasinghe et al. | Single cell resolution analysis of multi-tissue derived human iNKT cells reveals novel transcriptional paradigms | |
| Iperi et al. | Interferon-α–Driven Stratification of B Cell Reveals Metabolic Reprogramming of Double Negative, Naive and Transitional cell subsets and Refines Molecular Classification in Sjögren’s Disease | |
| Zou et al. | Landscape of T cells in tuberculous pleural effusion | |
| Zheng et al. | Single cell transcriptome analysis of decidua macrophages in normal and recurrent spontaneous abortion patients |
Legal Events
| Date | Code | Title | Description |
|---|---|---|---|
| PUAI | Public reference made under article 153(3) epc to a published international application that has entered the european phase |
Free format text: ORIGINAL CODE: 0009012 |
|
| AK | Designated contracting states |
Kind code of ref document: A1 Designated state(s): AL AT BE BG CH CY CZ DE DK EE ES FI FR GB GR HR HU IE IS IT LI LT LU LV MC MK MT NL NO PL PT RO RS SE SI SK SM TR |
|
| AX | Request for extension of the european patent |
Extension state: BA ME |
|
| STAA | Information on the status of an ep patent application or granted ep patent |
Free format text: STATUS: THE APPLICATION IS DEEMED TO BE WITHDRAWN |
|
| 18D | Application deemed to be withdrawn |
Effective date: 20140319 |