EP2628023B1 - Seismic data filtering based on vibrator-coupled ground model - Google Patents
Seismic data filtering based on vibrator-coupled ground model Download PDFInfo
- Publication number
- EP2628023B1 EP2628023B1 EP11833508.2A EP11833508A EP2628023B1 EP 2628023 B1 EP2628023 B1 EP 2628023B1 EP 11833508 A EP11833508 A EP 11833508A EP 2628023 B1 EP2628023 B1 EP 2628023B1
- Authority
- EP
- European Patent Office
- Prior art keywords
- ground
- source
- baseplate
- vibrator
- seismic
- Prior art date
- Legal status (The legal status is an assumption and is not a legal conclusion. Google has not performed a legal analysis and makes no representation as to the accuracy of the status listed.)
- Active
Links
- 238000001914 filtration Methods 0.000 title claims description 9
- 230000001133 acceleration Effects 0.000 claims description 63
- 238000006243 chemical reaction Methods 0.000 claims description 46
- 230000004044 response Effects 0.000 claims description 36
- 230000008878 coupling Effects 0.000 claims description 26
- 238000010168 coupling process Methods 0.000 claims description 26
- 238000005859 coupling reaction Methods 0.000 claims description 26
- 230000006870 function Effects 0.000 claims description 26
- 238000000034 method Methods 0.000 claims description 26
- 238000012545 processing Methods 0.000 claims description 25
- 238000012546 transfer Methods 0.000 claims description 20
- 238000003672 processing method Methods 0.000 claims description 3
- 238000001228 spectrum Methods 0.000 description 18
- 230000033001 locomotion Effects 0.000 description 10
- 230000000694 effects Effects 0.000 description 7
- 230000008569 process Effects 0.000 description 7
- 238000004458 analytical method Methods 0.000 description 6
- 238000004891 communication Methods 0.000 description 5
- 238000003384 imaging method Methods 0.000 description 5
- 238000005259 measurement Methods 0.000 description 5
- 239000011435 rock Substances 0.000 description 5
- 241000272165 Charadriidae Species 0.000 description 4
- 230000010365 information processing Effects 0.000 description 4
- 239000002245 particle Substances 0.000 description 4
- 238000012360 testing method Methods 0.000 description 4
- 230000015572 biosynthetic process Effects 0.000 description 3
- 230000006835 compression Effects 0.000 description 3
- 238000007906 compression Methods 0.000 description 3
- 238000005314 correlation function Methods 0.000 description 3
- 238000005755 formation reaction Methods 0.000 description 3
- 230000008901 benefit Effects 0.000 description 2
- 230000000875 corresponding effect Effects 0.000 description 2
- 238000005516 engineering process Methods 0.000 description 2
- 239000012530 fluid Substances 0.000 description 2
- 230000003993 interaction Effects 0.000 description 2
- 244000025254 Cannabis sativa Species 0.000 description 1
- 239000004215 Carbon black (E152) Substances 0.000 description 1
- 239000006096 absorbing agent Substances 0.000 description 1
- 230000004913 activation Effects 0.000 description 1
- 230000004075 alteration Effects 0.000 description 1
- 238000005452 bending Methods 0.000 description 1
- 230000005540 biological transmission Effects 0.000 description 1
- 230000008859 change Effects 0.000 description 1
- 238000004590 computer program Methods 0.000 description 1
- 230000002596 correlated effect Effects 0.000 description 1
- 230000007423 decrease Effects 0.000 description 1
- 238000009795 derivation Methods 0.000 description 1
- 238000010586 diagram Methods 0.000 description 1
- 238000004880 explosion Methods 0.000 description 1
- 229930195733 hydrocarbon Natural products 0.000 description 1
- 150000002430 hydrocarbons Chemical class 0.000 description 1
- 238000012986 modification Methods 0.000 description 1
- 230000004048 modification Effects 0.000 description 1
- 238000012544 monitoring process Methods 0.000 description 1
- 230000003287 optical effect Effects 0.000 description 1
- 239000004576 sand Substances 0.000 description 1
- 230000035939 shock Effects 0.000 description 1
Images


Classifications
-
- G—PHYSICS
- G01—MEASURING; TESTING
- G01V—GEOPHYSICS; GRAVITATIONAL MEASUREMENTS; DETECTING MASSES OR OBJECTS; TAGS
- G01V1/00—Seismology; Seismic or acoustic prospecting or detecting
- G01V1/28—Processing seismic data, e.g. analysis, for interpretation, for correction
- G01V1/36—Effecting static or dynamic corrections on records, e.g. correcting spread; Correlating seismic signals; Eliminating effects of unwanted energy
- G01V1/37—Effecting static or dynamic corrections on records, e.g. correcting spread; Correlating seismic signals; Eliminating effects of unwanted energy specially adapted for seismic systems using continuous agitation of the ground, e.g. using pulse compression of frequency swept signals for enhancement of received signals
-
- G—PHYSICS
- G01—MEASURING; TESTING
- G01V—GEOPHYSICS; GRAVITATIONAL MEASUREMENTS; DETECTING MASSES OR OBJECTS; TAGS
- G01V1/00—Seismology; Seismic or acoustic prospecting or detecting
- G01V1/02—Generating seismic energy
- G01V1/04—Details
- G01V1/047—Arrangements for coupling the generator to the ground
- G01V1/0475—Arrangements for coupling the generator to the ground for controlling "Ground Force"
-
- G—PHYSICS
- G01—MEASURING; TESTING
- G01V—GEOPHYSICS; GRAVITATIONAL MEASUREMENTS; DETECTING MASSES OR OBJECTS; TAGS
- G01V1/00—Seismology; Seismic or acoustic prospecting or detecting
- G01V1/28—Processing seismic data, e.g. analysis, for interpretation, for correction
- G01V1/282—Application of seismic models, synthetic seismograms
-
- G—PHYSICS
- G01—MEASURING; TESTING
- G01V—GEOPHYSICS; GRAVITATIONAL MEASUREMENTS; DETECTING MASSES OR OBJECTS; TAGS
- G01V1/00—Seismology; Seismic or acoustic prospecting or detecting
- G01V1/28—Processing seismic data, e.g. analysis, for interpretation, for correction
-
- G—PHYSICS
- G01—MEASURING; TESTING
- G01V—GEOPHYSICS; GRAVITATIONAL MEASUREMENTS; DETECTING MASSES OR OBJECTS; TAGS
- G01V1/00—Seismology; Seismic or acoustic prospecting or detecting
- G01V1/28—Processing seismic data, e.g. analysis, for interpretation, for correction
- G01V1/36—Effecting static or dynamic corrections on records, e.g. correcting spread; Correlating seismic signals; Eliminating effects of unwanted energy
- G01V1/364—Seismic filtering
Definitions
- seismic exploration The oil and gas exploration industry employ geophysical tools and techniques to identify a subterranean structure having potential hydrocarbon deposits.
- these techniques and tools generate an image of subsurface structures by recording energy in the form of vibrations reflected or refracted from geologic formations.
- seismic exploration for example, seismic waves generated by a source and imparted into the ground reflect off rocks in the subsurface. Boundaries between different rocks often reflect seismic waves, and information relating to these waves is collected and processed to generate a representation or images of the subsurface.
- a two-dimensional image which is called a seismic line, is essentially a cross-sectional view of the earth oriented parallel to the line of geophones.
- the information may also be collected as an intersecting grid of seismic lines referred to as a 3-D seismic volume.
- Any number of exploration systems can gather the desired information for processing.
- Dynamite explosions, vibrator trucks, air guns or the like can create the seismic waves.
- Sensors such as velocity geophones, accelerometers, and/or hydrophones can be laid out in lines, or towed in the case of hydrophones, to measure how long it takes the waves to leave the seismic source, reflect off a rock boundary, and return to the sensors used.
- An example seismic system 10 in Figure 1 can generate geophysical information to image earth subsurface structures.
- the system 10 has a central controller/recorder 90 in communication with a seismic acquisition array 12 known as a spread.
- the array 12 has spaced sensor stations 20, which can each have one or more sensors 22.
- the sensors 22 measure geophysical information and can include 3-component sensors for obtaining 3-dimensional energy known as 3D seismic.
- the sensors 22 can include accelerometers, velocity geophones, microphones, or the like, and the array 12 can be deployed on land or a seabed location.
- a seismic source 30 imparts acoustic energy into the ground, and the sensors 22 receive energy after reflection and refraction at boundaries in subsurface structures.
- the array 12 then communicates sensor data with the central controller or recorder 90 using wireless technology or other communication technique.
- the seismic source 30 can be a vibrator, such as shown in Figure 2 , although other types of sources can be used.
- the vibrator 30 transmits force to the ground using a baseplate 70 and a reaction mass 50.
- the vibrator 30 is mounted on a carrier vehicle (not shown) that uses bars 32/34 to lower the vibrator 30 to the ground. With the vibrator 30 lowered, the weight of the vehicle holds the baseplate 70 engaged with the ground so seismic source signals can be transmitted into the earth.
- the reaction mass 50 positions directly above baseplate 70 and stilts 52 extend from the baseplate 70 and through the mass 50 to stabilize it. Internally, the reaction mass 50 has a cylinder 56 formed therein. A vertically extending piston 60 extends through this cylinder 56, and a head 62 on the piston 60 divides the cylinder 56 into chambers. The ends of the piston 60 connect to cross-pieces 54U-L that connect to the stilts 52.
- Feet 36 with isolators 40 isolate the baseplate 70 from the bars 34, and tension members 42 interconnect between the feet 36 and the baseplate 70.
- the tension members 42 hold the baseplate 70 when the vibrator 30 is raised and lowered to the ground.
- shock absorbers 44 are also mounted between the bottom of the feet 36 and the baseplate 70 to isolate vibrations therebetween.
- a controller 80 receives signals from a first sensor 85 that measures acceleration of the baseplate 70 and receives signals from a second sensor 87 that measure acceleration of the reaction mass 50. Based on feedback from these sensors 85/87 and a desired sweep signal for operating the vibrator 30, the controller 80 generates a pilot signal to control a servo valve assembly 82. Driven by the drive signal, the servo valve assembly 82 alternatingly routes hydraulic fluid between a hydraulic fluid supply 84 and the piston 60. The reaction mass 50 reciprocally vibrates on the piston 60. In turn, the force generated by the vibrating mass 50 transfers to the baseplate 70 via the stilts 52 and the piston 60 so that the baseplate 70 vibrates at a desired amplitude and frequency or sweep to generate a seismic source signal into the ground.
- the moving reaction mass 50 acts upon the baseplate 70 to impart a seismic source signal into the earth, the signal travels through the ground, reflects at discontinuities and formations, and then travels toward the earth's surface.
- the array 12 of Figure 1 having the geophone receivers or other sensors 22 coupled to the ground detect the reflected signals, and the recorder 90 of Figure 1 records the seismic data 92 received from the geophone receivers 22.
- a data processing system 98 receives the seismic data 92 from the seismic recorder 90.
- the seismic data 92 can also include recorded data from the seismic vibrator 30 if information such as pilot signal, acceleration data, and weighted sum ground force are stored separately.
- the data processing system 98 can use a correlation processor to correlate the computed ground force supplied by the vibrator 30 to the seismic data 92 received by the geophone receivers 22.
- the correlated information can be used to create an image or representation of the earth's subsurface structures.
- a local sensor 85 e.g., accelerometer or geophone
- the upper cross piece 54U of the vibrator 50 which positions above the reaction mass 50.
- the controller 80 shown in Figure 2 measures the signal imparted into the ground using the local sensor 85 located on the upper cross-piece 54U and using the sensor 87 located on the reaction mass 50.
- the data processing system 98 of Figure 1 receives the seismic data 92 making up the seismic spread, it also receives the acceleration signals from these sensors 85/87 on the source 30.
- the system 98's correlation processor uses various algorithms to distinguish wave signal data from distortions and other spurious signals.
- a problem with this method is that original source signal distortion may vary and make correlation difficult.
- the results may be corrupted by unrealistic assumptions used in modeling the system 10.
- the vibrator 30 works on the surface of the ground, which can vary dramatically from location to location due to the presence of sand, rock, vegetation, etc.
- the baseplate 70 is often not evenly supported when deployed against the ground at a given location.
- the baseplate 70 will flex and directly affect the control system during operation. As a result, the radiated energy produced can vary from location to location depending on where the vibrator 30 is deployed.
- the vibrator's source signature is not the same (or nearly the same) from location to location and is not characteristically repeatable, which is desirable when performing seismic analysis.
- a more accurate knowledge of the source signal imparted into the ground by the source 30 can make the correlation easier at the data processing stage.
- the subject matter of the present disclosure is directed to overcoming, or at least reducing the effects of, one or more of the problems set forth above.
- a vibrator-coupled ground filter improves seismic data recorded during a seismic operation.
- This filter is based on a ground model that takes into consideration the vibrator system, the coupling system between the baseplate and captured ground, and the coupled ground system.
- the ground model can be used to derive particular variables for the ground model to help characterize the system.
- the recorded seismic data can be corrected to remove errors in the trace data produced by typical assumptions.
- a seismic data processing apparatus as claimed in claim 14.
- An example seismic system 10 in Figure 3 can generate geophysical information to image earth subsurface structures.
- the system 10 has a central controller/recorder 90 in communication with a seismic acquisition array 12 known as a spread.
- the array 12 has spaced sensor stations 20, which can each have one or more sensors 22.
- the sensors 22 measure geophysical information and can include 3-component sensors for obtaining 3-dimensional energy known as 3D seismic.
- the sensors 22 can include accelerometers, velocity geophones, microphones, or the like, and the array 12 can be deployed on land or a seabed location.
- a seismic source 30 imparts acoustic energy into the ground, and the sensors 22 receive energy after reflection and refraction at boundaries in earth subsurface structures.
- the seismic source 30 can be similar to the vibrator disclosed previously with reference to Figures 2 .
- the seismic source 30 according to the present disclosure need not necessarily be a hydraulically operated vibrator.
- the seismic source 30 can be a seismic vibrator have an electric motor, can have an internal or external drive, and can generate seismic shear waves (S-waves) or seismic compression waves (P-waves).
- the vibrator 30 can be any type of vibrator having a controller 80 and having a reaction mass 50 and a baseplate 70 for imparting energy into the ground.
- the moving reaction mass 50 acts upon the baseplate 70 of the vibrator 30 to impart seismic source signals into the ground.
- the signals travel through the ground, reflect at discontinuities and formations, and then travel toward the earth's surface.
- the array 12 having the geophone receivers 22 coupled to the earth detects the reflected signals, and the array 12 communicates seismic data with the central controller or recorder 90 using wireless technology or other communication technique.
- the recorder 90 records the seismic data 92 from the geophone receivers 22.
- a data processing system 98 is employed to process the seismic data 92.
- the seismic data 92 can also include recorded data from the seismic vibrator 30 if information such as pilot signal, acceleration data, and weighted sum ground force are stored separately.
- a vibrator-coupled ground filter system 94 is used to refine or improve the original seismic data 92 so that the improved data 96 can be provided to the data processing system 98.
- the data processing system 98 can use its correlation processor (not shown) to correlate a computed ground force from the information supplied by the vibrator 30 to the seismic data 96 and can ultimately provide more clear data for seismic imaging.
- the vibrator's controller 80 measures the acceleration data from local sensors.
- Part of the seismic data 92 received at the recorder 90 includes the acceleration data for both the baseplate 70 and reaction mass 50 of the vibrator 30 from such local sensors.
- the dynamic motions related to the coupling conditions of the vibrator 30 are recorded and embedded in the baseplate acceleration data.
- the motion of the vibrator's actuator e.g., hydraulic system
- the filter system 94 uses this acceleration data and a model of the coupling between the vibrator 30 and the ground to filter or correct the seismic data 92 before processing with the data processing system 98.
- the vibrator 30 works on the earth surface where the surface medium can change dramatically from location to location.
- the vibrator's baseplate 70 is coupled with the ground by applying the hold-down weight force to the baseplate 70, the baseplate 70 and the coupled ground join together and become one system. Due to the low rigidity of the baseplate 70 and variant surface conditions, the vibrator-coupled ground model can be a complex system.
- FIG 4 diagrammatically depicts a vibrator-coupled ground model 100 according to the present disclosure.
- the ground model 100 has three subsystems, which include a coupling system 110, an inhomogeneous and elastic coupled ground system 120, and a homogenous elastic deep ground 130. These subsystems express the complicated transmission of the Vibroseis wavelet from the vibrator system (30) to the ground (130).
- the vibrator-coupled ground model 100 expresses the rigidity of the baseplate 70 as part of non-ideal contact stiffness present at the boundary interaction of the baseplate 70 and the ground.
- This model 100 can serve as a more realistic representation of the vibrator-ground interaction and can describe a wide range of non-linear contact behavior (such as a partial contact and a full contact).
- the ground system 120 is described as a linear second-order system that consists of a ground mass M g , a ground stiffness K g , and a ground viscosity D g .
- the vibrator system 30 is also treated as a linear and rigid body.
- the baseplate 70 is only considered to have a mass M BP and its stiffness is distributed to become a part of the contact stiffness. Therefore, the contact stiffness in this model 100 is located in between the vibrator baseplate 70 and the ground.
- the contact stiffness here is defined as a group of “springs” (kc 1 , kc 2 , etc.) connecting the vibrator baseplate 70 and the ground 130, and the value depends on the number of "springs" (kc 1 , kc 2 , etc.) that physically connect the baseplate 70 and the ground during vibrator operation. Therefore, the contact stiffness is a variable stiffness.
- the vibrator baseplate 70 loses some contact with the ground so that the contact stiffness is reduced.
- the contact stiffness is reduced halfway through the compression cycle until halfway through the release cycle, and its value decreases as the sweep frequency increases.
- the vibrator baseplate 70 is subject to many motions such as bending, flexing, and twisting so that the contact stiffness becomes more unpredictable, and harmonic distortion becomes more severe.
- the coupling system 110 attempts to describe the coupling conditions at the interface between the baseplate 70 and the coupled ground system 120.
- the coupling system 110 can be modeled by a group of springs kc 1 , kc 2 ,...,kc n and a damper D c .
- the springs kc 1 , kc 2 ,..., kc n connect the vibrator's baseplate 70 and the coupled ground system 120 and are used to represent the variant contact stiffness in between the baseplate 70 and the coupled ground system 120 during operation of the vibrator 30.
- the baseplate's stiffness is separated as a number of small local stiffness coefficients distributed to join with these springs kc 1 , kc 2 ,...,kc n depending on the contact area between the baseplate 70 and the coupled ground.
- the damper D c represents the viscosity of the surface medium (e.g ., thin layer of vegetation or grass on the ground).
- the coupled ground system 120 in Figure 4 is described as an inhomogeneous and elastic system and can be represented by a mass-spring-damper model.
- This system 120 is inhomogeneous because the values of the captured ground mass M g , the ground stiffness K g , and the ground viscosity D g vary from location to location.
- this system 120 (and especially the captured ground mass M g ) joins with the baseplate 70 and becomes a part of the vibration source.
- the vibrator's baseplate 70 feels this coupled ground system 120, and the motion of this system 120 is embedded and detected in the baseplate acceleration data being recorded, as noted previously.
- the three parameters M g , K g , and D g of this ground coupled system 120 can be estimated using vibrator field measurements as described in more detail later. Fortunately, this system 120 can be treated as an elastic linear system because the total effect of its nonlinearities may be small and may be ignored, especially when compared to the nonlinearities existing in the vibrator hydraulic system and the nonlinearities due to low rigidity of the baseplate 70.
- the deep ground body 130 in Figure 4 is described as a homogeneous and elastic system.
- the traveled wavelet remains practically invariant.
- experimental testing can show that far-field wavelets remain invariant in deep ground and that the deep ground can be treated homogenously and elastically.
- ground model 100 All of the systems 30, 110, 120 combined together make up the vibrator-coupled ground model 100. Additional details of the ground model 100 can be found in Zhouhong Wei, "Modeling and modal analysis of seismic vibrator baseplate," Geophysical Prospecting, 58, 19-31 (2010 ).
- the block diagram of Figure 5 shows particular details to be quantified in the vibrator-coupled ground model 100 for creating a vibrator-coupled ground filter 150 for use in the purposes disclosed herein.
- the vibrator-coupled ground filter 150 of Figure 5 contains the vibrator's baseplate system 105, the coupling system 110, and the inhomogeneous elastic coupled ground system 120 expressed in formulas. This vibrator-coupled ground filter 150 is minimum phase.
- M bp is the mass of the vibrator baseplate (70)
- D c is the contact viscosity of the coupling system 110
- K c is the contact stiffness of the coupling system 110, which consists of many small springs.
- M g is the mass of the captured ground mass
- D g is the contact viscosity
- K g is the contact stiffness for the captured ground.
- the vibrator-coupled ground filter 150 is based on the transfer functions of these systems G 1 (s), G 2 (s), and G 3 (s), as well as the variables for M bp , D c , K c , M g , D g , K g , etc.
- Input 102 to the ground filter 150 includes either a pilot sweep (T ref ) or a weighted-sum ground force (W s-gf ), which are supplied by the vibrator (30).
- the weighted-sum ground force (W s-gf ) is determined by the masses M rm and M bp of the reaction mass (50) and baseplate (70), which are known, and the acceleration data Acc rm and Acc bp of the reaction mass (50) and baseplate (70) recorded at the vibrator (30).
- Output 104 of the ground filter 150 includes a filtered pilot signal (filtered T ref ) or a filtered weighted-sum ground force (filtered W s-gf ).
- This output 104 is used by the ground filter system (94) of Figure 3 to filter the seismic data (92) of the recorder (90) before processing by the data processing system (98) so that the seismic data is processed with the more accurate vibrator-captured ground model 100 of the present disclosure.
- the filtered weighted-sum ground force (filtered W s-gf ) can give better cross-correlated results between the vibrator's seismic energy and the seismic sensor responses and can reduce noise.
- the dynamic motions related to the coupling condition and the inhomogeneous and elastic coupled ground system 120 are recorded and embedded in the baseplate acceleration data Acc bp supplied by the vibrator (30) to the recorder (90).
- the motion of the vibrator's actuator e.g ., hydraulic system
- the reaction mass acceleration data Acc rm supplied by the vibrator (30) to the recorder (90).
- the vibrator measurements Acc bp and Acc rm are often recorded during data acquisition as the weighted-sum ground force (W s-gf ) using the recorder (90).
- the dynamic motions of the coupling system 110 and the coupled ground system 120 are extracted from the baseplate and reaction mass acceleration data Acc bp and Acc rm as described below.
- Figure 6A shows an example frequency response for a vibrator.
- the reaction mass acceleration Acc RM is used as an input signal
- baseplate acceleration Acc BP is used as output responding to the input signal based on the ground model's transfer functions described previously.
- the frequency response of the vibrator is analyzed with the reaction mass acceleration data as input and with the baseplate acceleration as output.
- the inverse could also be done so that a frequency response can be analyzed with the baseplate acceleration data as input and with the reaction mass acceleration as output.
- the frequency responses would appear different, it is understood that the frequency response analysis can generally relate the reaction mass acceleration data and the baseplate acceleration data as input and output relative to one another.
- the magnitude plot 200A shows the magnitude ratio (dB) of Acc BP to Acc RM relative to frequency
- the phase plot 250A shows the phase (degrees) relative to frequency.
- the magnitude ratio increases at a sloped section 202 of about 40dB/dec as frequency increases.
- the magnitude ratio then reaches a turning point 204 at a resonant frequency between the baseplate (70) and the ground. Beyond this turning point 204, the magnitude ratio flattens out to a sloped section 206 of 0dB/dec.
- the phase in the phase plot 250A shifts from 0 degrees to -180 degrees. At the resonant frequency 254, the phase is expected to be -90 degrees.
- the turning point 204 is defined by the values of M g , K g , and D g in the coupled ground system (120; Figs. 3-4 ).
- the subsequent plateau section 206 is defined by the values of k c1 , k c2 , D c1 , and D c2 of the coupling system (110; Figs. 3-4 ). Knowing this theoretical nature of the frequency response having reaction mass acceleration Acc RM as input and baseplate acceleration Acc BP as output, an actual measured frequency response from measured data can be compared to the disclosed ground model 100 to derive values for M g , K g , D g , k c1-2 , D c1-2 for the vibrator-coupled ground filter 150.
- Figure 6B shows a measured frequency response using example vibrator measurement data 214 compared to model data 212 using the disclosed ground model 100.
- reaction mass acceleration data Acc rm is again used as an input signal
- baseplate acceleration data Acc bp is used as output responding to the input signal.
- the baseplate and reaction mass accelerations Acc bp and Acc rm have been measured and recorded on a standard vibrator (30) using a recorder (90).
- the measured frequency response curves 214/254 in Figure 6B are then compared to model frequency response curves 212/252 generated by the model data using the disclosed ground model 100.
- the values for the variables (M g , K g , D g ) in the ground model filter 150 are then obtained by successively modeling the measured frequency response seen in the measured data 214.
- the magnitude plot 200B the magnitude ratio spectra of the measured and model data curves 212/214 are shown.
- the phase plot 250B the corresponding phase spectra curves 262/264 are shown.
- the plots 200B/250B show that the model data curves 212/262 track the measured curves 214/264. Based on this, it can be seen that the main dynamic motions have been captured by the disclosed ground model 100, although some discrepancies are visible in these plots.
- first regions 204/254 show the main resonance produced by the baseplate (30) and the coupled ground system 110, which corresponds to flexure of the baseplate (30).
- second regions 206/256 illustrate the dynamic modes resulting from the coupling system 110.
- FIG. 7 shows a process 300 for deriving the vibrator-coupled ground filter 150 of the present disclosure.
- recorded data from a survey is obtained (Block 302).
- this data includes the seismic signals obtained with the sensors (22) in the array (12) as in Figure 3 .
- this data includes the pilot signal (T ref ) and the weighted-sum ground force (W s-gf ), which includes the reaction mass and baseplate accelerations Acc bp and Acc rm .
- the acceleration data Acc bp and Acc rm for the reaction mass (50) and baseplate (70) are input into the transfer functions of the systems (i.e., G 1 (s), G 2 (s), and G 3 (s)) in the ground force model 100 (Block 304).
- the dynamic motions related to the coupling conditions are recorded and embedded in the baseplate acceleration data Acc BP .
- the motion of the vibrator's actuator system is recorded and embedded in the reaction mass acceleration data Acc RM .
- Useful information for the variables of the ground model 100 is then obtained from knowledge of the frequency response (as in Figures 6A-6B ) and the transfer functions G 1 (s), G 2 (s), and G 3 (s) for the system 100.
- variables that describe the captured ground force system 120 are extracted from the transfer functions G 1 (s), G 2 (s), and G 3 (s) (Block 306).
- These variables include M g , K g , and D g .
- the values for these variables are generally known and would be expected to lie within some target range. Yet, given the dynamic nature of the vibrator's operation, the values vary dynamically.
- the appropriate values for the variables M g , K g , and D g can be derived.
- these variables M g , K g , and D g govern the first turning point 204/254 in the frequency response of Figure 6B .
- the values for these variables M g , K g , and D g can then be derived from the first region of the frequency response.
- variables that describe the coupling system 110 are extracted from the transfer functions of the system (Block 308). These variables include kc 1-2 and Dc 1-2 . For a given vibrator, the values for these variables kc 1-2 and Dc 1-2 are generally known and would be expected to lie within some target range. Yet, given the dynamic nature of the vibrator's operation, the values vary dynamically. Using the transfer functions G 1 (s), G 2 (s), and G 3 (s) and numerical analysis, the appropriate values for the variables kc 1-2 and Dc 1-2 can be derived. In particular, these variables kc 1-2 and Dc 1-2 govern the second region 206/256 in the frequency response of Figure 6B past the turning point 204/254. Using polynomial fitting, the values for these variables kc 1-2 and Dc 1-2 can then be derived from the second region of the frequency response for the ground model 100.
- the derived values for the variables M g , K g , D g , kc 1-2 , and Dc 1-2 as well as the mass of the baseplate M BP are input into transform functions to convert the transfer functions G 1 (s), G 2 (s), and G 3 (s) into the frequency domain.
- the ground model with extracted variables is then converted into the frequency domain (Block 310) so the desired vibrator-coupled ground model filter 150 can be calculated (Block 312).
- Figure 8 shows a process 350 for using the vibrator-coupled ground filter 150 of the present disclosure.
- the array (12) and recorder (90) of Figure 3 obtain recorded data from a survey as discussed previously (Block 352).
- the seismic data (92) is to be handled by the data processing system (98).
- the system filters the original seismic data (92) with the ground filter system (94) using the vibrator-coupled ground filter 150 of the present disclosure (Block 354).
- the improved data (96) can then be provided to the data processing system (98).
- the data processing system (98) can use its correlation processor to cross-correlate survey data using the filtered pilot reference signal (filtered T ref ) or filtered weighted sum ground force (filtered W s-gf ) (Block 356).
- the system (98) can then output the cross-correlated results, which can then be used for imaging purposes (Block 358).
- the input 102 (either the pilot sweep T ref or the weighted-sum ground force W s-gf ) is injected into the vibrator-coupled ground filter 150, it is passed through transfer functions corresponding to the vibrator's baseplate system 105, the coupling system 110, and the elastic coupled ground system 120. This means that the input 102 (the pilot sweep or the weighted-sum ground force) will be sequentially filtered by these systems (105, 110, 120).
- the output 104 from the vibrator-coupled ground filter 150 becomes the filtered pilot sweep (filtered T ref ) or the filtered weighted-sum ground force (filtered W s-gf ), which is the expected input to the deep ground (130) by the vibrator 30.
- the wavelet produced by the cross-correlation function between the input 102 (pilot sweep or the weighted-sum ground force) and the output 104 (the filtered pilot sweep or the filtered weighted-sum ground force) will be indicative of an accurate wavelet that travels through the deep ground 130. It should be in phase with the downhole wavelets except for a time shift.
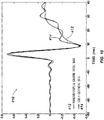
- the graph 400 in Figure 9 plots amplitude spectra 402 from six downhole geophones and the amplitude spectrum 404 from a filtered pilot sweep (filtered T ref ).
- the downhole geophone spectra 402 have been recorded using a standard vibrator driven by a linear sweep from 2 Hz to 160 Hz in 20 seconds. This linear sweep (pilot sweep) has been recorded as well.
- the downhole geophone spectra 402 plotted in Figure 9 are selected in 200 ft (60.96 m) intervals from 200 ft (60.96 m) to 1000 ft (304.8 m).
- the filtered pilot sweep spectrum 404 is obtained by passing the pilot sweep through the vibrator-coupled ground filter 150. It is observed that the amplitude spectrum 404 of the filtered pilot sweep (filtered T ref ) matches very well with the amplitude spectra 402 from six downhole geophones. This indicates that the filtered pilot sweep (filtered T ref ) is in the downgoing wavelet. Furthermore, the vibrator-coupled ground filter 150 does appear to accurately describe the filtering effects caused by the vibrator (30), the coupling condition between the baseplate (70) and the coupled ground, and the coupled ground system (120).
- the plot 410 in Figure 10 provides another example and shows a comparison of two wavelets 412/414.
- One wavelet 414 is produced by the cross-correlation between an original pilot sweep and the 1000 ft (304.8 m) downhole geophone data. Compensation for time delay of this wavelet 414 is made to provide a better comparison.
- the other wavelet 412 is the result of the cross-correlation function between the pilot sweep (T ref ) and the filtered pilot sweep (filtered T ref ), which is labeled as the Vibrator-Coupled Ground Model data 412 in Figure 10 .
- the two wavelets 412/414 match very well.
- the similarity of two wavelets 412/414 further confirms that the vibrator-coupled ground model 100 of the present disclosure is a reasonable model and each sub-model 110, 120, etc. can be used to represent its own system.
- Standard Vibroseis theory indicates that far-field particle velocity is proportional to a time differential of a true ground force. Again, this theory is built on an assumption that the ground can be treated as an isotropic homogeneous elastic body. As demonstrated above, the deep ground can be assumed to be a relatively homogeneous and elastic body 130, at least in the P-wave direction. However, the coupled ground system 120 of Figures 4-5 is definitely not a homogeneous body. Therefore, standard Vibroseis theory should be modified slightly to allow for the more realistic situation.
- the far-field particle velocity is proportional to the input of the deep ground 130, which is the output 104 of the pilot sweep (T ref ) or the weighted-sum ground force (W s-gf ) after it has passed through the vibrator-coupled ground model filter 150.
- Figures 11A-11B depict comparisons of wavelets generated by using the derivative of the pilot sweep (T ref ) as well as the filtered pilot sweep (filtered T ref ).
- wavelets 422/424 were obtained using the standard vibrator modeling.
- wavelets 432/434 were obtained from the modified vibrator modeling of the present disclosure.
- Curves 422/432 are produced by cross-correlating the derivatives of the pilot sweeps (T ref ) with the 1000-ft (304.8 m) downhole geophone traces.
- the curves 424/434 are results of the cross-correlation function between the filtered pilot sweeps (filtered T ref ) and the 1000-ft (304.8 m) downhole geophone traces.
- Figures 11A-11B clearly demonstrates that the zero-phase wavelets can be obtained when the filtered pilot sweep (filtered T ref ) was cross-correlated to the downhole geophone data.
- FIGS 12A-12B depict another representative example to show that the Vibrator-Coupled Ground Model 100 can describe the filtering effects seen in a Vibroseis wavelet caused by the vibrator-coupled ground system.
- These plots 440/450 depict the wavelets obtained by using the derivative of the weighted-sum ground force (W s-gf ) as well as the filtered weighted-sum ground force (filtered W s-gf ).
- W s-gf weighted-sum ground force
- filtered W s-gf filtered weighted-sum ground force
- the wavelets 442/452 are produced when the derivatives of the weighted-sum ground force (W s-gf ) was cross-correlated with the 1000-ft (304.8 m) downhole geophone traces.
- the other wavelets 444/454 are resulted from the cross-correlation of the filtered weighted-sum ground force (filtered W s-gf ) with the 1000-ft (304.8 m) downhole geophone traces.
- Figures 12A-12B show that the zero-phase wavelets can be obtained when the filtered weighted-sum ground force (filtered W s-gf ) was used to cross-correlate to the downhole geophone data. It can be observed that the wavelets in Figures 12A-12B delay slightly comparing to the wavelets in Figures 11A-11B . This tiny time-delay is due to the phase error between the pilot sweep (T ref ) and the weighted-sum ground force (W s-gf ).
- FIG. 13 shows an amplitude spectrum 460 comparing data recorded in an experimental test using a standard vibrator modeling.
- the curve 462 is produced from a surface geophone that was placed 1-m apart from the vibrator baseplate (70).
- the curve 462 represents the velocity power spectrum of particles where the surface geophone is located.
- the spectrum 460 was computed after geophone response removal.
- the baseplate accelerometer is mounted on the top cross of the baseplate stilt structure, the signal recorded by the baseplate accelerometer needs to physically pass through the baseplate (70), the coupling system (110), and the coupled ground system (120) in order to connect with any nodes in the coupled ground system (120). Additionally, because the surface geophone records the particle velocity, it makes more sense to convert the baseplate acceleration into the baseplate velocity. Therefore, the other curve 464 is calculated from the data output from the vibrator-coupled ground filter 150 where the input to the filter 150 is the baseplate velocity, which is obtained by integrating the baseplate acceleration.
- the curve 464 in the amplitude spectrum 460 obtained by utilizing the baseplate acceleration matches closely with the amplitude spectrum produced by using the surface geophone trace.
- Figure 13 indicates that the vibrator-coupled ground model 100 can simulate the filtering effects caused by the baseplate (70) and its vicinity. Moreover, it demonstrates that the coupled ground is a part of the source.
- Portions of the present disclosure may be implemented in terms of logic, software, or code typically encoded on a variety of media including, but not limited to, computer-readable media, machine-readable media, program storage media, or computer program product. Such media may be handled, read, sensed, and/or interpreted by a computing device having a processor. Those skilled in the art will appreciate that such media may take various forms such as cards, tapes, magnetic disks (e.g., floppy disk or hard drive) and optical disks (e.g., compact disk read only memory (“CD-ROM”) or digital versatile disc (“DVD”)). It should be understood that the given implementations are illustrative only and shall not limit the present disclosure.
- FIG 14 shows a geophysical information processing system 500 that can be used in accordance with the present disclosure.
- Geophysical information may be received by the geophysical information processing system 500 after being gathered by a geophysical information collector such as the collector or recorder 90 as described above and shown in Figure 3 .
- the information collector 90 can include one or more or any combination of the components shown in Figure 14 .
- the geophysical information processing system 500 may include one or more processing devices, such as a computer 520 with a storage device 510.
- the computer 500 can be, but is not limited to, a laptop computer, a desktop computer, a mainframe, or the like.
- the computer 520 may be in communication with the storage device 510 via any known interface and an interface for entering information into the computer 520 may be any acceptable interface.
- the interface may include the use of a network interface 530.
- the storage device 510 can be any useful storage device having a computer-readable media. Instructions for carrying out methods described herein may be stored on computer-readable media in the computer 520 or may be stored on an external storage device.
- Imaging includes any representation of a subsurface structure including, but not limited to, graphical representations, mathematical or numerical representation, strip charts or any other process output representative of the subsurface structure.
- Geophysical information as used herein means information relating to the location, shape, extent, depth, content, type, properties, and/or number of geologic bodies. Geophysical information includes, but is not necessarily limited to marine and land seismic information. Seismic information includes, but is not limited to, one or more or any combination of the following, analog signals, digital signals, recorded data, data structures, database information, parameters relating to surface geology, source type, source location, receiver location, receiver type, time of source activation, source duration, source frequency, energy amplitude, energy phase, energy frequency, wave acceleration, wave velocity and/or wave direction.
- Seismic information may be gathered using sensors monitoring seismic activities using, for example, a system as described above and shown in Figure 3 .
- the seismic activities result from active energy sources, including vibrator devices.
- the sensors can include geophones, accelerometers, pressure sensors, single component sensors, and/or multi-component sensors.
Description
- This is a non-provisional of
U.S. Pat. Appl. No. 61/393,106, filed 14-OCT-2010 - The oil and gas exploration industry employ geophysical tools and techniques to identify a subterranean structure having potential hydrocarbon deposits. Commonly referred to as seismic exploration, these techniques and tools generate an image of subsurface structures by recording energy in the form of vibrations reflected or refracted from geologic formations. In seismic exploration, for example, seismic waves generated by a source and imparted into the ground reflect off rocks in the subsurface. Boundaries between different rocks often reflect seismic waves, and information relating to these waves is collected and processed to generate a representation or images of the subsurface.
- When seismic waves generated by the source reach a bedding plane separating rocks of different acoustic density, then a portion of the waves reflects back to the surface, causing the ground surface to rise or fall depending on whether the expansion or compression phase of the wave is being recorded. The remaining portion of the waves is refracted and diffracted. A two-dimensional image, which is called a seismic line, is essentially a cross-sectional view of the earth oriented parallel to the line of geophones. The information may also be collected as an intersecting grid of seismic lines referred to as a 3-D seismic volume.
- Any number of exploration systems can gather the desired information for processing. Dynamite explosions, vibrator trucks, air guns or the like can create the seismic waves. Sensors such as velocity geophones, accelerometers, and/or hydrophones can be laid out in lines, or towed in the case of hydrophones, to measure how long it takes the waves to leave the seismic source, reflect off a rock boundary, and return to the sensors used.
- Exemplary systems are described in
US 6161076 ,GB 2190746 US 2009/210158 ,US 2007/230268 ,US 2005/267695 andUS 2007/133354 . An exampleseismic system 10 inFigure 1 can generate geophysical information to image earth subsurface structures. Thesystem 10 has a central controller/recorder 90 in communication with aseismic acquisition array 12 known as a spread. Thearray 12 has spacedsensor stations 20, which can each have one ormore sensors 22. Thesensors 22 measure geophysical information and can include 3-component sensors for obtaining 3-dimensional energy known as 3D seismic. Thesensors 22 can include accelerometers, velocity geophones, microphones, or the like, and thearray 12 can be deployed on land or a seabed location. - A
seismic source 30 imparts acoustic energy into the ground, and thesensors 22 receive energy after reflection and refraction at boundaries in subsurface structures. Thearray 12 then communicates sensor data with the central controller orrecorder 90 using wireless technology or other communication technique. - To impart the acoustic energy, the
seismic source 30 can be a vibrator, such as shown inFigure 2 , although other types of sources can be used. Thevibrator 30 transmits force to the ground using abaseplate 70 and areaction mass 50. As is typical for land seismic, thevibrator 30 is mounted on a carrier vehicle (not shown) that usesbars 32/34 to lower thevibrator 30 to the ground. With thevibrator 30 lowered, the weight of the vehicle holds thebaseplate 70 engaged with the ground so seismic source signals can be transmitted into the earth. - The
reaction mass 50 positions directly abovebaseplate 70 and stilts 52 extend from thebaseplate 70 and through themass 50 to stabilize it. Internally, thereaction mass 50 has acylinder 56 formed therein. A vertically extendingpiston 60 extends through thiscylinder 56, and ahead 62 on thepiston 60 divides thecylinder 56 into chambers. The ends of thepiston 60 connect to cross-pieces 54U-L that connect to the stilts 52. -
Feet 36 withisolators 40 isolate thebaseplate 70 from thebars 34, andtension members 42 interconnect between thefeet 36 and thebaseplate 70. Thetension members 42 hold thebaseplate 70 when thevibrator 30 is raised and lowered to the ground. Finally, shock absorbers 44 are also mounted between the bottom of thefeet 36 and thebaseplate 70 to isolate vibrations therebetween. - During operation, a
controller 80 receives signals from afirst sensor 85 that measures acceleration of thebaseplate 70 and receives signals from a second sensor 87 that measure acceleration of thereaction mass 50. Based on feedback from thesesensors 85/87 and a desired sweep signal for operating thevibrator 30, thecontroller 80 generates a pilot signal to control a servo valve assembly 82. Driven by the drive signal, the servo valve assembly 82 alternatingly routes hydraulic fluid between a hydraulic fluid supply 84 and thepiston 60. Thereaction mass 50 reciprocally vibrates on thepiston 60. In turn, the force generated by the vibratingmass 50 transfers to thebaseplate 70 via the stilts 52 and thepiston 60 so that thebaseplate 70 vibrates at a desired amplitude and frequency or sweep to generate a seismic source signal into the ground. - As the
moving reaction mass 50 acts upon thebaseplate 70 to impart a seismic source signal into the earth, the signal travels through the ground, reflects at discontinuities and formations, and then travels toward the earth's surface. At the surface, thearray 12 ofFigure 1 having the geophone receivers orother sensors 22 coupled to the ground detect the reflected signals, and therecorder 90 ofFigure 1 records theseismic data 92 received from thegeophone receivers 22. - At some point, a
data processing system 98 receives theseismic data 92 from theseismic recorder 90. (Theseismic data 92 can also include recorded data from theseismic vibrator 30 if information such as pilot signal, acceleration data, and weighted sum ground force are stored separately.) Thedata processing system 98 can use a correlation processor to correlate the computed ground force supplied by thevibrator 30 to theseismic data 92 received by thegeophone receivers 22. Ultimately, the correlated information can be used to create an image or representation of the earth's subsurface structures. - When operating such a
prior art vibrator 30, operators experience problems in accurately determining the ground force that thevibrator 30 is applying to the ground and in accurately correlating the vibrator's operation with the generated source signal. Ideally, operators would like to know the actual ground force applied by thebaseplate 70 to the ground when imparting the seismic energy. As shown inFigure 2 , a local sensor 85 (e.g., accelerometer or geophone) is typically positioned on the upper cross piece 54U of thevibrator 50, which positions above thereaction mass 50. - In operation, the
controller 80 shown inFigure 2 measures the signal imparted into the ground using thelocal sensor 85 located on the upper cross-piece 54U and using the sensor 87 located on thereaction mass 50. When thedata processing system 98 ofFigure 1 receives theseismic data 92 making up the seismic spread, it also receives the acceleration signals from thesesensors 85/87 on thesource 30. Thesystem 98's correlation processor then uses various algorithms to distinguish wave signal data from distortions and other spurious signals. - A problem with this method is that original source signal distortion may vary and make correlation difficult. When calculated ground force signals at the
vibrator 30 are cross-correlated with far-field signals measured in the field, the results may be corrupted by unrealistic assumptions used in modeling thesystem 10. In particular, thevibrator 30 works on the surface of the ground, which can vary dramatically from location to location due to the presence of sand, rock, vegetation, etc. Thus, thebaseplate 70 is often not evenly supported when deployed against the ground at a given location. In addition, thebaseplate 70 will flex and directly affect the control system during operation. As a result, the radiated energy produced can vary from location to location depending on where thevibrator 30 is deployed. Therefore, the vibrator's source signature is not the same (or nearly the same) from location to location and is not characteristically repeatable, which is desirable when performing seismic analysis. Thus, a more accurate knowledge of the source signal imparted into the ground by thesource 30 can make the correlation easier at the data processing stage. - The subject matter of the present disclosure is directed to overcoming, or at least reducing the effects of, one or more of the problems set forth above.
- A vibrator-coupled ground filter improves seismic data recorded during a seismic operation. This filter is based on a ground model that takes into consideration the vibrator system, the coupling system between the baseplate and captured ground, and the coupled ground system. Using acceleration data from the baseplate and the reaction mass, the ground model can be used to derive particular variables for the ground model to help characterize the system. Using the derived variables in the ground filter, the recorded seismic data can be corrected to remove errors in the trace data produced by typical assumptions.
- According to an aspect of the present invention, there is provided a seismic data processing method as claimed in
claim 1. - According to an aspect of the present invention, there is provided a seismic data processing apparatus as claimed in claim 14.
- The foregoing summary is not intended to summarize each potential embodiment or every aspect of the present disclosure.
-
-
Fig. 1 illustrates a seismic system for generating geophysical information according to the prior art. -
Fig. 2 schematically illustrates a prior art vibrator. -
Fig. 3 illustrates a seismic system for generating geophysical information according to the present disclosure. -
Fig. 4 schematically illustrates a vibrator-coupled ground model according to the present disclosure. -
Fig. 5 schematically illustrates a vibrator-coupled ground filter according to the present disclosure. -
Fig. 6A graphs a theoretical frequency response of reaction mass acceleration and baseplate acceleration where reaction mass acceleration is the input and baseplate acceleration is the output. -
Fig. 6B graphs a frequency response of reaction mass acceleration and baseplate acceleration using data recorded on a standard vibrator, where the reaction mass acceleration is input and the baseplate acceleration is output. -
Fig. 7 shows a process for deriving the vibrator-coupled ground filter of the present disclosure. -
Fig. 8 shows a process for using the vibrator-coupled ground filter of the present disclosure. -
Fig. 9 graphs power spectra of downhole geophones at different depths and with the filtered weighted-sum ground force. -
Fig. 10 graphs wavelets produced by a pilot sweep cross-correlated with 1000-ft (304.8 m) geophone data and with the vibrator-coupled ground model data, respectively. -
Fig. 11A graphs a cross-correlation of the derivative of the pilot sweep with the 1000-ft downhole geophone data and a cross-correlation of the filtered pilot sweep with the 1000-ft downhole geophone data using standard vibrator modeling. -
Fig. 11B graphs a cross-correlation of the derivative of the pilot sweep with the 1000-ft downhole geophone data and a cross-correlation of the filtered pilot sweep with the 1000-ft downhole geophone data using modified vibrator modeling. -
Fig. 12A graphs a cross-correlation of the derivative of the weighted-sum ground force with the 1000-ft downhole geophone data and a cross-correlation of the filtered weighted-sum ground force with the 1000-ft downhole geophone data using he standard vibrator modeling. -
Fig. 12B graphs a cross-correlation of the derivative of the weighted-sum ground force with the 1000-ft downhole geophone data and a cross-correlation of the filtered weighted-sum ground force with the 1000-ft downhole geophone data using modified vibrator modeling. -
Fig. 13 graphs a comparison in amplitude spectra of a surface geophone and the velocity computed from baseplate accelerometer data. -
Fig. 14 shows a geophysical information processing system that can be used in accordance with the present disclosure. - An example
seismic system 10 inFigure 3 can generate geophysical information to image earth subsurface structures. Thesystem 10 has a central controller/recorder 90 in communication with aseismic acquisition array 12 known as a spread. As before, thearray 12 has spacedsensor stations 20, which can each have one ormore sensors 22. Thesensors 22 measure geophysical information and can include 3-component sensors for obtaining 3-dimensional energy known as 3D seismic. Thesensors 22 can include accelerometers, velocity geophones, microphones, or the like, and thearray 12 can be deployed on land or a seabed location. - As before, a
seismic source 30 imparts acoustic energy into the ground, and thesensors 22 receive energy after reflection and refraction at boundaries in earth subsurface structures. Theseismic source 30 can be similar to the vibrator disclosed previously with reference toFigures 2 . For the benefit of the present discussion, reference is made to the components of thevibrator 30 ofFigure 2 , including areaction mass 50, abaseplate 70, and acontroller 80 as diagramed inFigure 3 . However, theseismic source 30 according to the present disclosure need not necessarily be a hydraulically operated vibrator. Instead, theseismic source 30 can be a seismic vibrator have an electric motor, can have an internal or external drive, and can generate seismic shear waves (S-waves) or seismic compression waves (P-waves). In general, thevibrator 30 can be any type of vibrator having acontroller 80 and having areaction mass 50 and abaseplate 70 for imparting energy into the ground. - As before, the moving
reaction mass 50 acts upon thebaseplate 70 of thevibrator 30 to impart seismic source signals into the ground. The signals travel through the ground, reflect at discontinuities and formations, and then travel toward the earth's surface. At the surface, thearray 12 having thegeophone receivers 22 coupled to the earth detects the reflected signals, and thearray 12 communicates seismic data with the central controller orrecorder 90 using wireless technology or other communication technique. - The
recorder 90 records theseismic data 92 from thegeophone receivers 22. At some point, adata processing system 98 is employed to process theseismic data 92. (Theseismic data 92 can also include recorded data from theseismic vibrator 30 if information such as pilot signal, acceleration data, and weighted sum ground force are stored separately.) To improve the subsequent imaging produced by thedata processing system 98, a vibrator-coupledground filter system 94 according to the present disclosure is used to refine or improve the originalseismic data 92 so that theimproved data 96 can be provided to thedata processing system 98. When this is done, thedata processing system 98 can use its correlation processor (not shown) to correlate a computed ground force from the information supplied by thevibrator 30 to theseismic data 96 and can ultimately provide more clear data for seismic imaging. - As noted previously, the vibrator's
controller 80 measures the acceleration data from local sensors. Part of theseismic data 92 received at therecorder 90 includes the acceleration data for both thebaseplate 70 andreaction mass 50 of thevibrator 30 from such local sensors. The dynamic motions related to the coupling conditions of thevibrator 30 are recorded and embedded in the baseplate acceleration data. In addition, the motion of the vibrator's actuator (e.g., hydraulic system) is recorded and embedded in the reaction mass acceleration data. These measurements are recorded during data acquisition using therecorder 90 and are used by thefilter system 94 to process the data. In particular, theground filter system 94 uses this acceleration data and a model of the coupling between thevibrator 30 and the ground to filter or correct theseismic data 92 before processing with thedata processing system 98. - Before turning to particular details of the
filter system 94, discussion first focuses on a vibrator-coupled ground model used for thefilter system 94. - As noted above, the
vibrator 30 works on the earth surface where the surface medium can change dramatically from location to location. When the vibrator'sbaseplate 70 is coupled with the ground by applying the hold-down weight force to thebaseplate 70, thebaseplate 70 and the coupled ground join together and become one system. Due to the low rigidity of thebaseplate 70 and variant surface conditions, the vibrator-coupled ground model can be a complex system. -
Figure 4 diagrammatically depicts a vibrator-coupledground model 100 according to the present disclosure. In addition to thevibrator system 30, theground model 100 has three subsystems, which include acoupling system 110, an inhomogeneous and elastic coupledground system 120, and a homogenous elasticdeep ground 130. These subsystems express the complicated transmission of the Vibroseis wavelet from the vibrator system (30) to the ground (130). - The vibrator-coupled
ground model 100 expresses the rigidity of thebaseplate 70 as part of non-ideal contact stiffness present at the boundary interaction of thebaseplate 70 and the ground. Thismodel 100 can serve as a more realistic representation of the vibrator-ground interaction and can describe a wide range of non-linear contact behavior (such as a partial contact and a full contact). - In
Figure 4 , theground system 120 is described as a linear second-order system that consists of a ground mass Mg, a ground stiffness Kg, and a ground viscosity Dg. Thevibrator system 30 is also treated as a linear and rigid body. In thismodel 100, thebaseplate 70 is only considered to have a mass MBP and its stiffness is distributed to become a part of the contact stiffness. Therefore, the contact stiffness in thismodel 100 is located in between thevibrator baseplate 70 and the ground. The contact stiffness here is defined as a group of "springs" (kc1, kc2, etc.) connecting thevibrator baseplate 70 and theground 130, and the value depends on the number of "springs" (kc1, kc2, etc.) that physically connect thebaseplate 70 and the ground during vibrator operation. Therefore, the contact stiffness is a variable stiffness. - As is known, partial decoupling often occurs as the
vibrator 30 shakes at high frequencies due to the low rigidity of thevibrator baseplate 70. Such decoupling becomes even worse on uneven ground. When thevibrator 30 is in a compressing mode, there are more contact areas between thevibrator baseplate 70 and the ground. More contact areas mean more "springs" and more stiffness in themodel 100. - As the
vibrator 30 goes to a releasing mode, however, partial decoupling may happen. This means that thebaseplate 70 loses some contact with the ground so that the contact stiffness is reduced. The contact stiffness is reduced halfway through the compression cycle until halfway through the release cycle, and its value decreases as the sweep frequency increases. When thevibrator 30 is located on uneven ground, thevibrator baseplate 70 is subject to many motions such as bending, flexing, and twisting so that the contact stiffness becomes more unpredictable, and harmonic distortion becomes more severe. - In the
model 100 ofFigure 4 , thecoupling system 110 attempts to describe the coupling conditions at the interface between thebaseplate 70 and the coupledground system 120. Thecoupling system 110 can be modeled by a group of springs kc1, kc2,...,kcn and a damper Dc. In thissystem 120, the springs kc1, kc2,..., kcn connect the vibrator'sbaseplate 70 and the coupledground system 120 and are used to represent the variant contact stiffness in between thebaseplate 70 and the coupledground system 120 during operation of thevibrator 30. Notably, the baseplate's stiffness is separated as a number of small local stiffness coefficients distributed to join with these springs kc1, kc2,...,kcn depending on the contact area between thebaseplate 70 and the coupled ground. The damper Dc represents the viscosity of the surface medium (e.g., thin layer of vegetation or grass on the ground). - For its part, the coupled
ground system 120 inFigure 4 is described as an inhomogeneous and elastic system and can be represented by a mass-spring-damper model. Thissystem 120 is inhomogeneous because the values of the captured ground mass Mg, the ground stiffness Kg, and the ground viscosity Dg vary from location to location. When loaded to the vibrator'sbaseplate 70 during vibration, this system 120 (and especially the captured ground mass Mg) joins with thebaseplate 70 and becomes a part of the vibration source. - At each vibrator shaking spot, the vibrator's
baseplate 70 feels this coupledground system 120, and the motion of thissystem 120 is embedded and detected in the baseplate acceleration data being recorded, as noted previously. The three parameters Mg, Kg, and Dg of this ground coupledsystem 120 can be estimated using vibrator field measurements as described in more detail later. Fortunately, thissystem 120 can be treated as an elastic linear system because the total effect of its nonlinearities may be small and may be ignored, especially when compared to the nonlinearities existing in the vibrator hydraulic system and the nonlinearities due to low rigidity of thebaseplate 70. - The
deep ground body 130 inFigure 4 is described as a homogeneous and elastic system. In thisdeep ground body 130, the traveled wavelet remains practically invariant. In particular, experimental testing can show that far-field wavelets remain invariant in deep ground and that the deep ground can be treated homogenously and elastically. - All of the
systems ground model 100. Additional details of theground model 100 can be found in Zhouhong Wei, "Modeling and modal analysis of seismic vibrator baseplate," Geophysical Prospecting, 58, 19-31 (2010). - Given the vibrator-coupled
ground model 100 ofFigure 4 , the block diagram ofFigure 5 shows particular details to be quantified in the vibrator-coupledground model 100 for creating a vibrator-coupledground filter 150 for use in the purposes disclosed herein. Essentially, the vibrator-coupledground filter 150 ofFigure 5 contains the vibrator'sbaseplate system 105, thecoupling system 110, and the inhomogeneous elastic coupledground system 120 expressed in formulas. This vibrator-coupledground filter 150 is minimum phase. - In the
ground filter 150, the vibrator'sbaseplate system 105 can be represented by the following transfer function:
- In this
baseplate system 105, Mbp is the mass of the vibrator baseplate (70), Dc is the contact viscosity of thecoupling system 110, and Kc is the contact stiffness of thecoupling system 110, which consists of many small springs. - For its part, the
coupling system 110 in theground filter 150 can be represented by the following transfer function:
- Finally, the coupled
ground system 120 in theground filter 150 can be represented by the following transfer function:
- In the coupled
ground system 120, Mg is the mass of the captured ground mass, Dg is the contact viscosity, and Kg is the contact stiffness for the captured ground. - Thus, the vibrator-coupled
ground filter 150 is based on the transfer functions of these systems G1(s), G2(s), and G3(s), as well as the variables for Mbp, Dc, Kc, Mg, Dg, Kg, etc. - Input 102 to the
ground filter 150 includes either a pilot sweep (Tref) or a weighted-sum ground force (Ws-gf), which are supplied by the vibrator (30). The weighted-sum ground force (Ws-gf) is characterized by the equation:
- Therefore, the weighted-sum ground force (Ws-gf) is determined by the masses Mrm and Mbp of the reaction mass (50) and baseplate (70), which are known, and the acceleration data Accrm and Accbp of the reaction mass (50) and baseplate (70) recorded at the vibrator (30).
-
Output 104 of theground filter 150 includes a filtered pilot signal (filtered Tref) or a filtered weighted-sum ground force (filtered Ws-gf). Thisoutput 104 is used by the ground filter system (94) ofFigure 3 to filter the seismic data (92) of the recorder (90) before processing by the data processing system (98) so that the seismic data is processed with the more accurate vibrator-capturedground model 100 of the present disclosure. In turn, for example, the filtered weighted-sum ground force (filtered Ws-gf) can give better cross-correlated results between the vibrator's seismic energy and the seismic sensor responses and can reduce noise. - As discussed earlier, the dynamic motions related to the coupling condition and the inhomogeneous and elastic coupled
ground system 120 are recorded and embedded in the baseplate acceleration data Accbp supplied by the vibrator (30) to the recorder (90). In addition, the motion of the vibrator's actuator (e.g., hydraulic system) is recorded and embedded in the reaction mass acceleration data Accrm supplied by the vibrator (30) to the recorder (90). As noted above, the vibrator measurements Accbp and Accrm are often recorded during data acquisition as the weighted-sum ground force (Ws-gf) using the recorder (90). To obtain the required variables for the vibrator-coupledground filter 150, the dynamic motions of thecoupling system 110 and the coupledground system 120 are extracted from the baseplate and reaction mass acceleration data Accbp and Accrm as described below. -
Figure 6A shows an example frequency response for a vibrator. In this frequency response, the reaction mass acceleration AccRM is used as an input signal, and baseplate acceleration AccBP is used as output responding to the input signal based on the ground model's transfer functions described previously. Thus, the frequency response inFigure 6A is based on the following:
- In other words, the frequency response of the vibrator is analyzed with the reaction mass acceleration data as input and with the baseplate acceleration as output. The inverse could also be done so that a frequency response can be analyzed with the baseplate acceleration data as input and with the reaction mass acceleration as output. Although the frequency responses would appear different, it is understood that the frequency response analysis can generally relate the reaction mass acceleration data and the baseplate acceleration data as input and output relative to one another.
- The
magnitude plot 200A shows the magnitude ratio (dB) of AccBP to AccRM relative to frequency, and thephase plot 250A shows the phase (degrees) relative to frequency. As shown in themagnitude plot 200A, the magnitude ratio increases at asloped section 202 of about 40dB/dec as frequency increases. The magnitude ratio then reaches aturning point 204 at a resonant frequency between the baseplate (70) and the ground. Beyond thisturning point 204, the magnitude ratio flattens out to asloped section 206 of 0dB/dec. The phase in thephase plot 250A shifts from 0 degrees to -180 degrees. At theresonant frequency 254, the phase is expected to be -90 degrees. - In the frequency response, the
turning point 204 is defined by the values of Mg, Kg, and Dg in the coupled ground system (120;Figs. 3-4 ). Thesubsequent plateau section 206 is defined by the values of kc1, kc2, Dc1, and Dc2 of the coupling system (110;Figs. 3-4 ). Knowing this theoretical nature of the frequency response having reaction mass acceleration AccRM as input and baseplate acceleration AccBP as output, an actual measured frequency response from measured data can be compared to the disclosedground model 100 to derive values for Mg, Kg, Dg, kc1-2, Dc1-2 for the vibrator-coupledground filter 150. - To that end,
Figure 6B shows a measured frequency response using examplevibrator measurement data 214 compared tomodel data 212 using the disclosedground model 100. In these frequency responses, reaction mass acceleration data Accrm is again used as an input signal, and baseplate acceleration data Accbp is used as output responding to the input signal. - For the measured frequency response curves 214/254, the baseplate and reaction mass accelerations Accbp and Accrm have been measured and recorded on a standard vibrator (30) using a recorder (90). The measured frequency response curves 214/254 in
Figure 6B are then compared to model frequency response curves 212/252 generated by the model data using the disclosedground model 100. - The values for the variables (Mg, Kg, Dg) in the
ground model filter 150 are then obtained by successively modeling the measured frequency response seen in the measureddata 214. In the magnitude plot 200B, the magnitude ratio spectra of the measured and model data curves 212/214 are shown. In thephase plot 250B, the corresponding phase spectra curves 262/264 are shown. The plots 200B/250B show that the model data curves 212/262 track the measuredcurves 214/264. Based on this, it can be seen that the main dynamic motions have been captured by the disclosedground model 100, although some discrepancies are visible in these plots. - In both magnitude-ratio and phase spectra plots 200B/250B,
first regions 204/254 show the main resonance produced by the baseplate (30) and the coupledground system 110, which corresponds to flexure of the baseplate (30). In both magnitude-ratio and phase spectra plots 200B/250B, thesecond regions 206/256 illustrate the dynamic modes resulting from thecoupling system 110. - Based on this understanding of the frequency responses, values for the vibrator-coupled
ground filter 150 can be derived.Figure 7 shows aprocess 300 for deriving the vibrator-coupledground filter 150 of the present disclosure. - Initially, recorded data from a survey is obtained (Block 302). As noted above, this data includes the seismic signals obtained with the sensors (22) in the array (12) as in
Figure 3 . Likewise, this data includes the pilot signal (Tref) and the weighted-sum ground force (Ws-gf), which includes the reaction mass and baseplate accelerations Accbp and Accrm. - The acceleration data Accbp and Accrm for the reaction mass (50) and baseplate (70) are input into the transfer functions of the systems (i.e., G1(s), G2(s), and G3(s)) in the ground force model 100 (Block 304). (As noted previously, the dynamic motions related to the coupling conditions are recorded and embedded in the baseplate acceleration data AccBP. In addition, the motion of the vibrator's actuator system is recorded and embedded in the reaction mass acceleration data AccRM.)
- Useful information for the variables of the
ground model 100 is then obtained from knowledge of the frequency response (as inFigures 6A-6B ) and the transfer functions G1(s), G2(s), and G3(s) for thesystem 100. In particular, variables that describe the capturedground force system 120 are extracted from the transfer functions G1(s), G2(s), and G3(s) (Block 306). These variables include Mg, Kg, and Dg. For a given vibrator, the values for these variables are generally known and would be expected to lie within some target range. Yet, given the dynamic nature of the vibrator's operation, the values vary dynamically. Using the transfer functions G1(s), G2(s), and G3(s) and numerical analysis, the appropriate values for the variables Mg, Kg, and Dg can be derived. In particular, these variables Mg, Kg, and Dg govern thefirst turning point 204/254 in the frequency response ofFigure 6B . Using polynomial fitting, the values for these variables Mg, Kg, and Dg can then be derived from the first region of the frequency response. - Additionally, variables that describe the
coupling system 110 are extracted from the transfer functions of the system (Block 308). These variables include kc1-2 and Dc1-2. For a given vibrator, the values for these variables kc1-2 and Dc1-2 are generally known and would be expected to lie within some target range. Yet, given the dynamic nature of the vibrator's operation, the values vary dynamically. Using the transfer functions G1(s), G2(s), and G3(s) and numerical analysis, the appropriate values for the variables kc1-2 and Dc1-2 can be derived. In particular, these variables kc1-2 and Dc1-2 govern thesecond region 206/256 in the frequency response ofFigure 6B past theturning point 204/254. Using polynomial fitting, the values for these variables kc1-2 and Dc1-2 can then be derived from the second region of the frequency response for theground model 100. - At this point, the derived values for the variables Mg, Kg, Dg, kc1-2, and Dc1-2 as well as the mass of the baseplate MBP are input into transform functions to convert the transfer functions G1(s), G2(s), and G3(s) into the frequency domain. Using standard mathematical techniques, the ground model with extracted variables is then converted into the frequency domain (Block 310) so the desired vibrator-coupled
ground model filter 150 can be calculated (Block 312). -
Figure 8 shows aprocess 350 for using the vibrator-coupledground filter 150 of the present disclosure. As is typically, the array (12) and recorder (90) ofFigure 3 obtain recorded data from a survey as discussed previously (Block 352). At some point, the seismic data (92) is to be handled by the data processing system (98). To improve the subsequent imaging produced by the data processing system (98), the system filters the original seismic data (92) with the ground filter system (94) using the vibrator-coupledground filter 150 of the present disclosure (Block 354). - The improved data (96) can then be provided to the data processing system (98). In turn, the data processing system (98) can use its correlation processor to cross-correlate survey data using the filtered pilot reference signal (filtered Tref) or filtered weighted sum ground force (filtered Ws-gf) (Block 356). The system (98) can then output the cross-correlated results, which can then be used for imaging purposes (Block 358).
- As depicted in
Figure 5 , when the input 102 (either the pilot sweep Tref or the weighted-sum ground force Ws-gf) is injected into the vibrator-coupledground filter 150, it is passed through transfer functions corresponding to the vibrator'sbaseplate system 105, thecoupling system 110, and the elastic coupledground system 120. This means that the input 102 (the pilot sweep or the weighted-sum ground force) will be sequentially filtered by these systems (105, 110, 120). Theoutput 104 from the vibrator-coupledground filter 150 becomes the filtered pilot sweep (filtered Tref) or the filtered weighted-sum ground force (filtered Ws-gf), which is the expected input to the deep ground (130) by thevibrator 30. In other words, the wavelet produced by the cross-correlation function between the input 102 (pilot sweep or the weighted-sum ground force) and the output 104 (the filtered pilot sweep or the filtered weighted-sum ground force) will be indicative of an accurate wavelet that travels through thedeep ground 130. It should be in phase with the downhole wavelets except for a time shift. - To test the results, the
graph 400 inFigure 9 plots amplitudespectra 402 from six downhole geophones and theamplitude spectrum 404 from a filtered pilot sweep (filtered Tref). Thedownhole geophone spectra 402 have been recorded using a standard vibrator driven by a linear sweep from 2 Hz to 160 Hz in 20 seconds. This linear sweep (pilot sweep) has been recorded as well. Thedownhole geophone spectra 402 plotted inFigure 9 are selected in 200 ft (60.96 m) intervals from 200 ft (60.96 m) to 1000 ft (304.8 m). - The filtered
pilot sweep spectrum 404 is obtained by passing the pilot sweep through the vibrator-coupledground filter 150. It is observed that theamplitude spectrum 404 of the filtered pilot sweep (filtered Tref) matches very well with theamplitude spectra 402 from six downhole geophones. This indicates that the filtered pilot sweep (filtered Tref) is in the downgoing wavelet. Furthermore, the vibrator-coupledground filter 150 does appear to accurately describe the filtering effects caused by the vibrator (30), the coupling condition between the baseplate (70) and the coupled ground, and the coupled ground system (120). - The
plot 410 inFigure 10 provides another example and shows a comparison of twowavelets 412/414. Onewavelet 414 is produced by the cross-correlation between an original pilot sweep and the 1000 ft (304.8 m) downhole geophone data. Compensation for time delay of thiswavelet 414 is made to provide a better comparison. Theother wavelet 412 is the result of the cross-correlation function between the pilot sweep (Tref) and the filtered pilot sweep (filtered Tref), which is labeled as the Vibrator-CoupledGround Model data 412 inFigure 10 . The twowavelets 412/414 match very well. The similarity of twowavelets 412/414 further confirms that the vibrator-coupledground model 100 of the present disclosure is a reasonable model and each sub-model 110, 120, etc. can be used to represent its own system. - Standard Vibroseis theory indicates that far-field particle velocity is proportional to a time differential of a true ground force. Again, this theory is built on an assumption that the ground can be treated as an isotropic homogeneous elastic body. As demonstrated above, the deep ground can be assumed to be a relatively homogeneous and
elastic body 130, at least in the P-wave direction. However, the coupledground system 120 ofFigures 4-5 is definitely not a homogeneous body. Therefore, standard Vibroseis theory should be modified slightly to allow for the more realistic situation. The far-field particle velocity is proportional to the input of thedeep ground 130, which is theoutput 104 of the pilot sweep (Tref) or the weighted-sum ground force (Ws-gf) after it has passed through the vibrator-coupledground model filter 150. -
Figures 11A-11B depict comparisons of wavelets generated by using the derivative of the pilot sweep (Tref) as well as the filtered pilot sweep (filtered Tref). Inplot 420 ofFig. 11A ,wavelets 422/424 were obtained using the standard vibrator modeling. Inplot 430 ofFig. 11B ,wavelets 432/434 were obtained from the modified vibrator modeling of the present disclosure.Curves 422/432 are produced by cross-correlating the derivatives of the pilot sweeps (Tref) with the 1000-ft (304.8 m) downhole geophone traces. Thecurves 424/434 are results of the cross-correlation function between the filtered pilot sweeps (filtered Tref) and the 1000-ft (304.8 m) downhole geophone traces.Figures 11A-11B clearly demonstrates that the zero-phase wavelets can be obtained when the filtered pilot sweep (filtered Tref) was cross-correlated to the downhole geophone data. -
Figures 12A-12B depict another representative example to show that the Vibrator-CoupledGround Model 100 can describe the filtering effects seen in a Vibroseis wavelet caused by the vibrator-coupled ground system. Theseplots 440/450 depict the wavelets obtained by using the derivative of the weighted-sum ground force (Ws-gf) as well as the filtered weighted-sum ground force (filtered Ws-gf). In theplot 440 ofFig. 12A , thewavelets 442/444 are generated using the standard vibrator modeling. In theplot 450 ofFig. 12B , thewavelets 452/454 are produced by using the modified vibrator modeling. Once again, thewavelets 442/452 are produced when the derivatives of the weighted-sum ground force (Ws-gf) was cross-correlated with the 1000-ft (304.8 m) downhole geophone traces. Theother wavelets 444/454 are resulted from the cross-correlation of the filtered weighted-sum ground force (filtered Ws-gf) with the 1000-ft (304.8 m) downhole geophone traces. -
Figures 12A-12B show that the zero-phase wavelets can be obtained when the filtered weighted-sum ground force (filtered Ws-gf) was used to cross-correlate to the downhole geophone data. It can be observed that the wavelets inFigures 12A-12B delay slightly comparing to the wavelets inFigures 11A-11B . This tiny time-delay is due to the phase error between the pilot sweep (Tref) and the weighted-sum ground force (Ws-gf). - To prove the validity of the vibrator-coupled
ground model 100 shown inFigure 4 and determine the robustness of the vibrator-coupledground filter 150 shown inFigure 5 , another experimental test was performed in a completely different area from the downhole geophone site.Figure 13 shows anamplitude spectrum 460 comparing data recorded in an experimental test using a standard vibrator modeling. Thecurve 462 is produced from a surface geophone that was placed 1-m apart from the vibrator baseplate (70). Thecurve 462 represents the velocity power spectrum of particles where the surface geophone is located. Thespectrum 460 was computed after geophone response removal. - Because the baseplate accelerometer is mounted on the top cross of the baseplate stilt structure, the signal recorded by the baseplate accelerometer needs to physically pass through the baseplate (70), the coupling system (110), and the coupled ground system (120) in order to connect with any nodes in the coupled ground system (120). Additionally, because the surface geophone records the particle velocity, it makes more sense to convert the baseplate acceleration into the baseplate velocity. Therefore, the
other curve 464 is calculated from the data output from the vibrator-coupledground filter 150 where the input to thefilter 150 is the baseplate velocity, which is obtained by integrating the baseplate acceleration. - As can be seen, the
curve 464 in theamplitude spectrum 460 obtained by utilizing the baseplate acceleration matches closely with the amplitude spectrum produced by using the surface geophone trace.Figure 13 indicates that the vibrator-coupledground model 100 can simulate the filtering effects caused by the baseplate (70) and its vicinity. Moreover, it demonstrates that the coupled ground is a part of the source. - Portions of the present disclosure may be implemented in terms of logic, software, or code typically encoded on a variety of media including, but not limited to, computer-readable media, machine-readable media, program storage media, or computer program product. Such media may be handled, read, sensed, and/or interpreted by a computing device having a processor. Those skilled in the art will appreciate that such media may take various forms such as cards, tapes, magnetic disks (e.g., floppy disk or hard drive) and optical disks (e.g., compact disk read only memory ("CD-ROM") or digital versatile disc ("DVD")). It should be understood that the given implementations are illustrative only and shall not limit the present disclosure.
- For example,
Figure 14 shows a geophysicalinformation processing system 500 that can be used in accordance with the present disclosure. Geophysical information may be received by the geophysicalinformation processing system 500 after being gathered by a geophysical information collector such as the collector orrecorder 90 as described above and shown inFigure 3 . Theinformation collector 90 can include one or more or any combination of the components shown inFigure 14 . In one example, the geophysicalinformation processing system 500 may include one or more processing devices, such as acomputer 520 with astorage device 510. Thecomputer 500 can be, but is not limited to, a laptop computer, a desktop computer, a mainframe, or the like. Thecomputer 520 may be in communication with thestorage device 510 via any known interface and an interface for entering information into thecomputer 520 may be any acceptable interface. For example, the interface may include the use of anetwork interface 530. - The
storage device 510 can be any useful storage device having a computer-readable media. Instructions for carrying out methods described herein may be stored on computer-readable media in thecomputer 520 or may be stored on an external storage device. - Imaging, as used herein includes any representation of a subsurface structure including, but not limited to, graphical representations, mathematical or numerical representation, strip charts or any other process output representative of the subsurface structure. Geophysical information as used herein means information relating to the location, shape, extent, depth, content, type, properties, and/or number of geologic bodies. Geophysical information includes, but is not necessarily limited to marine and land seismic information. Seismic information includes, but is not limited to, one or more or any combination of the following, analog signals, digital signals, recorded data, data structures, database information, parameters relating to surface geology, source type, source location, receiver location, receiver type, time of source activation, source duration, source frequency, energy amplitude, energy phase, energy frequency, wave acceleration, wave velocity and/or wave direction.
- Seismic information may be gathered using sensors monitoring seismic activities using, for example, a system as described above and shown in
Figure 3 . The seismic activities result from active energy sources, including vibrator devices. The sensors can include geophones, accelerometers, pressure sensors, single component sensors, and/or multi-component sensors. - The foregoing description of preferred and other embodiments is not intended to limit or restrict the scope or applicability of the inventive concepts conceived of by the Applicants. It will be appreciated with the benefit of the present disclosure that features described above in accordance with any embodiment or aspect of the disclosed subject matter can be utilized, either alone or in combination, with any other described feature, in any other embodiment or aspect of the disclosed subject matter.
- In exchange for disclosing the inventive concepts contained herein, the Applicants desire all patent rights afforded by the appended claims. Therefore, it is intended that the appended claims include all modifications and alterations to the full extent that they come within the scope of the following claims.
Claims (15)
- A seismic data processing method, comprising:imparting acoustic energy into the ground with a seismic source (30) including a vibrator provided with a reaction mass (50) and a baseplate (70);obtaining reaction mass acceleration data of the source (30) of seismic energy;obtaining baseplate acceleration data of the source (30);obtaining seismic data of one or more seismic sensors (22) responsive to the seismic energy of the source (30);defining a ground model (100), said ground model (100) including a set of variables;deriving a transfer function from the ground model (100):deriving said variables included in the ground model (100) by analyzing a frequency response for the vibrator based on the ground model's transfer function, the frequency response relating the reaction mass acceleration data and the baseplate acceleration data as input and output relative to one another;filtering a source signal configured to operate said seismic source (30) using the transfer function derived from the ground model (100) with the derived values for the variables; andmaking the filtered source signal available for processing with the seismic data of the one or more seismic sensors (22),the processing method characterized in that the ground model (100) defines the coupling between the vibrator and the ground on which the vibrator is placed and the ground model variables describe said coupling.
- A method as claimed in claim 1, wherein obtaining the reaction mass acceleration data comprises obtaining readings of an accelerometer associated with a reaction mass (50) of the source (30), and wherein obtaining the baseplate acceleration data comprises obtaining reading of an accelerometer associated with a baseplate (70) of the source (30).
- A method as claimed in claim 1 or 2, wherein obtaining the reaction mass (50) and baseplate acceleration data comprises receiving the reaction mass (50) and baseplate acceleration data from a recorder associated with the source (30), and wherein obtaining the seismic data of one or more seismic sensors (22) comprises receiving the seismic data from a recorder associated with the one or more seismic sensors (22).
- A method as claimed in claim 1, 2 or 3, wherein deriving the variables for the ground model (100) comprises deriving a mass, a viscosity, and a stiffness of captured ground of the ground model (100) based on a resonant frequency indicated by the frequency response.
- A method as claimed in any preceding claim, wherein filtering the source signal comprises filtering a weighted sum ground force for the source (30).
- A method as claimed in claim 5, wherein the weighted sum ground force comprises a first force summed with a second force, the first force defined by a mass of a reaction mass (50) of the source (30) times the reaction mass acceleration data, the second force defined by a mass of a baseplate (70) of the source (30) times the baseplate acceleration data.
- A method as claimed in any of claims 1-4, wherein filtering the source signal comprises filtering a pilot signal for the source (30).
- A method as claimed in any preceding claim, further comprising correlating the seismic data with the filtered source signal.
- A method as claimed in any preceding claim, wherein deriving the variables for the ground model (100) comprises modeling a baseplate system of the source in the ground model (100) with a first transform function based on a mass value Mbp of a baseplate (70) of the source, a damper value Dc representative of a viscosity of a surface medium, and a stiffness value Kc representative of a contact stiffness of the ground model (100), and the first transform function is optionally of the form:

- A method as claimed in any preceding claim, wherein deriving the variables for the ground model (100) comprises modeling a coupling system of the source in the ground model (100) with a second transform function based on a dampening value Dc representative of a viscosity of a surface medium and a stiffness value Kc representative of a contact stiffness of the coupling system, and the second transform function is optionally of the form:

- A method as claimed in any preceding claim, wherein deriving the variables for the ground model (100) comprises modeling a coupled ground system of the source in the ground model (100) with a third transform function based on a mass value Mg of captured ground, a dampening value Dg representative of a contact viscosity of the captured ground, and a stiffness value Kg representative of a contact stiffness of the captured ground, and the third transform function is optionally of the form:

- A method as claimed in any preceding claim, wherein deriving the variables for the ground model (100) by analyzing the frequency response relating the reaction mass acceleration data and the baseplate acceleration data as input and output relative to one another comprises applying curve fitting to a first region of the frequency response below a resonant frequency of a baseplate (70) and the ground to derive a mass value Mg representative of a mass of captured ground in the ground model (100), a stiffness value Kg representative of a contact stiffness of the captured ground, and a dampening value Dg representative of a contact viscosity of the captured ground.
- A method as claimed in any preceding claim, wherein deriving the variables for the ground model (100) by analyzing the frequency response relating the reaction mass acceleration data and the baseplate acceleration data as input and output relative to one another comprises applying curve fitting to a second region of the frequency response above a resonant frequency of a baseplate (70) of the source and the ground to derive a dampening value Dc representative of a viscosity of a surface medium and a stiffness value Kc representative of a contact stiffness.
- A seismic data processing apparatus, comprising:a seismic source (30) configured to impart acoustic energy into the ground, wherein said seismic source (30) includes a vibrator comprising a reaction mass (50) and a baseplate (70);memory storing a ground model, said ground model including a set of variables and a transfer function, a source signal configured to operate said seismic source, reaction mass acceleration data of the source (30), baseplate acceleration data of the source (30), and seismic data of one or more seismic sensors (22) responsive to the seismic energy of the source (30); andone or more processing units operatively coupled to the memory and configured to:analyze a frequency response for the vibrator based on the ground model's transfer function, the frequency response relating the reaction mass acceleration data and the baseplate acceleration data as input and output relative to one another,derive said variables included in the ground model (100) based on the analyzed frequency response,filter the source signal using the transfer function derived from the ground model (100) with the derived values for the variables, andmake the filtered source signal available for processing with derived values for the seismic data,the apparatus characterized in that the ground model (100) defines the coupling between the vibrator and the ground on which the vibrator is placed and the ground model (100) variables describe said coupling.
- Apparatus as claimed in claim 14, wherein the one or more processing units is operable to correlate the seismic data with the filtered source signal.
Applications Claiming Priority (2)
| Application Number | Priority Date | Filing Date | Title |
|---|---|---|---|
| US39310610P | 2010-10-14 | 2010-10-14 | |
| PCT/US2011/056409 WO2012051561A2 (en) | 2010-10-14 | 2011-10-14 | Seismic data filtering based on vibrator-coupled ground model |
Publications (3)
| Publication Number | Publication Date |
|---|---|
| EP2628023A2 EP2628023A2 (en) | 2013-08-21 |
| EP2628023A4 EP2628023A4 (en) | 2016-08-31 |
| EP2628023B1 true EP2628023B1 (en) | 2019-12-04 |
Family
ID=45939011
Family Applications (1)
| Application Number | Title | Priority Date | Filing Date |
|---|---|---|---|
| EP11833508.2A Active EP2628023B1 (en) | 2010-10-14 | 2011-10-14 | Seismic data filtering based on vibrator-coupled ground model |
Country Status (5)
| Country | Link |
|---|---|
| US (1) | US8909480B2 (en) |
| EP (1) | EP2628023B1 (en) |
| CN (1) | CN103238087B (en) |
| CA (1) | CA2813782A1 (en) |
| WO (1) | WO2012051561A2 (en) |
Families Citing this family (16)
| Publication number | Priority date | Publication date | Assignee | Title |
|---|---|---|---|---|
| US20120075955A1 (en) * | 2010-09-28 | 2012-03-29 | Timothy Dean | Efficient seismic source operation in connection with a seismic survey |
| US20130201793A1 (en) * | 2012-01-13 | 2013-08-08 | Spencer Lewis Rowse | Vibrator source system for improved seismic imaging |
| US9217798B2 (en) * | 2012-04-30 | 2015-12-22 | Conocophillips Company | Constant energy displacements |
| WO2014110565A1 (en) * | 2013-01-14 | 2014-07-17 | Inova Ltd. | Method of optimizing seismic vibrator output force |
| US9217797B2 (en) | 2013-04-11 | 2015-12-22 | Schlumberger Technology Corporation | High-speed image monitoring of baseplate movement in a vibrator |
| WO2014196858A1 (en) * | 2013-06-04 | 2014-12-11 | Mi-Partners Bv | Seismic shaker |
| WO2015101643A1 (en) * | 2013-12-30 | 2015-07-09 | Pgs Geophysical As | Control system for marine vibrators |
| US10488542B2 (en) | 2014-12-02 | 2019-11-26 | Pgs Geophysical As | Use of external driver to energize a seismic source |
| US20190250289A1 (en) * | 2016-08-05 | 2019-08-15 | Inovaltd. | Novel system and related methods for performing seismic surveys |
| MX367617B (en) * | 2016-10-14 | 2019-08-26 | Andres Pech Perez | Method and system for the detection and characterisation of waves induced by the flow of fluids, atomic particle flows, fracture propagation and geological fault activation. |
| US10288755B2 (en) | 2017-03-28 | 2019-05-14 | Saudi Arabian Oil Company | Seismic processing workflow for broadband single-sensor single-source land seismic data |
| CN108425983B (en) * | 2018-04-08 | 2024-03-29 | 天津大学 | Rigidity damping adjustable boundary system suitable for multipoint earthquake motion test of vibrating table |
| CN110907992B (en) * | 2019-12-05 | 2021-07-30 | 中国石油化工集团有限公司 | Surface physical property distinguishing method based on vibroseis vibration induction |
| US11703607B2 (en) | 2020-06-15 | 2023-07-18 | Saudi Arabian Oil Company | Determining a seismic quality factor for subsurface formations from a seismic source to a first VSP downhole receiver |
| CN112305604A (en) * | 2020-07-24 | 2021-02-02 | 中国石油化工集团有限公司 | Near-surface physical property distinguishing method under controllable seismic source combined excitation condition |
| CN113049202B (en) * | 2021-03-08 | 2022-07-12 | 中国地震局工程力学研究所 | Local weighted regression correction method and system for acceleration integral displacement |
Family Cites Families (13)
| Publication number | Priority date | Publication date | Assignee | Title |
|---|---|---|---|---|
| FR1355517A (en) | 1961-12-30 | 1964-03-20 | Inst Francais Du Petrole | Servo system for vibrators |
| GB2190746B (en) * | 1986-03-24 | 1990-06-13 | Bird James Mckenna | Improvements in or relating to methods of collecting data and seismic vibrators |
| US4750157A (en) * | 1987-05-06 | 1988-06-07 | Standard Oil Production Company | Seismic vibrator earth impedance determination and compensation system |
| CA2277119C (en) * | 1997-11-14 | 2003-06-03 | Western Atlas International, Inc. | Seismic data acquisition and processing using non-linear distortion in a groundforce signal |
| US7206709B2 (en) * | 2003-05-29 | 2007-04-17 | Carnegie Mellon University | Determination of damping in bladed disk systems using the fundamental mistuning model |
| US7107159B2 (en) | 2004-03-29 | 2006-09-12 | Peter Thomas German | Systems and methods to determine elastic properties of materials |
| US7225662B2 (en) * | 2004-08-27 | 2007-06-05 | Schlumberger Technology Corporation | Geophone calibration technique |
| KR20130025951A (en) * | 2005-09-19 | 2013-03-12 | 마이크로 모우션, 인코포레이티드 | Meter electronics and methods for verification diagnostics for a flow meter |
| US7327633B2 (en) | 2005-12-12 | 2008-02-05 | Westerneco L.L.C. | Systems and methods for enhancing low-frequency content in vibroseis acquisition |
| EP1999489B1 (en) | 2006-03-27 | 2013-12-25 | INOVA Ltd. | Apparatus and method for generating a seismic source signal |
| US7539079B2 (en) * | 2006-03-29 | 2009-05-26 | Pgs Geophysical As | System and method for determining positions of towed marine source-array elements |
| US20080201089A1 (en) * | 2007-01-11 | 2008-08-21 | Ensco, Inc. | System and method for determining neutral temperature of a metal |
| US8061471B2 (en) | 2009-05-01 | 2011-11-22 | INOVA, Ltd. | Seismic vibrator controlled by directly detecting base plate motion |
-
2011
- 2011-10-14 EP EP11833508.2A patent/EP2628023B1/en active Active
- 2011-10-14 CN CN201180055874.1A patent/CN103238087B/en not_active Expired - Fee Related
- 2011-10-14 CA CA2813782A patent/CA2813782A1/en not_active Abandoned
- 2011-10-14 WO PCT/US2011/056409 patent/WO2012051561A2/en active Application Filing
- 2011-10-14 US US13/273,997 patent/US8909480B2/en active Active
Non-Patent Citations (1)
| Title |
|---|
| None * |
Also Published As
| Publication number | Publication date |
|---|---|
| WO2012051561A2 (en) | 2012-04-19 |
| WO2012051561A3 (en) | 2012-07-26 |
| US8909480B2 (en) | 2014-12-09 |
| US20120271551A1 (en) | 2012-10-25 |
| EP2628023A2 (en) | 2013-08-21 |
| CN103238087A (en) | 2013-08-07 |
| EP2628023A4 (en) | 2016-08-31 |
| CA2813782A1 (en) | 2012-04-19 |
| CN103238087B (en) | 2016-05-04 |
Similar Documents
| Publication | Publication Date | Title |
|---|---|---|
| EP2628023B1 (en) | Seismic data filtering based on vibrator-coupled ground model | |
| US11428834B2 (en) | Processes and systems for generating a high-resolution velocity model of a subterranean formation using iterative full-waveform inversion | |
| US11016211B2 (en) | 4D time shift and amplitude joint inversion for obtaining quantitative saturation and pressure separation | |
| Gélis et al. | Numerical modeling of surface waves over shallow cavities | |
| JP5379163B2 (en) | Spectral shaping inversion and migration of seismic data | |
| RU2523734C2 (en) | Seismic data collection system and method | |
| EP3602136B1 (en) | Amplitude compensation of reverse time migration (rtm) gathers for avo/ava analysis | |
| CA2718917C (en) | Method for imaging the earth's subsurface using passive seismic sensing | |
| AU2022202557A1 (en) | Surface wave tomography using sparse data acquisition | |
| US20210103065A1 (en) | Determining properties of a subterranean formation using an acoustic wave equation with a reflectivity parameterization | |
| EP2756333B1 (en) | Seismic frequency sweep enhancement | |
| Zhang et al. | Retrieval of shallow S-wave profiles from seismic reflection surveying and traffic-induced noise | |
| CN111025386A (en) | Vertical and horizontal wave separation method without separation false image | |
| Wei et al. | Break through the limits of vibroseis data quality | |
| US20080232195A1 (en) | Apparatus and Method for Processing Geophysical Information | |
| EP2722689B1 (en) | Seismic source and method for single sweep intermodulation mitigation | |
| EP2722690A2 (en) | Seismic source and method for intermodulation mitigation | |
| Wei | The vibrator-ground model and the vibroseis source wavelet | |
| Hailemikael et al. | From ambient vibration data analysis to 1D ground-motion prediction of the Mj 5.9 and the Mj 6.5 Kumamoto earthquakes in the Kumamoto alluvial plain, Japan | |
| Song | Locating Petroleum Sources Using Dsp Techniques | |
| Hu et al. | Quantitative FWI characterization of reservoir properties at the CMC Newell County Facility | |
| Luo et al. | Application of high-resolution linear Radon transform for Rayleigh-wave dispersive energy imaging and mode separating |
Legal Events
| Date | Code | Title | Description |
|---|---|---|---|
| PUAI | Public reference made under article 153(3) epc to a published international application that has entered the european phase |
Free format text: ORIGINAL CODE: 0009012 |
|
| 17P | Request for examination filed |
Effective date: 20130418 |
|
| AK | Designated contracting states |
Kind code of ref document: A2 Designated state(s): AL AT BE BG CH CY CZ DE DK EE ES FI FR GB GR HR HU IE IS IT LI LT LU LV MC MK MT NL NO PL PT RO RS SE SI SK SM TR |
|
| DAX | Request for extension of the european patent (deleted) | ||
| A4 | Supplementary search report drawn up and despatched |
Effective date: 20160803 |
|
| RIC1 | Information provided on ipc code assigned before grant |
Ipc: G01V 1/28 20060101ALI20160728BHEP Ipc: G01V 1/37 20060101ALI20160728BHEP Ipc: G01V 1/00 20060101AFI20160728BHEP Ipc: G01V 1/047 20060101ALI20160728BHEP Ipc: G01V 1/36 20060101ALI20160728BHEP |
|
| GRAP | Despatch of communication of intention to grant a patent |
Free format text: ORIGINAL CODE: EPIDOSNIGR1 |
|
| STAA | Information on the status of an ep patent application or granted ep patent |
Free format text: STATUS: GRANT OF PATENT IS INTENDED |
|
| INTG | Intention to grant announced |
Effective date: 20190103 |
|
| GRAJ | Information related to disapproval of communication of intention to grant by the applicant or resumption of examination proceedings by the epo deleted |
Free format text: ORIGINAL CODE: EPIDOSDIGR1 |
|
| STAA | Information on the status of an ep patent application or granted ep patent |
Free format text: STATUS: REQUEST FOR EXAMINATION WAS MADE |
|
| GRAP | Despatch of communication of intention to grant a patent |
Free format text: ORIGINAL CODE: EPIDOSNIGR1 |
|
| STAA | Information on the status of an ep patent application or granted ep patent |
Free format text: STATUS: GRANT OF PATENT IS INTENDED |
|
| INTC | Intention to grant announced (deleted) | ||
| INTG | Intention to grant announced |
Effective date: 20190614 |
|
| RIN1 | Information on inventor provided before grant (corrected) |
Inventor name: WEI, ZHOUHONG Inventor name: PHILLIPS, THOMAS |
|
| GRAS | Grant fee paid |
Free format text: ORIGINAL CODE: EPIDOSNIGR3 |
|
| GRAA | (expected) grant |
Free format text: ORIGINAL CODE: 0009210 |
|
| STAA | Information on the status of an ep patent application or granted ep patent |
Free format text: STATUS: THE PATENT HAS BEEN GRANTED |
|
| AK | Designated contracting states |
Kind code of ref document: B1 Designated state(s): AL AT BE BG CH CY CZ DE DK EE ES FI FR GB GR HR HU IE IS IT LI LT LU LV MC MK MT NL NO PL PT RO RS SE SI SK SM TR |
|
| REG | Reference to a national code |
Ref country code: GB Ref legal event code: FG4D |
|
| REG | Reference to a national code |
Ref country code: CH Ref legal event code: EP |
|
| REG | Reference to a national code |
Ref country code: AT Ref legal event code: REF Ref document number: 1210082 Country of ref document: AT Kind code of ref document: T Effective date: 20191215 |
|
| REG | Reference to a national code |
Ref country code: DE Ref legal event code: R096 Ref document number: 602011063840 Country of ref document: DE |
|
| REG | Reference to a national code |
Ref country code: IE Ref legal event code: FG4D |
|
| REG | Reference to a national code |
Ref country code: NL Ref legal event code: MP Effective date: 20191204 |
|
| REG | Reference to a national code |
Ref country code: LT Ref legal event code: MG4D |
|
| PG25 | Lapsed in a contracting state [announced via postgrant information from national office to epo] |
Ref country code: ES Free format text: LAPSE BECAUSE OF FAILURE TO SUBMIT A TRANSLATION OF THE DESCRIPTION OR TO PAY THE FEE WITHIN THE PRESCRIBED TIME-LIMIT Effective date: 20191204 Ref country code: LT Free format text: LAPSE BECAUSE OF FAILURE TO SUBMIT A TRANSLATION OF THE DESCRIPTION OR TO PAY THE FEE WITHIN THE PRESCRIBED TIME-LIMIT Effective date: 20191204 Ref country code: SE Free format text: LAPSE BECAUSE OF FAILURE TO SUBMIT A TRANSLATION OF THE DESCRIPTION OR TO PAY THE FEE WITHIN THE PRESCRIBED TIME-LIMIT Effective date: 20191204 Ref country code: LV Free format text: LAPSE BECAUSE OF FAILURE TO SUBMIT A TRANSLATION OF THE DESCRIPTION OR TO PAY THE FEE WITHIN THE PRESCRIBED TIME-LIMIT Effective date: 20191204 Ref country code: GR Free format text: LAPSE BECAUSE OF FAILURE TO SUBMIT A TRANSLATION OF THE DESCRIPTION OR TO PAY THE FEE WITHIN THE PRESCRIBED TIME-LIMIT Effective date: 20200305 Ref country code: NO Free format text: LAPSE BECAUSE OF FAILURE TO SUBMIT A TRANSLATION OF THE DESCRIPTION OR TO PAY THE FEE WITHIN THE PRESCRIBED TIME-LIMIT Effective date: 20200304 Ref country code: BG Free format text: LAPSE BECAUSE OF FAILURE TO SUBMIT A TRANSLATION OF THE DESCRIPTION OR TO PAY THE FEE WITHIN THE PRESCRIBED TIME-LIMIT Effective date: 20200304 Ref country code: FI Free format text: LAPSE BECAUSE OF FAILURE TO SUBMIT A TRANSLATION OF THE DESCRIPTION OR TO PAY THE FEE WITHIN THE PRESCRIBED TIME-LIMIT Effective date: 20191204 |
|
| PG25 | Lapsed in a contracting state [announced via postgrant information from national office to epo] |
Ref country code: RS Free format text: LAPSE BECAUSE OF FAILURE TO SUBMIT A TRANSLATION OF THE DESCRIPTION OR TO PAY THE FEE WITHIN THE PRESCRIBED TIME-LIMIT Effective date: 20191204 Ref country code: HR Free format text: LAPSE BECAUSE OF FAILURE TO SUBMIT A TRANSLATION OF THE DESCRIPTION OR TO PAY THE FEE WITHIN THE PRESCRIBED TIME-LIMIT Effective date: 20191204 |
|
| PG25 | Lapsed in a contracting state [announced via postgrant information from national office to epo] |
Ref country code: AL Free format text: LAPSE BECAUSE OF FAILURE TO SUBMIT A TRANSLATION OF THE DESCRIPTION OR TO PAY THE FEE WITHIN THE PRESCRIBED TIME-LIMIT Effective date: 20191204 |
|
| PG25 | Lapsed in a contracting state [announced via postgrant information from national office to epo] |
Ref country code: EE Free format text: LAPSE BECAUSE OF FAILURE TO SUBMIT A TRANSLATION OF THE DESCRIPTION OR TO PAY THE FEE WITHIN THE PRESCRIBED TIME-LIMIT Effective date: 20191204 Ref country code: PT Free format text: LAPSE BECAUSE OF FAILURE TO SUBMIT A TRANSLATION OF THE DESCRIPTION OR TO PAY THE FEE WITHIN THE PRESCRIBED TIME-LIMIT Effective date: 20200429 Ref country code: CZ Free format text: LAPSE BECAUSE OF FAILURE TO SUBMIT A TRANSLATION OF THE DESCRIPTION OR TO PAY THE FEE WITHIN THE PRESCRIBED TIME-LIMIT Effective date: 20191204 Ref country code: NL Free format text: LAPSE BECAUSE OF FAILURE TO SUBMIT A TRANSLATION OF THE DESCRIPTION OR TO PAY THE FEE WITHIN THE PRESCRIBED TIME-LIMIT Effective date: 20191204 Ref country code: RO Free format text: LAPSE BECAUSE OF FAILURE TO SUBMIT A TRANSLATION OF THE DESCRIPTION OR TO PAY THE FEE WITHIN THE PRESCRIBED TIME-LIMIT Effective date: 20191204 |
|
| PG25 | Lapsed in a contracting state [announced via postgrant information from national office to epo] |
Ref country code: SM Free format text: LAPSE BECAUSE OF FAILURE TO SUBMIT A TRANSLATION OF THE DESCRIPTION OR TO PAY THE FEE WITHIN THE PRESCRIBED TIME-LIMIT Effective date: 20191204 Ref country code: IS Free format text: LAPSE BECAUSE OF FAILURE TO SUBMIT A TRANSLATION OF THE DESCRIPTION OR TO PAY THE FEE WITHIN THE PRESCRIBED TIME-LIMIT Effective date: 20200404 Ref country code: SK Free format text: LAPSE BECAUSE OF FAILURE TO SUBMIT A TRANSLATION OF THE DESCRIPTION OR TO PAY THE FEE WITHIN THE PRESCRIBED TIME-LIMIT Effective date: 20191204 |
|
| REG | Reference to a national code |
Ref country code: DE Ref legal event code: R097 Ref document number: 602011063840 Country of ref document: DE |
|
| REG | Reference to a national code |
Ref country code: AT Ref legal event code: MK05 Ref document number: 1210082 Country of ref document: AT Kind code of ref document: T Effective date: 20191204 |
|
| PLBE | No opposition filed within time limit |
Free format text: ORIGINAL CODE: 0009261 |
|
| STAA | Information on the status of an ep patent application or granted ep patent |
Free format text: STATUS: NO OPPOSITION FILED WITHIN TIME LIMIT |
|
| PG25 | Lapsed in a contracting state [announced via postgrant information from national office to epo] |
Ref country code: DK Free format text: LAPSE BECAUSE OF FAILURE TO SUBMIT A TRANSLATION OF THE DESCRIPTION OR TO PAY THE FEE WITHIN THE PRESCRIBED TIME-LIMIT Effective date: 20191204 |
|
| 26N | No opposition filed |
Effective date: 20200907 |
|
| PG25 | Lapsed in a contracting state [announced via postgrant information from national office to epo] |
Ref country code: PL Free format text: LAPSE BECAUSE OF FAILURE TO SUBMIT A TRANSLATION OF THE DESCRIPTION OR TO PAY THE FEE WITHIN THE PRESCRIBED TIME-LIMIT Effective date: 20191204 Ref country code: SI Free format text: LAPSE BECAUSE OF FAILURE TO SUBMIT A TRANSLATION OF THE DESCRIPTION OR TO PAY THE FEE WITHIN THE PRESCRIBED TIME-LIMIT Effective date: 20191204 Ref country code: AT Free format text: LAPSE BECAUSE OF FAILURE TO SUBMIT A TRANSLATION OF THE DESCRIPTION OR TO PAY THE FEE WITHIN THE PRESCRIBED TIME-LIMIT Effective date: 20191204 |
|
| PG25 | Lapsed in a contracting state [announced via postgrant information from national office to epo] |
Ref country code: IT Free format text: LAPSE BECAUSE OF FAILURE TO SUBMIT A TRANSLATION OF THE DESCRIPTION OR TO PAY THE FEE WITHIN THE PRESCRIBED TIME-LIMIT Effective date: 20191204 |
|
| REG | Reference to a national code |
Ref country code: CH Ref legal event code: PL |
|
| PG25 | Lapsed in a contracting state [announced via postgrant information from national office to epo] |
Ref country code: MC Free format text: LAPSE BECAUSE OF FAILURE TO SUBMIT A TRANSLATION OF THE DESCRIPTION OR TO PAY THE FEE WITHIN THE PRESCRIBED TIME-LIMIT Effective date: 20191204 Ref country code: LU Free format text: LAPSE BECAUSE OF NON-PAYMENT OF DUE FEES Effective date: 20201014 |
|
| REG | Reference to a national code |
Ref country code: BE Ref legal event code: MM Effective date: 20201031 |
|
| PG25 | Lapsed in a contracting state [announced via postgrant information from national office to epo] |
Ref country code: LI Free format text: LAPSE BECAUSE OF NON-PAYMENT OF DUE FEES Effective date: 20201031 Ref country code: CH Free format text: LAPSE BECAUSE OF NON-PAYMENT OF DUE FEES Effective date: 20201031 Ref country code: BE Free format text: LAPSE BECAUSE OF NON-PAYMENT OF DUE FEES Effective date: 20201031 |
|
| PG25 | Lapsed in a contracting state [announced via postgrant information from national office to epo] |
Ref country code: IE Free format text: LAPSE BECAUSE OF NON-PAYMENT OF DUE FEES Effective date: 20201014 |
|
| PG25 | Lapsed in a contracting state [announced via postgrant information from national office to epo] |
Ref country code: TR Free format text: LAPSE BECAUSE OF FAILURE TO SUBMIT A TRANSLATION OF THE DESCRIPTION OR TO PAY THE FEE WITHIN THE PRESCRIBED TIME-LIMIT Effective date: 20191204 Ref country code: MT Free format text: LAPSE BECAUSE OF FAILURE TO SUBMIT A TRANSLATION OF THE DESCRIPTION OR TO PAY THE FEE WITHIN THE PRESCRIBED TIME-LIMIT Effective date: 20191204 Ref country code: CY Free format text: LAPSE BECAUSE OF FAILURE TO SUBMIT A TRANSLATION OF THE DESCRIPTION OR TO PAY THE FEE WITHIN THE PRESCRIBED TIME-LIMIT Effective date: 20191204 |
|
| PG25 | Lapsed in a contracting state [announced via postgrant information from national office to epo] |
Ref country code: MK Free format text: LAPSE BECAUSE OF FAILURE TO SUBMIT A TRANSLATION OF THE DESCRIPTION OR TO PAY THE FEE WITHIN THE PRESCRIBED TIME-LIMIT Effective date: 20191204 |
|
| PGFP | Annual fee paid to national office [announced via postgrant information from national office to epo] |
Ref country code: GB Payment date: 20230831 Year of fee payment: 13 |
|
| PGFP | Annual fee paid to national office [announced via postgrant information from national office to epo] |
Ref country code: FR Payment date: 20230911 Year of fee payment: 13 |
|
| PGFP | Annual fee paid to national office [announced via postgrant information from national office to epo] |
Ref country code: DE Payment date: 20230830 Year of fee payment: 13 |