EP2610780A2 - Method of detecting visual stress and photosensitive epilepsy triggers in video and mitigation device - Google Patents
Method of detecting visual stress and photosensitive epilepsy triggers in video and mitigation device Download PDFInfo
- Publication number
- EP2610780A2 EP2610780A2 EP12198658.2A EP12198658A EP2610780A2 EP 2610780 A2 EP2610780 A2 EP 2610780A2 EP 12198658 A EP12198658 A EP 12198658A EP 2610780 A2 EP2610780 A2 EP 2610780A2
- Authority
- EP
- European Patent Office
- Prior art keywords
- video
- scenes
- visual stress
- signal
- generating
- Prior art date
- Legal status (The legal status is an assumption and is not a legal conclusion. Google has not performed a legal analysis and makes no representation as to the accuracy of the status listed.)
- Ceased
Links
Images




Classifications
-
- G—PHYSICS
- G06—COMPUTING OR CALCULATING; COUNTING
- G06T—IMAGE DATA PROCESSING OR GENERATION, IN GENERAL
- G06T7/00—Image analysis
- G06T7/0002—Inspection of images, e.g. flaw detection
-
- G—PHYSICS
- G06—COMPUTING OR CALCULATING; COUNTING
- G06T—IMAGE DATA PROCESSING OR GENERATION, IN GENERAL
- G06T7/00—Image analysis
- G06T7/20—Analysis of motion
-
- G—PHYSICS
- G06—COMPUTING OR CALCULATING; COUNTING
- G06V—IMAGE OR VIDEO RECOGNITION OR UNDERSTANDING
- G06V20/00—Scenes; Scene-specific elements
- G06V20/40—Scenes; Scene-specific elements in video content
- G06V20/41—Higher-level, semantic clustering, classification or understanding of video scenes, e.g. detection, labelling or Markovian modelling of sport events or news items
-
- G—PHYSICS
- G06—COMPUTING OR CALCULATING; COUNTING
- G06T—IMAGE DATA PROCESSING OR GENERATION, IN GENERAL
- G06T2207/00—Indexing scheme for image analysis or image enhancement
- G06T2207/30—Subject of image; Context of image processing
- G06T2207/30168—Image quality inspection
-
- G—PHYSICS
- G06—COMPUTING OR CALCULATING; COUNTING
- G06T—IMAGE DATA PROCESSING OR GENERATION, IN GENERAL
- G06T2210/00—Indexing scheme for image generation or computer graphics
- G06T2210/41—Medical
Definitions
- This disclosure is directed toward video analysis systems, and, more particularly, to a system and method that accurately detects visual stress and photosensitive epilepsy triggers in video, and a device that mitigates such triggers.
- Epilepsy is a neurologic disorder that causes those afflicted to have seizures. Sometimes external stimuli trigger the seizures. For example, those with photosensitive epilepsy (PSE) have an increased likelihood of experiencing a seizure when exposed to pulsating light or patterns that include strong contrast of light and dark areas. Even if not seizure inducing, pulsating, flashing, or high contrast images may cause visual discomfort to viewers of video, such as broadcast on television or shown in movie theaters. The flashing images may be due to video content and/or effects of video processing. Some countries require that broadcast video be pre-screened for such PSE triggers. The current requirements dictate that video be checked for flashing and checkerboard or bar type patterns with more than 20 nit differences over more than one quarter of the screen.
- ITU International Telecommunication Union
- Embodiments of the invention address this and other limitations of the prior art.
- a scalable (over image resolution, frame rate, real-time vs. higher accuracy, etc.) method provides quantitative indications, predictions, alarms and causes of visual discomfort. These methods may be used to implement the existing United Kingdom, Japanese, ITU and other broadcasting guidelines, as well as a significant superset of PSE trigger video stimuli not directly covered by these guidelines. It quantifies the degree of likely visual discomfort while allowing for variations in the population regarding photosensitivity. Further, it accounts for differences in stimuli due to different displays and viewing conditions, such as those home viewing screens as well as cinematic, PDA and other common ways video may be viewed.
- Particular embodiments of the invention are directed to a method for detecting visual stress scenes in a video, including receiving a video including scenes that may cause visual stress in some viewers and generating a signal representing human perceptual response from scenes in the video. Next, an envelope follower is applied to the perceptual response signal, and an indication that the video contains visual stress scenes is generated based on the output of the envelope follower.
- Other embodiments include actively reducing contrast of the input video based on the measured likelihood that the particular scene may cause visual stress to some users. Further, output of the envelope follower may be converted into a simulated EEG signal and compared to actual measured EEG signals from viewers who watched the same video, to verify the accuracy of the visual stress detector.
- Fig. 1 is a functional block diagram of a picture/video quality analyzer having a visual stress detection system.
- Fig. 2 is a functional block diagram of a human vision model including the triggering mechanism and region of the brain thought to be responsible for PSE seizures.
- Fig. 3 is a functional block diagram of portions of a quality analyzer including visual stress detection and measurement system according to embodiments of the invention.
- Fig. 4 is a functional block diagram of portions of another quality analyzer including visual stress detection and measurement system according to embodiments of the invention.
- Fig. 5 is a graph of output from an envelope follower, used as a portion of the visual stress detection circuit of Figs. 3 and 4 according to embodiments of the invention.
- Fig. 6 is a graph that illustrates a response of both the envelope follower as well as an output of the thalamocortical loop simulation block of Figs. 3 and 4 according to embodiments of the invention.
- Figs. 7A, 7B, 7C, 7D , 7E, 7F, and 7G illustrate a series of simulated EEG signals, generated using embodiments of the invention.
- Figs. 8 and 9 are graphs that illustrate responses, both actually measured and simulated by embodiments of the invention, of the proportion of photosensitive patients showing a photoconvulsive EEG response under certain conditions.
- Figs. 10 and 11 are graphs that illustrate response, both actually measured and simulated by embodiments of the invention, of the proportion of photosensitive patients showing a photoconvulsive EEG response under other conditions.
- Fig. 12 is a functional block diagram of an example system that uses embodiments of the invention to actively mitigate visual stress areas of video streams.
- Fig. 1 is a functional block diagram of a picture/video quality analyzer having a visual stress detection system according to embodiments of the invention.
- a picture quality analyzer 100 accepts as input either pictures or a stream of pictures in video form.
- the analyzer 100 is referred to as a picture quality analyzer, or just an analyzer, whether it is accepting video or still images.
- An early visual perceptual response block 110 processes the input video through early visual perception, such as spatiotemporal filtering before splitting the processed video into two paths.
- a measuring block 120 then analyzes the video and generates quantitative and qualitative measures, portions or all of which may be sent out of the analyzer 100 as data, or may be used internally.
- a visual stress detection module 130 analyzes the pre-processed video for scenes or patterns that may potentially cause visual stress, such as discomfort for the user, or may potentially act as a trigger for a seizure of one afflicted with photosensitive epilepsy (PSE).
- PSE photosensitive epilepsy
- all scenes that may cause visual stress are referred to as PSE triggers, regardless of whether the visual stress is severe enough or has enough duration to cause a seizure to occur.
- Fig. 2 is a functional block diagram of human vision input and its resultant brain response areas that are material for this disclosure.
- Thalamocortical radiations 212 are fibers that connect the thalamus and the cerebral cortex in the brain, while the thalamocortical loop 216 is an ensemble of functional loops, each consisting of cortical, reticular and thalamocortical neurons.
- Cortical stimulation causes a sequence of spindle waves in the reticular cell and a series of spikes in the thalamocortical cell.
- the thalamocortical loops control the propagation of sensory information and are involved in the production of sleep spindles and absence seizures.
- Brain output may be monitored and evaluated using an EEG (Electroencephalogram).
- EEG Electroencephalogram
- Figs. 3 and 4 are a functional block diagram of portions of a quality analyzer including visual stress detection according to embodiments of the invention.
- an existing quality analyzer 320 may provide the functions of display modeling 322, viewing environment 324, and early visual perceptual response 312. Description of these functions may be found, for instance, in US Patent 6,975,776 , entitled Predicting Human Vision Perception and Perceptual Difference. These functions include spatiotemporal pooling, giving a scalar value representing the perceptual contrast per temporal sample (i.e. an overall perceptual contrast value per video frame). The output of the early visual perceptual response 312 is very accurate, and follows the human visual perceptual response very closely.
- the perceptual response accounts for different color response of the output display, as well as display characteristics and the viewing environment in which the display is being viewed.
- This precision, however, of using an adaptive, non-linear filter for the visual perceptual response block 312 comes at a relatively high computing cost.
- the early visual perceptual response 312 block may be replaced for purposes of this invention by a series of spatial and temporal filters.
- a normalized spatiotemporal bandpass filter 412 of Fig. 4 may include separate three dimensional filters for center and surround areas, each a cascade of spatial and temporal filters. In the following case (showing temporal filtering only), consider the spatial filter output was the input to the temporal filter.
- the spatial processing may be performed by techniques disclosed in the '143 patent referenced above, again simplified due to surLum[n]*K1 being max during the peaks. Together these simplifications allow for much for streamlined, faster spatiotemporal filtering.
- pcdiff n diffLum n ⁇ 100 baseLum 2 + surLum n + centLum n ⁇ 1 + 10 2
- This pcdiff[n] output from the normalized spatiotemporal bandpass block 412 of Fig. 4 corresponds to output of the perceptual response 312 of Fig. 4 , perceptual contrast response per frame.
- Any of the outputs of the blocks of Figs. 3 and 4 , or data derived from them, may be output from the quality analyzer including visual stress indication as a quantitative indication, prediction, alarm, and cause of visual discomfort of the input video.
- a thalamocortical loop simulation block 316, 416 is a verification simulation that generates output that may be compared to EEG data from those known to be experiencing visual stress. Matching the output from the thalamocortical loop simulation block 316, 416 against such EEG data validates that the envelope follower 314, 414 accurately models the stimuli to onset (attack), duration and decay of paroxysmal brain responses of those who experience PSE triggers.
- Fig. 5 is a graph of output from an envelope follower, such as the envelope follower 414 of Fig. 4 and 314 of Fig. 3 .
- an example input signal pulse train of alternating positive and negative, representing the normalized early perception output 412 of Fig. 4 was provide for approximately 2 seconds.
- An envelope follower output rises exponentially in response to the input. Then, after the input signal stops modulating, at approximately 2 seconds, the envelope follower slowly decays, as illustrated in Fig. 5 .
- an amplified envelope follower output is shown, which follows the same output as the envelope follower, but has higher gain.
- the thalamocortical loop simulation blocks 316, 416 of Figs. 3 and 4 create a signal that models EEG signals, which are used for verifying that the envelope follower 314, 414 produces accurate results, despite the seeming simplicity of using such a simple model for the thalamocortical loop.
- the following model formulae are used for simulating EEG.
- This simple model includes a noise term to be more complete, but is not required for our purposes of verification, so is set to 0 here.
- Figs. 6-11 together show how this model accounts for EEG simulation.
- f[n] G1*f[n-delay]*(1-G2*f(n-Delay)), where
- Delay Thalamocortical loop delay
- the clip functions may be implemented as
- Fig. 6 is a graph that illustrates a response of both the envelope follower 314, 414, as well as illustrates a portion of the thalamocortical loop simulation block 316, 416.
- An impulse train represents and simulates a PSE trigger input, shown on the left-hand side of this graph.
- the "r" value near the top of the graph is the amplified envelope follower output with gain calibrated to result in the desired r value at two different sampling rates, a delay of 1 vs. delay of ⁇ 21 samples. Their responses are nearly identical and look superimposed on Fig. 6 .
- Simulated thalamocortical loop responses which are outputs of the thalamocortical loop simulation block 316, 416 of Figs. 3 and 4 , respectively, are also illustrated, one for each from the different "r" values (envelope follower responses) that they use as input, respectively.
- Figs. 7A - 7G illustrate a series of simulated EEG signals, generated as an ensemble of individual (3 cell) thalamocortical loops.
- Fig. 7A is output for a single loop, generated according to the EEG simulation equation given above.
- Figs. 7B, 7C, 7D , and 7E are similarly generated, except that the simulated EEG signals include multiple signals that are added together while introducing a delay. This models activity within the thalamocortical loops themselves, which include an amount of delay based on their biochemical makeup.
- Fig. 7B illustrates a simulated EEG signal based on output from two parallel loops
- Fig. 7C illustrates simulated EEG signal based on output from three loops.
- Fig. 7A - 7G illustrate a series of simulated EEG signals, generated as an ensemble of individual (3 cell) thalamocortical loops.
- Fig. 7A is output for a single loop, generated according to the EEG simulation equation given
- FIG. 7D illustrates four loops, while Fig. 7E illustrates ten loops.
- Fig. 7F simulates a very large ensemble of loops by using output from an IIR filter.
- Fig. 7G illustrates the simulated EEG output of Fig. 7F overlaid on an example paroxysmal EEG with the same stimulus timing, taken from literature, in order to check response timing. Note how well the simulated EEG produced with a large ensemble of loops accurately matches the actual measured EEG in Fig. 7G .
- Figs. 8 - 9 explain how embodiments of the invention are used to examine population sensitivities over temporal (flash) frequencies.
- Figs. 8-9 show the percentage of population showing photoconvulsive (paroxysmal) response to flashing at various temporal frequencies, along with simulated responses generated using embodiments of the invention, such as described with reference to Figs. 3 and 4 above, which have been converted into probabilities according to the following set of equations:
- probPerPcDiffEnv is a normalizing constant (a scalar value) that scales the pcDiffEnv output, after being raised to the pth power, such that the maxima of the predicted response and the measured response coincide.
- Fig. 8 illustrates responses, both actually measured and simulated by embodiments of the invention, of the proportion of photosensitive patients showing a photoconvulsive EEG response to intermittent light, expressed as a function of flash frequency from known studies.
- the stimulus was simulated using a 100% contrast temporal square wave, with a mean luminance of 1000 nits.
- Fig. 9 is similar to Fig. 8 , except that for Fig. 8 data was taken for 170 patients (test 271), while data for only 16 patients (test 275) was used in creating the graph of Fig. 9 .
- Embodiments of the invention may also be used to provide a prediction, measured in probability, of whether people identified with having a photoconvulsive (paroxysmal) response to patterns at various spatial frequencies will in fact have a response to a particular pattern.
- Fig. 10 illustrates responses, both actually measured and simulated by embodiments of the invention, of the proportion of photosensitive patients showing a photoconvulsive EEG response to high contrast light patterns.
- the stimulus to provoke the response illustrated in Fig. 10 is a pattern of bars having a 75% contrast, with a mean luminance of 300 nits. Shown in Fig. 10 are the measured responses as well as the response predicted by embodiments of the invention. Additionally illustrated in Fig. 10 are maximum and minimum measured limits.
- Fig. 11 is similar to that of Fig. 10 , except the equivalent simulated stimulus is a 4 cpd square wave, with a mean luminance of 55 nits.
- the thalamocortical loop simulation blocks 316, 416 are useful in determining that the envelope followers 314, 414 are accurately modeling the onset, duration, and decay of paroxysmal events in the brain when subjected to PSE triggers.
- the justification of the simplistic approximation of the thalamocortical loop, and thus the resulting accuracy of the prediction, is due to properties of unimodal maps, which are an example of nonlinear system theory.
- the unimodal map approach to simulating the thalamocortical loop is based on the hypothesis that the thalamocortical loop may be approximately modeled as a logistic map with a maximum function value modulated by the envelope of the spatiotemporal perceptual contrast response. Anatomical evidence along with a universal principal of unimodal maps together provide evidence supporting this hypothesis.
- Thalamocortical Loop Delay Cortical, Thalamocortical & Reticular
- the above properties may be used to assemble a unimodal map.
- This model is a form of unimodal map. Thus, it conforms to the quantitative universality property of stability, period doubling and other behavioral characteristics of unimodal maps.
- a cobweb analysis provides that if the "r" value, the output of the envelope followers 314, 414, described above, is greater than or equal to three, then this indicates that a paroxysmal response is predicted.
- the quantitative universality of the unimodal map period doubling says that the ratio of differences of successive r values (and corresponding x values determining relative AC amplitude) where frequency doubling takes place is approximately the same, regardless of the function f(x[n]), as long as f() is a unimodal map.
- the model of the Thalamocortical Loop described above, reflects the excitation and inhibition observed in the actual thalamocortical loop, both correspond to unimodal maps, and, therefore, these qualities exist similarly for both the given model and the actual neural network being modeled.
- Fig. 12 illustrates an example system that uses embodiments of the invention to actively mitigate visual stress areas of video streams.
- video may be processed such that it reduces the probability of causing visual stress and PSE triggers.
- a limiter 710 receives a stream of video that may or may not include PSE triggers.
- a perceptual response for the video is determined in a block 712, or as described above with reference to Fig. 4 , a normalized spatiotemporal bandpass filter may be substituted.
- the input video may be processed using color conversion and viewing environment processing as described above with reference to Figs. 3 and 4 .
- An envelope follower 714 generates an output signal from its input, as described above. However, differently than above, the envelope follower 714 produces its output signal for an active contrast limiter 718, which also receives the incoming video.
- the active contrast limiter 718 may be internal or external to the limiter 710.
- ContrastReduction contrastLUT desiredEnvelopeOutput / contrastLUT EnvelopeOutput
- the spatiotemporal contrast is reduced by a factor required to result in the desired envelope output which corresponds to the corresponding lower target probability for causing visual stress and PSE.
- a Michelson contrast is defined as:
- An alternative to reducing contrast, rather than, as described above, reducing the gain of the dynamic portion of the signal, is to slowly reduce the gain over the entire video signal, then slowly raise the gain again after the PSE trigger scene has passed. Such reduction should be performed slowly, on the order of 1 ⁇ 2 second or longer, to prevent the entire video signal from quickly darkening, which itself may be a source of visual stress.
- the detection method may be used to dynamically either mitigate or correct the video signal, as described above, or may work as an input to a later processing of the video in a camera, editing equipment, broadcast equipment, set top box, DVR, Personal Computer, or a display 720, such as a consumer television, that reduces the effect of the PSE triggering scenes.
- components of the invention may be implemented in hardware, software, or a combination of the two, and may comprise a general purpose microprocessor, a digital signal processor (DSP), an application specific integrated circuit (ASIC), a field-programmable gate array (FPGA), or the like.
- DSP digital signal processor
- ASIC application specific integrated circuit
- FPGA field-programmable gate array
Landscapes
- Engineering & Computer Science (AREA)
- Physics & Mathematics (AREA)
- General Physics & Mathematics (AREA)
- Theoretical Computer Science (AREA)
- Multimedia (AREA)
- Computer Vision & Pattern Recognition (AREA)
- Computational Linguistics (AREA)
- Software Systems (AREA)
- Quality & Reliability (AREA)
- Testing, Inspecting, Measuring Of Stereoscopic Televisions And Televisions (AREA)
- Measurement Of The Respiration, Hearing Ability, Form, And Blood Characteristics Of Living Organisms (AREA)
- Measurement And Recording Of Electrical Phenomena And Electrical Characteristics Of The Living Body (AREA)
- Image Analysis (AREA)
- Controls And Circuits For Display Device (AREA)
Abstract
Description
- This disclosure is directed toward video analysis systems, and, more particularly, to a system and method that accurately detects visual stress and photosensitive epilepsy triggers in video, and a device that mitigates such triggers.
- Epilepsy is a neurologic disorder that causes those afflicted to have seizures. Sometimes external stimuli trigger the seizures. For example, those with photosensitive epilepsy (PSE) have an increased likelihood of experiencing a seizure when exposed to pulsating light or patterns that include strong contrast of light and dark areas. Even if not seizure inducing, pulsating, flashing, or high contrast images may cause visual discomfort to viewers of video, such as broadcast on television or shown in movie theaters. The flashing images may be due to video content and/or effects of video processing. Some countries require that broadcast video be pre-screened for such PSE triggers. The current requirements dictate that video be checked for flashing and checkerboard or bar type patterns with more than 20 nit differences over more than one quarter of the screen. Although an International Telecommunication Union (ITU) standard includes for checking of flashing, there is no detection method outlined other than suggesting a manual approach: viewers watch video using ITU-R BT.500 specified home viewing conditions and determine if the video seems to have flashes, etc. Nor are the guidelines inclusive of all PSE triggers.
- One marketed product, Cambridge Research Systems' Harding Flash and Pattern Analyzer claims to screen for triggers following the guidelines, which means it likely searches video for temporal (flash) or spatial (bar or checkerboard) pattern detection.
- No current systems, however, analyze video images and produce quantitative indications, predictions, alarms, and causes of visual discomfort. Further, there is no device that actively detects video having scenes that could possibly trigger PSE seizures, and actively mitigates such scenes.
- Embodiments of the invention address this and other limitations of the prior art.
- A scalable (over image resolution, frame rate, real-time vs. higher accuracy, etc.) method provides quantitative indications, predictions, alarms and causes of visual discomfort. These methods may be used to implement the existing United Kingdom, Japanese, ITU and other broadcasting guidelines, as well as a significant superset of PSE trigger video stimuli not directly covered by these guidelines. It quantifies the degree of likely visual discomfort while allowing for variations in the population regarding photosensitivity. Further, it accounts for differences in stimuli due to different displays and viewing conditions, such as those home viewing screens as well as cinematic, PDA and other common ways video may be viewed.
- Particular embodiments of the invention are directed to a method for detecting visual stress scenes in a video, including receiving a video including scenes that may cause visual stress in some viewers and generating a signal representing human perceptual response from scenes in the video. Next, an envelope follower is applied to the perceptual response signal, and an indication that the video contains visual stress scenes is generated based on the output of the envelope follower. Other embodiments include actively reducing contrast of the input video based on the measured likelihood that the particular scene may cause visual stress to some users. Further, output of the envelope follower may be converted into a simulated EEG signal and compared to actual measured EEG signals from viewers who watched the same video, to verify the accuracy of the visual stress detector.
-
Fig. 1 is a functional block diagram of a picture/video quality analyzer having a visual stress detection system. -
Fig. 2 is a functional block diagram of a human vision model including the triggering mechanism and region of the brain thought to be responsible for PSE seizures. -
Fig. 3 is a functional block diagram of portions of a quality analyzer including visual stress detection and measurement system according to embodiments of the invention. -
Fig. 4 is a functional block diagram of portions of another quality analyzer including visual stress detection and measurement system according to embodiments of the invention. -
Fig. 5 is a graph of output from an envelope follower, used as a portion of the visual stress detection circuit ofFigs. 3 and4 according to embodiments of the invention. -
Fig. 6 is a graph that illustrates a response of both the envelope follower as well as an output of the thalamocortical loop simulation block ofFigs. 3 and4 according to embodiments of the invention. -
Figs. 7A, 7B, 7C, 7D ,7E, 7F, and 7G illustrate a series of simulated EEG signals, generated using embodiments of the invention. -
Figs. 8 and9 are graphs that illustrate responses, both actually measured and simulated by embodiments of the invention, of the proportion of photosensitive patients showing a photoconvulsive EEG response under certain conditions. -
Figs. 10 and11 are graphs that illustrate response, both actually measured and simulated by embodiments of the invention, of the proportion of photosensitive patients showing a photoconvulsive EEG response under other conditions. -
Fig. 12 is a functional block diagram of an example system that uses embodiments of the invention to actively mitigate visual stress areas of video streams. -
Fig. 1 is a functional block diagram of a picture/video quality analyzer having a visual stress detection system according to embodiments of the invention. Apicture quality analyzer 100 accepts as input either pictures or a stream of pictures in video form. In this disclosure theanalyzer 100 is referred to as a picture quality analyzer, or just an analyzer, whether it is accepting video or still images. An early visualperceptual response block 110 processes the input video through early visual perception, such as spatiotemporal filtering before splitting the processed video into two paths. Ameasuring block 120 then analyzes the video and generates quantitative and qualitative measures, portions or all of which may be sent out of theanalyzer 100 as data, or may be used internally. A visualstress detection module 130 analyzes the pre-processed video for scenes or patterns that may potentially cause visual stress, such as discomfort for the user, or may potentially act as a trigger for a seizure of one afflicted with photosensitive epilepsy (PSE). For brevity, in this disclosure, all scenes that may cause visual stress are referred to as PSE triggers, regardless of whether the visual stress is severe enough or has enough duration to cause a seizure to occur. -
Fig. 2 is a functional block diagram of human vision input and its resultant brain response areas that are material for this disclosure.Thalamocortical radiations 212 are fibers that connect the thalamus and the cerebral cortex in the brain, while thethalamocortical loop 216 is an ensemble of functional loops, each consisting of cortical, reticular and thalamocortical neurons. Cortical stimulation causes a sequence of spindle waves in the reticular cell and a series of spikes in the thalamocortical cell. The thalamocortical loops control the propagation of sensory information and are involved in the production of sleep spindles and absence seizures. Brain output may be monitored and evaluated using an EEG (Electroencephalogram). -
Figs. 3 and4 are a functional block diagram of portions of a quality analyzer including visual stress detection according to embodiments of the invention. InFig. 3 , an existingquality analyzer 320 may provide the functions ofdisplay modeling 322,viewing environment 324, and early visualperceptual response 312. Description of these functions may be found, for instance, inUS Patent 6,975,776 , entitled Predicting Human Vision Perception and Perceptual Difference. These functions include spatiotemporal pooling, giving a scalar value representing the perceptual contrast per temporal sample (i.e. an overall perceptual contrast value per video frame).The output of the early visualperceptual response 312 is very accurate, and follows the human visual perceptual response very closely. Because of thedisplay model 322 andviewing environment 324, the perceptual response accounts for different color response of the output display, as well as display characteristics and the viewing environment in which the display is being viewed. This precision, however, of using an adaptive, non-linear filter for the visualperceptual response block 312 comes at a relatively high computing cost. Instead, inFig. 4 , the early visualperceptual response 312 block may be replaced for purposes of this invention by a series of spatial and temporal filters. For example, a normalizedspatiotemporal bandpass filter 412 ofFig. 4 may include separate three dimensional filters for center and surround areas, each a cascade of spatial and temporal filters. In the following case (showing temporal filtering only), consider the spatial filter output was the input to the temporal filter. Then, for each pixel in a video frame, the temporal filter can be applied as follows (n is the index representing temporal sample or frame number in this example):
- This is a form close to the temporal portion of the spatiotemporal filter method described in
US Patent 6,907,143 , techniques of which may be used for the above-described filters. Note that since b0cmin = 1, the temporal center filter is transparent and may be removed for this sample rate. This is an optimization step that does not exactly match the response of the corresponding anatomical portion of the human vision system, but the envelope follower portion, described below, has a low-pass response which compensates for this. Also, b0cmin is further justified (as well as the K1 = 0 setting) because for the light stimulus we are interested in detecting for PSE triggers, generally the spatiotemporal contrast is large and the peak luminance is usually large enough to cause the surLum[n]*K1 term to be large enough to cause the b0[n] values to clip at unity. - The spatial processing may be performed by techniques disclosed in the '143 patent referenced above, again simplified due to surLum[n]*K1 being max during the peaks. Together these simplifications allow for much for streamlined, faster spatiotemporal filtering.
- Then the filtered difference is
-

- The perceptual contrast as a function of the center, surround and difference for high contrast video is approximated with the following simplified model:
-

- This pcdiff[n] output from the normalized
spatiotemporal bandpass block 412 ofFig. 4 corresponds to output of theperceptual response 312 ofFig. 4 , perceptual contrast response per frame. Any of the outputs of the blocks ofFigs. 3 and4 , or data derived from them, may be output from the quality analyzer including visual stress indication as a quantitative indication, prediction, alarm, and cause of visual discomfort of the input video. - Referring back to
Figs. 3 and4 , for purposes of visual stress and PSE trigger detection, embodiments of the invention model thethalamocortical radiations 212 ofFig. 2 with anenvelope follower circuit 314 as described in detail with reference toFig. 5 below. In addition, a thalamocorticalloop simulation block loop simulation block envelope follower - An
example envelope follower 
-
Fig. 5 is a graph of output from an envelope follower, such as theenvelope follower 414 ofFig. 4 and 314 ofFig. 3 . InFig. 5 , an example input signal pulse train of alternating positive and negative, representing the normalizedearly perception output 412 ofFig. 4 , was provide for approximately 2 seconds. An envelope follower output rises exponentially in response to the input. Then, after the input signal stops modulating, at approximately 2 seconds, the envelope follower slowly decays, as illustrated inFig. 5 . Also, an amplified envelope follower output is shown, which follows the same output as the envelope follower, but has higher gain. - As mentioned above, the thalamocortical loop simulation blocks 316, 416 of
Figs. 3 and4 create a signal that models EEG signals, which are used for verifying that theenvelope follower Figs. 6-11 together show how this model accounts for EEG simulation.
- Where f() for this particular case is:
- f[n] = G1*f[n-delay]*(1-G2*f(n-Delay)), where
- • G1 = (Visual cortex gain)*(Thalamocortical gain)
- • G2 = Thalamic reticular gain
- • Delay = Thalamocortical loop delay
- Or, equivalently,
-

- For delay normalized to 1:
-

- And for G2*f[n] substituted with x[n]
-

- multiplying both sides by G2:
-

- Also, for this EEG simulation, the clip functions may be implemented as
-

- Output from this formula is illustrated in
Fig. 6 , which is a graph that illustrates a response of both theenvelope follower loop simulation block Fig. 6 . Simulated thalamocortical loop responses, which are outputs of the thalamocorticalloop simulation block Figs. 3 and4 , respectively, are also illustrated, one for each from the different "r" values (envelope follower responses) that they use as input, respectively. -
Figs. 7A - 7G illustrate a series of simulated EEG signals, generated as an ensemble of individual (3 cell) thalamocortical loops.Fig. 7A is output for a single loop, generated according to the EEG simulation equation given above.Figs. 7B, 7C, 7D , and7E are similarly generated, except that the simulated EEG signals include multiple signals that are added together while introducing a delay. This models activity within the thalamocortical loops themselves, which include an amount of delay based on their biochemical makeup.Fig. 7B illustrates a simulated EEG signal based on output from two parallel loops, whileFig. 7C illustrates simulated EEG signal based on output from three loops.Fig. 7D illustrates four loops, whileFig. 7E illustrates ten loops.Fig. 7F simulates a very large ensemble of loops by using output from an IIR filter.Fig. 7G illustrates the simulated EEG output ofFig. 7F overlaid on an example paroxysmal EEG with the same stimulus timing, taken from literature, in order to check response timing. Note how well the simulated EEG produced with a large ensemble of loops accurately matches the actual measured EEG inFig. 7G . -
Figs. 8 - 9 explain how embodiments of the invention are used to examine population sensitivities over temporal (flash) frequencies. In general,Figs. 8-9 show the percentage of population showing photoconvulsive (paroxysmal) response to flashing at various temporal frequencies, along with simulated responses generated using embodiments of the invention, such as described with reference toFigs. 3 and4 above, which have been converted into probabilities according to the following set of equations: -

- The value of max(prob271) is the maximum probability taken from the experimental data for a particular test number, shown in the corresponding figure, and the p (power) value, as illustrated in
Figs 8 and9 , is 2. Thus, probPerPcDiffEnv is a normalizing constant (a scalar value) that scales the pcDiffEnv output, after being raised to the pth power, such that the maxima of the predicted response and the measured response coincide. -
Fig. 8 illustrates responses, both actually measured and simulated by embodiments of the invention, of the proportion of photosensitive patients showing a photoconvulsive EEG response to intermittent light, expressed as a function of flash frequency from known studies. The stimulus was simulated using a 100% contrast temporal square wave, with a mean luminance of 1000 nits.Fig. 9 is similar toFig. 8 , except that forFig. 8 data was taken for 170 patients (test 271), while data for only 16 patients (test 275) was used in creating the graph ofFig. 9 . - Recall from above that a portion of those with photosensitive triggers are sensitive not only to flashing images, but even to static images that contain high contrast. Embodiments of the invention may also be used to provide a prediction, measured in probability, of whether people identified with having a photoconvulsive (paroxysmal) response to patterns at various spatial frequencies will in fact have a response to a particular pattern.
-
Fig. 10 illustrates responses, both actually measured and simulated by embodiments of the invention, of the proportion of photosensitive patients showing a photoconvulsive EEG response to high contrast light patterns. The stimulus to provoke the response illustrated inFig. 10 is a pattern of bars having a 75% contrast, with a mean luminance of 300 nits. Shown inFig. 10 are the measured responses as well as the response predicted by embodiments of the invention. Additionally illustrated inFig. 10 are maximum and minimum measured limits.Fig. 11 is similar to that ofFig. 10 , except the equivalent simulated stimulus is a 4 cpd square wave, with a mean luminance of 55 nits. - Referring back to
Figs. 3 and4 , the thalamocortical loop simulation blocks 316, 416 are useful in determining that theenvelope followers - Properties of Thalamocortical Loops:
- Thalamocortical Loop Delay: Single Neuron
- • Mean firing response delay: ∼10.1 ms
- • Axon signal propagation delays:
- • Delay/length: 0.35-0.68 mm/ms
• Average for thalamus to cortex -= 70mm - • Average axon delay -= 70*0.515 = 36.05 ms
- • Synaptic delay: ∼21.55 ms
- Thalamocortical Loop Delay: Cortical, Thalamocortical & Reticular
- • Cortical, Thalamocortical: Firing + Axon + Synaptic Delays:
-

- • Reticular: Firing + ∼Negligible Axon + Synaptic Delays:
-

- • Total Thalamocortical Loop Delay:
-

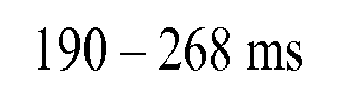
- • Compare to reaction times to visual stimuli:
-
- The above properties may be used to assemble a unimodal map.
- Thalamocortical Loop Map:
- y[n] = G1*y[n-delay]*(1-G2*y(n-Delay)), where
- G1 = (Visual cortex gain)*(Thalamocortical gain)
- G2 = Thalamic reticular gain
- Delay = Thalamocortical loop delay
- This model is a form of unimodal map. Thus, it conforms to the quantitative universality property of stability, period doubling and other behavioral characteristics of unimodal maps.
- Consider unimodal logistic map example:
-

- • "Stable," "fixed" outputs correspond to the intersection of
-

- • "Stable" oscillations & "fixed" outputs correspond to the intersection of

where for delay =2,
- Further, a cobweb analysis provides that if the "r" value, the output of the
envelope followers - Next, the quantitative universality of the unimodal map period doubling says that the ratio of differences of successive r values (and corresponding x values determining relative AC amplitude) where frequency doubling takes place is approximately the same, regardless of the function f(x[n]), as long as f() is a unimodal map. Thus, because the model of the Thalamocortical Loop, described above, reflects the excitation and inhibition observed in the actual thalamocortical loop, both correspond to unimodal maps, and, therefore, these qualities exist similarly for both the given model and the actual neural network being modeled.
-
Fig. 12 illustrates an example system that uses embodiments of the invention to actively mitigate visual stress areas of video streams. In other words, using this system, video may be processed such that it reduces the probability of causing visual stress and PSE triggers. With reference toFig. 12 , alimiter 710 receives a stream of video that may or may not include PSE triggers. A perceptual response for the video is determined in ablock 712, or as described above with reference toFig. 4 , a normalized spatiotemporal bandpass filter may be substituted. Additionally, the input video may be processed using color conversion and viewing environment processing as described above with reference toFigs. 3 and4 . Anenvelope follower 714 generates an output signal from its input, as described above. However, differently than above, theenvelope follower 714 produces its output signal for anactive contrast limiter 718, which also receives the incoming video. Theactive contrast limiter 718 may be internal or external to thelimiter 710. - The
contrast limiter 718 reduces contrast of the video input signal in relation to contrast of the input signal in relation to the maximum desired contrast, as follows:
- where

- In other words, the spatiotemporal contrast is reduced by a factor required to result in the desired envelope output which corresponds to the corresponding lower target probability for causing visual stress and PSE.
- A Michelson contrast is defined as:
- MaxLum - MinLum / MaxLum + MinLum , where MaxLum and MinLum represent the highest and the lowest luminance of the region of interest, respectively. The contrast reduction method described above reduces this Michelson contrast.
- An alternative to reducing contrast, rather than, as described above, reducing the gain of the dynamic portion of the signal, is to slowly reduce the gain over the entire video signal, then slowly raise the gain again after the PSE trigger scene has passed. Such reduction should be performed slowly, on the order of ½ second or longer, to prevent the entire video signal from quickly darkening, which itself may be a source of visual stress.
- Any of the contrast processing described above may be efficiently performed in embodiments with Look Up Tables (LUTs).
- In other embodiments, the detection method may be used to dynamically either mitigate or correct the video signal, as described above, or may work as an input to a later processing of the video in a camera, editing equipment, broadcast equipment, set top box, DVR, Personal Computer, or a
display 720, such as a consumer television, that reduces the effect of the PSE triggering scenes. - In various embodiments, components of the invention may be implemented in hardware, software, or a combination of the two, and may comprise a general purpose microprocessor, a digital signal processor (DSP), an application specific integrated circuit (ASIC), a field-programmable gate array (FPGA), or the like.
- It will be appreciated from the forgoing discussion that the present invention represents a significant advance in the field of video stress detection. Although specific embodiments of the invention have been illustrated and described for purposes of illustration, it will be understood that various modifications may be made without departing from the scope of the invention. Accordingly, the invention should not be limited except as by the appended claims. The following section of the description consists of numbered paragraphs simply providing statements of the invention already described herein. The numbered paragraphs in this section are not claims. The claims are set forth below in the later section headed "claims".
- 1. A method for detecting visual stress scenes in a video, the method comprising: receiving a video including scenes that may cause visual stress in some viewers; generating a signal representing human perceptual response from scenes in the video; applying an envelope follower to the perceptual response signal; and indicating the video contains visual stress scenes based on the output of the envelope follower.
- 2. The method of 1 in which generating a human perceptual response comprises passing the video through a spatiotemporal filter.
- 3. The method of 1 or 2, further comprising generating a perceptual contrast portion of the perceptual response signal based on a function of a center area, a surround area, and a difference between the center and surround areas of the video.
- 4. The method of any of 1 to 3 in which detecting visual stress scenes comprises detecting contrasting scenes in temporal differences.
- 5. The method of any of 1 to 4 in which detecting visual stress scenes comprises detecting contrasting scenes in spatial differences.
- 6. The method of any of 1 to 5 in which indicating the video contains visual stress scenes comprises generating a quantitative measure.
- 7. The method of any of 1 to 6, further comprising: converting the output of the envelope follower into a simulated EEG signal; and comparing the simulated EEG signal with an EEG signal produced from a human response while viewing the same video.
- 8. The method of any of 1 to 7, further comprising: converting the output of the envelope follower to a probability measure.
- 9. The method of 8, in which the probability measure is made for each pixel in a video frame.
- 10. The method of 8 or 9, in which the probability measure is made for a predetermined time interval.
- 11. The method of 8 or 9, in which the probability measure is made only for a region of interest within the video frame.
- 12. A method for reducing visual stress scenes in a video, the method comprising: receiving a video including scenes that may cause visual stress in some viewers; generating a signal representing human perceptual response from scenes in the video; applying an envelope follower to the perceptual response signal; reducing contrast in the video based on an output from the envelope follower; and outputting the reduced contrast video as a reduced visual stress output.
- 13. The method of 12 in which generating a human perceptual response comprises passing the video through a spatiotemporal filter.
- 14. The method of 12 or 13, further comprising generating a perceptual contrast portion of the perceptual response signal based on a function of a center area, a surround area, and a difference between the center and surround areas of the video.
- 15. The method of any of 12 to 14, in which reducing contrast in the video comprises reducing contrast of the video in a final display device.
- 16. The method of any of 12 to 14, in which reducing contrast in the video comprises reducing a maximum luminescence of at least a portion of the video.
- 17. The method of any of 12 to 14, in which reducing contrast in the video comprises reducing a difference between a minimum luminescence and a maximum luminescence of at least a portion of the video.
- 18. The method of any of 12 to 14, in which reducing contrast in the video comprises reducing contrast of the video in a device separate from a final display device.
- 19. A visual stress detector for detecting scenes of a video that may cause visual stress in a viewer, the detector comprising: an input for receiving a video including scenes that may cause visual stress in some viewers; a human perceptual response generator coupled to the input; an envelope follower coupled to the human perceptual response generator; and an output for generating a signal indicating those scenes of the video may cause visual stress in the viewer.
- 20. The visual stress detector of 19, further comprising a mitigation circuit coupled to the envelope follower, the mitigation circuit structured to modify the video to reduce scenes that may cause visual stress to the viewer.
- 21. The visual stress detector of 20, in which the mitigation circuit is structured to reduce contrast in the video.
- 22. The visual stress detector of 20, further comprising: an EEG simulation circuit coupled to the envelope follower and structured to generate a simulated EEG signal.
- 23. A method of verification of a device structured to detect visual stress scenes in a video, the method, comprising:
- generating a signal that indicates visual stress in the video;
- from the signal that indicates visual stress, generating a simulated EEG; obtaining a measured EEG from one or more humans created while watching the video; and
- comparing the measured EEG to the simulated EEG.
- 24. The method of 23 in which generating a signal that indicates visual stress in a video comprises: generating a signal representing a human perceptual response from scenes in the video.
- 25. The method of 24, further comprising: analyzing the signal representing the human perceptual response with an envelope follower.
- 26. The method of 23, in which generating a simulated EEG comprises generating a unimodal map.
Claims (15)
- A method for detecting visual stress scenes in a video, the method comprising:receiving a video including scenes that may cause visual stress in some viewers;generating a signal representing human perceptual response from scenes in the video;applying an envelope follower to the perceptual response signal; andindicating the video contains visual stress scenes based on the output of the envelope follower.
- The method of claim 1 in which generating a human perceptual response comprises passing the video through a spatiotemporal filter.
- The method of claim 2, further comprising generating a perceptual contrast portion of the perceptual response signal based on a function of a center area, a surround area, and a difference between the center and surround areas of the video.
- The method of claim 1 in which detecting visual stress scenes comprises:detecting contrasting scenes in temporal differences; ordetecting contrasting scenes in spatial differences; or generating a quantitative measure.
- The method of claim 1, further comprising:converting the output of the envelope follower into a simulated EEG signal; andcomparing the simulated EEG signal with an EEG signal produced from a human response while viewing the same video.
- The method of claim 1, further comprising:converting the output of the envelope follower to a probability measure.
- The method of claim 6, in which the probability measure is made for:each pixel in a video frame; and/ora predetermined time interval; and/ora region of interest within the video frame.
- A method for reducing visual stress scenes in a video, the method comprising:receiving a video including scenes that may cause visual stress in some viewers;generating a signal representing human perceptual response from scenes in the video;applying an envelope follower to the perceptual response signal;reducing contrast in the video based on an output from the envelope follower; andoutputting the reduced contrast video as a reduced visual stress output.
- The method of claim 8 in which generating a human perceptual response comprises passing the video through a spatiotemporal filter.
- The method of claim 9, further comprising generating a perceptual contrast portion of the perceptual response signal based on a function of a center area, a surround area, and a difference between the center and surround areas of the video.
- The method of claim 8, in which reducing contrast in the video comprises reducing contrast of the video in a final display device.
- The method of claim 8, in which reducing contrast in the video comprises:reducing a maximum luminescence of at least a portion of the video; orreducing a difference between a minimum luminescence and a maximum luminescence of at least a portion of the video; orreducing contrast of the video in a device separate from a final display device.
- A visual stress detector for detecting scenes of a video that may cause visual stress in a viewer, the detector comprising:an input for receiving a video including scenes that may cause visual stress in some viewers;a human perceptual response generator coupled to the input;an envelope follower coupled to the human perceptual response generator; andan output for generating a signal indicating those scenes of the video may cause visual stress in the viewer.
- The visual stress detector of claim 13, further comprising a mitigation circuit coupled to the envelope follower, the mitigation circuit structured to modify the video to reduce scenes that may cause visual stress to the viewer.
- A method of verification of a device structured to detect visual stress scenes in a video, the method, comprising:generating a signal that indicates visual stress in the video;from the signal that indicates visual stress, generating a simulated EEG;obtaining a measured EEG from one or more humans created while watching the video; andcomparing the measured EEG to the simulated EEG.
Applications Claiming Priority (1)
| Application Number | Priority Date | Filing Date | Title |
|---|---|---|---|
| US13/340,481 US8768020B2 (en) | 2011-12-29 | 2011-12-29 | Method of detecting visual stress and photosensitive epilepsy triggers in video and mitigation device |
Publications (2)
| Publication Number | Publication Date |
|---|---|
| EP2610780A2 true EP2610780A2 (en) | 2013-07-03 |
| EP2610780A3 EP2610780A3 (en) | 2015-04-08 |
Family
ID=47623859
Family Applications (1)
| Application Number | Title | Priority Date | Filing Date |
|---|---|---|---|
| EP12198658.2A Ceased EP2610780A3 (en) | 2011-12-29 | 2012-12-20 | Method of detecting visual stress and photosensitive epilepsy triggers in video and mitigation device |
Country Status (4)
| Country | Link |
|---|---|
| US (1) | US8768020B2 (en) |
| EP (1) | EP2610780A3 (en) |
| JP (1) | JP6267424B2 (en) |
| CN (1) | CN103271738B (en) |
Cited By (1)
| Publication number | Priority date | Publication date | Assignee | Title |
|---|---|---|---|---|
| US12316908B2 (en) | 2020-10-07 | 2025-05-27 | Telefonaktiebolaget Lm Ericsson (Publ) | System and method to minimize repetitive flashes in streaming media content |
Families Citing this family (8)
| Publication number | Priority date | Publication date | Assignee | Title |
|---|---|---|---|---|
| WO2013153798A1 (en) * | 2012-04-12 | 2013-10-17 | Canon Kabushiki Kaisha | Brain activity and visually induced motion sickness |
| US9807445B2 (en) * | 2012-11-29 | 2017-10-31 | Echostar Technologies L.L.C. | Photosensitivity protection for video display |
| US10063853B2 (en) * | 2013-12-16 | 2018-08-28 | Barco N.V. | Efficient error recovery |
| US11074885B2 (en) * | 2015-09-25 | 2021-07-27 | Intel Corporation | Facilitating efficient detection of patterns in graphics display streams prior to their display at computing devices |
| US10067565B2 (en) * | 2016-09-29 | 2018-09-04 | Intel Corporation | Methods and apparatus for identifying potentially seizure-inducing virtual reality content |
| US10742923B2 (en) * | 2018-10-25 | 2020-08-11 | International Business Machines Corporation | Detection of photosensitive triggers in video content |
| CN111557813B (en) * | 2020-06-09 | 2021-11-23 | 首都医科大学宣武医院 | Fence system for monitoring children with epilepsy |
| US11769465B1 (en) | 2021-11-05 | 2023-09-26 | Optum, Inc. | Identifying regions of visible media data that belong to a trigger content type |
Citations (2)
| Publication number | Priority date | Publication date | Assignee | Title |
|---|---|---|---|---|
| US6907143B2 (en) | 2001-05-16 | 2005-06-14 | Tektronix, Inc. | Adaptive spatio-temporal filter for human vision system models |
| US6975776B2 (en) | 2002-02-14 | 2005-12-13 | Tektronix, Inc. | Predicting human vision perception and perceptual difference |
Family Cites Families (5)
| Publication number | Priority date | Publication date | Assignee | Title |
|---|---|---|---|---|
| US6119083A (en) * | 1996-02-29 | 2000-09-12 | British Telecommunications Public Limited Company | Training process for the classification of a perceptual signal |
| AUPS185102A0 (en) * | 2002-04-19 | 2002-05-30 | Dienn, Henry James William | System for prevention of photoepileptic seizures |
| JP2006246138A (en) * | 2005-03-04 | 2006-09-14 | Pioneer Electronic Corp | Image display apparatus, image display method and image display program |
| JP4580347B2 (en) * | 2006-01-17 | 2010-11-10 | 財団法人エヌエイチケイエンジニアリングサービス | Flicker video conversion device, program and method thereof, and video display device |
| JP4870990B2 (en) * | 2006-01-20 | 2012-02-08 | 日本放送協会 | Image analysis apparatus, visual stimulus risk determination program, and image analysis system |
-
2011
- 2011-12-29 US US13/340,481 patent/US8768020B2/en not_active Expired - Fee Related
-
2012
- 2012-12-20 EP EP12198658.2A patent/EP2610780A3/en not_active Ceased
- 2012-12-28 CN CN201210582375.4A patent/CN103271738B/en not_active Expired - Fee Related
- 2012-12-28 JP JP2012288305A patent/JP6267424B2/en not_active Expired - Fee Related
Patent Citations (2)
| Publication number | Priority date | Publication date | Assignee | Title |
|---|---|---|---|---|
| US6907143B2 (en) | 2001-05-16 | 2005-06-14 | Tektronix, Inc. | Adaptive spatio-temporal filter for human vision system models |
| US6975776B2 (en) | 2002-02-14 | 2005-12-13 | Tektronix, Inc. | Predicting human vision perception and perceptual difference |
Non-Patent Citations (1)
| Title |
|---|
| GRAHAM HARDING: "HardingFPA HD User's Manual", 12 March 2010 (2010-03-12), XP055263563, Retrieved from the Internet <URL:http://www.hardingfpa.com/assets/Downloads/HardingFPA-HD-Users-Manual-3.0.0.pdf> [retrieved on 20160407] * |
Cited By (1)
| Publication number | Priority date | Publication date | Assignee | Title |
|---|---|---|---|---|
| US12316908B2 (en) | 2020-10-07 | 2025-05-27 | Telefonaktiebolaget Lm Ericsson (Publ) | System and method to minimize repetitive flashes in streaming media content |
Also Published As
| Publication number | Publication date |
|---|---|
| EP2610780A3 (en) | 2015-04-08 |
| JP2013153435A (en) | 2013-08-08 |
| JP6267424B2 (en) | 2018-01-24 |
| CN103271738B (en) | 2016-11-23 |
| US20130169880A1 (en) | 2013-07-04 |
| US8768020B2 (en) | 2014-07-01 |
| CN103271738A (en) | 2013-09-04 |
Similar Documents
| Publication | Publication Date | Title |
|---|---|---|
| US8768020B2 (en) | Method of detecting visual stress and photosensitive epilepsy triggers in video and mitigation device | |
| DE60020795T2 (en) | Real-time modeling of the behavior of human vision systems | |
| Belitski et al. | Sensory information in local field potentials and spikes from visual and auditory cortices: time scales and frequency bands | |
| Billock | Neural acclimation to 1/f spatial frequency spectra in natural images transduced by the human visual system | |
| Gutnisky et al. | Spontaneous fluctuations in visual cortical responses influence population coding accuracy | |
| US20170308923A1 (en) | Evaluation apparatus and evaluation method | |
| Lim et al. | Investigation of driver performance with night vision and pedestrian detection systems—Part I: Empirical study on visual clutter and glance behavior | |
| Sekuler et al. | Structural modeling of spatial vision | |
| US6975776B2 (en) | Predicting human vision perception and perceptual difference | |
| Wang et al. | Altering stimulus timing via fast rhythmic sensory stimulation induces STDP-like recall performance in human episodic memory | |
| Blake et al. | Temporal aspects of spatial vision in the cat | |
| Christiansen et al. | Effects of tonotopicity, adaptation, modulation tuning, and temporal coherence in “primitive” auditory stream segregation | |
| Ahumada Jr et al. | Spatiotemporal discrimination model predicts temporal masking functions | |
| Chan et al. | A stochastic model of schistosomiasis immuno-epidemiology | |
| Alzubaidi et al. | Parallel scheme for real-time detection of photosensitive seizures | |
| Fredericksen et al. | Temporal integration of random dot apparent motion information in human central vision | |
| KR101798777B1 (en) | Method for estimating emotional arousal changes of viewer and evaluating on viedo contents | |
| Watson | Transfer of contrast sensitivity in linear visual networks | |
| Passaglia et al. | Cell-based model of the Limulus lateral eye | |
| Young et al. | Non‐Linearities and the Representation of Auditory Spectra | |
| Zaagman et al. | Adaptive strategies in fly vision: on their image-processing qualities | |
| Zheng et al. | Stimulus-entrained oscillatory activity propagates as waves from area 18 to 17 in cat visual cortex | |
| Amodio et al. | An entropy-based spline approximation technique for the automatic detection of peaks in electrodermal activity data | |
| RU2477881C1 (en) | Method of securing automated system | |
| Avadhanam et al. | Prediction and measurement of high quality in still-image coding |
Legal Events
| Date | Code | Title | Description |
|---|---|---|---|
| PUAI | Public reference made under article 153(3) epc to a published international application that has entered the european phase |
Free format text: ORIGINAL CODE: 0009012 |
|
| AK | Designated contracting states |
Kind code of ref document: A2 Designated state(s): AL AT BE BG CH CY CZ DE DK EE ES FI FR GB GR HR HU IE IS IT LI LT LU LV MC MK MT NL NO PL PT RO RS SE SI SK SM TR |
|
| AX | Request for extension of the european patent |
Extension state: BA ME |
|
| RAP1 | Party data changed (applicant data changed or rights of an application transferred) |
Owner name: TEKTRONIX, INC. |
|
| PUAL | Search report despatched |
Free format text: ORIGINAL CODE: 0009013 |
|
| AK | Designated contracting states |
Kind code of ref document: A3 Designated state(s): AL AT BE BG CH CY CZ DE DK EE ES FI FR GB GR HR HU IE IS IT LI LT LU LV MC MK MT NL NO PL PT RO RS SE SI SK SM TR |
|
| AX | Request for extension of the european patent |
Extension state: BA ME |
|
| RIC1 | Information provided on ipc code assigned before grant |
Ipc: G06K 9/00 20060101AFI20150302BHEP |
|
| 17P | Request for examination filed |
Effective date: 20151008 |
|
| RBV | Designated contracting states (corrected) |
Designated state(s): AL AT BE BG CH CY CZ DE DK EE ES FI FR GB GR HR HU IE IS IT LI LT LU LV MC MK MT NL NO PL PT RO RS SE SI SK SM TR |
|
| 17Q | First examination report despatched |
Effective date: 20160413 |
|
| STAA | Information on the status of an ep patent application or granted ep patent |
Free format text: STATUS: THE APPLICATION HAS BEEN REFUSED |
|
| 18R | Application refused |
Effective date: 20180608 |