EP2605046A2 - Vorrichtung und Verfahren zur Lokalisierung seismischer Ereignisse mit einem Empfängerarray - Google Patents
Vorrichtung und Verfahren zur Lokalisierung seismischer Ereignisse mit einem Empfängerarray Download PDFInfo
- Publication number
- EP2605046A2 EP2605046A2 EP12197282.2A EP12197282A EP2605046A2 EP 2605046 A2 EP2605046 A2 EP 2605046A2 EP 12197282 A EP12197282 A EP 12197282A EP 2605046 A2 EP2605046 A2 EP 2605046A2
- Authority
- EP
- European Patent Office
- Prior art keywords
- seismic data
- simo
- subsurface
- receivers
- signal model
- Prior art date
- Legal status (The legal status is an assumption and is not a legal conclusion. Google has not performed a legal analysis and makes no representation as to the accuracy of the status listed.)
- Withdrawn
Links
- 238000000034 method Methods 0.000 title claims abstract description 50
- 238000001514 detection method Methods 0.000 claims abstract description 42
- 230000002596 correlated effect Effects 0.000 claims abstract description 34
- 241001168730 Simo Species 0.000 claims abstract description 30
- 238000002347 injection Methods 0.000 claims abstract description 15
- 239000007924 injection Substances 0.000 claims abstract description 15
- 230000000875 corresponding effect Effects 0.000 claims abstract description 8
- 238000004880 explosion Methods 0.000 claims abstract description 7
- MHKKFFHWMKEBDW-UHFFFAOYSA-N dimethyl 2,5-dioxocyclohexane-1,4-dicarboxylate Chemical compound COC(=O)C1CC(=O)C(C(=O)OC)CC1=O MHKKFFHWMKEBDW-UHFFFAOYSA-N 0.000 claims abstract 11
- 230000007246 mechanism Effects 0.000 claims description 28
- 238000009826 distribution Methods 0.000 claims description 8
- 238000004364 calculation method Methods 0.000 claims description 2
- 230000006870 function Effects 0.000 description 11
- 239000012530 fluid Substances 0.000 description 9
- 238000006073 displacement reaction Methods 0.000 description 5
- 230000008569 process Effects 0.000 description 5
- 208000013201 Stress fracture Diseases 0.000 description 4
- 238000012937 correction Methods 0.000 description 4
- 238000010586 diagram Methods 0.000 description 4
- 229930195733 hydrocarbon Natural products 0.000 description 4
- 150000002430 hydrocarbons Chemical class 0.000 description 4
- 230000003068 static effect Effects 0.000 description 4
- 239000004215 Carbon black (E152) Substances 0.000 description 3
- 230000015654 memory Effects 0.000 description 3
- 238000012806 monitoring device Methods 0.000 description 3
- 238000012545 processing Methods 0.000 description 3
- 238000005086 pumping Methods 0.000 description 3
- 238000004422 calculation algorithm Methods 0.000 description 2
- 238000004590 computer program Methods 0.000 description 2
- 230000000694 effects Effects 0.000 description 2
- 238000012544 monitoring process Methods 0.000 description 2
- 239000002245 particle Substances 0.000 description 2
- 239000002689 soil Substances 0.000 description 2
- 230000008901 benefit Effects 0.000 description 1
- 238000004891 communication Methods 0.000 description 1
- 238000013500 data storage Methods 0.000 description 1
- 230000001939 inductive effect Effects 0.000 description 1
- 239000007788 liquid Substances 0.000 description 1
- 239000000203 mixture Substances 0.000 description 1
- 238000012986 modification Methods 0.000 description 1
- 230000004048 modification Effects 0.000 description 1
- 230000003287 optical effect Effects 0.000 description 1
- 230000035699 permeability Effects 0.000 description 1
- 239000004576 sand Substances 0.000 description 1
- 239000000243 solution Substances 0.000 description 1
- XLYOFNOQVPJJNP-UHFFFAOYSA-N water Substances O XLYOFNOQVPJJNP-UHFFFAOYSA-N 0.000 description 1
Images









Classifications
-
- G—PHYSICS
- G01—MEASURING; TESTING
- G01V—GEOPHYSICS; GRAVITATIONAL MEASUREMENTS; DETECTING MASSES OR OBJECTS; TAGS
- G01V1/00—Seismology; Seismic or acoustic prospecting or detecting
- G01V1/28—Processing seismic data, e.g. for interpretation or for event detection
- G01V1/282—Application of seismic models, synthetic seismograms
-
- G—PHYSICS
- G01—MEASURING; TESTING
- G01V—GEOPHYSICS; GRAVITATIONAL MEASUREMENTS; DETECTING MASSES OR OBJECTS; TAGS
- G01V1/00—Seismology; Seismic or acoustic prospecting or detecting
- G01V1/28—Processing seismic data, e.g. for interpretation or for event detection
- G01V1/288—Event detection in seismic signals, e.g. microseismics
-
- G—PHYSICS
- G01—MEASURING; TESTING
- G01V—GEOPHYSICS; GRAVITATIONAL MEASUREMENTS; DETECTING MASSES OR OBJECTS; TAGS
- G01V1/00—Seismology; Seismic or acoustic prospecting or detecting
- G01V1/28—Processing seismic data, e.g. for interpretation or for event detection
- G01V1/36—Effecting static or dynamic corrections on records, e.g. correcting spread; Correlating seismic signals; Eliminating effects of unwanted energy
- G01V1/364—Seismic filtering
- G01V1/366—Seismic filtering by correlation of seismic signals
-
- G—PHYSICS
- G01—MEASURING; TESTING
- G01V—GEOPHYSICS; GRAVITATIONAL MEASUREMENTS; DETECTING MASSES OR OBJECTS; TAGS
- G01V2210/00—Details of seismic processing or analysis
- G01V2210/10—Aspects of acoustic signal generation or detection
- G01V2210/12—Signal generation
- G01V2210/123—Passive source, e.g. microseismics
-
- G—PHYSICS
- G01—MEASURING; TESTING
- G01V—GEOPHYSICS; GRAVITATIONAL MEASUREMENTS; DETECTING MASSES OR OBJECTS; TAGS
- G01V2210/00—Details of seismic processing or analysis
- G01V2210/50—Corrections or adjustments related to wave propagation
- G01V2210/55—Array focusing; Phased arrays
-
- G—PHYSICS
- G01—MEASURING; TESTING
- G01V—GEOPHYSICS; GRAVITATIONAL MEASUREMENTS; DETECTING MASSES OR OBJECTS; TAGS
- G01V2210/00—Details of seismic processing or analysis
- G01V2210/60—Analysis
- G01V2210/65—Source localisation, e.g. faults, hypocenters or reservoirs
Definitions
- Embodiments of the subject matter disclosed herein generally relate to methods and systems and, more particularly, to mechanisms and techniques for locating microseismic events underground.
- Stimulated fracturing operations are intended to increase the productivity of a hydrocarbon reservoir working well. These operations include injecting a high-pressure fluid into a layer of the subsoil where the reservoir is located. The injection of the fluid produces micro-fractures in the layer. This technique makes it possible to increase the permeability of the reservoir by favoring hydrocarbon circulation via the micro-fractures to the well.
- micro-fractures of the layers are the source of microseismic events.
- geologists or geophysicists conventionally record at the surface waves generated by the micro-fractures.
- the waves are recorded as a function of time by one or more receivers.
- the signals recorded by the receivers are known as seismic traces.
- the stimulated fracturing operations require continuous monitoring of the reservoir so as, on one hand, to monitor the progress of the fracturing operation and, on the other, to stop the operations when the fracturing is sufficient.
- the seismic sensors are deployed in the vicinity of the reservoir.
- the conventional way of determining the microseismic events in the explored area is to deploy a few sensors inside the observation well(s) and to monitor the fracturing events.
- Another way is to deploy seismic sensors at or close to the earth surface.
- the known methods do not enable rapid data processing, and are not suitable for real-time subsoil monitoring. Further, if the receivers are installed in the injection well, the well tends to vibrate under the effect of this injection, which raises the noise level on the receivers positioned in this well. Also, it is not always possible to have access to another well. Furthermore, the known methods do not provide an accurate location of the microseismic event and/or its type.
- the method includes receiving recorded seismic data S(t, Rc) acquired by a plurality of receivers as a function of time t and a position Rc; receiving a reference signal model SiMo(t, Rc) that corresponds to seismic data recorded by the plurality of receivers if an event occurs at an injection point in the subsurface; time correlating the recorded seismic data S(t, Rc) with the reference signal model SiMo(t, r) to determine correlated seismic data DMSS; calculating a detection curve for each of plural cells in a given volume in the subsurface of the earth based on the correlated seismic data DMSS; and determining a seismic location in the volume of the microseismic event based on a largest value of maximums of the detection curves calculated for various points of the given volume in the subsurface.
- a device for locating a microseismic event taking place in a subsurface of the earth includes an interface configured to receive recorded seismic data S(t, Rc) acquired by a plurality of receivers as a function of time t and a position Rc; and a processor connected to the interface.
- the processor is configured to receive a reference signal model SiMo(t, Rc) that corresponds to seismic data recorded by the plurality of receivers if an explosion occurs at an injection point in the subsurface, time correlate the recorded seismic data S(t, Rc) with the reference signal model SiMo(t, Rc) to determine correlated seismic data DMSS, calculate a detection curve for each of plural cells in a given volume in the subsurface of the earth based on the correlated seismic data DMSS, and determine a seismic location in the volume of the microseismic event based on a largest value of maximums of the detection curves calculated for various points of the given volume in the subsurface.
- Figure 1 is a schematic diagram of a system for determining a position of a microseismic event according to an exemplary embodiment
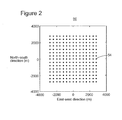
- Figure 2 is a grid of receivers provided on the ground for measuring seismic data
- Figure 3 is a schematic representation of data measured by receivers according to an exemplary embodiment
- Figure 4 is a flowchart illustrating a method for detecting, locating and characterizing a microseismic event according to an exemplary embodiment
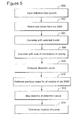
- Figure 5 is a flow chart illustrating an algorithm for locating a microseismic event according to an exemplary embodiment
- Figure 6 is a schematic diagram showing a location of a calibration point and a location of a microseismic event according to an exemplary embodiment
- Figure 7 is a schematic representation of a cross-correlation between raw data and a reference signal model according to an exemplary embodiment
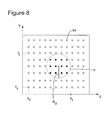
- Figure 8 is a schematic diagram of a plurality of receivers and a vicinity of one receiver
- Figure 9 is a schematic representation of a cross-correlation between raw data and a reference signal model when a microseismic event occurs at the same location as a calibration shot according to an exemplary embodiment
- Figure 10 is a schematic representation of maximum values of the detection curve obtained at each point of a grid according to an exemplary embodiment
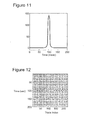
- Figure 11 is a graph of a detection curve for a given signal model according to an exemplary embodiment
- Figure 12 is a schematic representation of a cross-correlation of raw data and an extrapolated reference signal model according to an exemplary embodiment
- Figure 13 is a flow chart of a method for calculating a position of a microseismic event according to an exemplary embodiment
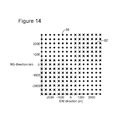
- Figure 14 is a schematic representation of a amplitudes and signs associated with a correlation product according to an exemplary embodiment
- Figure 15 is a schematic diagram of a device in which one or more of the methods may be implemented.
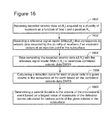
- Figure 16 is a flow chart of a method for calculating a position of a microseismic event according to an exemplary embodiment.
- a method that locates or locates and characterizes microseismic events observed in a subsurface of the earth.
- the method correlates recorded traces with a signal model for determining the location of the microseismic events and amplitudes and signs of the correlated traces for determining the characteristics of the microseismic events.
- FIG. 1 A system 10 for recording and/or determining the positions of the microseismic events is illustrated in Figure 1 .
- the system 10 is deployed above a subsurface zone of interest that includes geological layers 12, 14, and 16.
- Layer 16 is a layer containing hydrocarbons.
- a well 18 is drilled through the geological layers to the layer 16.
- the system 10 includes a fracturing device 20 and a monitoring device 50.
- the fracturing device 20 includes a fluid injection column 22 extending into the well 18 and a pumping unit 24 positioned on the surface 26 of the subsurface zone.
- the injection column 22 includes a lower end 28 provided with openings 30 and an upper end 32 connected to the pumping unit 24.
- the pumping unit 24 includes a pump 34 configured to inject a high-pressure fracturing fluid 36 into the layer 16 via the injection column 22.
- the fracturing fluid typically consists of a mixture of a liquid (for example, water) and particles (for example, sand).
- the fracturing fluid is discharged from the column 22 via openings 30 created by well casing perforations.
- the fracturing fluid enters the subsurface layer 16, inducing fracturing of the layer 16, i.e. the appearance of cracks inside the layer 16.
- the particles contained in the fracturing fluid are forced into the cracks and remain in place in the cracks when the fluid pressure is released, thus forming a permeable network enabling hydrocarbon to flow in the layer 16 to the well 18.
- the monitoring device 50 may be separately located from the fracturing device 24 or on the fracturing device 24.
- the monitoring device may include a network 52 of receivers (e.g., geophones) 54, a recording unit 56 and a processing unit 58.
- the receiver network 52 includes a plurality of receivers 54 arranged on the soil surface 26 or in the vicinity of this surface.
- the receivers 54 may be arranged on the nodes of a grid 60 as shown in Figure 2 or may be arranged in any other configuration.
- the processing unit 58 may be configured to implement any of the methods discussed next.
- the soil movements detected by the receivers 54 are converted into signals (e.g., electric voltages) and they are transmitted to the recording unit 56 to be recorded therein.
- the recordings obtained represent the seismic data (or traces).
- signals s(t, r) are detected by the receivers 54.
- the signal s is a function of the position r of the receiver and the time t at which it is recorded.
- An example of traces recorded by the plural receivers shown in Figure 2 is illustrated in Figure 3 , in which each trace (identified by a trace index parameter) is plotted versus time.
- a method for detecting, locating, and characterizing a microseismic event progresses as discussed next.
- step 400 a set of signal models that depend on a velocity model and the statics of the monitored area is selected or determined. Part of the information contained in the signal model is the time of propagation of an event (e.g., an explosion) that would occur at a theoretical injection point (hereafter referred as calibration point), e.g., point 62 in Figure 1 , and would be recorded by the seismic receivers 54 located close to the surface 26.
- an event e.g., an explosion
- calibration point e.g., point 62 in Figure 1
- step 402 the recorded seismic data at the receivers 54 is correlated with the data of the signal model from step 400 for a current location, as will be discussed later. If the microseismic event is located at the same place as the calibration point, the correlations should exhibit a seismic phase that has the same arrival time for each sensor.
- the microseismic event may be detected. For example, a method for detecting the microseismic event is described in U.S. Patent Publication Application no. 2010/0302905, author J. Meunier , which is assigned to the assignee of this patent application, and which content is incorporated herein by reference in its entirety.
- the method advances to step 404 for further calculations for locating the position of the microseismic event. It is noted that in these steps a focal mechanism of the microseismic events may be ignored.
- each correlation is further correlated with sum of correlations in a vicinity of a potential location of the microseismic event and these correlations are summed together to calculate a reference detection curve. Based on multiple detection curves calculated for a plurality of potential locations of the micro-seismic event, the actual location of the micro-seismic event is determined.
- the micro-seismic event (which was located in step 404) is characterized in terms of its direction, dip and rake, by inverting the amplitudes and sign distributions of the detected event based on the amplitudes of the above noted correlations. For example, the amplitudes are (i) inverted to determine the focal mechanism or (ii) the amplitudes are modified and summed based on various possible focal mechanisms to determine the correct focal mechanism.
- the above noted steps are now discussed in more details.
- the step 400 of building a set of signal models (SSM) involves generating a model at each point Sg of a source grid.
- Sg indicates a possible position of a source of the micro-seismic event.
- the potential source positions Sg are physically distributed under a receiver grid as the seismic event is generated underground and the receivers are placed above ground.
- the source grid is a three-dimensional grid.
- a signal model for a reference source position Sg0 (i.e., in the subsurface) is considered to be SiMo ( t, Rc, Sg 0) , where Rc is the vector indicating the receiver position in a receiver grid
- the signal model SiMo ( t, Rc, Sg 0) can be extrapolated from Sg0 to another location Sg (in the source grid) and the extrapolated model is described by SiMo ( t, Rc, Sg ). This model may be calculated or measured.
- the seismic waves that propagate from the reference point (X Sg0 , Y Sg0, Z Sg0 ) to each receiver 54 (location Rc in the receiver grid) may be calculated so that the signals to be recorded by the receivers may be estimated.
- the signal model may be measured by producing a controlled micro-seismic event at the reference point (X Sg0 , Y Sg0, Z Sg0 ) and recording the traces detected at the receivers 54.
- a perforation shot location point 62 characterized by coordinates X Sg0 , Y Sg0, and Z Sg0
- a micro-seismic event has a location 64 characterized by coordinates Xms, Yms, and Zms as shown in Figure 6
- the position of a receiver is characterized by the vector Rc.
- the position of the perforation shot location and the position of the micro-seismic event may be different from each other or coincide.
- the signal model may be characterized by an rms velocity of the medium Vrms and by a residual statics correction Stat(Sg0) for a location Sg0.
- the model may be more complex, i.e., has plural velocities depending on the anisotropy of the subsurface.
- the rms velocity describes the fact that various layers in the earth have different properties and thus, different speeds
- the residual statics correction describes, for example, that a location Rc at the surface 26 of the earth may be elevated by a given height relative to other points of the surface and this needs to be accounted for.
- a correction is necessary to be applied to this point if a receiver 54 happens to be provided at this point or near it.
- Other examples of residual statics corrections are know in the art.
- the SSM set is built for each point Sg of the source grid.
- step 402 associated with the detection of the microseismic event is not detailed here as this step is described in the above noted patent application.
- FIG. 5 shows a step 500 in which data detected data by the receivers 54 is provided as input.
- a signal model from the SSM is selected and this model is characterized, for example, by SiMo ( t,Rc,Sg ) .
- the data may be correlated as discussed next.
- seismic data S(t, Rc) (recorded by the receivers 54) is correlated with the signal model SiMo ( t, Rc, Sg ).
- the correlation may include a convolution operator and the correlation operator is denoted " ⁇ .”
- the convolution product is a mathematical operation that combines two different functions f and g to produce a third function h that can be viewed as a modified version of one of the original functions f and g.
- the convolution product in this embodiment is performed in time t and not in space (Rc).
- the complex conjugate of a signal s(t, r) that varies in time t and is recorded at position r is understood to be s ( t, r ) .
- DMSS DM data correlated by SS where SS is defined next
- the vicinity V may be a disk having a radius Rd centered on the trace DM ( t, Rc, Sg ) in question.
- Figure 8 illustrates the plural receivers 54 and the vicinity V having the radius Rd. It is noted that Figure 8 illustrates the receiver grid, which is substantially flat as the receivers lie on the ground. The source grid discussed above extends beneath the receiver grid.
- the above noted correlations i.e., DM and not DMSS
- the correlations exhibit a seismic phase that has the same arrival time for each receiver, as shown in Figure 9 .
- the correlations exhibit a seismic phase that has an arrival time that differs from one sensor to the other as shown in Figure 7 . The time shifts from one receiver to the other increase with the distance between the microseismic event and the calibration point.
- a source grid 70 is defined around the reference point as shown in Figure 10 .
- the grid 70 is three dimensional (located in the subsurface) but Figure 10 illustrates only a two dimensional slide of the grid for simplicity.
- the receiver grid shown in Figure 8 may be in top of the three dimensional source grid of Figure 10 so that the sources are below the receivers.
- a detection curve is calculated in step 512 versus time for each point of the source grid 70.
- step 512 maximums of the detection curves at each point are identified and plotted on the source grid and the location of the microseismic event is determined in step 514 by selecting the position corresponding to the largest maximum of the detection curves.
- step 512 a map of the maxima of the detection curves is analyzed and the location of the maximum is interpolated between the grid points in step 514.
- Figure 10 shows that detection curves have been calculated for all points 72 and a maximum of 10 has been determined for location 74.
- the remaining cells 72 show a value of the detection curve between 1 and 9.
- Figure 11 shows an example of the shape of the detection curve when calculated in time for a given extrapolated position.
- the arrival time of the maximum of the correlation between the observed data and the model extrapolated at this location is constant as observed in Figure 12 .
- an algorithm for calculating the position of the microseismic event may be implemented in a processor to start with a step 1300 in which traces S(t, Rc) are received from the recorders.
- a signal model SiMo(t, Rc, Sg) is selected from the set of signal models SSM.
- the selected signal model is correlated with the recorded traces to produce the DM(t, Rc, Sg).
- step 1306 DM(t, Rc, Sg) is further multiplied with the sum of neighboring traces SS(t, Rc, Sg) (calculated in step 1305) for determining DMSS(t, Rc, Sg).
- step 1308 the detection curve DC(t) is calculated for the current location Sg.
- step 1311 which consists of repeating steps 1302 to 1312 for all signal models of set SSM after all points of the grid have been considered. Note that there is a detection curve (that varies in time) for each point of the grid.
- step 1312 the maximum point for each detection curve is selected and mapped as shown in Figure 10 . The largest value of this map is selected in step 1314 as indicating the location of the microseismic event.
- step 406 for characterizing the microseismic event.
- the sign and amplitude changes of the correlations DM are considered. More specifically, any given focal mechanism is associated to a certain distribution of signed amplitudes of DM.
- the focal mechanism of a seismic event describes the inelastic deformation in the source region that generates the seismic waves. Focal mechanisms are derived from a solution of the moment tensor for the seismic event, which itself is estimated by an analysis of the observed seismic waveforms. Depending on the focal mechanism, the ground displacements measured by the receivers may be only positive (if an explosion occurred in the subsurface) or both positive and negative (for an earthquake) or may have other distributions.
- an alternate method is possible for determining the focal mechanism.
- the signs and amplitudes of the correlations may be inverted to directly determine the focal mechanism. Irrespective of the chosen process, after step 406 the focal mechanism is determined.
- step 406 shown in Figure 4 characteristics of the microseismic event are obtained from the focal mechanism, and the signed amplitude distribution of the correlations, as illustrated in Figure 14.
- Figure 14 shows some of the correlations 80 calculated at the receivers 54 having one sign and the remainder of the correlations 82 having a different sign.
- Each focal mechanism corresponds to a given amplitude and sign distribution, i.e., has its own signature. The inversion of this distribution leads to the characteristics of the fault on which a microseismic event occurred, i.e., its direction, its dip and its rake.
- An exemplary computing arrangement 1500 suitable for performing the activities described in the exemplary embodiments may include server 1501.
- a server 1501 may include a central processor (CPU) 1502 or 58 coupled to a random access memory (RAM) 1504 and to a read-only memory (ROM) 1506.
- the ROM 1506 may also be other types of storage media to store programs, such as programmable ROM (PROM), erasable PROM (EPROM), etc.
- the processor 1502 may communicate with other internal and external components through input/output (I/O) circuitry 1508 and bussing 1510, to provide control signals and the like.
- the processor 1502 carries out a variety of functions as is known in the art, as dictated by software and/or firmware instructions.
- the server 1501 may also include one or more data storage devices, including hard and floppy disk drives 1512, CD-ROM drives 1514, and other hardware capable of reading and/or storing information such as DVD, etc.
- software for carrying out the above discussed steps may be stored and distributed on a CD-ROM 1516, diskette 1518 or other form of media capable of portably storing information. These storage media may be inserted into, and read by, devices such as the CD-ROM drive 1514, the disk drive 1512, etc.
- the server 1501 may be coupled to a display 1520, which may be any type of known display or presentation screen, such as LCD displays, plasma display, cathode ray tubes (CRT), etc.
- a user input interface 1522 is provided, including one or more user interface mechanisms such as a mouse, keyboard, microphone, touch pad, touch screen, voice-recognition system, etc.
- the server 1501 may be coupled to other computing devices, such as the landline and/or wireless terminals via a network.
- the server may be part of a larger network configuration as in a global area network (GAN) such as the Internet 1528, which allows ultimate connection to the various landline and/or mobile clients.
- GAN global area network
- the exemplary embodiments may be embodied in a wireless communication device, a computer network, as a method or in a computer program product. Accordingly, the exemplary embodiments may take the form of an entirely hardware embodiment or an embodiment combining hardware and software aspects. Further, the exemplary embodiments may take the form of a computer program product stored on a computer-readable storage medium having computer-readable instructions embodied in the medium. Any suitable computer readable medium may be utilized including hard disks, CD-ROMs, digital versatile disc (DVD), optical storage devices, or magnetic storage devices such a floppy disk or magnetic tape. Other non-limiting examples of computer readable media include flash-type memories or other known memories.
- the method includes a step 1600 of receiving recorded seismic data S(t, Rc) acquired by a plurality of receivers as a function of time t and a position r; a step 1602 of receiving a reference signal model SiMo(t, r) that corresponds to seismic data recorded by the plurality of receivers if an explosion occurs at an injection point in the subsurface; a step 1604 of time correlating the recorded seismic data s(t, r) with the reference signal model SiMo(t, r) to determine correlated seismic data DMSS; a step 1606 of calculating a detection curve for each of plural cells in a given volume in the subsurface of the earth based on the correlated seismic data DMSS; and a step 1608 of determining a seismic location in the volume of the microseismic event based on a largest value of maximums of the detection curve
- the disclosed exemplary embodiments provide a system and a method for estimating a position and/or a characteristic of a microseismic event. It should be understood that this description is not intended to limit the invention. On the contrary, the exemplary embodiments are intended to cover alternatives, modifications and equivalents, which are included in the spirit and scope of the invention as defined by the appended claims. Further, in the detailed description of the exemplary embodiments, numerous specific details are set forth in order to provide a comprehensive understanding of the claimed invention. However, one skilled in the art would understand that various embodiments may be practiced without such specific details.
Landscapes
- Engineering & Computer Science (AREA)
- Remote Sensing (AREA)
- Life Sciences & Earth Sciences (AREA)
- Physics & Mathematics (AREA)
- Environmental & Geological Engineering (AREA)
- Acoustics & Sound (AREA)
- Geology (AREA)
- General Life Sciences & Earth Sciences (AREA)
- General Physics & Mathematics (AREA)
- Geophysics (AREA)
- Business, Economics & Management (AREA)
- Emergency Management (AREA)
- Geophysics And Detection Of Objects (AREA)
Applications Claiming Priority (1)
| Application Number | Priority Date | Filing Date | Title |
|---|---|---|---|
| US201161576019P | 2011-12-15 | 2011-12-15 |
Publications (3)
| Publication Number | Publication Date |
|---|---|
| EP2605046A2 true EP2605046A2 (de) | 2013-06-19 |
| EP2605046A3 EP2605046A3 (de) | 2013-08-14 |
| EP2605046A8 EP2605046A8 (de) | 2014-02-12 |
Family
ID=47559129
Family Applications (1)
| Application Number | Title | Priority Date | Filing Date |
|---|---|---|---|
| EP12197282.2A Withdrawn EP2605046A3 (de) | 2011-12-15 | 2012-12-14 | Vorrichtung und Verfahren zur Lokalisierung seismischer Ereignisse mit einem Empfängerarray |
Country Status (4)
| Country | Link |
|---|---|
| US (1) | US20130158878A1 (de) |
| EP (1) | EP2605046A3 (de) |
| AU (1) | AU2012261738B2 (de) |
| CA (1) | CA2798776A1 (de) |
Cited By (1)
| Publication number | Priority date | Publication date | Assignee | Title |
|---|---|---|---|---|
| CN103399300A (zh) * | 2013-07-31 | 2013-11-20 | 中国石油集团川庆钻探工程有限公司地球物理勘探公司 | 波包叠加微地震地面定位方法 |
Families Citing this family (7)
| Publication number | Priority date | Publication date | Assignee | Title |
|---|---|---|---|---|
| CN105204068B (zh) * | 2014-06-26 | 2017-08-25 | 中石化石油工程地球物理有限公司胜利分公司 | 基于实际资料频谱特征的非线性扫描信号设计方法 |
| US20180164454A1 (en) * | 2015-05-27 | 2018-06-14 | Schlumberger Technology Corporation | Determining residual statics of survey receivers |
| US11327188B2 (en) * | 2018-08-22 | 2022-05-10 | Saudi Arabian Oil Company | Robust arrival picking of seismic vibratory waves |
| CN113138420A (zh) * | 2020-01-20 | 2021-07-20 | 中国石油天然气集团有限公司 | 微地震事件定位方法及装置 |
| CN111221034B (zh) * | 2020-01-20 | 2022-02-25 | 山东黄金矿业股份有限公司新城金矿 | 矿山微地震源定位方法及模拟检验系统 |
| US12535610B2 (en) * | 2023-05-15 | 2026-01-27 | Halliburton Energy Services, Inc. | Operating a seismic sensing system |
| CN117849896B (zh) * | 2024-01-17 | 2024-10-22 | 北京神州明达高科技有限公司 | 一种集成式微震生命探测方法 |
Citations (1)
| Publication number | Priority date | Publication date | Assignee | Title |
|---|---|---|---|---|
| US20100302905A1 (en) | 2009-05-27 | 2010-12-02 | Cggveritas Services Sa | Method for monitoring a subsoil zone, particularly during simulated fracturing operations |
Family Cites Families (4)
| Publication number | Priority date | Publication date | Assignee | Title |
|---|---|---|---|---|
| US4203161A (en) * | 1972-03-01 | 1980-05-13 | Texaco Inc. | Method of enhancing common depth point seismic data |
| US4344142A (en) * | 1974-05-23 | 1982-08-10 | Federal-Mogul Corporation | Direct digital control of rubber molding presses |
| GB2409722A (en) * | 2003-12-29 | 2005-07-06 | Westerngeco Ltd | Microseismic determination of location and origin time of a fracture generated by fracturing operation in a hydrocarbon well |
| US7978563B2 (en) * | 2009-08-18 | 2011-07-12 | Microseismic, Inc. | Method for passive seismic emission tomography including polarization correction for source mechanism |
-
2012
- 2012-06-22 US US13/530,307 patent/US20130158878A1/en not_active Abandoned
- 2012-12-13 CA CA2798776A patent/CA2798776A1/en not_active Abandoned
- 2012-12-14 EP EP12197282.2A patent/EP2605046A3/de not_active Withdrawn
- 2012-12-14 AU AU2012261738A patent/AU2012261738B2/en not_active Ceased
Patent Citations (1)
| Publication number | Priority date | Publication date | Assignee | Title |
|---|---|---|---|---|
| US20100302905A1 (en) | 2009-05-27 | 2010-12-02 | Cggveritas Services Sa | Method for monitoring a subsoil zone, particularly during simulated fracturing operations |
Cited By (2)
| Publication number | Priority date | Publication date | Assignee | Title |
|---|---|---|---|---|
| CN103399300A (zh) * | 2013-07-31 | 2013-11-20 | 中国石油集团川庆钻探工程有限公司地球物理勘探公司 | 波包叠加微地震地面定位方法 |
| CN103399300B (zh) * | 2013-07-31 | 2015-07-08 | 中国石油集团川庆钻探工程有限公司地球物理勘探公司 | 波包叠加微地震地面定位方法 |
Also Published As
| Publication number | Publication date |
|---|---|
| AU2012261738A1 (en) | 2013-07-04 |
| EP2605046A8 (de) | 2014-02-12 |
| CA2798776A1 (en) | 2013-06-15 |
| US20130158878A1 (en) | 2013-06-20 |
| AU2012261738B2 (en) | 2014-09-18 |
| EP2605046A3 (de) | 2013-08-14 |
Similar Documents
| Publication | Publication Date | Title |
|---|---|---|
| AU2012261738B2 (en) | Device and method for locating microseismic events using array of receivers | |
| CN103765245B (zh) | 混合式确定性-地质统计地球模型 | |
| US9772415B2 (en) | Correcting time lapse seismic data for overburden and recording effects | |
| US8427903B2 (en) | Method for monitoring a subsoil zone using a plurality of correlated traces, particularly during simulated fracturing operations | |
| US10345463B2 (en) | Methods and systems for using known source events in seismic data processing | |
| NO20130824A1 (no) | Seismisk traseattributt | |
| US11061156B2 (en) | Microseismic velocity models derived from historical model classification | |
| CA2767552A1 (en) | Reservoir mapping with fracture pulse signal background | |
| CN106255902B (zh) | 使用地震数据分析地质特征的系统和方法 | |
| CN108375785B (zh) | 裂缝带位置校正方法及装置 | |
| US20130088940A1 (en) | Device and method for source mechanism identification | |
| EP2775321A2 (de) | Verfahren und Vorrichtung zur Berechnung von Zeitverschiebungen und Zeitbelastungen in seismischen Daten | |
| US10317543B2 (en) | Estimation of a far field signature in a second direction from a far field signature in a first direction | |
| EP3012669A2 (de) | System und verfahren zur vorhersage der frontankunftszeit in einer seismischen reservoirüberwachung | |
| EP2581764A1 (de) | Vorrichtung und Verfahren zur Identifikation eines Quellenmechanismus | |
| CN118837946B (zh) | 一种微地震的定位方法、装置、设备及介质 | |
| CN120831694A (zh) | 针对深层储层的非规则地面微地震观测系统设计方法、装置、电子设备及介质 | |
| CN121410778A (zh) | 使用基于混合l1/l2走时差的全波形反演的地震成像的系统及方法 | |
| Hakso | Analysis of microseismic multiplets in a hydraulic fracturing operation | |
| CN119291761A (zh) | 一种恢复三维古构造的方法和系统 | |
| CN119916469A (zh) | 适用于声波远探测井孔模式下的噪音处理方法及装置 |
Legal Events
| Date | Code | Title | Description |
|---|---|---|---|
| PUAI | Public reference made under article 153(3) epc to a published international application that has entered the european phase |
Free format text: ORIGINAL CODE: 0009012 |
|
| AK | Designated contracting states |
Kind code of ref document: A2 Designated state(s): AL AT BE BG CH CY CZ DE DK EE ES FI FR GB GR HR HU IE IS IT LI LT LU LV MC MK MT NL NO PL PT RO RS SE SI SK SM TR |
|
| AX | Request for extension of the european patent |
Extension state: BA ME |
|
| PUAL | Search report despatched |
Free format text: ORIGINAL CODE: 0009013 |
|
| AK | Designated contracting states |
Kind code of ref document: A3 Designated state(s): AL AT BE BG CH CY CZ DE DK EE ES FI FR GB GR HR HU IE IS IT LI LT LU LV MC MK MT NL NO PL PT RO RS SE SI SK SM TR |
|
| AX | Request for extension of the european patent |
Extension state: BA ME |
|
| RIC1 | Information provided on ipc code assigned before grant |
Ipc: G01V 1/36 20060101ALI20130708BHEP Ipc: G01V 1/28 20060101AFI20130708BHEP |
|
| RIN1 | Information on inventor provided before grant (corrected) |
Inventor name: REBEL, ESTELLE Inventor name: MEUNIER, JULIEN |
|
| 17P | Request for examination filed |
Effective date: 20140214 |
|
| RBV | Designated contracting states (corrected) |
Designated state(s): AL AT BE BG CH CY CZ DE DK EE ES FI FR GB GR HR HU IE IS IT LI LT LU LV MC MK MT NL NO PL PT RO RS SE SI SK SM TR |
|
| RAP1 | Party data changed (applicant data changed or rights of an application transferred) |
Owner name: CGG SERVICES SA |
|
| 17Q | First examination report despatched |
Effective date: 20180530 |
|
| STAA | Information on the status of an ep patent application or granted ep patent |
Free format text: STATUS: THE APPLICATION IS DEEMED TO BE WITHDRAWN |
|
| 18D | Application deemed to be withdrawn |
Effective date: 20181010 |