EP2600385A1 - Method for identifying microorganisms by mass spectrometry - Google Patents
Method for identifying microorganisms by mass spectrometry Download PDFInfo
- Publication number
- EP2600385A1 EP2600385A1 EP11306610.4A EP11306610A EP2600385A1 EP 2600385 A1 EP2600385 A1 EP 2600385A1 EP 11306610 A EP11306610 A EP 11306610A EP 2600385 A1 EP2600385 A1 EP 2600385A1
- Authority
- EP
- European Patent Office
- Prior art keywords
- mass
- max
- peaks
- microorganisms
- intervals
- Prior art date
- Legal status (The legal status is an assumption and is not a legal conclusion. Google has not performed a legal analysis and makes no representation as to the accuracy of the status listed.)
- Withdrawn
Links
Images

Classifications
-
- H—ELECTRICITY
- H01—ELECTRIC ELEMENTS
- H01J—ELECTRIC DISCHARGE TUBES OR DISCHARGE LAMPS
- H01J49/00—Particle spectrometers or separator tubes
- H01J49/0027—Methods for using particle spectrometers
- H01J49/0036—Step by step routines describing the handling of the data generated during a measurement
-
- G—PHYSICS
- G01—MEASURING; TESTING
- G01N—INVESTIGATING OR ANALYSING MATERIALS BY DETERMINING THEIR CHEMICAL OR PHYSICAL PROPERTIES
- G01N33/00—Investigating or analysing materials by specific methods not covered by groups G01N1/00 - G01N31/00
- G01N33/48—Biological material, e.g. blood, urine; Haemocytometers
- G01N33/50—Chemical analysis of biological material, e.g. blood, urine; Testing involving biospecific ligand binding methods; Immunological testing
- G01N33/68—Chemical analysis of biological material, e.g. blood, urine; Testing involving biospecific ligand binding methods; Immunological testing involving proteins, peptides or amino acids
- G01N33/6803—General methods of protein analysis not limited to specific proteins or families of proteins
- G01N33/6848—Methods of protein analysis involving mass spectrometry
-
- G—PHYSICS
- G16—INFORMATION AND COMMUNICATION TECHNOLOGY [ICT] SPECIALLY ADAPTED FOR SPECIFIC APPLICATION FIELDS
- G16B—BIOINFORMATICS, i.e. INFORMATION AND COMMUNICATION TECHNOLOGY [ICT] SPECIALLY ADAPTED FOR GENETIC OR PROTEIN-RELATED DATA PROCESSING IN COMPUTATIONAL MOLECULAR BIOLOGY
- G16B40/00—ICT specially adapted for biostatistics; ICT specially adapted for bioinformatics-related machine learning or data mining, e.g. knowledge discovery or pattern finding
- G16B40/10—Signal processing, e.g. from mass spectrometry [MS] or from PCR
-
- G—PHYSICS
- G16—INFORMATION AND COMMUNICATION TECHNOLOGY [ICT] SPECIALLY ADAPTED FOR SPECIFIC APPLICATION FIELDS
- G16B—BIOINFORMATICS, i.e. INFORMATION AND COMMUNICATION TECHNOLOGY [ICT] SPECIALLY ADAPTED FOR GENETIC OR PROTEIN-RELATED DATA PROCESSING IN COMPUTATIONAL MOLECULAR BIOLOGY
- G16B99/00—Subject matter not provided for in other groups of this subclass
Definitions
- the invention relates to the field of the identification of microorganisms, and in particular bacteria, by means of mass spectrometry.
- microorganisms and more particularly bacteria.
- a sample of the microorganism is prepared and then a mass spectrum of the sample is acquired and pre-processed: denoising of the spectrum (elimination of noise), filtering of the background noise (attributable to the overloading of the detector).
- the major peaks of the pre-processed spectrum are then detected and the resulting list of peaks is "analyzed” and “compared” to data from a knowledge base constructed from lists of typical microorganism or group peaks. of microorganisms (strain, genus, family, etc ...) identified.
- the object of the invention is to propose a method allowing the robust identification of microorganisms by mass spectrometry by reducing the mass of information to be analyzed and reducing the impact of the lack of precision in the location of the peaks of the mass spectrum.
- the continuous space of the mass-on-charge ratios is logarithmically quantized, and only a single peak is retained in each quantization interval if several peaks are present in this interval. This allows a significant reduction in the amount of data to be processed.
- the precise position a peak is replaced by the reference of the interval at which the peak belongs. This reduces the measurement uncertainty concerning the position of peaks since it is no longer necessary to compare a precise position with the knowledge base. It is rather to compare the membership of the measured peak with an interval.
- the predetermined range of Thompsons is between 3000 Thompsons and 17000 Thompsons.
- the inventors have indeed found that this range was sufficient for the identification of most bacteria and yeasts / molds. It is observed in particular that peaks located below 3000 Thompsons are common to many microorganisms and are therefore not discriminating.
- the number of intervals is between 900 and 1500, in particular between 1200 and 1400.
- the inventors have found that these intervals constitute the optimal compromise between the loss of information induced by the quantification of the space of the Thompsons and accuracy gained by replacing the precise position of peaks by intervals.
- the peak kept in an interval of the subdivision is the peak with the strongest intensity.
- Other choices are possible, however. For example, it is possible to choose the average value or the median value of the intensities of the peaks present in the interval.
- the mass spectrometry is a MALDI-TOF spectrometry.
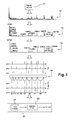
- the process begins with the preparation, in 10, of a sample of a bacterium to be identified, followed by the acquisition, at 12, of one or more mass spectra of the sample prepared by means of a spectrometer of pass type MALDI-TOF.
- MALDI-TOF mass spectrometry is well known per se and will therefore not be described in more detail later. For example, we can refer to the document Jackson O. Lay, “Maldi-tof Spectrometry of Bacteria," Mass Spectrometry Reviews, 2001, 20, 172-194 .
- the process continues, at 14, by the pretreatment of the acquired spectra, in particular to denoise and smooth the spectra. More particularly, the spectral baseline, which represents the background of the spectrometer, is removed.
- An identification of the peaks present in the acquired spectra is then carried out at 16, for example by means of a peak detection algorithm for example based on the detection of local maxima.
- a list of peaks for each spectrum, including the location and intensity of the peaks of the spectrum, is thus produced.
- step 18 of the figure on the figure 1 there are illustrated three lists of identified peaks, namely "list 1", “list 2” and “list 3", each corresponding to a measured mass spectrum.
- the space of the Thompsons is subdivided into 8 intervals, from “bin1” to "bin8", logarithmically increasing width, and only the peak of higher intensity is kept in each interval.
- a peak is eliminated for the interval "bin6" of the first list "list 1".
- each line corresponding to a list 980 0 98 0 1300 1556 400 2000 505 700 200 0 500 200 345 256 700 0 0 100 2340 1786 0 2507
- the process continues with a step of discretizing the intensities.
- This step may for example consist of a simple "binarization" (presence / absence).
- each row of the matrix is "binarized” then normalized, the matrix thus listing for each acquired spectrum the presence or absence of peak in the intervals.
- the previous matrix is binarized in the matrix: 1 0 1 0 1 1 1 1 1 1 1 0 1 1 1 1 1 0 0 1 1 1 0 1 1 0 1
- the information relevant for the identification of a bacterium is contained mainly in the absence and / or the presence of peaks, and that the intensity information is less relevant, in particular because of its high variability.
- standard classification tools such as logistic regression, discriminant analysis, classification trees, LASSO methods, algorithms of the type SVM (acronym of the English expression " support vector machine ").
- SVM synchrom of the English expression " support vector machine ".
- the binarized matrix can be used in all known classification tools.
- the method then continues, at 20, by analyzing the matrix obtained in the previous step. More particularly, a classification and decision algorithm 22 is implemented based on a knowledge base 24 constructed according to previously identified lists of microorganisms and / or types of microorganisms. One or more candidates, or a type of microorganisms (family, germ, species, subspecies) are thus identified for the sample analyzed.
- the method according to the invention thus makes it possible to reduce a list of peaks of variable size and with continuous values on 2 axes (m / z, intensities) to a vector of fixed and reasonable size.
- the knowledge base 24 is constructed from peak lists produced as described above, and associated with previously identified microorganisms and / or types of microorganisms. It will be understood that the invention applies to all types of classification algorithms and knowledge bases.
- the quantization according to the invention makes it possible in particular to reduce the quantity of data, as well as to eliminate the problems of precision in the location of the peaks, and thus makes it possible to build a more robust knowledge base, and in a simpler way.
- the implementation is much simpler than the calculation of a tolerant distance (for example) and allows a quasi-automated construction of the knowledge base
- the number of intervals is advantageously chosen between 900 and 1500, and preferably between 1200 and 1400 for the identification of microorganisms.
- the inventors have found that these intervals constitute the optimal compromise between the loss of information induced. by the quantification of the space of the Thompsons and the precision gained by the replacement of the precise position of the peaks by the intervals.
- the inventors have carried out tests and modeled, as shown in FIG. figure 2 , the number of peaks eliminated by quantization as a function of the number of intervals. In particular, it is noted that beyond a certain number of intervals, the reduction in the quantity of data is minimal, and that below a certain number, the number of peaks eliminated grows exponentially.
- the width of the intervals is equal to the resolution of the mass spectrometer used for testing for a mass-to-charge ratio of 17,000 Thompsons.
- the width of the intervals is equal to the resolution of the spectrometer for a mass-to-charge ratio of 3000 Thompsons.
- the quantization according to the invention makes it possible to have a maximum error rate that is at least 1 point lower (-15% error) than that of a constant quantization, as well as a smaller footprint. memory (-25%).
- the quantization according to the invention thus gives better results than constant quantization. This makes it possible to keep a small number of intervals, even by increasing the resolution of the mass spectrometer or the Thompsons range selected [ m min ; m max ].
- the quantization according to the invention requires only 700 intervals while the constant quantization requires 1700.
Abstract
Description
L'invention a trait au domaine de l'identification de microorganisme, et notamment des bactéries, au moyens de la spectrométrie de masse.The invention relates to the field of the identification of microorganisms, and in particular bacteria, by means of mass spectrometry.
Il est connu d'utiliser la spectrométrie de masse pour identifier des micro-organismes, et plus particulièrement des bactéries. Un échantillon du micro-organisme est préparé puis un spectre de masse de l'échantillon est acquis et prétraité : débruitage du spectre (élimination du bruit), filtrage du bruit de fond (attribuable à la surcharge du détecteur). Les pics importants du spectre prétraité sont alors détectés et la liste de pics ainsi obtenue est « analysée » et « comparée » à des données d'une base de connaissances construite à partir de listes de pics typiques d'un microorganisme ou d'un groupe de micro-organismes (souche, genre, famille, etc...) identifié.It is known to use mass spectrometry to identify microorganisms, and more particularly bacteria. A sample of the microorganism is prepared and then a mass spectrum of the sample is acquired and pre-processed: denoising of the spectrum (elimination of noise), filtering of the background noise (attributable to the overloading of the detector). The major peaks of the pre-processed spectrum are then detected and the resulting list of peaks is "analyzed" and "compared" to data from a knowledge base constructed from lists of typical microorganism or group peaks. of microorganisms (strain, genus, family, etc ...) identified.
Si le principe parait simple a priori, sa mise en oeuvre est toutefois délicate. En effet, tout d'abord, la quantité d'information contenue dans un spectre de masse, notamment le nombre de pics, est très importante, ce qui nécessite des outils de calcul très puissants pour créer une base de connaissance robuste, ainsi que pour la mise en oeuvre d'algorithmes de classification, de comparaison et de décision.Although the principle seems simple a priori, its implementation is delicate. Indeed, first of all, the amount of information contained in a mass spectrum, especially the number of peaks, is very important, which requires very powerful calculation tools to create a robust knowledge base, as well as to the implementation of classification, comparison and decision algorithms.
Ensuite, il existe une incertitude de mesure importante, notamment en ce qui concerne la localisation des pics dans le spectre. On observe en effet que d'une mesure à l'autre sur un même spectromètre, ainsi que d'un spectromètre à l'autre, un pic représentant une molécule donnée n'a pas une position fixe dans les spectres mesurés, ou à tout le moins le pic n'est pas contenu dans une plage. Ainsi, un pic d'un spectre acquis, et correspondant à une molécule de protéine donnée, peut ne pas être identifié comme correspondant à ladite molécule de protéine par l'algorithme de classification. Enfin, cette incertitude n'est pas constante sur la gamme de rapports masse-sur-charge et augmente à mesure que ce rapport augmente.Then, there is an important measurement uncertainty, especially as regards the location of the peaks in the spectrum. It is observed that from one measurement to another on the same spectrometer, as well as from one spectrometer to another, a peak representing a given molecule does not have a fixed position in the measured spectra, or at all the less the peak is not contained in a range. Thus, a peak of an acquired spectrum, and corresponding to a given protein molecule, may not be identified as corresponding to said protein molecule by the classification algorithm. Finally, this uncertainty is not constant over the mass-to-load ratio range and increases as this ratio increases.
Le but de l'invention est de proposer un procédé permettant l'identification robuste des micro-organismes par spectrométrie de masses grâce à une réduction de la masse d'informations à analyser et une réduction de l'impact de l'absence de précision dans la localisation des pics du spectre de masse.The object of the invention is to propose a method allowing the robust identification of microorganisms by mass spectrometry by reducing the mass of information to be analyzed and reducing the impact of the lack of precision in the location of the peaks of the mass spectrum.
A cet effet, l'invention a pour objet un procédé d'identification d'un microorganisme par spectrométrie de masse, comprenant :
- ■ l'acquisition d'au moins un spectre de masse dudit microorganisme ;
- ■ pour chaque spectre de masse acquis :
- o la détection de pics du spectre dans une gamme prédéterminée de masses ;
- o la génération d'une liste de pics répertoriant au plus un pic dans chaque intervalle d'une subdivision prédéterminée de la gamme des rapports masse-sur-charge, la largeur des intervalles de la subdivision augmentant avec le rapport masse-sur-charge selon les relations :


où les intervalles de la subdivision sont référencés par des entiers supérieurs à 1 depuis l'entier b min, pour les rapports masses-sur-charges les plus faibles de la gamme, à l'entier b max, pour les rapports masses-sur-charges les plus importants de la gamme, L(b) est la largeur de l'intervalle référencé par l'entier b, m min est une borne inférieure de la gamme des rapports masse-sur-charge, et m max est une borne supérieure de la gamme des rapports masse-sur-charge; et
- ■ l'analyse de la ou des listes de pics obtenues en fonction de la base de connaissances de microorganismes et/ou à de types de microorganismes préalablement identifiés.
- The acquisition of at least one mass spectrum of said microorganism;
- ■ for each acquired mass spectrum:
- o detection of peaks of the spectrum in a predetermined range of masses;
- generating a list of peaks listing at most one peak in each interval of a predetermined subdivision of the mass-to-load ratio range, the width of the intervals of the subdivision increasing with the mass-to-charge ratio according to the relationships :
where the intervals of the subdivision are referenced by integers greater than 1 from the integer b min , for the lowest mass-to-charge ratios of the range, to the integer b max , for mass-over-weight ratios. most important loads in the range, L ( b ) is the width of the interval referenced by the integer b , m min is a lower bound of the mass-to-load ratio range, and m max is an upper bound the range of mass-to-load ratios; and
- ■ analysis of the list or lists of peaks obtained based on the knowledge base of microorganisms and / or previously identified types of microorganisms.
En d'autres termes, l'espace continu des rapports masse-sur-charge, ou Thompson, est quantifié de manière logarithmique, et il n'est retenu qu'un seul pic dans chaque intervalle de quantification si plusieurs pics sont présents dans cet intervalle. Ceci permet une réduction sensible de la quantité de données à traiter. En outre, la position précise d'un pic est remplacée par la référence de l'intervalle auquel le pic appartient. Ceci réduit l'incertitude de mesure concernant la position de pics puisqu'il n'est plus besoin de comparer une position précise avec la base de connaissance. Il est plutôt comparer l'appartenance du pic mesuré à un intervalle. Enfin, la progression logarithmique de la largeur des intervalles permet de s'adapter au fait que l'instrument présente une précision relative constante : 
Selon un mode de réalisation, la gamme prédéterminée de Thompsons est comprise entre 3000 Thompsons et 17000 Thompsons. Les inventeurs ont en effet constaté que cette gamme était suffisante pour l'indentification de la plupart des bactéries et des levures/moisissures. On observe notamment que les pics localisés en dessous de 3000 Thompsons sont communs à beaucoup de microorganisme et ne sont donc pas discriminants.According to one embodiment, the predetermined range of Thompsons is between 3000 Thompsons and 17000 Thompsons. The inventors have indeed found that this range was sufficient for the identification of most bacteria and yeasts / molds. It is observed in particular that peaks located below 3000 Thompsons are common to many microorganisms and are therefore not discriminating.
Selon un mode de réalisation, le nombre d'intervalles est compris entre 900 et 1500, notamment entre 1200 et 1400. Les inventeurs ont constaté que ces intervalles constituent le compromis optimal entre la perte d'informations induite par la quantification de l'espace des Thompsons et la précision gagnée par le remplacement de la position précise des pics par les intervalles.According to one embodiment, the number of intervals is between 900 and 1500, in particular between 1200 and 1400. The inventors have found that these intervals constitute the optimal compromise between the loss of information induced by the quantification of the space of the Thompsons and accuracy gained by replacing the precise position of peaks by intervals.
Selon un mode de réalisation, le pic gardé dans un intervalle de la subdivision est le pic avec l'intensité la plus forte. D'autres choix sont cependant possibles. Par exemple, il est possible de choisir la valeur moyenne ou la valeur médiane des intensités des pics présents dans l'intervalle.According to one embodiment, the peak kept in an interval of the subdivision is the peak with the strongest intensity. Other choices are possible, however. For example, it is possible to choose the average value or the median value of the intensities of the peaks present in the interval.
Selon un mode de réalisation, la spectrométrie de masse est une spectrométrie MALDI-TOF.According to one embodiment, the mass spectrometry is a MALDI-TOF spectrometry.
L'invention a également pour objet un dispositif d'identification d'un microorganisme par spectrométrie de masse, comprenant :
- ■ un spectromètre de masse apte à produire des spectres de masse de microorganismes à identifier ;
- ■ une unité de calcul apte à identifier les microorganismes associés aux spectres de masse produits par le spectromètre en mettant en oeuvre un procédé conforme à l'une quelconque des revendications précédentes.
- A mass spectrometer capable of producing mass spectra of microorganisms to be identified;
- A computing unit capable of identifying the microorganisms associated with the mass spectra produced by the spectrometer by implementing a method according to any one of the preceding claims.
L'invention sera mieux comprise à la lecture de la description qui va suivre, donnée uniquement à titre d'exemple, et faire en relation avec les dessins annexés, dans lequel :
- ■ la
figure 1 est un organigramme du procédé selon l'invention ; et - ■ la
figure 2 est un tracé du nombre de pics éliminés dans un spectre de masse en fonction du nombre d'intervalles de la quantification selon l'invention.
- ■ the
figure 1 is a flowchart of the method according to the invention; and - ■ the
figure 2 is a plot of the number of peaks eliminated in a mass spectrum as a function of the number of quantization intervals according to the invention.
Il va à présent être décrit en référence avec la
Le procédé débute par la préparation, en 10, d'un échantillon d'une bactérie à identifier, suivi de l'acquisition, en 12, d'un ou plusieurs spectres de masse de l'échantillon préparé au moyen d'un spectromètre de passe de type MALDI-TOF. La spectrométrie de masse MALDI-TOF est bien connue en soi et ne sera donc pas décrite plus en détail par la suite. On pourra, par exemple, se référer au document de
Le procédé se poursuit, en 14, par le prétraitement des spectres acquis, afin notamment de débruiter et lisser les spectres. Plus particulièrement, la ligne de base des spectres, qui représente le bruit de fond du spectromètre est retirée.The process continues, at 14, by the pretreatment of the acquired spectra, in particular to denoise and smooth the spectra. More particularly, the spectral baseline, which represents the background of the spectrometer, is removed.
Une identification des pics présents dans les spectres acquis est alors réalisée en 16, par exemple au moyen d'un algorithme détection de pics par exemple basé sur la détection de maximums locaux. Une liste des pics pour chaque spectre, comportant la localisation et l'intensité des pics du spectre, est ainsi produite.An identification of the peaks present in the acquired spectra is then carried out at 16, for example by means of a peak detection algorithm for example based on the detection of local maxima. A list of peaks for each spectrum, including the location and intensity of the peaks of the spectrum, is thus produced.
De manière avantageuse, les pics sont identifiés dans la gamme de Thompsons [m min;m max] restreinte, de préférence la gamme [m min;m max] = [3000;17000] Thompsons. En effet, il a été observé que les informations suffisantes à l'identification des micro-organismes sont regroupées dans cette gamme, et qu'il n'est donc pas besoin de tenir compte d'une gamme plus large.Advantageously, the peaks are identified in the Thompsons range [ m min ; m max ] restricted, preferably the range [ m min ; m max ] = [3000; 17000] Thompsons. Indeed, it has been observed that sufficient information for the identification of microorganisms is grouped in this range, and that there is therefore no need to take into account a wider range.
Le procédé se poursuit, en 18, par une étape de quantification, ou « binning ». Pour ce faire :
- ■ la gamme [m min;m max] est subdivisée en intervalles dont la largeur croit de manière logarithmique avec les Thompsons selon la relation :


où les intervalles de la subdivision sont référencés par des entiers supérieurs à 1 depuis l'entier b min, par exemple égal à 1, à l'entier b max, et L(b) est la largeur de l'intervalle référencé par l'entier b . L'entier b min correspond à l'intervalle des rapports masses-sur-charges les plus faibles de la gamme [m min;m max], et l'entier b max correspond à l'intervalle des rapports masses-sur-charges les plus importants de la gamme [m min;m max]. L'axe des Thompsons est donc quantifié selon les relations :
où └ ┘ est le symbole de l'arrondi à l'entier inférieur ; - ■ pour chaque intervalle comprenant plusieurs pics, un seul pic est conservé, avantageusement le pic présentant la plus forte intensité. Un vecteur est ainsi produit pour chaque spectre mesuré. Chaque composante du vecteur correspond à un intervalle de la quantification et a pour valeur l'intensité du pic conservé pour cet intervalle, la valeur « 0 » signifiant qu'aucun pic n'a été détecté dans cet intervalle.
- ■ the range [ m min ; m max ] is subdivided into intervals whose width increases logarithmically with the Thompsons according to the relation:
where the intervals of the subdivision are referenced by integers greater than 1 since the integer b min , for example equal to 1, to the integer b max , and L ( b ) is the width of the interval referenced by the whole b . The integer b min is the interval of the lowest mass-to-charge ratios in the range [ m min ; m max ], and the integer b max corresponds to the interval of the largest mass-to-load ratios in the range [ m min ; m max ]. The Thompsons axis is therefore quantified according to the relationships:
where └ ┘ is the symbol of the rounding to the lower integer; - For each interval comprising several peaks, a single peak is preserved, advantageously the peak having the highest intensity. A vector is thus produced for each measured spectrum. Each component of the vector corresponds to an interval of the quantization and has as value the intensity of the peak conserved for this interval, the value "0" signifying that no peak has been detected in this interval.
Par exemple, à l'étape 18 de la figure sur la 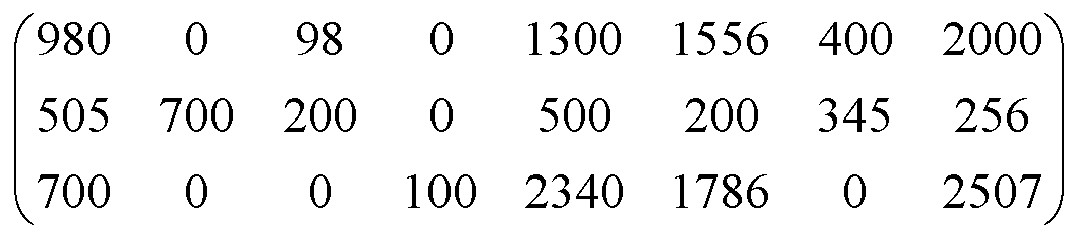
On montre ainsi qu'à l'aide d'une quantification telle que décrite précédemment, il est tenu compte de l'accroissement de l'incertitude sur la position des pics à mesure que les masses augmentent. Notamment, la subdivision selon l'invention de l'axe des Thompsons permet de tenir compte d'une incertitude du type : ![]()
où p est la précision sur la localisation d'un pic, Δµ est l'incertitude de mesure sur la position des pics du spectromètre, et m est la position réelle du pic. La quantification est donc une quantification adaptative qui tient compte de l'erreur de mesure du spectromètre de masse.It is thus shown that, by means of a quantization as described above, account is taken of the increase in the uncertainty in the position of the peaks as the masses increase. In particular, the subdivision according to the invention of the Thompsons axis makes it possible to take into account an uncertainty of the type: ![]()
where p is the precision on the location of a peak, Δ μ is the measurement uncertainty on the position of the peaks of the spectrometer, and m is the actual position of the peak. Quantification is therefore an adaptive quantization that takes into account the measurement error of the mass spectrometer.
Le remplacement de la localisation mesurée d'un pic par la référence à l'intervalle auquel il appartient, est équivalent à aligner la position du pic sur le milieu de l'intervalle. On vérifie que la subdivision logarithmique selon l'invention permet de réduire l'incertitude selon la relation (4). En effet, on a : 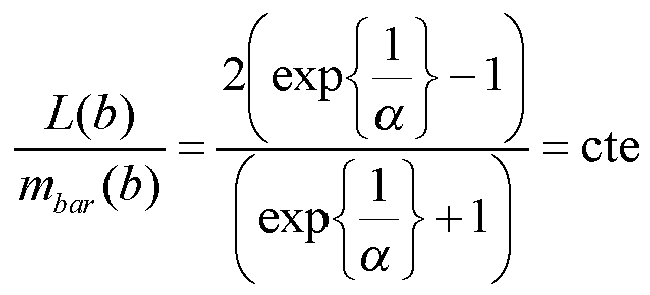
où mbar (b) est le milieu de l'intervalle référencé de référence b.The replacement of the measured location of a peak by the reference to the interval to which it belongs, is equivalent to aligning the position of the peak on the middle of the interval. It is verified that the logarithmic subdivision according to the invention makes it possible to reduce the uncertainty according to relation (4). Indeed, we have:
where m bar ( b ) is the middle of the referenced reference interval b .
L'intensité d'un pic est très variable d'un spectre à l'autre et/ou d'un spectromètre à un autre. Du fait de cette variabilité, il est très difficile de prendre en compte les valeurs brutes d'intensité. De manière avantageuse, mais optionnelle, le procédé se poursuit par une étape de discrétisation des intensités. Cette étape peut par exemple consister en une simple « binarisation » (présence/absence).The intensity of a peak is very variable from one spectrum to another and / or from one spectrometer to another. Due to this variability, it is very difficult to take into account the raw intensity values. Advantageously, but optional, the process continues with a step of discretizing the intensities. This step may for example consist of a simple "binarization" (presence / absence).
Ainsi, chaque ligne de la matrice est « binarisée » puis normalisée, la matrice répertoriant ainsi pour chaque spectre acquis la présence ou l'absence de pic dans les intervalles. Par exemple, la matrice précédente est binarisée en la matrice : 
Les inventeurs ont en outre noté que l'information pertinente pour l'identification d'une bactérie est contenue essentiellement dans l'absence et/ou la présence de pics, et que l'information d'intensité est moins pertinente, notamment en raison de sa forte variabilité. Ainsi par exemple, il est possible d'identifier des bactéries sur la base de ce type de listes à l'aide d'outils de classification usuels tels que la régression logistique, l'analyse discriminante, les arbres de classification, méthodes LASSO, des algorithmes de type SVM (acronyme de l'expression anglo-saxonne « support vector machine »). La matrice ainsi binarisée peut être utilisée dans tous les outils de classification connus.The inventors have further noted that the information relevant for the identification of a bacterium is contained mainly in the absence and / or the presence of peaks, and that the intensity information is less relevant, in particular because of its high variability. For example, it is possible to identify bacteria on the basis of this type of list using standard classification tools such as logistic regression, discriminant analysis, classification trees, LASSO methods, algorithms of the type SVM (acronym of the English expression " support vector machine "). The binarized matrix can be used in all known classification tools.
Le procédé se poursuit ensuite, en 20, par l'analyse de la matrice obtenue à l'étape précédente. Plus particulièrement, un algorithme de classification et de décision 22 est mis en oeuvre en fonction d'une base de connaissances 24 construite en fonction de listes de pics de microorganismes et/ou types de microorganismes préalablement identifiés. Un ou plusieurs candidats, ou un type de microorganismes (famille, germe, espèce, sous-espèces) sont ainsi identifiés pour l'échantillon analysé.The method then continues, at 20, by analyzing the matrix obtained in the previous step. More particularly, a classification and
Le procédé selon l'invention permet ainsi de ramener une liste de pics de taille variable et à valeurs continues sur 2 axes (m/z, intensités) à un vecteur de taille fixe et raisonnable.The method according to the invention thus makes it possible to reduce a list of peaks of variable size and with continuous values on 2 axes (m / z, intensities) to a vector of fixed and reasonable size.
La base de connaissances 24 est construite à partir de listes de pic produites comme décrit ci-dessus, et associées à des microorganismes et/ou types de microorganismes préalablement identifiés. On comprendra que l'invention s'applique à tout type d'algorithmes de classification et de bases de connaissances. La quantification selon l'invention permet notamment de réduire la quantité de données, ainsi que d'éliminer les problèmes de précision dans la localisation des pics, et permet donc de construire une base de connaissances plus robuste, et ce de manière plus simple. La mise en oeuvre est beaucoup plus simple que le calcul d'une distance tolérante (par exemple) et permet une construction quasi-automatisée de la base de connaissanceThe
Le nombre d'intervalles est avantageusement choisi entre 900 et 1500, et de préférence entre 1200 et 1400 pour l'identification de micro-organismes. Les inventeurs ont constaté que ces intervalles constituent le compromis optimal entre la perte d'informations induite par la quantification de l'espace des Thompsons et la précision gagnée par le remplacement de la position précise des pics par les intervalles. Les inventeurs ont procédé à des essais et ont modélisé, comme illustré à la
Il a été procédé à des essais comparatifs entre la quantification logarithmique de l'invention et une quantification constante, c'est-à-dire une quantification pour laquelle tous les intervalles sont de largeur identique, et ce pour un même spectromètre de masse et un algorithme de classification et de décision et une construction de base de connaissance identiques. Ces essais sont décrits dans le tableau ci-dessous. L'erreur correspond à l'erreur d'identification des microorganismes.
En choisissant 1000 intervalles de largeur constante, la largeur des intervalles est égale à la résolution du spectromètre de masse utilisé pour les essais pour un rapport masse-sur-charge égal à 17 000 Thompsons. En choisissant, 4700 intervalles de largeur constante, la largeur des intervalles est égale à la résolution du spectromètre pour un rapport masse-sur-charge égal à 3000 Thompsons.By choosing 1000 intervals of constant width, the width of the intervals is equal to the resolution of the mass spectrometer used for testing for a mass-to-charge ratio of 17,000 Thompsons. By choosing 4700 intervals of constant width, the width of the intervals is equal to the resolution of the spectrometer for a mass-to-charge ratio of 3000 Thompsons.
En choisissant 1700 intervalles logarithmiques selon les relations (1) à (3), avec b min= 1, la largeur de chaque intervalle est égale à la précision du spectromètre pour un rapport masse-sur-charge égal au milieu de l'intervalle. Toutefois, il est observé, qu'en moyenne, un nombre de 1300 intervalles permet d'obtenir à la fois le taux d'erreur d'indentification le plus bas et l'espace mémoire occupé le plus bas. Notamment, par rapport au nombre de 1700 intervalles, qui semble au premier abord le plus adapté, un gain de 2 points d'erreur (-28% d'erreur) est réalisé, tout en diminuant l'espace mémoire occupé, comme l'indique le tableau ci-dessus. Le nombre de 1300 est donc privilégié pour la mise en oeuvre de l'invention.By choosing 1700 logarithmic intervals according to relations (1) to (3), with b min = 1, the width of each interval is equal to the accuracy of the spectrometer for a report. mass-on-charge equal to the middle of the interval. However, it is observed that, on average, a number of 1300 intervals makes it possible to obtain both the lowest identification error rate and the lowest occupied memory space. In particular, compared to the number of 1700 intervals, which at first seems the most suitable, a gain of 2 error points (-28% error) is achieved, while decreasing the memory space occupied, as the indicates the table above. The number of 1300 is therefore preferred for the implementation of the invention.
On remarque également que la quantification selon l'invention permet d'avoir un taux d'erreur maximale inférieur d'au moins 1 point (-15% d'erreur) à celui d'une quantification constante, ainsi qu'une plus faible empreinte mémoire (-25%). Pour des nombres d'intervalles faibles, la quantification selon l'invention donne ainsi de meilleurs résultats qu'une quantification constante. Ceci permet ainsi de garder un nombre faible d'intervalles, même en augmentant la résolution du spectromètre de masse ou la plage de Thompsons retenue [m min;m max]. Ainsi, on remarque que pour un même taux d'erreur, par exemple environ 6%, la quantification selon l'invention nécessite uniquement 700 intervalles alors que la quantification constante en nécessite 1700.It is also noted that the quantization according to the invention makes it possible to have a maximum error rate that is at least 1 point lower (-15% error) than that of a constant quantization, as well as a smaller footprint. memory (-25%). For low interval numbers, the quantization according to the invention thus gives better results than constant quantization. This makes it possible to keep a small number of intervals, even by increasing the resolution of the mass spectrometer or the Thompsons range selected [ m min ; m max ]. Thus, it is noted that for the same error rate, for example about 6%, the quantization according to the invention requires only 700 intervals while the constant quantization requires 1700.
Claims (7)


où les intervalles de la subdivision sont référencés par des entiers supérieurs à 1 depuis l'entier b min, pour les rapports masses-sur-charges les plus faibles de la gamme, à l'entier b max, pour les rapports masses-sur-charges les plus importants de la gamme, L(b) est la largeur de l'intervalle référencé par l'entier b, m min est une borne inférieure de la gamme des rapports masse-sur-charge, et m max est une borne supérieure de la gamme des rapports masse-sur-charge; et
where the intervals of the subdivision are referenced by integers greater than 1 from the integer b min , for the lowest mass-to-charge ratios of the range, to the integer b max , for mass-over-weight ratios. most important loads in the range, L ( b ) is the width of the interval referenced by the integer b , m min is a lower bound of the mass-to-load ratio range, and m max is an upper bound the range of mass-to-load ratios; and
Priority Applications (10)
| Application Number | Priority Date | Filing Date | Title |
|---|---|---|---|
| EP11306610.4A EP2600385A1 (en) | 2011-12-02 | 2011-12-02 | Method for identifying microorganisms by mass spectrometry |
| JP2014544031A JP5964983B2 (en) | 2011-12-02 | 2012-11-30 | Method for identifying microorganisms by mass spectrometry |
| EP19199848.3A EP3627533A1 (en) | 2011-12-02 | 2012-11-30 | Method for identifying microorganisms by mass spectrometry |
| CN201280058472.1A CN103959426B (en) | 2011-12-02 | 2012-11-30 | For the method by mass spectrometry identification microorganism |
| IN1140KON2014 IN2014KN01140A (en) | 2011-12-02 | 2012-11-30 | |
| US14/361,794 US10541119B2 (en) | 2011-12-02 | 2012-11-30 | Method for identifying microorganisms by mass spectrometry |
| EP12798884.8A EP2786397B1 (en) | 2011-12-02 | 2012-11-30 | Method for identifying microorganisms by mass spectrometry |
| ES12798884T ES2755734T3 (en) | 2011-12-02 | 2012-11-30 | Microorganisms identification procedure by mass spectrometry |
| PCT/IB2012/056860 WO2013080170A1 (en) | 2011-12-02 | 2012-11-30 | Method for identifying microorganisms by mass spectrometry |
| US16/708,419 US20200111653A1 (en) | 2011-12-02 | 2019-12-09 | Method for identifying microorganisms by mass spectrometry |
Applications Claiming Priority (1)
| Application Number | Priority Date | Filing Date | Title |
|---|---|---|---|
| EP11306610.4A EP2600385A1 (en) | 2011-12-02 | 2011-12-02 | Method for identifying microorganisms by mass spectrometry |
Publications (1)
| Publication Number | Publication Date |
|---|---|
| EP2600385A1 true EP2600385A1 (en) | 2013-06-05 |
Family
ID=45524307
Family Applications (3)
| Application Number | Title | Priority Date | Filing Date |
|---|---|---|---|
| EP11306610.4A Withdrawn EP2600385A1 (en) | 2011-12-02 | 2011-12-02 | Method for identifying microorganisms by mass spectrometry |
| EP19199848.3A Withdrawn EP3627533A1 (en) | 2011-12-02 | 2012-11-30 | Method for identifying microorganisms by mass spectrometry |
| EP12798884.8A Active EP2786397B1 (en) | 2011-12-02 | 2012-11-30 | Method for identifying microorganisms by mass spectrometry |
Family Applications After (2)
| Application Number | Title | Priority Date | Filing Date |
|---|---|---|---|
| EP19199848.3A Withdrawn EP3627533A1 (en) | 2011-12-02 | 2012-11-30 | Method for identifying microorganisms by mass spectrometry |
| EP12798884.8A Active EP2786397B1 (en) | 2011-12-02 | 2012-11-30 | Method for identifying microorganisms by mass spectrometry |
Country Status (7)
| Country | Link |
|---|---|
| US (2) | US10541119B2 (en) |
| EP (3) | EP2600385A1 (en) |
| JP (1) | JP5964983B2 (en) |
| CN (1) | CN103959426B (en) |
| ES (1) | ES2755734T3 (en) |
| IN (1) | IN2014KN01140A (en) |
| WO (1) | WO2013080170A1 (en) |
Cited By (2)
| Publication number | Priority date | Publication date | Assignee | Title |
|---|---|---|---|---|
| WO2015015106A1 (en) * | 2013-07-31 | 2015-02-05 | Biomerieux Sa | Method and device for analysing a biological sample |
| FR3035410A1 (en) * | 2015-04-24 | 2016-10-28 | Biomerieux Sa | METHOD OF MASS SPECTROMETRY IDENTIFICATION OF AN UNKNOWN MICROORGANISM SUB-GROUP FROM A SET OF REFERENCE SUBGROUMS |
Families Citing this family (7)
| Publication number | Priority date | Publication date | Assignee | Title |
|---|---|---|---|---|
| EP2600385A1 (en) * | 2011-12-02 | 2013-06-05 | bioMérieux, Inc. | Method for identifying microorganisms by mass spectrometry |
| FR3016461B1 (en) * | 2014-01-10 | 2017-06-23 | Imabiotech | METHOD FOR PROCESSING MOLECULAR IMAGING DATA AND CORRESPONDING DATA SERVER |
| JP6934650B2 (en) * | 2016-03-31 | 2021-09-15 | 株式会社島津製作所 | How to identify microorganisms |
| GB2575168B (en) * | 2018-06-04 | 2022-06-01 | Bruker Daltonics Gmbh & Co Kg | Precursor selection for data-dependent tandem mass spectrometry |
| JP7095805B2 (en) * | 2019-05-10 | 2022-07-05 | 株式会社島津製作所 | Method of detecting outliers of theoretical mass |
| EP3990906A4 (en) * | 2019-06-29 | 2023-07-26 | Zeteo Tech, Inc. | Methods and systems for detecting aerosol particles without using complex organic maldi matrices |
| WO2021019752A1 (en) * | 2019-08-01 | 2021-02-04 | 株式会社島津製作所 | Imaging mass spectrometry device |
Citations (3)
| Publication number | Priority date | Publication date | Assignee | Title |
|---|---|---|---|---|
| US4008388A (en) * | 1974-05-16 | 1977-02-15 | Universal Monitor Corporation | Mass spectrometric system for rapid, automatic and specific identification and quantitation of compounds |
| US20040195500A1 (en) * | 2003-04-02 | 2004-10-07 | Sachs Jeffrey R. | Mass spectrometry data analysis techniques |
| US20080029697A1 (en) * | 2006-07-12 | 2008-02-07 | Willis Peter M | Data Acquisition System and Method for a Spectrometer |
Family Cites Families (7)
| Publication number | Priority date | Publication date | Assignee | Title |
|---|---|---|---|---|
| JP4818981B2 (en) * | 2006-04-28 | 2011-11-16 | 独立行政法人産業技術総合研究所 | Rapid cell identification method and identification device |
| EP1942194A1 (en) * | 2007-01-08 | 2008-07-09 | Université René Descartes | Method for identifying a germ isolated from a clinical sample |
| FR2920235B1 (en) | 2007-08-22 | 2009-12-25 | Commissariat Energie Atomique | METHOD FOR ESTIMATING MOLECULE CONCENTRATIONS IN A SAMPLE STATE AND APPARATUS |
| DE102010006450B4 (en) | 2010-02-01 | 2019-03-28 | Bruker Daltonik Gmbh | Stepped search for microbial spectra in reference libraries |
| CN102253110A (en) * | 2011-06-09 | 2011-11-23 | 曹际娟 | Method for auxiliary identification of comma bacillus by matrix-assisted laser desorption ionisation-time-of-flight mass spectrometry (MALDI-TOF MS) |
| CN102253111A (en) * | 2011-06-09 | 2011-11-23 | 曹际娟 | MALDI-TOF MS (Matrix-assisted Laser Desorption/Ionization Time of Flight Mass Spectrometry)-assisted identification method for listeria monocytogenes |
| EP2600385A1 (en) * | 2011-12-02 | 2013-06-05 | bioMérieux, Inc. | Method for identifying microorganisms by mass spectrometry |
-
2011
- 2011-12-02 EP EP11306610.4A patent/EP2600385A1/en not_active Withdrawn
-
2012
- 2012-11-30 WO PCT/IB2012/056860 patent/WO2013080170A1/en active Application Filing
- 2012-11-30 US US14/361,794 patent/US10541119B2/en active Active
- 2012-11-30 JP JP2014544031A patent/JP5964983B2/en active Active
- 2012-11-30 ES ES12798884T patent/ES2755734T3/en active Active
- 2012-11-30 CN CN201280058472.1A patent/CN103959426B/en active Active
- 2012-11-30 IN IN1140KON2014 patent/IN2014KN01140A/en unknown
- 2012-11-30 EP EP19199848.3A patent/EP3627533A1/en not_active Withdrawn
- 2012-11-30 EP EP12798884.8A patent/EP2786397B1/en active Active
-
2019
- 2019-12-09 US US16/708,419 patent/US20200111653A1/en active Pending
Patent Citations (3)
| Publication number | Priority date | Publication date | Assignee | Title |
|---|---|---|---|---|
| US4008388A (en) * | 1974-05-16 | 1977-02-15 | Universal Monitor Corporation | Mass spectrometric system for rapid, automatic and specific identification and quantitation of compounds |
| US20040195500A1 (en) * | 2003-04-02 | 2004-10-07 | Sachs Jeffrey R. | Mass spectrometry data analysis techniques |
| US20080029697A1 (en) * | 2006-07-12 | 2008-02-07 | Willis Peter M | Data Acquisition System and Method for a Spectrometer |
Non-Patent Citations (3)
| Title |
|---|
| JACKSON O. LAY: "Maldi-tof spectrometry ofbacteria", MASS SPECTROMETRY REVIEWS, vol. 20, 2001, pages 172 - 194 |
| JUSTIN M. HETTICK ET AL: "Proteomic Profiling of Intact Mycobacteria by Matrix-Assisted Laser Desorption/Ionization Time-of-Flight Mass Spectrometry", ANALYTICAL CHEMISTRY, vol. 76, no. 19, 1 October 2004 (2004-10-01), pages 5769 - 5776, XP055031885, ISSN: 0003-2700, DOI: 10.1021/ac049410m * |
| SCOTT C RUSSELL: "MICROORGANISM CHARACTERIZATION BY SINGLE PARTICLE MASS SPECTROMETRY", MASS SPECTROMETRY REVIEWS, JOHN WILEY AND SONS, NEW YORK, NY, US, vol. 28, 1 January 2009 (2009-01-01), pages 376 - 387, XP007910439, ISSN: 0277-7037, DOI: 10.1002/MAS * |
Cited By (6)
| Publication number | Priority date | Publication date | Assignee | Title |
|---|---|---|---|---|
| WO2015015106A1 (en) * | 2013-07-31 | 2015-02-05 | Biomerieux Sa | Method and device for analysing a biological sample |
| FR3009387A1 (en) * | 2013-07-31 | 2015-02-06 | Biomerieux Sa | METHOD AND DEVICE FOR ANALYZING A BIOLOGICAL SAMPLE |
| CN105431854A (en) * | 2013-07-31 | 2016-03-23 | 生物梅里埃公司 | Method and device for analysing a biological sample |
| CN105431854B (en) * | 2013-07-31 | 2018-05-04 | 生物梅里埃公司 | Method and apparatus for analyzing biological sample |
| FR3035410A1 (en) * | 2015-04-24 | 2016-10-28 | Biomerieux Sa | METHOD OF MASS SPECTROMETRY IDENTIFICATION OF AN UNKNOWN MICROORGANISM SUB-GROUP FROM A SET OF REFERENCE SUBGROUMS |
| US11562165B2 (en) | 2015-04-24 | 2023-01-24 | Biomerieux | Method for identifying by mass spectrometry an unknown microorganism subgroup from a set of reference subgroups |
Also Published As
| Publication number | Publication date |
|---|---|
| ES2755734T3 (en) | 2020-04-23 |
| EP3627533A1 (en) | 2020-03-25 |
| US20140358449A1 (en) | 2014-12-04 |
| EP2786397A1 (en) | 2014-10-08 |
| CN103959426B (en) | 2016-11-09 |
| EP2786397B1 (en) | 2019-10-02 |
| US20200111653A1 (en) | 2020-04-09 |
| JP2015500466A (en) | 2015-01-05 |
| WO2013080170A1 (en) | 2013-06-06 |
| JP5964983B2 (en) | 2016-08-03 |
| CN103959426A (en) | 2014-07-30 |
| US10541119B2 (en) | 2020-01-21 |
| IN2014KN01140A (en) | 2015-10-16 |
Similar Documents
| Publication | Publication Date | Title |
|---|---|---|
| EP2786397B1 (en) | Method for identifying microorganisms by mass spectrometry | |
| EP2834777B1 (en) | Identification of microorganisms by structured classification and spectrometry | |
| EP2798575B1 (en) | Method for identifying micro-organisms by mass spectrometry and score normalisation | |
| CN101710071B (en) | Sampling method for establishing tobacco near-infrared model | |
| EP3028202B1 (en) | Method and device for analysing a biological sample | |
| EP1741047A2 (en) | Method for searching content particularly for extracts common to two computer files | |
| EP3038261B1 (en) | Method of data compression preprocessing tailored to data of measurements of electro-corticographic signals (ecog) and system for acquiring and transmitting ecog data | |
| FR2771542A1 (en) | FREQUENTIAL FILTERING METHOD APPLIED TO NOISE NOISE OF SOUND SIGNALS USING A WIENER FILTER | |
| EP3092589B1 (en) | Method for processing molecular imaging data and corresponding data server | |
| FR2831302A1 (en) | CODING OF CONCENTRIC INFORMATION | |
| FR2961597A1 (en) | PROCESS FOR CHARACTERIZING AN AGRO-FOOD PRODUCT AND APPARATUS FOR CARRYING OUT SAID METHOD | |
| WO2004002637A1 (en) | Method for detecting single postal covers and postal covers stuck together in a mail sorting machine | |
| EP3412012B1 (en) | Method for estimating parameters of signals contained in a frequency band | |
| CN109670531A (en) | A kind of denoising method of the near infrared light spectrum signal based on Hodrick-Prescott filter | |
| CN108489917A (en) | A kind of method of low frequency instrument error and higher-order of oscillation noise in removal terahertz absorption spectra | |
| CN112268862A (en) | Spectral reconstruction method and apparatus, device and medium | |
| CN113138181A (en) | Method for grading quality of fresh scent type raw wine | |
| EP4166931B1 (en) | Method for multi-species mapping of an area from spectral data | |
| WO2013053631A1 (en) | Method and device for separating signals by iterative spatial filtering | |
| CN114279991B (en) | White spirit brand identification method | |
| EP2126904A1 (en) | Audio encoding method and device | |
| WO2021105640A1 (en) | Method for the quick identification of microorganisms by analysis of excitation-emission matrices | |
| WO2021191554A1 (en) | Method for processing flight data | |
| EP1459214A1 (en) | Method for characterizing a sound signal | |
| FR2708362A1 (en) | Method of identifying objects |
Legal Events
| Date | Code | Title | Description |
|---|---|---|---|
| PUAI | Public reference made under article 153(3) epc to a published international application that has entered the european phase |
Free format text: ORIGINAL CODE: 0009012 |
|
| AK | Designated contracting states |
Kind code of ref document: A1 Designated state(s): AL AT BE BG CH CY CZ DE DK EE ES FI FR GB GR HR HU IE IS IT LI LT LU LV MC MK MT NL NO PL PT RO RS SE SI SK SM TR |
|
| AX | Request for extension of the european patent |
Extension state: BA ME |
|
| 17P | Request for examination filed |
Effective date: 20130913 |
|
| RBV | Designated contracting states (corrected) |
Designated state(s): AL AT BE BG CH CY CZ DE DK EE ES FI FR GB GR HR HU IE IS IT LI LT LU LV MC MK MT NL NO PL PT RO RS SE SI SK SM TR |
|
| STAA | Information on the status of an ep patent application or granted ep patent |
Free format text: STATUS: EXAMINATION IS IN PROGRESS |
|
| 17Q | First examination report despatched |
Effective date: 20170915 |
|
| 17Q | First examination report despatched |
Effective date: 20180423 |
|
| STAA | Information on the status of an ep patent application or granted ep patent |
Free format text: STATUS: THE APPLICATION IS DEEMED TO BE WITHDRAWN |
|
| 18D | Application deemed to be withdrawn |
Effective date: 20180904 |