EP2594944A1 - Automatic analysis device, analysis method and information processing device - Google Patents
Automatic analysis device, analysis method and information processing device Download PDFInfo
- Publication number
- EP2594944A1 EP2594944A1 EP11806654.7A EP11806654A EP2594944A1 EP 2594944 A1 EP2594944 A1 EP 2594944A1 EP 11806654 A EP11806654 A EP 11806654A EP 2594944 A1 EP2594944 A1 EP 2594944A1
- Authority
- EP
- European Patent Office
- Prior art keywords
- sample
- reagent
- reaction
- shape descriptor
- measurement
- Prior art date
- Legal status (The legal status is an assumption and is not a legal conclusion. Google has not performed a legal analysis and makes no representation as to the accuracy of the status listed.)
- Granted
Links
Images




Classifications
-
- G—PHYSICS
- G01—MEASURING; TESTING
- G01N—INVESTIGATING OR ANALYSING MATERIALS BY DETERMINING THEIR CHEMICAL OR PHYSICAL PROPERTIES
- G01N21/00—Investigating or analysing materials by the use of optical means, i.e. using sub-millimetre waves, infrared, visible or ultraviolet light
- G01N21/75—Systems in which material is subjected to a chemical reaction, the progress or the result of the reaction being investigated
-
- B—PERFORMING OPERATIONS; TRANSPORTING
- B01—PHYSICAL OR CHEMICAL PROCESSES OR APPARATUS IN GENERAL
- B01F—MIXING, e.g. DISSOLVING, EMULSIFYING OR DISPERSING
- B01F31/00—Mixers with shaking, oscillating, or vibrating mechanisms
- B01F31/80—Mixing by means of high-frequency vibrations above one kHz, e.g. ultrasonic vibrations
- B01F31/86—Mixing by means of high-frequency vibrations above one kHz, e.g. ultrasonic vibrations with vibration of the receptacle or part of it
-
- B—PERFORMING OPERATIONS; TRANSPORTING
- B01—PHYSICAL OR CHEMICAL PROCESSES OR APPARATUS IN GENERAL
- B01F—MIXING, e.g. DISSOLVING, EMULSIFYING OR DISPERSING
- B01F35/00—Accessories for mixers; Auxiliary operations or auxiliary devices; Parts or details of general application
- B01F35/20—Measuring; Control or regulation
- B01F35/21—Measuring
- B01F35/2131—Colour or luminescence
-
- G—PHYSICS
- G01—MEASURING; TESTING
- G01N—INVESTIGATING OR ANALYSING MATERIALS BY DETERMINING THEIR CHEMICAL OR PHYSICAL PROPERTIES
- G01N35/00—Automatic analysis not limited to methods or materials provided for in any single one of groups G01N1/00 - G01N33/00; Handling materials therefor
- G01N35/00584—Control arrangements for automatic analysers
- G01N35/00594—Quality control, including calibration or testing of components of the analyser
-
- G—PHYSICS
- G01—MEASURING; TESTING
- G01N—INVESTIGATING OR ANALYSING MATERIALS BY DETERMINING THEIR CHEMICAL OR PHYSICAL PROPERTIES
- G01N35/00—Automatic analysis not limited to methods or materials provided for in any single one of groups G01N1/00 - G01N33/00; Handling materials therefor
- G01N35/00584—Control arrangements for automatic analysers
- G01N35/00594—Quality control, including calibration or testing of components of the analyser
- G01N35/00613—Quality control
- G01N35/00623—Quality control of instruments
-
- G—PHYSICS
- G01—MEASURING; TESTING
- G01N—INVESTIGATING OR ANALYSING MATERIALS BY DETERMINING THEIR CHEMICAL OR PHYSICAL PROPERTIES
- G01N35/00—Automatic analysis not limited to methods or materials provided for in any single one of groups G01N1/00 - G01N33/00; Handling materials therefor
- G01N35/00584—Control arrangements for automatic analysers
- G01N35/00594—Quality control, including calibration or testing of components of the analyser
- G01N35/00613—Quality control
- G01N35/00663—Quality control of consumables
-
- G—PHYSICS
- G16—INFORMATION AND COMMUNICATION TECHNOLOGY [ICT] SPECIALLY ADAPTED FOR SPECIFIC APPLICATION FIELDS
- G16C—COMPUTATIONAL CHEMISTRY; CHEMOINFORMATICS; COMPUTATIONAL MATERIALS SCIENCE
- G16C20/00—Chemoinformatics, i.e. ICT specially adapted for the handling of physicochemical or structural data of chemical particles, elements, compounds or mixtures
- G16C20/10—Analysis or design of chemical reactions, syntheses or processes
-
- G—PHYSICS
- G01—MEASURING; TESTING
- G01N—INVESTIGATING OR ANALYSING MATERIALS BY DETERMINING THEIR CHEMICAL OR PHYSICAL PROPERTIES
- G01N35/00—Automatic analysis not limited to methods or materials provided for in any single one of groups G01N1/00 - G01N33/00; Handling materials therefor
- G01N2035/00465—Separating and mixing arrangements
-
- G—PHYSICS
- G01—MEASURING; TESTING
- G01N—INVESTIGATING OR ANALYSING MATERIALS BY DETERMINING THEIR CHEMICAL OR PHYSICAL PROPERTIES
- G01N35/00—Automatic analysis not limited to methods or materials provided for in any single one of groups G01N1/00 - G01N33/00; Handling materials therefor
- G01N35/00584—Control arrangements for automatic analysers
- G01N35/00594—Quality control, including calibration or testing of components of the analyser
- G01N35/00693—Calibration
- G01N2035/00702—Curve-fitting; Parameter matching; Calibration constants
-
- G—PHYSICS
- G01—MEASURING; TESTING
- G01N—INVESTIGATING OR ANALYSING MATERIALS BY DETERMINING THEIR CHEMICAL OR PHYSICAL PROPERTIES
- G01N35/00—Automatic analysis not limited to methods or materials provided for in any single one of groups G01N1/00 - G01N33/00; Handling materials therefor
- G01N35/00584—Control arrangements for automatic analysers
- G01N2035/0097—Control arrangements for automatic analysers monitoring reactions as a function of time
-
- G—PHYSICS
- G01—MEASURING; TESTING
- G01N—INVESTIGATING OR ANALYSING MATERIALS BY DETERMINING THEIR CHEMICAL OR PHYSICAL PROPERTIES
- G01N21/00—Investigating or analysing materials by the use of optical means, i.e. using sub-millimetre waves, infrared, visible or ultraviolet light
- G01N21/17—Systems in which incident light is modified in accordance with the properties of the material investigated
- G01N21/25—Colour; Spectral properties, i.e. comparison of effect of material on the light at two or more different wavelengths or wavelength bands
- G01N21/27—Colour; Spectral properties, i.e. comparison of effect of material on the light at two or more different wavelengths or wavelength bands using photo-electric detection ; circuits for computing concentration
- G01N21/272—Colour; Spectral properties, i.e. comparison of effect of material on the light at two or more different wavelengths or wavelength bands using photo-electric detection ; circuits for computing concentration for following a reaction, e.g. for determining photometrically a reaction rate (photometric cinetic analysis)
-
- G—PHYSICS
- G01—MEASURING; TESTING
- G01N—INVESTIGATING OR ANALYSING MATERIALS BY DETERMINING THEIR CHEMICAL OR PHYSICAL PROPERTIES
- G01N35/00—Automatic analysis not limited to methods or materials provided for in any single one of groups G01N1/00 - G01N33/00; Handling materials therefor
- G01N35/00584—Control arrangements for automatic analysers
- G01N35/00594—Quality control, including calibration or testing of components of the analyser
- G01N35/00603—Reinspection of samples
-
- Y—GENERAL TAGGING OF NEW TECHNOLOGICAL DEVELOPMENTS; GENERAL TAGGING OF CROSS-SECTIONAL TECHNOLOGIES SPANNING OVER SEVERAL SECTIONS OF THE IPC; TECHNICAL SUBJECTS COVERED BY FORMER USPC CROSS-REFERENCE ART COLLECTIONS [XRACs] AND DIGESTS
- Y10—TECHNICAL SUBJECTS COVERED BY FORMER USPC
- Y10T—TECHNICAL SUBJECTS COVERED BY FORMER US CLASSIFICATION
- Y10T436/00—Chemistry: analytical and immunological testing
- Y10T436/11—Automated chemical analysis
Definitions
- the present invention relates to an automatic analyzer, an analysis method, and an information processor which are used to qualitatively and quantitatively analyze biological samples such as blood and urine.
- the invention has been contrived to address the above the issues, and one object of the invention is to provide an automatic analyzer, analysis method and information processor which not only allow abnormalities to be detected accurately from each measurement result, but also allow the causes of the abnormalities to be identified.
- an automatic analyzer comprises: a sample vessel for containing a sample to be measured; a reagent vessel for containing a reagent to be reacted with the sample; a reaction vessel in which to mix the sample and the reagent; a sample dispenser for dispensing the sample from the sample vessel into the reaction vessel; a reagent dispenser for dispensing the reagent from the reagent vessel into the reaction vessel; a stirrer for stirring the sample and the reagent contained in the reaction vessel to obtain a mixed solution; a measurement section for obtaining a plurality of measurement data points during the progress of reaction of the mixed solution; a storage section for storing one or more approximation formula to generate an approximation curve from the measurement data points; and a data processing section having a calculation section for selecting at least one approximation formula and generating an approximation curve from the measurement data points to calculate a shape descriptor from the approximation curve generated and an abnormality judgment section for performing abnormality judgment
- the invention not only allows abnormalities to be detected accurately from each measurement result, but also allows the causes of the abnormalities to be identified.
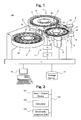
- FIG.1 is a schematic of an automatic analyzer according to an embodiment of the invention.
- the automatic analyzer 100 of FIG.1 includes the following components: a sample disk 1, a reagent disk 2, a reaction disk 3, a sample dispenser 5, a reagent dispenser 6, a stirrer 7, a photometric measurement unit 8, (measurement section) a rinse mechanism 9, a storage device 12 (storage section), a controller 13, a computer 10 (PC), and the like.
- the sample disk 1 includes a circular disk 17 in which to store sample vessels 16 each containing a biological sample such as blood or urine.
- the reagent disk 2 includes a circular disk 19 in which to store reagent vessels 18.
- the reagent vessels 18 contain various reagents to be used for the analysis of the samples.
- the reagent disk 2 further includes a refrigerator 20 for maintaining the reagent vessels 18 at a constant temperature.
- the reaction disk 3 includes a reaction vessel holder 22 for holding reaction vessels 21 in which to mix a sample and a reagent.
- the reaction disk 3 further includes a reaction tank 4 for adjusting the temperatures of the reaction vessel 21 held by the reaction vessel holder 22.
- the reaction disk 3 is rotated by a drive mechanism 23.
- the sample dispenser 5 is designed to dispense a sample from any of the sample vessels 16 to any of the reaction vessels 21 and includes a support shaft 25, an arm 26, and a probe 24.
- the probe 24 is attached to the distal end of the arm 26 that can be rotated and vertically moved by the support shaft 25.
- the reagent dispenser is designed to dispense a reagent from any of the reagent vessels 18 to any of the reaction vessels 21 and includes a support shaft 26, an arm 29, and a probe 27.
- the probe 27 is attached to the distal end of the arm 29 that can be rotated and vertically moved by the support shaft 26.
- the stirrer 7 includes a stirrer controller 15 for controlling the vibration of a fixed unit 31 through the use of a piezoelectric driver 14 and is used to stir the mixed solutions within the reaction vessels 21.
- the photometric measurement unit 8 performs photometric measurement on any of the reaction vessels 21 when it passes through a light beam emitted from a light source (not illustrated), thereby detecting the absorbance of the mixed solution contained in that reaction vessel.
- the rinse mechanism 9 is used to clean the reaction vessels 21 after they have been subjected to photometric measurement.
- the rinse mechanism 9 includes nozzles 33 for suctioning and discharging rinse liquid and a lifter 34 for vertically moving the nozzles 33.
- the storage device 12 stores information such as analysis parameters, the number of times analysis can be done using each reagent bottle, the maximum number of times of analysis, calibration results, analysis results, and so forth.
- the controller 13 is used to control the entire operation of the analyzer 100.
- the computer 10 has means for allowing input of information or commands into the controller 13 and means for displaying various pieces of information.
- FIG. 2 is a partial block diagram of the controller 13.
- the controller 13 includes an input/output unit 131, a calculator 132 (calculation section), and an abnormality judgment unit 133. Data transfer can be done among these components via a data bus 134.
- the input/output unit 131 performs data transfer from/to the photometric measurement unit 8, the computer 10, and the storage device 12.
- the input/output unit 131, the calculator 132, and the abnormality judgment unit 133 can be implemented by hardware and CPUs. Alternatively, those components can be installed on a single CPU as software modules.
- sample analysis performed by the analyzer 100 includes the following steps: sampling, reagent dispensing, stirring, photometric measurement, reaction vessel cleaning, and data processing (e.g., conversion of concentrations).
- the sample disk 1 is controlled by the controller 13 via the computer 10.
- the sample vessels 16 are arranged along the circumference of the sample disk 1, and the sample disk 1 is rotated so that the sample vessels 16 can move to the position right below the probe 24 one after another according to the order of measurements.
- a given amount of the sample contained in a sample vessel 16 is dispensed into any of the reaction vessels 21 by a pump connected to the sample dispenser 5.
- the reaction vessel 21 that has received the sample then moves within the reaction tank 4 up to a first reagent dispensing position (i.e., the position below the probe 27). Thereafter, a given amount of the reagent contained in a reagent vessel 18 is dispensed into that reaction vessel 21 by a pump connected to the reagent dispenser 6.
- the reaction vessel 21 that has received the reagent moves to the position of the stirrer 7 where the first stirring is performed. The above steps are repeated until the same sample and several other reagents are mixed in the same reaction vessel 21.
- a reaction vessel 21 Once a reaction vessel 21 has been subjected to stirring, it passes through a light beam emitted from a light source, and the photometric measurement unit 8 (multi-wavelength photometer) detects the absorbance of the mixed solution in that reaction vessel 21.
- the resultant absorbance signal (absorbance data) is transmitted to the controller 13 where it is converted into the concentration of the sample.
- the controller 13 also performs abnormality judgment (discussed later) based on the absorbance.
- the absorbance data obtained before and after the conversion are stored on the storage device 12 and displayed on the screen of the computer 10.
- a reaction vessel 21 that has been subjected to photometric measurement is moved to the position of the rinse mechanism 9 and then cleaned for subsequent analyses.
- a two-wavelength measurement method involving the use of light of a wavelength that greatly changes in absorbance due to color changes resulting from reactions between a reagent and a sample (i.e., main wavelength) and light of a wavelength that hardly changes in absorbance (i.e., sub-wavelength)
- the difference between the absorbance of the main wavelength and the absorbance of the sub wavelength is input as absorbance data.
- the concentrations of the proteins and fat contained in a sample are measured.
- the amount of a substance generated by reactions between the substances in a sample and a reagent becomes closer to a particular value with the passage of time, and so do measurement values.
- the rate method is used primarily to measure the activity values of the enzymes contained in a sample, not the concentrations of the enzymes.
- a given amount of a base is added as a reagent, and factors that change due to the consumption of the base by the enzymes are measured.
- the enzyme reaction rate becomes closer to a theoretical upper limit if the concentration of the base is relatively high.
- Reagents used for analysis of biological items contain a sufficient amount of a base. Thus, when a reaction between a sample and a reagent proceeds properly, reaction measurement values change linearly by a fixed amount with the passage of time.
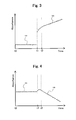
- FIGS. 3 and 4 illustrate examples of reaction processes in which two reagents are used for the rate analysis.
- FIG. 3 shows a reaction process in which the absorbance increases while FIG. 4 shows a reaction process in which the absorbance decreases.
- the horizontal axis represents time
- the vertical axis represents the absorbance of the mixed solution inside a reaction vessel 21
- absorbance data 103 obtained at particular time intervals are plotted.
- the sample inside the reaction vessel 21 is mixed with a first reagent at time t0, followed by incubation at a proper temperature. During that time, sub-reactions and the like that do not influence the wavelength measured will proceed. At time t1 when the sub-reactions end, a second reagent is added and stirred for the main reaction to start, and the absorbance of the wavelength measured will change.
- the reaction process in such a rate method is influenced by the status of reactions between a sample and a reagent.
- the absorbance increases at time t1 when the main reaction starts, but the rate of this reaction does not always stay the same from the beginning and becomes almost constant after time t2 when the reaction is in a steady state.
- the change rate (increase rate) of the absorbance becomes constant. That is, as illustrated in FIG. 3 , the change status after time t2 takes the form of a straight line.
- the period between time t1 and time t2, i.e., from the start of the main reaction (time t1) to the steady state (time t2) is called a lag phase as a time lag.
- the absorbance increases after time t1 when the main reaction starts, but the rate of this reaction does not always stay the same from the beginning and becomes almost constant after time t2 when the reaction is in a steady state.
- the change rate (increase rate) of the absorbance becomes constant.
- the change status after time t2 takes the form of a straight line.
- the period between time t1 and time t2, i.e., from the start of the main reaction (time t1) to the steady state (time t2), is called a lag phase as time lag.
- FIG. 5 is a graph extracted from the lag phase (time t1 to time t2) among the reaction process shown in FIG. 3 .
- the horizontal and vertical axes of FIG. 5 represent time and the absorbance of the mixed solution inside a reaction vessel 21, respectively, and absorbance data 103 obtained at particular time intervals are plotted.
- the length of the lag phase (time t1 to time t2) is T
- an approximate straight line for the reaction process data after the end of the lag phase (time t2) is the straight line 104
- the intersection point between the line showing time t1 (the absorbance axis of FIG. 5 ) and the line 104 is Q
- the difference between the absorbance at the intersection point Q and the absorbance at time t1 is D.
- T, D, Q, and P are called shape descriptors as the indices representing the shape of reaction process data and hereinafter denoted by the shape descriptor T, shape descriptor D, shape descriptor Q, and shape descriptor P, respectively.
- Measurement results are also influenced solely or in a combined manner by the composition or characteristics of reagents and samples.
- Reaction process data of the rate method has parts that distinctively show changes of such multiple influencing factors.
- the lag phase varies depending on analysis items, the composition of reagents, stirring status, reaction temperature, the concentration of the target substance in a sample, or the like.
- ⁇ GT ⁇ -glutamyl transpeptidase
- LD lactate dehydrogenase
- ALP alkaline phosphatase
- AST aspartate amino transferase
- lag phases are influenced by various factors related to reaction, but the factors can be identified under certain conditions.
- the characteristics of reaction process data including lag phases and the relationship of factors that influence the characteristics.
- stirring status can be given.
- Stirring has the function of physically mixing a sample and a reagent and promoting their reaction.
- the reaction between a sample and a reagent under the rate method reaches optimal conditions right after the stirring, and because the rate of the reaction becomes constant, the lag phase becomes short.
- a time lag occurs until the reaction rate reaches constant optimal conditions.
- the lag phase becomes large because the rate at which the absorbance during that time changes becomes slower.
- the properties of the reaction between the sample and the reagent can be evaluated, and it also becomes possible to detect whether stirring has been done properly.
- the influence of a reagent is always constant if the lot of the reagent is the same and the use period of the reagent is also the same.
- reaction temperature is less likely to exhibit fluctuations in each measurement if the temperature of the thermostat bath is monitored.
- concentration of the substance measured and the size of the lag phase there is a constant relation between the concentration of the substance measured and the size of the lag phase, and it can be inferred that measurements that have deviated from the relation is due to insufficient stirring, that is, the status of the mixed solution is abnormal.
- sample differences can be given. Since a lag phase is attributed to the reaction between a sample and a reagent, management of time until the lag phase becomes a steady reaction allows evaluation of the reaction status of that item. It seems that the length of a lag phase may also be influenced by other comprehensive factors such as a sample, a reagent, stirring, and reaction temperature. However, when measurement is done at a single institution, the composition of a generally used reagent is fixed, and reaction temperature, one of the device-related factors, will not change in each measurement. Thus, because the time T of a lag phase (the time between the start of the main reaction and a steady state) shown in FIG. 5 is influenced especially by the influence of reaction inhibitors or the like contained in the sample, monitoring of the time T of the lag phase allows detection of differences in sample properties and detection of abnormalities resulting from substances other than the substance to be measured such as reaction inhibitors.
- reagent-related factors deterioration and stability
- sample-related factors lipemia, turbidity, or hemolysis
- the intercept Q (shape descriptor Q) of the line 104 of FIG. 5 shows the absorbance at the time of the start of reaction at which a sample and a reagent are added.
- the value of this absorbance is not derived from the concentration of the target substance generated by the reaction between the sample and the reagent, but mostly reflects the absorption of the mixed solution between the first reagent and the second reagent and represents the absorbance of the reagent and the sample that are not dependent on the reaction generating the substance to be measured.
- reagents of the rate method showing a reaction process in which the absorbance increases as in FIG.
- one larger in absorption of the first reagent tends to be smaller in absorbance because the colored substances of the reagent are decomposed due to deterioration of the reagent.
- reagents of the rate method showing a reaction process in which the absorbance decreases as in FIG. 4
- absorption of the first reagent itself is low, but with the progress of reagent deterioration, the absorbance tends to be larger.
- the absorbance before the start of the main reaction is not dependent on the concentration of the target substance in the sample, but becomes almost constant.
- the value of the shape descriptor Q of the data obtained by measuring the sample, control, and the like is monitored according to a temporal sequence, the value of the shape descriptor Q gradually decreases or increases along the temporal sequence with the progress of reagent deterioration.
- the quality of reagents cannot be confirmed in each measurement, but the use of this index allows confirmation of the quality of the reagents.
- the reagent change can be done before it influences measurement results, thereby preventing abnormalities of measurement results.
- Such samples may affect the absorbance depending on the wavelength used, and samples that have become white, opaque, or hemolyzed affect the results of measurement of items such as LD, AST, K (potassium), Fe (serum iron), TP (total protein), TTT (thymol turbidity test), and ZTT (zinc sulfate turbidity test).
- items such as LD, AST, K (potassium), Fe (serum iron), TP (total protein), TTT (thymol turbidity test), and ZTT (zinc sulfate turbidity test).
- factors related to the substance to be measured concentration, activity values
- reagent-related factors performance
- K factor conversion coefficient
- K C ⁇ 2 - C ⁇ 1 / A ⁇ 2 - B Using this K factor, the value of the absorbance of the specified measurement point of a sample measured is typically converted into the concentration.
- the reaction process of the rate method obtained from each sample changes linearly within a given amount of time.
- Reagents that use enzyme reaction have a sufficient amount of a base or enzyme so that there are no problems even if the target substance in a sample is high in concentration.
- the possible range of measurement of a reagent is limited, and as specified in its package insert, its linearity in fact fluctuates due to the temporal change of the reagent or lot differences.
- the concentration or activity value of the target substance in a sample and the amount of change in absorbance per fixed time period have a proportional relation of a linear equation.
- the shape descriptor P by monitoring the shape descriptor P, it is possible to detect abnormalities related to the possible measurement range of a reagent such as the performance of the reagent (i.e., the range of the concentration that can be measured by that reagent), the abnormality in which the measurement has been done outside the possible measurement range of that reagent, or the absence of linearity in the possible measurement range specified in the package insert of that reagent (i.e., the possible measurement range in the package insert of the reagent is different from the actual possible measurement range). Further, since the shape descriptor P corresponds to the amount of absorbance change per fixed time period, by monitoring the relation between the measurement values of the sample and the shape descriptor P, the accuracy of the sample of those measurement values can be evaluated.
- the reaction process data is approximated by functions, and the resultant approximation curve is used to calculate the shape descriptors.
- the function that can perform the most accurate approximation is selected, and when the reaction process data of the rate method is approximated, the value of each parameter (a, b, c, d, e, k, p, q, r, u, v, and w) is obtained.
- the shape characteristics of the lag phase are quantified.
- the sizes of theirs changes are quantified.
- the existing least squares method is available, but as a method suitable for formulas of various forms, the parameters (a, b, e, d) that cause the square error to be the smallest are calculated by, for example, the steepest decent method.
- the absorbance starts to change greatly. In this case, only the data after the addition of the reagent that causes the main absorbance change is used for parameter calculation.
- FIG. 6 is a diagram illustrating a case where an approximation curve 107 is created with the use of an approximation formula from the reaction process data in the reaction process in which the absorbance increases as in FIG. 5 .
- the horizontal axis represents time, and the vertical axis the absorbance.
- the line 105 (first line) is a tangent to the approximation curve 107 at the time of the start of the main reaction (right after the start), and the line 106 (second line) is a line to which the approximation curve is getting closer.
- the time Tl at which the curve is sufficiently close is defined as the time at which the difference f between the approximation curve 107 and the line 106 at the same time becomes less than ⁇ , which is a small value determined in advance.
- ⁇ can be a fixed value or set according to the initial absorbance or the width of absorbance fluctuation.
- the initial absorbance can be multiplied by a constant, or the difference between the initial absorbance and the last absorbance can be multiplied by a constant to obtain ⁇ .
- ⁇ can be a constant or set according to the slope of the line 106.
- the slope of the line 106 can be multiplied by a constant to obtain ⁇ .
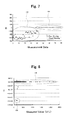
- FIG. 7 is a plotted diagram in which an approximation curve is generated from the reaction progress data about a sample measured under varied stirring conditions in measurement by a ⁇ GT automatic analyzer, with the vertical axis representing the shape descriptor D calculated from an formula (Formula 6) and the horizontal axis representing each reaction progress data.
- the shape descriptors D calculated using the reaction progress data when stirring failures occurred are arranged in 1 to 40 of the horizontal axis, and the shape descriptors D calculated using the reaction progress data when stirring has been done properly are arranged in 41 to 80 of the horizontal axis.
- FIG. 8 is a plotted diagram in which the vertical axis represents the shape descriptor T (Tl) calculated using a formula (Formula 13) about measurement results of LD and the horizontal axis represents measurements values (U/L) calculated from the apparatus.
- Tl shape descriptor
- the shape descriptor T shows the value of 0 about almost all the measurement results regardless of the sizes of the measurement values. This means that the time of the lag phase is small.
- several data as illustrated by a data group 109 show large absolute values of Tl, and it can be judged that this is due to the reaction specific to the sample because this data is not related to the temporal sequence.
- FIG. 9 is a plotted diagram in which the vertical axis represents the shape descriptor Q calculated using a formula (Formula 9) about measurement item LD and the horizontal axis represents a temporal sequence.
- a data group 111 only the values of the shape descriptor Q in a certain temporal sequence are higher than other data groups 112, 113. This coincides with the time of sample measurement and the day of reagent bottle replacement, and it can be detected that the values of the shape descriptor Q are due to reagent bottle differences.
- data (group) 114 the value of the shape descriptor Q is small in only one measurement regardless of the temporal sequence, and it seems that this is due to hemolysis of the sample.
- FIG. 10 is a plotted diagram in which the horizontal axis represents the shape descriptor P calculated using a formula (Formula 10) by measuring a general sample and the horizontal axis represents measurement values (U/L) calculated from the apparatus.
- a data group 115 is on a line 117, but it deviates from the line 117 when the measurement value (U/L) exceeds 900 (U/L).
- the possible measurement range of the reagent used at this measurement is up to the measurement value shown by a line 118 or thereabout (in this example, up to a measurement value of 900 U/L), and for the measurement of the two points of a data group 116 that show measurement values larger than that, amount-reduced re-examination is necessary.
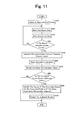
- FIG. 11 is a flowchart illustrating the content of the abnormality judgment of the present embodiment
- FIG. 12 is a tree diagram illustrating the content of the abnormality cause judgment in the abnormality judgment.
- the controller 13 first selects an optimal approximation formula from among one or more approximation formulas stored on the storage device 12 based on the combination of inspection items and reagents (Step S10).
- the input/output unit 131 the absorbance data of one measurement or the average of several measurements of the absorbance measured several times with the passage of time is input from the photometric measurement unit 8 to the controller 13 (Step S20), and the input absorbance data is stored on the storage device 12 (Step S30).
- Step S40 whether the absorbance data necessary for subsequent steps has been stored is judged (Step S40), and when the judgment result is NO, the process returns to Step S20, followed repetition of Steps S20 and 30 until the judgment result becomes YES. Also, when the judgment results in Step S40 is YES, by the calculator 132, the parameters of the approximation formula are calculated (approximation process) such that the temporal change of the absorbance represented by the approximation formula selected in Step S10 and the temporal change of the actual absorbance are as small as possible (Step S50).
- Step S60 the shape descriptors (T, D, Q, P) showing the characteristics of the absorbance change pattern of the part in which the absorbance of the earlier stage of the main reaction changes in a curved manner are calculated (Step S60), and the calculated shape descriptors are classified according to the types and stored on the storage device 12 (Step S70).
- Step S80 whether or not the calculated shape descriptors exceed reference values (for example, a range defined by upper and lower limit values) pre-stored on the storage device 12 is judged (Step S80), and when the judgment result is YES, an abnormality cause judgment (described later) in which the causes of the abnormality are judged from the types and patterns of the shape descriptors is performed (Step S90), followed by the transfer of the judgment result from the abnormality judgment unit 133 to the computer (PC) 10 (Step S100), Also, when the judgment result in Step S80 is NO, the process ends.
- reference values for example, a range defined by upper and lower limit values
- the controller 13 first judges what is the type of the index (shape descriptor) that exceeded the reference values (Step S901).
- Step S901 when the index that exceeded the reference value is the shape descriptor D or T, whether the measurement data exceeds the reference data in a continuous manner is judged (Step S902).
- Step S902 when the judgment result is YES, whether the same occurred in other items (Step 906) and whether a data alarm of the stirring function has been issued (Step S910) are judged.
- Step S910 when the judgment results are both YES, the stirring function is judged abnormal (Step S912), and the process ends. Further, when the judgment result in Step S910 is NO, the stirring parameter setting is judged bad (Step S914), and the process ends.
- Step S906 When the judgment result in Step S906 is NO, whether the reagent lot has been changed is judged (Step S911), and when the judgment result is No, the stirring parameter setting is judged bad (Step S914), and when the judgment result is YES, it is judged that the reference value has changed due to lot change (Step S913), and the process ends. Also, when the judgment result in Step S902 is NO, whether the value is larger than the previous value is judged (Step S907), and when the judgment result is YES, stirring is judged insufficient (Step S915), and when the judgment result is NO, it is judged that sample singularity is responsible (Step S916), and the process ends.
- Step S901 when the index that exceeded the reference value is the shape descriptor Q, whether reagent bottle replacement has been done is judged (Step S903), and when the judgment result is YES, it is judged that the reference value has changed due to lot change (Step S913), and the process ends. Also, when the judgment result in Step S903, whether the same has occurred continuously before and after the measurement is judged (Step S908), and when the judgment result is NO, it is judged that the turbidity or hemolysis of the sample is responsible (Step S917), and when the judgment result is YES, it is judged that reagent deterioration is responsible (Step S918), and the process ends.
- Step S901 when the index that exceeded the reference value is the shape descriptor Q, whether the sample has been subjected to amount-increased or amount-decreased measurement is judged (Step S904), and when the judgment result is YES, it is judged that the absorbance data is normal (Step S905), and the process ends. Further, when the judgment result in Step S904 is NO, whether the absorbance data is within the range of the technical limit is judged (Step S909), and when the judgment result is YES, it is judged that reagent deterioration is responsible (Step S918), and when the judgment result is NO, it is judged that the absorbance data is outside the range of reagent performance (Step S919), and the process ends.
- Sample analysis performed by the analyzer 100 includes the following steps: sampling, reagent dispensing, stirring, photometric measurement, reaction vessel cleaning, and data processing (e.g., conversion of concentrations).
- the sample disk 1 is controlled by the controller 13 via the computer 10.
- the sample vessels 16 are arranged along the circumference of the sample disk 1, and the sample disk 1 is rotated so that the sample vessels 16 can move to the position right below the probe 24 one after another according to the order of measurements.
- a given amount of the sample contained in a sample vessel 16 is dispensed into any of the reaction vessels 21 by a pump connected to the sample dispenser 5.
- the reaction vessel 21 that has received the sample then moves within the reaction tank 4 up to a first reagent dispensing position (i.e., the position below the probe 27).
- a given amount of the reagent contained in a reagent vessel 18 is dispensed into that reaction vessel 21 by a pump connected to the reagent dispenser 6.
- the reaction vessel 21 that has received the reagent moves to the position of the stirrer 7 where the first stirring is performed.
- the photometric measurement unit 8 multi-wavelength photometer detects the absorbance of the mixed solution in that reaction vessel 21.
- the resultant absorbance signal (absorbance data) is transmitted to the controller 13 where it is converted into the concentration of the sample.
- the controller 13 also performs abnormality judgment based on the absorbance.
- the absorbance data obtained before and after the conversion are stored on the storage device 12 and displayed on the screen of the computer 10.
- Absorbance data that has been judged abnormal during the abnormality judgment is displayed on the screen of the computer 10 together with possible causes identified, thereby prompting the operator to take proper actions (e.g., elimination of the abnormality causes or reanalysis).
- the reaction vessel 21 is moved to the position of the rinse mechanism 9 and then cleaned for subsequent analyses.
- the preset embodiment it is configured such that an approximation curve is created from measurement data points, and shape descriptors are calculated from the approximation curve, and abnormality judgment is performed based on the shape descriptors.
- an approximation curve is created from measurement data points, and shape descriptors are calculated from the approximation curve, and abnormality judgment is performed based on the shape descriptors.
- the presence or absence or level of stirring for which evaluation is vague can be quantified; thus, it is possible to verify and determine optimal parameters for each item and each reagent in addition to abnormality detection for the stirrer.
- reaction abnormalities can be detected from changes in reaction rates when reagents deteriorate or when dilution occurs due to the rinse liquid inside the reagent probe, it is possible to detect reagent deteriorations caused by human errors in daily inspections and prevent overlooking wrong data output.
- abnormality judgment is performed by the controller 13 that has an input/output unit, a calculator, an abnormality judgment unit, and the like, but the invention is not limited to this.
- this information processor includes a storage device for storing one or more approximation formulas used to generate an approximation curve from measurement data points, a calculator for selecting at least one approximation formula to generate an approximation curve from multiple measurement data points, thereby calculating the shape descriptors from the approximation curve generated, and a data processor having an abnormality judgment unit for performing abnormality judgment using the shape descriptors.
- Multiple measurement data points in the reaction process of a mixes solution are output from the automatic analyzer.
- the measurement data points (reaction process data) output from the automatic analyzer can be transferred by connecting the automatic analyzer and the external computer via a LAN.
Landscapes
- Chemical & Material Sciences (AREA)
- Engineering & Computer Science (AREA)
- Quality & Reliability (AREA)
- Life Sciences & Earth Sciences (AREA)
- Analytical Chemistry (AREA)
- Physics & Mathematics (AREA)
- Chemical Kinetics & Catalysis (AREA)
- Immunology (AREA)
- General Health & Medical Sciences (AREA)
- General Physics & Mathematics (AREA)
- Biochemistry (AREA)
- Pathology (AREA)
- Health & Medical Sciences (AREA)
- Bioinformatics & Cheminformatics (AREA)
- Crystallography & Structural Chemistry (AREA)
- Bioinformatics & Computational Biology (AREA)
- Computing Systems (AREA)
- Theoretical Computer Science (AREA)
- Plasma & Fusion (AREA)
- Automatic Analysis And Handling Materials Therefor (AREA)
- Investigating Or Analysing Materials By The Use Of Chemical Reactions (AREA)
Abstract
Description
- The present invention relates to an automatic analyzer, an analysis method, and an information processor which are used to qualitatively and quantitatively analyze biological samples such as blood and urine.
- In recent years, in automatic analyzers for performing qualitative and quantitative analyses on biological samples such as blood or urine, due to performance improvements, it has become possible to accurately analyze various items with a small amount of reagent or sample. On the other hand, the influence of factors influencing analysis accuracy, such as operational errors of each part of automatic analyzers and changes in the properties of reagents, is becoming large, and it is now required to maintain their status at normal range, detect the occurrence of abnormalities, and handle such problems properly.
- As conventional techniques for detecting such abnormalities, for example, there are one in which reference temporal data created using a chemical reaction model is stored in advance, the reaction process data of a sample is compared against the reference temporal data, and an abnormality is detected when the difference is large (see Patent Document 1) and one in which absorbance changes are approximated by a function stored in advance, the actual absorbance changes measured are compared against the absorbance changes calculated from the function approximated, and an abnormality is detected based on the size of the difference (see Patent Document 2).
-
- Patent Document 1:
JP-2004-347385-A - Patent Document 2:
JP-2006-337125-A - However, in the above conventional technique, it is impossible to detect abnormal reactions other than those between the photometric measurement points used for concentration measurement and reaction changes in each measurement. Also, because the possible measurement range of the reagent used for analysis varies due to temporal changes in its properties, it has been difficult to sufficiently detect abnormalities from each measurement result. Further, because the causes of abnormalities will not be identified, it is possible that the reliability in reexamination after detection of an abnormality may decrease and the same abnormality may occur again.
- Even if the operator confirms examination results and reaction processes, because the operator performs analyses on a great number of sample on a daily basis at the clinical site, it is extremely difficult to confirm all cases such as measurement results and reaction processes. Further, the problem with the confirmation by the operator is that the accuracy of abnormality detection and the accuracy of cause identification are dependent on the experience and skills of the operator.
- The invention has been contrived to address the above the issues, and one object of the invention is to provide an automatic analyzer, analysis method and information processor which not only allow abnormalities to be detected accurately from each measurement result, but also allow the causes of the abnormalities to be identified.
- To achieve the above object, an automatic analyzer according to the invention comprises: a sample vessel for containing a sample to be measured; a reagent vessel for containing a reagent to be reacted with the sample; a reaction vessel in which to mix the sample and the reagent; a sample dispenser for dispensing the sample from the sample vessel into the reaction vessel; a reagent dispenser for dispensing the reagent from the reagent vessel into the reaction vessel; a stirrer for stirring the sample and the reagent contained in the reaction vessel to obtain a mixed solution; a measurement section for obtaining a plurality of measurement data points during the progress of reaction of the mixed solution; a storage section for storing one or more approximation formula to generate an approximation curve from the measurement data points; and a data processing section having a calculation section for selecting at least one approximation formula and generating an approximation curve from the measurement data points to calculate a shape descriptor from the approximation curve generated and an abnormality judgment section for performing abnormality judgment based on the shape descriptor.
- The invention not only allows abnormalities to be detected accurately from each measurement result, but also allows the causes of the abnormalities to be identified.
-
-
FIG. 1 is a diagram illustrating the overall structure of an automatic analyzer according to an embodiment of the invention; -
FIG. 2 is a diagram illustrating the functions of the controller of the automatic analyzer according to an embodiment of the invention; -
FIG. 3 is a diagram illustrating an example of the reaction process in the case of a two-reagent rate method and the reaction process in which absorbance increases; -
FIG. 4 is a diagram illustrating an example of the reaction process in the case of a two-reagent rate method and the reaction process in which absorbance decreases; -
FIG. 5 is a diagram extracted from lag phase among the reaction process ofFIG. 3 ; -
FIG. 6 is a diagram illustrating a case where an approximation curve is created using an approximation formula from reaction process data in the reaction process in which absorbance increases; -
FIG. 7 is a diagram in which the shape descriptor D calculated using an approximation curve generated from reaction progress data about a sample measured under varied stirring conditions in measurement by γGT automatic analyzer is plotted; -
FIG. 8 is a diagram in which the shape descriptor T calculated about measurement item LD is plotted; -
FIG. 9 is a diagram in which the shape descriptor Q calculated about measurement item LD is plotted; -
FIG. 10 is a diagram in which the shape descriptor P calculated by measuring a general sample is plotted; -
FIG. 11 is a flowchart illustrating the content of abnormality judgment according to one embodiment of the invention; -
FIG. 12 is a tree diagram illustrating the content of abnormality cause judgment according to one embodiment of the invention; and -
FIG. 13 is a diagram illustrating an information processor according to one embodiment of the invention. - An embodiment of the present invention will now be described with reference to the accompanying drawings.
-
FIG.1 is a schematic of an automatic analyzer according to an embodiment of the invention. - The
automatic analyzer 100 ofFIG.1 includes the following components: asample disk 1, areagent disk 2, areaction disk 3, asample dispenser 5, areagent dispenser 6, astirrer 7, aphotometric measurement unit 8, (measurement section) arinse mechanism 9, a storage device 12 (storage section), acontroller 13, a computer 10 (PC), and the like. Thesample disk 1 includes acircular disk 17 in which to storesample vessels 16 each containing a biological sample such as blood or urine. Thereagent disk 2 includes acircular disk 19 in which to storereagent vessels 18. Thereagent vessels 18 contain various reagents to be used for the analysis of the samples. Thereagent disk 2 further includes arefrigerator 20 for maintaining thereagent vessels 18 at a constant temperature. Thereaction disk 3 includes areaction vessel holder 22 forholding reaction vessels 21 in which to mix a sample and a reagent. Thereaction disk 3 further includes areaction tank 4 for adjusting the temperatures of thereaction vessel 21 held by thereaction vessel holder 22. Thereaction disk 3 is rotated by adrive mechanism 23. Thesample dispenser 5 is designed to dispense a sample from any of thesample vessels 16 to any of thereaction vessels 21 and includes asupport shaft 25, anarm 26, and aprobe 24. Theprobe 24 is attached to the distal end of thearm 26 that can be rotated and vertically moved by thesupport shaft 25. The reagent dispenser is designed to dispense a reagent from any of thereagent vessels 18 to any of thereaction vessels 21 and includes asupport shaft 26, anarm 29, and aprobe 27. Theprobe 27 is attached to the distal end of thearm 29 that can be rotated and vertically moved by thesupport shaft 26. Thestirrer 7 includes astirrer controller 15 for controlling the vibration of a fixed unit 31 through the use of apiezoelectric driver 14 and is used to stir the mixed solutions within thereaction vessels 21. Thephotometric measurement unit 8 performs photometric measurement on any of thereaction vessels 21 when it passes through a light beam emitted from a light source (not illustrated), thereby detecting the absorbance of the mixed solution contained in that reaction vessel. Therinse mechanism 9 is used to clean thereaction vessels 21 after they have been subjected to photometric measurement. Therinse mechanism 9 includesnozzles 33 for suctioning and discharging rinse liquid and alifter 34 for vertically moving thenozzles 33. Thestorage device 12 stores information such as analysis parameters, the number of times analysis can be done using each reagent bottle, the maximum number of times of analysis, calibration results, analysis results, and so forth. Thecontroller 13 is used to control the entire operation of theanalyzer 100. Thecomputer 10 has means for allowing input of information or commands into thecontroller 13 and means for displaying various pieces of information. -
FIG. 2 is a partial block diagram of thecontroller 13. - As illustrated in the figure, the
controller 13 includes an input/output unit 131, a calculator 132 (calculation section), and anabnormality judgment unit 133. Data transfer can be done among these components via adata bus 134. The input/output unit 131 performs data transfer from/to thephotometric measurement unit 8, thecomputer 10, and thestorage device 12. The input/output unit 131, thecalculator 132, and theabnormality judgment unit 133 can be implemented by hardware and CPUs. Alternatively, those components can be installed on a single CPU as software modules. - As discussed below, sample analysis performed by the
analyzer 100 includes the following steps: sampling, reagent dispensing, stirring, photometric measurement, reaction vessel cleaning, and data processing (e.g., conversion of concentrations). - The
sample disk 1 is controlled by thecontroller 13 via thecomputer 10. Thesample vessels 16 are arranged along the circumference of thesample disk 1, and thesample disk 1 is rotated so that thesample vessels 16 can move to the position right below theprobe 24 one after another according to the order of measurements. A given amount of the sample contained in asample vessel 16 is dispensed into any of thereaction vessels 21 by a pump connected to thesample dispenser 5. Thereaction vessel 21 that has received the sample then moves within thereaction tank 4 up to a first reagent dispensing position (i.e., the position below the probe 27). Thereafter, a given amount of the reagent contained in areagent vessel 18 is dispensed into thatreaction vessel 21 by a pump connected to thereagent dispenser 6. Thereaction vessel 21 that has received the reagent moves to the position of thestirrer 7 where the first stirring is performed. The above steps are repeated until the same sample and several other reagents are mixed in thesame reaction vessel 21. Once areaction vessel 21 has been subjected to stirring, it passes through a light beam emitted from a light source, and the photometric measurement unit 8 (multi-wavelength photometer) detects the absorbance of the mixed solution in thatreaction vessel 21. The resultant absorbance signal (absorbance data) is transmitted to thecontroller 13 where it is converted into the concentration of the sample. Thecontroller 13 also performs abnormality judgment (discussed later) based on the absorbance. The absorbance data obtained before and after the conversion are stored on thestorage device 12 and displayed on the screen of thecomputer 10. Areaction vessel 21 that has been subjected to photometric measurement is moved to the position of the rinsemechanism 9 and then cleaned for subsequent analyses. - In a two-wavelength measurement method involving the use of light of a wavelength that greatly changes in absorbance due to color changes resulting from reactions between a reagent and a sample (i.e., main wavelength) and light of a wavelength that hardly changes in absorbance (i.e., sub-wavelength), the difference between the absorbance of the main wavelength and the absorbance of the sub wavelength is input as absorbance data.
- During reactions between a sample and a reagent, several absorbance measurements are done, and the resultant absorbance data is recorded as temporal data. This temporal data is also called reaction process data. Data confirmation in daily inspections is done using the reaction process data. Its method varies depending on the analysis method. Measurement methods in clinical assay can be roughly classified into the endpoint method and the rate method depending on the analysis method. The present embodiment illustrates an example in which the rate method is used, and the endpoint method is not discussed in detail herein.
- In the endpoint method, the concentrations of the proteins and fat contained in a sample are measured. The amount of a substance generated by reactions between the substances in a sample and a reagent becomes closer to a particular value with the passage of time, and so do measurement values.
- The rate method is used primarily to measure the activity values of the enzymes contained in a sample, not the concentrations of the enzymes. To perform the measurement, a given amount of a base is added as a reagent, and factors that change due to the consumption of the base by the enzymes are measured. The enzyme reaction rate becomes closer to a theoretical upper limit if the concentration of the base is relatively high. Reagents used for analysis of biological items contain a sufficient amount of a base. Thus, when a reaction between a sample and a reagent proceeds properly, reaction measurement values change linearly by a fixed amount with the passage of time.
-
FIGS. 3 and 4 illustrate examples of reaction processes in which two reagents are used for the rate analysis.FIG. 3 shows a reaction process in which the absorbance increases whileFIG. 4 shows a reaction process in which the absorbance decreases. InFIGS. 3 and 4 , the horizontal axis represents time, the vertical axis represents the absorbance of the mixed solution inside areaction vessel 21, andabsorbance data 103 obtained at particular time intervals are plotted. - In the two-reagent method, the sample inside the
reaction vessel 21 is mixed with a first reagent at time t0, followed by incubation at a proper temperature. During that time, sub-reactions and the like that do not influence the wavelength measured will proceed. At time t1 when the sub-reactions end, a second reagent is added and stirred for the main reaction to start, and the absorbance of the wavelength measured will change. The reaction process in such a rate method is influenced by the status of reactions between a sample and a reagent. - In the case of
FIG. 3 , the absorbance increases at time t1 when the main reaction starts, but the rate of this reaction does not always stay the same from the beginning and becomes almost constant after time t2 when the reaction is in a steady state. After time t2, the change rate (increase rate) of the absorbance becomes constant. That is, as illustrated inFIG. 3 , the change status after time t2 takes the form of a straight line. Like this, the period between time t1 and time t2, i.e., from the start of the main reaction (time t1) to the steady state (time t2), is called a lag phase as a time lag. - The same is true of
FIG. 4 . That is, the absorbance increases after time t1 when the main reaction starts, but the rate of this reaction does not always stay the same from the beginning and becomes almost constant after time t2 when the reaction is in a steady state. After time t2, the change rate (increase rate) of the absorbance becomes constant. As illustrated inFIG. 3 , the change status after time t2 takes the form of a straight line. The period between time t1 and time t2, i.e., from the start of the main reaction (time t1) to the steady state (time t2), is called a lag phase as time lag. - The reaction process near a lag phase is further discussed below with reference to the accompanying drawings. Explained here is an example in which the absorbance increases with the progress of reaction as in
FIG. 3 .FIG. 5 is a graph extracted from the lag phase (time t1 to time t2) among the reaction process shown inFIG. 3 . - Similar to
FIG. 3 , the horizontal and vertical axes ofFIG. 5 represent time and the absorbance of the mixed solution inside areaction vessel 21, respectively, andabsorbance data 103 obtained at particular time intervals are plotted. Also, the length of the lag phase (time t1 to time t2) is T, an approximate straight line for the reaction process data after the end of the lag phase (time t2) is thestraight line 104, the intersection point between the line showing time t1 (the absorbance axis ofFIG. 5 ) and theline 104 is Q, and the difference between the absorbance at the intersection point Q and the absorbance at time t1 is D. At this time, when the slope of theline 104 is P (=ΔABS/min), theline 104 can be represented as y = Px + Q (y: absorbance variable, x: time variable). - Here, T, D, Q, and P are called shape descriptors as the indices representing the shape of reaction process data and hereinafter denoted by the shape descriptor T, shape descriptor D, shape descriptor Q, and shape descriptor P, respectively.
- Possible factors that influence the accuracy of measurement results include the sampling mechanism, reagent dispenser, stirrer, optical system, reaction vessels, and thermostat bath of the analyzer. Measurement results are also influenced solely or in a combined manner by the composition or characteristics of reagents and samples. Reaction process data of the rate method has parts that distinctively show changes of such multiple influencing factors. The lag phase varies depending on analysis items, the composition of reagents, stirring status, reaction temperature, the concentration of the target substance in a sample, or the like. For example, γGT (γ-glutamyl transpeptidase), LD (lactate dehydrogenase), and the like have a relatively long lag phase while ALP (alkaline phosphatase), AST (aspartate amino transferase) have a short lag phase. This is because of differences in enzyme activity and because the number of conjugate enzymes or the liquid properties of reagents are different.
- Like this, lag phases are influenced by various factors related to reaction, but the factors can be identified under certain conditions. We now describe the characteristics of reaction process data including lag phases and the relationship of factors that influence the characteristics.
- As one example of the factors influencing the shape descriptor D, stirring status can be given. Stirring has the function of physically mixing a sample and a reagent and promoting their reaction. Thus, it seems that when stirring is done properly, the reaction between a sample and a reagent under the rate method reaches optimal conditions right after the stirring, and because the rate of the reaction becomes constant, the lag phase becomes short. On the other hand, when stirring is insufficient and the sample and the reagent have not been mixed sufficiently, a time lag occurs until the reaction rate reaches constant optimal conditions. Thus it can be said that the lag phase becomes large because the rate at which the absorbance during that time changes becomes slower. In other words, by using the lag phase sixe D shown in
FIG. 5 as an index, the properties of the reaction between the sample and the reagent can be evaluated, and it also becomes possible to detect whether stirring has been done properly. When measurement is done for a certain item, it can be assumed that the influence of a reagent is always constant if the lot of the reagent is the same and the use period of the reagent is also the same. Further, reaction temperature is less likely to exhibit fluctuations in each measurement if the temperature of the thermostat bath is monitored. There is a constant relation between the concentration of the substance measured and the size of the lag phase, and it can be inferred that measurements that have deviated from the relation is due to insufficient stirring, that is, the status of the mixed solution is abnormal. - As an example of the factors influencing the shape descriptor T, sample differences can be given. Since a lag phase is attributed to the reaction between a sample and a reagent, management of time until the lag phase becomes a steady reaction allows evaluation of the reaction status of that item. It seems that the length of a lag phase may also be influenced by other comprehensive factors such as a sample, a reagent, stirring, and reaction temperature. However, when measurement is done at a single institution, the composition of a generally used reagent is fixed, and reaction temperature, one of the device-related factors, will not change in each measurement. Thus, because the time T of a lag phase (the time between the start of the main reaction and a steady state) shown in
FIG. 5 is influenced especially by the influence of reaction inhibitors or the like contained in the sample, monitoring of the time T of the lag phase allows detection of differences in sample properties and detection of abnormalities resulting from substances other than the substance to be measured such as reaction inhibitors. - As examples of the factors influencing the shape descriptor Q, reagent-related factors (deterioration and stability) and sample-related factors (lipemia, turbidity, or hemolysis) can be given.
- The intercept Q (shape descriptor Q) of the
line 104 ofFIG. 5 shows the absorbance at the time of the start of reaction at which a sample and a reagent are added. The value of this absorbance is not derived from the concentration of the target substance generated by the reaction between the sample and the reagent, but mostly reflects the absorption of the mixed solution between the first reagent and the second reagent and represents the absorbance of the reagent and the sample that are not dependent on the reaction generating the substance to be measured. As regards reagents of the rate method showing a reaction process in which the absorbance increases as inFIG. 3 , one larger in absorption of the first reagent tends to be smaller in absorbance because the colored substances of the reagent are decomposed due to deterioration of the reagent. On the other hand, as regards reagents of the rate method showing a reaction process in which the absorbance decreases as inFIG. 4 , absorption of the first reagent itself is low, but with the progress of reagent deterioration, the absorbance tends to be larger. The absorbance before the start of the main reaction is not dependent on the concentration of the target substance in the sample, but becomes almost constant. Thus, when the value of the shape descriptor Q of the data obtained by measuring the sample, control, and the like is monitored according to a temporal sequence, the value of the shape descriptor Q gradually decreases or increases along the temporal sequence with the progress of reagent deterioration. In other words, during calibration and measurement of a control sample, the quality of reagents cannot be confirmed in each measurement, but the use of this index allows confirmation of the quality of the reagents. Also, by setting a threshold for the value of the shape descriptor Q and by changing reagents based on the results of comparison against the threshold, the reagent change can be done before it influences measurement results, thereby preventing abnormalities of measurement results. - In monitoring the value of the shape descriptor Q according to a temporal sequence, when the value changes discontinuously regardless of changes of reagent lots and bottles, it can be attributed to the influence of absorbance of the sample itself. As the sample, serum is often used, and to obtain a sample, peripheral blood collected in a blood collecting tube containing a blood separator is subjected to centrifugal separation, and serum is obtained from its upper layer. Depending on samples, there are ones that are hemolyzed during blood collection or the process of separation and serums that become white or opaque. Such samples may affect the absorbance depending on the wavelength used, and samples that have become white, opaque, or hemolyzed affect the results of measurement of items such as LD, AST, K (potassium), Fe (serum iron), TP (total protein), TTT (thymol turbidity test), and ZTT (zinc sulfate turbidity test). By monitoring the value of Q, whitening, turbidity, or hemolysis of samples can be detected.
- As examples of the factors including the shape descriptor P, factors related to the substance to be measured (concentration, activity values) and reagent-related factors (performance) can be given.
- As one method of concentration calculation in the rate method, from the measurement values measured by using two standard solutions of two concentrations, when C2 is the concentration of a second standard solution, C1 is the concentration of a first standard solution, A2 is the absorbance of the second standard solution, and B is the absorbance of a blank standard solution, K factor (conversion coefficient) can be calculated from
Formula 1 below. -

line 104 represented by this linear equation (y = Px + Q) shown inFIG. 5 is the amount of change in absorbance per fixed time period; thus, by using this shape descriptor P, the concentration or activity value of the sample to be measured can be calculated. - Reagents that use enzyme reaction have a sufficient amount of a base or enzyme so that there are no problems even if the target substance in a sample is high in concentration. However, the possible range of measurement of a reagent is limited, and as specified in its package insert, its linearity in fact fluctuates due to the temporal change of the reagent or lot differences. In the rate method, if within the possible range of measurement as the performance of the reagent, the concentration or activity value of the target substance in a sample and the amount of change in absorbance per fixed time period have a proportional relation of a linear equation. In other words, if outside the possible range of measurement as the performance of the reagent, the concentration or activity value of the target substance in the sample and the amount of change in absorbance per fixed time period are deviated from a proportional relation of a linear equation (i.e., linearity is lost). That is, by monitoring the shape descriptor P, it is possible to detect abnormalities related to the possible measurement range of a reagent such as the performance of the reagent (i.e., the range of the concentration that can be measured by that reagent), the abnormality in which the measurement has been done outside the possible measurement range of that reagent, or the absence of linearity in the possible measurement range specified in the package insert of that reagent (i.e., the possible measurement range in the package insert of the reagent is different from the actual possible measurement range). Further, since the shape descriptor P corresponds to the amount of absorbance change per fixed time period, by monitoring the relation between the measurement values of the sample and the shape descriptor P, the accuracy of the sample of those measurement values can be evaluated.
- To quantitatively obtain the above-mentioned shape descriptors (T, D, Q, P) in reaction process data, the reaction process data is approximated by functions, and the resultant approximation curve is used to calculate the shape descriptors.
- In the present embodiment, as the functions to be used for approximation in which reaction process data is approximated (an approximation curve is created), formulas that can accurately approximate the lag phase (curved portion) that is the shape part characteristic of the reaction process of the rate method and the part (straight portion) in which reaction progresses steadily with fixed absorbance changes are used. The functions used for the approximate curve generation in the present embodiment are shown by
Formulas 2 to 5. In the formulas that follow includingFormulas 2 to 5, t represents time, and y absorbance. Also, a, b, c, d, e, k, p, q, r, u, v, and w are parameters. -


- Among these formulas, the function that can perform the most accurate approximation is selected, and when the reaction process data of the rate method is approximated, the value of each parameter (a, b, c, d, e, k, p, q, r, u, v, and w) is obtained. With the use of these parameters, the shape characteristics of the lag phase are quantified. Like this, by applying an approximation formula that can accurately reflect the shape changes of the reaction process obtained in each measurement, the sizes of theirs changes are quantified. By managing the values of the parameters quantified, the characteristics of each reaction can be known, and especially abnormal reactions that affect the accuracy of measurement results can be detected. In the present embodiment, from among the multiple approximation formulas representing the temporal changes of absorbance that can be storred on the
storage device 12, the optimal approximation formula that is suited for the combination of the inspection items and the reagent is automatically determined and used. - A case in which approximation is performed using the above formula (Formula 3) is shown as an example and further explained in detail. When approximation is performed with the use of
Formula 3, the values of the parameters in the formula are calculated such that the temporal absorbance change represented by an approximation curve generated and the actual temporal absorbance change become as small as possible. Specifically, the values of the parameters in the formula are calculated such that the square error between the absorbance data measured and stored and the absorbance calculated from the approximation formula becomes as small as possible. For the calculation of the values of the parameters, the existing least squares method is available, but as a method suitable for formulas of various forms, the parameters (a, b, e, d) that cause the square error to be the smallest are calculated by, for example, the steepest decent method. In reactions in which several reagents are used, after the reagent that causes the main absorbance change (normally the final reagent) is added, the absorbance starts to change greatly. In this case, only the data after the addition of the reagent that causes the main absorbance change is used for parameter calculation. - The process of calculating the shape descriptors (T, D, Q, P) from an approximation curve generated by the approximation process from reaction process data is explained with reference to
FIG. 6. FIG. 6 is a diagram illustrating a case where anapproximation curve 107 is created with the use of an approximation formula from the reaction process data in the reaction process in which the absorbance increases as inFIG. 5 . The horizontal axis represents time, and the vertical axis the absorbance. - In
FIG. 6 , the line 105 (first line) is a tangent to theapproximation curve 107 at the time of the start of the main reaction (right after the start), and the line 106 (second line) is a line to which the approximation curve is getting closer. - The time Tl at which the curve is sufficiently close is defined as the time at which the difference f between the
approximation curve 107 and theline 106 at the same time becomes less than ε, which is a small value determined in advance. ε can be a fixed value or set according to the initial absorbance or the width of absorbance fluctuation. For example, the initial absorbance can be multiplied by a constant, or the difference between the initial absorbance and the last absorbance can be multiplied by a constant to obtain ε. To determine the time Tl, a small value δ is determined, and the time TL can also be defined as the time at which the slope difference between theapproximation curve 107 and theline 106 becomes less than δ. In this case, δ can be a constant or set according to the slope of theline 106. For example, the slope of theline 106 can be multiplied by a constant to obtain δ. - For an approximation curve of such reaction process data, the shape descriptors are calculated using
Formulas 6 through 10. - · Shape descriptor D: the difference between the absorbance at the intersection between the absorbance axis (vertical axis) and the
line 106 and the absorbance at the intersection between the absorbance axis (vertical axis) and the line 105
- · Shape descriptor T: the time shown by the intersection between the
line 105 and the line 106 (Tc) or the time at which theline 106 and theapproximation curve 107 is sufficiently close to each other (Tl)

- · Shape descriptor Q: the intersection between the absorbance axis (vertical axis) and the line 106 (intercept of the line 106)

- · Shape descriptor P: the slope of the line 106

- When an approximation curve generated by an approximation formula (Formula 4) is used, the shape descriptors are calculated from Formulas 11 to 13 below.
- · Shape descriptor D: the difference between the absorbance at the intersection between the absorbance axis (vertical axis) and the
line 106 and the absorbance at the intersection between the absorbance axis (vertical axis) and the line 105
- · Shape descriptor T: the time shown by the intersection between the
line 105 and the line 106 (Tc) or the time at which theline 106 and theapproximation curve 107 is sufficiently close to each other (Tl)

- · Shape descriptor Q: the intersection between the absorbance axis (vertical axis) and the line 106 (intercept of the line 106)

- · Shape descriptor P: the slope of the line 106

- Here, using the shape descriptors (D, T, Q, P) calculated from the reaction process data when measurement conditions (factors influencing the accuracy of measurement results) are changed, we now consider the evaluation of measurement data (measurement results) based on the shape characteristics.
-
FIG. 7 is a plotted diagram in which an approximation curve is generated from the reaction progress data about a sample measured under varied stirring conditions in measurement by a γGT automatic analyzer, with the vertical axis representing the shape descriptor D calculated from an formula (Formula 6) and the horizontal axis representing each reaction progress data. The shape descriptors D calculated using the reaction progress data when stirring failures occurred are arranged in 1 to 40 of the horizontal axis, and the shape descriptors D calculated using the reaction progress data when stirring has been done properly are arranged in 41 to 80 of the horizontal axis. It is obvious that as illustrated by a group ofdata 108, the absolute value of the shape descriptor D when a stirring failure occurred is large, and as illustrated by a group ofdata 109, the absolute value of the shape descriptor D when stirring has been done properly is small. Thus, from the values of the shape descriptor D, stirring status can be evaluated. -
FIG. 8 is a plotted diagram in which the vertical axis represents the shape descriptor T (Tl) calculated using a formula (Formula 13) about measurement results of LD and the horizontal axis represents measurements values (U/L) calculated from the apparatus. As illustrated by adata group 110, as regards LD, the shape descriptor T shows the value of 0 about almost all the measurement results regardless of the sizes of the measurement values. This means that the time of the lag phase is small. However, several data as illustrated by adata group 109 show large absolute values of Tl, and it can be judged that this is due to the reaction specific to the sample because this data is not related to the temporal sequence. -
FIG. 9 is a plotted diagram in which the vertical axis represents the shape descriptor Q calculated using a formula (Formula 9) about measurement item LD and the horizontal axis represents a temporal sequence. As illustrated by adata group 111, only the values of the shape descriptor Q in a certain temporal sequence are higher thanother data groups -
FIG. 10 is a plotted diagram in which the horizontal axis represents the shape descriptor P calculated using a formula (Formula 10) by measuring a general sample and the horizontal axis represents measurement values (U/L) calculated from the apparatus. Adata group 115 is on aline 117, but it deviates from theline 117 when the measurement value (U/L) exceeds 900 (U/L). From this data, it can be seen that the possible measurement range of the reagent used at this measurement is up to the measurement value shown by aline 118 or thereabout (in this example, up to a measurement value of 900 U/L), and for the measurement of the two points of adata group 116 that show measurement values larger than that, amount-reduced re-examination is necessary. - We now explain about the content of the abnormality judgment performed at the
controller 13 in the present embodiment with reference to the accompanying drawings.FIG. 11 is a flowchart illustrating the content of the abnormality judgment of the present embodiment, andFIG. 12 is a tree diagram illustrating the content of the abnormality cause judgment in the abnormality judgment. - In the abnormality judgment shown in
FIG. 11 , thecontroller 13 first selects an optimal approximation formula from among one or more approximation formulas stored on thestorage device 12 based on the combination of inspection items and reagents (Step S10). Next, by the input/output unit 131, the absorbance data of one measurement or the average of several measurements of the absorbance measured several times with the passage of time is input from thephotometric measurement unit 8 to the controller 13 (Step S20), and the input absorbance data is stored on the storage device 12 (Step S30). Then, whether the absorbance data necessary for subsequent steps has been stored is judged (Step S40), and when the judgment result is NO, the process returns to Step S20, followed repetition of Steps S20 and 30 until the judgment result becomes YES. Also, when the judgment results in Step S40 is YES, by thecalculator 132, the parameters of the approximation formula are calculated (approximation process) such that the temporal change of the absorbance represented by the approximation formula selected in Step S10 and the temporal change of the actual absorbance are as small as possible (Step S50). Next, by thecalculator 132, the shape descriptors (T, D, Q, P) showing the characteristics of the absorbance change pattern of the part in which the absorbance of the earlier stage of the main reaction changes in a curved manner are calculated (Step S60), and the calculated shape descriptors are classified according to the types and stored on the storage device 12 (Step S70). Then, whether or not the calculated shape descriptors exceed reference values (for example, a range defined by upper and lower limit values) pre-stored on thestorage device 12 is judged (Step S80), and when the judgment result is YES, an abnormality cause judgment (described later) in which the causes of the abnormality are judged from the types and patterns of the shape descriptors is performed (Step S90), followed by the transfer of the judgment result from theabnormality judgment unit 133 to the computer (PC) 10 (Step S100), Also, when the judgment result in Step S80 is NO, the process ends. - In the abnormality judgment shown in
FIG. 12 , thecontroller 13 first judges what is the type of the index (shape descriptor) that exceeded the reference values (Step S901). - In Step S901, when the index that exceeded the reference value is the shape descriptor D or T, whether the measurement data exceeds the reference data in a continuous manner is judged (Step S902). When the judgment result is YES, whether the same occurred in other items (Step 906) and whether a data alarm of the stirring function has been issued (Step S910) are judged. When the judgment results are both YES, the stirring function is judged abnormal (Step S912), and the process ends. Further, when the judgment result in Step S910 is NO, the stirring parameter setting is judged bad (Step S914), and the process ends. When the judgment result in Step S906 is NO, whether the reagent lot has been changed is judged (Step S911), and when the judgment result is No, the stirring parameter setting is judged bad (Step S914), and when the judgment result is YES, it is judged that the reference value has changed due to lot change (Step S913), and the process ends. Also, when the judgment result in Step S902 is NO, whether the value is larger than the previous value is judged (Step S907), and when the judgment result is YES, stirring is judged insufficient (Step S915), and when the judgment result is NO, it is judged that sample singularity is responsible (Step S916), and the process ends.
- In Step S901, when the index that exceeded the reference value is the shape descriptor Q, whether reagent bottle replacement has been done is judged (Step S903), and when the judgment result is YES, it is judged that the reference value has changed due to lot change (Step S913), and the process ends. Also, when the judgment result in Step S903, whether the same has occurred continuously before and after the measurement is judged (Step S908), and when the judgment result is NO, it is judged that the turbidity or hemolysis of the sample is responsible (Step S917), and when the judgment result is YES, it is judged that reagent deterioration is responsible (Step S918), and the process ends.
- In Step S901, when the index that exceeded the reference value is the shape descriptor Q, whether the sample has been subjected to amount-increased or amount-decreased measurement is judged (Step S904), and when the judgment result is YES, it is judged that the absorbance data is normal (Step S905), and the process ends. Further, when the judgment result in Step S904 is NO, whether the absorbance data is within the range of the technical limit is judged (Step S909), and when the judgment result is YES, it is judged that reagent deterioration is responsible (Step S918), and when the judgment result is NO, it is judged that the absorbance data is outside the range of reagent performance (Step S919), and the process ends.
- We now discuss the operation in the present embodiment thus configured.
- Sample analysis performed by the
analyzer 100 includes the following steps: sampling, reagent dispensing, stirring, photometric measurement, reaction vessel cleaning, and data processing (e.g., conversion of concentrations). - When the
automatic analyzer 100 starts an analysis, thesample disk 1 is controlled by thecontroller 13 via thecomputer 10. Thesample vessels 16 are arranged along the circumference of thesample disk 1, and thesample disk 1 is rotated so that thesample vessels 16 can move to the position right below theprobe 24 one after another according to the order of measurements. A given amount of the sample contained in asample vessel 16 is dispensed into any of thereaction vessels 21 by a pump connected to thesample dispenser 5. Thereaction vessel 21 that has received the sample then moves within thereaction tank 4 up to a first reagent dispensing position (i.e., the position below the probe 27). Thereafter, a given amount of the reagent contained in areagent vessel 18 is dispensed into thatreaction vessel 21 by a pump connected to thereagent dispenser 6. Thereaction vessel 21 that has received the reagent moves to the position of thestirrer 7 where the first stirring is performed. After thereaction vessel 21 has been subjected to addition of all necessary reagents and stirring, it passes through a light beam emitted from a light source, and the photometric measurement unit 8 (multi-wavelength photometer) detects the absorbance of the mixed solution in thatreaction vessel 21. The resultant absorbance signal (absorbance data) is transmitted to thecontroller 13 where it is converted into the concentration of the sample. Thecontroller 13 also performs abnormality judgment based on the absorbance. The absorbance data obtained before and after the conversion are stored on thestorage device 12 and displayed on the screen of thecomputer 10. Absorbance data that has been judged abnormal during the abnormality judgment is displayed on the screen of thecomputer 10 together with possible causes identified, thereby prompting the operator to take proper actions (e.g., elimination of the abnormality causes or reanalysis). When the photometric measurement is complete, thereaction vessel 21 is moved to the position of the rinsemechanism 9 and then cleaned for subsequent analyses. - We now discuss the effects in the present embodiment thus configured.
- In the conventional technique for detecting abnormalities of measurement results in an automatic analyzer, it is impossible to detect abnormal reactions other than those between the photometric measurement points used for concentration measurement and reaction changes in each measurement. Also, because the possible measurement range of the reagent used for analysis varies due to temporal changes in its properties, it has been difficult to sufficiently detect abnormalities from each measurement result. Further, because the causes of abnormalities will not be identified, it is possible that the reliability in reexamination after detection of an abnormality may decrease and the same abnormality may occur again. Even if the operator confirms examination results and reaction processes, because the operator performs analyses on a great number of sample on a daily basis at the clinical site, it is extremely difficult to confirm all cases such as measurement results and reaction processes. Further, the problem with the confirmation by the operator is that the accuracy of abnormality detection and the accuracy of cause identification are dependent on the experience and skills of the operator.
- On the other hand, in the preset embodiment, it is configured such that an approximation curve is created from measurement data points, and shape descriptors are calculated from the approximation curve, and abnormality judgment is performed based on the shape descriptors. Thus, it is possible to sufficiently detect abnormalities from each measurement result, and it is also possible to identify the causes of the abnormalities.
- Not only are a control and a calibrator evaluated, but it is also possible to evaluate each measurement result of patient samples of unknown concentrations. It is also possible to assure the reliability of measurement data from the data of the control.
- Further, about factors in which apparatus abnormalities influence reaction process data, it is possible to check the abnormalities from daily inspection data and contribute to the maintenance of apparatus performance.
- Moreover, in a sample of a known concentration such as a control sample and a standard solution, calculation and monitoring of changes in reaction process curves allows the temporal performance of the stirrer to be checked. Thus, it is possible to detect the halt of stirring and changes in reaction rates, making it possible to actively notify the apparatus user of the necessity of stirrer maintenance and replacement from the side of the automatic analyzer.
- Further, the presence or absence or level of stirring for which evaluation is vague can be quantified; thus, it is possible to verify and determine optimal parameters for each item and each reagent in addition to abnormality detection for the stirrer.
- Because the slowness of reaction can be quantified, and because reaction abnormalities can be detected from changes in reaction rates when reagents deteriorate or when dilution occurs due to the rinse liquid inside the reagent probe, it is possible to detect reagent deteriorations caused by human errors in daily inspections and prevent overlooking wrong data output.
- In the present embodiment, we have described examples in which abnormality judgment is performed by the
controller 13 that has an input/output unit, a calculator, an abnormality judgment unit, and the like, but the invention is not limited to this. For example, it is possible to perform abnormality judgment by installing an input/output unit, a calculator, an abnormality judgment unit, and the like on the inside of the computer softwarewise. - Also, as in
FIG. 13 , it is instead possible to perform abnormality judgment by installing softwarewise an input/output unit for reaction process data, a calculator, an abnormality judgment unit, and the like on the inside of an external computer (PC) 101 that exists separately and independently of the automatic analyzer. That is, the data obtained from the automatic analyzer can be calculated by an information processor that exists separately and independently of the automatic analyzer. In this case, this information processor includes a storage device for storing one or more approximation formulas used to generate an approximation curve from measurement data points, a calculator for selecting at least one approximation formula to generate an approximation curve from multiple measurement data points, thereby calculating the shape descriptors from the approximation curve generated, and a data processor having an abnormality judgment unit for performing abnormality judgment using the shape descriptors. Multiple measurement data points in the reaction process of a mixes solution are output from the automatic analyzer. In this case, the measurement data points (reaction process data) output from the automatic analyzer can be transferred by connecting the automatic analyzer and the external computer via a LAN. It is also possible to store the data on an external output medium such as a CD-R, DVD-RAM, or the like and transfer the data to the external computer (information processor) via such a medium, and analyze the data. As for the details of information processing, it is the same as the functions of the information processing in the automatic analyzer already described, and an explanation about this is skipped. - Also, we have described examples in which
Formula 3 is used as an approximation formula, but the invention is not limited to this. It is possible to useFormulas -
1: Sample disk 2: Reagent disk 3: Reaction disk 4: Reaction tank 5: Sample dispenser 6: Reagent dispenser 7: Stirrer 8: Photometric measurement unit 9: Rinse mechanism 10: Computer (PC) with display 11: Input unit 12: Storage device 13: Controller 14: Piezoelectric driver 15: Stirrer controller 16: Sample vessel 17, 19: Circular disk 18: Reagent bottle 20: Refrigerator 21: Reaction vessel 22: Reaction vessel holder 23: Drive mechanism 24, 27: Probe 25: Support shaft 26, 29: Arm 28: Support shaft 31: Fixed unit 33: Nozzle 34: Lifter 51: Input/output unit 52: Calculator 53: abnormality judgment unit 54: Storage device 55: Data bus 100: Automatic analyzer 101: External computer (information processor) 102: External output medium
Claims (8)
- An automatic analyzer comprising:a sample vessel for containing a sample to be measured;a reagent vessel for containing a reagent to be reacted with the sample;a reaction vessel in which to mix the sample and the reagent;a sample dispenser for dispensing the sample from the sample vessel into the reaction vessel;a reagent dispenser for dispensing the reagent from the reagent vessel into the reaction vessel;a stirrer for stirring the sample and the reagent contained in the reaction vessel to obtain a mixed solution;a measurement section for obtaining a plurality of measurement data points during the progress of reaction of the mixed solution;a storage section for storing one or more approximation formula to generate an approximation curve from the measurement data points; anda data processing section having a calculation section for selecting at least one approximation formula and generating an approximation curve from the measurement data points to calculate a shape descriptor from the approximation curve generated and an abnormality judgment section for performing abnormality judgment based on the shape descriptor.
- The automatic analyzer of claim 1,
wherein the data processing section generates as the shape descriptor at least either one of shape descriptors T, D, Q, and P to perform abnormality judgment based on the selected shape descriptor, and
wherein, provided that a tangent to the approximation curve right after the start of reaction is a first line and that a line approaching the approximation curve is a second line, the shape descriptor T is the time at which the first line and the second line intersect, the shape descriptor D is the difference between the first line and the second line at the start of the reaction, the shape descriptor Q is the value of the first line at the start of the reaction, and the shape descriptor P is the slope of the second line. - The automatic analyzer of claim 2,
wherein the data processing section generates the shape descriptor T, and
wherein the abnormality judgment section detects abnormalities resulting from substances other than a target substance in the sample based on the shape descriptor T. - The automatic analyzer of claim 2,
wherein the data processing section generates the shape descriptor D, and
wherein the abnormality judgment section detects abnormalities of the mixed solution based on the shape descriptor D. - The automatic analyzer of claim 2,
wherein the data processing section generates the shape descriptor Q, and
wherein the abnormality judgment section detects abnormalities of reagent quality, abnormalities resulting from sample turbidity, or abnormalities resulting from sample hemolysis based on the shape descriptor Q. - The automatic analyzer of claim 2,
wherein the data processing section generates the shape descriptor P, and
wherein the abnormality judgment section detects abnormalities related to the possible measurement range of the reagent based on the shape descriptor P. - An analysis method comprising the steps of:obtaining a plurality of measurement data points during the progress of reaction between a sample to be measured and a reagent to be reacted with the sample;selecting at least one approximation formula from among one or more approximation formulas stored on a storage section;generating an approximation curve based on the measurement data points;calculating a shape descriptor using the approximation curve; andperforming abnormality judgment based on the shape descriptor.
- An information processor for performing data processing on a plurality of measurement data points obtained during the progress of reaction between a sample and a reagent contained in a reaction vessel, the information processor comprising:a storage section for storing one or more approximation formulas used to generate an approximation curve from the measurement data points;a calculation section for selecting at least one approximation formula and generating an approximation curve from the measurement data points to calculate a shape descriptor from the approximation curve generated; anda data processing section having an abnormality judgment section for performing abnormality judgment using the shape descriptor.
Applications Claiming Priority (2)
| Application Number | Priority Date | Filing Date | Title |
|---|---|---|---|
| JP2010159995 | 2010-07-14 | ||
| PCT/JP2011/065277 WO2012008324A1 (en) | 2010-07-14 | 2011-07-04 | Automatic analysis device, analysis method and information processing device |
Publications (3)
| Publication Number | Publication Date |
|---|---|
| EP2594944A1 true EP2594944A1 (en) | 2013-05-22 |
| EP2594944A4 EP2594944A4 (en) | 2017-10-18 |
| EP2594944B1 EP2594944B1 (en) | 2020-06-03 |
Family
ID=45469327
Family Applications (1)
| Application Number | Title | Priority Date | Filing Date |
|---|---|---|---|
| EP11806654.7A Active EP2594944B1 (en) | 2010-07-14 | 2011-07-04 | Automatic analysis device, analysis method and information processing device |
Country Status (5)
| Country | Link |
|---|---|
| US (1) | US10352864B2 (en) |
| EP (1) | EP2594944B1 (en) |
| JP (1) | JP5562421B2 (en) |
| CN (1) | CN102985829B (en) |
| WO (1) | WO2012008324A1 (en) |
Cited By (1)
| Publication number | Priority date | Publication date | Assignee | Title |
|---|---|---|---|---|
| EP3128330A4 (en) * | 2014-04-01 | 2017-11-22 | Hitachi High-Technologies Corporation | Automatic analytical apparatus |
Families Citing this family (28)
| Publication number | Priority date | Publication date | Assignee | Title |
|---|---|---|---|---|
| JP5953089B2 (en) * | 2012-03-30 | 2016-07-13 | 株式会社Lsiメディエンス | Method for detecting measurement data abnormality and measurement data abnormality detection device |
| JP5953164B2 (en) * | 2012-07-30 | 2016-07-20 | 株式会社日立ハイテクノロジーズ | Data processing apparatus and automatic analyzer using the same |
| JP6073117B2 (en) * | 2012-11-26 | 2017-02-01 | 株式会社日立ハイテクノロジーズ | Automatic analyzer, automatic analysis method |
| US9513227B2 (en) | 2013-04-26 | 2016-12-06 | Panasonic Intellectual Property Management Co., Ltd. | Method for quantitative determination of oxidant and apparatus for quantitative determination of oxidant |
| JP6174411B2 (en) * | 2013-07-29 | 2017-08-02 | 株式会社堀場製作所 | Water quality analyzer and water quality analysis method |
| WO2016130962A1 (en) | 2015-02-13 | 2016-08-18 | Abbott Laboratories | Automated storage modules for diagnostic analyzer liquids and related systems and methods |
| KR20170014689A (en) * | 2015-07-31 | 2017-02-08 | 가톨릭대학교 산학협력단 | Apparatus for automatic quality control of blood cell analyzer |
| EP3432314B1 (en) | 2017-07-17 | 2025-09-24 | F. Hoffmann-La Roche AG | Techniques for determining coagulation results |
| JP7109965B2 (en) * | 2018-04-04 | 2022-08-01 | キヤノンメディカルシステムズ株式会社 | automatic analyzer |
| JP7299914B2 (en) | 2018-10-17 | 2023-06-28 | 株式会社日立ハイテク | Abnormality determination method and automatic analyzer |
| CN113039438B (en) * | 2018-12-06 | 2024-05-31 | 株式会社日立高新技术 | Automatic analysis device |
| JP7294849B2 (en) * | 2019-03-27 | 2023-06-20 | キヤノンメディカルシステムズ株式会社 | automatic analyzer |
| CN110082345A (en) * | 2019-04-18 | 2019-08-02 | 迈克医疗电子有限公司 | Absorbance change rate determines method and apparatus, analysis instrument and storage medium |
| US12163972B2 (en) | 2019-06-11 | 2024-12-10 | Hitachi High-Tech Corporation | Automated analysis device, and abnormality detecting method |
| CN110160980B (en) * | 2019-06-25 | 2021-12-28 | 迈克医疗电子有限公司 | Method and device for analyzing sample absorbance change rate and optical detection system |
| CN112147090B (en) * | 2019-06-28 | 2024-10-01 | 深圳迈瑞生物医疗电子股份有限公司 | A biochemical analyzer and a method for determining substrate exhaustion in a biochemical reaction |
| CN112147091A (en) * | 2019-06-28 | 2020-12-29 | 深圳迈瑞生物医疗电子股份有限公司 | A biochemical analyzer and method for judging the occurrence of substrate depletion in biochemical reactions |
| CN114174834B (en) * | 2019-08-06 | 2025-08-15 | 株式会社岛津制作所 | Biochemical analysis device and biochemical analysis method |
| JP7246498B2 (en) * | 2019-09-04 | 2023-03-27 | 株式会社日立ハイテク | COMBINED AUTOMATIC ANALYZER, SYSTEM, AND ABNORMALITY DETERMINATION METHOD |
| CN112578133B (en) * | 2019-09-27 | 2024-07-05 | 深圳迈瑞生物医疗电子股份有限公司 | A sample analysis system and a test management method for analysis equipment |
| WO2021108422A1 (en) * | 2019-11-27 | 2021-06-03 | Hach Company | Turbidimeter cleaning |
| US20230375581A1 (en) * | 2020-09-30 | 2023-11-23 | Hitachi High-Tech Corporation | Data processing device and automatic analyzer |
| CN115524324A (en) * | 2020-11-25 | 2022-12-27 | 深圳迈瑞生物医疗电子股份有限公司 | Sample analysis device and control method |
| JP7643971B2 (en) * | 2021-08-03 | 2025-03-11 | 株式会社日立ハイテク | Chemical Analysis Equipment |
| CN113845830A (en) * | 2021-10-13 | 2021-12-28 | 常州正邦数码科技有限公司 | Fingerprint-resistant coating of functional film for decorative film surface layer and preparation method thereof |
| EP4462127A4 (en) * | 2022-01-05 | 2026-01-07 | Hitachi High Tech Corp | DEVICE FOR CALCULATING A PREDICTION LINE AND METHOD FOR CALCULATING A PREDICTION LINE |
| JP2023170266A (en) * | 2022-05-18 | 2023-12-01 | キヤノンメディカルシステムズ株式会社 | Automatic analyzer, dispensing method and program for automatic analyzer |
| EP4400829A1 (en) * | 2023-01-16 | 2024-07-17 | Shenzhen Mindray Bio-Medical Electronics Co., Ltd. | Sample analyzer and method for controlling sample analyzer |
Family Cites Families (8)
| Publication number | Priority date | Publication date | Assignee | Title |
|---|---|---|---|---|
| JPS57147039A (en) * | 1981-03-09 | 1982-09-10 | Hitachi Ltd | Data discriminating device for photometer |
| JP4276894B2 (en) * | 2003-05-21 | 2009-06-10 | 株式会社日立ハイテクノロジーズ | Anomaly detection system and anomaly detection method |
| JP4367126B2 (en) * | 2003-12-19 | 2009-11-18 | 和光純薬工業株式会社 | Measuring method |
| JP2006337125A (en) | 2005-06-01 | 2006-12-14 | Hitachi High-Technologies Corp | Automatic analyzer, analysis method using automatic analyzer |
| JP4538423B2 (en) * | 2006-03-14 | 2010-09-08 | 株式会社日立ハイテクノロジーズ | Automatic analyzer |
| JP4654256B2 (en) | 2008-02-28 | 2011-03-16 | 株式会社日立ハイテクノロジーズ | Automatic analyzer |
| JP5520519B2 (en) * | 2009-05-20 | 2014-06-11 | 株式会社日立ハイテクノロジーズ | Automatic analyzer and analysis method |
| JP6073117B2 (en) * | 2012-11-26 | 2017-02-01 | 株式会社日立ハイテクノロジーズ | Automatic analyzer, automatic analysis method |
-
2011
- 2011-07-04 JP JP2012524517A patent/JP5562421B2/en active Active
- 2011-07-04 WO PCT/JP2011/065277 patent/WO2012008324A1/en not_active Ceased
- 2011-07-04 EP EP11806654.7A patent/EP2594944B1/en active Active
- 2011-07-04 US US13/808,743 patent/US10352864B2/en active Active
- 2011-07-04 CN CN201180034242.7A patent/CN102985829B/en active Active
Non-Patent Citations (1)
| Title |
|---|
| See references of WO2012008324A1 * |
Cited By (1)
| Publication number | Priority date | Publication date | Assignee | Title |
|---|---|---|---|---|
| EP3128330A4 (en) * | 2014-04-01 | 2017-11-22 | Hitachi High-Technologies Corporation | Automatic analytical apparatus |
Also Published As
| Publication number | Publication date |
|---|---|
| WO2012008324A1 (en) | 2012-01-19 |
| JPWO2012008324A1 (en) | 2013-09-09 |
| EP2594944A4 (en) | 2017-10-18 |
| EP2594944B1 (en) | 2020-06-03 |
| JP5562421B2 (en) | 2014-07-30 |
| CN102985829B (en) | 2015-11-25 |
| US20130122596A1 (en) | 2013-05-16 |
| CN102985829A (en) | 2013-03-20 |
| US10352864B2 (en) | 2019-07-16 |
Similar Documents
| Publication | Publication Date | Title |
|---|---|---|
| EP2594944B1 (en) | Automatic analysis device, analysis method and information processing device | |
| EP2434292B1 (en) | Automatic analysis device and analysis method | |
| JP4654256B2 (en) | Automatic analyzer | |
| JP5193940B2 (en) | Automatic analyzer | |
| CN102422162B (en) | Automatic analysis device and analysis method | |
| US10203277B2 (en) | Automatic analysis device and automatic analysis method | |
| CN112955749B (en) | Abnormality determination method and automatic analysis device | |
| CN118647874A (en) | Data analysis method, data analysis system and computer | |
| JP7448521B2 (en) | Data analysis methods, data analysis systems, and calculators | |
| WO2023171013A1 (en) | Automatic analysis device and automatic analysis method | |
| JP2006292698A (en) | Accuracy control method of automatic analyzer for clinical examination, and automatic analyzer | |
| JP7357557B2 (en) | Automatic analyzer and reaction abnormality determination method | |
| EP4685491A1 (en) | Automated analysis device and sample analysis method |
Legal Events
| Date | Code | Title | Description |
|---|---|---|---|
| PUAI | Public reference made under article 153(3) epc to a published international application that has entered the european phase |
Free format text: ORIGINAL CODE: 0009012 |
|
| 17P | Request for examination filed |
Effective date: 20130213 |
|
| AK | Designated contracting states |
Kind code of ref document: A1 Designated state(s): AL AT BE BG CH CY CZ DE DK EE ES FI FR GB GR HR HU IE IS IT LI LT LU LV MC MK MT NL NO PL PT RO RS SE SI SK SM TR |
|
| DAX | Request for extension of the european patent (deleted) | ||
| RA4 | Supplementary search report drawn up and despatched (corrected) |
Effective date: 20170915 |
|
| RIC1 | Information provided on ipc code assigned before grant |
Ipc: G01N 35/00 20060101AFI20170911BHEP |
|
| GRAP | Despatch of communication of intention to grant a patent |
Free format text: ORIGINAL CODE: EPIDOSNIGR1 |
|
| STAA | Information on the status of an ep patent application or granted ep patent |
Free format text: STATUS: GRANT OF PATENT IS INTENDED |
|
| INTG | Intention to grant announced |
Effective date: 20191107 |
|
| GRAS | Grant fee paid |
Free format text: ORIGINAL CODE: EPIDOSNIGR3 |
|
| GRAJ | Information related to disapproval of communication of intention to grant by the applicant or resumption of examination proceedings by the epo deleted |
Free format text: ORIGINAL CODE: EPIDOSDIGR1 |
|
| GRAL | Information related to payment of fee for publishing/printing deleted |
Free format text: ORIGINAL CODE: EPIDOSDIGR3 |
|
| STAA | Information on the status of an ep patent application or granted ep patent |
Free format text: STATUS: REQUEST FOR EXAMINATION WAS MADE |
|
| INTC | Intention to grant announced (deleted) | ||
| GRAP | Despatch of communication of intention to grant a patent |
Free format text: ORIGINAL CODE: EPIDOSNIGR1 |
|
| STAA | Information on the status of an ep patent application or granted ep patent |
Free format text: STATUS: GRANT OF PATENT IS INTENDED |
|
| GRAS | Grant fee paid |
Free format text: ORIGINAL CODE: EPIDOSNIGR3 |
|
| GRAA | (expected) grant |
Free format text: ORIGINAL CODE: 0009210 |
|
| STAA | Information on the status of an ep patent application or granted ep patent |
Free format text: STATUS: THE PATENT HAS BEEN GRANTED |
|
| INTG | Intention to grant announced |
Effective date: 20200420 |
|
| AK | Designated contracting states |
Kind code of ref document: B1 Designated state(s): AL AT BE BG CH CY CZ DE DK EE ES FI FR GB GR HR HU IE IS IT LI LT LU LV MC MK MT NL NO PL PT RO RS SE SI SK SM TR |
|
| REG | Reference to a national code |
Ref country code: GB Ref legal event code: FG4D |
|
| REG | Reference to a national code |
Ref country code: DE Ref legal event code: R081 Ref document number: 602011067172 Country of ref document: DE Owner name: HITACHI HIGH-TECH CORPORATION, JP Free format text: FORMER OWNER: HITACHI HIGH-TECHNOLOGIES CORPORATION, TOKYO, JP Ref country code: DE Ref legal event code: R082 Ref document number: 602011067172 Country of ref document: DE Representative=s name: STREHL SCHUEBEL-HOPF & PARTNER MBB PATENTANWAE, DE |
|
| REG | Reference to a national code |
Ref country code: CH Ref legal event code: EP Ref country code: AT Ref legal event code: REF Ref document number: 1277541 Country of ref document: AT Kind code of ref document: T Effective date: 20200615 |
|
| RAP2 | Party data changed (patent owner data changed or rights of a patent transferred) |
Owner name: HITACHI HIGH-TECH CORPORATION |
|
| REG | Reference to a national code |
Ref country code: DE Ref legal event code: R096 Ref document number: 602011067172 Country of ref document: DE |
|
| REG | Reference to a national code |
Ref country code: LT Ref legal event code: MG4D |
|
| PG25 | Lapsed in a contracting state [announced via postgrant information from national office to epo] |
Ref country code: NO Free format text: LAPSE BECAUSE OF FAILURE TO SUBMIT A TRANSLATION OF THE DESCRIPTION OR TO PAY THE FEE WITHIN THE PRESCRIBED TIME-LIMIT Effective date: 20200903 Ref country code: FI Free format text: LAPSE BECAUSE OF FAILURE TO SUBMIT A TRANSLATION OF THE DESCRIPTION OR TO PAY THE FEE WITHIN THE PRESCRIBED TIME-LIMIT Effective date: 20200603 Ref country code: LT Free format text: LAPSE BECAUSE OF FAILURE TO SUBMIT A TRANSLATION OF THE DESCRIPTION OR TO PAY THE FEE WITHIN THE PRESCRIBED TIME-LIMIT Effective date: 20200603 Ref country code: SE Free format text: LAPSE BECAUSE OF FAILURE TO SUBMIT A TRANSLATION OF THE DESCRIPTION OR TO PAY THE FEE WITHIN THE PRESCRIBED TIME-LIMIT Effective date: 20200603 Ref country code: GR Free format text: LAPSE BECAUSE OF FAILURE TO SUBMIT A TRANSLATION OF THE DESCRIPTION OR TO PAY THE FEE WITHIN THE PRESCRIBED TIME-LIMIT Effective date: 20200904 |
|
| REG | Reference to a national code |
Ref country code: NL Ref legal event code: MP Effective date: 20200603 |
|
| PG25 | Lapsed in a contracting state [announced via postgrant information from national office to epo] |
Ref country code: RS Free format text: LAPSE BECAUSE OF FAILURE TO SUBMIT A TRANSLATION OF THE DESCRIPTION OR TO PAY THE FEE WITHIN THE PRESCRIBED TIME-LIMIT Effective date: 20200603 Ref country code: LV Free format text: LAPSE BECAUSE OF FAILURE TO SUBMIT A TRANSLATION OF THE DESCRIPTION OR TO PAY THE FEE WITHIN THE PRESCRIBED TIME-LIMIT Effective date: 20200603 Ref country code: HR Free format text: LAPSE BECAUSE OF FAILURE TO SUBMIT A TRANSLATION OF THE DESCRIPTION OR TO PAY THE FEE WITHIN THE PRESCRIBED TIME-LIMIT Effective date: 20200603 Ref country code: BG Free format text: LAPSE BECAUSE OF FAILURE TO SUBMIT A TRANSLATION OF THE DESCRIPTION OR TO PAY THE FEE WITHIN THE PRESCRIBED TIME-LIMIT Effective date: 20200903 |
|
| REG | Reference to a national code |
Ref country code: AT Ref legal event code: MK05 Ref document number: 1277541 Country of ref document: AT Kind code of ref document: T Effective date: 20200603 |
|
| PG25 | Lapsed in a contracting state [announced via postgrant information from national office to epo] |
Ref country code: AL Free format text: LAPSE BECAUSE OF FAILURE TO SUBMIT A TRANSLATION OF THE DESCRIPTION OR TO PAY THE FEE WITHIN THE PRESCRIBED TIME-LIMIT Effective date: 20200603 Ref country code: NL Free format text: LAPSE BECAUSE OF FAILURE TO SUBMIT A TRANSLATION OF THE DESCRIPTION OR TO PAY THE FEE WITHIN THE PRESCRIBED TIME-LIMIT Effective date: 20200603 |
|
| PG25 | Lapsed in a contracting state [announced via postgrant information from national office to epo] |
Ref country code: CZ Free format text: LAPSE BECAUSE OF FAILURE TO SUBMIT A TRANSLATION OF THE DESCRIPTION OR TO PAY THE FEE WITHIN THE PRESCRIBED TIME-LIMIT Effective date: 20200603 Ref country code: ES Free format text: LAPSE BECAUSE OF FAILURE TO SUBMIT A TRANSLATION OF THE DESCRIPTION OR TO PAY THE FEE WITHIN THE PRESCRIBED TIME-LIMIT Effective date: 20200603 Ref country code: PT Free format text: LAPSE BECAUSE OF FAILURE TO SUBMIT A TRANSLATION OF THE DESCRIPTION OR TO PAY THE FEE WITHIN THE PRESCRIBED TIME-LIMIT Effective date: 20201006 Ref country code: SM Free format text: LAPSE BECAUSE OF FAILURE TO SUBMIT A TRANSLATION OF THE DESCRIPTION OR TO PAY THE FEE WITHIN THE PRESCRIBED TIME-LIMIT Effective date: 20200603 Ref country code: EE Free format text: LAPSE BECAUSE OF FAILURE TO SUBMIT A TRANSLATION OF THE DESCRIPTION OR TO PAY THE FEE WITHIN THE PRESCRIBED TIME-LIMIT Effective date: 20200603 Ref country code: IT Free format text: LAPSE BECAUSE OF FAILURE TO SUBMIT A TRANSLATION OF THE DESCRIPTION OR TO PAY THE FEE WITHIN THE PRESCRIBED TIME-LIMIT Effective date: 20200603 Ref country code: RO Free format text: LAPSE BECAUSE OF FAILURE TO SUBMIT A TRANSLATION OF THE DESCRIPTION OR TO PAY THE FEE WITHIN THE PRESCRIBED TIME-LIMIT Effective date: 20200603 Ref country code: AT Free format text: LAPSE BECAUSE OF FAILURE TO SUBMIT A TRANSLATION OF THE DESCRIPTION OR TO PAY THE FEE WITHIN THE PRESCRIBED TIME-LIMIT Effective date: 20200603 |
|
| PG25 | Lapsed in a contracting state [announced via postgrant information from national office to epo] |
Ref country code: PL Free format text: LAPSE BECAUSE OF FAILURE TO SUBMIT A TRANSLATION OF THE DESCRIPTION OR TO PAY THE FEE WITHIN THE PRESCRIBED TIME-LIMIT Effective date: 20200603 Ref country code: SK Free format text: LAPSE BECAUSE OF FAILURE TO SUBMIT A TRANSLATION OF THE DESCRIPTION OR TO PAY THE FEE WITHIN THE PRESCRIBED TIME-LIMIT Effective date: 20200603 Ref country code: IS Free format text: LAPSE BECAUSE OF FAILURE TO SUBMIT A TRANSLATION OF THE DESCRIPTION OR TO PAY THE FEE WITHIN THE PRESCRIBED TIME-LIMIT Effective date: 20201003 |
|
| REG | Reference to a national code |
Ref country code: CH Ref legal event code: PL |
|
| REG | Reference to a national code |
Ref country code: DE Ref legal event code: R097 Ref document number: 602011067172 Country of ref document: DE |
|
| PG25 | Lapsed in a contracting state [announced via postgrant information from national office to epo] |
Ref country code: MC Free format text: LAPSE BECAUSE OF FAILURE TO SUBMIT A TRANSLATION OF THE DESCRIPTION OR TO PAY THE FEE WITHIN THE PRESCRIBED TIME-LIMIT Effective date: 20200603 |
|
| PLBE | No opposition filed within time limit |
Free format text: ORIGINAL CODE: 0009261 |
|
| STAA | Information on the status of an ep patent application or granted ep patent |
Free format text: STATUS: NO OPPOSITION FILED WITHIN TIME LIMIT |
|
| REG | Reference to a national code |
Ref country code: BE Ref legal event code: MM Effective date: 20200731 |
|
| PG25 | Lapsed in a contracting state [announced via postgrant information from national office to epo] |
Ref country code: LU Free format text: LAPSE BECAUSE OF NON-PAYMENT OF DUE FEES Effective date: 20200704 Ref country code: IE Free format text: LAPSE BECAUSE OF NON-PAYMENT OF DUE FEES Effective date: 20200704 Ref country code: LI Free format text: LAPSE BECAUSE OF NON-PAYMENT OF DUE FEES Effective date: 20200731 Ref country code: DK Free format text: LAPSE BECAUSE OF FAILURE TO SUBMIT A TRANSLATION OF THE DESCRIPTION OR TO PAY THE FEE WITHIN THE PRESCRIBED TIME-LIMIT Effective date: 20200603 Ref country code: CH Free format text: LAPSE BECAUSE OF NON-PAYMENT OF DUE FEES Effective date: 20200731 |
|
| 26N | No opposition filed |
Effective date: 20210304 |
|
| GBPC | Gb: european patent ceased through non-payment of renewal fee |
Effective date: 20200903 |
|
| PG25 | Lapsed in a contracting state [announced via postgrant information from national office to epo] |
Ref country code: BE Free format text: LAPSE BECAUSE OF NON-PAYMENT OF DUE FEES Effective date: 20200731 Ref country code: SI Free format text: LAPSE BECAUSE OF FAILURE TO SUBMIT A TRANSLATION OF THE DESCRIPTION OR TO PAY THE FEE WITHIN THE PRESCRIBED TIME-LIMIT Effective date: 20200603 |
|
| PG25 | Lapsed in a contracting state [announced via postgrant information from national office to epo] |
Ref country code: GB Free format text: LAPSE BECAUSE OF NON-PAYMENT OF DUE FEES Effective date: 20200903 |
|
| PG25 | Lapsed in a contracting state [announced via postgrant information from national office to epo] |
Ref country code: TR Free format text: LAPSE BECAUSE OF FAILURE TO SUBMIT A TRANSLATION OF THE DESCRIPTION OR TO PAY THE FEE WITHIN THE PRESCRIBED TIME-LIMIT Effective date: 20200603 Ref country code: MT Free format text: LAPSE BECAUSE OF FAILURE TO SUBMIT A TRANSLATION OF THE DESCRIPTION OR TO PAY THE FEE WITHIN THE PRESCRIBED TIME-LIMIT Effective date: 20200603 Ref country code: CY Free format text: LAPSE BECAUSE OF FAILURE TO SUBMIT A TRANSLATION OF THE DESCRIPTION OR TO PAY THE FEE WITHIN THE PRESCRIBED TIME-LIMIT Effective date: 20200603 |
|
| PG25 | Lapsed in a contracting state [announced via postgrant information from national office to epo] |
Ref country code: MK Free format text: LAPSE BECAUSE OF FAILURE TO SUBMIT A TRANSLATION OF THE DESCRIPTION OR TO PAY THE FEE WITHIN THE PRESCRIBED TIME-LIMIT Effective date: 20200603 |
|
| PGFP | Annual fee paid to national office [announced via postgrant information from national office to epo] |
Ref country code: DE Payment date: 20250528 Year of fee payment: 15 |
|
| PGFP | Annual fee paid to national office [announced via postgrant information from national office to epo] |
Ref country code: FR Payment date: 20260619 Year of fee payment: 16 |