EP2563930B1 - Method for diagnosing risk of type 1 diabetes - Google Patents
Method for diagnosing risk of type 1 diabetes Download PDFInfo
- Publication number
- EP2563930B1 EP2563930B1 EP11774490.4A EP11774490A EP2563930B1 EP 2563930 B1 EP2563930 B1 EP 2563930B1 EP 11774490 A EP11774490 A EP 11774490A EP 2563930 B1 EP2563930 B1 EP 2563930B1
- Authority
- EP
- European Patent Office
- Prior art keywords
- diabetes
- mice
- risk
- clostridium
- type
- Prior art date
- Legal status (The legal status is an assumption and is not a legal conclusion. Google has not performed a legal analysis and makes no representation as to the accuracy of the status listed.)
- Not-in-force
Links
- 206010067584 Type 1 diabetes mellitus Diseases 0.000 title claims description 54
- 238000000034 method Methods 0.000 title claims description 22
- 241000186569 [Clostridium] leptum Species 0.000 claims description 20
- 238000004458 analytical method Methods 0.000 claims description 16
- 241000894006 Bacteria Species 0.000 claims description 15
- 230000003292 diminished effect Effects 0.000 claims description 14
- 238000003935 denaturing gradient gel electrophoresis Methods 0.000 claims description 11
- 239000000499 gel Substances 0.000 claims description 7
- 230000002068 genetic effect Effects 0.000 claims description 6
- 241001134569 Flavonifractor plautii Species 0.000 claims description 4
- 230000002550 fecal effect Effects 0.000 claims description 4
- 241000605980 Faecalibacterium prausnitzii Species 0.000 claims description 3
- 241001420307 Acetanaerobacterium elongatum Species 0.000 claims description 2
- 241001531272 Agathobaculum desmolans Species 0.000 claims description 2
- 241000511620 Anaerofilum pentosovorans Species 0.000 claims description 2
- 241000428313 Anaerotruncus colihominis Species 0.000 claims description 2
- 241001529428 Hydrogenoanaerobacterium saccharovorans Species 0.000 claims description 2
- 241001042460 Oscillibacter valericigenes Species 0.000 claims description 2
- 241001446611 Papillibacter cinnamivorans Species 0.000 claims description 2
- 241001528479 Pseudoflavonifractor capillosus Species 0.000 claims description 2
- 241000192029 Ruminococcus albus Species 0.000 claims description 2
- 241000123753 Ruminococcus bromii Species 0.000 claims description 2
- 241000123754 Ruminococcus callidus Species 0.000 claims description 2
- 241000192026 Ruminococcus flavefaciens Species 0.000 claims description 2
- 241000168532 Sporobacter termitidis Species 0.000 claims description 2
- 241001580973 Subdoligranulum variabile Species 0.000 claims description 2
- 241001147772 [Clostridium] cellulosi Species 0.000 claims description 2
- 241001656805 [Clostridium] methylpentosum Species 0.000 claims description 2
- 241000186586 [Clostridium] sporosphaeroides Species 0.000 claims description 2
- 241000215449 [Clostridium] viride Species 0.000 claims description 2
- 241001531189 [Eubacterium] siraeum Species 0.000 claims description 2
- OCQZXMCGTAWGEQ-UHFFFAOYSA-N prop-2-enamide;n-[(prop-2-enoylamino)methyl]prop-2-enamide Chemical compound NC(=O)C=C.C=CC(=O)NCNC(=O)C=C OCQZXMCGTAWGEQ-UHFFFAOYSA-N 0.000 claims description 2
- 241000699670 Mus sp. Species 0.000 description 98
- 206010012601 diabetes mellitus Diseases 0.000 description 47
- NOESYZHRGYRDHS-UHFFFAOYSA-N insulin Chemical compound N1C(=O)C(NC(=O)C(CCC(N)=O)NC(=O)C(CCC(O)=O)NC(=O)C(C(C)C)NC(=O)C(NC(=O)CN)C(C)CC)CSSCC(C(NC(CO)C(=O)NC(CC(C)C)C(=O)NC(CC=2C=CC(O)=CC=2)C(=O)NC(CCC(N)=O)C(=O)NC(CC(C)C)C(=O)NC(CCC(O)=O)C(=O)NC(CC(N)=O)C(=O)NC(CC=2C=CC(O)=CC=2)C(=O)NC(CSSCC(NC(=O)C(C(C)C)NC(=O)C(CC(C)C)NC(=O)C(CC=2C=CC(O)=CC=2)NC(=O)C(CC(C)C)NC(=O)C(C)NC(=O)C(CCC(O)=O)NC(=O)C(C(C)C)NC(=O)C(CC(C)C)NC(=O)C(CC=2NC=NC=2)NC(=O)C(CO)NC(=O)CNC2=O)C(=O)NCC(=O)NC(CCC(O)=O)C(=O)NC(CCCNC(N)=N)C(=O)NCC(=O)NC(CC=3C=CC=CC=3)C(=O)NC(CC=3C=CC=CC=3)C(=O)NC(CC=3C=CC(O)=CC=3)C(=O)NC(C(C)O)C(=O)N3C(CCC3)C(=O)NC(CCCCN)C(=O)NC(C)C(O)=O)C(=O)NC(CC(N)=O)C(O)=O)=O)NC(=O)C(C(C)CC)NC(=O)C(CO)NC(=O)C(C(C)O)NC(=O)C1CSSCC2NC(=O)C(CC(C)C)NC(=O)C(NC(=O)C(CCC(N)=O)NC(=O)C(CC(N)=O)NC(=O)C(NC(=O)C(N)CC=1C=CC=CC=1)C(C)C)CC1=CN=CN1 NOESYZHRGYRDHS-UHFFFAOYSA-N 0.000 description 41
- 150000002632 lipids Chemical class 0.000 description 24
- 230000002503 metabolic effect Effects 0.000 description 24
- 230000037361 pathway Effects 0.000 description 23
- 229940125396 insulin Drugs 0.000 description 21
- 239000000523 sample Substances 0.000 description 21
- WQZGKKKJIJFFOK-GASJEMHNSA-N Glucose Natural products OC[C@H]1OC(O)[C@H](O)[C@@H](O)[C@@H]1O WQZGKKKJIJFFOK-GASJEMHNSA-N 0.000 description 20
- 102000004877 Insulin Human genes 0.000 description 20
- 108090001061 Insulin Proteins 0.000 description 20
- 239000008103 glucose Substances 0.000 description 20
- 108090000623 proteins and genes Proteins 0.000 description 20
- 239000002207 metabolite Substances 0.000 description 19
- 210000002966 serum Anatomy 0.000 description 19
- RYCNUMLMNKHWPZ-SNVBAGLBSA-N 1-acetyl-sn-glycero-3-phosphocholine Chemical compound CC(=O)OC[C@@H](O)COP([O-])(=O)OCC[N+](C)(C)C RYCNUMLMNKHWPZ-SNVBAGLBSA-N 0.000 description 18
- 201000010099 disease Diseases 0.000 description 18
- 208000037265 diseases, disorders, signs and symptoms Diseases 0.000 description 18
- 230000014509 gene expression Effects 0.000 description 18
- 241000699666 Mus <mouse, genus> Species 0.000 description 14
- 239000003550 marker Substances 0.000 description 9
- 238000002705 metabolomic analysis Methods 0.000 description 9
- 239000000203 mixture Substances 0.000 description 9
- 241000282414 Homo sapiens Species 0.000 description 8
- 238000004422 calculation algorithm Methods 0.000 description 8
- 230000000694 effects Effects 0.000 description 8
- 210000004185 liver Anatomy 0.000 description 8
- 241000894007 species Species 0.000 description 8
- PSXUKPCAIKETHF-UHFFFAOYSA-N 2-[4-[3-[4-(4,5-dihydro-1h-imidazol-2-yl)phenoxy]propoxy]phenyl]-4,5-dihydro-1h-imidazole Chemical compound C=1C=C(C=2NCCN=2)C=CC=1OCCCOC(C=C1)=CC=C1C1=NCCN1 PSXUKPCAIKETHF-UHFFFAOYSA-N 0.000 description 7
- 102100029579 Diphosphoinositol polyphosphate phosphohydrolase 1 Human genes 0.000 description 7
- 206010022489 Insulin Resistance Diseases 0.000 description 7
- 238000013459 approach Methods 0.000 description 7
- 210000004369 blood Anatomy 0.000 description 7
- 239000008280 blood Substances 0.000 description 7
- 230000037396 body weight Effects 0.000 description 7
- 101710153356 mRNA-decapping protein g5R Proteins 0.000 description 7
- 208000001072 type 2 diabetes mellitus Diseases 0.000 description 7
- 102000058061 Glucose Transporter Type 4 Human genes 0.000 description 6
- 102000016267 Leptin Human genes 0.000 description 6
- 108010092277 Leptin Proteins 0.000 description 6
- OKKJLVBELUTLKV-UHFFFAOYSA-N Methanol Chemical compound OC OKKJLVBELUTLKV-UHFFFAOYSA-N 0.000 description 6
- 108091006300 SLC2A4 Proteins 0.000 description 6
- 210000000593 adipose tissue white Anatomy 0.000 description 6
- 210000000227 basophil cell of anterior lobe of hypophysis Anatomy 0.000 description 6
- 244000005709 gut microbiome Species 0.000 description 6
- 238000007912 intraperitoneal administration Methods 0.000 description 6
- NRYBAZVQPHGZNS-ZSOCWYAHSA-N leptin Chemical compound O=C([C@H](CO)NC(=O)[C@H](CC(C)C)NC(=O)[C@H](CC(O)=O)NC(=O)[C@H](CC(C)C)NC(=O)[C@H](CCC(N)=O)NC(=O)[C@H](CC=1C2=CC=CC=C2NC=1)NC(=O)[C@H](CC(C)C)NC(=O)[C@@H](NC(=O)[C@H](CC(O)=O)NC(=O)[C@H](CCC(N)=O)NC(=O)[C@H](CC(C)C)NC(=O)[C@H](CO)NC(=O)CNC(=O)[C@H](CCC(N)=O)NC(=O)[C@@H](N)CC(C)C)CCSC)N1CCC[C@H]1C(=O)NCC(=O)N[C@@H](CS)C(O)=O NRYBAZVQPHGZNS-ZSOCWYAHSA-N 0.000 description 6
- 229940039781 leptin Drugs 0.000 description 6
- 230000000813 microbial effect Effects 0.000 description 6
- 230000008506 pathogenesis Effects 0.000 description 6
- 238000003068 pathway analysis Methods 0.000 description 6
- 239000000243 solution Substances 0.000 description 6
- 238000012360 testing method Methods 0.000 description 6
- 108091032973 (ribonucleotides)n+m Proteins 0.000 description 5
- 108010076365 Adiponectin Proteins 0.000 description 5
- 102000011690 Adiponectin Human genes 0.000 description 5
- 108091093088 Amplicon Proteins 0.000 description 5
- 241000252983 Caecum Species 0.000 description 5
- 108020004414 DNA Proteins 0.000 description 5
- 238000003556 assay Methods 0.000 description 5
- 230000001580 bacterial effect Effects 0.000 description 5
- 210000004534 cecum Anatomy 0.000 description 5
- 238000011161 development Methods 0.000 description 5
- 210000004153 islets of langerhan Anatomy 0.000 description 5
- 238000013507 mapping Methods 0.000 description 5
- 230000001431 metabolomic effect Effects 0.000 description 5
- 206010018429 Glucose tolerance impaired Diseases 0.000 description 4
- TWRXJAOTZQYOKJ-UHFFFAOYSA-L Magnesium chloride Chemical compound [Mg+2].[Cl-].[Cl-] TWRXJAOTZQYOKJ-UHFFFAOYSA-L 0.000 description 4
- 241001465754 Metazoa Species 0.000 description 4
- YZXBAPSDXZZRGB-DOFZRALJSA-N arachidonic acid Chemical compound CCCCC\C=C/C\C=C/C\C=C/C\C=C/CCCC(O)=O YZXBAPSDXZZRGB-DOFZRALJSA-N 0.000 description 4
- 230000005784 autoimmunity Effects 0.000 description 4
- 230000003247 decreasing effect Effects 0.000 description 4
- 230000001419 dependent effect Effects 0.000 description 4
- 238000002474 experimental method Methods 0.000 description 4
- 230000006870 function Effects 0.000 description 4
- 238000010199 gene set enrichment analysis Methods 0.000 description 4
- 230000002710 gonadal effect Effects 0.000 description 4
- 230000008595 infiltration Effects 0.000 description 4
- 238000001764 infiltration Methods 0.000 description 4
- 238000002493 microarray Methods 0.000 description 4
- 230000001019 normoglycemic effect Effects 0.000 description 4
- 150000003904 phospholipids Chemical class 0.000 description 4
- 210000002027 skeletal muscle Anatomy 0.000 description 4
- 210000003462 vein Anatomy 0.000 description 4
- WEVYAHXRMPXWCK-UHFFFAOYSA-N Acetonitrile Chemical compound CC#N WEVYAHXRMPXWCK-UHFFFAOYSA-N 0.000 description 3
- 241000186000 Bifidobacterium Species 0.000 description 3
- 241001112695 Clostridiales Species 0.000 description 3
- 238000000692 Student's t-test Methods 0.000 description 3
- 210000000577 adipose tissue Anatomy 0.000 description 3
- WQZGKKKJIJFFOK-VFUOTHLCSA-N beta-D-glucose Chemical compound OC[C@H]1O[C@@H](O)[C@H](O)[C@@H](O)[C@@H]1O WQZGKKKJIJFFOK-VFUOTHLCSA-N 0.000 description 3
- 150000005693 branched-chain amino acids Chemical class 0.000 description 3
- 230000000875 corresponding effect Effects 0.000 description 3
- 230000007613 environmental effect Effects 0.000 description 3
- 230000001610 euglycemic effect Effects 0.000 description 3
- 238000009396 hybridization Methods 0.000 description 3
- -1 lysoPC(16:0) Chemical class 0.000 description 3
- 238000004949 mass spectrometry Methods 0.000 description 3
- 108020004999 messenger RNA Proteins 0.000 description 3
- 238000012986 modification Methods 0.000 description 3
- 230000004048 modification Effects 0.000 description 3
- 210000000496 pancreas Anatomy 0.000 description 3
- 230000002265 prevention Effects 0.000 description 3
- 230000000750 progressive effect Effects 0.000 description 3
- 238000003753 real-time PCR Methods 0.000 description 3
- 230000001105 regulatory effect Effects 0.000 description 3
- 238000001269 time-of-flight mass spectrometry Methods 0.000 description 3
- 210000001519 tissue Anatomy 0.000 description 3
- 150000003626 triacylglycerols Chemical class 0.000 description 3
- 238000004704 ultra performance liquid chromatography Methods 0.000 description 3
- XLYOFNOQVPJJNP-UHFFFAOYSA-N water Substances O XLYOFNOQVPJJNP-UHFFFAOYSA-N 0.000 description 3
- BKAJNAXTPSGJCU-UHFFFAOYSA-N 4-methyl-2-oxopentanoic acid Chemical compound CC(C)CC(=O)C(O)=O BKAJNAXTPSGJCU-UHFFFAOYSA-N 0.000 description 2
- 102000007469 Actins Human genes 0.000 description 2
- 108010085238 Actins Proteins 0.000 description 2
- 102000014777 Adipokines Human genes 0.000 description 2
- 108010078606 Adipokines Proteins 0.000 description 2
- 206010002091 Anaesthesia Diseases 0.000 description 2
- 208000023275 Autoimmune disease Diseases 0.000 description 2
- 241000606125 Bacteroides Species 0.000 description 2
- 241000186560 Blautia coccoides Species 0.000 description 2
- 108010055166 Chemokine CCL5 Proteins 0.000 description 2
- 102000001327 Chemokine CCL5 Human genes 0.000 description 2
- HEDRZPFGACZZDS-UHFFFAOYSA-N Chloroform Chemical compound ClC(Cl)Cl HEDRZPFGACZZDS-UHFFFAOYSA-N 0.000 description 2
- 238000008157 ELISA kit Methods 0.000 description 2
- 229920001917 Ficoll Polymers 0.000 description 2
- ZHNUHDYFZUAESO-UHFFFAOYSA-N Formamide Chemical compound NC=O ZHNUHDYFZUAESO-UHFFFAOYSA-N 0.000 description 2
- BDAGIHXWWSANSR-UHFFFAOYSA-N Formic acid Chemical compound OC=O BDAGIHXWWSANSR-UHFFFAOYSA-N 0.000 description 2
- 102100036255 Glucose-6-phosphatase 2 Human genes 0.000 description 2
- WZUVPPKBWHMQCE-UHFFFAOYSA-N Haematoxylin Chemical compound C12=CC(O)=C(O)C=C2CC2(O)C1C1=CC=C(O)C(O)=C1OC2 WZUVPPKBWHMQCE-UHFFFAOYSA-N 0.000 description 2
- 241000282412 Homo Species 0.000 description 2
- 101000930907 Homo sapiens Glucose-6-phosphatase 2 Proteins 0.000 description 2
- 102000004388 Interleukin-4 Human genes 0.000 description 2
- 108090000978 Interleukin-4 Proteins 0.000 description 2
- KFZMGEQAYNKOFK-UHFFFAOYSA-N Isopropanol Chemical compound CC(C)O KFZMGEQAYNKOFK-UHFFFAOYSA-N 0.000 description 2
- ROHFNLRQFUQHCH-YFKPBYRVSA-N L-leucine Chemical compound CC(C)C[C@H](N)C(O)=O ROHFNLRQFUQHCH-YFKPBYRVSA-N 0.000 description 2
- ROHFNLRQFUQHCH-UHFFFAOYSA-N Leucine Natural products CC(C)CC(N)C(O)=O ROHFNLRQFUQHCH-UHFFFAOYSA-N 0.000 description 2
- 241001529936 Murinae Species 0.000 description 2
- 208000008589 Obesity Diseases 0.000 description 2
- 238000002123 RNA extraction Methods 0.000 description 2
- 238000011530 RNeasy Mini Kit Methods 0.000 description 2
- FAPWRFPIFSIZLT-UHFFFAOYSA-M Sodium chloride Chemical compound [Na+].[Cl-] FAPWRFPIFSIZLT-UHFFFAOYSA-M 0.000 description 2
- XSQUKJJJFZCRTK-UHFFFAOYSA-N Urea Chemical compound NC(N)=O XSQUKJJJFZCRTK-UHFFFAOYSA-N 0.000 description 2
- 239000000478 adipokine Substances 0.000 description 2
- 235000001014 amino acid Nutrition 0.000 description 2
- 229940024606 amino acid Drugs 0.000 description 2
- 230000037354 amino acid metabolism Effects 0.000 description 2
- 150000001413 amino acids Chemical class 0.000 description 2
- 230000003321 amplification Effects 0.000 description 2
- 230000037005 anaesthesia Effects 0.000 description 2
- 238000010171 animal model Methods 0.000 description 2
- 230000006907 apoptotic process Effects 0.000 description 2
- 229940114079 arachidonic acid Drugs 0.000 description 2
- 235000021342 arachidonic acid Nutrition 0.000 description 2
- 230000001363 autoimmune Effects 0.000 description 2
- 230000027455 binding Effects 0.000 description 2
- 210000004027 cell Anatomy 0.000 description 2
- 230000008859 change Effects 0.000 description 2
- 238000006243 chemical reaction Methods 0.000 description 2
- 238000000546 chi-square test Methods 0.000 description 2
- 239000002299 complementary DNA Substances 0.000 description 2
- 239000002131 composite material Substances 0.000 description 2
- 238000007405 data analysis Methods 0.000 description 2
- 238000001514 detection method Methods 0.000 description 2
- 235000005911 diet Nutrition 0.000 description 2
- 230000037213 diet Effects 0.000 description 2
- 238000009826 distribution Methods 0.000 description 2
- 230000003828 downregulation Effects 0.000 description 2
- 230000008482 dysregulation Effects 0.000 description 2
- 235000019253 formic acid Nutrition 0.000 description 2
- 238000004817 gas chromatography Methods 0.000 description 2
- 238000003633 gene expression assay Methods 0.000 description 2
- 238000007446 glucose tolerance test Methods 0.000 description 2
- 235000013922 glutamic acid Nutrition 0.000 description 2
- 230000003284 homeostatic effect Effects 0.000 description 2
- 230000003914 insulin secretion Effects 0.000 description 2
- 230000002473 insulinotropic effect Effects 0.000 description 2
- 230000003993 interaction Effects 0.000 description 2
- 230000037356 lipid metabolism Effects 0.000 description 2
- 238000004895 liquid chromatography mass spectrometry Methods 0.000 description 2
- 229910001629 magnesium chloride Inorganic materials 0.000 description 2
- 238000004519 manufacturing process Methods 0.000 description 2
- 239000011159 matrix material Substances 0.000 description 2
- 238000005259 measurement Methods 0.000 description 2
- 238000012544 monitoring process Methods 0.000 description 2
- 238000010606 normalization Methods 0.000 description 2
- 238000003199 nucleic acid amplification method Methods 0.000 description 2
- 235000020824 obesity Nutrition 0.000 description 2
- 238000005457 optimization Methods 0.000 description 2
- 230000010627 oxidative phosphorylation Effects 0.000 description 2
- 239000008188 pellet Substances 0.000 description 2
- 239000000047 product Substances 0.000 description 2
- 230000004224 protection Effects 0.000 description 2
- 235000018102 proteins Nutrition 0.000 description 2
- 102000004169 proteins and genes Human genes 0.000 description 2
- 230000004044 response Effects 0.000 description 2
- 230000019491 signal transduction Effects 0.000 description 2
- 239000002904 solvent Substances 0.000 description 2
- 230000003595 spectral effect Effects 0.000 description 2
- 238000007619 statistical method Methods 0.000 description 2
- 230000009885 systemic effect Effects 0.000 description 2
- 230000004102 tricarboxylic acid cycle Effects 0.000 description 2
- 238000003260 vortexing Methods 0.000 description 2
- 238000005406 washing Methods 0.000 description 2
- 230000003442 weekly effect Effects 0.000 description 2
- JKMHFZQWWAIEOD-UHFFFAOYSA-N 2-[4-(2-hydroxyethyl)piperazin-1-yl]ethanesulfonic acid Chemical compound OCC[NH+]1CCN(CCS([O-])(=O)=O)CC1 JKMHFZQWWAIEOD-UHFFFAOYSA-N 0.000 description 1
- QKNYBSVHEMOAJP-UHFFFAOYSA-N 2-amino-2-(hydroxymethyl)propane-1,3-diol;hydron;chloride Chemical compound Cl.OCC(N)(CO)CO QKNYBSVHEMOAJP-UHFFFAOYSA-N 0.000 description 1
- 102100030840 AT-rich interactive domain-containing protein 4B Human genes 0.000 description 1
- 241001502050 Acis Species 0.000 description 1
- IJGRMHOSHXDMSA-UHFFFAOYSA-N Atomic nitrogen Chemical compound N#N IJGRMHOSHXDMSA-UHFFFAOYSA-N 0.000 description 1
- 238000011740 C57BL/6 mouse Methods 0.000 description 1
- 206010057250 Cell-mediated cytotoxicity Diseases 0.000 description 1
- 208000017667 Chronic Disease Diseases 0.000 description 1
- 241001552059 Cleptes Species 0.000 description 1
- 102000029816 Collagenase Human genes 0.000 description 1
- 108060005980 Collagenase Proteins 0.000 description 1
- 208000011231 Crohn disease Diseases 0.000 description 1
- 102100039498 Cytotoxic T-lymphocyte protein 4 Human genes 0.000 description 1
- 102000007260 Deoxyribonuclease I Human genes 0.000 description 1
- 108010008532 Deoxyribonuclease I Proteins 0.000 description 1
- 206010061818 Disease progression Diseases 0.000 description 1
- KCXVZYZYPLLWCC-UHFFFAOYSA-N EDTA Chemical compound OC(=O)CN(CC(O)=O)CCN(CC(O)=O)CC(O)=O KCXVZYZYPLLWCC-UHFFFAOYSA-N 0.000 description 1
- 108700039887 Essential Genes Proteins 0.000 description 1
- 241000192125 Firmicutes Species 0.000 description 1
- WHUUTDBJXJRKMK-UHFFFAOYSA-N Glutamic acid Natural products OC(=O)C(N)CCC(O)=O WHUUTDBJXJRKMK-UHFFFAOYSA-N 0.000 description 1
- 239000007995 HEPES buffer Substances 0.000 description 1
- 239000012981 Hank's balanced salt solution Substances 0.000 description 1
- 206010019708 Hepatic steatosis Diseases 0.000 description 1
- 101000792935 Homo sapiens AT-rich interactive domain-containing protein 4B Proteins 0.000 description 1
- 101000889276 Homo sapiens Cytotoxic T-lymphocyte protein 4 Proteins 0.000 description 1
- 101000976075 Homo sapiens Insulin Proteins 0.000 description 1
- 101100455054 Homo sapiens LTA4H gene Proteins 0.000 description 1
- 229940122199 Insulin secretagogue Drugs 0.000 description 1
- 108090001005 Interleukin-6 Proteins 0.000 description 1
- 102000000704 Interleukin-7 Human genes 0.000 description 1
- 108010002586 Interleukin-7 Proteins 0.000 description 1
- AGPKZVBTJJNPAG-WHFBIAKZSA-N L-isoleucine Chemical compound CC[C@H](C)[C@H](N)C(O)=O AGPKZVBTJJNPAG-WHFBIAKZSA-N 0.000 description 1
- KZSNJWFQEVHDMF-BYPYZUCNSA-N L-valine Chemical compound CC(C)[C@H](N)C(O)=O KZSNJWFQEVHDMF-BYPYZUCNSA-N 0.000 description 1
- 241000186660 Lactobacillus Species 0.000 description 1
- 102100022118 Leukotriene A-4 hydrolase Human genes 0.000 description 1
- 238000000585 Mann–Whitney U test Methods 0.000 description 1
- 241000736262 Microbiota Species 0.000 description 1
- 101000775476 Mus musculus Adiponectin Proteins 0.000 description 1
- MSPCIZMDDUQPGJ-UHFFFAOYSA-N N-methyl-N-(trimethylsilyl)trifluoroacetamide Chemical compound C[Si](C)(C)N(C)C(=O)C(F)(F)F MSPCIZMDDUQPGJ-UHFFFAOYSA-N 0.000 description 1
- IPCSVZSSVZVIGE-FIBGUPNXSA-N Palmitic acid(d3) Chemical compound [2H]C([2H])([2H])CCCCCCCCCCCCCCC(O)=O IPCSVZSSVZVIGE-FIBGUPNXSA-N 0.000 description 1
- 241001596784 Pegasus Species 0.000 description 1
- 229920001213 Polysorbate 20 Polymers 0.000 description 1
- 208000037048 Prodromal Symptoms Diseases 0.000 description 1
- 238000011529 RT qPCR Methods 0.000 description 1
- 208000006265 Renal cell carcinoma Diseases 0.000 description 1
- 238000012952 Resampling Methods 0.000 description 1
- 102000002278 Ribosomal Proteins Human genes 0.000 description 1
- 108010000605 Ribosomal Proteins Proteins 0.000 description 1
- 241000283984 Rodentia Species 0.000 description 1
- CGNLCCVKSWNSDG-UHFFFAOYSA-N SYBR Green I Chemical compound CN(C)CCCN(CCC)C1=CC(C=C2N(C3=CC=CC=C3S2)C)=C2C=CC=CC2=[N+]1C1=CC=CC=C1 CGNLCCVKSWNSDG-UHFFFAOYSA-N 0.000 description 1
- 101100075025 Scheffersomyces stipitis (strain ATCC 58785 / CBS 6054 / NBRC 10063 / NRRL Y-11545) LTA4 gene Proteins 0.000 description 1
- 229920002684 Sepharose Polymers 0.000 description 1
- 210000001744 T-lymphocyte Anatomy 0.000 description 1
- 239000008049 TAE buffer Substances 0.000 description 1
- 108010006785 Taq Polymerase Proteins 0.000 description 1
- 102000002689 Toll-like receptor Human genes 0.000 description 1
- 108020000411 Toll-like receptor Proteins 0.000 description 1
- 101710120037 Toxin CcdB Proteins 0.000 description 1
- 239000007983 Tris buffer Substances 0.000 description 1
- KZSNJWFQEVHDMF-UHFFFAOYSA-N Valine Natural products CC(C)C(N)C(O)=O KZSNJWFQEVHDMF-UHFFFAOYSA-N 0.000 description 1
- 241001531188 [Eubacterium] rectale Species 0.000 description 1
- HGEVZDLYZYVYHD-UHFFFAOYSA-N acetic acid;2-amino-2-(hydroxymethyl)propane-1,3-diol;2-[2-[bis(carboxymethyl)amino]ethyl-(carboxymethyl)amino]acetic acid Chemical compound CC(O)=O.OCC(N)(CO)CO.OC(=O)CN(CC(O)=O)CCN(CC(O)=O)CC(O)=O HGEVZDLYZYVYHD-UHFFFAOYSA-N 0.000 description 1
- 239000002253 acid Substances 0.000 description 1
- 150000007513 acids Chemical class 0.000 description 1
- 150000001335 aliphatic alkanes Chemical class 0.000 description 1
- JAZBEHYOTPTENJ-JLNKQSITSA-N all-cis-5,8,11,14,17-icosapentaenoic acid Chemical compound CC\C=C/C\C=C/C\C=C/C\C=C/C\C=C/CCCC(O)=O JAZBEHYOTPTENJ-JLNKQSITSA-N 0.000 description 1
- MBMBGCFOFBJSGT-KUBAVDMBSA-N all-cis-docosa-4,7,10,13,16,19-hexaenoic acid Chemical compound CC\C=C/C\C=C/C\C=C/C\C=C/C\C=C/C\C=C/CCC(O)=O MBMBGCFOFBJSGT-KUBAVDMBSA-N 0.000 description 1
- 238000012197 amplification kit Methods 0.000 description 1
- 238000000540 analysis of variance Methods 0.000 description 1
- 238000000137 annealing Methods 0.000 description 1
- 230000003110 anti-inflammatory effect Effects 0.000 description 1
- 239000003963 antioxidant agent Substances 0.000 description 1
- 230000003078 antioxidant effect Effects 0.000 description 1
- 230000005775 apoptotic pathway Effects 0.000 description 1
- 235000003704 aspartic acid Nutrition 0.000 description 1
- 150000001510 aspartic acids Chemical class 0.000 description 1
- 230000003190 augmentative effect Effects 0.000 description 1
- 244000052616 bacterial pathogen Species 0.000 description 1
- 239000011324 bead Substances 0.000 description 1
- 230000008901 benefit Effects 0.000 description 1
- 239000000090 biomarker Substances 0.000 description 1
- 230000015572 biosynthetic process Effects 0.000 description 1
- 238000010241 blood sampling Methods 0.000 description 1
- 239000000872 buffer Substances 0.000 description 1
- 238000010804 cDNA synthesis Methods 0.000 description 1
- 238000004364 calculation method Methods 0.000 description 1
- 239000004202 carbamide Substances 0.000 description 1
- 238000012754 cardiac puncture Methods 0.000 description 1
- 239000012159 carrier gas Substances 0.000 description 1
- 230000015556 catabolic process Effects 0.000 description 1
- 238000005119 centrifugation Methods 0.000 description 1
- 238000012512 characterization method Methods 0.000 description 1
- 239000003153 chemical reaction reagent Substances 0.000 description 1
- 239000003795 chemical substances by application Substances 0.000 description 1
- OEYIOHPDSNJKLS-UHFFFAOYSA-N choline Chemical compound C[N+](C)(C)CCO OEYIOHPDSNJKLS-UHFFFAOYSA-N 0.000 description 1
- 229960001231 choline Drugs 0.000 description 1
- 230000001427 coherent effect Effects 0.000 description 1
- 229960002424 collagenase Drugs 0.000 description 1
- 238000010835 comparative analysis Methods 0.000 description 1
- 230000000052 comparative effect Effects 0.000 description 1
- 150000001875 compounds Chemical class 0.000 description 1
- 238000002247 constant time method Methods 0.000 description 1
- 239000000470 constituent Substances 0.000 description 1
- 230000002596 correlated effect Effects 0.000 description 1
- 238000010219 correlation analysis Methods 0.000 description 1
- 230000001186 cumulative effect Effects 0.000 description 1
- 230000001351 cycling effect Effects 0.000 description 1
- 230000006378 damage Effects 0.000 description 1
- 238000013480 data collection Methods 0.000 description 1
- 238000013079 data visualisation Methods 0.000 description 1
- 238000006731 degradation reaction Methods 0.000 description 1
- 238000003745 diagnosis Methods 0.000 description 1
- 235000021196 dietary intervention Nutrition 0.000 description 1
- 229910001873 dinitrogen Inorganic materials 0.000 description 1
- XEYBRNLFEZDVAW-ARSRFYASSA-N dinoprostone Chemical compound CCCCC[C@H](O)\C=C\[C@H]1[C@H](O)CC(=O)[C@@H]1C\C=C/CCCC(O)=O XEYBRNLFEZDVAW-ARSRFYASSA-N 0.000 description 1
- 229960002986 dinoprostone Drugs 0.000 description 1
- 230000005750 disease progression Effects 0.000 description 1
- 229960005135 eicosapentaenoic acid Drugs 0.000 description 1
- JAZBEHYOTPTENJ-UHFFFAOYSA-N eicosapentaenoic acid Natural products CCC=CCC=CCC=CCC=CCC=CCCCC(O)=O JAZBEHYOTPTENJ-UHFFFAOYSA-N 0.000 description 1
- 235000020673 eicosapentaenoic acid Nutrition 0.000 description 1
- 238000001962 electrophoresis Methods 0.000 description 1
- 230000037149 energy metabolism Effects 0.000 description 1
- 238000005516 engineering process Methods 0.000 description 1
- YQGOJNYOYNNSMM-UHFFFAOYSA-N eosin Chemical compound [Na+].OC(=O)C1=CC=CC=C1C1=C2C=C(Br)C(=O)C(Br)=C2OC2=C(Br)C(O)=C(Br)C=C21 YQGOJNYOYNNSMM-UHFFFAOYSA-N 0.000 description 1
- 239000000284 extract Substances 0.000 description 1
- 210000003608 fece Anatomy 0.000 description 1
- 210000004700 fetal blood Anatomy 0.000 description 1
- 238000007710 freezing Methods 0.000 description 1
- 238000001457 gas chromatography time-of-flight mass spectrometry Methods 0.000 description 1
- 210000001035 gastrointestinal tract Anatomy 0.000 description 1
- 230000004110 gluconeogenesis Effects 0.000 description 1
- 229960001031 glucose Drugs 0.000 description 1
- 239000004220 glutamic acid Substances 0.000 description 1
- 150000002307 glutamic acids Chemical class 0.000 description 1
- 230000034659 glycolysis Effects 0.000 description 1
- 239000001307 helium Substances 0.000 description 1
- 229910052734 helium Inorganic materials 0.000 description 1
- SWQJXJOGLNCZEY-UHFFFAOYSA-N helium atom Chemical compound [He] SWQJXJOGLNCZEY-UHFFFAOYSA-N 0.000 description 1
- 238000003065 hierarchial clustering Methods 0.000 description 1
- 238000000265 homogenisation Methods 0.000 description 1
- 229940088597 hormone Drugs 0.000 description 1
- 239000005556 hormone Substances 0.000 description 1
- 230000001900 immune effect Effects 0.000 description 1
- 230000007188 immune regulating pathway Effects 0.000 description 1
- 210000000987 immune system Anatomy 0.000 description 1
- 230000001771 impaired effect Effects 0.000 description 1
- 210000005007 innate immune system Anatomy 0.000 description 1
- PBGKTOXHQIOBKM-FHFVDXKLSA-N insulin (human) Chemical compound C([C@@H](C(=O)N[C@@H](CC(C)C)C(=O)N[C@H]1CSSC[C@H]2C(=O)N[C@H](C(=O)N[C@@H](CO)C(=O)N[C@H](C(=O)N[C@H](C(N[C@@H](CO)C(=O)N[C@@H](CC(C)C)C(=O)N[C@@H](CC=3C=CC(O)=CC=3)C(=O)N[C@@H](CCC(N)=O)C(=O)N[C@@H](CC(C)C)C(=O)N[C@@H](CCC(O)=O)C(=O)N[C@@H](CC(N)=O)C(=O)N[C@@H](CC=3C=CC(O)=CC=3)C(=O)N[C@@H](CSSC[C@H](NC(=O)[C@H](C(C)C)NC(=O)[C@H](CC(C)C)NC(=O)[C@H](CC=3C=CC(O)=CC=3)NC(=O)[C@H](CC(C)C)NC(=O)[C@H](C)NC(=O)[C@H](CCC(O)=O)NC(=O)[C@H](C(C)C)NC(=O)[C@H](CC(C)C)NC(=O)[C@H](CC=3NC=NC=3)NC(=O)[C@H](CO)NC(=O)CNC1=O)C(=O)NCC(=O)N[C@@H](CCC(O)=O)C(=O)N[C@@H](CCCNC(N)=N)C(=O)NCC(=O)N[C@@H](CC=1C=CC=CC=1)C(=O)N[C@@H](CC=1C=CC=CC=1)C(=O)N[C@@H](CC=1C=CC(O)=CC=1)C(=O)N[C@@H]([C@@H](C)O)C(=O)N1[C@@H](CCC1)C(=O)N[C@@H](CCCCN)C(=O)N[C@@H]([C@@H](C)O)C(O)=O)C(=O)N[C@@H](CC(N)=O)C(O)=O)=O)CSSC[C@@H](C(N2)=O)NC(=O)[C@H](CCC(N)=O)NC(=O)[C@H](CCC(O)=O)NC(=O)[C@H](C(C)C)NC(=O)[C@@H](NC(=O)CN)[C@@H](C)CC)[C@@H](C)CC)[C@@H](C)O)NC(=O)[C@H](CCC(N)=O)NC(=O)[C@H](CC(N)=O)NC(=O)[C@@H](NC(=O)[C@@H](N)CC=1C=CC=CC=1)C(C)C)C1=CN=CN1 PBGKTOXHQIOBKM-FHFVDXKLSA-N 0.000 description 1
- 230000000968 intestinal effect Effects 0.000 description 1
- 230000006623 intrinsic pathway Effects 0.000 description 1
- 208000002551 irritable bowel syndrome Diseases 0.000 description 1
- 238000002955 isolation Methods 0.000 description 1
- 229960000310 isoleucine Drugs 0.000 description 1
- AGPKZVBTJJNPAG-UHFFFAOYSA-N isoleucine Natural products CCC(C)C(N)C(O)=O AGPKZVBTJJNPAG-UHFFFAOYSA-N 0.000 description 1
- 150000004715 keto acids Chemical class 0.000 description 1
- 229940039696 lactobacillus Drugs 0.000 description 1
- UFPQIRYSPUYQHK-WAQVJNLQSA-N leukotriene A4 Chemical compound CCCCC\C=C/C\C=C/C=C/C=C/[C@@H]1O[C@H]1CCCC(O)=O UFPQIRYSPUYQHK-WAQVJNLQSA-N 0.000 description 1
- VNYSSYRCGWBHLG-AMOLWHMGSA-N leukotriene B4 Chemical compound CCCCC\C=C/C[C@@H](O)\C=C\C=C\C=C/[C@@H](O)CCCC(O)=O VNYSSYRCGWBHLG-AMOLWHMGSA-N 0.000 description 1
- 150000002617 leukotrienes Chemical class 0.000 description 1
- 239000007788 liquid Substances 0.000 description 1
- 210000003750 lower gastrointestinal tract Anatomy 0.000 description 1
- 239000012139 lysis buffer Substances 0.000 description 1
- 238000012423 maintenance Methods 0.000 description 1
- 230000014759 maintenance of location Effects 0.000 description 1
- 239000000463 material Substances 0.000 description 1
- 230000008774 maternal effect Effects 0.000 description 1
- 230000035800 maturation Effects 0.000 description 1
- 230000007246 mechanism Effects 0.000 description 1
- 230000004066 metabolic change Effects 0.000 description 1
- 230000010120 metabolic dysregulation Effects 0.000 description 1
- 230000037353 metabolic pathway Effects 0.000 description 1
- 238000010208 microarray analysis Methods 0.000 description 1
- 238000012543 microbiological analysis Methods 0.000 description 1
- 230000003278 mimic effect Effects 0.000 description 1
- 230000004898 mitochondrial function Effects 0.000 description 1
- 239000003068 molecular probe Substances 0.000 description 1
- 238000012806 monitoring device Methods 0.000 description 1
- 238000010172 mouse model Methods 0.000 description 1
- 210000003205 muscle Anatomy 0.000 description 1
- 230000035772 mutation Effects 0.000 description 1
- 230000009871 nonspecific binding Effects 0.000 description 1
- 238000002966 oligonucleotide array Methods 0.000 description 1
- 239000012074 organic phase Substances 0.000 description 1
- 230000003647 oxidation Effects 0.000 description 1
- 238000007254 oxidation reaction Methods 0.000 description 1
- 239000002245 particle Substances 0.000 description 1
- 230000003950 pathogenic mechanism Effects 0.000 description 1
- 239000013610 patient sample Substances 0.000 description 1
- 230000035515 penetration Effects 0.000 description 1
- WTJKGGKOPKCXLL-RRHRGVEJSA-N phosphatidylcholine Chemical compound CCCCCCCCCCCCCCCC(=O)OC[C@H](COP([O-])(=O)OCC[N+](C)(C)C)OC(=O)CCCCCCCC=CCCCCCCCC WTJKGGKOPKCXLL-RRHRGVEJSA-N 0.000 description 1
- 230000006461 physiological response Effects 0.000 description 1
- 239000000256 polyoxyethylene sorbitan monolaurate Substances 0.000 description 1
- 235000010486 polyoxyethylene sorbitan monolaurate Nutrition 0.000 description 1
- 238000007781 pre-processing Methods 0.000 description 1
- 230000035935 pregnancy Effects 0.000 description 1
- 125000002924 primary amino group Chemical group [H]N([H])* 0.000 description 1
- 238000000513 principal component analysis Methods 0.000 description 1
- 238000012545 processing Methods 0.000 description 1
- 238000003672 processing method Methods 0.000 description 1
- 230000000770 proinflammatory effect Effects 0.000 description 1
- XEYBRNLFEZDVAW-UHFFFAOYSA-N prostaglandin E2 Natural products CCCCCC(O)C=CC1C(O)CC(=O)C1CC=CCCCC(O)=O XEYBRNLFEZDVAW-UHFFFAOYSA-N 0.000 description 1
- 230000001681 protective effect Effects 0.000 description 1
- 230000009979 protective mechanism Effects 0.000 description 1
- 238000000746 purification Methods 0.000 description 1
- 238000011002 quantification Methods 0.000 description 1
- 238000011552 rat model Methods 0.000 description 1
- 239000011535 reaction buffer Substances 0.000 description 1
- 239000003642 reactive oxygen metabolite Substances 0.000 description 1
- AOPOCGPBAIARAV-OTBJXLELSA-N resolvin E1 Chemical compound CC[C@@H](O)\C=C\C=C/C[C@@H](O)\C=C\C=C\C=C/[C@@H](O)CCCC(O)=O AOPOCGPBAIARAV-OTBJXLELSA-N 0.000 description 1
- KPRHYAOSTOHNQA-NNQKPOSRSA-N resolvin E2 Chemical compound CC[C@@H](O)\C=C\C=C/C\C=C/C\C=C/C=C/[C@@H](O)CCCC(O)=O KPRHYAOSTOHNQA-NNQKPOSRSA-N 0.000 description 1
- 230000035945 sensitivity Effects 0.000 description 1
- 238000000926 separation method Methods 0.000 description 1
- 238000013207 serial dilution Methods 0.000 description 1
- 230000011664 signaling Effects 0.000 description 1
- 239000011780 sodium chloride Substances 0.000 description 1
- 239000002689 soil Substances 0.000 description 1
- 230000009870 specific binding Effects 0.000 description 1
- 238000001228 spectrum Methods 0.000 description 1
- DUYSYHSSBDVJSM-KRWOKUGFSA-N sphingosine 1-phosphate Chemical compound CCCCCCCCCCCCC\C=C\[C@@H](O)[C@@H](N)COP(O)(O)=O DUYSYHSSBDVJSM-KRWOKUGFSA-N 0.000 description 1
- 210000000952 spleen Anatomy 0.000 description 1
- 230000002269 spontaneous effect Effects 0.000 description 1
- 238000013179 statistical model Methods 0.000 description 1
- 150000003431 steroids Chemical class 0.000 description 1
- 230000000638 stimulation Effects 0.000 description 1
- 238000013517 stratification Methods 0.000 description 1
- 230000035882 stress Effects 0.000 description 1
- 239000006228 supernatant Substances 0.000 description 1
- 238000003786 synthesis reaction Methods 0.000 description 1
- 230000002123 temporal effect Effects 0.000 description 1
- 238000002560 therapeutic procedure Methods 0.000 description 1
- 238000012546 transfer Methods 0.000 description 1
- 230000009466 transformation Effects 0.000 description 1
- 238000000844 transformation Methods 0.000 description 1
- 230000007704 transition Effects 0.000 description 1
- LENZDBCJOHFCAS-UHFFFAOYSA-N tris Chemical compound OCC(N)(CO)CO LENZDBCJOHFCAS-UHFFFAOYSA-N 0.000 description 1
- PIEPQKCYPFFYMG-UHFFFAOYSA-N tris acetate Chemical compound CC(O)=O.OCC(N)(CO)CO PIEPQKCYPFFYMG-UHFFFAOYSA-N 0.000 description 1
- 238000007492 two-way ANOVA Methods 0.000 description 1
- 238000001946 ultra-performance liquid chromatography-mass spectrometry Methods 0.000 description 1
- 241001300301 uncultured bacterium Species 0.000 description 1
- 230000003827 upregulation Effects 0.000 description 1
- 239000004474 valine Substances 0.000 description 1
- 238000012800 visualization Methods 0.000 description 1
- 239000003643 water by type Substances 0.000 description 1
Images







Classifications
-
- C—CHEMISTRY; METALLURGY
- C12—BIOCHEMISTRY; BEER; SPIRITS; WINE; VINEGAR; MICROBIOLOGY; ENZYMOLOGY; MUTATION OR GENETIC ENGINEERING
- C12Q—MEASURING OR TESTING PROCESSES INVOLVING ENZYMES, NUCLEIC ACIDS OR MICROORGANISMS; COMPOSITIONS OR TEST PAPERS THEREFOR; PROCESSES OF PREPARING SUCH COMPOSITIONS; CONDITION-RESPONSIVE CONTROL IN MICROBIOLOGICAL OR ENZYMOLOGICAL PROCESSES
- C12Q1/00—Measuring or testing processes involving enzymes, nucleic acids or microorganisms; Compositions therefor; Processes of preparing such compositions
- C12Q1/68—Measuring or testing processes involving enzymes, nucleic acids or microorganisms; Compositions therefor; Processes of preparing such compositions involving nucleic acids
- C12Q1/6876—Nucleic acid products used in the analysis of nucleic acids, e.g. primers or probes
- C12Q1/6883—Nucleic acid products used in the analysis of nucleic acids, e.g. primers or probes for diseases caused by alterations of genetic material
-
- C—CHEMISTRY; METALLURGY
- C12—BIOCHEMISTRY; BEER; SPIRITS; WINE; VINEGAR; MICROBIOLOGY; ENZYMOLOGY; MUTATION OR GENETIC ENGINEERING
- C12Q—MEASURING OR TESTING PROCESSES INVOLVING ENZYMES, NUCLEIC ACIDS OR MICROORGANISMS; COMPOSITIONS OR TEST PAPERS THEREFOR; PROCESSES OF PREPARING SUCH COMPOSITIONS; CONDITION-RESPONSIVE CONTROL IN MICROBIOLOGICAL OR ENZYMOLOGICAL PROCESSES
- C12Q1/00—Measuring or testing processes involving enzymes, nucleic acids or microorganisms; Compositions therefor; Processes of preparing such compositions
- C12Q1/02—Measuring or testing processes involving enzymes, nucleic acids or microorganisms; Compositions therefor; Processes of preparing such compositions involving viable microorganisms
- C12Q1/04—Determining presence or kind of microorganism; Use of selective media for testing antibiotics or bacteriocides; Compositions containing a chemical indicator therefor
-
- A—HUMAN NECESSITIES
- A61—MEDICAL OR VETERINARY SCIENCE; HYGIENE
- A61P—SPECIFIC THERAPEUTIC ACTIVITY OF CHEMICAL COMPOUNDS OR MEDICINAL PREPARATIONS
- A61P3/00—Drugs for disorders of the metabolism
- A61P3/08—Drugs for disorders of the metabolism for glucose homeostasis
- A61P3/10—Drugs for disorders of the metabolism for glucose homeostasis for hyperglycaemia, e.g. antidiabetics
-
- G—PHYSICS
- G01—MEASURING; TESTING
- G01N—INVESTIGATING OR ANALYSING MATERIALS BY DETERMINING THEIR CHEMICAL OR PHYSICAL PROPERTIES
- G01N33/00—Investigating or analysing materials by specific methods not covered by groups G01N1/00 - G01N31/00
- G01N33/48—Biological material, e.g. blood, urine; Haemocytometers
- G01N33/50—Chemical analysis of biological material, e.g. blood, urine; Testing involving biospecific ligand binding methods; Immunological testing
- G01N33/68—Chemical analysis of biological material, e.g. blood, urine; Testing involving biospecific ligand binding methods; Immunological testing involving proteins, peptides or amino acids
- G01N33/6893—Chemical analysis of biological material, e.g. blood, urine; Testing involving biospecific ligand binding methods; Immunological testing involving proteins, peptides or amino acids related to diseases not provided for elsewhere
-
- C—CHEMISTRY; METALLURGY
- C12—BIOCHEMISTRY; BEER; SPIRITS; WINE; VINEGAR; MICROBIOLOGY; ENZYMOLOGY; MUTATION OR GENETIC ENGINEERING
- C12Q—MEASURING OR TESTING PROCESSES INVOLVING ENZYMES, NUCLEIC ACIDS OR MICROORGANISMS; COMPOSITIONS OR TEST PAPERS THEREFOR; PROCESSES OF PREPARING SUCH COMPOSITIONS; CONDITION-RESPONSIVE CONTROL IN MICROBIOLOGICAL OR ENZYMOLOGICAL PROCESSES
- C12Q2600/00—Oligonucleotides characterized by their use
- C12Q2600/118—Prognosis of disease development
-
- G—PHYSICS
- G01—MEASURING; TESTING
- G01N—INVESTIGATING OR ANALYSING MATERIALS BY DETERMINING THEIR CHEMICAL OR PHYSICAL PROPERTIES
- G01N2800/00—Detection or diagnosis of diseases
- G01N2800/04—Endocrine or metabolic disorders
- G01N2800/042—Disorders of carbohydrate metabolism, e.g. diabetes, glucose metabolism
Definitions
- This invention relates to a novel method for diagnosing an increased risk of type 1 diabetes in an individual. Furthermore, this invention relates to a method for preventing onset of type 1 diabetes in an individual.
- Type 1 diabetes is an autoimmune disease that results from the selective destruction of insulin-producing ⁇ -cells in pancreatic islets.
- the diagnosis of T1D is commonly preceded by a long prodromal period which includes seroconversion to islet autoantibody positivity 1 and subtle metabolic disturbances 2 .
- the incidence of T1D among children and adolescents has increased markedly in the Western countries during the recent decades 3 and is presently increasing at a faster rate than ever before 4,5 . This suggests an important role of environment and gene-environment interactions in T1D pathogenesis.
- Metabolome is sensitive to both genetic and early environmental factors influencing later susceptibility to chronic diseases 6 .
- Recent evidence from serum metabolomics suggests that metabolic disturbances already precede ⁇ -cell autoimmunity markers in children who subsequently progress to T1D 2 .
- the environmental causes and tissue-specific mechanisms leading to these disturbances are unknown.
- studies on early phenomena of T1D pathogenesis in humans are a huge undertaking as they require long and frequent follow-up of large numbers of subjects 2,7,8 to be able to go "back to the origins" of the disease once a sufficient number of subjects in the follow-up have progressed to overt disease.
- the non-obese diabetic (NOD) mouse is a well characterized model of autoimmune disease 9 which has been widely used in studies of T1D. It is clear that the NOD experimental model does not completely mimic the immune system and T1D pathogenesis in man 10 . In fact, only a fraction of NOD mice progress to disease, with the incidence of spontaneous diabetes being 60%-80% in females and 20%-30% in males 9 . There is thus a stochastic component to T1D pathogenesis in NOD mice, believed to be due to random generation of islet-specific T cells 11 . The disease incidence does seem to depend on the environment and there is evidence indicating that its incidence is highest in relatively germ-free environment 12 and that gut microbiota may affect its incidence via the modulation of the host innate immune system 13 .
- WO 2008/031917 teaches using biofluid metabolite profile as a tool for early prediction of type 1 diabetes risk.
- Use of diabetes associated autoantibodies in connection of decreased metabolite level has been proposed for improving the accuracy.
- a nutritional intervention, an antioxidant therapy, or a stimulation of the biochemical synthesis of choline plasmalogens are proposed to be used for prevention of onset on the disease.
- LUIZ FW ROESCH ET AL THE I S M E JOURNAL, vol. 3, no. 5, 1 May 2009, pages 536-548, teaches identification of bacteria (in particular Lactobacillus and Bacteroides strais) correlated with the onset of diabetes in a rat model .
- Aim of the present invention is to provide a method according to appended claim 1 for diagnosing an increased risk of type 1 diabetes in an individual comprising the steps of
- the present invention provides a considerable advantage of enabling the individuals having a risk of type 1 diabetes being diagnosed at an early stage before or near the onset of islet autoimmunity. Especially individuals with increased risk should be diagnosed as early as possible.
- Gut microbiota sample is obtained from lower gastrointestinal tract, preferably it is e.g. feces sample.
- the onset of type 1 diabetes in the individual can be prevented by normalizing the diversity of the gut microbiota.
- a method for preventing onset of type 1 diabetes in an individual by administering to said individual at least one species of bacteria of the clostridial phylogenetic cluster IV ( Clostridium leptum group).
- Clostridium leptum group - Clostridial phylogenetical cluster IV which includes e.g. Acetanaerobacterium elongatum , Anaerophilum agile, Anaerofilum pentosovorans, Anaerotruncus colihominis, Butyricoccus pullicaecorum , Clostridium cellulosi, Clostridium leptum, Clostridium methylpentosum , Clostridium orbiscindens, Clostridium sporosphaeroides, Clostridium viride, Ethanoligenes harbinense, Eubacterium desmolans, Eubacterium siraeum, Eubacterium plautii, Faecalibacterium prausnitzii, Hydrogenoanaerobacterium saccharovorans, Oscillibacter valericigenes, Papillibacter cinnamivorans , Pseudoflavonif
- non-pathogenic bacteria means bacteria that is not harmful to an individual. Especially bacteria naturally occurring in the intestinal flora of a healthy individual are preferred.
- metabolic is preferably a lysophospholipid (e.g., lysophosphatidylcholines such as lysoPC(16:0), lysoPC(18:0)), sphingosine-1-phosphate, arachidonic acid, arachidonic acid derived lipid mediators (e.g. prostaglandin E2 or leukotrienes LTA4, LTB4), docosahexanoic acid eicosapentaenoic acid derived lipid mediators (e.g.
- resolvins such as Resolvin E1 and Resolvin E2, maresins, protectins), branched chain amino acids (valine, isoleucine, leucine) and their ketoacids (e.g. ketoleucine), glutamic acid, .
- the determination of the serum metabolite can be followed up at several ages of the individual, preferably a child, and the result is compared to control groups of the same age as the child to be diagnosed. Also several serum metabolites can be determined for the child to be diagnosed, and the levels are compared to the levels of said metabolites for control groups.
- the forementioned monitoring of one or more serum metabolites is combined with monitoring of emergence of autoimmunity in the child and / or determination of genetic risk for development of type 1 diabetes.
- Lipidomic analysis using Ultra Performance Liquid Chromatography (UPLC) coupled to mass spectrometry (MS) 2 was performed on a complete sample series from 26 female mice (12 progressors, 14 non-progressors) and 13 male (seven progressors, six non-progressors) mice, comprising a total of 1172 samples or 30 samples/mouse on an average (733 samples from female and 439 from male mice), with 154 lipids measured in each sample.
- UPLC Ultra Performance Liquid Chromatography
- MS mass spectrometry
- the first weeks of life (3-10 weeks) were characterized by an overall lipid-lowering trend among the female progressors, while the period close to the disease onset (15 week and older) was characterized by elevated triacylglycerols and phospholipids ( Fig. 1b ). No such changes were observed in male mice (Supplementary Fig. 1 ).
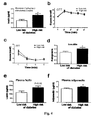
- the NOD female progressors had similar levels of glycemia ( Fig. 1c ) than the non-progressors but to our surprise the progressors exhibited higher fasting as well as glucose-stimulated plasma insulin levels ( Fig.
- mice who later progress to diabetes are characterized by enhanced glucose-stimulated insulin secretion (GSIS) at an early age or that they are inappropriately insulin resistant for their degree of body weight.
- GSIS glucose-stimulated insulin secretion
- this increased GSIS associated to early evolutive stages towards type 1 diabetes is consistent with our earlier findings indicating that the children who later progress to diabetes are characterized by low serum ketoleucine and elevated levels of the more insulinotropic aminoacid leucine prior to seroconversion to insulin autoantibody (IAA) positivity 2,14 .
- the nested case-control study included 56 T1D progressors and 73 matched non-progressors, comprising a total of 1196 samples or 9.3 samples per child on average between birth and diabetes onset (in progressors).
- the first state corresponding to first year of life was characterized by low triacylglycerols and specific phospholipids (Supplementary Fig. 2 ).
- Seroconversion to islet autoantibody positivity is associated with transiently elevated lysophosphatidylcholine (lysoPC) serum levels in children who subsequently progress to TID 2 .
- lysoPC lysophosphatidylcholine
- GSEA Gene Set Enrichment Analysis
- FDR False Discovery Rate
- ROS reactive oxygen species
- mice All experimental procedures were approved by the Committee for Laboratory Animal Welfare, University of Turku. The mice were kept in an animal room maintained at 21 ⁇ 1°C with a fixed 12:12 h light-dark cycle. Standard rodent chow (Special Diet Services, Witham, UK) and water were available ad libitum. The colonies of NOD/Bom mice used were bred and maintained in the animal facilities of University of Turku and originated from mice purchased from Taconic Europe (Ry, Denmark).
- mice 26 female and 44 male NOD mice (Study 1) underwent weekly blood sampling by venopuncture from the tail vein starting at 3 weeks of age until the mice developed diabetes (blood glucose ⁇ 14.0 mmol/ in two consecutive weeks) or until female mice reached 36 weeks and male mice 40 weeks of age. Serum was separated and quickly frozen in -70°C for metabolomic analysis. Blood samples for detection of insulin autoantibodies (IAA) were collected from tail vein at the age of 8 weeks. Plasma samples for insulin were collected between noon and 2 PM after 4 h fast and two days later 5 minutes after intraperitoneal glucose (1 g/kg) administration at the age of 10 weeks.
- IAA insulin autoantibodies
- mice were sacrificed at 10 weeks of age after 4 h fast by cardiac puncture under anesthesia.
- Gonadal white adipose tissue (WAT) depot was carefully dissected and weighted, and was used as a marker of adiposity.
- Serum samples for IAA, lipidomics and adipokine panel assays, gonadal WAT, gastrocnemius muscle and pancreas samples were collected, and stored at -70°C until analyses.
- HOMA-IR an estimate of insulin resistance, was calculated as fasting insulin ( ⁇ IU/ml) ⁇ fasting glucose (mmol/l)/22.5.
- Statistical significances were analyzed with Student's t-test or two-way ANOVA using GraphPad Prism 4.
- Plasma insulin was analyzed with Mouse Ultrasensitive ELISA kit (Mercodia, Uppsala, Sweden) or together with leptin with Milliplex Mouse Adipokine Panel (Millipore, Billerica, MA, USA). Plasma adiponectin was measured with Mouse Adiponectin ELISA kit from Millipore.
- Pancreatic islets were isolated using Ficoll 400 (Sigma-Aldrich, St Louis, MI, USA) gradient method 1a .
- the pancreata were incubated with Collagenase P (0,5 mg/ml, Roche Diagnostics, Mannheim, Germany) in HBSS containing 10 mM HEPES, 1 mM MgCl 2 , 5mM Glucose, pH 7.4 for 17 min.
- the pellet was resuspended in Ficoll 25%, and the densities 23%, 20% and 11% were layered on top.
- the islet layer between densities 23% and 20% was collected and washed twice before snap_freezing the pellet for metabolomics or homogenization in lysis buffer for RNA extraction. Samples were stored in -70°C until analyses.
- Pancreata from euglycemic NOD mice were cryosectioned. 5 ⁇ m sections with > 20 ⁇ m intervals were stained with hematoxylin & eosin and graded for insulitis as follows: 0, no visible infiltration, I peri-insulitis, II insulitis with ⁇ 50% and III insulitis with > 50% islet infiltration.
- Murine IAA were measured by a radiobinding microassay (RIA) with minor modifications to that previously described for human IAA 2a .
- Mouse sera (2.5 ⁇ l) and serial dilutions of standard samples (5 ⁇ l) of a serum pool obtained from persons with a high IAA titer were incubated for 72 h with 15,000 cpm mono 125 I-(TyrA14)-insulin (Amersham, GE Healthcare, Buckinghamshire, UK) in the presence or absence of an excess of unlabeled human recombinant insulin (Roche Diagnostics, Mannheim, Germany).
- Antibody complexes were precipitated by adding 50 ⁇ l TBT buffer (50 mM Tris, pH 8,0, 0,1% Tween 20) containing 8 ⁇ l Protein A and 4 ⁇ l Protein G Sepharose (Amersham). After repeated washings the bound radioactivity was measured with a liquid scintillation detector (1450 Microbeta Trilux, Perkin Elmer Life Sciences Wallac, Turku, Finland). The specific binding was calculated by subtracting the non-specific binding (excess unlabeled insulin) from total binding and expressed in relative units (RU) based on standard curves run on each plate. The cut-off value for mouse IAA positivity was set at the mean + 3SDS in 16 BALB-mice, i.e. 1.79 relative units (RU).
- Serum samples (10 ⁇ l) in Eppendorf tubes were spiked with a standard mixture containing 10 lipid compounds at a concentration level of 0.2 ⁇ g/sample, and mixed with 10 ⁇ l of 0.9% sodium chloride and 100 ⁇ l of chloroform:methanol (2:1). After 2 min vortexing and 1 h standing the samples were centrifuged at 10000 rpm for 3 min and 60 ⁇ l of the lower organic phase was taken to a vial insert and spiked with 20 ⁇ l of three labelled lipid standards at a concentration level of 0.2 ⁇ g/sample.
- the lipidomics runs were performed on a Waters Q-Tof Premier mass spectrometer combined with an Acquity Ultra Performance LCTM (UPLC; Milford MA).
- the solvent system consisted of 1) water with 1% 1M NH 4 Ac and 0.1% HCOOH and 2) LC/MS grade acetonitrile/isopropanol (5:2) with 1% 1M NH 4 Ac, 0.1% HCOOH.
- the gradient run from 65% A / 35% B to 100% B took 6 min and the total run time including a 5 min reequilibration step was 18 min.
- the column (at 50 °C) was an Acquity UPLCTMBEH C18 (1 ⁇ 50 mm, 1.7 ⁇ m particles) and the flow rate was 0.200 ml/min.
- the lipids were profiled using ESI+ mode and the data collected at a mass range of m/z 300-1200.
- the data was processed by using MZmine software (version 0.60) 3a,4a and the lipid identification was based on an internal spectral library 5 .
- Islet samples were analyzed by two-dimensional gas chromatography coupled to time of flight mass spectrometry (GCxGC-TOF/MS).
- the instrument used was a Leco Pegasus 4D (Leco Inc., St. Joseph, MI), equipped with an Agilent GC 6890N from Agilent Technologies (Santa Clara, CA) and a CombiPAL autosampler from CTC Analytics AG (Zwingen, Switzerland).
- the modulator, secondary oven and time-of-flight mass spectrometer were from Leco Inc.
- the GC was operated in split mode with a 1:20 ratio. Helium with a constant pressure of 39.6 psig was used as carrier gas.
- the first dimension GC column was a non-polar RTX-5 column, 10 m x 0.18 mm x 0.20 ⁇ m (Restek Corp., Bellefonte, PA), coupled to a polar BPX-50 column, 1.50 m x 0.10 mm x 0.10 ⁇ m (SGE Analytical Science, Ringwood, Australia).
- the temperature program was as follows: initial temperature 50 °C, 1 min ⁇ 295 °C, 7 °C/min, 3 min.
- the secondary oven was set to 20 °C above the oven temperature. Inlet and transfer line temperatures were set to 260 °C.
- the second dimension separation time was set to 5 s.
- the mass range used was 45-700 amu and the data collection speed was 100 spectra/second.
- Raw data were processed using Leco ChromaTOF software, followed by alignment using in-house developed software Mylly.
- the metabolites were identified by using an in-house reference compound library together with The Palisade Complete Mass Spectral Library, 600K Edition (Palisade Mass Spectrometry, Ithaca, NY).
- RNA extraction from islets was carried out with Rneasy minikit (QIAGEN GmbH, Hilden, Germany) and from liver, skeletal muscle (m. gastrocnemius) and gonadal white adipose tissue with Trizol reagent (Invitrogen, Carlsbad, CA) followed by RNase-free DNase I treatment (QIAGEN GmbH) and purification with Rneasy minikit.
- Pancreatic islets and liver for microarray analysis were collected from 19-week-old euglycemic female NOD/Bom mice.
- Skeletal muscle and adipose tissue for GLUT4 mRNA expression were collected from 10-week-old female NOD/MrkTac mice.
- GLUT4 mRNA expression in skeletal muscle and gonadal white adipose tissue was measured by quantitative real-time PCR.
- CDNA synthesis was performed with High Capacity RNA-to-cDNA Kit according to manufacturer's protocol.
- Real-time PCR was performed with 7300 Real Time PCR system, pre-designed TaqMan® Gene Expression Assay for GLUT4 and TaqMan® Endogenous Control Assay for ⁇ -actin.
- the 20 ⁇ l PCR reactions contained 8 ⁇ l cDNA, 8 ⁇ l TaqMan® Gene Expression Master Mix, 1 ⁇ l GLUT4 TaqMan Gene Expression Assay, 1 ⁇ l b-actin TaqMan Endogenous control Assay and 2 ⁇ l depc water.
- Cycling parameters for real-time RT-PCR were as follows: 50°C for 2 min, 95°C for 10 min followed by 40 cycles of 95 °C for 15 seconds and 60 °C for one minute.
- RNA amplification was performed from 300 ng total RNA with Ambion's (Austin, TX) Illumina RNA TotalPrep Amplification kit (cat no AMIL1791). IVT reaction overnight (14 h), during it cRNA was biotinylated. Both before and after the amplifications the RNA/cRNA concentrations where checked with Nanodrop ND-1000 (Wilmington, DE) and RNA/cRNA quality was controlled by BioRad's Experion electrophoresis station (Hercules, CA).
- Hybridizations 1.50 ⁇ g each sample was hybridized to Illumina's MouseWG-6 Expression BeadChips, version 2 (BD-201-0602) at 58 °C overnight (18 h) according to Illumina Whole-Genome Gene Expression Direct Hybridization protocol, revision A. Hybridization was detected with 1 ⁇ g/ml Cyanine3-streptavidine, GE Healthcare Limited (Chalfont, UK) (cat no PA43001). Chips were scanned with Illumina BeadArray Reader, BeadScan software version 3.5. The numerical results were extracted with Illumina's GenomeStudio software v 1.0 without any normalization.
- Bead Summary data exported from Illumina's GenomeStudio software, was preprocessed using beadarray package 6a of R/Bioconductor 7a as follows. Data was transformed to logarithm (base 2), and normalized using quantile method 8a , which equalizes the distribution of probe intensities across a set of microarrays.
- GSEA Gene Set Enrichment Analysis
- LIMMA Linear Models for Microarray Data
- Leading edge genes of an enriched pathway are the genes that account for the enrichment signal 9a .
- the pathway profiles are calculated as average expression of all leading edge genes.
- This matrix of pathway profiles of selected pathways was then augmented with selected metabolite profiles. Then the numerical values in this matrix were normalized with the autoantibody-negative non-progressors (IAA- & NP) i.e., each numerical value of a variable is divided by the average values from IAA- & NP samples, and transformed to logarithmic (base 2) scale. Then the variables were scaled for unit variance.
- hierarchical clustering was applied using Euclidean metric and complete linkage method 14a for computing inter-cluster distances.
- An R package called gplots http://www.r-project.org/) was used for the clustering and displaying the numerical values as a heat map.
- PCR-DGGEs of predominant bacterial PCR-DGGE and group specific PCR-DGGEs were performed as described previously 16 .
- Metabolic state development in progressors and non-progressors was modeled by separate Hidden Markov Models 20a , making it possible to align individuals based on metabolic states instead of age, and to compare the metabolic states in progressors and no-progressors.
- the modeling assumptions under which the models are fitted to data are that individual mice share a similar developmental progression but the timing of the states may vary, and that metabolite profiles in each state may be different for progressors and non-progressors.
- Model fitting was done by the standard Baum-Welch algorithm using the MATLAB toolbox by Kevin Murphy (http://people.cs.ubc.ca/ ⁇ murphyk/ Bayes/hmm.html).
- the model structure was validated by the bootstrap in the same way as in our earlier studies 20a , and confidence intervals were estimated with non-parametric bootstrap (5000 samples).
- X ⁇ R N ⁇ D X and Y ⁇ R M ⁇ D Y be two data matrices with N and M samples, M ⁇ N, and dimensions D X and D Y respectively.
- the task is to find a permutation p of samples in Y such that each sample x i in X is matched with y p ( i ) in Y , that is, we assume a one-to-one matching of samples between the two data matrices. Since the data matrices do not lie in the same data space, it is not possible to use distance as matching criterion. We have introduced a new methodology based on statistical dependencies between the data sets to solve this problem 21 .
- the idea is to compute from the data features or statistical descriptors that maximize statistical dependencies, and do the matching based on the descriptors.
- we will project the data onto a lower-dimensional subspace such that the statistical dependencies between the datasets are maximized, and find a matching of samples in this comparable subspace.
- the method described above can be used to find a matching given any pair of human-mouse datasets.
- the matching can be further improved by combining solutions obtained by several human-mouse dataset pairs to give a consensus matching .
- the pairs of human-mouse datasets are independent samples, which holds approximately assuming a large number of datasets.
Landscapes
- Health & Medical Sciences (AREA)
- Life Sciences & Earth Sciences (AREA)
- Chemical & Material Sciences (AREA)
- Engineering & Computer Science (AREA)
- Organic Chemistry (AREA)
- Proteomics, Peptides & Aminoacids (AREA)
- Analytical Chemistry (AREA)
- Molecular Biology (AREA)
- Immunology (AREA)
- Wood Science & Technology (AREA)
- Zoology (AREA)
- General Health & Medical Sciences (AREA)
- Biochemistry (AREA)
- Physics & Mathematics (AREA)
- Microbiology (AREA)
- Genetics & Genomics (AREA)
- Biotechnology (AREA)
- Hematology (AREA)
- Bioinformatics & Cheminformatics (AREA)
- Pathology (AREA)
- Urology & Nephrology (AREA)
- Biomedical Technology (AREA)
- General Engineering & Computer Science (AREA)
- Biophysics (AREA)
- Diabetes (AREA)
- Medicinal Chemistry (AREA)
- General Physics & Mathematics (AREA)
- Food Science & Technology (AREA)
- Cell Biology (AREA)
- Toxicology (AREA)
- Animal Behavior & Ethology (AREA)
- Emergency Medicine (AREA)
- Veterinary Medicine (AREA)
- Obesity (AREA)
- General Chemical & Material Sciences (AREA)
- Nuclear Medicine, Radiotherapy & Molecular Imaging (AREA)
- Endocrinology (AREA)
- Chemical Kinetics & Catalysis (AREA)
- Pharmacology & Pharmacy (AREA)
- Public Health (AREA)
Description
- This invention relates to a novel method for diagnosing an increased risk of
type 1 diabetes in an individual. Furthermore, this invention relates to a method for preventing onset oftype 1 diabetes in an individual. - The publications and other materials used herein to illuminate the background of the invention, and in particular, cases to provide additional details respecting the practice, are incorporated by reference.
-
Type 1 diabetes (T1D) is an autoimmune disease that results from the selective destruction of insulin-producing β-cells in pancreatic islets. The diagnosis of T1D is commonly preceded by a long prodromal period which includes seroconversion to islet autoantibody positivity1 and subtle metabolic disturbances2 . The incidence of T1D among children and adolescents has increased markedly in the Western countries during the recent decades3 and is presently increasing at a faster rate than ever before4,5. This suggests an important role of environment and gene-environment interactions in T1D pathogenesis. - Metabolome is sensitive to both genetic and early environmental factors influencing later susceptibility to chronic diseases6. Recent evidence from serum metabolomics suggests that metabolic disturbances already precede β-cell autoimmunity markers in children who subsequently progress to T1D2. However, the environmental causes and tissue-specific mechanisms leading to these disturbances are unknown. Given its relatively low disease incidence in the general population and even among subjects at genetic risk1, studies on early phenomena of T1D pathogenesis in humans are a huge undertaking as they require long and frequent follow-up of large numbers of subjects2,7,8 to be able to go "back to the origins" of the disease once a sufficient number of subjects in the follow-up have progressed to overt disease.
- The non-obese diabetic (NOD) mouse is a well characterized model of autoimmune disease9 which has been widely used in studies of T1D. It is clear that the NOD experimental model does not completely mimic the immune system and T1D pathogenesis in man10. In fact, only a fraction of NOD mice progress to disease, with the incidence of spontaneous diabetes being 60%-80% in females and 20%-30% in males9. There is thus a stochastic component to T1D pathogenesis in NOD mice, believed to be due to random generation of islet-specific T cells11. The disease incidence does seem to depend on the environment and there is evidence indicating that its incidence is highest in relatively germ-free environment12 and that gut microbiota may affect its incidence via the modulation of the host innate immune system13.
-
WO 2008/031917 teaches using biofluid metabolite profile as a tool for early prediction oftype 1 diabetes risk. Use of diabetes associated autoantibodies in connection of decreased metabolite level has been proposed for improving the accuracy. A nutritional intervention, an antioxidant therapy, or a stimulation of the biochemical synthesis of choline plasmalogens are proposed to be used for prevention of onset on the disease. - LUIZ FW ROESCH ET AL, THE I S M E JOURNAL, vol. 3, no. 5, 1 May 2009, pages 536-548, teaches identification of bacteria (in particular Lactobacillus and Bacteroides strais) correlated with the onset of diabetes in a rat model.
- However, ther is still a need for improved methods for early identification of the individuals being susceptible to
type 1 diabetes having increased risk oftype 1 diabetes. There is also a need for effectively prevent onset oftype 1 diabetes. - Aim of the present invention is to provide a method according to appended
claim 1 for diagnosing an increased risk oftype 1 diabetes in an individual comprising the steps of - (a) providing a fecal sample;
- (b) analyzing diversity of the Clostridium leptum group of said sample
- (c) comparing the result to control samples obtained from healthy individuals;
- (d) determining the difference between the patient samples and control samples,
- The present invention provides a considerable advantage of enabling the individuals having a risk of
type 1 diabetes being diagnosed at an early stage before or near the onset of islet autoimmunity. Especially individuals with increased risk should be diagnosed as early as possible. - Gut microbiota sample is obtained from lower gastrointestinal tract, preferably it is e.g. feces sample.
- Once diagnosed at an early stage as belonging to the risk group, the onset of
type 1 diabetes in the individual can be prevented by normalizing the diversity of the gut microbiota. Specifically, disclosed is a method for preventing onset oftype 1 diabetes in an individual by administering to said individual at least one species of bacteria of the clostridial phylogenetic cluster IV (Clostridium leptum group). -
-
Figure 1 . Normoglycemic female NOD mice who later progress to diabetes have elevated glucose stimulated plasma insulin and diminished lipids at an early age.
a, Incidence of diabetes in female and male NOD mice included in the longitudinal lipidomics study. The cumulative incidence of diabetes in this study was lower than the colony incidence of 80% in females and 35% in males. b, Age-dependent progression of lipidomic profiles in females, viewed as ratios of mean lipid concentrations of diabetes progressors (n=12) vs. non-progressors (n=14). The hierarchical clustering was performed across all 733 samples analyzed. PC, phosphatidylcholine; lysoPC, lysophosphatidylcholine. c, Blood glucose levels in 10-week-old female NOD progressors (n=11) and non-progressors (n=14) after 4 h fast and 5 minutes after intraperitoneal (i.p.) glucose (1 g/kg) administration (2-way ANOVA with glucose administration and diabetes progression as factors, reported P-value for diabetes progression; error bars ± SEM). d, Plasma insulin concentrations (mice and statistic same as in panel c). e, There were no differences in body weight between the groups. f, Concentration of serum lysophosphatidylcholine (lysoPC; measured as total added concentration of PC(16:0/0:0) and PC(18:0/0:0)) in 8-week female NOD mice as dependent on diabetes progression and insulin autoantibody (IAA) positivity. Surrogate marker derived from lysoPC level and IAA positivity (SupplementaryFig. 3 ) was used to stratify mice according to diabetes risk in subsequent studies where mice were sacrificed for tissue-specific studies. -
Figure 2 . Lipid changes observed in children who later progress to T1D are also characteristic of the early prediabetic changes in female NOD mouse progressors.
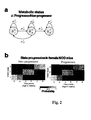
a, Structure of the Hidden Markov Model (HMM) used in this study. The model is made to focus on progressive changes of lipidomic profiles over time15 by assuming that returning back in states is not possible afterstate 2. Separate HMM models were developed for NOD female progressors and non-progressors. The nodes in the graph represent the hidden states, each of which emits a multivariate profile of metabolite concentrations, and arrows represent possible transitions between the states. b, HMM state progression as a function of age is similar for progressors and non-progressors. Each column shows the probabilities of being in the three states at a certain age, estimated by bootstrap. c, Differences in lipidomic profiles (mean lipid concentrations) between progressors and non-progressors as a function of the progressive metabolic state, colored according to bootstrap-based confidence intervals. d, Differences in lipid concentrations in diabetes progressors vs. nonprogressors that generalize across the species. Mapping shown on the left is inferred from longitudinal lipidomic profiles from DIPP study children2 (SupplementaryFig. 2 ) and NOD female mice. -
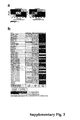
Figure 3 . Female NOD mice at high risk of diabetes have more insulitis, elevated levels of insulinotropic amino acis in pancreatic islets, and diminished diversity of C. leptum bacteria in caecum.
a, Grading of pancreatic islet insulitis in normoglycemic 19-week-old female NOD mice comparing high- and low-risk groups. Insulitis was graded: 0, no visible infiltration, I peri-insulitis, II insulitis with < 50% and III insulitis with > 50% islet infiltration. 52 islets from 4 non-progressors (11-17 islets/each) and 28 islets from 3 non-progressors (7-10 islets/each) were graded. There was a tendency to more severe insulitis in the progressors (P = 0.07, χ2 test). b, Significantly regulated and selected other metabolites (P<0.07), out of 125 measured, in islets from female mice at high (HR) vs. low risk (LR) of developing diabetes. Fourteen mice were 8 weeks old (two IAA+ LR, three IAA- LR, four IAA+ HR, five IAA- HR) and 11 were 19 weeks old (four IAA+ LR, three IAA- LR, one IAA+ HR, three IAA- HR) at time of sacrifice. FDR (Max. q-value47 at P<0.05) = 0.12. c, Bacterial diversity of caecum samples from 19-week old female NOD mice, four from HR group and seven from LR group, as detected with group specific DGGEs. Bifidobacteria did not amplify from any sample. -
Figure 4 . Markers of insulin resistance in 8-11 week old female NOD mice.
a, Glucose-stimulated insulin secretion is elevated in the high-risk (HR) group (n = 18) as compared to low-risk (LR) group (n = 12) (measured in NOD Study 3). b, No significant differences between the HR and LR group were found in glucose tolerance test (GTT) or c, insulin tolerance test (ITT) (measured in Study 3). d, The HR mice at 10 weeks of age have slightly more insulitis. Total 678 islets from 8 LR mice (60-123 islets/each) and 633 islets from 8 HR mice (59-102 islets/each) were graded as inFig. 3a . e, Plasma leptin (combinedStudies Study 4; n = 14 for LR and n = 27 for HR) are elevated in 10-week-old HR mice. - Supplementary
Figure 1 . Lipidomic profiles of male NOD progressors do not differ from non-progressors.
Age-dependent progression of lipidomic profiles in NOD male mice, viewed as ratios of mean lipid concentrations of diabetes progressors (n=7) vs. the non-progressors (n=6). The hierarchial clustering was performed across all 439 samples analyzed. - Supplementary
Figure 2 . Metabolic states derived from hidden Markov Model in children who later progress to type 1 diabetes.
a. Distribution of HMM states as a function of age in DIPP children, shown separately for progressors and non-progressors. The HMM was derived from previously obtained data1b from diabetes progressors (n=56) and non-progressors (n=73), comprising a total of 1196 samples. b Progressopn of lipidomics states to diabetes in DIPP study children. Differences in mean lipid concentrations between progressors and non-progressors are shown for each of the three states. - Supplementary
Figure 3 . Surrogate marker for stratifying female NOD mice into two groups with high- and low-risk of developing autoimmune diabetes.
The marker is derived from lysophosphatidylcholine and IAA measurement from 8 week old female mice (same as shown inFigure 3 .). The following algorithm was applied:- Calculate lysoPC concentration (µmol/l) as a sum of concentrations of PC(16:0/0:0) and PC(18:0/0:0)
- Scale the lysoPC concentration to zero mean and unit variance → lysoPCS
- Marker calculation
- o If IAA-, then Marker = lysoPCS
- ∘ If IAA+, then Marker = -lysoPCS
- Estimation of progressors (P) and non-progressors (NP)
- o If marker ≥ -0,1 then P, else NP
- Supplementary
Figure 4 . Insulin resistance, weight, and adiposity in progression to T1D. a. Homeostatic model assessment (HOMA) index in high- vs. low-risk group (Study 4). b. Body weight andc. adipose tissue mass in the same groups. - Supplementary
Figure 5 . Microbial composition of caecum in 19-week-old female NOD mice, comparing- high and low-risk groups.
Principal Components Analysis plot of the composite DGGE dataset, which was calculated based DGGE profiles of predominant bacteria, E. rectal - B. coccoides group, C. leptum group, Bacteroiden spp. and Lactobacillus-group, bifidobacteria didn'r amplify. Star = high diabetes risk, dot= low diabetes risk. - Supplemenray
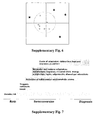
Figure 6 . Metabolic dysregulation in early type I diabetes pathogenesis - a summary of findings. - In this connection Bacteria of the Clostridium leptum group - Clostridial phylogenetical cluster IV, which includes e.g. Acetanaerobacterium elongatum, Anaerophilum agile, Anaerofilum pentosovorans, Anaerotruncus colihominis, Butyricoccus pullicaecorum, Clostridium cellulosi, Clostridium leptum, Clostridium methylpentosum, Clostridium orbiscindens, Clostridium sporosphaeroides, Clostridium viride, Ethanoligenes harbinense, Eubacterium desmolans, Eubacterium siraeum, Eubacterium plautii, Faecalibacterium prausnitzii, Hydrogenoanaerobacterium saccharovorans, Oscillibacter valericigenes, Papillibacter cinnamivorans, Pseudoflavonifractor capillosus, Ruminococcus albus, Ruminococcus bromii, Ruminococcus callidus, Ruminococcus flavefaciens, Sporobacter termitidis, Subdoligranulum variabile and other closely related yet uncultured bacteria
- In this connection "non-pathogenic bacteria" means bacteria that is not harmful to an individual. Especially bacteria naturally occurring in the intestinal flora of a healthy individual are preferred.
- In this connection phrase "diminished diversity of Clostridium leptum group bacteria" means statistically significant difference between healthy individuals and those with disease (e.g. 17 amplicons against 12 amplicons, respectively).
- In this connection "metabolite" is preferably a lysophospholipid (e.g., lysophosphatidylcholines such as lysoPC(16:0), lysoPC(18:0)), sphingosine-1-phosphate, arachidonic acid, arachidonic acid derived lipid mediators (e.g. prostaglandin E2 or leukotrienes LTA4, LTB4), docosahexanoic acid eicosapentaenoic acid derived lipid mediators (e.g. resolvins such as Resolvin E1 and Resolvin E2, maresins, protectins), branched chain amino acids (valine, isoleucine, leucine) and their ketoacids (e.g. ketoleucine), glutamic acid, .
- In this connection phrases "elevated / decreased metabolite level compared to healthy individual" means that concentration of a metabolite is above / below a set threshold defined in relation to the mean concentration in healthy individual with no islet autoantibodies who are not considered at-risk of
type 1 diabetes. - In one embodiment of the invention the diversity of Clostridium leptum group bacteria in a sample is determined as follows:
- (a) DNA is extracted from a fecal sample
- (b) PCR is performed with primers 5'-GCACAAGCAGTGGAGT-3' and 5'-CGCCCGGGGCGCGCCCCGGGCGGGGCGGGGGCACGGGG GGGTTTTRTCAACGGCAGTC-3' in a total volume of 30 µl containing 1 µl of appropriately diluted template DNA, 0.4 µM of both primers, 0.2 mM dNTP, 1.25 units of Taq polymerase (Invitrogen) in a reaction buffer with 20 mM Tris-HCl (pH 8.4), 50 mM KCl, and 2 mM MgCl2. The PCR program consists of: initial denaturing at 94oC for 5 min, followed by 30 cycles of denaturing at 94oC for 45 s, primer annealing at 60oC for 30 s and elongation at 72oC for 60 s, and a final extension for 30 min at 72oC;
- (c) DGGE analysis is performed using the Dcode Universal Mutation Detection System (BioRad) maintained at 60oC and 85 V for 16 h in 0.5 x TAE buffer (20 mM Tris-acetate, 0.5 mM EDTA, pH 8.0). Samples are loaded onto 8% acrylamide-bisacrylamide (37.5:1) gels with linear denaturing gradients from 30 to 60% (where 100% is 7 M urea and 40% (vol/vol) deionized formamide). The gels are stained with SYBR Green I (Molecular Probes) for 20 min at room temperature and the images are captured with a Gel Doc XR Gel Documentation System (BioRad);
- (d) The DGGE gels are analyzed with the BioNumerics software (Applied Maths BVBA);
- The determination of the serum metabolite can be followed up at several ages of the individual, preferably a child, and the result is compared to control groups of the same age as the child to be diagnosed. Also several serum metabolites can be determined for the child to be diagnosed, and the levels are compared to the levels of said metabolites for control groups.
- In one embodiment the forementioned monitoring of one or more serum metabolites is combined with monitoring of emergence of autoimmunity in the child and / or determination of genetic risk for development of
type 1 diabetes. - Our first objective was to validate whether the NOD mouse was a good model of
type 1 diabetes able to recapitulate the lipidomic-based metabolic phenotypes observed in the longitudinal study of children who later progressed to T1D (Type 1 Diabetes Prediction and Prevention project; DIPP)2,8. Hence we performed a murine study using NOD mice and recapitulated the protocol used in human studies (Study 1). A total of 70 NOD/Bom mice (26 female) were monitored weekly with serum collection fromage 3 weeks until either (a) the development of diabetes (progressor group), or (b) followed until 36 weeks of age in females and 40 weeks in males in the absence of a diabetic phenotype (non-progressor group) (Fig. 1a ). Similarly as in the DIPP study2, we were primarily interested in early pre-diabetic differences of lipidomic profiles, in mice of the same colony, between diabetes progressors and non-progressors. - Lipidomic analysis using Ultra Performance Liquid Chromatography (UPLC) coupled to mass spectrometry (MS)2 was performed on a complete sample series from 26 female mice (12 progressors, 14 non-progressors) and 13 male (seven progressors, six non-progressors) mice, comprising a total of 1172 samples or 30 samples/mouse on an average (733 samples from female and 439 from male mice), with 154 lipids measured in each sample. When comparing the lipid concentrations of diabetes progressors and non-progressors, the first weeks of life (3-10 weeks) were characterized by an overall lipid-lowering trend among the female progressors, while the period close to the disease onset (15 week and older) was characterized by elevated triacylglycerols and phospholipids (
Fig. 1b ). No such changes were observed in male mice (SupplementaryFig. 1 ). The NOD female progressors had similar levels of glycemia (Fig. 1c ) than the non-progressors but to our surprise the progressors exhibited higher fasting as well as glucose-stimulated plasma insulin levels (Fig. 1d ) despite the fact that no body weight differences were evident between progressors and non-progressors at 10 weeks of age (Fig. 1e ). Together, these results imply that the mice who later progress to diabetes are characterized by enhanced glucose-stimulated insulin secretion (GSIS) at an early age or that they are inappropriately insulin resistant for their degree of body weight. In fact this increased GSIS associated to early evolutive stages towardstype 1 diabetes is consistent with our earlier findings indicating that the children who later progress to diabetes are characterized by low serum ketoleucine and elevated levels of the more insulinotropic aminoacid leucine prior to seroconversion to insulin autoantibody (IAA) positivity2,14. - In order to systematically investigate similarities between of early metabolic phenotypes of autoimmune diabetes progressors in mice and men, we proceeded with comparative analysis of longitudinal lipidomic profiles from female NOD mice and DIPP study children2. However, given the sensitivity of metabolome to both genetic and environmental factors6 and variable disease penetration the lipidomic profiles may individually change at different paces. We recently introduced a concept that the maturation of metabolic profiles with age, such as during normal development or early disease pathogenesis, can be described in terms of metabolic states derived using the Hidden Markov Model (HMM) methodology15. Instead of observing progression of average lipidomic profiles (
Fig. 1b ), our approach allows for each individual's lipidomic profiles to mature at its own pace. Such individual profiles are captured into a set of progressive HMM states (described by mean lipid profiles) using an underlying statistical model. - Here we applied the HMM methodology to study the longitudinal lipidomic profiles of female NOD mice (
Fig. 2a ) and identified a three-state HMM to describe the progression of metabolic states at early ages (3-10 weeks) (Fig. 2b ). The first two states, corresponding to mean ages of approximately 4 weeks and 6 weeks, respectively, were characterized by decreased phospholipids and triacylglycerols among the progressors (Fig. 2c ). A three-state HMM model of similar characteristics to the murine model was also applied to the complete lipidomics data from the longitudinal study of children who progressed to T1D2. The nested case-control study included 56 T1D progressors and 73 matched non-progressors, comprising a total of 1196 samples or 9.3 samples per child on average between birth and diabetes onset (in progressors). As in female NOD mice, the first state corresponding to first year of life was characterized by low triacylglycerols and specific phospholipids (SupplementaryFig. 2 ). - The similarity of state progression in children (Supplementary
Fig. 2 ) and female NOD mice (Fig. 2c ) presenting with diabetes suggests that the early disease stages as reflected in the lipidomes share similar metabolic perturbations. However, it is always a challenge to compare species which exhibit differences in systemic lipid metabolism as well as diet related effects on the lipidomic profiles. Consequently the mapping of molecular lipids between mouse and man may not be trivial. In order to compare progression of mouse and human lipidomic profiles we applied a new mapping algorithm that captures their dependencies across the two species16. By using this strategy it is possible to compare lipidomic profiles across the species, and we sought the disease effect by a two-way analysis on progressors/non-progressors vs. men/mice. We uncovered associations of functionally and structurally related lipids between the species (Fig. 2d ) and confirmed strong association of diminished phospholipids with the development of the disease at an early age (HMM state 1). We can thus conclude that the lipid changes seen in children prior to the first seroconversion to islet autoantibodies are also characteristic of the early changes in female NOD mice progressors. - Seroconversion to islet autoantibody positivity is associated with transiently elevated lysophosphatidylcholine (lysoPC) serum levels in children who subsequently progress to TID2. Here we measured the IAA levels in NOD mice at 8 weeks of age and similarly confirmed that the IAA-negative (IAA-) progressor female NOD mice had elevated lysoPC as compared to IAA- non-progressors (Fig. If). Intriguingly, IAA positivity had the opposite association with diabetes progression since the IAA-positive (IAA+) mice with high lysoPC were protected from diabetes (
Fig. 1f ). It can be speculated that due to their opposite association with disease progression IAA measurement in combination with lysoPC may help stratify the NOD mice according to their risk of developing diabetes. We derived a surrogate marker by combining autoantibody positivity and lysoPC concentration, which reasonably well discriminated between progressors and non-progressors (χ2=5.75, Pχ 2 =0.0044; SupplementaryFig. 3 ), with the NOD mice in the assigned "High-risk" group being at 4.3-fold higher risk (95% lower tolerance bound = 2.6, as calculated from 1000-fold resampling) of developing autoimmune diabetes as compared to the mice in the "Low-risk" group. - In an independent experiment normoglycemic female NOD mice from the same colony as in the first experiment were sacrificed at 8 (n=57) or 19 (n=14) weeks of age and blood, liver and pancreas samples were collected (Study 2). We selected sixteen 8-week-old mice (seven were IAA+) and thirteen 19-week-old mice (six were IAA+) for UPLC/MS based serum lipidomics analysis for subsequent risk stratification using the algorithm described above. Mice at high risk of developing diabetes showed a tendency towards more severe insulitis (
Fig. 3a ). In parallel liver and islet transcriptomics was performed for 19-week-old mice. When comparing high- and low-risk mice, independent of IAA level, the pathway analysis of islet gene expression data using Gene Set Enrichment Analysis (GSEA)17 expectedly revealed upregulation of several apoptotic and immunoregulatory pathways in the high-risk group (Table 1). These pathways were associated with the autoimmune status, as they were also upregulated when comparing IAA+ and IAA- mice independent of diabetes risk. Some of the upregulated gene products of these pathways are known to be implicated in progression to autoimmune diabetes, including CD3 from the CTLA4 pathway18, pro-inflammatory chemokine CCL5 (or RANTES) from the toll like receptor signalling pathway19,20 and the IL-7 pathway21.Table 1. Pathway analysis in female NOD mouse islets. Up to 10 most significantly affected pathways are shown at False Discovery Rate (FDR) q<0.25 for two different comparisons: (1) High (HR) vs. low diabetes risk (LR) and (2) IAA positive LR vs. other. Transcriptomics was performed in the islets of n=10 19-week old female NOD mice (three IAA+ LR, two IAA- LR, two IAA+ HR, three IAA- HR). N, number of genes in the pathway; NES, normalized enrichment score; Source, gene list source. N NES FDR q Source Upregulated in progressors, associated with IAA positivity HIVNEFPATHWAY 53 2,32 0,000000 BioCarta HSA04650_NATURAL_KILLER_CELL_MEDIATED_CYTOTOXICITY 94 2,21 0,000157 KEGG APOPTOSIS_GENMAPP 40 2,18 0,000307 GenMAPP CELL_CYCLE_KEGG 79 2,16 0,00041 GenMAPP HSA04660_T_CELL_RECEPTOR_SIGNALING_PATHWAY 90 2,15 0,000413 KEGG IL7PATHWAY 16 2,04 0,00166 BioCarta APOPTOSIS 63 2,03 0,001676 GenMAPP CTLA4PATHWAY 16 2,02 0,0019 BioCarta HSA03022_BASAL_TRANSCRIPTION_FACTORS 30 2 0,002515 KEGG HSA04662_B_CELL_RECEPTOR_SIGNALING_PATHWAY 59 2 0,002531 KEGG Upregulated in progressors, not associated with IAA positivity HSA00240_PYRIMIDINE_METABOLISM 82 2,12 0,000763 KEGG RIBOSOMAL_PROTEINS 71 2,03 0,001743 GenMAPP HSA04610_COMPLEMENT_AND_COAGULATION_CASCADES 62 1,92 0,004885 KEGG NKCELLSPATHWAY 18 1,9 0,005527 BioCarta CARM_ERPATHWAY 24 1,89 0,006187 BioCarta HSA00100_BIOSYNTHESIS_OF_STEROIDS 21 1,88 0,006819 KEGG HSA00230_PURINE_METABOLISM 135 1,87 0,00801 KEGG KREBS_TCA_CYCLE 28 1,85 0,009439 GenMAPP INTRINSICPATHWAY 22 1,82 0,011212 BioCarta GLYCOLYSIS_AND_GLUCONEOGENESIS 38 1,81 0,012117 GenMAPP Downregulated in IAA positive non-progressors OXIDATIVE_PHOSPHORYLATION 56 -1,76 0,080640 GenMAPP KREBS_TCA_CYCLE 28 -1,66 0,129344 GenMAPP MITOCHONDRIAL_FATTY_ACID_BETAOXIDATION 15 -1,61 0,152160 GenMAPP HSA03010_RIBOSOME 55 -1,57 0,163501 KEGG HSA00480_GLUTATHIONE_METABOLISM 34 -1,45 0,196112 KEGG HSA00280_VALINE_LEUCINE_AND_ISOLEUCINE_DEGRADATION 40 -1,46 0,196296 KEGG Upregulated in IAA positive non-progressors ST_INTEGRIN_SIGNALING_PATHWAY 78 2,06 0,000774 STKE HSA05211_RENAL_CELL_CARCINOMA 67 1,99 0,001681 KEGG INTEGRIN_MEDIATED_CELL_ADHESION_KEGG 90 1,95 0,002570 GenMAPP IL6PATHWAY 19 1,95 0,002717 BioCarta SA_PTEN_PATHWAY 16 1,85 0,005938 SigmaAldrich ST_INTERLEUKIN_4_PATHWAY 23 1,84 0,006384 STKE SIG_CHEMOTAXIS 44 1,77 0,011176 SignalingAlliance CELL_GROWTH_AND_OR_MAINTENANCE 58 1,75 0,012905 GO ECMPATHWAY 20 1,73 0,015894 BioCarta RAC1PATHWAY 22 1,68 0,021239 BioCarta - Several upregulated pathways in high-risk mice were not associated with the IAA titer. These pathways associated with high risk of developing diabetes were mainly metabolic pathways and included upregulated genes from TCA cycle and glycolysis/gluconeogenesis (Table 1). In order to directly measure the metabolic products of these pathways, we performed metabolomic analysis of islets using two-dimensional gas chromatography coupled to time-of-flight mass spectrometry (GCxGC-TOFMS)22. Metabolomics confirmed dysregulation of energy and amino acid metabolism in the islets of high-risk mice (
Fig. 3b ), as several key metabolites of these pathways were found upregulated, including glutamic and aspartic acids, as well as at a marginal significance level all three branched chain amino acids (BCAAs). These elevated amino acids are known insulin secretagogues in β-cells23. The top ranking gene in this pathway, Glucose-6-phosphatase, catalytic, 2 (G6PC2; fold change high- vs. low-risk group +11%, P=0.0034), controls the release of glucose from liver into the bloodstream. However, the animals included in this study, as in the earlier longitudinal study, were normoglycemic and there were no differences in body weight between the two groups. The metabolic changes in β -cells and liver can thus explain the observed elevated GSIS in mice at high risk for developing autoimmune diabetes (Figs. 1c-e ). - There is evidence from clinical studies that insulin resistance is a risk factor for progression to T1D24,25. It is also known that the NOD genetic background may predispose the mice to insulin resistance26. To test for insulin resistance as a potential explanation for the observed metabolic phenotype of high-risk mice, we performed two independent studies in another NOD colony where (Study 3) n = 36 female NOD/MrkTac mice were tested for GSIS, glucose and insulin tolerance, and plasma leptin between 8 and 11 weeks of age; and (Study 4) n = 42 female NOD/MrkTac were sacrificed at 10 weeks of age and tested for insulitis, plasma leptin and adiponectin. As before, serum lipidomics and IAA assays were performed to stratify the mice into high- and low-diabetes-risk groups.
- We confirmed the elevated GSIS in high risk mice (
Fig. 4a ) but found no significant difference in glucose responses to intraperitoneal glucose or insulin between the groups (Figs. 4b-c ), in the Homeostatic model assessment (HOMA-IR) index or GLUT4 expression in white adipose tissue and muscle (SupplementaryFig. 4a-c ). In agreement with the results from older mice (Fig. 3a ), the 10-week old female NOD mice at higher risk of developing diabetes have already signs of more insulitis than their low-risk counterparts, although the average degree of insulitis is mild in both groups (Fig. 4d ). Surprisingly, the adipose tissue derived hormones leptin (Fig. 4e ) and adiponectin (Fig. 4f ) were both elevated in plasma of high-risk mice despite no significant differences in weight or adiposity (SupplementaryFig. 4d-f ). - We recently found that serum metabolome of germ-free mice is similar to pre-autoimmune metabolomes of children who later progress to T1D27, thus implying that gut microbiota of T1D progressors may be devoid of important constituents or has an impaired function that predisposes the children to T1D. Given the observed similarities of metabolomes of diabetes progressors in mice and men (
Fig. 2 ), we found that the observed metabolic differences between the high- and low-risk mice may be reflected in differences of their gut microbial composition. - We characterized the microbial composition of caecum samples from high- and low-risk mice from
Study 2 using denaturing gradient gel electrophoresis (DGGE) as previously described28,29. We indeed found that the total bacterial composition was more coherent in low-risk mice than in the high-risk mice (SupplementaryFig. 5 ) and bacteria of high-risk mice had significantly diminished diversity of the Clostridium leptum group of the Firmicutes phylum (Fig. 3c ). - Given that the metabolic profile is normalized in children following the seroconversion2, we proposed earlier that generation of autoantibodies may be a physiological response to early metabolic disturbances. In the present study (mice from Study 2), we investigated the pathways in the IAA+ low-risk female mice and compared them to all other groups. The IAA+ low-risk mice were characterized by several elevated signaling pathways in the islets including the IL-4 and IL-6 pathways (Table 1). IL-4 is known to be protective from diabetes in NOD mouse30. Conversely IAA+ low-risk mice had reduced expression of pathways mainly related to mitochondrial function and TCA cycle, BCAA catabolism, beta oxidation and oxidative phosphorylation. It is unclear how downregulation of these pathways may protect against T1D. However downregulation of these pathways will lead to a state of reduced production of reactive oxygen species (ROS)31 which may explain at least in part the conserved β -cell functionality. This would offer a potential protective mechanism linking decreased ROS production to the prevention of β-cell apoptosis in IAA+ mice which do not progress to diabetes. Our results stress the need for similar studies in terms of protection from diabetes in individuals who seroconverted but did not progress to overt disease.
- This study emphasize the translatability of the our previous findings from the large-scale clinical study2 into the tissue-specific context. Also, our study highlights that specific metabolic disturbances are identifiable early on during the evolutive stages and could potentially be linked to pathogenic mechanisms implicated in the progression to autoimmune diabetes (Supplementary
Fig. 6 ). - Our study implicates that diminished diversity of specific bacterial groups such as C. leptum is associated with the early metabolic disturbances. The fact that the diabetes-associated differences in microbial composition were observed among the mice of the same colony suggests that the observed diminished microbial diversity is likely a consequence of immunological or metabolic response. Microbial communities are sensitive to disturbances and may subsequently not return to the their original state44 and diminished diversity of gut microbiota has been found e.g. in obesity45. Interestingly, diminished diversity of the anti-inflammatory commensal bacterium Faecalibacterium prausnitzii from the C. leptum subgroup characterizes also Crohn's disease46.
- The invention is illustrated by the following non-limiting examples. It should be understood, however, that the embodiments given in the description above and in the examples are for illustrative purposes only, and that various changes and modifications are possible.
- All experimental procedures were approved by the Committee for Laboratory Animal Welfare, University of Turku. The mice were kept in an animal room maintained at 21 ± 1°C with a fixed 12:12 h light-dark cycle. Standard rodent chow (Special Diet Services, Witham, UK) and water were available ad libitum. The colonies of NOD/Bom mice used were bred and maintained in the animal facilities of University of Turku and originated from mice purchased from Taconic Europe (Ry, Denmark). 26 female and 44 male NOD mice (Study 1) underwent weekly blood sampling by venopuncture from the tail vein starting at 3 weeks of age until the mice developed diabetes (blood glucose ≥ 14.0 mmol/ in two consecutive weeks) or until female mice reached 36 weeks and
male mice 40 weeks of age. Serum was separated and quickly frozen in -70°C for metabolomic analysis. Blood samples for detection of insulin autoantibodies (IAA) were collected from tail vein at the age of 8 weeks. Plasma samples for insulin were collected between noon and 2 PM after 4 h fast and two days later 5 minutes after intraperitoneal glucose (1 g/kg) administration at the age of 10 weeks. Another set of euglycemic NOD/Bom female mice (Study 2) was sacrificed with decapitation under CO2 anesthesia at the age of 8 weeks (n = 57) or 19 weeks (n = 14), and blood, liver and pancreas samples were collected. - Two separate batches (n = 36 and 42,
Studies 3 and 4) of female NOD/MrcTac were delivered from Taconic USA (Hudson, NY, USA) at 5 weeks of age. InStudy 3, intraperitoneal glucose tolerance test was performed after 4 h fast at 8 weeks of age by administering glucose (10% [wt/vol], 1 g/kg body weight) and measuring tail vein blood glucose and serum insulin. Serum samples for lipidomics and IAA were collected from tail vein at 10 weeks of age. Intraperitoneal insulin tolerance test was performed after 1 h fast at 11 weeks of age by administering human insulin (1.0 IU/kg body weight, Protaphane, Novo Nordisk, Bagsvaerd, Denmark). InStudy 4, mice were sacrificed at 10 weeks of age after 4 h fast by cardiac puncture under anesthesia. Gonadal white adipose tissue (WAT) depot was carefully dissected and weighted, and was used as a marker of adiposity. Serum samples for IAA, lipidomics and adipokine panel assays, gonadal WAT, gastrocnemius muscle and pancreas samples were collected, and stored at -70°C until analyses. HOMA-IR, an estimate of insulin resistance, was calculated as fasting insulin (µIU/ml) × fasting glucose (mmol/l)/22.5. Statistical significances were analyzed with Student's t-test or two-way ANOVA usingGraphPad Prism 4. - Blood glucose was measured with Precision Xtra™ Glucose Monitoring Device (Abbott Diabetes Care, IL). Plasma insulin was analyzed with Mouse Ultrasensitive ELISA kit (Mercodia, Uppsala, Sweden) or together with leptin with Milliplex Mouse Adipokine Panel (Millipore, Billerica, MA, USA). Plasma adiponectin was measured with Mouse Adiponectin ELISA kit from Millipore.
- Pancreatic islets were isolated using Ficoll 400 (Sigma-Aldrich, St Louis, MI, USA) gradient method1a. In brief, the pancreata were incubated with Collagenase P (0,5 mg/ml, Roche Diagnostics, Mannheim, Germany) in HBSS containing 10 mM HEPES, 1 mM MgCl2, 5mM Glucose, pH 7.4 for 17 min. After two rounds of washing, the pellet was resuspended in
Ficoll 25%, and the densities 23%, 20% and 11% were layered on top. After centrifuge, the islet layer between densities 23% and 20% was collected and washed twice before snap_freezing the pellet for metabolomics or homogenization in lysis buffer for RNA extraction. Samples were stored in -70°C until analyses. - Pancreata from euglycemic NOD mice were cryosectioned. 5 µm sections with > 20 µm intervals were stained with hematoxylin & eosin and graded for insulitis as follows: 0, no visible infiltration, I peri-insulitis, II insulitis with < 50% and III insulitis with > 50% islet infiltration. Total 678 islets from 8 female 10-week-old low-risk mice (60-123 islets/each) and 633 islets from 8 high-risk mice (59-102 islets/each), and 52 islets from 4 female 19-week-old low-risk mice (11-17 islets/each) and 28 islets from 3 high-risk mice (7-10 islets/each) were graded. Statistical significance was analyzed with Student's t-test or Chi Square test using
GraphPad Prism 4. - Murine IAA were measured by a radiobinding microassay (RIA) with minor modifications to that previously described for human IAA2a. Mouse sera (2.5 µl) and serial dilutions of standard samples (5 µl) of a serum pool obtained from persons with a high IAA titer were incubated for 72 h with 15,000 cpm mono125I-(TyrA14)-insulin (Amersham, GE Healthcare, Buckinghamshire, UK) in the presence or absence of an excess of unlabeled human recombinant insulin (Roche Diagnostics, Mannheim, Germany). Antibody complexes were precipitated by adding 50 µl TBT buffer (50 mM Tris,
pH - Serum samples (10 µl) in Eppendorf tubes were spiked with a standard mixture containing 10 lipid compounds at a concentration level of 0.2 µg/sample, and mixed with 10 µl of 0.9% sodium chloride and 100 µl of chloroform:methanol (2:1). After 2 min vortexing and 1 h standing the samples were centrifuged at 10000 rpm for 3 min and 60 µl of the lower organic phase was taken to a vial insert and spiked with 20 µl of three labelled lipid standards at a concentration level of 0.2 µg/sample.
- The lipidomics runs were performed on a Waters Q-Tof Premier mass spectrometer combined with an Acquity Ultra Performance LC™ (UPLC; Milford MA). The solvent system consisted of 1) water with 1% 1M NH4Ac and 0.1% HCOOH and 2) LC/MS grade acetonitrile/isopropanol (5:2) with 1% 1M NH4Ac, 0.1% HCOOH. The gradient run from 65% A / 35% B to 100% B took 6 min and the total run time including a 5 min reequilibration step was 18 min. The column (at 50 °C) was an Acquity UPLC™BEH C18 (1 × 50 mm, 1.7 µm particles) and the flow rate was 0.200 ml/min. The lipids were profiled using ESI+ mode and the data collected at a mass range of m/z 300-1200. The data was processed by using MZmine software (version 0.60)3a,4a and the lipid identification was based on an internal spectral library5.
- Depending on the protein concentrations of PBS buffered cell solutions, 20-40 µL samples were taken for islet metabolomic analysis. 10 µL of an internal standard labeled palmitic acid-16,16,16-d3 (250 mg/L) and 400 µL of methanol solvent were added to the sample. After vortexing for 2 min and incubating for 30 min at room temperature, the supernatant was separated by centrifugation at 10,000 rpm for 5 min. The sample was dried under constant flow of nitrogen gas and derivatized with 25 µL of MOX (1 h, 45 °C) and MSTFA (1 h, 45 °C). 5 µL of retention index standard mixture with five alkanes (125 ppm) was added to the metabolite mixture.
- Islet samples were analyzed by two-dimensional gas chromatography coupled to time of flight mass spectrometry (GCxGC-TOF/MS). The instrument used was a Leco Pegasus 4D (Leco Inc., St. Joseph, MI), equipped with an Agilent GC 6890N from Agilent Technologies (Santa Clara, CA) and a CombiPAL autosampler from CTC Analytics AG (Zwingen, Switzerland). The modulator, secondary oven and time-of-flight mass spectrometer were from Leco Inc. The GC was operated in split mode with a 1:20 ratio. Helium with a constant pressure of 39.6 psig was used as carrier gas. The first dimension GC column was a non-polar RTX-5 column, 10 m x 0.18 mm x 0.20 µm (Restek Corp., Bellefonte, PA), coupled to a polar BPX-50 column, 1.50 m x 0.10 mm x 0.10 µm (SGE Analytical Science, Ringwood, Australia). The temperature program was as follows:
initial temperature 50 °C, 1 min → 295 °C, 7 °C/min, 3 min. The secondary oven was set to 20 °C above the oven temperature. Inlet and transfer line temperatures were set to 260 °C. The second dimension separation time was set to 5 s. The mass range used was 45-700 amu and the data collection speed was 100 spectra/second. Raw data were processed using Leco ChromaTOF software, followed by alignment using in-house developed software Mylly. The metabolites were identified by using an in-house reference compound library together with The Palisade Complete Mass Spectral Library, 600K Edition (Palisade Mass Spectrometry, Ithaca, NY). - RNA extraction from islets was carried out with Rneasy minikit (QIAGEN GmbH, Hilden, Germany) and from liver, skeletal muscle (m. gastrocnemius) and gonadal white adipose tissue with Trizol reagent (Invitrogen, Carlsbad, CA) followed by RNase-free DNase I treatment (QIAGEN GmbH) and purification with Rneasy minikit. Pancreatic islets and liver for microarray analysis were collected from 19-week-old euglycemic female NOD/Bom mice. Skeletal muscle and adipose tissue for GLUT4 mRNA expression were collected from 10-week-old female NOD/MrkTac mice.
- GLUT4 mRNA expression in skeletal muscle and gonadal white adipose tissue was measured by quantitative real-time PCR. CDNA synthesis was performed with High Capacity RNA-to-cDNA Kit according to manufacturer's protocol. Real-time PCR was performed with 7300 Real Time PCR system, pre-designed TaqMan® Gene Expression Assay for GLUT4 and TaqMan® Endogenous Control Assay for β-actin. The 20 µl PCR reactions contained 8 µl cDNA, 8 µl TaqMan® Gene Expression Master Mix, 1 µl GLUT4 TaqMan Gene Expression Assay, 1 µl b-actin TaqMan Endogenous control Assay and 2 µl depc water. Cycling parameters for real-time RT-PCR were as follows: 50°C for 2 min, 95°C for 10 min followed by 40 cycles of 95 °C for 15 seconds and 60 °C for one minute. GLUT4 mRNA levels were expressed relative to β-actin, which was used as a housekeeping gene. Relative gene expression was calculated using the comparative CT method and RQ=2-ΔΔCT formula. All reagens from Applied Biosystems (Foster City, CA, USA).
- RNA amplification was performed from 300 ng total RNA with Ambion's (Austin, TX) Illumina RNA TotalPrep Amplification kit (cat no AMIL1791). IVT reaction overnight (14 h), during it cRNA was biotinylated. Both before and after the amplifications the RNA/cRNA concentrations where checked with Nanodrop ND-1000 (Wilmington, DE) and RNA/cRNA quality was controlled by BioRad's Experion electrophoresis station (Hercules, CA).
- Hybridizations. 1.50 µg each sample was hybridized to Illumina's MouseWG-6 Expression BeadChips, version 2 (BD-201-0602) at 58 °C overnight (18 h) according to Illumina Whole-Genome Gene Expression Direct Hybridization protocol, revision A. Hybridization was detected with 1 µg/ml Cyanine3-streptavidine, GE Healthcare Limited (Chalfont, UK) (cat no PA43001). Chips were scanned with Illumina BeadArray Reader, BeadScan software version 3.5. The numerical results were extracted with Illumina's GenomeStudio software v 1.0 without any normalization.
- Preprocessing. Bead Summary data, exported from Illumina's GenomeStudio software, was preprocessed using beadarray package6a of R/Bioconductor7a as follows. Data was transformed to logarithm (base 2), and normalized using quantile method8a, which equalizes the distribution of probe intensities across a set of microarrays.
- Pathway analysis. Gene Set Enrichment Analysis (GSEA)9a, a commonly used pathway analysis technique for microarray gene expression data analysis, uses a Kolmogorov-Smirnov like statistic to test whether selected gene sets are enriched among the most up or down regulated genes. Linear Models for Microarray Data (LIMMA) approach10a identifies differentially expressed genes by fitting a linear model to the expression data of each gene, and computing moderated t-statistic using posterior residual standard deviations to account for the gene-specific variability of expression values. Here, we used the R/Bioconductor packages7a and LIMMA10a for testing differential expression of genes. We then performed pre-ranked GSEA analysis using the moderated t-statistic for ranking the gene list, to test for enrichment of gene sets from a variety of pathway databases such as Gene Ontology (GO)11a, GenMAPP12a, BioCarta (http://www.biocarta.com), Signal Transduction Knowledge Environment (STKE) (http://stke.sciencemag.org/), and KEGG13a curated in Molecular Signatures Database (MSigDB)9a.
- Clustering. Leading edge genes of an enriched pathway are the genes that account for the enrichment signal9a. For selected pathways that are found statistically significant by GSEA, the pathway profiles are calculated as average expression of all leading edge genes. This matrix of pathway profiles of selected pathways was then augmented with selected metabolite profiles. Then the numerical values in this matrix were normalized with the autoantibody-negative non-progressors (IAA- & NP) i.e., each numerical value of a variable is divided by the average values from IAA- & NP samples, and transformed to logarithmic (base 2) scale. Then the variables were scaled for unit variance. Finally, hierarchical clustering was applied using Euclidean metric and complete linkage method14a for computing inter-cluster distances. An R package called gplots (http://www.r-project.org/) was used for the clustering and displaying the numerical values as a heat map.
- DNA was extracted from 300 mg of fecal sample from caecum using FastDNA Spin Kit for Soil (QBIOgene, Carlsbad, CA,) with modifications to the manufacturer's instructions15a. PCR-DGGEs of predominant bacterial PCR-DGGE and group specific PCR-DGGEs (bifidobacteria, Lactobacillus-group, Eubacterium rectale - Blautia coccoides clostridial group (Erec-group), Clostridium leptum clostridial group (Clept group), and genus Bacteroides) were performed as described previously16. The comparison of the profiles and the quantification of the amplicons were performed using BioNumerics software version 5.1 (Applied Maths BVBA, Sint-Martens-Latem, Belgium). The statistical analysis of amplicon numbers was performed with the Student's t-test with unequal variances. Clustering was performed with Pearson correlation from each bacterial group besides using composite datasets in which amplicons with the total surface area of at least 1% were included in the similarity analysis. Principal component analysis was performed with the BioNumerics software.
- R statistical software (http://www.r-project.org/) was used for data analyses and visualization. The concentrations were compared using the Wilcoxon rank-sum test, with p-values <0.05 considered statistically significant. To account for multiple comparisons, false discovery rates among significantly differing lipids were estimated using q-values17a,18a. False discovery rates were computed using the R package q-value. The fold difference was calculated by dividing the median concentration in progressors by the median concentration in nonprogressors and taking the base-2-log of the resulting value. This makes interpretation easy as values greater/smaller than zero correspond to up/down-regulated lipids in the progressor group. In clustering we applied a customized correlation based distance metric

- Metabolic state development in progressors and non-progressors was modeled by separate Hidden Markov Models20a, making it possible to align individuals based on metabolic states instead of age, and to compare the metabolic states in progressors and no-progressors. The modeling assumptions under which the models are fitted to data are that individual mice share a similar developmental progression but the timing of the states may vary, and that metabolite profiles in each state may be different for progressors and non-progressors. Model fitting was done by the standard Baum-Welch algorithm using the MATLAB toolbox by Kevin Murphy (http://people.cs.ubc.ca/∼murphyk/ Bayes/hmm.html). The model structure was validated by the bootstrap in the same way as in our earlier studies20a, and confidence intervals were estimated with non-parametric bootstrap (5000 samples).
- Let X ∈ R N×DX and Y ∈ R M×DY be two data matrices with N and M samples, M ≥ N, and dimensions DX and DY respectively. The task is to find a permutation p of samples in Y such that each sample xi in X is matched with y p(i) in Y, that is, we assume a one-to-one matching of samples between the two data matrices. Since the data matrices do not lie in the same data space, it is not possible to use distance as matching criterion. We have introduced a new methodology based on statistical dependencies between the data sets to solve this problem21. The idea is to compute from the data features or statistical descriptors that maximize statistical dependencies, and do the matching based on the descriptors. In practice, we will project the data onto a lower-dimensional subspace such that the statistical dependencies between the datasets are maximized, and find a matching of samples in this comparable subspace.
- Let


- We use an iterative algorithm to solve this optimization problem. In the first step the projections are computed given a fixed permutation p, and in the second step the permutations are optimized given fixed projections. These two steps are alternated until convergence. In practice, canonical correlation analysis can be used to compute projections given a permutation, and solving the permutation given fixed projections leads to an assignment problem which can be solved using the Hungarian algorithm.
- The method described above can be used to find a matching given any pair of human-mouse datasets. The matching can be further improved by combining solutions obtained by several human-mouse dataset pairs to give a consensus matching. For simplicity we assume that the pairs of human-mouse datasets are independent samples, which holds approximately assuming a large number of datasets.
- In order to combine different matching solutions, we create a contingency table based on all observed matching solutions. The lipids of the two species are the labels of rows and columns of the contingency table, and each cell gives the count of how many times the corresponding lipids in the two species have been paired in the observed matching solutions. Finding the consensus pairing given the contingency table reduces to finding a maximum bipartite matching between the rows and columns of the contingency table. This can again be solved by using the Hungarian algorithm.
- In order to find disease effects shared by NOD mice and humans in the DIPP study, we first paired metabolites of the two organisms, then estimated the metabolic states of progressor and non-progressor men and mice by HMMs, and finally did a bootstrap-based two-way analysis on progressors/non-progressors vs. men/mice to identify disease and organism effects and their interactions. The data-driven pairing or the metabolites and the four HMMs were computed as described above. The two-way analysis of disease effect was done by first removing the organism effect, represented with a single mean parameter estimated by least squares, and then computing bootstrap confidence intervals for the disease effect of pooled men and mice. Organism and cross effects were estimated analogously.
-
- 1. Achenbach, P., Bonifacio, E., Koczwara, K. & Ziegler, A.-G. Natural history of ).
- 2. Oresic, M. et al. Dysregulation of lipid and amino acid metabolism precedes islet autoimmunity in children who later progress to type 1 diabetes. J. Exp. Med. 205, 2975-2984 (2008).
- 3. Gale, E. A. M. The rise of ).
- 4. Harjutsalo, V., Sjöberg, L. & Tuomilehto, J. Time trends in the incidence of ).
- 5. Patterson, C. C. et al. Incidence trends for ).
- 6. Oresic, M., Vidal-Puig, A. & Hänninen, V. Metabolomic approaches to phenotype characterization and applications to complex diseases. Expert Rev. Mol. Diagn. 6, 575-585 (2006).
- 7. Hagopian, W. A. et al. TEDDY - the environmental determinants of diabetes in the young: an observational clinical trial. Ann. NY Acad. Sci. 1079, 320-326 (2006).
- 8. Kupila, A. et al. Feasibility of genetic and immunological prediction of ).
- 9. Anderson, M. S. & Bluestone, J. A. The NOD mouse: a model of immune dysregulation. Annu. Rev. Immunol. 23, 447-485 (2005).
- 10. Atkinson, M. A. & Leiter, E. H. The NOD mouse model of ).
- 11. Chervonsky, A. V. Influence of microbial environment on autoimmunity. Nat. Immunol. 11, 28-35 (2010).
- 12. Singh, B. & Rabinovitch, A. Influence of microbial agents on the development and prevention of autoimmune diabetes. ).
- 13. Wen, L. et al. Innate immunity and intestinal microbiota in the development of ).
- 14. Floyd, J. C. J., Fajans, S. S., Knopf, R. F. & Conn, J. W. Evidence that insulin release is the mechanism for experimentally induced leucine hypoglycemia in man. J. Clin. Invest. 42, 1714-1719 (1963).
- 15. Nikkilä, J. et al. Gender dependent progression of systemic metabolic states in early childhood. Mol. Syst. Biol. 4, e197 (2008).
- 16. Tripathi, A., Klami, A. & Kaski, S.,Using dependencies to pair samples for multi-view learning. In TKK Reports in Information and Computer Science, Report No. TKK-ICS-R8 (2008).
- 17. Subramanian, A. et al. Gene set enrichment analysis: A knowledge-based approach for interpreting genome-wide expression profiles. Proc. Nat. Acad. Sci. U S A 102, 15545-15550 (2005).
- 18. Keymeulen, B. et al. Insulin needs after CD3-Antibody therapy in new-).
- 19. Eizirik, D. L., Moore, F., Flamez, D. & Ortis, F. Use of systems biology approach to understand pancreatic {beta}-cell death in ).
- 20. Zhernakova, A. et al. Genetic variants of RANTES are associated with serum RANTES level and protection for ).
- 21. Calzascia, T. et al. CD4 T cells, lymphopenia, and IL-7 in a multistep pathway to autoimmunity. Proc. Natl. Acad. Sci. USA 105, 2999-3004 (2008).
- 22. Welthagen, W. et al. Comprehensive two-dimensional gas chromatography time-of-flight mass spectrometry (GC-GC-TOF) for high resolution metabolomics: biomarker discovery on spleen tissue extracts of obese NZO compared to lean C57BL/6 mice. ).
- 23. Newsholme, P., Brennan, L. & Bender, K. Amino acid metabolism, {beta}-cell function, and diabetes. Diabetes 55, S39-47 (2006).
- 24. Fourlanos, S. et al. Insulin resistance is a risk factor for progression to ).
- 25. Xu, P. et al. Role of insulin resistance in predicting progression to type 1 diabetes. ).
- 26. Chaparro, R. J. et al. Nonobese diabetic mice express aspects of both ).
- 27. Velagapudi, V. R. et al. The gut microbiota modulates host energy and lipid metabolism in mice. J. Lipid Res. 51, 1101-1112 (2010).
- 28. Maukonen, J. et al. Prevalence and temporal stability of selected clostridial groups in irritable bowel syndrome in relation to predominant faecal bacteria. J Med Microbiol 55, 625-633 (2006).
- 29. Maukonen, J., Matto, J., Suihko, M.-L. & Saarela, M. Intra-individual diversity and similarity of salivary and faecal microbiota. J. Med. Microbiol. 57, 1560-1568 (2008).
- 30. Rapoport, M. et al. ).
- 31. Ott, M., Gogvadze, V., Orrenius, S. & Zhivotovsky, B. Mitochondria, oxidative stress and cell death. Apoptosis 12, 913-922 (2007).
- 32. Seufert, J. et al. Leptin suppression of insulin secretion and gene expression in human pancreatic islets: implications for the development of adipogenic diabetes mellitus. J Clin Endocrinol Metab 84, 670-676 (1999).
- 33. Kadowaki, T. et al. Adiponectin and adiponectin receptors in insulin resistance, diabetes, and the metabolic syndrome. J. Clin. Invest. 116, 1784-1792 (2006).
- 34. Truyen, I. et al. Adiponectin levels do not predict clinical onset of ).
- 35. Matarese, G., Leiter, E. H. & Cava, A. L. Leptin in autoimmunity: many questions, some answers. ).
- 36. De Rosa, V. et al. A key role of leptin in the control of regulatory T cell proliferation. Immunity 26, 241-255 (2007).
- 37. Lord, G. M. et al. Leptin modulates the T-cell immune response and reverses starvation-induced immunosuppression. Nature 394, 897-901 (1998).
- 38. Ozata, M., Ozdemir, I. C. & Licinio, J. Human leptin deficiency caused by a missense mutation: multiple endocrine defects, decreased sympathetic tone, and immune system dysfunction indicate new targets for leptin action, greater central than peripheral resistance to the effects of leptin, and spontaneous correction of leptin-mediated defects. J. Clin. Endocrinol. Metab. 84, 3686-3695 (1999).
- 39. Matarese, G. et al. Leptin accelerates autoimmune diabetes in female NOD mice. ).
- 40. Ozcan, L. et al. Endoplasmic reticulum stress plays a central role in development of leptin resistance. Cell Metab. 9, 35-51 (2009).
- 41. Eizirik, D. L., Colli, M. L. & Ortis, F. The role of inflammation in insulitis and {beta}-cell loss in ).
- 42. Hypponen, E. et al. Obesity, increased linear growth, and risk of ).
- 43. Kimm, S. Y. S. & Obarzanek, E. Childhood obesity: a new pandemic of the new millennium. Pediatrics 110, 1003-1007 (2002).
- 44. Allison, S. D. & Martiny, J. B. H. Resistance, resilience, and redundancy in microbial communities. Proc. Natl. Acad. Sci. USA 105, 11512-11519 (2008).
- 45. Turnbaugh, P. J. et al. A core gut microbiome in obese and lean twins. Nature 457, 480-484 (2009).
- 46. Sokol, H. et al. Faecalibacterium prausnitzii is an anti-inflammatory commensal bacterium identified by gut microbiota analysis of Crohn disease patients. Proc. Natl. Acad. Sci. USA 105, 16731-16736 (2008).
- 47. Storey, J. D. A direct approach to false discovery rates. J. R. Stat. Soc. B 64, 479-498 (2002).
-
- 1a. Szot, G. L., Koudria, P. & Bluestone, J. A. Murine pancreatic islet isolation. J. Vis. Exp., 255 (2007).
- 2a. Ronkainen, M. S. et al. Pregnancy induces nonimmunoglobulin insulin-binding activity in both maternal and cord blood serum. Clin. Exp. Immunol. 124, 190-196 (2001).
- 3a. Katajamaa, M., Miettinen, J. & Oresic, M. MZmine: toolbox for processing and visualization of mass spectrometry based molecular profile data. ).
- 4a. Katajamaa, M. & Oresic, M. Processing methods for differential analysis of LC/MS profile data. ).
- 5a. Yetukuri, L. et al. Bioinformatics strategies for lipidomics analysis: characterization of obesity related hepatic steatosis. BMC Syst. Biol. 1, e12 (2007).
- 6a. Dunning, M. J., Smith, M. L., Ritchie, M. E. & Tavare, S. beadarray: R classes and methods for Illumina bead-based data. Bioinformatics 23, 2183-2184 (2007).
- 7a. Gentleman, R. et al., Bioinformatics and computational biology solutions using R and Bioconductor. (2005).
- 8a. Bolstad, B. M., Irizarry, R. A., Astrand, M. & Speed, T. P. A comparison of normalization methods for high density oligonucleotide array data based on variance and bias. Bioinformatics 19, 185-193 (2003).
- 9a. Subramanian, A. et al. Gene set enrichment analysis: A knowledge-based approach for interpreting genome-wide expression profiles. Proc. Nat. Acad. Sci. U S A 102, 15545-15550 (2005).
- 10a. Smyth, G. K. Linear models and empirical bayes methods for assessing differential expression in microarray experiments. Stat. Appl. Genet. Mol. Biol. 3, doi: 10.2202/1544-6115.1027 (2004).
- 11a. Ashburner, M. et al. Gene ontology: tool for the unification of biology. Nat. Genet. 25, 25 - 29 (2000).
- 12a. Salomonis, N. et al. GenMAPP 2: new features and resources for pathway analysis. ).
- 13a. Kanehisa, M. et al. KEGG for linking genomes to life and the environment. Nucl. Acids Res. 36, D480-484 (2008).
- 14a. Jain, A. K., Murty, M. N. & Flynn, P. J. Data clustering: a review. Algorithms for ).
- 15a. Maukonen, J. et al. Prevalence and temporal stability of selected clostridial groups in irritable bowel syndrome in relation to predominant faecal bacteria. J Med Microbiol 55, 625-633 (2006).
- 16a. Maukonen, J., Matto, J., Suihko, M.-L. & Saarela, M. Intra-individual diversity and similarity of salivary and faecal microbiota. J. Med. Microbiol. 57, 1560-1568 (2008).
- 17a. Storey, J. D. A direct approach to false discovery rates. J. R. Stat. Soc. B 64, 479-498 (2002).
- 18a. Storey, J. D. & Tibshirani, R. Statistical significance for genomewide studies. Proc. Natl. ).
- 19a. Sharma, S., Applied multivariate techniques, Har/Dis edition ed. (Wiley, 1995).
- 20a. Nikkilä, J. et al. Gender dependent progression of systemic metabolic states in early childhood. Mol. Syst. Biol. 4, e197 (2008).
- 21a. Tripathi, A., Klami, A. & Kaski, S.,Using dependencies to pair samples for multi-view learning. In TKK Reports in Information and Computer Science, Report No. TKK-ICS-R8 (2008).
-
- 1b. Oresic, M. et al. Dysregulation of lipid and amino acid metabolism precedes islet autoimmunity in children who later progress to type 1 diabetes. J. Exp. Med. 205, 2975 (2008).
- 2b. Subramanian, A. et al. Gene set enrichment analysis: A knowledge-based approach for interpreting genome-wide expression profiles. Proc. Nat. Acad. Sci. U S A 102, 15545 (2005).
- 3b. Storey, J. D. A direct approach to false discovery rates. J. R. Stat. Soc. B 64, 479 (2002).
- 4b. Welthagen, W. et al. Comprehensive two-dimensional gas chromatography time- of flight mass spectrometry (GC-GC-TOF) for high resolution metabolomics: biomarker discovery on spleen tissue extracts of obese NZO compared to lean C57BL/6 mice. ).
-
- <110> TEKNOLOGIAN TUTKIMUSKESKUS VTT
- <120> METHOD FOR DIAGNOSING RISK OF
TYPE 1 DIABETES AND FOR PREVENTING ONSET OFTYPE 1 DIABETES - <130> VTT285PCT
- <160> 2
- <170> PatentIn version 3.4
- <210> 1
<211> 16
<212> DNA
<213> Artificial - <220>
<223> primer - <400> 1
gcacaagcag tggagt 16 - <210> 2
<211> 58
<212> DNA
<213> Artificial - <220>
<223> primer - <400> 2
cgcccggggc gcgccccggg cggggcgggg gcacgggggg gttttrtcaa cggcagtc 58
Claims (4)
- A method for diagnosing a risk of type 1 diabetes in an individual comprising the steps of(a) providing a fecal sample from said individual;(b) analyzing diversity of the Clostridium leptum group of said sample, the Clostridium leptum group including Acetanaerobacterium elongatum, Anaerophilum agile, Anaerofilum pentosovorans, Anaerotruncus colihominis, Butyricoccus pullicaecorum, Clostridium cellulosi, Clostridium leptum, Clostridium methylpentosum, Clostridium orbiscindens, Clostridium sporosphaeroides, Clostridium viride, Ethanoligenes harbinense, Eubacterium desmolans, Eubacterium siraeum, Eubacterium plautii, Faecalibacterium prausnitzii, Hydrogenoanaerobacterium saccharovorans, Oscillibacter valericigenes, Papillibacter cinnamivorans, Pseudoflavonifractor capillosus, Ruminococcus albus, Ruminococcus bromii, Ruminococcus callidus, Ruminococcus flavefaciens, Sporobacter termitidis, and Subdoligranulum variabile;(c) comparing the result to control samples obtained from healthy individuals who are not considered at-risk of type 1 diabetes;(d) determining the difference between said sample and the control samples,
wherein diminished diversity of Clostridium leptum group bacteria in said individual as compared to the control samples indicates an increased risk of type 1 diabetes. - The method of claim 1, wherein the diversity of Clostridium leptum group bacteria in a sample is determined as follows:(a) DNA is extracted from a sample(b) PCR is performed with primers 5'-GCACAAGCAGTGGAGT-3' and 5'-CGCCCGGGGCGCGCCCCGGGCGGGGCGGGGGCACGGGG GGGTTTTRTCAACGGCAGTC-3'(c) DGGE analysis is performed using acrylamide-bisacrylamide (37.5:1) gels with linear denaturing gradients(d) The DGGE gels are analyzed,
wherein diminished diversity of Clostridium leptum group bacteria indicates an increased risk of type 1 diabetes. - The method of claim 1 or 2, wherein genetic background of an individual is estimated.
- The method of any preceding claims, wherein said individual has an increased risk of type 1 diabetes or is susceptible for developing type 1 diabetes.
Applications Claiming Priority (3)
| Application Number | Priority Date | Filing Date | Title |
|---|---|---|---|
| FI20105478A FI20105478A0 (en) | 2010-04-30 | 2010-04-30 | Procedure for Diagnosing Type 1 Diabetes and Procedures and Compositions for Preventing Type 1 Diabetes Outbreak |
| US33052310P | 2010-05-03 | 2010-05-03 | |
| PCT/FI2011/050399 WO2011135194A2 (en) | 2010-04-30 | 2011-05-02 | Method for diagnosing risk of type 1 diabetes and for preventing onset of type 1 diabetes |
Publications (3)
| Publication Number | Publication Date |
|---|---|
| EP2563930A2 EP2563930A2 (en) | 2013-03-06 |
| EP2563930A4 EP2563930A4 (en) | 2013-08-28 |
| EP2563930B1 true EP2563930B1 (en) | 2015-11-25 |
Family
ID=42133316
Family Applications (1)
| Application Number | Title | Priority Date | Filing Date |
|---|---|---|---|
| EP11774490.4A Not-in-force EP2563930B1 (en) | 2010-04-30 | 2011-05-02 | Method for diagnosing risk of type 1 diabetes |
Country Status (5)
| Country | Link |
|---|---|
| US (1) | US20130108598A1 (en) |
| EP (1) | EP2563930B1 (en) |
| JP (1) | JP2013524829A (en) |
| FI (1) | FI20105478A0 (en) |
| WO (1) | WO2011135194A2 (en) |
Families Citing this family (49)
| Publication number | Priority date | Publication date | Assignee | Title |
|---|---|---|---|---|
| WO2011094027A1 (en) | 2010-02-01 | 2011-08-04 | Hlavka Edwin J | Bacteriotherapy for clostridium difficile colitis |
| WO2012013861A2 (en) * | 2010-07-26 | 2012-02-02 | Suomen Punainen Risti Veripalvelu | Use of blood group status iii |
| WO2013130773A2 (en) | 2012-02-29 | 2013-09-06 | Ethicon Endo-Surgery, Inc. | Compositions of microbiota and methods related thereto |
| US11798685B2 (en) | 2012-05-15 | 2023-10-24 | James M. Minor | Diagnostic methods and devices for controlling acute glycemia |
| WO2013173499A2 (en) | 2012-05-15 | 2013-11-21 | Minor James M | Diagnostic methods and devices for monitoring chronic glycemia |
| US9694039B2 (en) | 2013-06-05 | 2017-07-04 | Rebiotix, Inc. | Microbiota restoration therapy (MRT), compositions and methods of manufacture |
| EP4234011A3 (en) | 2013-06-05 | 2023-09-20 | Rebiotix, Inc. | Microbiota restoration therapy (mrt), compositions and methods of manufacture |
| US9511100B2 (en) | 2013-06-05 | 2016-12-06 | Rebiotix, Inc. | Microbiota restoration therapy (MRT), compositions and methods of manufacture |
| US10383901B2 (en) | 2013-06-05 | 2019-08-20 | Rebiotix, Inc. | Microbiota restoration therapy (MRT), compositions and methods of manufacture |
| US9511099B2 (en) | 2013-06-05 | 2016-12-06 | Rebiotix, Inc. | Microbiota restoration therapy (MRT), compositions and methods of manufacture |
| US9782445B2 (en) | 2013-06-05 | 2017-10-10 | Rebiotix, Inc. | Microbiota restoration therapy (MRT), compositions and methods of manufacture |
| WO2015013214A2 (en) | 2013-07-21 | 2015-01-29 | Whole Biome, Inc. | Methods and systems for microbiome characterization, monitoring and treatment |
| US10950353B2 (en) | 2013-09-20 | 2021-03-16 | Georgia Tech Research Corporation | Systems and methods for disease progression modeling |
| CN106659746A (en) * | 2014-04-10 | 2017-05-10 | 国立研究开发法人理化学研究所 | Compositions and methods for induction of TH17 cells |
| US10325685B2 (en) | 2014-10-21 | 2019-06-18 | uBiome, Inc. | Method and system for characterizing diet-related conditions |
| US10793907B2 (en) | 2014-10-21 | 2020-10-06 | Psomagen, Inc. | Method and system for microbiome-derived diagnostics and therapeutics for endocrine system conditions |
| EP3209803A4 (en) | 2014-10-21 | 2018-06-13 | Ubiome, Inc. | Method and system for microbiome-derived diagnostics and therapeutics |
| US9754080B2 (en) | 2014-10-21 | 2017-09-05 | uBiome, Inc. | Method and system for microbiome-derived characterization, diagnostics and therapeutics for cardiovascular disease conditions |
| US10395777B2 (en) | 2014-10-21 | 2019-08-27 | uBiome, Inc. | Method and system for characterizing microorganism-associated sleep-related conditions |
| US9758839B2 (en) | 2014-10-21 | 2017-09-12 | uBiome, Inc. | Method and system for microbiome-derived diagnostics and therapeutics for conditions associated with microbiome functional features |
| US10789334B2 (en) | 2014-10-21 | 2020-09-29 | Psomagen, Inc. | Method and system for microbial pharmacogenomics |
| US11783914B2 (en) | 2014-10-21 | 2023-10-10 | Psomagen, Inc. | Method and system for panel characterizations |
| US10366793B2 (en) | 2014-10-21 | 2019-07-30 | uBiome, Inc. | Method and system for characterizing microorganism-related conditions |
| US10265009B2 (en) | 2014-10-21 | 2019-04-23 | uBiome, Inc. | Method and system for microbiome-derived diagnostics and therapeutics for conditions associated with microbiome taxonomic features |
| US10388407B2 (en) | 2014-10-21 | 2019-08-20 | uBiome, Inc. | Method and system for characterizing a headache-related condition |
| US10073952B2 (en) | 2014-10-21 | 2018-09-11 | uBiome, Inc. | Method and system for microbiome-derived diagnostics and therapeutics for autoimmune system conditions |
| US10346592B2 (en) | 2014-10-21 | 2019-07-09 | uBiome, Inc. | Method and system for microbiome-derived diagnostics and therapeutics for neurological health issues |
| US10357157B2 (en) | 2014-10-21 | 2019-07-23 | uBiome, Inc. | Method and system for microbiome-derived characterization, diagnostics and therapeutics for conditions associated with functional features |
| US10410749B2 (en) | 2014-10-21 | 2019-09-10 | uBiome, Inc. | Method and system for microbiome-derived characterization, diagnostics and therapeutics for cutaneous conditions |
| US10169541B2 (en) | 2014-10-21 | 2019-01-01 | uBiome, Inc. | Method and systems for characterizing skin related conditions |
| US9760676B2 (en) | 2014-10-21 | 2017-09-12 | uBiome, Inc. | Method and system for microbiome-derived diagnostics and therapeutics for endocrine system conditions |
| US10777320B2 (en) | 2014-10-21 | 2020-09-15 | Psomagen, Inc. | Method and system for microbiome-derived diagnostics and therapeutics for mental health associated conditions |
| US9710606B2 (en) | 2014-10-21 | 2017-07-18 | uBiome, Inc. | Method and system for microbiome-derived diagnostics and therapeutics for neurological health issues |
| US10381112B2 (en) | 2014-10-21 | 2019-08-13 | uBiome, Inc. | Method and system for characterizing allergy-related conditions associated with microorganisms |
| US10311973B2 (en) | 2014-10-21 | 2019-06-04 | uBiome, Inc. | Method and system for microbiome-derived diagnostics and therapeutics for autoimmune system conditions |
| US10409955B2 (en) | 2014-10-21 | 2019-09-10 | uBiome, Inc. | Method and system for microbiome-derived diagnostics and therapeutics for locomotor system conditions |
| CA2964480A1 (en) | 2014-10-31 | 2016-05-06 | Whole Biome Inc. | Methods and compositions relating to microbial treatment and diagnosis of disorders |
| WO2016157513A1 (en) * | 2015-04-03 | 2016-10-06 | 株式会社日立製作所 | Method and device for identifying amount of antigen-antibody interaction |
| US10246753B2 (en) | 2015-04-13 | 2019-04-02 | uBiome, Inc. | Method and system for characterizing mouth-associated conditions |
| US10905726B2 (en) | 2015-06-09 | 2021-02-02 | Rebiotix, Inc. | Microbiota restoration therapy (MRT) compositions and methods of manufacture |
| US10799539B2 (en) | 2015-06-09 | 2020-10-13 | Rebiotix, Inc. | Microbiota restoration therapy (MRT) compositions and methods of manufacture |
| US10828340B2 (en) | 2015-06-09 | 2020-11-10 | Rebiotix, Inc. | Microbiota restoration therapy (MRT) compositions and methods of manufacture |
| CN107921072A (en) | 2015-06-09 | 2018-04-17 | 雷柏奥提斯有限公司 | Micropopulation resumes treatment(MRT)Composition and manufacture method |
| WO2019046646A1 (en) | 2017-08-30 | 2019-03-07 | Whole Biome Inc. | Methods and compositions for treatment of microbiome-associated disorders |
| AU2018201783A1 (en) * | 2018-03-13 | 2019-10-03 | Pryzm Health IQ Pty Ltd | Visualising Clinical and Disease Data |
| JP7811843B2 (en) | 2018-07-19 | 2026-02-06 | ペンデュラム セラピューティクス, インコーポレイテッド | Methods and compositions for microbial engraftment |
| WO2021028861A2 (en) * | 2019-08-13 | 2021-02-18 | Tata Consultancy Services Limited | System and method for assessing the risk of prediabetes |
| KR102363088B1 (en) | 2020-06-19 | 2022-02-16 | 한국식품연구원 | Predicting or Diagnosing Composition for Risk of Diabetic Disease Using Human Intestinal Microbiome, Diagnosing Kit, Method For Providing Information, And Screening Method For Drugs For Preventing Or Treating Diabetes Using The Same |
| KR20220041401A (en) | 2020-09-25 | 2022-04-01 | 한국식품연구원 | Composition For Improving, Preventing Or Treating Diabetes Using Human Intestinal Microbiome, And Treating Method Of Diabetes Using The Same |
Family Cites Families (3)
| Publication number | Priority date | Publication date | Assignee | Title |
|---|---|---|---|---|
| US7173119B2 (en) * | 2004-03-25 | 2007-02-06 | Medical College Of Georgia Research Institute | SUMO4 gene and methods of use for type 1 diabetes |
| JP2007020423A (en) * | 2005-07-12 | 2007-02-01 | Yakult Honsha Co Ltd | Nucleic acid fragments for enterobacteria group detection |
| US7868139B2 (en) * | 2006-01-24 | 2011-01-11 | Uab Research Foundation | Compositions and methods for the identification and treatment of immune-mediated inflammatory diseases |
-
2010
- 2010-04-30 FI FI20105478A patent/FI20105478A0/en not_active Application Discontinuation
-
2011
- 2011-05-02 EP EP11774490.4A patent/EP2563930B1/en not_active Not-in-force
- 2011-05-02 JP JP2013506705A patent/JP2013524829A/en active Pending
- 2011-05-02 US US13/695,059 patent/US20130108598A1/en not_active Abandoned
- 2011-05-02 WO PCT/FI2011/050399 patent/WO2011135194A2/en not_active Ceased
Also Published As
| Publication number | Publication date |
|---|---|
| FI20105478A0 (en) | 2010-04-30 |
| EP2563930A2 (en) | 2013-03-06 |
| WO2011135194A2 (en) | 2011-11-03 |
| US20130108598A1 (en) | 2013-05-02 |
| WO2011135194A3 (en) | 2011-12-29 |
| EP2563930A4 (en) | 2013-08-28 |
| JP2013524829A (en) | 2013-06-20 |
Similar Documents
| Publication | Publication Date | Title |
|---|---|---|
| US20130108598A1 (en) | Method for diagnosing risk of type 1 diabetes and for preventing onset of type 1 diabetes | |
| Sysi-Aho et al. | Metabolic regulation in progression to autoimmune diabetes | |
| Liu et al. | Alterations of gut microbiota and blood lipidome in gestational diabetes mellitus with hyperlipidemia | |
| Levi et al. | Potential role of indolelactate and butyrate in multiple sclerosis revealed by integrated microbiome-metabolome analysis | |
| Hjort et al. | Gestational diabetes and maternal obesity are associated with epigenome-wide methylation changes in children | |
| Hanachi et al. | Altered host-gut microbes symbiosis in severely malnourished anorexia nervosa (AN) patients undergoing enteral nutrition: an explicative factor of functional intestinal disorders? | |
| Chu et al. | Continuous light-induced PCOS-like changes in reproduction, metabolism, and gut microbiota in Sprague-Dawley rats | |
| Lepage et al. | Twin study indicates loss of interaction between microbiota and mucosa of patients with ulcerative colitis | |
| Erener et al. | Profiling of circulating microRNAs in children with recent onset of type 1 diabetes | |
| Geurts et al. | Altered gut microbiota and endocannabinoid system tone in obese and diabetic leptin-resistant mice: impact on apelin regulation in adipose tissue | |
| Beaumont et al. | Heritable components of the human fecal microbiome are associated with visceral fat | |
| Bouchard et al. | Differential epigenomic and transcriptomic responses in subcutaneous adipose tissue between low and high responders to caloric restriction | |
| Binder et al. | Epigenome-wide and transcriptome-wide analyses reveal gestational diabetes is associated with alterations in the human leukocyte antigen complex | |
| Simon et al. | Polymorphisms in vitamin D metabolism related genes and risk of multiple sclerosis | |
| Wang et al. | The fecal microbiota is already altered in normoglycemic individuals who go on to have type 2 diabetes | |
| Corella et al. | MicroRNA-410 regulated lipoprotein lipase variant rs13702 is associated with stroke incidence and modulated by diet in the randomized controlled PREDIMED trial | |
| Pampols | Inherited metabolic rare disease | |
| Redondo et al. | Dissecting heterogeneity in paediatric type 1 diabetes: association of TCF7L2 rs7903146 TT and low‐risk human leukocyte antigen (HLA) genotypes | |
| Song et al. | Changes in gut microbiome upon orchiectomy and testosterone administration in AOM/DSS-induced colon cancer mouse model | |
| Pinto et al. | Predictive metagenomic profiling, urine metabolomics, and human marker gene expression as an integrated approach to study alopecia areata | |
| Meijer et al. | Residual N‐acetyl‐α‐glucosaminidase activity in fibroblasts correlates with disease severity in patients with mucopolysaccharidosis type IIIB | |
| Liu et al. | Bacteroidaceae, Bacteroides, and Veillonella: emerging protectors against Graves’ disease | |
| Abd El Gayed et al. | Fat mass and obesity-associated gene expression and disease severity in type 2 diabetes mellitus | |
| Gual-Grau et al. | Physiological, metabolic and microbial responses to obesogenic cafeteria diet in rats: The impact of strain and sex | |
| Jonsson et al. | Effect of a common variant of the PCSK2 gene on reduced insulin secretion |
Legal Events
| Date | Code | Title | Description |
|---|---|---|---|
| PUAI | Public reference made under article 153(3) epc to a published international application that has entered the european phase |
Free format text: ORIGINAL CODE: 0009012 |
|
| 17P | Request for examination filed |
Effective date: 20121101 |
|
| AK | Designated contracting states |
Kind code of ref document: A2 Designated state(s): AL AT BE BG CH CY CZ DE DK EE ES FI FR GB GR HR HU IE IS IT LI LT LU LV MC MK MT NL NO PL PT RO RS SE SI SK SM TR |
|
| DAX | Request for extension of the european patent (deleted) | ||
| A4 | Supplementary search report drawn up and despatched |
Effective date: 20130725 |
|
| RIC1 | Information provided on ipc code assigned before grant |
Ipc: C12Q 1/04 20060101AFI20130719BHEP Ipc: A61K 35/74 20060101ALI20130719BHEP Ipc: A61P 3/10 20060101ALI20130719BHEP Ipc: C12R 1/145 20060101ALI20130719BHEP Ipc: C12N 1/20 20060101ALI20130719BHEP Ipc: C12Q 1/68 20060101ALI20130719BHEP Ipc: G01N 33/92 20060101ALI20130719BHEP Ipc: G01N 33/564 20060101ALI20130719BHEP |
|
| 17Q | First examination report despatched |
Effective date: 20140408 |
|
| GRAP | Despatch of communication of intention to grant a patent |
Free format text: ORIGINAL CODE: EPIDOSNIGR1 |
|
| RIC1 | Information provided on ipc code assigned before grant |
Ipc: C12Q 1/68 20060101ALI20150427BHEP Ipc: C12Q 1/04 20060101AFI20150427BHEP Ipc: C12R 1/145 20060101ALI20150427BHEP |
|
| INTG | Intention to grant announced |
Effective date: 20150528 |
|
| GRAS | Grant fee paid |
Free format text: ORIGINAL CODE: EPIDOSNIGR3 |
|
| GRAA | (expected) grant |
Free format text: ORIGINAL CODE: 0009210 |
|
| RAP1 | Party data changed (applicant data changed or rights of an application transferred) |
Owner name: TEKNOLOGIAN TUTKIMUSKESKUS VTT OY |
|
| AK | Designated contracting states |
Kind code of ref document: B1 Designated state(s): AL AT BE BG CH CY CZ DE DK EE ES FI FR GB GR HR HU IE IS IT LI LT LU LV MC MK MT NL NO PL PT RO RS SE SI SK SM TR |
|
| REG | Reference to a national code |
Ref country code: GB Ref legal event code: FG4D |
|
| REG | Reference to a national code |
Ref country code: CH Ref legal event code: EP |
|
| REG | Reference to a national code |
Ref country code: AT Ref legal event code: REF Ref document number: 762643 Country of ref document: AT Kind code of ref document: T Effective date: 20151215 |
|
| REG | Reference to a national code |
Ref country code: IE Ref legal event code: FG4D |
|
| REG | Reference to a national code |
Ref country code: DE Ref legal event code: R096 Ref document number: 602011021675 Country of ref document: DE |
|
| REG | Reference to a national code |
Ref country code: LT Ref legal event code: MG4D |
|
| REG | Reference to a national code |
Ref country code: NL Ref legal event code: MP Effective date: 20160225 |
|
| REG | Reference to a national code |
Ref country code: AT Ref legal event code: MK05 Ref document number: 762643 Country of ref document: AT Kind code of ref document: T Effective date: 20151125 |
|
| PG25 | Lapsed in a contracting state [announced via postgrant information from national office to epo] |
Ref country code: IS Free format text: LAPSE BECAUSE OF FAILURE TO SUBMIT A TRANSLATION OF THE DESCRIPTION OR TO PAY THE FEE WITHIN THE PRESCRIBED TIME-LIMIT Effective date: 20160325 Ref country code: NL Free format text: LAPSE BECAUSE OF FAILURE TO SUBMIT A TRANSLATION OF THE DESCRIPTION OR TO PAY THE FEE WITHIN THE PRESCRIBED TIME-LIMIT Effective date: 20151125 Ref country code: HR Free format text: LAPSE BECAUSE OF FAILURE TO SUBMIT A TRANSLATION OF THE DESCRIPTION OR TO PAY THE FEE WITHIN THE PRESCRIBED TIME-LIMIT Effective date: 20151125 Ref country code: LT Free format text: LAPSE BECAUSE OF FAILURE TO SUBMIT A TRANSLATION OF THE DESCRIPTION OR TO PAY THE FEE WITHIN THE PRESCRIBED TIME-LIMIT Effective date: 20151125 Ref country code: NO Free format text: LAPSE BECAUSE OF FAILURE TO SUBMIT A TRANSLATION OF THE DESCRIPTION OR TO PAY THE FEE WITHIN THE PRESCRIBED TIME-LIMIT Effective date: 20160225 Ref country code: ES Free format text: LAPSE BECAUSE OF FAILURE TO SUBMIT A TRANSLATION OF THE DESCRIPTION OR TO PAY THE FEE WITHIN THE PRESCRIBED TIME-LIMIT Effective date: 20151125 |
|
| PG25 | Lapsed in a contracting state [announced via postgrant information from national office to epo] |
Ref country code: RS Free format text: LAPSE BECAUSE OF FAILURE TO SUBMIT A TRANSLATION OF THE DESCRIPTION OR TO PAY THE FEE WITHIN THE PRESCRIBED TIME-LIMIT Effective date: 20151125 Ref country code: GR Free format text: LAPSE BECAUSE OF FAILURE TO SUBMIT A TRANSLATION OF THE DESCRIPTION OR TO PAY THE FEE WITHIN THE PRESCRIBED TIME-LIMIT Effective date: 20160226 Ref country code: FI Free format text: LAPSE BECAUSE OF FAILURE TO SUBMIT A TRANSLATION OF THE DESCRIPTION OR TO PAY THE FEE WITHIN THE PRESCRIBED TIME-LIMIT Effective date: 20151125 Ref country code: LV Free format text: LAPSE BECAUSE OF FAILURE TO SUBMIT A TRANSLATION OF THE DESCRIPTION OR TO PAY THE FEE WITHIN THE PRESCRIBED TIME-LIMIT Effective date: 20151125 Ref country code: PT Free format text: LAPSE BECAUSE OF FAILURE TO SUBMIT A TRANSLATION OF THE DESCRIPTION OR TO PAY THE FEE WITHIN THE PRESCRIBED TIME-LIMIT Effective date: 20160325 Ref country code: PL Free format text: LAPSE BECAUSE OF FAILURE TO SUBMIT A TRANSLATION OF THE DESCRIPTION OR TO PAY THE FEE WITHIN THE PRESCRIBED TIME-LIMIT Effective date: 20151125 Ref country code: AT Free format text: LAPSE BECAUSE OF FAILURE TO SUBMIT A TRANSLATION OF THE DESCRIPTION OR TO PAY THE FEE WITHIN THE PRESCRIBED TIME-LIMIT Effective date: 20151125 Ref country code: SE Free format text: LAPSE BECAUSE OF FAILURE TO SUBMIT A TRANSLATION OF THE DESCRIPTION OR TO PAY THE FEE WITHIN THE PRESCRIBED TIME-LIMIT Effective date: 20151125 |
|
| PG25 | Lapsed in a contracting state [announced via postgrant information from national office to epo] |
Ref country code: CZ Free format text: LAPSE BECAUSE OF FAILURE TO SUBMIT A TRANSLATION OF THE DESCRIPTION OR TO PAY THE FEE WITHIN THE PRESCRIBED TIME-LIMIT Effective date: 20151125 Ref country code: IT Free format text: LAPSE BECAUSE OF FAILURE TO SUBMIT A TRANSLATION OF THE DESCRIPTION OR TO PAY THE FEE WITHIN THE PRESCRIBED TIME-LIMIT Effective date: 20151125 |
|
| REG | Reference to a national code |
Ref country code: DE Ref legal event code: R097 Ref document number: 602011021675 Country of ref document: DE |
|
| PG25 | Lapsed in a contracting state [announced via postgrant information from national office to epo] |
Ref country code: SM Free format text: LAPSE BECAUSE OF FAILURE TO SUBMIT A TRANSLATION OF THE DESCRIPTION OR TO PAY THE FEE WITHIN THE PRESCRIBED TIME-LIMIT Effective date: 20151125 Ref country code: EE Free format text: LAPSE BECAUSE OF FAILURE TO SUBMIT A TRANSLATION OF THE DESCRIPTION OR TO PAY THE FEE WITHIN THE PRESCRIBED TIME-LIMIT Effective date: 20151125 Ref country code: BE Free format text: LAPSE BECAUSE OF NON-PAYMENT OF DUE FEES Effective date: 20160531 Ref country code: DK Free format text: LAPSE BECAUSE OF FAILURE TO SUBMIT A TRANSLATION OF THE DESCRIPTION OR TO PAY THE FEE WITHIN THE PRESCRIBED TIME-LIMIT Effective date: 20151125 Ref country code: RO Free format text: LAPSE BECAUSE OF FAILURE TO SUBMIT A TRANSLATION OF THE DESCRIPTION OR TO PAY THE FEE WITHIN THE PRESCRIBED TIME-LIMIT Effective date: 20151125 Ref country code: SK Free format text: LAPSE BECAUSE OF FAILURE TO SUBMIT A TRANSLATION OF THE DESCRIPTION OR TO PAY THE FEE WITHIN THE PRESCRIBED TIME-LIMIT Effective date: 20151125 |
|
| PLBE | No opposition filed within time limit |
Free format text: ORIGINAL CODE: 0009261 |
|
| STAA | Information on the status of an ep patent application or granted ep patent |
Free format text: STATUS: NO OPPOSITION FILED WITHIN TIME LIMIT |
|
| 26N | No opposition filed |
Effective date: 20160826 |
|
| REG | Reference to a national code |
Ref country code: FR Ref legal event code: PLFP Year of fee payment: 6 |
|
| PG25 | Lapsed in a contracting state [announced via postgrant information from national office to epo] |
Ref country code: SI Free format text: LAPSE BECAUSE OF FAILURE TO SUBMIT A TRANSLATION OF THE DESCRIPTION OR TO PAY THE FEE WITHIN THE PRESCRIBED TIME-LIMIT Effective date: 20151125 |
|
| PG25 | Lapsed in a contracting state [announced via postgrant information from national office to epo] |
Ref country code: LU Free format text: LAPSE BECAUSE OF FAILURE TO SUBMIT A TRANSLATION OF THE DESCRIPTION OR TO PAY THE FEE WITHIN THE PRESCRIBED TIME-LIMIT Effective date: 20160502 Ref country code: BE Free format text: LAPSE BECAUSE OF FAILURE TO SUBMIT A TRANSLATION OF THE DESCRIPTION OR TO PAY THE FEE WITHIN THE PRESCRIBED TIME-LIMIT Effective date: 20151125 |
|
| REG | Reference to a national code |
Ref country code: IE Ref legal event code: MM4A |
|
| PG25 | Lapsed in a contracting state [announced via postgrant information from national office to epo] |
Ref country code: IE Free format text: LAPSE BECAUSE OF NON-PAYMENT OF DUE FEES Effective date: 20160502 |
|
| REG | Reference to a national code |
Ref country code: FR Ref legal event code: PLFP Year of fee payment: 7 |
|
| PGFP | Annual fee paid to national office [announced via postgrant information from national office to epo] |
Ref country code: DE Payment date: 20171121 Year of fee payment: 7 Ref country code: FR Payment date: 20171121 Year of fee payment: 7 |
|
| PGFP | Annual fee paid to national office [announced via postgrant information from national office to epo] |
Ref country code: GB Payment date: 20171123 Year of fee payment: 7 Ref country code: CH Payment date: 20171120 Year of fee payment: 7 |
|
| PG25 | Lapsed in a contracting state [announced via postgrant information from national office to epo] |
Ref country code: CY Free format text: LAPSE BECAUSE OF FAILURE TO SUBMIT A TRANSLATION OF THE DESCRIPTION OR TO PAY THE FEE WITHIN THE PRESCRIBED TIME-LIMIT Effective date: 20151125 Ref country code: HU Free format text: LAPSE BECAUSE OF FAILURE TO SUBMIT A TRANSLATION OF THE DESCRIPTION OR TO PAY THE FEE WITHIN THE PRESCRIBED TIME-LIMIT; INVALID AB INITIO Effective date: 20110502 |
|
| PG25 | Lapsed in a contracting state [announced via postgrant information from national office to epo] |
Ref country code: MT Free format text: LAPSE BECAUSE OF NON-PAYMENT OF DUE FEES Effective date: 20160531 Ref country code: TR Free format text: LAPSE BECAUSE OF FAILURE TO SUBMIT A TRANSLATION OF THE DESCRIPTION OR TO PAY THE FEE WITHIN THE PRESCRIBED TIME-LIMIT Effective date: 20151125 Ref country code: MK Free format text: LAPSE BECAUSE OF FAILURE TO SUBMIT A TRANSLATION OF THE DESCRIPTION OR TO PAY THE FEE WITHIN THE PRESCRIBED TIME-LIMIT Effective date: 20151125 Ref country code: MC Free format text: LAPSE BECAUSE OF FAILURE TO SUBMIT A TRANSLATION OF THE DESCRIPTION OR TO PAY THE FEE WITHIN THE PRESCRIBED TIME-LIMIT Effective date: 20151125 |
|
| PG25 | Lapsed in a contracting state [announced via postgrant information from national office to epo] |
Ref country code: BG Free format text: LAPSE BECAUSE OF FAILURE TO SUBMIT A TRANSLATION OF THE DESCRIPTION OR TO PAY THE FEE WITHIN THE PRESCRIBED TIME-LIMIT Effective date: 20151125 |
|
| PG25 | Lapsed in a contracting state [announced via postgrant information from national office to epo] |
Ref country code: AL Free format text: LAPSE BECAUSE OF FAILURE TO SUBMIT A TRANSLATION OF THE DESCRIPTION OR TO PAY THE FEE WITHIN THE PRESCRIBED TIME-LIMIT Effective date: 20151125 |
|
| REG | Reference to a national code |
Ref country code: DE Ref legal event code: R119 Ref document number: 602011021675 Country of ref document: DE |
|
| REG | Reference to a national code |
Ref country code: CH Ref legal event code: PL |
|
| GBPC | Gb: european patent ceased through non-payment of renewal fee |
Effective date: 20180502 |
|
| PG25 | Lapsed in a contracting state [announced via postgrant information from national office to epo] |
Ref country code: CH Free format text: LAPSE BECAUSE OF NON-PAYMENT OF DUE FEES Effective date: 20180531 Ref country code: LI Free format text: LAPSE BECAUSE OF NON-PAYMENT OF DUE FEES Effective date: 20180531 |
|
| PG25 | Lapsed in a contracting state [announced via postgrant information from national office to epo] |
Ref country code: DE Free format text: LAPSE BECAUSE OF NON-PAYMENT OF DUE FEES Effective date: 20181201 Ref country code: FR Free format text: LAPSE BECAUSE OF NON-PAYMENT OF DUE FEES Effective date: 20180531 Ref country code: GB Free format text: LAPSE BECAUSE OF NON-PAYMENT OF DUE FEES Effective date: 20180502 |