EP2535862A1 - Procédé pour analyser des billes de réactif - Google Patents
Procédé pour analyser des billes de réactif Download PDFInfo
- Publication number
- EP2535862A1 EP2535862A1 EP11170128A EP11170128A EP2535862A1 EP 2535862 A1 EP2535862 A1 EP 2535862A1 EP 11170128 A EP11170128 A EP 11170128A EP 11170128 A EP11170128 A EP 11170128A EP 2535862 A1 EP2535862 A1 EP 2535862A1
- Authority
- EP
- European Patent Office
- Prior art keywords
- intensity
- curve
- values
- image
- intensity values
- Prior art date
- Legal status (The legal status is an assumption and is not a legal conclusion. Google has not performed a legal analysis and makes no representation as to the accuracy of the status listed.)
- Ceased
Links
Images


Classifications
-
- G—PHYSICS
- G06—COMPUTING; CALCULATING OR COUNTING
- G06T—IMAGE DATA PROCESSING OR GENERATION, IN GENERAL
- G06T7/00—Image analysis
- G06T7/0002—Inspection of images, e.g. flaw detection
- G06T7/0012—Biomedical image inspection
-
- G—PHYSICS
- G06—COMPUTING; CALCULATING OR COUNTING
- G06T—IMAGE DATA PROCESSING OR GENERATION, IN GENERAL
- G06T2207/00—Indexing scheme for image analysis or image enhancement
- G06T2207/30—Subject of image; Context of image processing
- G06T2207/30004—Biomedical image processing
- G06T2207/30072—Microarray; Biochip, DNA array; Well plate
Definitions
- the present invention relates to a method of analysing reagent beads and an analyser for analysing reagent beads.
- ELISA Enzyme Linked ImmunoSorbent Assay
- lmmunoassay procedures are a preferred way of testing biological products. These procedures exploit the ability of antibodies produced by the body to recognise and combine with specific antigens which may, for example, be associated with foreign bodies such as bacteria or viruses, or with other body products such as hormones. Once a specific antigen-antibody combination has occurred it can be detected using chromogenic, fluorescent or chemiluminescent materials or less preferably by using radioactive substances. Radioactive substances are less preferred due to environmental and safety concerns regarding their handling, storage and disposal. The same principles can be used to detect or determine any materials which can form specific binding pairs, for example using lectins, rheumatoid factor, protein A or nucleic acids as one of the binding partners.
- ELISA is a particularly preferred form of immunoassay procedure wherein one member of the binding pair is linked to an insoluble carrier surface ("the solid phase") such as a sample vessel, and after reaction the bound pair is detected by use of a further specific binding agent conjugated to an enzyme ("the conjugate").
- the procedures for ELISA are well known in the art and have been in use for both research and commercial purposes for many years. Numerous books and review articles describe the theory and practice of immunoassays. Advice is given, for example, on the characteristics and choice of solid phases for capture assays, on methods and reagents for coating solid phases with capture components, on the nature and choice of labels, and on methods for labelling components.
- the solid phase is coated with a member of the binding pair.
- An aliquot of the specimen to be examined is incubated with the solid coated solid phase and any analyte that may be present is captured onto the solid phase.
- a second binding agent specific for the analyte and conjugated to an enzyme is added to the solid phase.
- any analyte captured onto the solid phase will combine with the conjugate.
- a chromogenic substrate for the enzyme is added to the solid phase. Any enzyme present will begin to convert the substrate to a chromophoric product. After a specified time the amount of product formed may be measured using a spectrophotometer, either directly or after stopping the reaction.
- microplate The most common type of solid phase is a standard sample vessel known as a microplate which can be stored easily and which may be used with a variety of biological specimens.
- Microplates have been available commercially since the 1960s and are made from e.g. polystyrene, PVC, Perspex or Lucite and measure approximately 5 inches (12.7 cm) in length, 3.3 inches (8.5 cm) in width, and 0.55 inches (1.4 cm) in depth. Microplates made from polystyrene are particularly preferred on account of polystyrene's enhanced optical clarity which assists visual interpretation of the results of any reaction. Polystyrene microplates are also compact, lightweight and easily washable. Microplates manufactured by the Applicants are sold under the name "MICROTITRE" (RTM).
- microplates comprise 96 wells (also commonly known as "microwells") which are symmetrically arranged in an 8 x 12 array.
- Microwells typically have a maximum volume capacity of approximately 350 ⁇ l. However, normally only 10-200 ⁇ l of fluid is dispensed into a microwell.
- the microwells may be arranged in strips of 8 or 12 wells that can be moved and combined in a carrier to give a complete plate having conventional dimensions.
- Positive and negative controls are generally supplied with commercial kits and are used for quality control and to provide a relative cut-off. After reading the processed microplate, the results of the controls are checked against the manufacturer's validated values to ensure that the analysis has operated correctly and then the value is used to distinguish positive from negative specimens and a cut-off value is calculated. Standards are usually provided for quantitative assays and are used to build a standard curve from which the concentration of analyte in a specimen may be interpolated.
- the ELISA procedure as outlined above involves multiple steps including pipetting, incubation, washing, transferring microplates between activities, reading and data analysis.
- systems have been developed which automate the steps (or "phases") involved in the ELISA procedures such as sample distribution, dilution, incubation at specific temperatures, washing, enzyme conjugate addition, reagent addition, reaction stopping and the analysis of results.
- the pipette mechanism used to aspirate and dispense fluid samples uses disposable tips which are ejected after being used so as to prevent cross-contamination of patients' samples. Multiple instrumental controls are in place to ensure that appropriate volumes, times, wavelengths and temperatures are employed, data transfer and analysis is fully validated and monitored.
- Automated immunoassay apparatus for carrying out ELISA procedures are now widely used in laboratories of e.g. pharmaceutical companies, veterinary and botanical laboratories, hospitals and universities for in-vitro diagnostic applications such as testing for diseases and infection, and for assisting in the production of new vaccines and drugs.
- ELISA kits are commercially available which consist of microplates having microwells which have been coated by the manufacturer with a specific antibody (or antigen).
- a specific antibody or antigen
- the kit manufacturer will dispense anti-hepatitis B antibodies which have been suspended in a fluid into the microwells of a microplate.
- the microplate is then incubated for a period of time, during which time the antibodies adhere to the walls of the microwells up to the fluid fill level (typically about half the maximum fluid capacity of the microwell).
- the microwells are then washed leaving a microplate having microwells whose walls are uniformly covered with anti-hepatitis B antibodies up to the fluid fill level.
- a testing laboratory will receive a number of sample tubes containing, for example, body fluid from a number of patients. A specified amount of fluid is then aspirated out of the sample tube using a pipette mechanism and is then dispensed into one or more microwells of a microplate which has been previously prepared by the manufacturer as discussed above. If it is desired to test a patient for a number of different diseases then fluid from the patient must be dispensed into a number of separate microplates, each coated by its manufacturer with a different binding agent. Each microplate can then be processed separately to detect the presence of a different disease. It will be seen that to analyse several different analytes requires a multiplicity of microplates and transfer of aliquots of the same specimen to the different microplates.
- Conventional ELISA techniques have concentrated upon performing the same single test upon a plurality of patient samples per microplate or in detecting the presence of one or more of a multiplicity of analytes in those patients without distinguishing which of the possible analytes is actually present. For example, it is commonplace to determine in a single microwell whether a patient has antibodies to HIV-1 or HIV-2, or HIV-1 or -2 antigens, without determining which analyte is present and similarly for HCV antibodies and antigens.
- a recent approach to multiplexing is to provide a microplate comprising 96 sample wells wherein an array of different capture antibodies is disposed in each sample well.
- the array comprises an array of 20 nl spots each having a diameter of 350 ⁇ m.
- the spots are arranged with a pitch spacing of 650 ⁇ m.
- Each spot corresponds with a different capture antibody.
- Multiplexing enables a greater number of data points and more information per assay to be obtained compared with conventional ELISA techniques wherein each sample plate tests for a single analyte of interest.
- the ability to be able to combine multiple separate tests into the same assay can lead to considerable time and cost savings.
- Multiplexing also enables the overall footprint of the automated apparatus to be reduced.
- a hybridization probe typically comprises a fragment of DNA or RNA which is used to detect the presence of nucleotide sequences which are complementary to the DNA or RNA sequence on the probe.
- the hybridization probe hybridizes to single-stranded nucleic acid (e.g. DNA or RNA) whose base sequence allows pairing due to complementarity between the hybridization probe and the sample being analysed.
- the hybridization probe may be tagged or labelled with a molecular marker such as a radioactive or more preferably a fluorescent molecule.
- the probes are inactive until hybridization at which point there is a conformational change and the molecule complex becomes active and will then fluoresce (which can be detected under UV light) DNA sequences or RNA transcripts which have a moderate to high sequence similarity to the probe are then detected by visualising the probe under UV light.
- Microbead multiplexing technology is currently being developed wherein reagent beads coated with an antigen or antibody are embedded in a single sample well such that samples can be tested against multiple analytes at the same time.
- the reagent beads in a sample well are analysed by determining the intensity of a chemiluminescent, chromogenic or fluorescent indicator present on each bead.
- the indicator is indicative of the specific binding for that analyte.
- the reagent beads are in relatively close proximity to each other then light from other reagent beads may be directly reflected off a particular reagent bead (or indirectly off the sample well wall) and will be directed towards the camera detector or imaging sensor.
- the determined intensity associated with the particular reagent bead may be affected by direct reflections from a neighbouring reagent bead or indirectly through reflections from the sample well wall. Deformities in the surface of a reagent bead may also cause an abnormal concentration of signal due to light redirection or an accumulation of materials that may not have been sufficiently removed in previous wash steps.
- a method of analysing one or more reagent beads retained or secured in a sample well of a sample plate comprising:
- the first curve preferably comprises a 4th, 5th, 6th, 7th, 8th or higher order polynomial.
- the step of comparing the first curve with the standard profile preferably comprises determining the closeness of fit of the first curve with the standard profile.
- the step of comparing the first curve with the standard profile preferably comprises determining a first sum which equals the sum of the squares of the differences between the first curve and the standard profile. These differences may be weighted and the preferred weighting is division by the standard deviation of the values of the first curve and the standard curve.
- a different method of weighting may be used.
- the method preferably further comprises:
- the second curve preferably comprises a 4th, 5th, 6th, 7th, 8th or higher order polynomial.
- the step of comparing the second curve with the standard profile preferably comprises determining the closeness of fit of the second curve with the standard profile.
- the step of comparing the second curve with the standard profile preferably comprises determining a second sum which equals the sum of the squares of the differences between the second curve and the standard profile.
- the method preferably further comprises:
- the third curve preferably comprises a 4th, 5th, 6th, 7th, 8th or higher order polynomial.
- the step of comparing the third curve with the standard profile preferably comprises determining the closeness of fit of the third curve with the standard profile.
- the step of comparing the third curve with the standard profile preferably comprises determining a third sum which equals the sum of the squares of the differences between the third curve and the standard profile.
- the method preferably further comprises:
- the fourth curve preferably comprises a 4th, 5th, 6th, 7th, 8th or higher order polynomial.
- the step of comparing the fourth curve with the standard profile preferably comprises determining the closeness of fit of the fourth curve with the standard profile.
- the step of comparing the fourth curve with the standard profile preferably comprises determining a fourth sum which equals the sum of the squares of the differences between the fourth curve and the standard profile.
- the method preferably further comprises:
- the n th curve preferably comprises a 4th, 5th, 6th, 7th, 8th or higher order polynomial.
- the step of comparing the n th curve with the standard profile preferably comprises determining the closeness of fit of the n th curve with the standard profile.
- the step of comparing the n th curve with the standard profile preferably comprises determining a n th sum which equals the sum of the squares of the differences between the n th curve and the standard profile.
- the plurality of intensity bins preferably comprises ⁇ 10, 10-20, 20-30, 30-40, 40-50, 50-60, 60-70, 70-80, 80-90, 90-100 or > 100 intensity bins.
- the method preferably further comprises determining which of the first sum and/or the second sum and/or the third sum and/or the fourth sum and/or the n th sum have the lowest value or have a value which otherwise indicates the closest fit between the first curve, the second curve, the third curve, the fourth curve or the n th curve and the standard profile.
- the method preferably further comprises determining the intensity of the reagent bead by using or summing the intensity values or values related to the intensity values which were not discarded and which were distributed amongst the plurality of intensity bins which gave the curve having the closest fit to the standard profile.
- the standard profile preferably comprises a profile which corresponds with the expected intensity profile of a reagent bead being analysed wherein the reagent bead being analysed is not significantly affected by stray reflections from one or more neighbouring reagent beads, indirect reflections from high signal beads from the sample well wall or from reagent bead surface abnormalities.
- the preferred profile is comprised of a plurality of reagent averaged bead image profiles that fit this criteria.
- a family of standard profiles may be established based on the range of the average intensity values for the reagent bead signal.
- the preferred standard profile against which the profile of the reagent bead should be compared is based on the average intensity value of that reagent bead.
- the standard profile to be used is preferably the one whose range includes the average value of the reagent bead.
- an analyser for analysing one or more reagent beads retained or secured in a sample well of a sample plate comprising:
- a method of analysing one or more reagent beads retained or secured in a sample well of a sample plate comprising:
- an analyser for analysing one or more reagent beads retained or secured in a sample well of a sample plate, the analyser further comprising a control system which is arranged and adapted:
- a method of analysing a reagent bead retained or secured in a sample well of a sample plate comprising:
- an analyser for analysing a reagent bead retained or secured in a sample well of a sample plate comprising:
- a method of analysing one or more reagent beads retained or secured in a sample well of a sample plate comprising:
- an analyser for analysing one or more reagent beads retained or secured in a sample well of a sample plate comprising:
- a preferred embodiment of the present invention will now be described which relates generally to a method and apparatus for analysing reagent beads located in a sample well of a sample plate and which is concerned with the problem of reducing crosstalk.
- the reagent beads are evenly coated with a reagent and include a chemiluminescent, fluorescent or chromogenic indicator.
- the intensity of light emanating from a reagent bead gives a measure of the strength of the reaction of the reagent on the reagent bead with the sample dispensed into the sample well.
- the sample well being analysed preferably comprises ten recesses or through holes in which reagent beads are secured or retained. During an earlier stage of the procedure a sample will have been dispensed into the sample well so as to cover the reagent beads such that the different reagent beads may react with the sample.
- the intensity (or logarithm of intensity) profile of image pixels which together form an image of the light emanating from a reagent bead should exhibit a characteristic profile of light output which should correspond with a standard profile. Any light which is reflected off the walls of the sample well or through bead surface abnormalities may also be considered.
- images from reagent beads which are not affected by light emanating from a neighbouring reagent bead are obtained.
- the image of a reagent bead preferably comprises a plurality of image pixels which may have different intensities.
- the intensities of the image pixels are then processed by distributing either the intensity values or alternatively the logarithm of the intensity values amongst a plurality of intensity bins and a standard profile is generated.
- the standard profile corresponds with the intensity (or logarithm of intensity) distribution of image pixels which may be expected when analysing a reagent bead which is not affected by light emanating from a neighbouring reagent bead.
- an intensity (or logarithm of intensity) profile of the image pixels of a particular reagent bead is observed to deviate significantly from the standard profile then this is due to light emanating from a neighbouring reagent bead which reflects off the particular reagent bead. Significant deviations can be observed if a neighbouring reagent bead has reacted strongly and emanates a relatively high intensity of light.
- a standard intensity (or logarithm of intensity) profile is constructed from an histogram comprised of the intensity values (or the logarithm of the intensity values) of image pixels which together make up an image of a reagent bead which falls within a cell boundary and wherein the reagent bead is not affected by stray reflections from a neighbouring reagent bead.
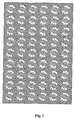
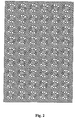
- Fig. 2 shows how the imaging system according to the preferred embodiment superimposes ten cell boundaries for each sample well.
- the superimposed cell boundaries are used to define the position (and intensity) of reagent beads located within a sample well.
- Fig. 3 shows in greater detail a cell boundary which is superimposed upon the image of a reagent bead located in a sample well.
- the image is comprised of a plurality of pixels wherein the intensity of the image pixels are not distorted by light emanating from neighbouring reagent beads.
- the intensity of the image pixels (or alternatively the logarithm of the intensity values of the image pixels) within a cell boundary are distributed amongst a plurality of intensity bins and an histogram of the frequency of the intensity (or logarithm of intensity) of the image pixels is constructed.
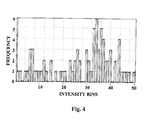
- Fig. 4 shows an example of an histogram of the intensity values of 80 image pixels within a cell boundary.
- the intensity values of the 80 image pixels are shown distributed amongst 50 intensity bins. It will be understood by those skilled in the art that other embodiments are contemplated wherein the number of image pixels may be ⁇ 80 or > 80. It will also be understood by those skilled in the art that other embodiments are contemplated wherein the number of intensity bins may be ⁇ 50 or > 50.
- multiple histogram profiles from a plurality of beads which are unaffected by stray reflections from neighbouring reagent beads are averaged.
- An histogram of the intensity (or logarithm of the intensity) profile of image pixels which may be expected to be observed when analysing an image of a reagent bead which is unaffected by light emanating from neighbouring reagent beads is then constructed.
- a 4th (or higher order) polynomial curve is preferably fitted to the histogram so that a standard profile relating to the distribution of the intensity values (or logarithm of intensity values) of the image pixels is then produced.
- Fig. 5 shows an example of a polynomial curve which has been fitted to an histogram of the intensities of image pixels. The curve is stored or retained as a standard profile.
- the "y” value shown in Fig. 5 is the percentage of pixel values which fall into a particular intensity bin.
- Embodiments are contemplated wherein a family of curves may be derived if the ideal or standard profile changes over the intensity range of the image pixels.
- the characterization of an ideal or standard profile may be performed individually for a microarrayer as there may be slight variations in the optics, other components between instruments, coating characteristics or assay chemistry. As a result, the standard profile may vary slightly from instrument to instrument and assay to assay. Alternatively, instruments may use a generic ideal or standard profile.
- an histogram of the intensity (or the logarithm of the intensity) of image pixels of a reagent bead is preferably obtained.
- a polynomial curve is then preferably fitted to the histogram and the curve is preferably compared against the standard profile curve.
- a determination is preferably made as to how close the correspondence is between the curve and the standard profile.
- the sum of the squares of the differences between points on an ideal or standard curve and corresponding points on a curve which is fitted to the histogram of the intensity (or logarithm of the intensity) of image pixels being analysed is preferably calculated.
- Fig. 6 shows an example of a pixelated image of a particular reagent bead. Signal emanating from an adjacent high signal bead is reflected off a portion of the particular reagent bead back towards the camera detector or imaging sensor and hence the intensity of some of the image pixels is distorted or otherwise affected due to stray light.
- the reagent bead shown in the centre of Fig. 6 is located close to a reagent bead to the left which strongly emits light. Light from the reagent bead to the left will reflect off the reagent bead shown in the centre.
- Fig. 7 shows an histogram of the intensity of 80 image pixels which together form an image of the reagent bead shown in the centre of Fig. 6 within the cell boundary shown.
- the intensity values of the image pixels are distributed amongst 50 intensity bins.
- a control system preferably eliminates or discards the intensity values (or the logarithm of the intensity values) in the highest intensity bin (intensity bin #50) and the remaining intensity data is then preferably redistributed amongst a new set of e.g. 50 intensity bins and a new histogram is obtained.
- a 6th order polynomial curve is fitted to the new histogram and the resulting curve is then preferably compared to the standard or idealised curve.
- a determination of the goodness of fit is then made preferably by determining the squares of the differences between the curve and the standard profile.
- This process is preferably repeated multiple times and each time the intensity (or the logarithm of the intensity) values in the highest intensity bin (e.g. intensity bin #50) are preferable discarded and the remaining intensity (or logarithm of intensity) data is preferably redistributed amongst a new set of intensity bins.
- this process may be repeated until intensity data has been discarded from the highest intensity bin x times, wherein x corresponds to 50% of the total number of intensity bins.
- the profile or curve which has the lowest value for the sum of the squared differences between the curve and the standard profile is preferably taken to represent image data which is substantially undistorted by light emanating from neighbouring reagent beads.
- the intensity (or the logarithm of the intensity) of the image pixels corresponding to the intensity data which produces the best fit with the standard profile may, for example, be summed to give a determination of the undistorted intensity of the reagent bead.
- Fig. 8 shows a 4th order polynomial curve which is initially fitted to the histogram shown in Fig. 7 .
- the number of pixels in each intensity bin are preferably converted to a percentage of all the pixels since as intensity data is eliminated from intensity bins one at a time, then less image pixels are considered. After the image pixel data in the highest intensity bin is eliminated or discarded, the remaining image pixel data is distributed into a new 50-bin histogram for the next iteration.
- Fig. 10 shows how according to an embodiment of the present invention squaring the difference between the profile or curve fit to an histogram and the standard profile enables an index value for the goodness of fit to be obtained.
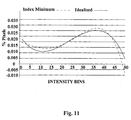
- the intensity bin profile with the lowest value of the sum of the squared difference (Index Minimum) was derived from the image pixels that were initially distributed in the first 37 intensity bins.
- the profile comparison between this intensity data and the standard profile is shown in Fig. 11 .
- Fig. 12 Some image pixels are shown in Fig. 12 together with their Relative Luminescence Unit (“RLU") values. The six image pixels highlighted are those image pixels which were eliminated from consideration when determining the overall intensity of the reagent bead.
- RLU Relative Luminescence Unit
- these image pixels correspond to the surface area of the reagent bead being analysed which is most likely to be affected by light reflected from the adjacent reagent bead which is emitting a relatively high intensity of light. According to this particular example, the average Relative Luminescence Unit of all the image pixels was reduced from 86.5 to 79.1.
Landscapes
- Engineering & Computer Science (AREA)
- Health & Medical Sciences (AREA)
- General Health & Medical Sciences (AREA)
- Medical Informatics (AREA)
- Nuclear Medicine, Radiotherapy & Molecular Imaging (AREA)
- Radiology & Medical Imaging (AREA)
- Quality & Reliability (AREA)
- Computer Vision & Pattern Recognition (AREA)
- Physics & Mathematics (AREA)
- General Physics & Mathematics (AREA)
- Theoretical Computer Science (AREA)
- Apparatus Associated With Microorganisms And Enzymes (AREA)
Priority Applications (4)
| Application Number | Priority Date | Filing Date | Title |
|---|---|---|---|
| EP11170128A EP2535862A1 (fr) | 2011-06-16 | 2011-06-16 | Procédé pour analyser des billes de réactif |
| PCT/IB2012/052012 WO2012143909A1 (fr) | 2011-04-20 | 2012-04-20 | Procédé permettant d'analyser des perles de réactifs |
| EP12165038.6A EP2515271B1 (fr) | 2011-04-20 | 2012-04-20 | Procédé pour analyser des billes de réactif |
| US14/113,180 US9128860B2 (en) | 2011-04-20 | 2012-04-20 | Method of imaging reagent beads, analyzing, and redistributing intensity |
Applications Claiming Priority (1)
| Application Number | Priority Date | Filing Date | Title |
|---|---|---|---|
| EP11170128A EP2535862A1 (fr) | 2011-06-16 | 2011-06-16 | Procédé pour analyser des billes de réactif |
Publications (1)
| Publication Number | Publication Date |
|---|---|
| EP2535862A1 true EP2535862A1 (fr) | 2012-12-19 |
Family
ID=44773942
Family Applications (1)
| Application Number | Title | Priority Date | Filing Date |
|---|---|---|---|
| EP11170128A Ceased EP2535862A1 (fr) | 2011-04-20 | 2011-06-16 | Procédé pour analyser des billes de réactif |
Country Status (1)
| Country | Link |
|---|---|
| EP (1) | EP2535862A1 (fr) |
Citations (2)
| Publication number | Priority date | Publication date | Assignee | Title |
|---|---|---|---|---|
| US20080090735A1 (en) * | 2006-10-12 | 2008-04-17 | Le Cocq Christian A | Methods and systems for removing offset bias in chemical array data |
| WO2009146036A2 (fr) * | 2008-04-01 | 2009-12-03 | Purdue Research Foundation | Quantification de différences entre des valeurs mesurées et une validation statistique basée sur les différences |
-
2011
- 2011-06-16 EP EP11170128A patent/EP2535862A1/fr not_active Ceased
Patent Citations (2)
| Publication number | Priority date | Publication date | Assignee | Title |
|---|---|---|---|---|
| US20080090735A1 (en) * | 2006-10-12 | 2008-04-17 | Le Cocq Christian A | Methods and systems for removing offset bias in chemical array data |
| WO2009146036A2 (fr) * | 2008-04-01 | 2009-12-03 | Purdue Research Foundation | Quantification de différences entre des valeurs mesurées et une validation statistique basée sur les différences |
Non-Patent Citations (2)
| Title |
|---|
| "ELISA and Other Solid Phase Immunoassays, Theoretical and Practical Aspects", 1988, JOHN WILEY |
| SHUTIN D ET AL: "Application of information-theoretic measures to quantitative analysis of immunofluorescent microscope imaging", COMPUTER METHODS AND PROGRAMS IN BIOMEDICINE, ELSEVIER, AMSTERDAM, NL, vol. 97, no. 2, 1 February 2010 (2010-02-01), pages 114 - 129, XP026872620, ISSN: 0169-2607, [retrieved on 20090630] * |
Similar Documents
| Publication | Publication Date | Title |
|---|---|---|
| EP2459314B1 (fr) | Plaque d'échantillon | |
| AU2010312284B2 (en) | Multiplex Microarrays and Methods for Quantification of Analytes | |
| US10207268B2 (en) | Sample plate systems and methods | |
| AU2009335612A1 (en) | Methods for multiplex analyte detection and quantification | |
| WO2001014425A1 (fr) | Systemes de diagnostic a fins multiples utilisant des puces a proteines | |
| US20080076133A1 (en) | Method for determining polymorphism | |
| EP2598244B1 (fr) | Plaque d'échantillon | |
| EP2639584A1 (fr) | Analyses de diagnostic en temps réel utilisant un biocapteur d'évanescence | |
| KR101862439B1 (ko) | 마이크로rna와 같은 특이적 핵산 서열의 탐지를 위한 면역분석법 | |
| US20060210984A1 (en) | Use of nucleic acid mimics for internal reference and calibration in a flow cell microarray binding assay | |
| EP2780112B1 (fr) | Systèmes et procédés pour améliorer la consistance de la performance d'un dosage | |
| EP2515271B1 (fr) | Procédé pour analyser des billes de réactif | |
| CN109187450A (zh) | 一种基于量子点的生物分子浓度检测方法 | |
| EP2535862A1 (fr) | Procédé pour analyser des billes de réactif | |
| WO2020016552A1 (fr) | Plaque d'échantillon multiplexée | |
| EP3317647B1 (fr) | Quantification résolue numériquement dans l'espace et le temps de cibles luminescentes | |
| US7195867B2 (en) | Method for detection of multiple test materials in a sample | |
| US20030162178A1 (en) | Variable microarray and methods of detecting one or more anlaytes in a sample | |
| WO2021258024A9 (fr) | Détection sensible et multiplexée d'acides nucléiques et de protéines pour un test sérologique à grande échelle | |
| WO2004079342A2 (fr) | Mimetiques d'acides nucleiques pour reference interne et etalonnage dans une methode d'analyse de liaisons sur microreseau dans une cuve a circulation | |
| EP2131196A1 (fr) | Détection d'analytes dans un biocapteur à flux | |
| CN105891464A (zh) | 一种生物芯片 | |
| GB2496315A (en) | Multiplex optical assembly |
Legal Events
| Date | Code | Title | Description |
|---|---|---|---|
| PUAI | Public reference made under article 153(3) epc to a published international application that has entered the european phase |
Free format text: ORIGINAL CODE: 0009012 |
|
| AK | Designated contracting states |
Kind code of ref document: A1 Designated state(s): AL AT BE BG CH CY CZ DE DK EE ES FI FR GB GR HR HU IE IS IT LI LT LU LV MC MK MT NL NO PL PT RO RS SE SI SK SM TR |
|
| AX | Request for extension of the european patent |
Extension state: BA ME |
|
| STAA | Information on the status of an ep patent application or granted ep patent |
Free format text: STATUS: THE APPLICATION HAS BEEN REFUSED |
|
| 18R | Application refused |
Effective date: 20130128 |