EP2510339B1 - Mass spectrometric determination of non-derivatized, non-metabolized vitamin d - Google Patents
Mass spectrometric determination of non-derivatized, non-metabolized vitamin d Download PDFInfo
- Publication number
- EP2510339B1 EP2510339B1 EP10836711.1A EP10836711A EP2510339B1 EP 2510339 B1 EP2510339 B1 EP 2510339B1 EP 10836711 A EP10836711 A EP 10836711A EP 2510339 B1 EP2510339 B1 EP 2510339B1
- Authority
- EP
- European Patent Office
- Prior art keywords
- vitamin
- ions
- sample
- column
- ion
- Prior art date
- Legal status (The legal status is an assumption and is not a legal conclusion. Google has not performed a legal analysis and makes no representation as to the accuracy of the status listed.)
- Not-in-force
Links
Images


Classifications
-
- G—PHYSICS
- G01—MEASURING; TESTING
- G01N—INVESTIGATING OR ANALYSING MATERIALS BY DETERMINING THEIR CHEMICAL OR PHYSICAL PROPERTIES
- G01N33/00—Investigating or analysing materials by specific methods not covered by groups G01N1/00 - G01N31/00
- G01N33/48—Biological material, e.g. blood, urine; Haemocytometers
- G01N33/50—Chemical analysis of biological material, e.g. blood, urine; Testing involving biospecific ligand binding methods; Immunological testing
- G01N33/82—Chemical analysis of biological material, e.g. blood, urine; Testing involving biospecific ligand binding methods; Immunological testing involving vitamins or their receptors
-
- G—PHYSICS
- G01—MEASURING; TESTING
- G01N—INVESTIGATING OR ANALYSING MATERIALS BY DETERMINING THEIR CHEMICAL OR PHYSICAL PROPERTIES
- G01N30/00—Investigating or analysing materials by separation into components using adsorption, absorption or similar phenomena or using ion-exchange, e.g. chromatography or field flow fractionation
- G01N30/02—Column chromatography
- G01N30/62—Detectors specially adapted therefor
- G01N30/72—Mass spectrometers
- G01N30/7233—Mass spectrometers interfaced to liquid or supercritical fluid chromatograph
-
- G—PHYSICS
- G01—MEASURING; TESTING
- G01N—INVESTIGATING OR ANALYSING MATERIALS BY DETERMINING THEIR CHEMICAL OR PHYSICAL PROPERTIES
- G01N30/00—Investigating or analysing materials by separation into components using adsorption, absorption or similar phenomena or using ion-exchange, e.g. chromatography or field flow fractionation
- G01N30/02—Column chromatography
- G01N30/88—Integrated analysis systems specially adapted therefor, not covered by a single one of the groups G01N30/04 - G01N30/86
-
- H—ELECTRICITY
- H01—ELECTRIC ELEMENTS
- H01J—ELECTRIC DISCHARGE TUBES OR DISCHARGE LAMPS
- H01J49/00—Particle spectrometers or separator tubes
- H01J49/004—Combinations of spectrometers, tandem spectrometers, e.g. MS/MS, MSn
-
- H—ELECTRICITY
- H01—ELECTRIC ELEMENTS
- H01J—ELECTRIC DISCHARGE TUBES OR DISCHARGE LAMPS
- H01J49/00—Particle spectrometers or separator tubes
- H01J49/02—Details
- H01J49/10—Ion sources; Ion guns
- H01J49/14—Ion sources; Ion guns using particle bombardment, e.g. ionisation chambers
- H01J49/145—Ion sources; Ion guns using particle bombardment, e.g. ionisation chambers using chemical ionisation
-
- G—PHYSICS
- G01—MEASURING; TESTING
- G01N—INVESTIGATING OR ANALYSING MATERIALS BY DETERMINING THEIR CHEMICAL OR PHYSICAL PROPERTIES
- G01N30/00—Investigating or analysing materials by separation into components using adsorption, absorption or similar phenomena or using ion-exchange, e.g. chromatography or field flow fractionation
- G01N2030/009—Extraction
-
- G—PHYSICS
- G01—MEASURING; TESTING
- G01N—INVESTIGATING OR ANALYSING MATERIALS BY DETERMINING THEIR CHEMICAL OR PHYSICAL PROPERTIES
- G01N30/00—Investigating or analysing materials by separation into components using adsorption, absorption or similar phenomena or using ion-exchange, e.g. chromatography or field flow fractionation
- G01N30/02—Column chromatography
- G01N2030/022—Column chromatography characterised by the kind of separation mechanism
- G01N2030/027—Liquid chromatography
-
- G—PHYSICS
- G01—MEASURING; TESTING
- G01N—INVESTIGATING OR ANALYSING MATERIALS BY DETERMINING THEIR CHEMICAL OR PHYSICAL PROPERTIES
- G01N30/00—Investigating or analysing materials by separation into components using adsorption, absorption or similar phenomena or using ion-exchange, e.g. chromatography or field flow fractionation
- G01N30/02—Column chromatography
- G01N30/88—Integrated analysis systems specially adapted therefor, not covered by a single one of the groups G01N30/04 - G01N30/86
- G01N2030/8809—Integrated analysis systems specially adapted therefor, not covered by a single one of the groups G01N30/04 - G01N30/86 analysis specially adapted for the sample
- G01N2030/8813—Integrated analysis systems specially adapted therefor, not covered by a single one of the groups G01N30/04 - G01N30/86 analysis specially adapted for the sample biological materials
Definitions
- the invention relates to the quantitative measurement of non-metabolized vitamin D.
- the invention relates to methods for quantitative measurement of non-metabolized vitamin D by tandem mass spectrometry.
- Vitamin D is an essential nutrient with important physiological roles in the positive regulation of calcium (Ca 2+ ) homeostasis. Vitamin D can be made de novo in the skin by exposure to sunlight or it can be absorbed from the diet. There are two forms of vitamin D; vitamin D 2 (ergocalciferol) and vitamin D 3 (cholecalciferol). Vitamin D 3 is the form synthesized de novo by animals. It is also a common supplement added to milk products and certain food products produced in the United States. Both dietary and intrinsically synthesized vitamin D 3 must undergo metabolic activation to generate the bioactive metabolites.
- the initial step of vitamin D 3 activation occurs primarily in the liver and involves hydroxylation to form the intermediate metabolite 25-hydroxycholecalciferol (calcifediol; 25OHD 3 ).
- Calcifediol is the major form of Vitamin D 3 in circulation. Circulating 25OHD 3 is then converted by the kidney to form 1,25-dihydroxyvitamin D 3 (calcitriol; 1,25(OH) 2 D 3 ), which is generally believed to be the metabolite of Vitamin D 3 with the highest biological activity.
- Vitamin D 2 is derived from fungal and plant sources. Many over-the-counter dietary supplements contain crgocalciferol (vitamin D 2 ) rather than cholecalciferol (vitamin D 3 ). Drisdol, the only high-potency prescription form of vitamin D available in the United States, is formulated with ergocalciferol. Vitamin D 2 undergoes a similar pathway of metabolic activation in humans as Vitamin D 3 , forming the metabolites 25OHD 2 and 1,25(OH) 2 D 2 . Vitamin D 2 and vitamin D 3 have long been assumed to be biologically equivalent in humans, however recent reports suggest that there may be differences in the bioactivity and bioavailability of these two forms of vitamin D ( Armas et. al., (2004) J. Clin. Endocrinol. Metab. 89:5387-5391 ).
- vitamin D the inactive vitamin D precursor
- serum levels of 25-hydroxyvitamin D 3 , 25-hydroxyvitamin D 2 , and total 25-hydroxyvitamin D are useful indices of vitamin D nutritional status and the efficacy of certain vitamin D analogs.
- the measurement of 25OHD is commonly used in the diagnosis and management of disorders of calcium metabolism.
- low levels of 25OHD are indicative of vitamin D deficiency associated with diseases such as hypocalcemia, hypophosphatemia, secondary hyperparathyroidism, elevated alkaline phosphatase, osteomalacia in adults and rickets in children.
- elevated levels of 25OHD distinguishes this disorder from other disorders that cause hypercalcemia.
- 1,25(OH) 2 D Measurement of 1,25(OH) 2 D is also used in clinical settings. Certain disease states can be reflected by circulating levels of 1,25(OH) 2 D, for example kidney disease and kidney failure often result in low levels of 1,25(OH) 2 D. Elevated levels of 1,25(OH) 2 D may be indicative of excess parathyroid hormone or can be indicative of certain diseases such as sarcoidosis or certain types of lymphomas.
- Detection of vitamin D metabolites has been accomplished by radioimmunoassay with antibodies co-specific for 25OHD 2 and 25OHD 3 . Because the current immunologically-based assays do not separately resolve 25OHD 2 and 25OHD 3 , the source of any nutritional deficiency of vitamin D cannot be determined without resorting to other tests. Reports have been published that disclose methods for detecting specific vitamin D metabolites using mass spectrometry. In some of the reports, the vitamin D metabolites are derivatized prior to mass spectrometry, but in others, they are not. For example Holmquist, et al., U.S. Patent Application Serial No.
- Biochanal Chem, 2008, 391:229-38 ; and Aronov, et al., Anal Bioanal Chem, 2008, 391:1917-30 disclose methods for detecting various vitamin D metabolites by derivatizing the metabolites prior to mass spectrometry. Methods to detect underivatized vitamin D metabolites are reported in Clarke, et al., in U.S. Patent Application Serial Nos. 11/101,166, filed April 6, 2005 , and 11/386,215, filed March 21, 2006 , and Singh, et al., in U.S. Patent Application Serial No. 10/977,121, filed October 24, 2004 .
- vitamin D from the sample is derivatized prior to analysis by mass spectrometry.
- vitamin D from the sample is not derivatized prior to analysis by mass spectrometry.
- the methods include the steps of: (i) subjecting Cookson-type-derivatized vitamin D in the sample to an ionization source under conditions suitable to generate one or more precursor ions detectable by mass spectrometry; (ii) fragmenting at least one of said precursor ions to generate one or more fragment ions detectable by mass spectrometry; (iii) determining the amount of one or more of the precursor and fragment ions by mass spectrometry; and (iv) relating the amount of ions determined in step (iii) to the amount of a vitamin D in the sample.
- the sample is subjected to a Cookson-type derivatization reagent under conditions sufficient to generate Cookson-type-derivatized vitamin D prior to step (i).
- the Cookson-type-derivatized-vitamin D is subjected to an extraction column and an analytical column prior to ionization.
- the analytical column may be a high performance liquid chromatography (HPLC) column.
- the methods include the steps of: (i) subjecting the sample to turbulent flow liquid chromatography (TFLC); (ii) subjecting Cookson-type-derivatized vitamin D from the sample an ionization source under conditions suitable to generate one or more ions detectable by mass spectrometry; (iii) determining the amount of one or more of the Cookson-type-derivatized vitamin D ions by mass spectrometry; and (iv) relating the amount of Cookson-type-derivatized vitamin D ions determined in step (iii) to the amount of a vitamin D in the sample.
- TFLC turbulent flow liquid chromatography
- the sample is subjected to a Cookson-type derivatizing reagent under conditions sufficient to generate Cookson-type-derivatized vitamin D in the sample prior to step (i).
- the sample is subjected to high performance liquid chromatography (HPLC) after step (i) but prior to step (ii).
- the Cookson-type derivatizing reagent is 4-phenyl-1,2,4-triazoline-3,5-dione (PTAD).
- the one or more precursor ions comprise one or more ions selected from the group consisting of ions with a mass/charge ratio (m/z) of 572.4 ⁇ 0.5 and 560.4 ⁇ 0.5.
- one or more fragment ions comprise an ion with a mass/charge ratio (m/z) of 298.1 ⁇ 0.5.
- one or more Cookson-type-derivatized vitamin D ions may comprise a precursor ion with a mass/charge ratio (m/z) of 572.3 ⁇ 0.5 and a fragment ion with a mass/charge ratio (m/z) of 298.1 ⁇ 0.5.
- one or more Cookson-type-derivatized vitamin D ions may comprise a precursor ion with a mass/charge ratio (m/z) of 560.3 ⁇ 0.5 and a fragment ion with a mass/charge ratio (m/z) of 298.1 ⁇ 0.5.
- one or more precursor ions may comprise a vitamin D 2 precursor ion with a mass/charge ratio (m/z) of 572.4 ⁇ 0.5 and a vitamin D 3 precursor ion with a m/z of 560.4 ⁇ 0.5; and one or more fragment ions may comprise a vitamin D 2 fragment ion with a m/z of 298.1 ⁇ 0.5 and a vitamin D 3 fragment ion with a m/z of 298.1 ⁇ 0.5.
- m/z mass/charge ratio
- the vitamin D comprises vitamin D 2 ; these methods include the steps of: subjecting vitamin D 2 from a sample to an ionization source under conditions suitable to generate one or more precursor ions detectable by mass spectrometry selected from the group consisting of ions with a mass to charge ratio (m/z) of 397.2 ⁇ 0.5 or 379.2 ⁇ 0.5; fragmenting at least one of said precursor ions to generate one or more fragment ions detectable by mass spectrometry; (iii) determining the amount of one or more of the ions generated in steps (i) and (ii) by mass spectrometry; and (iv) relating the presence of vitamin D 2 ions determined in step (iii) to the presence of vitamin D 2 in the sample.
- these methods include the steps of: subjecting vitamin D 2 from a sample to an ionization source under conditions suitable to generate one or more precursor ions detectable by mass spectrometry selected from the group consisting of ions with a mass to charge ratio (m/z) of 397.2
- the fragment ions comprise an ion with m/z of 397.2 ⁇ 0.5
- the fragment ions comprise one or more ions selected from the group consisting of ions with m/z of 159.0 ⁇ 0.5, 146.9 ⁇ 0.5, 133.1 ⁇ 0.5, and 121.0 ⁇ 0.5.
- the fragment ions comprise one or more ions selected from the group consisting of ions with m/z of 283.2 ⁇ 0.5, 187.3 ⁇ 0.5, 175.2 ⁇ 0.5, and 159.0 ⁇ 0.5.
- vitamin D 2 from the sample may be subjected to an extraction column, such as a solid phase extraction (SPE) column or a turbulent flow liquid chromatography (THLC) column, prior to ionization.
- an extraction column such as a solid phase extraction (SPE) column or a turbulent flow liquid chromatography (THLC) column
- THLC turbulent flow liquid chromatography
- vitamin D 2 from the sample is further subjected to an analytical column, such as a high performance liquid chromatography (HPLC) column, prior to ionization.
- HPLC high performance liquid chromatography
- vitamin D comprises vitamin D 3 ; these methods include the steps of: (i) subjecting vitamin D 3 from a sample to an ionization source under conditions suitable to generate one or more precursor ions detectable by mass spectrometry selected from the group consisting of ions with a mass to charge ratio (m/z) of 385.2 ⁇ 0.5 or 367.2 ⁇ 0.5; (ii) fragmenting at least one of the precursor ions to generate one or more fragment ions detectable by mass spectrometry; (iii) determining the amount of one or more of the ions generated in steps (i) and (ii) by mass spectrometry; and (iv) relating the presence of vitamin D 3 ions determined in step (iii) to the presence of vitamin D 3 in the sample.
- precursor ions detectable by mass spectrometry selected from the group consisting of ions with a mass to charge ratio (m/z) of 385.2 ⁇ 0.5 or 367.2 ⁇ 0.5
- the fragment ions comprise an ion with m/z of 385.2 ⁇ 0.5
- the fragment ions comprise one or more ions selected from the group consisting of ions with m/z of 159.0 ⁇ 0.5, 147.0 ⁇ 0.5, 133.1 ⁇ 0.5, and 107.1 ⁇ 0.5.
- the fragment ions comprise an ion with m/z of 367.2 ⁇ 0.5
- the fragment ions comprise one or more ions selected from the group consisting of ions with m/z of 172.2 ⁇ 0.5, 145.0 ⁇ 0.5, and 119.1 ⁇ 0.5.
- vitamin D 3 from the sample may be subjected to an extraction column, such as a solid phase extraction (SPE) column or a turbulent flow liquid chromatography (THLC) column, prior to ionization.
- an extraction column such as a solid phase extraction (SPE) column or a turbulent flow liquid chromatography (THLC) column
- THLC turbulent flow liquid chromatography
- vitamin D 3 from the sample is further subjected to an analytical column, such as a high performance liquid chromatography (HPLC) column, prior to ionization.
- HPLC high performance liquid chromatography
- mass spectrometry may be tandem mass spectrometry.
- tandem mass spectrometry may be conducted by any method known in the art, including for example, multiple reaction monitoring, precursor ion scanning, or product ion scanning.
- the extraction column may be a solid phase extraction (SPE) column; such as a turbulent flow liquid chromatography (TFLC) column.
- SPE solid phase extraction
- TFLC turbulent flow liquid chromatography
- the utilized components may be connected in an on-line fashion to allow for automated sample processing and analysis.
- Cookson-type derivatizing reagents useful for certain embodiments may be selected from the group consisting of 4-phenyl-1,2,4-triazoline-3,5-dione (PTAD), 4-methyl-1,2,4-triazoline-3,5-dione (MTAD), 4-[2-(6,7-dimethoxy-4-methyl-3-oxo-3,4-dihydroquinoxalyl)ethyl]-1,2,4-triazoline-3,5-dione (DMEQTAD), 4-(4-nitrophenyl)-1,2,4-triazoline-3,5- dione (NPTAD), and 4-ferrocenylmethyl-1,2,4-triazoline-3,5-dione (FMTAD), and isotopically labeled variants thereof.
- PTAD 4-phenyl-1,2,4-triazoline-3,5-dione
- MTAD 4-methyl-1,2,4-triazoline-3,5-dione
- DEQTAD 4-[2-(6,
- the Cookson-type derivatizing reagent is 4-phenyl-1,2,4-triazoline-3,5-dione (PTAD) or an isotopically labeled variant thereof.
- the Cookson-type derivatizing reagent is 4-phenyl-1,2,4-triazoline-3,5-dione (PTAD) or an isotopically labeled variant thereof.
- vitamin D refers to any one or more naturally occurring or synthetic analog of vitamin D which are non-metabolized. This is in contrast to vitamin D metabolites which are identified by specific chemical modification (e.g., 25-hydroxyvitamin D and 1 ⁇ ,25-dihydroxyvitamin D) which occurs during metabolism.
- Non-metabolized vitamin D may also be referred to as "nutritional" vitamin D to distinguish from metabolized forms.
- Reference to vitamin D without specifying a metabolized form is a reference to non-metabolized forms.
- a derivatizing agent is an agent that may be reacted with another substance to derivatize the substance.
- PTAD 4-phenyl-1,2,4-triazoline-3,5-dione
- PTAD is a derivatizing reagent that may be reacted with vitamin D to form a PTAD-derivatized vitamin D.
- the names of derivatized forms vitamin D include an indication as to the nature of derivatization.
- the PTAD derivative of vitamin D 2 is indicated as PTAD-vitamin D 2 (or PTAD-derivatized vitamin D 2 ).
- a "Cookson-type derivatizing agent” is a 4-substituted 1,2,4-triazoline-3,5-dione compound.
- Exemplary Cookson-type derivatizing agents include 4-phenyl-1,2,4-triazoline-3,5-dione (PTAD), 4-methyl-1,2,4-triazoline-3,5-dione (MTAD), 4-[2-(6,7-dimethoxy-4-methyl-3-oxo-3,4-dihydroquinoxalyl)ethyl]-1,2,4-triazoline-3,5-dione (DMEQTAD), 4-(4-nitrophenyl)-1,2,4-triazoline-3,5-dione (NPTAD), and 4-ferrocenylmethyl-1,2,4-triazoline-3,5-dione (FMTAD).
- PTAD 4-phenyl-1,2,4-triazoline-3,5-dione
- MTAD 4-methyl-1,2,4-triazoline-3,
- isotopically labeled variants of Cookson-type derivatizing agents may be used in some embodiments.
- the 13 C 6 -PTAD isotopic variant is 6 mass units heavier than normal PTAD and may be used in some embodiments.
- Derivatization of vitamin D metabolites by Cookson-type reagents can be conducted by any appropriate method. See, e.g., Holmquist, et al., U.S. Patent Application Serial No. 11/946765, filed December 28, 2007 ; Yeung B, et al., J Chromatogr. 1993, 645(1):115-23 ; Higashi T, et al., Steroids.
- Vitamin D may refer to one or more forms of vitamin D, such as vitamin D 2 and/or vitamin D 3 .
- the plurality of vitamin D forms may be ionized simultaneously.
- the amounts of vitamin D 2 and vitamin D 3 are determined in the same sample.
- (derivatized or underivatized) vitamin D 2 and vitamin D 3 may be ionized simultaneously.
- the term "simultaneous" as applied to simultaneously detecting the amount of two or more analytes from a sample means acquiring data reflective of the amount of the two or more analytes in the sample from the same sample injection.
- the data for each analyte may be acquired sequentially or in parallel, depending on the instrumental techniques employed. For example, a single sample containing two analytes may be injected into a HPLC column, which may then elute each analyte one after the other, resulting in introduction of the analytes into a mass spectrometer sequentially. Determining the amount of each of these two analytes is simultaneous for the purposes herein, as both analytes result from the same sample injection into the HPLC.
- Vitamin D may be found in the circulation of an animal and/or may be generated by a biological organism, such as an animal.
- samples may be obtained, for example, from a patient; that is, a living person, male or female, presenting oneself in a clinical setting for diagnosis, prognosis, or treatment of a disease or condition.
- Preferred samples may be biological samples; particularly biological fluid samples such as serum or plasma. The methods presented herein may be used to determine the amount of vitamin D present in a sample when taken from the human.
- mass spectrometry is performed in positive ion mode.
- mass spectrometry is performed in negative ion mode.
- Various ionization sources including for example atmospheric pressure chemical ionization (APCI), laser diode thermal desorption (LDTD), or electrospray ionization (ESI), may be used in embodiments disclosed herein.
- APCI atmospheric pressure chemical ionization
- LDTD laser diode thermal desorption
- ESI electrospray ionization
- vitamin D metabolites are measured using APCI or LDTD in positive ion mode.
- one or more separately detectable internal standards are provided in the sample, the amount of which are also determined in the sample.
- all or a portion of both the analyte(s) of interest and the internal standard(s) present in the sample are ionized to produce a plurality of ions detectable in a mass spectrometer, and one or more ions produced from each are detected by mass spectrometry.
- the internal standard(s) are one or more of vitamin D 2 -[6, 19, 19]- 2 H 3 , vitamin D 2 -[26, 26, 26, 27, 27, 27]- 2 H 6 , vitamin D 3 -[6, 19, 19]- 2 H 3 , and vitamin D 3 -[26, 26, 26, 27, 27, 27]- 2 H 6 .
- One or more separately detectable internal standards may be provided in the sample prior to treatment with a Cookson-type derivatizing reagent (if applicable), or any purification of the analyte(s) from the sample.
- the one or more internal standards may undergo derivatization and/or purification along with the endogenous vitamin D, in which case ions of the derivatized and/or purified internal standards are detected by mass spectrometry.
- the presence or amount of ions generated from the analyte of interest may be related to the presence or amount of analyte of interest in the sample.
- the internal standards may be isotopically labeled versions of vitamin D, such as vitamin D 2 -[6, 19, 19]- 2 H 3 , vitamin D 2 -[26, 26, 26, 27, 27, 27]- 2 H 6 , vitamin D 3 -[6, 19, 19]- 2 H 3 , and vitamin D 3 -[26, 26, 26, 27, 27, 27]- 2 H 6 .
- Ions detectable in a mass spectrometer may be generated for each of the exemplary internal standards listed above. Exemplary spectra generated for several exemplary internal standards are discussed in Examples 8 and 9, and shown in Figures 6-7 , 9-10 , 12-13 , and 15-16 .
- an "isotopic label” produces a mass shift in the labeled molecule relative to the unlabeled molecule when analyzed by mass spectrometric techniques.
- suitable labels include deuterium ( 2 H), 13 C, and 15 N.
- vitamin D 2 -[6, 19, 19]- 2 H 3 and vitamin D 3 -[6, 19, 19]- 2 H 3 has masses of about 3 mass units higher than vitamin D 2 and vitamin D 3 , respectively.
- the isotopic label can be incorporated at one or more positions in the molecule and one or more kinds of isotopic labels can be used on the same isotopically labeled molecule.
- the amount of vitamin D ion or ions may be determined by comparison to one or more external reference standards.
- Exemplary external reference standards include blank plasma or serum spiked with one or more of vitamin D 2 -[6, 19, 19]- 2 H 3 , vitamin D 2 -[26, 26, 26, 27, 27, 27]- 2 H 6 , vitamin D 3 -[6, 19, 19]- 2 H 3 , and vitamin D 3 -[26, 26, 26, 27, 27, 27]- 2 H 6 .
- External standards typically will undergo the same treatment and analysis as any other sample to be analyzed, including treatment with one or more Cookson-type reagents prior to mass spectrometry in embodiments wherein derivatized vitamin D is detected.
- the lower limit of quantitation (LLOQ) of vitamin D 2 and vitamin D 3 are less than 10 ng/mL; preferably less than 5 ng/mL; preferably less than 2 ng/mL.
- purification does not refer to removing all materials from the sample other than the analyte(s) of interest. Instead, purification refers to a procedure that enriches the amount of one or more analytes of interest relative to other components in the sample that may interfere with detection of the analyte of interest. Purification of the sample by various means may allow relative reduction of one or more interfering substances, e.g., one or more substances that may or may not interfere with the detection of selected parent or daughter ions by mass spectrometry. Relative reduction as this term is used does not require that any substance, present with the analyte of interest in the material to be purified, is entirely removed by purification.
- solid phase extraction refers to a process in which a chemical mixture is separated into components as a result of the affinity of components dissolved or suspended in a solution (i.e., mobile phase) for a solid through or around which the solution is passed (i.e., solid phase).
- a solution i.e., mobile phase
- the solid phase may be retained by the solid phase resulting in a purification of the analyte in the mobile phase.
- the analyte may be retained by the solid phase, allowing undesired components of the mobile phase to pass through or around the solid phase.
- SPE including TFLC
- TFLC may operate via a unitary or mixed mode mechanism.
- Mixed mode mechanisms utilize ion exchange and hydrophobic retention in the same column; for example, the solid phase of a mixed-mode SPE column may exhibit strong anion exchange and hydrophobic retention; or may exhibit column exhibit strong cation exchange and hydrophobic retention.
- chromatography refers to a process in which a chemical mixture carried by a liquid or gas is separated into components as a result of differential distribution of the chemical entities as they flow around or over a stationary liquid or solid phase.
- liquid chromatography means a process of selective retardation of one or more components of a fluid solution as the fluid uniformly percolates through a column of a finely divided substance, or through capillary passageways. The retardation results from the distribution of the components of the mixture between one or more stationary phases and the bulk fluid, (i.e., mobile phase), as this fluid moves relative to the stationary phase(s).
- liquid chromatography include reverse phase liquid chromatography (RPLC), high performance liquid chromatography (HPLC), and turbulent flow liquid chromatography (TFLC) (sometimes known as high turbulence liquid chromatography (HTLC) or high throughput liquid chromatography).
- HPLC high performance liquid chromatography
- HPLC high pressure liquid chromatography
- TFLC turbulent flow liquid chromatography
- TFLC turbulent flow liquid chromatography
- TFLC has been applied in the preparation of samples containing two unnamed drugs prior to analysis by mass spectrometry. See, e.g., Zimmer et al., J Chromatogr A 854: 23-35 (1999 ); see also, U.S. Patents No. 5,968,367 , 5,919,368 , 5,795,469 , and 5,772,874 , which further explain TFLC.
- laminar flow When fluid flows slowly and smoothly, the flow is called “laminar flow”. For example, fluid moving through an HPLC column at low flow rates is laminar. In laminar flow the motion of the particles of fluid is orderly with particles moving generally in straight lines. At faster velocities, the inertia of the water overcomes fluid frictional forces and turbulent flow results. Fluid not in contact with the irregular boundary "outruns” that which is slowed by friction or deflected by an uneven surface. When a fluid is flowing turbulently, it flows in eddies and whirls (or vortices), with more "drag" than when the flow is laminar.
- Turbulent Flow Analysis Measurement and Prediction, P.S. Bernard & J.M. Wallace, John Wiley & Sons, Inc., (2000 ); An Introduction to Turbulent Flow, Jean Mathieu & Julian Scott, Cambridge University Press (2001 )).
- GC gas chromatography
- large particle column or “extraction column” refers to a chromatography column containing an average particle diameter greater than about 50 ⁇ m.
- analytical column refers to a chromatography column having sufficient chromatographic plates to effect a separation of materials in a sample that elute from the column sufficient to allow a determination of the presence or amount of an analyte.
- the analytical column contains particles of about 5 ⁇ m in diameter. Such columns are often distinguished from “extraction columns", which have the general purpose of separating or extracting retained material from non-retained materials in order to obtain a purified sample for further analysis.
- the terms “on-line” and “inline”, for example as used in “on-line automated fashion” or “on-line extraction” refers to a procedure performed without the need for operator intervention.
- the term “off-line” as used herein refers to a procedure requiring manual intervention of an operator.
- MS mass spectrometry
- MS refers to an analytical technique to identify compounds by their mass.
- MS refers to methods of filtering, detecting, and measuring ions based on their mass-to-charge ratio, or "m/z”.
- MS technology generally includes (1) ionizing the compounds to form charged compounds; and (2) detecting the molecular weight of the charged compounds and calculating a mass-to-charge ratio. The compounds may be ionized and detected by any suitable means.
- a “mass spectrometer” generally includes an ionizer and an ion detector.
- one or more molecules of interest are ionized, and the ions are subsequently introduced into a mass spectrometric instrument where, due to a combination of magnetic and electric fields, the ions follow a path in space that is dependent upon mass (“m”) and charge (“z").
- mass m
- z charge
- operating in negative ion mode refers to those mass spectrometry methods where negative ions are generated and detected.
- operating in positive ion mode refers to those mass spectrometry methods where positive ions are generated and detected.
- the term "ionization” or “ionizing” refers to the process of generating an analyte ion having a net electrical charge equal to one or more electron units. Negative ions are those having a net negative charge of one or more electron units, while positive ions are those having a net positive charge of one or more electron units.
- EI electron ionization
- CI chemical ionization
- a reagent gas e.g. ammonia
- analyte ions are formed by the interaction of reagent gas ions and analyte molecules.
- the term "fast atom bombardment” or “FAB” refers to methods in which a beam of high energy atoms (often Xe or Ar) impacts a non-volatile sample, desorbing and ionizing molecules contained in the sample.
- Test samples are dissolved in a viscous liquid matrix such as glycerol, thioglycerol, m-nitrobenzyl alcohol, 18-crown-6 crown ether, 2-nitrophenyloctyl ether, sulfolane, diethanolamine, and triethanolamine.
- a viscous liquid matrix such as glycerol, thioglycerol, m-nitrobenzyl alcohol, 18-crown-6 crown ether, 2-nitrophenyloctyl ether, sulfolane, diethanolamine, and triethanolamine.
- matrix-assisted laser desorption ionization refers to methods in which a non-volatile sample is exposed to laser irradiation, which desorbs and ionizes analytes in the sample by various ionization pathways, including photo-ionization, protonation, deprotonation, and cluster decay.
- MALDI matrix-assisted laser desorption ionization
- the sample is mixed with an energy-absorbing matrix, which facilitates desorption of analyte molecules.
- the term "surface enhanced laser desorption ionization” or “SELDI” refers to another method in which a non-volatile sample is exposed to laser irradiation, which desorbs and ionizes analytes in the sample by various ionization pathways, including photo-ionization, protonation, deprotonation, and cluster decay.
- SELDI the sample is typically bound to a surface that preferentially retains one or more analytes of interest.
- this process may also employ an energy-absorbing material to facilitate ionization.
- electrospray ionization refers to methods in which a solution is passed along a short length of capillary tube, to the end of which is applied a high positive or negative electric potential. Solution reaching the end of the tube is vaporized (nebulized) into a jet or spray of very small droplets of solution in solvent vapor. This mist of droplets flows through an evaporation chamber, which is heated slightly to prevent condensation and to evaporate solvent. As the droplets get smaller the electrical surface charge density increases until such time that the natural repulsion between like charges causes ions as well as neutral molecules to be released.
- APCI atmospheric pressure chemical ionization
- mass spectrometry methods that are similar to ESI; however, APCI produces ions by ion-molecule reactions that occur within a plasma at atmospheric pressure.
- the plasma is maintained by an electric discharge between the spray capillary and a counter electrode.
- ions are typically extracted into the mass analyzer by use of a set of differentially pumped skimmer stages.
- a counterflow of dry and preheated N 2 gas may be used to improve removal of solvent.
- the gas-phase ionization in APCI can be more effective than ESI for analyzing less-polar species.
- atmospheric pressure photoionization or "APPI” as used herein refers to a form of ionization where the mechanism for the ionization of molecule M is photon absorption and electron ejection to form the molecular ion M+. Because the energy of the absorbed photon is typically just above the ionization potential, the molecular ion is less susceptible to dissociation. In many cases it may be possible to analyze samples without the need for chromatography, thus saving significant time and expense. In the presence of water vapor or protic solvents, the molecular ion can extract H to form MH+. This tends to occur if M has a high proton affinity.
- ICP inductively coupled plasma
- LDTD Laser diode thermal desorption
- a sample containing the analyte is thermally desorbed into the gas phase by a laser pulse.
- the laser hits the back of a specially made 96-well plate with a metal base.
- the laser pulse heats the base and the heat causes the sample to transfer into the gas phase.
- the gas phase sample may then be drawn into an ionization source, where the gas phase sample is ionized in preparation for analysis in the mass spectrometer.
- ionization of the gas phase sample may be accomplished by any suitable technique known in the art, such as by ionization with a corona discharge (for example by APCI).
- field desorption refers to methods in which a non-volatile test sample is placed on an ionization surface, and an intense electric field is used to generate analyte ions.
- selective ion monitoring is a detection mode for a mass spectrometric instrument in which only ions within a relatively narrow mass range, typically about one mass unit, are detected.
- multiple reaction mode is a detection mode for a mass spectrometric instrument in which a precursor ion and one or more fragment ions are selectively detected.
- the term "lower limit of quantification”, “lower limit of quantitation” or “LLOQ” refers to the point where measurements become quantitatively meaningful.
- the analyte response at this LOQ is identifiable, discrete and reproducible with a relative standard deviation (RSD %) of less than 20% and an accuracy of 80% to 120%.
- LOD limit of detection
- an “amount" of an analyte in a body fluid sample refers generally to an absolute value reflecting the mass of the analyte detectable in volume of sample. However, an amount also contemplates a relative amount in comparison to another analyte amount. For example, an amount of an analyte in a sample can be an amount which is greater than a control or normal level of the analyte normally present in the sample.
- Methods are described for measuring vitamin D in a sample. More specifically, mass spectrometric methods are described for detecting and quantifying vitamin D in a sample. The methods may utilize Cookson-type reagents, such as PTAD, to generate derivatized vitamin D. However, in some methods, no derivatizing agent is used, and underivatized vitamin D 2 and/or vitamin D 3 are detected by mass spectrometry.
- Cookson-type reagents such as PTAD
- no derivatizing agent is used, and underivatized vitamin D 2 and/or vitamin D 3 are detected by mass spectrometry.
- the methods may use an extraction chromatography technique, such as turbulent flow liquid chromatography (TFLC), to perform a purification of underivatized or derivatized vitamin D 2 and/or vitamin D 3 , combined with methods of mass spectrometry (MS), thereby providing a high-throughput assay system for detecting and quantifying vitamin D 2 and/or vitamin D 3 in a sample.
- TFLC turbulent flow liquid chromatography
- MS mass spectrometry
- the underivatized or derivatized vitamin D 2 and/or vitamin D 3 is ionized with LDTD.
- Preferred embodiments are particularly well suited for application in large clinical laboratories for automated vitamin D quantification.
- Suitable test samples for use in methods disclosed herein include any test sample that may contain the analyte of interest.
- a sample is a biological sample; that is, a sample obtained from any biological source, such as an animal, a cell culture, an organ culture, etc.
- samples are obtained from a mammalian animal, such as a dog, cat, horse, etc. Particularly preferred mammalian animals are primates, most preferably male or female humans.
- Preferred samples comprise bodily fluids such as blood, plasma, serum, saliva, cerebrospinal fluid, or tissue samples; preferably plasma (including EDTA and heparin plasma) and serum; most preferably serum.
- Such samples may be obtained, for example, from a patient; that is, a living person, male or female, presenting oneself in a clinical setting for diagnosis, prognosis, or treatment of a disease or condition.
- kits for a vitamin D quantitation assay may include a kit comprising the compositions provided herein.
- a kit may include packaging material and measured amounts of a Cookson-type reagent and an isotopically labeled internal standard, in amounts sufficient for at least one assay.
- the kits will also include instructions recorded in a tangible form (e.g., contained on paper or an electronic medium) for using the packaged reagents for use in a vitamin D quantitation assay.
- Calibration and QC pools for use in embodiments disclosed herein are preferably prepared using a matrix similar to the intended sample matrix.
- vitamin D may be enriched relative to one or more other components in the sample (e.g. protein) by various methods known in the art, including for example, liquid chromatography, filtration, centrifugation, thin layer chromatography (TLC), electrophoresis including capillary electrophoresis, affinity separations including immunoaffinity separations, extraction methods including ethyl acetate or methanol extraction, and the use of chaotropic agents or any combination of the above or the like.
- TLC thin layer chromatography
- electrophoresis including capillary electrophoresis
- affinity separations including immunoaffinity separations
- extraction methods including ethyl acetate or methanol extraction, and the use of chaotropic agents or any combination of the above or the like.
- Protein precipitation is one method of preparing a test sample, especially a biological test sample, such as serum or plasma.
- Protein purification methods are well known in the art, for example, Polson et al., Journal of Chromatography B 2003, 785:263-275 , describes protein precipitation techniques suitable for use in methods disclosed herein.
- Protein precipitation may be used to remove most of the protein from the sample leaving vitamin D in the supernatant.
- the samples may be centrifuged to separate the liquid supernatant from the precipitated proteins; alternatively the samples may be filtered to remove precipitated proteins.
- the resultant supernatant or filtrate may then be applied directly to mass spectrometry analysis; or alternatively to liquid chromatography and subsequent mass spectrometry analysis.
- samples such as plasma or serum
- samples may be purified by a hybrid protein precipitation / liquid-liquid extraction method.
- a sample is mixed with methanol, ethyl acetate, and water, and the resulting mixture is vortexed and centrifuged. The resulting supernatant is removed, dried to completion and reconstituted in acetonitrile.
- the purified vitamin D may then be derivatized with any Cookson-type reagent, preferably PTAD or an isotopically labeled variant thereof.
- LC liquid chromatography
- Traditional HPLC analysis relies on column packing in which laminar flow of the sample through the column is the basis for separation of the analyte of interest from the sample.
- separation in such columns is a diffusional process and may select LC, including HPLC, instruments and columns that are suitable for use with derivatized vitamin D.
- the chromatographic column typically includes a medium (i.e., a packing material) to facilitate separation of chemical moieties (i.e., fractionation).
- the medium may include minute particles, or may include a monolithic material with porous channels.
- a surface of the medium typically includes a bonded surface that interacts with the various chemical moieties to facilitate separation of the chemical moieties.
- One suitable bonded surface is a hydrophobic bonded surface such as an alkyl bonded, cyano bonded surface, or highly pure silica surface.
- Alkyl bonded surfaces may include C-4, C-8, C-12, or C-18 bonded alkyl groups.
- the column is a highly pure silica column (such as a Thermo Hypersil Gold Aq column).
- the chromatographic column includes an inlet port for receiving a sample and an outlet port for discharging an effluent that includes the fractionated sample. The sample may be supplied to the inlet port directly, or from an extraction column, such as an on-line SPE cartridge or a TFLC extraction column.
- the sample may be applied to the LC column at the inlet port, eluted with a solvent or solvent mixture, and discharged at the outlet port.
- Different solvent modes may be selected for eluting the analyte(s) of interest.
- liquid chromatography may be performed using a gradient mode, an isocratic mode, or a polytyptic (i.e. mixed) mode.
- the separation of materials is effected by variables such as choice of eluent (also known as a "mobile phase”), elution mode, gradient conditions, temperature, etc.
- an analyte may be purified by applying a sample to a column under conditions where the analyte of interest is reversibly retained by the column packing material, while one or more other materials are not retained.
- a first mobile phase condition can be employed where the analyte of interest is retained by the column, and a second mobile phase condition can subsequently be employed to remove retained material from the column, once the non-retained materials are washed through.
- an analyte may be purified by applying a sample to a column under mobile phase conditions where the analyte of interest elutes at a differential rate in comparison to one or more other materials. Such procedures may enrich the amount of one or more analytes of interest relative to one or more other components of the sample.
- HPLC is conducted with an alkyl bonded analytical column chromatographic system.
- a highly pure silica column such as a Thermo Hypersil Gold Aq column
- HPLC and/or TFLC are performed using HPLC Grade water as mobile phase A and HPLC Grade ethanol as mobile phase B.
- valves and connector plumbing By careful selection of valves and connector plumbing, two or more chromatography columns may be connected as needed such that material is passed from one to the next without the need for any manual steps.
- the selection of valves and plumbing is controlled by a computer pre-programmed to perform the necessary steps.
- the chromatography system is also connected in such an on-line fashion to the detector system, e.g., an MS system.
- the detector system e.g., an MS system.
- an extraction column may be used for purification of vitamin D metabolites prior to mass spectrometry.
- samples may be extracted using a extraction column which captures the analyte, then eluted and chromatographed on a second extraction column or on an analytical HPLC column prior to ionization.
- sample extraction with a TFLC extraction column may be accomplished with a large particle size (50 ⁇ m) packed column.
- Sample eluted off of this column may then be transferred to an HPLC analytical column for further purification prior to mass spectrometry. Because the steps involved in these chromatography procedures may be linked in an automated fashion, the requirement for operator involvement during the purification of the analyte can be minimized. This feature may result in savings of time and costs, and eliminate the opportunity for operator error.
- protein precipitation is accomplished with a hybrid protein precipitation / liquid-liquid extraction method which includes methanol protein precipitation and ethyl acetate/water extraction from serum.
- the resulting vitamin D metabolites may be derivatized prior to being subjected to an extraction column.
- the hybrid protein precipitation / liquid-liquid extraction method and the extraction column are connected in an on-line fashion.
- the extraction column is a C-8 extraction column, such as a Cohesive Technologies C8XL online extraction column (50 ⁇ m particle size, 0.5 x 50 mm) or equivalent.
- the eluent from the extraction column may then be applied to an analytical LC column, such as a HPLC column in an on-line fashion, prior to mass spectrometric analysis.
- an analytical LC column such as a HPLC column in an on-line fashion
- derivatized vitamin D may be ionized by any method known to the skilled artisan. Mass spectrometry is performed using a mass spectrometer, which includes an ion source for ionizing the fractionated sample and creating charged molecules for further analysis.
- ionization of the sample may be performed by electron ionization, chemical ionization, electrospray ionization (ESI), photon ionization, atmospheric pressure chemical ionization (APCI), photoionization, atmospheric pressure photoionization (APPI), Laser diode thermal desorption (LDTD), fast atom bombardment (FAB), liquid secondary ionization (LSI), matrix assisted laser desorption ionization (MALDI), field ionization, field desorption, thermospray/plasmaspray ionization, surface enhanced laser desorption ionization (SELDI), inductively coupled plasma (ICP) and particle beam ionization.
- ESI electron ionization
- APCI atmospheric pressure chemical ionization
- APPI atmospheric pressure photoionization
- LDTD Laser diode thermal desorption
- FAB fast atom bombardment
- LSI liquid secondary ionization
- MALDI matrix assisted laser desorption ionization
- field ionization
- Derivatized vitamin D may be ionized in positive or negative mode.
- derivatized vitamin D is ionized by APCI or LDTD in positive ion mode.
- mass spectrometry techniques generally, after the sample has been ionized, the positively or negatively charged ions thereby created may be analyzed to determine a mass-to-charge ratio.
- Suitable analyzers for determining mass-to-charge ratios include quadrupole analyzers, ion traps analyzers, and time-of-flight analyzers. Exemplary ion trap methods are described in Bartolucci, et al., Rapid Commun. Mass Spectrom. 2000, 14:967-73 .
- the ions may be detected using several detection modes. For example, selected ions may be detected, i.e. using a selective ion monitoring mode (SIM), or alternatively, mass transitions resulting from collision induced dissociation or neutral loss may be monitored, e.g., multiple reaction monitoring (MRM) or selected reaction monitoring (SRM).
- MRM multiple reaction monitoring
- SRM selected reaction monitoring
- the mass-to-charge ratio is determined using a quadrupole analyzer.
- ions in an oscillating radio frequency field experience a force proportional to the DC potential applied between electrodes, the amplitude of the RF signal, and the mass/charge ratio.
- the voltage and amplitude may be selected so that only ions having a particular mass/charge ratio travel the length of the quadrupole, while all other ions are deflected.
- quadrupole instruments may act as both a “mass filter” and as a “mass detector” for the ions injected into the instrument.
- a precursor ion also called a parent ion
- a precursor ion generated from a molecule of interest
- the precursor ion subsequently fragmented to yield one or more fragment ions (also called daughter ions or product ions) that are then analyzed in a second MS procedure.
- fragment ions also called daughter ions or product ions
- the MS/MS technique may provide an extremely powerful analytical tool.
- the combination of filtration/fragmentation may be used to eliminate interfering substances, and may be particularly useful in complex samples, such as biological samples.
- Alternate modes of operating a tandem mass spectrometric instrument include product ion scanning and precursor ion scanning.
- product ion scanning and precursor ion scanning.
- Chromatographic-Mass Spectrometric Food Analysis for Trace Determination of Pesticide Residues Chapter 8 (Amadeo R. Fernandez-Alba, ed., Elsevier 2005) (387 ).
- the results of an analyte assay may be related to the amount of the analyte in the original sample by numerous methods known in the art. For example, given that sampling and analysis parameters are carefully controlled, the relative abundance of a given ion may be compared to a table that converts that relative abundance to an absolute amount of the original molecule. Alternatively, external standards may be run with the samples, and a standard curve constructed based on ions generated from those standards. Using such a standard curve, the relative abundance of a given ion may be converted into an absolute amount of the original molecule. In certain preferred embodiments, an internal standard is used to generate a standard curve for calculating the quantity of vitamin D.
- one or more isotopically labeled vitamin D e.g., vitamin D 2 -[6, 19, 19]- 2 H 3 and vitamin D 3 -[6, 19, 19]- 2 H 3
- vitamin D 2 -[6, 19, 19]- 2 H 3 may be used as internal standards.
- Numerous other methods for relating the amount of an ion to the amount of the original molecule will be well known to those of ordinary skill in the art.
- One or more steps of the methods may be performed using automated machines.
- one or more purification steps are performed on-line, and more preferably all of the purification and mass spectrometry steps may be performed in an on-line fashion.
- CAD collision activated dissociation
- vitamin D in a sample is detected and/or quantified using MS/MS as follows.
- the samples are first purified by protein precipitation or a hybrid protein precipitation / liquid-liquid extraction.
- vitamin D in the purified sample is optionally derivatized with a Cookson-type reagent, such as PTAD.
- the purified samples are then subjected to liquid chromatography, preferably on an extraction column (such as a TFLC column) followed by an analytical column (such as a HPLC column); the flow of liquid solvent from a chromatographic column enters the nebulizer interface of an MS/MS analyzer; and the solvent/analyte mixture is converted to vapor in the heated charged tubing of the interface.
- the analyte(s) (e.g., derivatized or underivatized vitamin D) contained in the solvent, are ionized by applying a large voltage to the solvent/analyte mixture. As the analytes exit the charged tubing of the interface, the solvent/analyte mixture nebulizes and the solvent evaporates, leaving analyte ions.
- the analyte ions e.g. precursor ions, pass through the orifice of the instrument and enter the first quadrupole.
- Quadrupoles 1 and 3 are mass filters, allowing selection of ions (i.e., selection of "precursor” and “fragment” ions in Q1 and Q3, respectively) based on their mass to charge ratio (m/z).
- Quadrupole 2 (Q2) is the collision cell, where ions are fragmented.
- the first quadrupole of the mass spectrometer (Q1) selects for ions with the mass to charge ratios of interest.
- Precursor ions with the correct mass/charge ratios are allowed to pass into the collision chamber (Q2), while unwanted ions with any other mass/charge ratio collide with the sides of the quadrupole and are eliminated.
- Precursor ions entering Q2 collide with neutral argon gas molecules and fragment.
- the fragment ions generated are passed into quadrupole 3 (Q3), where derivatized or underivatized vitamin D fragment ions are selected while other ions are eliminated.
- the methods may involve MS/MS performed in either positive or negative ion mode; preferably positive ion mode.
- MS/MS performed in either positive or negative ion mode; preferably positive ion mode.
- one of ordinary skill is capable of identifying one or more fragment ions of a particular precursor ion of a derivatized vitamin D that may be used for selection in quadrupole 3 (Q3).
- ions collide with the detector they produce a pulse of electrons that are converted to a digital signal.
- the acquired data is relayed to a computer, which plots counts of the ions collected versus time.
- the resulting mass chromatograms are similar to chromatograms generated in traditional HPLC-MS methods.
- the areas under the peaks corresponding to particular ions, or the amplitude of such peaks may be measured and correlated to the amount of the analyte of interest.
- the area under the curves, or amplitude of the peaks, for fragment ion(s) and/or precursor ions are measured to determine the amount of vitamin D.
- the relative abundance of a given ion may be converted into an absolute amount of the original analyte using calibration standard curves based on peaks of one or more ions of an internal molecular standard.
- Example 1 Hybrid Protein Precipitation / Liquid-Liquid Extraction and Cookson-type Derivatization
- a Perkin-Elmer Janus robot and a TomTec Quadra Tower robot was used to automate the following procedure. For each sample, 50 ⁇ L of serum was added to a well of a 96 well plate. Then 25 ⁇ L of internal standard cocktail (containing isotopically labeled vitamin D 3 -[6, 19, 19]- 2 H 3 ) was added to each well, and the plate vortexed. Then 75 ⁇ L of methanol was added, followed by additional vortexing. 300 ⁇ L of ethyl acetate and 75 ⁇ L of water was then added, followed by additional vortexing, centrifugation, and transfer of the resulting supernatant to a new 96-well plate.
- internal standard cocktail containing isotopically labeled vitamin D 3 -[6, 19, 19]- 2 H 3
- the transferred liquid in the second 96-well plate was dried to completion under a flowing nitrogen gas manifold.
- Derivatization was accomplished by adding 100 ⁇ L of a 0.1 mg/mL solution of the Cookson-type derivatization agent PTAD in acetonitrile to each well.
- the derivatization reaction was allowed to proceed for approximately one hour, and was quenched by adding 100 ⁇ L of water to the reaction mixture.
- Sample injection was performed with a Cohesive Technologies Aria TX-4 TFLC system using Aria OS V 1.5.1 or newer software.
- the TFLC system automatically injected an aliquot of the above prepared samples into a Cohesive Technologies C8XL online extraction column (50 ⁇ m particle size, 005 x 50 mm, from Cohesive Technologies, Inc.) packed with large particles.
- the samples were loaded at a high flow rate to create turbulence inside the extraction column. This turbulence ensured optimized binding of derivatized vitamin D to the large particles in the column and the passage of excess derivatizing reagent and debris to waste.
- Thermo Hypersil Gold Aq analytical column (5 ⁇ m particle size, 50 x 2.1 mm), with a water/ethanol elution gradient.
- the HPLC gradient was applied to the analytical column, to separate vitamin D from other analytes contained in the sample.
- Mobile phase A was water and mobile phase B was ethanol.
- the HPLC gradient started with a 35 % organic gradient which was ramped to 99 % in approximately 65 seconds.
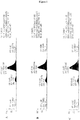
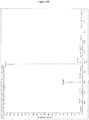
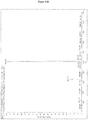
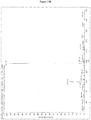
- MS/MS was performed on the above generated samples using a Finnigan TSQ Quantum Ultra MS/MS system (Thermo Electron Corporation). The following software programs, all from Thermo Electron, were used in the Examples described herein: Quantum Tune Master V 1.5 or newer, Xcalibur V 2.07 or newer, LCQuan V 2.56 (Thermo Finnigan) or newer, and ARIA OS v1.5.1 (Cohesive Technologies) or newer. Liquid solvent/analyte exiting the analytical column flowed to the nebulizer interface of the MS/MS analyzer. The solvent/analyte mixture was converted to vapor in the tubing of the interface. Analytes in the nebulized solvent were ionized by APCI.
- Ions passed to the first quadrupole (Q1) which selected vitamin D 2 and vitamin D 3 precursor ions with a mass-to-charge ratio of 572.3 ⁇ 0.5 m/z and 560.3 ⁇ 0.5 m/z, respectively.
- Mass spectrometer settings are shown in Table 1. Simultaneously, the same process using isotope dilution mass spectrometry was carried out with internal standard, vitamin D 3 -[6, 19, 19]- 2 H 3 .
- Mass transitions used for detection and quantitation during validation on positive polarity and at the indicated collision energies are shown in Table 2.
- Table 1 Mass Spectrometer Settings for Detection of PTAD-vitamin D 2 , PTAD-vitamin D 3 , and vitamin D 3 -[6, 19, 19]- 2 H 3 (internal standard) (Positive Polarity) Mass Spectrometric Instrument Settings Discharge Current 4.0 ⁇ A Vaporizer Temperature 300 °C Sheath Gas Pressure 15 Ion Sweep Gas Pressure 0.0 Aux Gas Pressure 5 Capillary Temperature 300 °C Skimmer Offset -10 V Collision Pressure 1.5 mTorr Collision Cell Energy 15 V Table 2.
- Exemplary chromatograms for PTAD-vitamin D 2 , PTAD-vitamin D 3 , PTAD-vitamin D 3 -[6, 19, 19]- 2 H 3 are shown in Figures 1A, 1B, and 1C , respectively.
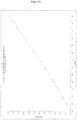
- Linearity was determined by diluting four pools of serum with high endogenous concentration of either vitamin D 2 or vitamin D 3 and analyzing dilutions of 75%, 50%, and 25% in duplicate according to the methods of Examples 1-3. Specimens may be diluted 1:4 with average recovery of 102%, permitting a Clinically Reportable Range (CRR) of 2-240 ng/mL within precision limits of 85%-115%CV. Measured values and percent recoveries from these studies are shown in Table 3. Table 3.
- Example 5 Analytical Sensitivity: Lower Limit of Quantitation (LLOQ) and Limit of Detection (LOD)
- the lower limit of quantitation is the point where measurements become quantitatively meaningful.
- the analyte response at this LLOQ is identifiable, discrete and reproducible with a precision (i.e., coefficient of variation (CV)) of greater than 20% and an accuracy of 80% to 120%.
- the LLOQ was determined by assaying samples with known analyte concentrations (2 ng/mL, 5 ng/mL, 10 ng/mL, 15 ng/mL, 20 ng/mL, 40 ng/mL, and 60 ng/mL) in quadruplicate five times according to the methods of Examples 1-3, then evaluating the reproducibility.
- the limit of detection is the point where a measured value is larger than the uncertainty associated with it and is defined arbitrarily as four standard deviations (SD) from the zero concentration.
- SD standard deviations
- Selectivity is the ability of an analytical method to differentiate and quantify the analyte in the presence of other components in the sample. A blank was analyzed in 20 replicates according to the methods of Examples 1-3 and the resulting area ratios were statistically analyzed to determine that the LOD for both vitamin D 2 and vitamin D 3 are 0.4 ng/mL. Data collected to determine LOD for each analyte is shown in Table 6. Table 6.
- the intra-assay variation is defined as the reproducibility of a sample within an assay and was determined by assaying 20 replicates of a sample from each of three QC pools according to the methods of Examples 1-3. Data collected from these analyses are shown in Tables 8 and 9 for vitamin D 2 and vitamin D 3 . respectively.
- the concentrations of the analytes in the QC pools were determined to be 6.6 ng/mL, 20.6 ng/mL, and 52.6 ng/mL for vitamin D 2 , and 4.9 ng/mL, 20.5 ng/mL, and 48.6 ng/mL for Vitamin D 3 .
- the inter-assay variation is defined as the reproducibility (CV) of a sample between assays.
- the inter-assay variation (CV) for the pools was determined for vitamin D 2 and vitamin D 3 .
- Vitamin D 2 the CVs were determined to be 6.7%, 5.6%, and 4.0% with mean concentrations of 6.5 ng/mL, 21.1 ng/mL, and 50.5 ng/mL, respectively.
- Vitamin D 3 the CVs were determined to be 6.5%, 5.9%, and 4.2% with mean concentrations of 4.7 ng/mL, 20.8 ng/mL, and 46.8 ng/mL, respectively.
- Hemolysis Interference The effects of hemolysis in the assay described in Examples 1-3 were evaluated by spiking hemoglobin into serum pools containing elevated vitamin D 2 and vitamin D 3 . A fresh blood sample was centrifuged to yield packed red blood cells. The cells were reconstituted in deionized water and frozen to achieve cell lysis. This crude hemoglobin solution was then was spiked into the pools to generate lightly (100 mg/dL) and moderately (500 mg/dL) hemolyzed samples. Specimens were analyzed in duplicate according the method in Examples 1-3 and results were compared to the control pool result and a percent difference was calculated. The data shows that none of the hemoglobin spikes was >15% different than control, for either analyte).
- Icteria Interference The effects of icteria in the assay described in Examples 1-3 were evaluated by spiking bilirubin into serum pools containing elevated vitamin D 2 and vitamin D 3 . A concentrated solution of bilirubin was spiked into the pools to generate lightly (10 mg/dL) and moderately (50 mg/dL) icteric specimens. Specimens were analyzed in duplicate according to the method in Examples 1-3 and results were compared to the non-icteric pool result and the accuracy was calculated. The data shows that both analytes are unaffected by icteria (all values within acceptable accuracy range of 85-115%). Therefore, icteric specimens are acceptable.
- Vacutainers were collected from 10 sources into four different Vacutainer® containers.
- the Vacutainers used were Red-Top (silicon-coated serum tubes), SST (Serum Separator Tubes, which result in gel-barrier serum), EDTA tubes, and Sodium Heparin tubes.
- Serum specimens from 140 patients were analyzed according to the method described in Examples 1-3 to quantitate vitamin D 3 .
- the results ranged from ⁇ 2 ng/mL to about 63 ng/mL vitamin D 3 , with 95% of the results falling within the range of ⁇ 2 ng/mL to about 20 ng/mL.
- the results of these analyses are presented in Table 17.
- Vitamin D 3 Measured (ng/mL) Expected (ng/mL) Recovery (%) Measured (ng/mL) Expected (ng/mL) Recovery (%) 1 100% A 49.0 2.1 80/20 A/B 37.8 39.3 103.8 3.3 3.5 106.1 50/50 A/B 26.0 24.7 94.8 5.6 5.5 96.9 20/80 A/B 10.5 10.1 96.5 7.6 7.5 98.5 100% B 0.4 8.8 2 100% A 5.0 2.6 80/20 A/B 4.9 4.2 85.5 6.6 6.6 99.4 50/50 A/B 2.9 2.9 101.7 11.8 12.5 106.2 20/80 A/B 1.6 1.7 106.2 17.7 18.5 104.3 100% B 0.9 22.4 3 100% A 8.8 3.0 80/20 A/B 7.6 7.4 96.7 6.6 6.6 101.2 50/50 A/B 5.4 5.2 95.8 11.3 12.1 106.7 20/80 A/B 3.1 3.0 99.1 16.3 17.5
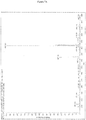
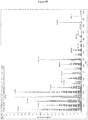
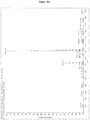
- Example 14 Exemplary spectra from MS/MS analysis of Vitamin D 2 and Vitamin D 3
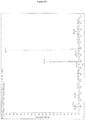
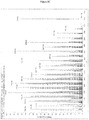
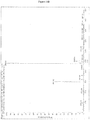
- Exemplary Q1 scan spectra from the tandem mass spectrometric analysis of vitamin D 2 , vitamin D 2 -[6, 19, 19]- 2 H 3 , and vitamin D 2 -[26, 26, 26, 27, 27, 27]- 2 H 6 are shown in Figures 5A , 6A , and 7A , respectively.
- These analyses were conducted by directly injecting standard solutions containing the analyte of interest into a Finnigan TSQ Quantum Ultra MS/MS system (Thermo Electron Corporation).
- a liquid chromatography mobile phase was simulated by passing 800 ⁇ L/min of 80% acetonitrile, 20% water with 0.1% formic acid through an HPLC column, upstream of introduction of the analyte.
- the analytes were ionized by APCI as described above.
- the spectra were collected by scanning Q1 across a m/z range of about 300 to 450.
- Exemplary product ion scans generated from two different precursor ions for each of vitamin D 2 , vitamin D 2 -[6, 19, 19]- 2 H 3 , and vitamin D 2 -[26, 26, 26, 27, 27, 27]- 2 H 6 are presented in Figures 5B-C , 6B-C , and 7B-C , respectively.
- the precursor ions selected in Q1 and the collision energies used to generate these product ion spectra are indicated in Table 20.
- Exemplary MRM transitions for the quantitation of vitamin D 2 include fragmenting a precursor ion with a m/z of about 397.2 to a product ion with a m/z of about 159.0; and fragmenting a precursor ion with a m/z of about 379.2 to a product ion with a m/z of about 158.9.
- Exemplary MRM transitions for the quantitation of vitamin D 2 -[6, 19, 19]- 2 H 3 include fragmenting a precursor ion with a m/z of about 400.2 to a product ion with a m/z of about 147.0; and fragmenting a precursor ion with a m/z of about 382.2 to a product ion with a m/z of about 312.2.
- Exemplary MRM transitions for the quantitation of vitamin D 2 -[26, 26, 26, 27, 27, 27]- 2 H 6 include fragmenting a precursor ion with a m/z of about 403.2 to a product ion with a m/z of about 159.1; and fragmenting a precursor ion with a m/z of about 385.2 to a product ion with a m/z of about 159.0.
- FIG. 5B-C , 6B-C , and 7B-C several other product ions are generated upon fragmentation of the precursor ions.
- Additional product ions may be selected from those indicated in Figures 5B-C , 6B-C , and 7B-C to replace or augment the exemplary fragment ions.
- additional product ions generated by fragmentation of the vitamin D 2 precursor ion with m/z of about 397.2 include ions with m/z of about 146.9, 133.1, and 121.0.
- Exemplary additional product ions generated by fragmentation of the vitamin D 2 precursor ion with m/z of about 379.2 include ions with m/z of about 283.2, 187.3, and 175.2. Table 20.
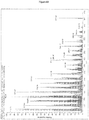
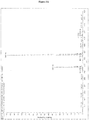
- Exemplary Q1 scan spectra from the tandem mass spectrometric analysis of vitamin D 3 , vitamin D 3 -[6, 19, 19]- 2 H 3 , and vitamin D 3 -[26, 26, 26, 27, 27, 27]- 2 H 6 are shown in Figures 8A , 9A , and 10A , respectively.
- These analyses were conducted by directly injecting standard solutions containing the analyte of interest into a Finnigan TSQ Quantum Ultra MS/MS system (Thermo Electron Corporation).
- a liquid chromatography mobile phase was simulated by passing 800 ⁇ L/min of 80% acetonitrile, 20% water with 0.1% formic acid through an HPLC column, upstream of introduction of the analyte.
- the spectra were collected by scanning Q1 across a m/z range of about 300 to 450.
- Exemplary product ion scans generated from two different precursor ions for each of vitamin D 3 , vitamin D 3 -[6, 19, 19]- 2 H 3 , and vitamin D 3 -[26, 26, 26, 27, 27, 27]- 2 H 6 are presented in Figures 8B-C , 9B-C , and 10B-C , respectively.
- the precursor ions selected in Q1 and the collision energies used to generate these product ion spectra are indicated in Table 21.
- Exemplary MRM transitions for the quantitation of vitamin D 3 include fragmenting a precursor ion with a m/z of about 385.2 to a product ion with a m/z of about 147.0; and fragmenting a precursor ion with a m/z of about 367.2 to a product ion with a m/z of about 159.0.
- Exemplary MRM transitions for the quantitation of vitamin D 3 -[6, 19, 19]- 2 H 3 include fragmenting a precursor ion with a m/z of about 388.2 to a product ion with a m/z of about 147.0; and fragmenting a precursor ion with a m/z of about 370.2 to a product ion with a m/z of about 162.0.
- Exemplary MRM transitions for the quantitation of vitamin D 3 -[26, 26, 26, 27, 27, 27]- 2 H 6 include fragmenting a precursor ion with a m/z of about 391.2 to a product ion with a m/z of about 159.1; and fragmenting a precursor ion with a m/z of about 373.2 to a product ion with a m/z of about 159.0.
- FIG. 8B-C , 9B-C , and 10B-C several other product ions are generated upon fragmentation of the precursor ions.
- Additional product ions may be selected from those indicated in Figures 8B-C , 9B-C , and 10B-C to replace or augment the exemplary fragment ions.
- additional product ions generated by fragmentation of the vitamin D 3 precursor ion with m/z of about 385.2 include ions with m/z of about 159.0, 133.1, and 107.1.
- Exemplary additional product ions generated by fragmentation of the vitamin D 3 precursor ion with m/z of about 367.2 include ions with m/z of about 172.9, 145.0, and 119.1. Table 21.
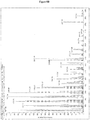
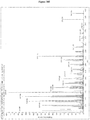
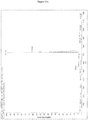
- Example 15 Exemplary spectra from MS/MS analysis of PTAD derivatized vitamin D 2 and vitamin D 3
- PTAD derivatives of vitamin D 2 , vitamin D 2 -[6, 19, 19]- 2 H 3 , vitamin D 2 -[26, 26, 26, 27, 27, 27]- 2 H 6 , vitamin D 3 , vitamin D 3 -[6, 19, 19]- 2 H 3 , and vitamin D 3 -[26, 26, 26, 27, 27, 27]- 2 H 6 were prepared by treating aliquots of stock solutions of each analyte with PTAD in acetonitrile. The derivatization reactions was allowed to proceed for approximately one hour, and were quenched by adding water to the reaction mixture. The derivatized analytes were then analyzed according to the procedure outlined above in Examples 2-3.
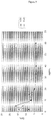
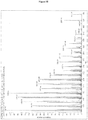
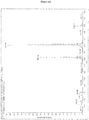
- Exemplary Q1 scan spectra from the analysis of samples containing PTAD-vitamin D 2 , PTAD-vitamin D 2 -[6, 19, 19]- 2 H 3 , and PTAD-vitamin D 2 -[26, 26, 26, 27, 27, 27]- 2 H 6 are shown in Figures 11A , 12A , and 13A , respectively. These analyses were conducted by directly injecting standard solutions containing the analyte of interest into a Finnigan TSQ Quantum Ultra MS/MS system (Thermo Electron Corporation). A liquid chromatography mobile phase was simulated by passing 800 ⁇ L/min of 80% acetonitrile, 20% water with 0.1% formic acid through an HPLC column, upstream of introduction of the analyte. The analytes were ionized by APCI as described above. The spectra were collected by scanning Q1 across a m/z range of about 500 to 620.
- Exemplary product ion scans generated from precursor ions for each of PTAD-vitamin D 2 , PTAD-vitamin D 2 -[6, 19, 19]- 2 H 3 , and PTAD-vitamin D 2 -[26, 26, 26, 27, 27, 27]- 2 H 6 are presented in Figures 11B , 12B , and 13B , respectively.
- the precursor ions selected in Q1 and the collision energies used to generate these product ion spectra are indicated in Table 22.
- An exemplary MRM transition for the quantitation of PTAD-vitamin D 2 includes fragmenting a precursor ion with a m/z of about 572.2 to a product ion with a m/z of about 297.9.
- An exemplary MRM transition for the quantitation of PTAD-vitamin D 2 -[6, 19, 19]- 2 H 3 includes fragmenting a precursor ion with a m/z of about 575.2 to a product ion with a m/z of about 301.0.
- An exemplary MRM transition for the quantitation of PTAD-vitamin D 2 -[26, 26, 26, 27, 27, 27]- 2 H 6 includes fragmenting a precursor ion with a m/z of about 578.2 to a product ion with a m/z of about 297.9.
- a precursor ion with a m/z of about 578.2 to a product ion with a m/z of about 297.9.
- Additional product ions may be selected from those indicated in Figures 11B , 12B , and 13B to replace or augment the exemplary fragment ions.
- additional product ions generated by fragmentation of the PTAD-vitamin D 2 precursor ion with m/z of about 572.2 include ions with m/z of about 280.1.
- Table 22 Precursor Ions and Collision Cell Energys for Fragmentation of PTAD-vitamin D 2 , PTAD-vitamin D 2 -[6, 19, 19]- 2 H 3 , and PTAD-vitamin D 2 -[26, 26, 26, 27, 27, 27]- 2 H 6
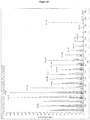
- Exemplary Q1 scan spectra from the analysis of samples containing PTAD-vitamin D 3 , PTAD-vitamin D 3 -[6, 19, 19]- 2 H 3 , and PTAD-vitamin D 3 -[26, 26, 26, 27, 27, 27]- 2 H 6 are shown in Figures 14A , 15A , and 16A , respectively.
- These analyses were conducted by directly injecting standard solutions containing the analyte of interest into a Finnigan TSQ Quantum Ultra MS/MS system (Thermo Electron Corporation).
- a liquid chromatography mobile phase was simulated by passing 800 ⁇ L/min of 80% acetonitrile, 20% water with 0.1% formic acid through an HPLC column, upstream of introduction of the analyte.
- the spectra were collected by scanning Q1 across a m/z range of about 500 to 620.
- Exemplary product ion scans generated from precursor ions for each of PTAD-vitamin D 3 , PTAD-vitamin D 3 -[6, 19, 19]- 2 H 3 , and PTAD-vitamin D 3 -[26, 26, 26, 27, 27, 27]- 2 H 6 are presented in Figures 14B , 15B , and 16B , respectively.
- the precursor ions selected in Q1 and the collision energies used to generate these product ion spectra are indicated in Table 23.
- An exemplary MRM transition for the quantitation of PTAD-vitamin D 3 includes fragmenting a precursor ion with a m/z of about 560.2 to a product ion with a m/z of about 298.0.
- An exemplary MRM transition for the quantitation of PTAD-vitamin D 3 -[6, 19, 19]- 2 H 3 includes fragmenting a precursor ion with a m/z of about 563.2 to a product ion with a m/z of about 301.0.
- An exemplary MRM transition for the quantitation of PTAD-vitamin D 3 -[26, 26, 26, 27, 27, 27]- 2 H 6 includes fragmenting a precursor ion with a m/z of about 566.2 to a product ion with a m/z of about 298.0.
- a precursor ion with a m/z of about 566.2 to a product ion with a m/z of about 298.0.
- Additional product ions may be selected from those indicated in Figures 14B , 15B , and 16B to replace or augment the exemplary fragment ions.
- additional product ions generated by fragmentation of the PTAD-vitamin D 3 precursor ion with m/z of about 560.2 include ions with m/z of about 280.0.
- Table 23 Precursor Ions and Collision Cell Energys for Fragmentation of PTAD-vitamin D 3 , PTAD-vitamin D 3 -[6, 19, 19]- 2 H 3 , and PTAD-vitamin D 3 -[26, 26, 26, 27, 27, 27]- 2 H 6
Description
- The invention relates to the quantitative measurement of non-metabolized vitamin D. In a particular aspect, the invention relates to methods for quantitative measurement of non-metabolized vitamin D by tandem mass spectrometry.
- Vitamin D is an essential nutrient with important physiological roles in the positive regulation of calcium (Ca2+) homeostasis. Vitamin D can be made de novo in the skin by exposure to sunlight or it can be absorbed from the diet. There are two forms of vitamin D; vitamin D2 (ergocalciferol) and vitamin D3 (cholecalciferol). Vitamin D3 is the form synthesized de novo by animals. It is also a common supplement added to milk products and certain food products produced in the United States. Both dietary and intrinsically synthesized vitamin D3 must undergo metabolic activation to generate the bioactive metabolites. In humans, the initial step of vitamin D3 activation occurs primarily in the liver and involves hydroxylation to form the intermediate metabolite 25-hydroxycholecalciferol (calcifediol; 25OHD3). Calcifediol is the major form of Vitamin D3 in circulation. Circulating 25OHD3 is then converted by the kidney to form 1,25-dihydroxyvitamin D3 (calcitriol; 1,25(OH)2D3), which is generally believed to be the metabolite of Vitamin D3 with the highest biological activity.
- Vitamin D2 is derived from fungal and plant sources. Many over-the-counter dietary supplements contain crgocalciferol (vitamin D2) rather than cholecalciferol (vitamin D3). Drisdol, the only high-potency prescription form of vitamin D available in the United States, is formulated with ergocalciferol. Vitamin D2 undergoes a similar pathway of metabolic activation in humans as Vitamin D3, forming the metabolites 25OHD2 and 1,25(OH)2D2. Vitamin D2 and vitamin D3 have long been assumed to be biologically equivalent in humans, however recent reports suggest that there may be differences in the bioactivity and bioavailability of these two forms of vitamin D (Armas et. al., (2004) J. Clin. Endocrinol. Metab. 89:5387-5391).
- Measurement of vitamin D, the inactive vitamin D precursor, is rare in clinical settings. Rather, serum levels of 25-hydroxyvitamin D3, 25-hydroxyvitamin D2, and total 25-hydroxyvitamin D ("25OHD") are useful indices of vitamin D nutritional status and the efficacy of certain vitamin D analogs. The measurement of 25OHD is commonly used in the diagnosis and management of disorders of calcium metabolism. In this respect, low levels of 25OHD are indicative of vitamin D deficiency associated with diseases such as hypocalcemia, hypophosphatemia, secondary hyperparathyroidism, elevated alkaline phosphatase, osteomalacia in adults and rickets in children. In patients suspected of vitamin D intoxication, elevated levels of 25OHD distinguishes this disorder from other disorders that cause hypercalcemia.
- Measurement of 1,25(OH)2D is also used in clinical settings. Certain disease states can be reflected by circulating levels of 1,25(OH)2D, for example kidney disease and kidney failure often result in low levels of 1,25(OH)2D. Elevated levels of 1,25(OH)2D may be indicative of excess parathyroid hormone or can be indicative of certain diseases such as sarcoidosis or certain types of lymphomas.
- Detection of vitamin D metabolites has been accomplished by radioimmunoassay with antibodies co-specific for 25OHD2 and 25OHD3. Because the current immunologically-based assays do not separately resolve 25OHD2 and 25OHD3, the source of any nutritional deficiency of vitamin D cannot be determined without resorting to other tests. Reports have been published that disclose methods for detecting specific vitamin D metabolites using mass spectrometry. In some of the reports, the vitamin D metabolites are derivatized prior to mass spectrometry, but in others, they are not. For example
Holmquist, et al., U.S. Patent Application Serial No. 11/946765, filed December 28, 2007 Clarke, et al., in U.S. Patent Application Serial Nos. 11/101,166, filed April 6, 2005 11/386,215, filed March 21, 2006 Singh, et al., in U.S. Patent Application Serial No. 10/977,121, filed October 24, 2004 US 2006/228808 A1 ;US 2006/094125 A1 ;US 2009/137056 A1 ; andUS 2006/228809 A1 ). - Provided herein are methods for detecting the amount of one or more (non-metabolized) forms of vitamin D in a sample by mass spectrometry, including tandem mass spectrometry. In one aspect, vitamin D from the sample is derivatized prior to analysis by mass spectrometry. In a second aspect, vitamin D from the sample is not derivatized prior to analysis by mass spectrometry.
- In some embodiments of the first aspect, the methods include the steps of: (i) subjecting Cookson-type-derivatized vitamin D in the sample to an ionization source under conditions suitable to generate one or more precursor ions detectable by mass spectrometry; (ii) fragmenting at least one of said precursor ions to generate one or more fragment ions detectable by mass spectrometry; (iii) determining the amount of one or more of the precursor and fragment ions by mass spectrometry; and (iv) relating the amount of ions determined in step (iii) to the amount of a vitamin D in the sample. In these methods, the sample is subjected to a Cookson-type derivatization reagent under conditions sufficient to generate Cookson-type-derivatized vitamin D prior to step (i). In some embodiments, the Cookson-type-derivatized-vitamin D is subjected to an extraction column and an analytical column prior to ionization. In related embodiments, the analytical column may be a high performance liquid chromatography (HPLC) column.
- In some embodiments of the first aspect, the methods include the steps of: (i) subjecting the sample to turbulent flow liquid chromatography (TFLC); (ii) subjecting Cookson-type-derivatized vitamin D from the sample an ionization source under conditions suitable to generate one or more ions detectable by mass spectrometry; (iii) determining the amount of one or more of the Cookson-type-derivatized vitamin D ions by mass spectrometry; and (iv) relating the amount of Cookson-type-derivatized vitamin D ions determined in step (iii) to the amount of a vitamin D in the sample. In these embodiments, the sample is subjected to a Cookson-type derivatizing reagent under conditions sufficient to generate Cookson-type-derivatized vitamin D in the sample prior to step (i). In some embodiments, the sample is subjected to high performance liquid chromatography (HPLC) after step (i) but prior to step (ii).
- In some embodiments, the Cookson-type derivatizing reagent is 4-phenyl-1,2,4-triazoline-3,5-dione (PTAD). In some of these embodiments, the one or more precursor ions comprise one or more ions selected from the group consisting of ions with a mass/charge ratio (m/z) of 572.4 ± 0.5 and 560.4 ± 0.5. In some of these embodiments, one or more fragment ions comprise an ion with a mass/charge ratio (m/z) of 298.1 ± 0.5.
- In embodiments where vitamin D comprises vitamin D2, one or more Cookson-type-derivatized vitamin D ions may comprise a precursor ion with a mass/charge ratio (m/z) of 572.3 ± 0.5 and a fragment ion with a mass/charge ratio (m/z) of 298.1 ± 0.5. In embodiments where vitamin D comprises vitamin D3, one or more Cookson-type-derivatized vitamin D ions may comprise a precursor ion with a mass/charge ratio (m/z) of 560.3 ± 0.5 and a fragment ion with a mass/charge ratio (m/z) of 298.1 ± 0.5. In embodiments where vitamin D comprises vitamin D2 and vitamin D3, one or more precursor ions may comprise a vitamin D2 precursor ion with a mass/charge ratio (m/z) of 572.4 ± 0.5 and a vitamin D3 precursor ion with a m/z of 560.4 ± 0.5; and one or more fragment ions may comprise a vitamin D2 fragment ion with a m/z of 298.1 ± 0.5 and a vitamin D3 fragment ion with a m/z of 298.1 ± 0.5.
- In some embodiments of the second aspect, provided herein are methods for determining the amount of vitamin D in a sample by tandem mass spectrometry without ionization and detection of derivatized vitamin D. In some embodiments, the vitamin D comprises vitamin D2; these methods include the steps of: subjecting vitamin D2 from a sample to an ionization source under conditions suitable to generate one or more precursor ions detectable by mass spectrometry selected from the group consisting of ions with a mass to charge ratio (m/z) of 397.2 ± 0.5 or 379.2 ± 0.5; fragmenting at least one of said precursor ions to generate one or more fragment ions detectable by mass spectrometry; (iii) determining the amount of one or more of the ions generated in steps (i) and (ii) by mass spectrometry; and (iv) relating the presence of vitamin D2 ions determined in step (iii) to the presence of vitamin D2 in the sample. In these methods, if the fragmented precursor ions comprise an ion with m/z of 397.2 ± 0.5, the fragment ions comprise one or more ions selected from the group consisting of ions with m/z of 159.0 ± 0.5, 146.9 ± 0.5, 133.1 ± 0.5, and 121.0 ± 0.5. In these methods, if the fragmented precursor ions comprise an ion with m/z of 379.2 ± 0.5, the fragment ions comprise one or more ions selected from the group consisting of ions with m/z of 283.2 ± 0.5, 187.3 ± 0.5, 175.2 ± 0.5, and 159.0 ± 0.5. In some embodiments, vitamin D2 from the sample may be subjected to an extraction column, such as a solid phase extraction (SPE) column or a turbulent flow liquid chromatography (THLC) column, prior to ionization. In some embodiments, vitamin D2 from the sample is further subjected to an analytical column, such as a high performance liquid chromatography (HPLC) column, prior to ionization.
- In other embodiments of the second aspect, vitamin D comprises vitamin D3; these methods include the steps of: (i) subjecting vitamin D3 from a sample to an ionization source under conditions suitable to generate one or more precursor ions detectable by mass spectrometry selected from the group consisting of ions with a mass to charge ratio (m/z) of 385.2 ± 0.5 or 367.2 ± 0.5; (ii) fragmenting at least one of the precursor ions to generate one or more fragment ions detectable by mass spectrometry; (iii) determining the amount of one or more of the ions generated in steps (i) and (ii) by mass spectrometry; and (iv) relating the presence of vitamin D3 ions determined in step (iii) to the presence of vitamin D3 in the sample. In these methods, if the fragmented precursor ions comprise an ion with m/z of 385.2 ± 0.5, the fragment ions comprise one or more ions selected from the group consisting of ions with m/z of 159.0 ± 0.5, 147.0 ± 0.5, 133.1 ± 0.5, and 107.1 ± 0.5. If the fragmented precursor ions comprise an ion with m/z of 367.2 ± 0.5, the fragment ions comprise one or more ions selected from the group consisting of ions with m/z of 172.2 ± 0.5, 145.0 ± 0.5, and 119.1 ± 0.5. In some embodiments, vitamin D3 from the sample may be subjected to an extraction column, such as a solid phase extraction (SPE) column or a turbulent flow liquid chromatography (THLC) column, prior to ionization. In some embodiments, vitamin D3 from the sample is further subjected to an analytical column, such as a high performance liquid chromatography (HPLC) column, prior to ionization.
- In the methods described herein, mass spectrometry may be tandem mass spectrometry. In embodiments utilizing tandem mass spectrometry, tandem mass spectrometry may be conducted by any method known in the art, including for example, multiple reaction monitoring, precursor ion scanning, or product ion scanning.
- In embodiments which utilize an extraction column, the extraction column may be a solid phase extraction (SPE) column; such as a turbulent flow liquid chromatography (TFLC) column. In some embodiments, which utilize two or more of an extraction column, an analytical column, and an ionization source, the utilized components may be connected in an on-line fashion to allow for automated sample processing and analysis.
- Cookson-type derivatizing reagents useful for certain embodiments may be selected from the group consisting of 4-phenyl-1,2,4-triazoline-3,5-dione (PTAD), 4-methyl-1,2,4-triazoline-3,5-dione (MTAD), 4-[2-(6,7-dimethoxy-4-methyl-3-oxo-3,4-dihydroquinoxalyl)ethyl]-1,2,4-triazoline-3,5-dione (DMEQTAD), 4-(4-nitrophenyl)-1,2,4-triazoline-3,5- dione (NPTAD), and 4-ferrocenylmethyl-1,2,4-triazoline-3,5-dione (FMTAD), and isotopically labeled variants thereof. In preferred embodiments, the Cookson-type derivatizing reagent is 4-phenyl-1,2,4-triazoline-3,5-dione (PTAD) or an isotopically labeled variant thereof. In certain preferred embodiments, the Cookson-type derivatizing reagent is 4-phenyl-1,2,4-triazoline-3,5-dione (PTAD) or an isotopically labeled variant thereof.
- As used herein, the term "vitamin D" refers to any one or more naturally occurring or synthetic analog of vitamin D which are non-metabolized. This is in contrast to vitamin D metabolites which are identified by specific chemical modification (e.g., 25-hydroxyvitamin D and 1α,25-dihydroxyvitamin D) which occurs during metabolism. Non-metabolized vitamin D may also be referred to as "nutritional" vitamin D to distinguish from metabolized forms. Reference to vitamin D without specifying a metabolized form is a reference to non-metabolized forms.
- As used herein, "derivatizing" means reacting two molecules to form a new molecule. Thus, a derivatizing agent is an agent that may be reacted with another substance to derivatize the substance. For example, 4-phenyl-1,2,4-triazoline-3,5-dione (PTAD) is a derivatizing reagent that may be reacted with vitamin D to form a PTAD-derivatized vitamin D.
- As used here, the names of derivatized forms vitamin D include an indication as to the nature of derivatization. For example, the PTAD derivative of vitamin D2 is indicated as PTAD-vitamin D2 (or PTAD-derivatized vitamin D2).
- As used herein, a "Cookson-type derivatizing agent" is a 4-substituted 1,2,4-triazoline-3,5-dione compound. Exemplary Cookson-type derivatizing agents include 4-phenyl-1,2,4-triazoline-3,5-dione (PTAD), 4-methyl-1,2,4-triazoline-3,5-dione (MTAD), 4-[2-(6,7-dimethoxy-4-methyl-3-oxo-3,4-dihydroquinoxalyl)ethyl]-1,2,4-triazoline-3,5-dione (DMEQTAD), 4-(4-nitrophenyl)-1,2,4-triazoline-3,5-dione (NPTAD), and 4-ferrocenylmethyl-1,2,4-triazoline-3,5-dione (FMTAD). Additionally, isotopically labeled variants of Cookson-type derivatizing agents may be used in some embodiments. For example, the 13C6-PTAD isotopic variant is 6 mass units heavier than normal PTAD and may be used in some embodiments. Derivatization of vitamin D metabolites by Cookson-type reagents can be conducted by any appropriate method. See, e.g.,
Holmquist, et al., U.S. Patent Application Serial No. 11/946765, filed December 28, 2007 - Vitamin D may refer to one or more forms of vitamin D, such as vitamin D2 and/or vitamin D3. In embodiments were a sample comprises a plurality of vitamin D forms, the plurality of vitamin D forms may be ionized simultaneously. For example, in some embodiments, the amounts of vitamin D2 and vitamin D3 are determined in the same sample. In these embodiments, (derivatized or underivatized) vitamin D2 and vitamin D3 may be ionized simultaneously.
- The term "simultaneous" as applied to simultaneously detecting the amount of two or more analytes from a sample means acquiring data reflective of the amount of the two or more analytes in the sample from the same sample injection. The data for each analyte may be acquired sequentially or in parallel, depending on the instrumental techniques employed. For example, a single sample containing two analytes may be injected into a HPLC column, which may then elute each analyte one after the other, resulting in introduction of the analytes into a mass spectrometer sequentially. Determining the amount of each of these two analytes is simultaneous for the purposes herein, as both analytes result from the same sample injection into the HPLC.
- Vitamin D may be found in the circulation of an animal and/or may be generated by a biological organism, such as an animal. As such, samples may be obtained, for example, from a patient; that is, a living person, male or female, presenting oneself in a clinical setting for diagnosis, prognosis, or treatment of a disease or condition. Preferred samples may be biological samples; particularly biological fluid samples such as serum or plasma. The methods presented herein may be used to determine the amount of vitamin D present in a sample when taken from the human.
- In certain preferred embodiments of the methods disclosed herein, mass spectrometry is performed in positive ion mode. Alternatively, mass spectrometry is performed in negative ion mode. Various ionization sources, including for example atmospheric pressure chemical ionization (APCI), laser diode thermal desorption (LDTD), or electrospray ionization (ESI), may be used in embodiments disclosed herein. In certain preferred embodiments, vitamin D metabolites are measured using APCI or LDTD in positive ion mode.
- In preferred embodiments, one or more separately detectable internal standards are provided in the sample, the amount of which are also determined in the sample. In these embodiments, all or a portion of both the analyte(s) of interest and the internal standard(s) present in the sample are ionized to produce a plurality of ions detectable in a mass spectrometer, and one or more ions produced from each are detected by mass spectrometry. Preferably, the internal standard(s) are one or more of vitamin D2-[6, 19, 19]-2H3, vitamin D2-[26, 26, 26, 27, 27, 27]-2H6, vitamin D3-[6, 19, 19]-2H3, and vitamin D3-[26, 26, 26, 27, 27, 27]-2H6.
- One or more separately detectable internal standards may be provided in the sample prior to treatment with a Cookson-type derivatizing reagent (if applicable), or any purification of the analyte(s) from the sample. In these embodiments, the one or more internal standards may undergo derivatization and/or purification along with the endogenous vitamin D, in which case ions of the derivatized and/or purified internal standards are detected by mass spectrometry. In these embodiments, the presence or amount of ions generated from the analyte of interest may be related to the presence or amount of analyte of interest in the sample. In some embodiments, the internal standards may be isotopically labeled versions of vitamin D, such as vitamin D2-[6, 19, 19]-2H3, vitamin D2-[26, 26, 26, 27, 27, 27]-2H6, vitamin D3-[6, 19, 19]-2H3, and vitamin D3-[26, 26, 26, 27, 27, 27]-2H6.
- Ions detectable in a mass spectrometer may be generated for each of the exemplary internal standards listed above. Exemplary spectra generated for several exemplary internal standards are discussed in Examples 8 and 9, and shown in
Figures 6-7 ,9-10 ,12-13 , and15-16 . - As used herein, an "isotopic label" produces a mass shift in the labeled molecule relative to the unlabeled molecule when analyzed by mass spectrometric techniques. Examples of suitable labels include deuterium (2H), 13C, and 15N. For example, vitamin D2-[6, 19, 19]-2H3 and vitamin D3-[6, 19, 19]-2H3 has masses of about 3 mass units higher than vitamin D2 and vitamin D3, respectively. The isotopic label can be incorporated at one or more positions in the molecule and one or more kinds of isotopic labels can be used on the same isotopically labeled molecule.
- In other embodiments, the amount of vitamin D ion or ions may be determined by comparison to one or more external reference standards. Exemplary external reference standards include blank plasma or serum spiked with one or more of vitamin D2-[6, 19, 19]-2H3, vitamin D2-[26, 26, 26, 27, 27, 27]-2H6, vitamin D3-[6, 19, 19]-2H3, and vitamin D3-[26, 26, 26, 27, 27, 27]-2H6. External standards typically will undergo the same treatment and analysis as any other sample to be analyzed, including treatment with one or more Cookson-type reagents prior to mass spectrometry in embodiments wherein derivatized vitamin D is detected.
- In certain embodiments, the lower limit of quantitation (LLOQ) of vitamin D2 and vitamin D3 are less than 10 ng/mL; preferably less than 5 ng/mL; preferably less than 2 ng/mL.
- As used herein, unless otherwise stated, the singular forms "a," "an," and "the" include plural reference. Thus, for example, a reference to "a protein" includes a plurality of protein molecules.
- As used herein, the term "purification" or "purifying" does not refer to removing all materials from the sample other than the analyte(s) of interest. Instead, purification refers to a procedure that enriches the amount of one or more analytes of interest relative to other components in the sample that may interfere with detection of the analyte of interest. Purification of the sample by various means may allow relative reduction of one or more interfering substances, e.g., one or more substances that may or may not interfere with the detection of selected parent or daughter ions by mass spectrometry. Relative reduction as this term is used does not require that any substance, present with the analyte of interest in the material to be purified, is entirely removed by purification.
- As used herein, the term "solid phase extraction" or "SPE" refers to a process in which a chemical mixture is separated into components as a result of the affinity of components dissolved or suspended in a solution (i.e., mobile phase) for a solid through or around which the solution is passed (i.e., solid phase). In some instances, as the mobile phase passes through or around the solid phase, undesired components of the mobile phase may be retained by the solid phase resulting in a purification of the analyte in the mobile phase. In other instances, the analyte may be retained by the solid phase, allowing undesired components of the mobile phase to pass through or around the solid phase. In these instances, a second mobile phase is then used to elute the retained analyte off of the solid phase for further processing or analysis. SPE, including TFLC, may operate via a unitary or mixed mode mechanism. Mixed mode mechanisms utilize ion exchange and hydrophobic retention in the same column; for example, the solid phase of a mixed-mode SPE column may exhibit strong anion exchange and hydrophobic retention; or may exhibit column exhibit strong cation exchange and hydrophobic retention.
- As used herein, the term "chromatography" refers to a process in which a chemical mixture carried by a liquid or gas is separated into components as a result of differential distribution of the chemical entities as they flow around or over a stationary liquid or solid phase.
- As used herein, the term "liquid chromatography" or "LC" means a process of selective retardation of one or more components of a fluid solution as the fluid uniformly percolates through a column of a finely divided substance, or through capillary passageways. The retardation results from the distribution of the components of the mixture between one or more stationary phases and the bulk fluid, (i.e., mobile phase), as this fluid moves relative to the stationary phase(s). Examples of "liquid chromatography" include reverse phase liquid chromatography (RPLC), high performance liquid chromatography (HPLC), and turbulent flow liquid chromatography (TFLC) (sometimes known as high turbulence liquid chromatography (HTLC) or high throughput liquid chromatography).
- As used herein, the term "high performance liquid chromatography" or "HPLC" (sometimes known as "high pressure liquid chromatography") refers to liquid chromatography in which the degree of separation is increased by forcing the mobile phase under pressure through a stationary phase, typically a densely packed column.
- As used herein, the term "turbulent flow liquid chromatography" or "TFLC" (sometimes known as high turbulence liquid chromatography or high throughput liquid chromatography) refers to a form of chromatography that utilizes turbulent flow of the material being assayed through the column packing as the basis for performing the separation. TFLC has been applied in the preparation of samples containing two unnamed drugs prior to analysis by mass spectrometry. See, e.g., Zimmer et al., J Chromatogr A 854: 23-35 (1999); see also,
U.S. Patents No. 5,968,367 ,5,919,368 ,5,795,469 , and5,772,874 , which further explain TFLC. Persons of ordinary skill in the art understand "turbulent flow". When fluid flows slowly and smoothly, the flow is called "laminar flow". For example, fluid moving through an HPLC column at low flow rates is laminar. In laminar flow the motion of the particles of fluid is orderly with particles moving generally in straight lines. At faster velocities, the inertia of the water overcomes fluid frictional forces and turbulent flow results. Fluid not in contact with the irregular boundary "outruns" that which is slowed by friction or deflected by an uneven surface. When a fluid is flowing turbulently, it flows in eddies and whirls (or vortices), with more "drag" than when the flow is laminar. Many references are available for assisting in determining when fluid flow is laminar or turbulent (e.g., Turbulent Flow Analysis: Measurement and Prediction, P.S. Bernard & J.M. Wallace, John Wiley & Sons, Inc., (2000); An Introduction to Turbulent Flow, Jean Mathieu & Julian Scott, Cambridge University Press (2001)). - As used herein, the term "gas chromatography" or "GC" refers to chromatography in which the sample mixture is vaporized and injected into a stream of carrier gas (as nitrogen or helium) moving through a column containing a stationary phase composed of a liquid or a particulate solid and is separated into its component compounds according to the affinity of the compounds for the stationary phase.
- As used herein, the term "large particle column" or "extraction column" refers to a chromatography column containing an average particle diameter greater than about 50 µm.
- As used herein, the term "analytical column" refers to a chromatography column having sufficient chromatographic plates to effect a separation of materials in a sample that elute from the column sufficient to allow a determination of the presence or amount of an analyte. In a preferred embodiment the analytical column contains particles of about 5 µm in diameter. Such columns are often distinguished from "extraction columns", which have the general purpose of separating or extracting retained material from non-retained materials in order to obtain a purified sample for further analysis.
- As used herein, the terms "on-line" and "inline", for example as used in "on-line automated fashion" or "on-line extraction" refers to a procedure performed without the need for operator intervention. In contrast, the term "off-line" as used herein refers to a procedure requiring manual intervention of an operator. Thus, if samples are subjected to precipitation, and the supernatants are then manually loaded into an autosampler, the precipitation and loading steps are off-line from the subsequent steps. In various embodiments of the methods, one or more steps may be performed in an on-line automated fashion.
- As used herein, the term "mass spectrometry" or "MS" refers to an analytical technique to identify compounds by their mass. MS refers to methods of filtering, detecting, and measuring ions based on their mass-to-charge ratio, or "m/z". MS technology generally includes (1) ionizing the compounds to form charged compounds; and (2) detecting the molecular weight of the charged compounds and calculating a mass-to-charge ratio. The compounds may be ionized and detected by any suitable means. A "mass spectrometer" generally includes an ionizer and an ion detector. In general, one or more molecules of interest are ionized, and the ions are subsequently introduced into a mass spectrometric instrument where, due to a combination of magnetic and electric fields, the ions follow a path in space that is dependent upon mass ("m") and charge ("z"). See, e.g.,
U.S. Patent Nos. 6,204,500 , entitled "Mass Spectrometry From Surfaces;"6,107,623 , entitled "Methods and Apparatus for Tandem Mass Spectrometry;"6,268,144 , entitled "DNA Diagnostics Based On Mass Spectrometry;"6,124,137 , entitled "Surface-Enhanced Photolabile Attachment And Release For Desorption And Detection Of Analytes;" Wright et al., Prostate Cancer and Prostatic Diseases 1999, 2: 264-76; and Merchant and Weinberger, Electrophoresis 2000, 21: 1164-67. - As used herein, the term "operating in negative ion mode" refers to those mass spectrometry methods where negative ions are generated and detected. The term "operating in positive ion mode" as used herein, refers to those mass spectrometry methods where positive ions are generated and detected.
- As used herein, the term "ionization" or "ionizing" refers to the process of generating an analyte ion having a net electrical charge equal to one or more electron units. Negative ions are those having a net negative charge of one or more electron units, while positive ions are those having a net positive charge of one or more electron units.
- As used herein, the term "electron ionization" or "EI" refers to methods in which an analyte of interest in a gaseous or vapor phase interacts with a flow of electrons. Impact of the electrons with the analyte produces analyte ions, which may then be subjected to a mass spectrometry technique.
- As used herein, the term "chemical ionization" or "CI" refers to methods in which a reagent gas (e.g. ammonia) is subjected to electron impact, and analyte ions are formed by the interaction of reagent gas ions and analyte molecules.
- As used herein, the term "fast atom bombardment" or "FAB" refers to methods in which a beam of high energy atoms (often Xe or Ar) impacts a non-volatile sample, desorbing and ionizing molecules contained in the sample. Test samples are dissolved in a viscous liquid matrix such as glycerol, thioglycerol, m-nitrobenzyl alcohol, 18-crown-6 crown ether, 2-nitrophenyloctyl ether, sulfolane, diethanolamine, and triethanolamine. The choice of an appropriate matrix for a compound or sample is an empirical process.
- As used herein, the term "matrix-assisted laser desorption ionization" or "MALDI" refers to methods in which a non-volatile sample is exposed to laser irradiation, which desorbs and ionizes analytes in the sample by various ionization pathways, including photo-ionization, protonation, deprotonation, and cluster decay. For MALDI, the sample is mixed with an energy-absorbing matrix, which facilitates desorption of analyte molecules.
- As used herein, the term "surface enhanced laser desorption ionization" or "SELDI" refers to another method in which a non-volatile sample is exposed to laser irradiation, which desorbs and ionizes analytes in the sample by various ionization pathways, including photo-ionization, protonation, deprotonation, and cluster decay. For SELDI, the sample is typically bound to a surface that preferentially retains one or more analytes of interest. As in MALDI, this process may also employ an energy-absorbing material to facilitate ionization.
- As used herein, the term "electrospray ionization" or "ESI," refers to methods in which a solution is passed along a short length of capillary tube, to the end of which is applied a high positive or negative electric potential. Solution reaching the end of the tube is vaporized (nebulized) into a jet or spray of very small droplets of solution in solvent vapor. This mist of droplets flows through an evaporation chamber, which is heated slightly to prevent condensation and to evaporate solvent. As the droplets get smaller the electrical surface charge density increases until such time that the natural repulsion between like charges causes ions as well as neutral molecules to be released.
- As used herein, the term "atmospheric pressure chemical ionization" or "APCI," refers to mass spectrometry methods that are similar to ESI; however, APCI produces ions by ion-molecule reactions that occur within a plasma at atmospheric pressure. The plasma is maintained by an electric discharge between the spray capillary and a counter electrode. Then ions are typically extracted into the mass analyzer by use of a set of differentially pumped skimmer stages. A counterflow of dry and preheated N2 gas may be used to improve removal of solvent. The gas-phase ionization in APCI can be more effective than ESI for analyzing less-polar species.
- The term "atmospheric pressure photoionization" or "APPI" as used herein refers to a form of ionization where the mechanism for the ionization of molecule M is photon absorption and electron ejection to form the molecular ion M+. Because the energy of the absorbed photon is typically just above the ionization potential, the molecular ion is less susceptible to dissociation. In many cases it may be possible to analyze samples without the need for chromatography, thus saving significant time and expense. In the presence of water vapor or protic solvents, the molecular ion can extract H to form MH+. This tends to occur if M has a high proton affinity. This does not affect quantitation accuracy because the sum of M+ and MH+ is constant. Drug compounds in protic solvents are usually observed as MH+, whereas nonpolar compounds such as naphthalene or testosterone usually form M+. See, e.g., Robb et al., Anal. Chem. 2000, 72(15): 3653-3659.
- As used herein, the term "inductively coupled plasma" or "ICP" refers to methods in which a sample interacts with a partially ionized gas at a sufficiently high temperature such that most elements are atomized and ionized.
- As used herein, the term "desorption" refers to the removal of an analyte from a surface and/or the entry of an analyte into a gaseous phase. Laser diode thermal desorption (LDTD) is a technique wherein a sample containing the analyte is thermally desorbed into the gas phase by a laser pulse. The laser hits the back of a specially made 96-well plate with a metal base. The laser pulse heats the base and the heat causes the sample to transfer into the gas phase. The gas phase sample may then be drawn into an ionization source, where the gas phase sample is ionized in preparation for analysis in the mass spectrometer. When using LDTD, ionization of the gas phase sample may be accomplished by any suitable technique known in the art, such as by ionization with a corona discharge (for example by APCI).
- As used herein, the term "field desorption" refers to methods in which a non-volatile test sample is placed on an ionization surface, and an intense electric field is used to generate analyte ions.
- As used herein, the term "selective ion monitoring" is a detection mode for a mass spectrometric instrument in which only ions within a relatively narrow mass range, typically about one mass unit, are detected.
- As used herein, "multiple reaction mode," sometimes known as "selected reaction monitoring," is a detection mode for a mass spectrometric instrument in which a precursor ion and one or more fragment ions are selectively detected.
- As used herein, the term "lower limit of quantification", "lower limit of quantitation" or "LLOQ" refers to the point where measurements become quantitatively meaningful. The analyte response at this LOQ is identifiable, discrete and reproducible with a relative standard deviation (RSD %) of less than 20% and an accuracy of 80% to 120%.
- As used herein, the term "limit of detection" or "LOD" is the point at which the measured value is larger than the uncertainty associated with it. The LOD is the point at which a value is beyond the uncertainty associated with its measurement and is defined as three times the RSD of the mean at the zero concentration.
- As used herein, an "amount" of an analyte in a body fluid sample refers generally to an absolute value reflecting the mass of the analyte detectable in volume of sample. However, an amount also contemplates a relative amount in comparison to another analyte amount. For example, an amount of an analyte in a sample can be an amount which is greater than a control or normal level of the analyte normally present in the sample.
- The term "about" as used herein in reference to quantitative measurements not including the measurement of the mass of an ion, refers to the indicated value plus or minus 10%. Mass spectrometry instruments can vary slightly in determining the mass of a given analyte. The term "about" in the context of the mass of an ion or the mass/charge ratio of an ion refers to +/- 0.50 atomic mass unit.
- The invention is defined by the appended claims.
-
-
Figures 1A-C show exemplary chromatograms for PTAD-vitamin D2, PTAD-vitamin D3, and PTAD-vitamin D3-[6, 19, 19]-2H3 (internal standard), respectively. Details are discussed in Example 3. -
Figures 2A and2B show exemplary calibration curves for vitamin D2 and vitamin D3 in serum samples determined by methods described in Example 3. -
Figure 3 shows a plots of coefficient of variation versus concentration for vitamin D2 and vitamin D3. Details are described in Example 5. -
Figures 4 shows results of comparative studies of analysis of vitamin D3 in different sample matrices. Details are described in Example 11. -
Figure 5A shows an exemplary Q1 scan spectrum (covering the m/z range of about 300 to 450) for ionization of vitamin D2.Figure 5B shows an exemplary product ion spectra (covering the m/z range of about 100 to 400) for fragmentation of the vitamin D2 precursor ion with m/z of about 397.2.Figure 5C shows an exemplary product ion spectra (covering the m/z range of about 100 to 400) for fragmentation of the vitamin D2 precursor ion with m/z of about 379.2. Details are described in Example 14. -
Figure 6A shows an exemplary Q1 scan spectrum (covering the m/z range of about 300 to 450) for vitamin D2-[6, 19, 19]-2H3 ions.Figure 6B shows an exemplary product ion spectra (covering the m/z range of about 100 to 400) for fragmentation of the vitamin D2-[6, 19, 19]-2H3 precursor ion with m/z of about 400.2.Figure 6C shows an exemplary product ion spectra (covering the m/z range of about 100 to 400) for fragmentation of the vitamin D2-[6, 19, 19]-2H3 precursor ion with m/z of about 382.2 Details are described in Example 14. -
Figure 7A shows an exemplary Q1 scan spectrum (covering the m/z range of about 300 to 450) for vitamin D2-[26, 26, 26, 27, 27, 27]-2H6 ions.Figure 7B shows an exemplary product ion spectra (covering the m/z range of about 100 to 400) for fragmentation of the vitamin D2-[26, 26, 26, 27, 27, 27]-2H6 precursor ion with m/z of about 403.2.Figure 7C shows an exemplary product ion spectra (covering the m/z range of about 100 to 400) for fragmentation of the vitamin D2-[26, 26, 26, 27, 27, 27]-2H6 precursor ion with m/z of about 385.2. Details are described in Example 14. -
Figure 8A shows an exemplary Q1 scan spectrum (covering the m/z range of about 300 to 450) for ionization of vitamin D3.Figure 8B shows an exemplary product ion spectra (covering the m/z range of about 100 to 400) for fragmentation of the vitamin D3 precursor ion with m/z of about 385.2.Figure 8C shows an exemplary product ion spectra (covering the m/z range of about 100 to 400) for fragmentation of the vitamin D3 precursor ion with m/z of about 367.2. Details are described in Example 14. -
Figure 9A shows an exemplary Q1 scan spectrum (covering the m/z range of about 300 to 450) for vitamin D3-[6, 19, 19]-2H3 ions.Figure 9B shows an exemplary product ion spectra (covering the m/z range of about 100 to 400) for fragmentation of the vitamin D3-[6, 19, 19]-2H3 precursor ion with m/z of about 388.2.Figure 9C shows an exemplary product ion spectra (covering the m/z range of about 100 to 400) for fragmentation of the vitamin D3-[6, 19, 19]-2H3 precursor ion with m/z of about 370.2 Details are described in Example 14. -
Figure 10A shows an exemplary Q1 scan spectrum (covering the m/z range of about 300 to 450) for vitamin D3-[26, 26, 26, 27, 27, 27]-2H6 ions.Figure 10B shows an exemplary product ion spectra (covering the m/z range of about 100 to 400) for fragmentation of the vitamin D3-[26, 26, 26, 27, 27, 27]-2H6 precursor ion with m/z of about 391.2.Figure 10C shows an exemplary product ion spectra (covering the m/z range of about 100 to 400) for fragmentation of the vitamin D3-[26, 26, 26, 27, 27, 27]-2H6 precursor ion with m/z of about 373.2. Details are described in Example 14. -
Figure 11A shows an exemplary Q1 scan spectrum (covering the m/z range of about 500 to 620) for PTAD-vitamin D2 ions.Figure 11B shows an exemplary product ion spectra (covering the m/z range of about 250 to 350) for fragmentation of the PTAD-vitamin D2 precursor ion with m/z of about 572.2. Details are described in Example 15. -
Figure 12A shows an exemplary Q1 scan spectrum (covering the m/z range of about 500 to 620) for PTAD-vitamin D2-[6, 19, 19]-2H3 ions.Figure 12B shows an exemplary product ion spectra (covering the m/z range of about 250 to 350) for fragmentation of the PTAD-vitamin D2-[6, 19, 19]-2H3 precursor ion with m/z of about 575.2. Details are described in Example 15. -
Figure 13A shows an exemplary Q1 scan spectrum (covering the m/z range of about 500 to 620) for PTAD-vitamin D2-[26, 26, 26, 27, 27, 27]-2H6 ions.Figure 13B shows an exemplary product ion spectra (covering the m/z range of about 250 to 350) for fragmentation of the PTAD-vitamin D2-[26, 26, 26, 27, 27, 27]-2H6 precursor ion with m/z of about 578.2. Details are described in Example 15. -
Figure 14A shows an exemplary Q1 scan spectrum (covering the m/z range of about 500 to 620) for PTAD-vitamin D3 ions.Figure 14B shows an exemplary product ion spectra (covering the m/z range of about 250 to 350) for fragmentation of the PTAD-vitamin D3 precursor ion with m/z of about 560.2. Details are described in Example 15. -
Figure 15A shows an exemplary Q1 scan spectrum (covering the m/z range of about 500 to 620) for PTAD-vitamin D3-[6, 19, 19]-2H3 ions.Figure 15B shows an exemplary product ion spectra (covering the m/z range of about 250 to 350) for fragmentation of the PTAD-vitamin D3-[6, 19, 19]-2H3 precursor ion with m/z of about 563.2. Details are described in Example 15. -
Figure 16A shows an exemplary Q1 scan spectrum (covering the m/z range of about 500 to 620) for PTAD-vitamin D3-[26, 26, 26, 27, 27, 27]-2H6 ions.Figure 16B shows an exemplary product ion spectra (covering the m/z range of about 250 to 350) for fragmentation of the PTAD-vitamin D3-[26, 26, 26, 27, 27, 27]-2H6 precursor ion with m/z of about 566.2. Details are described in Example 15. - Methods are described for measuring vitamin D in a sample. More specifically, mass spectrometric methods are described for detecting and quantifying vitamin D in a sample. The methods may utilize Cookson-type reagents, such as PTAD, to generate derivatized vitamin D. However, in some methods, no derivatizing agent is used, and underivatized vitamin D2 and/or vitamin D3 are detected by mass spectrometry.
- The methods may use an extraction chromatography technique, such as turbulent flow liquid chromatography (TFLC), to perform a purification of underivatized or derivatized vitamin D2 and/or vitamin D3, combined with methods of mass spectrometry (MS), thereby providing a high-throughput assay system for detecting and quantifying vitamin D2 and/or vitamin D3 in a sample. Alternatively, in some methods, no chromatography, including extraction chromatography, is necessary for sample analysis. In these methods, the underivatized or derivatized vitamin D2 and/or vitamin D3 is ionized with LDTD. Preferred embodiments are particularly well suited for application in large clinical laboratories for automated vitamin D quantification.
- Suitable test samples for use in methods disclosed herein include any test sample that may contain the analyte of interest. In some preferred embodiments, a sample is a biological sample; that is, a sample obtained from any biological source, such as an animal, a cell culture, an organ culture, etc. In certain preferred embodiments, samples are obtained from a mammalian animal, such as a dog, cat, horse, etc. Particularly preferred mammalian animals are primates, most preferably male or female humans. Preferred samples comprise bodily fluids such as blood, plasma, serum, saliva, cerebrospinal fluid, or tissue samples; preferably plasma (including EDTA and heparin plasma) and serum; most preferably serum. Such samples may be obtained, for example, from a patient; that is, a living person, male or female, presenting oneself in a clinical setting for diagnosis, prognosis, or treatment of a disease or condition.
- Also contemplated are kits for a vitamin D quantitation assay. A kit for a vitamin D quantitation assay may include a kit comprising the compositions provided herein. For example, a kit may include packaging material and measured amounts of a Cookson-type reagent and an isotopically labeled internal standard, in amounts sufficient for at least one assay. Typically, the kits will also include instructions recorded in a tangible form (e.g., contained on paper or an electronic medium) for using the packaged reagents for use in a vitamin D quantitation assay.
- Calibration and QC pools for use in embodiments disclosed herein are preferably prepared using a matrix similar to the intended sample matrix.
- In preparation for mass spectrometric analysis, vitamin D may be enriched relative to one or more other components in the sample (e.g. protein) by various methods known in the art, including for example, liquid chromatography, filtration, centrifugation, thin layer chromatography (TLC), electrophoresis including capillary electrophoresis, affinity separations including immunoaffinity separations, extraction methods including ethyl acetate or methanol extraction, and the use of chaotropic agents or any combination of the above or the like.
- Protein precipitation is one method of preparing a test sample, especially a biological test sample, such as serum or plasma. Protein purification methods are well known in the art, for example, Polson et al., Journal of Chromatography B 2003, 785:263-275, describes protein precipitation techniques suitable for use in methods disclosed herein. Protein precipitation may be used to remove most of the protein from the sample leaving vitamin D in the supernatant. The samples may be centrifuged to separate the liquid supernatant from the precipitated proteins; alternatively the samples may be filtered to remove precipitated proteins. The resultant supernatant or filtrate may then be applied directly to mass spectrometry analysis; or alternatively to liquid chromatography and subsequent mass spectrometry analysis. In certain embodiments, samples, such as plasma or serum, may be purified by a hybrid protein precipitation / liquid-liquid extraction method. In these embodiments, a sample is mixed with methanol, ethyl acetate, and water, and the resulting mixture is vortexed and centrifuged. The resulting supernatant is removed, dried to completion and reconstituted in acetonitrile. The purified vitamin D may then be derivatized with any Cookson-type reagent, preferably PTAD or an isotopically labeled variant thereof.
- Another method of sample purification that may be used prior to mass spectrometry is liquid chromatography (LC). Certain methods of liquid chromatography, including HPLC, rely on relatively slow, laminar flow technology. Traditional HPLC analysis relies on column packing in which laminar flow of the sample through the column is the basis for separation of the analyte of interest from the sample. The skilled artisan will understand that separation in such columns is a diffusional process and may select LC, including HPLC, instruments and columns that are suitable for use with derivatized vitamin D. The chromatographic column typically includes a medium (i.e., a packing material) to facilitate separation of chemical moieties (i.e., fractionation). The medium may include minute particles, or may include a monolithic material with porous channels. A surface of the medium typically includes a bonded surface that interacts with the various chemical moieties to facilitate separation of the chemical moieties. One suitable bonded surface is a hydrophobic bonded surface such as an alkyl bonded, cyano bonded surface, or highly pure silica surface. Alkyl bonded surfaces may include C-4, C-8, C-12, or C-18 bonded alkyl groups. In preferred embodiments, the column is a highly pure silica column (such as a Thermo Hypersil Gold Aq column). The chromatographic column includes an inlet port for receiving a sample and an outlet port for discharging an effluent that includes the fractionated sample. The sample may be supplied to the inlet port directly, or from an extraction column, such as an on-line SPE cartridge or a TFLC extraction column.
- In one embodiment, the sample may be applied to the LC column at the inlet port, eluted with a solvent or solvent mixture, and discharged at the outlet port. Different solvent modes may be selected for eluting the analyte(s) of interest. For example, liquid chromatography may be performed using a gradient mode, an isocratic mode, or a polytyptic (i.e. mixed) mode. During chromatography, the separation of materials is effected by variables such as choice of eluent (also known as a "mobile phase"), elution mode, gradient conditions, temperature, etc.
- In certain embodiments, an analyte may be purified by applying a sample to a column under conditions where the analyte of interest is reversibly retained by the column packing material, while one or more other materials are not retained. In these embodiments, a first mobile phase condition can be employed where the analyte of interest is retained by the column, and a second mobile phase condition can subsequently be employed to remove retained material from the column, once the non-retained materials are washed through. Alternatively, an analyte may be purified by applying a sample to a column under mobile phase conditions where the analyte of interest elutes at a differential rate in comparison to one or more other materials. Such procedures may enrich the amount of one or more analytes of interest relative to one or more other components of the sample.
- In one preferred embodiment, HPLC is conducted with an alkyl bonded analytical column chromatographic system. In certain preferred embodiments, a highly pure silica column (such as a Thermo Hypersil Gold Aq column) is used. In certain preferred embodiments, HPLC and/or TFLC are performed using HPLC Grade water as mobile phase A and HPLC Grade ethanol as mobile phase B.
- By careful selection of valves and connector plumbing, two or more chromatography columns may be connected as needed such that material is passed from one to the next without the need for any manual steps. In preferred embodiments, the selection of valves and plumbing is controlled by a computer pre-programmed to perform the necessary steps. Most preferably, the chromatography system is also connected in such an on-line fashion to the detector system, e.g., an MS system. Thus, an operator may place a tray of samples in an autosampler, and the remaining operations are performed under computer control, resulting in purification and analysis of all samples selected.
- In some embodiments, an extraction column may be used for purification of vitamin D metabolites prior to mass spectrometry. In such embodiments, samples may be extracted using a extraction column which captures the analyte, then eluted and chromatographed on a second extraction column or on an analytical HPLC column prior to ionization. For example, sample extraction with a TFLC extraction column may be accomplished with a large particle size (50 µm) packed column. Sample eluted off of this column may then be transferred to an HPLC analytical column for further purification prior to mass spectrometry. Because the steps involved in these chromatography procedures may be linked in an automated fashion, the requirement for operator involvement during the purification of the analyte can be minimized. This feature may result in savings of time and costs, and eliminate the opportunity for operator error.
- In some embodiments, protein precipitation is accomplished with a hybrid protein precipitation / liquid-liquid extraction method which includes methanol protein precipitation and ethyl acetate/water extraction from serum. The resulting vitamin D metabolites may be derivatized prior to being subjected to an extraction column. Preferably, the hybrid protein precipitation / liquid-liquid extraction method and the extraction column are connected in an on-line fashion. In preferred embodiments, the extraction column is a C-8 extraction column, such as a Cohesive Technologies C8XL online extraction column (50 µm particle size, 0.5 x 50 mm) or equivalent. The eluent from the extraction column may then be applied to an analytical LC column, such as a HPLC column in an on-line fashion, prior to mass spectrometric analysis. Because the steps involved in these chromatography procedures may be linked in an automated fashion, the requirement for operator involvement during the purification of the analyte can be minimized. This feature may result in savings of time and costs, and eliminate the opportunity for operator error.
- In various embodiments, derivatized vitamin D may be ionized by any method known to the skilled artisan. Mass spectrometry is performed using a mass spectrometer, which includes an ion source for ionizing the fractionated sample and creating charged molecules for further analysis. For example ionization of the sample may be performed by electron ionization, chemical ionization, electrospray ionization (ESI), photon ionization, atmospheric pressure chemical ionization (APCI), photoionization, atmospheric pressure photoionization (APPI), Laser diode thermal desorption (LDTD), fast atom bombardment (FAB), liquid secondary ionization (LSI), matrix assisted laser desorption ionization (MALDI), field ionization, field desorption, thermospray/plasmaspray ionization, surface enhanced laser desorption ionization (SELDI), inductively coupled plasma (ICP) and particle beam ionization. The skilled artisan will understand that the choice of ionization method may be determined based on the analyte to be measured, type of sample, the type of detector, the choice of positive versus negative mode, etc.
- Derivatized vitamin D may be ionized in positive or negative mode. In preferred embodiments, derivatized vitamin D is ionized by APCI or LDTD in positive ion mode.
- In mass spectrometry techniques generally, after the sample has been ionized, the positively or negatively charged ions thereby created may be analyzed to determine a mass-to-charge ratio. Suitable analyzers for determining mass-to-charge ratios include quadrupole analyzers, ion traps analyzers, and time-of-flight analyzers. Exemplary ion trap methods are described in Bartolucci, et al., Rapid Commun. Mass Spectrom. 2000, 14:967-73.
- The ions may be detected using several detection modes. For example, selected ions may be detected, i.e. using a selective ion monitoring mode (SIM), or alternatively, mass transitions resulting from collision induced dissociation or neutral loss may be monitored, e.g., multiple reaction monitoring (MRM) or selected reaction monitoring (SRM). Preferably, the mass-to-charge ratio is determined using a quadrupole analyzer. For example, in a "quadrupole" or "quadrupole ion trap" instrument, ions in an oscillating radio frequency field experience a force proportional to the DC potential applied between electrodes, the amplitude of the RF signal, and the mass/charge ratio. The voltage and amplitude may be selected so that only ions having a particular mass/charge ratio travel the length of the quadrupole, while all other ions are deflected. Thus, quadrupole instruments may act as both a "mass filter" and as a "mass detector" for the ions injected into the instrument.
- One may enhance the resolution of the MS technique by employing "tandem mass spectrometry," or "MS/MS". In this technique, a precursor ion (also called a parent ion) generated from a molecule of interest can be filtered in an MS instrument, and the precursor ion subsequently fragmented to yield one or more fragment ions (also called daughter ions or product ions) that are then analyzed in a second MS procedure. By careful selection of precursor ions, only ions produced by certain analytes are passed to the fragmentation chamber, where collisions with atoms of an inert gas produce the fragment ions. Because both the precursor and fragment ions are produced in a reproducible fashion under a given set of ionization/fragmentation conditions, the MS/MS technique may provide an extremely powerful analytical tool. For example, the combination of filtration/fragmentation may be used to eliminate interfering substances, and may be particularly useful in complex samples, such as biological samples.
- Alternate modes of operating a tandem mass spectrometric instrument include product ion scanning and precursor ion scanning. For a description of these modes of operation, see, e.g., E. Michael Thurman, et al., Chromatographic-Mass Spectrometric Food Analysis for Trace Determination of Pesticide Residues, Chapter 8 (Amadeo R. Fernandez-Alba, ed., Elsevier 2005) (387).
- The results of an analyte assay may be related to the amount of the analyte in the original sample by numerous methods known in the art. For example, given that sampling and analysis parameters are carefully controlled, the relative abundance of a given ion may be compared to a table that converts that relative abundance to an absolute amount of the original molecule. Alternatively, external standards may be run with the samples, and a standard curve constructed based on ions generated from those standards. Using such a standard curve, the relative abundance of a given ion may be converted into an absolute amount of the original molecule. In certain preferred embodiments, an internal standard is used to generate a standard curve for calculating the quantity of vitamin D. Methods of generating and using such standard curves are well known in the art and one of ordinary skill is capable of selecting an appropriate internal standard. For example, in preferred embodiments one or more isotopically labeled vitamin D (e.g., vitamin D2-[6, 19, 19]-2H3 and vitamin D3-[6, 19, 19]-2H3) may be used as internal standards. Numerous other methods for relating the amount of an ion to the amount of the original molecule will be well known to those of ordinary skill in the art.
- One or more steps of the methods may be performed using automated machines. In certain embodiments, one or more purification steps are performed on-line, and more preferably all of the purification and mass spectrometry steps may be performed in an on-line fashion.
- In certain embodiments, such as MS/MS, where precursor ions are isolated for further fragmentation, collision activated dissociation (CAD) is often used to generate fragment ions for further detection. In CAD, precursor ions gain energy through collisions with an inert gas, and subsequently fragment by a process referred to as "unimolecular decomposition." Sufficient energy must be deposited in the precursor ion so that certain bonds within the ion can be broken due to increased vibrational energy.
- In some preferred embodiments, vitamin D in a sample is detected and/or quantified using MS/MS as follows. The samples are first purified by protein precipitation or a hybrid protein precipitation / liquid-liquid extraction. Then, vitamin D in the purified sample is optionally derivatized with a Cookson-type reagent, such as PTAD. The purified samples are then subjected to liquid chromatography, preferably on an extraction column (such as a TFLC column) followed by an analytical column (such as a HPLC column); the flow of liquid solvent from a chromatographic column enters the nebulizer interface of an MS/MS analyzer; and the solvent/analyte mixture is converted to vapor in the heated charged tubing of the interface. The analyte(s) (e.g., derivatized or underivatized vitamin D) contained in the solvent, are ionized by applying a large voltage to the solvent/analyte mixture. As the analytes exit the charged tubing of the interface, the solvent/analyte mixture nebulizes and the solvent evaporates, leaving analyte ions. The analyte ions, e.g. precursor ions, pass through the orifice of the instrument and enter the first quadrupole. Quadrupoles 1 and 3 (Q1 and Q3) are mass filters, allowing selection of ions (i.e., selection of "precursor" and "fragment" ions in Q1 and Q3, respectively) based on their mass to charge ratio (m/z). Quadrupole 2 (Q2) is the collision cell, where ions are fragmented. The first quadrupole of the mass spectrometer (Q1) selects for ions with the mass to charge ratios of interest. Precursor ions with the correct mass/charge ratios are allowed to pass into the collision chamber (Q2), while unwanted ions with any other mass/charge ratio collide with the sides of the quadrupole and are eliminated. Precursor ions entering Q2 collide with neutral argon gas molecules and fragment. The fragment ions generated are passed into quadrupole 3 (Q3), where derivatized or underivatized vitamin D fragment ions are selected while other ions are eliminated.
- The methods may involve MS/MS performed in either positive or negative ion mode; preferably positive ion mode. Using standard methods well known in the art, one of ordinary skill is capable of identifying one or more fragment ions of a particular precursor ion of a derivatized vitamin D that may be used for selection in quadrupole 3 (Q3).
- As ions collide with the detector they produce a pulse of electrons that are converted to a digital signal. The acquired data is relayed to a computer, which plots counts of the ions collected versus time. The resulting mass chromatograms are similar to chromatograms generated in traditional HPLC-MS methods. The areas under the peaks corresponding to particular ions, or the amplitude of such peaks, may be measured and correlated to the amount of the analyte of interest. In certain embodiments, the area under the curves, or amplitude of the peaks, for fragment ion(s) and/or precursor ions are measured to determine the amount of vitamin D. As described above, the relative abundance of a given ion may be converted into an absolute amount of the original analyte using calibration standard curves based on peaks of one or more ions of an internal molecular standard.
- The following automated hybrid protein precipitation / liquid-liquid extraction technique was conducted on patient serum samples. Gel Barrier Serum (i.e., serum collected in Serum Separator Tubes) as well as EDTA plasma and Heparin Plasma have also been established as acceptable for this assay.
- A Perkin-Elmer Janus robot and a TomTec Quadra Tower robot was used to automate the following procedure. For each sample, 50 µL of serum was added to a well of a 96 well plate. Then 25 µL of internal standard cocktail (containing isotopically labeled vitamin D3-[6, 19, 19]-2H3) was added to each well, and the plate vortexed. Then 75 µL of methanol was added, followed by additional vortexing. 300 µL of ethyl acetate and 75 µL of water was then added, followed by additional vortexing, centrifugation, and transfer of the resulting supernatant to a new 96-well plate.
- The transferred liquid in the second 96-well plate was dried to completion under a flowing nitrogen gas manifold. Derivatization was accomplished by adding 100 µL of a 0.1 mg/mL solution of the Cookson-type derivatization agent PTAD in acetonitrile to each well. The derivatization reaction was allowed to proceed for approximately one hour, and was quenched by adding 100 µL of water to the reaction mixture.
- Sample injection was performed with a Cohesive Technologies Aria TX-4 TFLC system using Aria OS V 1.5.1 or newer software.
- The TFLC system automatically injected an aliquot of the above prepared samples into a Cohesive Technologies C8XL online extraction column (50 µm particle size, 005 x 50 mm, from Cohesive Technologies, Inc.) packed with large particles. The samples were loaded at a high flow rate to create turbulence inside the extraction column. This turbulence ensured optimized binding of derivatized vitamin D to the large particles in the column and the passage of excess derivatizing reagent and debris to waste.
- Following loading, the sample was eluted off to the analytical column, a Thermo Hypersil Gold Aq analytical column (5 µm particle size, 50 x 2.1 mm), with a water/ethanol elution gradient. The HPLC gradient was applied to the analytical column, to separate vitamin D from other analytes contained in the sample. Mobile phase A was water and mobile phase B was ethanol. The HPLC gradient started with a 35 % organic gradient which was ramped to 99 % in approximately 65 seconds.
- MS/MS was performed on the above generated samples using a Finnigan TSQ Quantum Ultra MS/MS system (Thermo Electron Corporation). The following software programs, all from Thermo Electron, were used in the Examples described herein: Quantum Tune Master V 1.5 or newer, Xcalibur V 2.07 or newer, LCQuan V 2.56 (Thermo Finnigan) or newer, and ARIA OS v1.5.1 (Cohesive Technologies) or newer. Liquid solvent/analyte exiting the analytical column flowed to the nebulizer interface of the MS/MS analyzer. The solvent/analyte mixture was converted to vapor in the tubing of the interface. Analytes in the nebulized solvent were ionized by APCI.
- Ions passed to the first quadrupole (Q1), which selected vitamin D2 and vitamin D3 precursor ions with a mass-to-charge ratio of 572.3 ± 0.5 m/z and 560.3 ± 0.5 m/z, respectively. Ions entering quadrupole 2 (Q2) collided with argon gas to generate ion fragments, which were passed to quadrupole 3 (Q3) for further selection. Mass spectrometer settings are shown in Table 1. Simultaneously, the same process using isotope dilution mass spectrometry was carried out with internal standard, vitamin D3-[6, 19, 19]-2H3. The mass transitions used for detection and quantitation during validation on positive polarity and at the indicated collision energies are shown in Table 2.
Table 1. Mass Spectrometer Settings for Detection of PTAD-vitamin D2, PTAD-vitamin D3, and vitamin D3-[6, 19, 19]-2H3 (internal standard) (Positive Polarity) Mass Spectrometric Instrument Settings Discharge Current 4.0 µA Vaporizer Temperature 300 °C Sheath Gas Pressure 15 Ion Sweep Gas Pressure 0.0 Aux Gas Pressure 5 Capillary Temperature 300 °C Skimmer Offset -10 V Collision Pressure 1.5 mTorr Collision Cell Energy 15 V Table 2. Mass Transitions for PTAD derivatized vitamin D2, vitamin D3, and vitamin D3-[6, 19, 19]-2H3 (internal standard) (Positive Polarity) Analyte Precursor Ion (m/z) Product Ions (m/z) PTAD-vitamin D2 572.3 ± 0.5 298.1 ± 0.5 PTAD-vitamin D3 560.3 ± 0.5 298.1 ± 0.5 PTAD-vitamin D3-[6, 19, 19]-2H3 563.3 ± 0.5 301.1 ± 0.5 - Exemplary chromatograms for PTAD-vitamin D2, PTAD-vitamin D3, PTAD-vitamin D3-[6, 19, 19]-2H3 (internal standard), are shown in
Figures 1A, 1B, and 1C , respectively. - Exemplary calibration curves for the determination of vitamin D2 and vitamin D3 in serum specimens are shown in
Figures 2A and2B , respectively. - Linearity was determined by diluting four pools of serum with high endogenous concentration of either vitamin D2 or vitamin D3 and analyzing dilutions of 75%, 50%, and 25% in duplicate according to the methods of Examples 1-3. Specimens may be diluted 1:4 with average recovery of 102%, permitting a Clinically Reportable Range (CRR) of 2-240 ng/mL within precision limits of 85%-115%CV. Measured values and percent recoveries from these studies are shown in Table 3.
Table 3. Data Demonstrating Linearity of Response over Dilution Range Nutritional Vitamin D2 (ng/mL (percent recovery %)) Concentration Pool 1 Pool 2 Pool 3 Pool 4 Pool 5 Pool 6 100% 25.0 (100) 24.5 (100) 28.1 (100) 24.4 (100) 28.1 (100) 26.7 (100) 75% 17.8 (95.3) 17.5 (95.4) 21.9 (103.7) 17.3 (94.5) 21.2 (100.4) 20.1 (100.5) 50% 12.8 (102.3) 13.0 (106.2) 14.0 (99.4) 13.8 (112.8) 14.8 (105.7) 11.8 (88.9) 25% 6.7 (107.9) 6.2 (101.4) 7.7 (109.6) 6.7 (109.6) 7.3 (104.1) 7.4 (110.7) Nutritional Vitamin D3 (ng/mL (percent recovery %)) Sample concentration Pool 1 Pool 2 Pool 3 Pool 4 Pool 5 Pool 6 100% 31.2 (100) 33.5 (100) 33.4 (100) 29.1 (100) 29.6 (100) 30.6 (100) 75% 22.1 (94.2) 23.6 (93.8) 25.8 (102.8) 22.0 (100.8) 24.8 (111.9) 24.1 (104.8) 50% 15.9 (101.9) 16.1 (96.1) 16.5 (98.5) 15.7 (107.8) 15.9 (107.8) 15.0 (98.0) 25% 7.6 (97.6) 7.9 (94.3) 8.5 (101.8) 7.3 (100.4) 8.0 (108.4) 8.0 (105.0) - The lower limit of quantitation (LLOQ) is the point where measurements become quantitatively meaningful. The analyte response at this LLOQ is identifiable, discrete and reproducible with a precision (i.e., coefficient of variation (CV)) of greater than 20% and an accuracy of 80% to 120%. The LLOQ was determined by assaying samples with known analyte concentrations (2 ng/mL, 5 ng/mL, 10 ng/mL, 15 ng/mL, 20 ng/mL, 40 ng/mL, and 60 ng/mL) in quadruplicate five times according to the methods of Examples 1-3, then evaluating the reproducibility. Analysis of the collected data indicates that samples with concentrations of less than 2 ng/mL yielded CVs of less than 20% for both analytes. Thus, the LLOQ of each analyte was determined to be < 2 ng/mL. Data generated for the determination of LLOQ of PTAD-vitamin D2 and PTAD-vitamin D3 are shown in Tables 4 and 5, respectively. The graphical representations of CV versus concentration for both analytes are shown in
Figure 3 .Table 4. Determination of Lower Limit of Quantitation of Vitamin D2 Vitamin D2 concentration (ng/mL) Assay 1 Assay 2 Assay 3 Assay 4 Assay 5 2 2.1 1.9 2.1 1.9 2.0 Average 2.04 1.7 2.0 2.1 1.9 2.0 Std Dev 0.2 1.9 2.0 2.2 2.2 2.3 CV (%) 8.5 1.9 1.9 2.1 2.5 2.2 Accuracy (%) 101.8 5 4.0 6.2 4.3 4.7 4.0 Average 4.7 NC 4.6 4.6 4.6 4.6 Std Dev 0.6 4.6 5.6 5.1 4.7 4.3 CV (%) 12.8 5.7 4.1 4.6 4.6 5.3 Accuracy (%) 94.8 10 9.8 11.2 10.8 11.3 10.3 Average 10.3 11.3 9.6 8.6 10.0 10.9 Std Dev 0.7 10.9 10.6 9.9 9.6 10.1 CV (%) 6.9 10.0 9.7 9.6 10.2 10.9 Accuracy (%) 102.6 15 13.6 14.7 15.6 15.0 14.5 Average 14.6 13.0 16.2 15.6 12.7 17.4 Std Dev 1.2 13.6 13.4 13.6 14.1 13.4 CV (%) 8.2 14.8 14.6 16.0 14.8 14.6 Accuracy (%) 97.1 20 19.4 19.1 20.3 19.9 19.1 Average 20.2 22.0 18.6 20.7 21.6 19.4 Std Dev 1.0 19.0 21.1 21.9 20.8 20.1 CV (%) 4.9 20.0 19.6 19.3 20.7 20.4 Accuracy (%) 100.8 40 42.2 41.5 39.1 42.5 41.8 Average 40.3 39.2 40.6 39.8 39.0 37.8 Std Dev 1.6 40.2 40.0 41.3 40.4 37.6 CV (%) 3.9 41.1 39.6 38.9 39.6 43.6 Accuracy (%) 100.7 60 64.4 57.8 59.1 59.3 57.0 Average 59.8 57.4 61.4 62.3 60.8 65.2 Std Dev 2.5 58.9 59.2 56.8 59.0 62.0 CV (%) 4.2 58.1 61.1 61.8 59.7 55.6 Accuracy (%) 99.7 Table 5. Determination of Lower Limit of Quantitation of Vitamin D3 Vitamin D3 concentration (ng/mL) Assay 1 Assay 2 Assay 3 Assay 4 Assay 5 2 2.1 1.6 2.2 2.0 1.8 Average 2.03 2.1 1.8 2.2 1.8 1.8 Std Dev 0.3 1.6 2.3 2.0 2.3 1.7 CV (%) 14.3 2.0 2.5 2.0 2.0 2.7 Accuracy (%) 101.4 5 4.7 5.6 4.6 5.0 4.9 Average 5.0 7.1 4.9 4.7 5.3 4.4 Std Dev 0.6 4.6 5.0 5.4 5.5 5.0 CV (%) 12.2 4.6 4.7 4.3 4.7 5.1 Accuracy (%) 99.7 10 9.4 10.2 10.1 9.9 11.0 Average 10.0 11.6 9.6 9.3 10.3 10.0 Std Dev 0.7 10.1 10.2 9.2 9.0 11.3 CV (%) 7.5 9.5 8.6 10.0 9.5 10.2 Accuracy (%) 99.5 15 14.5 14.9 14.4 15.7 15.8 Average 15.0 14.2 16.6 15.7 12.8 15.5 Std Dev 0.9 15.3 13.8 14.2 15.1 14.4 CV (%) 6.3 15.7 15.1 16.1 16.0 14.2 Accuracy (%) 100.0 20 19.8 18.4 18.2 22.2 17.5 Average 19.5 19.0 19.1 25.0 19.9 20.9 Std Dev 1.7 17.8 20.1 20.0 20.1 18.3 CV (%) 8.9 17.8 19.7 19.7 18.6 18.6 Accuracy (%) 97.7 40 44.3 41.7 40.6 39.1 42.0 Average 41.0 39.3 40.3 38.5 40.2 38.6 Std Dev 1.8 42.6 42.6 42.0 41.7 40.1 CV (%) 4.4 42.2 42.1 37.8 40.3 44.0 Accuracy (%) 102.5 60 65.0 57.0 ' 60.3 60.6 55.7 Average 59.5 57.6 61.5 61.1 59.3 62.6 Std Dev 2.7 55.4 55.6 56.9 60.0 61.6 CV (%) 4.5 58.2 62.4 61.7 59.3 58.1 Accuracy (%) 99.2 - The limit of detection (LOD) is the point where a measured value is larger than the uncertainty associated with it and is defined arbitrarily as four standard deviations (SD) from the zero concentration. Selectivity is the ability of an analytical method to differentiate and quantify the analyte in the presence of other components in the sample. A blank was analyzed in 20 replicates according to the methods of Examples 1-3 and the resulting area ratios were statistically analyzed to determine that the LOD for both vitamin D2 and vitamin D3 are 0.4 ng/mL. Data collected to determine LOD for each analyte is shown in Table 6.
Table 6. Determination of Limit of Detection of Vitamin D2 and Vitamin D3 Replicate # NVD2 (Response Ratio) NVD3 (Response Ratio) 1 0.012 0.014 2 0.004 0.005 3 0.008 0.011 4 0.005 0.004 5 0.018 0.03 6 0.004 0.001 7 0.007 0.006 8 0.006 0.002 9 0.014 0.006 10 0.015 0.006 11 0.003 0.008 12 0.005 0.004 13 0.009 0.002 14 0.017 0.016 15 0.007 0.005 16 0.006 0.012 17 0.003 0.001 18 0.002 0.001 19 0.011 0.001 20 0.023 0.009 Mean 0.009 0.007 SD 0.0058 0.0070 CV 65.1 97.0 Mean + 4SD 0.032 0.035 LOD 0.4 ng/mL 0.4 ng/mL - Several samples were prepared with vitamin D2, vitamin D3, and spiked amounts of potentially interfering species (including vitamin D metabolites and related compounds) and analyzed according to the methods of Examples 1-3. The compounds tested for potential interference are listed in Table 7. None of the tested compounds demonstrated cross-reactivity with detection of vitamin D2 or vitamin D3 according to the methods of Examples 1-3.
Table 7. Compounds Tested for Possible Interference with Detection of Vitamin D2 or Vitamin D3 Compounds Tested 1,25(OH)2D3 1,25(OH)2D2 1,25(OH)2D3-[6,19,19']-2H 1,25(OH)2D3-[26,26,26,27,27,27]-2H 1,25(OH)2D2-[26,26,26,27,27,27]-2H 25OHD3 25OHD2 25OHD3-IS-[6,19,19']-2H 25OHD2-IS-[6,19,19']-2H 25OHD3-IS-[26,26,26,27,27,27]-2H 25OHD2-IS-[26,26,26,27,27,27]-2H vitamin D3-[6,19,19']-2H vitamin D2-[6,19,19']-2H vitamin D3-[26,26,26,27,27,27]-2H vitamin D2-[26,26,26,27,27,27]-2H 1-OH-D3 (Alfacalcidiol) 1-OH-D2 (Hectoral) 24,25(OH)2D3 25,26(OH)2D3 3-epi-25OHD3 3-epi-1,25(OH)2D3 Dihydrotachysterol 1,25(OH)2D3-26,23-lactone Paracalcitol (Zemplar) Calcipotriene (Dovonex) 7-Dehydrocholesterol - The intra-assay variation is defined as the reproducibility of a sample within an assay and was determined by assaying 20 replicates of a sample from each of three QC pools according to the methods of Examples 1-3. Data collected from these analyses are shown in Tables 8 and 9 for vitamin D2 and vitamin D3. respectively. The concentrations of the analytes in the QC pools were determined to be 6.6 ng/mL, 20.6 ng/mL, and 52.6 ng/mL for vitamin D2, and 4.9 ng/mL, 20.5 ng/mL, and 48.6 ng/mL for Vitamin D3. Statistics performed on the results yielded reproducibility for the three QC pools at 5.1%, 4.6%, and 3.9% for vitamin D2, and 6.4%, 4.0%, and 4.5% for vitamin D3.
Table 8. Intra-Assay Variation Determination for Vitamin D2 Low QC Pool (ng/mL) Medium QC Pool (ng/mL) High QC Pool (ng/mL) Lot 120709-L Lot 120709-M Lot 120709- H 1 6.7 20.3 52.5 2 6.6 21.0 54.7 3 7.0 21.1 51.5 4 6.2 19.5 52.1 5 6.4 20.0 52.0 6 6.2 22.4 53.3 7 7.0 20.4 48.9 8 6.7 21.5 54.6 9 6.7 21.5 52.4 10 6.9 20.9 52.5 11 7.0 19.2 50.2 12 6.2 20.8 52.3 13 7.0 19.6 57.5 14 6.6 20.6 54.7 15 6.2 19.8 53.0 16 6.2 20.6 49.2 17 6.2 22.9 52.5 18 6.2 20.9 51.4 19 7.0 19.6 52.2 20 6.5 20.3 55.2 Mean 6.6 20.6 52.6 SD 0.3 1.0 2.0 CV% 5.1 4.6 3.9 Table 9. Intra-Assay Variation Determination for Vitamin D3 Low QC Pool (ng/mL) Medium QC Pool (ng/mL) High QC Pool (ng/mL) Lot 120709-L Lot 120709-M Lot 120709- H 1 4.3 20.0 48.3 2 5.1 21.8 47.2 3 4.8 21.7 45.4 4 4.5 21.3 49.9 5 5.0 20.5 49.8 6 4.7 21.0 48.2 7 5.8 20.4 46.3 8 4.9 21.2 50.8 9 4.7 22.0 49.1 10 4.7 20.1 48.9 11 4.8 19.1 47.3 12 4.7 19.9 49.1 13 4.9 19.5 52.9 14 5.4 20.3 52.7 15 4.7 19.6 51.3 16 4.8 19.9 46.7 17 4.8 21.0 47.5 18 4.7 21.1 46.9 19 5.0 19.7 45.3 20 5.1 20.4 48.8 Mean 4.9 20.5 48.6 SD 0.3 0.8 2.2 CV% 6.4 4.0 4.5 - The inter-assay variation is defined as the reproducibility (CV) of a sample between assays. Using the three QC pools covering the reportable range of the assay, evaluated over 5 assays according to the methods of Examples 1-3, the inter-assay variation (CV) for the pools was determined for vitamin D2 and vitamin D3. For Vitamin D2, the CVs were determined to be 6.7%, 5.6%, and 4.0% with mean concentrations of 6.5 ng/mL, 21.1 ng/mL, and 50.5 ng/mL, respectively. For Vitamin D3, the CVs were determined to be 6.5%, 5.9%, and 4.2% with mean concentrations of 4.7 ng/mL, 20.8 ng/mL, and 46.8 ng/mL, respectively. Data collected from these analyses are shown in Tables 10 and 11 for vitamin D2 and vitamin D3, respectively. All pools met with acceptable reproducibility requirements of ≤ 15% CV.
Table 10. Inter-Assay Variation Determination for Vitamin D2 Assay Low QC Pool (ng/mL) Medium QC Pool (ng/mL) High QC Pool (ng/mL) Lot 120709-L Lot 120709-M Lot 120709- H 1 6.7 20.3 52.5 6.6 21.0 54.7 7.0 21.1 51.5 6.2 19.5 52.1 6.4 20.0 52.0 2 7.3 23.3 49.4 6.8 22.1 51.6 6.7 20.6 48.6 6.7 20.6 47.2 7.0 21.1 50.4 3 6.3 22.3 49.7 6.1 23.0 52.2 6.6 24.0 49.5 5.6 22.1 49.6 6.1 19.1 51.7 4 6.1 20.5 47.5 7.0 21.1 50.1 6.9 22.2 50.2 7.3 22.1 48.3 6.6 20.2 46.8 5 5.8 21.1 52.4 6.9 19.6 49.6 6.0 20.8 49.1 6.4 20.6 56.1 6.3 20.1 50.8 6 6.3 21.8 50.0 7.0 22.5 49.8 6.2 21.6 51.2 5.9 20.1 50.3 6.9 20.1 50.9 Mean 6.5 21.1 50.5 SD 0.4 1.2 2.0 CV% 6.7 5.6 4.0 Table 11. Inter-Assay Variation Determination for Vitamin D3 Assay Low QC Pool (ng/mL) Medium QC Pool (ng/mL) High QC Pool (ng/mL) Lot 120709-L Lot 120709-M Lot 120709- H 1 4.3 20.0 48.3 5.1 21.8 47.2 4.8 21.7 45.4 4.5 21.3 49.9 5.0 20.5 49.8 2 4.5 23.0 46.3 4.2 22.8 47.8 4.5 19.8 45.1 4.4 20.1 44.4 4.7 21.1 48.7 3 4.9 21.8 44.9 5.1 20.9 46.8 5.2 23.9 45.5 4.4 22.1 45.7 4.6 19.3 47.1 4 4.5 20.1 43.7 4.8 21.2 44.6 5.2 21.9 46.1 4.7 21.3 44.1 4.7 20.5 42.8 5 4.5 20.5 49.1 5.1 20.8 46.9 4.5 21.3 47.3 4.8 20.6 45.8 4.2 19.7 46.1 6 4.7 19.9 49.6 4.7 18.9 47.6 4.4 20.2 48.9 4.4 18.6 48.5 5.2 19.4 49.4 Mean 4.7 20.8 46.8 SD 0.3 1.2 2.0 CV% 6.5 5.9 4.2 - A method correlation study was performed for quantitation of vitamin D2 according to the methods of Examples 1-3 by comparing 20 split samples analyzed according to the tandem mass spectrometric methods described herein with extensive off-line extraction followed by HPLC with UV detection. Specimens were analyzed in singles for each method. Data was analyzed by Linear and Deming regressions. Correlation analyses are summarized in Table 12.
Table 12. Correlation Analyses for Method Comparison Vitamin D2 (n=20) Linear Regression y = 1.26x - 0.55 R2 = 0.96 Deming Regression y = 1.29x - 1.31 - Hemolysis Interference: The effects of hemolysis in the assay described in Examples 1-3 were evaluated by spiking hemoglobin into serum pools containing elevated vitamin D2 and vitamin D3. A fresh blood sample was centrifuged to yield packed red blood cells. The cells were reconstituted in deionized water and frozen to achieve cell lysis. This crude hemoglobin solution was then was spiked into the pools to generate lightly (100 mg/dL) and moderately (500 mg/dL) hemolyzed samples. Specimens were analyzed in duplicate according the method in Examples 1-3 and results were compared to the control pool result and a percent difference was calculated. The data shows that none of the hemoglobin spikes was >15% different than control, for either analyte). Therefore, light to moderate hemolyzed specimens are acceptable. For raw data see Table 13 (%Difference = (Spiked -UnSpiked) /
UnSpiked x 100%).Table 13. Hemolysis Interference Studies Vitamin D2 Vitamin D3 ng/mL % Diff. ng/mL % Diff. Pool 1Control 22.1 31.2 Light Hemolysis 24.3 9.7 33.8 8.5 Moderate Hemolysis 23.8 7.6 34.3 10.0 Pool 2Control 22.3 34.8 Light Hemolysis 21.3 -4.8 32.6 -6.4 Moderate Hemolysis 20.7 -7.2 33.3 -4.5 Pool 3Control 27.3 34.6 Light Hemolysis 26.7 -2.2 34.7 0.2 Moderate Hemolysis 24.6 -9.8 33.4 -3.5 Pool 4Control 23.7 30.4 Light Hemolysis 22.8 -3.8 31.5 3.6 Moderate Hemolysis 21.2 -10.6 29.8 -2.0 Pool 5Control 27.7 33.9 Light Hemolysis 26.7 -3.4 33.7 -0.4 Moderate Hemolysis 25.6 -7.5 33.2 -1.9 Pool 6Control 24.2 33.6 Light Hemolysis 24.3 0.3 33.5 -0.4 Moderate Hemolysis 24.1 0.5 34.1 1.3 - Icteria Interference: The effects of icteria in the assay described in Examples 1-3 were evaluated by spiking bilirubin into serum pools containing elevated vitamin D2 and vitamin D3. A concentrated solution of bilirubin was spiked into the pools to generate lightly (10 mg/dL) and moderately (50 mg/dL) icteric specimens. Specimens were analyzed in duplicate according to the method in Examples 1-3 and results were compared to the non-icteric pool result and the accuracy was calculated. The data shows that both analytes are unaffected by icteria (all values within acceptable accuracy range of 85-115%). Therefore, icteric specimens are acceptable. For raw data see Table 14 (%Difference = (Spiked -UnSpiked) /
UnSpiked x 100%).Table 14. Icteria Interference Studies Vitamin D2 Vitamin D3 ng/mL % Diff. ng/mL % Diff. Pool 1Control 22.1 31.2 Light Icteria 22.2 0.3 32.6 4.8 Moderate Icteria 21.5 -2.6 30.7 -1.6 Pool 2Control 22.3 34.8 Light Icteria 22.0 -1.3 33.4 -4.0 Moderate Icteria 20.5 -8.2 32.4 -6.9 Pool 3Control 27.3 34.6 Light Icteria 28.3 3.8 35.2 1.8 Moderate Icteria 27.1 -0.7 35.0 1.0 Pool 4Control 23.7 30.4 Light Icteria 22.2 -6.3 31.7 4.0 Moderate Icteria 21.7 -8.7 30.7 1.0 Pool 5Control 27.7 33.9 Light Icteria 26.7 -3.7 32.9 -2.8 Moderate Icteria 27.1 -2.0 32.4 -4.4 Pool 6Control 24.2 33.6 Light Icteria 22.8 -5.8 31.8 -5.5 Moderate Icteria 22.6 -6.4 30.5 -9.4 - Lipemia Interference: The effect of lipemia in the assay described in Examples 1-3 was evaluated by spiking porcine brain extract into serum pools containing elevated vitamin D2 and vitamin D3. Powdered lipid sample (Avanti Polar Lipids) was dissolved into each pool to generate lightly (400 mg/dL) and moderately (2000 mg/dL) lipemic specimens. Specimens were analyzed in duplicate according to the method in Examples 1-3 and results were compared to the control pool result and the accuracy was calculated. The data shows that both analytes are unaffected by lipemia (all values within acceptable accuracy range of 85-115%). For raw data see Table 15 ((%Difference = (Spiked -UnSpiked) /
UnSpiked x 100%).Table 15. Lipemia Interference (Porcine Brain Extract) Studies Vitamin D2 Vitamin D3 ng/mL % Diff. ng/mL % Diff. Pool 1Control 22.1 31.2 Light Lipemia 22.0 -0.6 32.7 4.8 Moderate Lipemia 23.0 3.8 32.7 5.0 Pool 2Control 22.3 34.8 Light Lipemia 23.0 3.2 35.4 1.6 Moderate Lipemia 24.2 8.3 34.7 -0.2 Pool 3Control 27.3 34.6 Light Lipemia 28.7 5.4 35.7 2.9 Moderate Lipemia 28.1 3.3 36.5 5.3 Pool 4Control 23.7 30.4 Light Lipemia 25.5 7.4 33.2 9.0 Moderate Lipemia 23.2 -2.5 32.7 7.3 Pool 5Control 27.7 33.9 Light Lipemia 27.1 -2.2 34.4 1.5 Moderate Lipemia 26.7 -3.4 33.9 0.1 Pool 6Control 24.2 33.6 Light Lipemia 26.1 8.0 34.5 2.5 Moderate Lipemia 24.0 -0.7 33.6 -0.2 - The effects of lipemia in the assay described in Examples 1-3 were also evaluated by spiking Intralipid emulsion into serum pools containing elevated vitamin D2 and vitamin D3. To the serum pools, Intralipid (20% emulsion) was added to generate lightly (400 mg/dL) and moderately (2000 mg/dL) lipemic specimens. Specimens were analyzed in duplicate according to the method in Examples 1-3 and results were compared to the control pool result and the accuracy was calculated. The data shows that both analytes are unaffected by lipemia (all values within acceptable accuracy range of 85-115%). For raw data see Table 16.
Table 16. Lipemia Interference (Intralipid) Studies Vitamin D2 Vitamin D3 ng/mL % Diff. ng/mL % Diff. Pool 1Control 22.1 31.2 Light Lipemia 22.5 1.6 33.3 6.8 Moderate Lipemia 19.8 -10.4 28.8 -7.6 Pool 2Control 22.3 34.8 Light Lipemia 22.4 0.4 33.5 -3.6 Moderate Lipemia 19.2 -13.8 30.5 -12.3 Pool 3Control 27.3 34.6 Light Lipemia 27.4 0.6 34.5 -0.3 Moderate Lipemia 24.9 -8.6 32.5 -6.1 Pool 4Control 23.7 30.4 Light Lipemia 23.6 -0.6 31.3 3.0 Moderate Lipemia 19.9 -16.0 29.8 -2.0 Pool 5Control 27.7 33.9 Light Lipemia 27.4 -1.1 32.0 -5.6 Moderate Lipemia 25.8 -6.9 31.9 -5.9 Pool 6Control 24.2 33.6 Light Lipemia 24.5 1.2 33.8 0.6 Moderate Lipemia 22.8 -5.9 30.0 -10.7 - Based upon the two lipemia experiments using porcine brain extract and Intralipid, lipemic specimens are acceptable.
- Specimens were collected from 10 sources into four different Vacutainer® containers. The Vacutainers used were Red-Top (silicon-coated serum tubes), SST (Serum Separator Tubes, which result in gel-barrier serum), EDTA tubes, and Sodium Heparin tubes.
- These 40 samples were analyzed for nutritional vitamin D3 according to the method in Examples 1-3. Comparative results are presented in
Figure 4 . The data demonstrates that all four sample types are suitable for analysis. - Serum specimens from 140 patients were analyzed according to the method described in Examples 1-3 to quantitate vitamin D3. The results ranged from < 2 ng/mL to about 63 ng/mL vitamin D3, with 95% of the results falling within the range of < 2 ng/mL to about 20 ng/mL. The results of these analyses are presented in Table 17.


- Mix recovery studies were performed by analysis of specimens with naturally elevated levels of 25-hydroxyvitamin D2 or 25-hydroxyvitamin D3, and therefore also had some endogenous circulating vitamin D2 or vitamin D3. Six pairs of specimens were selected for the studies. From each pair of specimens (generically referred to as specimen A and specimen B), five samples were prepared and analyzed in quadruplicate according to the method in Examples 1-3. The samples corresponded to 100% A, 80% A - 20% B, 50% A - 50% B, 20% A - 80% B, and 100% B. The results of the recovery studies are presented in Tables 18 and 19.
Table 18. Mixed Specimen Recovery Studies Pool Spike Level Vitamin D2 Vitamin D3 Measured (ng/mL) Expected (ng/mL) Recovery (%) Measured (ng/mL) Expected (ng/mL) Recovery (%) 1 100% A 49.0 2.1 80/20 A/B 37.8 39.3 103.8 3.3 3.5 106.1 50/50 A/B 26.0 24.7 94.8 5.6 5.5 96.9 20/80 A/B 10.5 10.1 96.5 7.6 7.5 98.5 100% B 0.4 8.8 2 100% A 5.0 2.6 80/20 A/B 4.9 4.2 85.5 6.6 6.6 99.4 50/50 A/B 2.9 2.9 101.7 11.8 12.5 106.2 20/80 A/B 1.6 1.7 106.2 17.7 18.5 104.3 100% B 0.9 22.4 3 100% A 8.8 3.0 80/20 A/B 7.6 7.4 96.7 6.6 6.6 101.2 50/50 A/B 5.4 5.2 95.8 11.3 12.1 106.7 20/80 A/B 3.1 3.0 99.1 16.3 17.5 107.6 100% B 1.6 21.2 *Measured values are averages of analysis of four aliquots. Table 19. Summary of Results of Mixed Specimen Recovery Studies Pool Vitamin D2 Vitamin D3 1 103.8% 106.1% 94.8% 96.9% 96.5% 98.5% 2 85.5% 99.4% 101.7% 106.2% 106.2% 104.3% 3 96.7% 101.2% 95.8% 106.7% 99.1% 107.6% Avg 97.8% 103.0% Avg 100.4% - Exemplary Q1 scan spectra from the tandem mass spectrometric analysis of vitamin D2, vitamin D2-[6, 19, 19]-2H3, and vitamin D2-[26, 26, 26, 27, 27, 27]-2H6 are shown in
Figures 5A ,6A , and7A , respectively. These analyses were conducted by directly injecting standard solutions containing the analyte of interest into a Finnigan TSQ Quantum Ultra MS/MS system (Thermo Electron Corporation). A liquid chromatography mobile phase was simulated by passing 800 µL/min of 80% acetonitrile, 20% water with 0.1% formic acid through an HPLC column, upstream of introduction of the analyte. The analytes were ionized by APCI as described above. The spectra were collected by scanning Q1 across a m/z range of about 300 to 450. - Exemplary product ion scans generated from two different precursor ions for each of vitamin D2, vitamin D2-[6, 19, 19]-2H3, and vitamin D2-[26, 26, 26, 27, 27, 27]-2H6 are presented in
Figures 5B-C ,6B-C , and7B-C , respectively. The precursor ions selected in Q1 and the collision energies used to generate these product ion spectra are indicated in Table 20. - Exemplary MRM transitions for the quantitation of vitamin D2 include fragmenting a precursor ion with a m/z of about 397.2 to a product ion with a m/z of about 159.0; and fragmenting a precursor ion with a m/z of about 379.2 to a product ion with a m/z of about 158.9. Exemplary MRM transitions for the quantitation of vitamin D2-[6, 19, 19]-2H3 include fragmenting a precursor ion with a m/z of about 400.2 to a product ion with a m/z of about 147.0; and fragmenting a precursor ion with a m/z of about 382.2 to a product ion with a m/z of about 312.2. Exemplary MRM transitions for the quantitation of vitamin D2-[26, 26, 26, 27, 27, 27]-2H6 include fragmenting a precursor ion with a m/z of about 403.2 to a product ion with a m/z of about 159.1; and fragmenting a precursor ion with a m/z of about 385.2 to a product ion with a m/z of about 159.0. However, as can be seen in the product ion scans in
Figures 5B-C ,6B-C , and7B-C , several other product ions are generated upon fragmentation of the precursor ions. Additional product ions may be selected from those indicated inFigures 5B-C ,6B-C , and7B-C to replace or augment the exemplary fragment ions. For example, additional product ions generated by fragmentation of the vitamin D2 precursor ion with m/z of about 397.2 include ions with m/z of about 146.9, 133.1, and 121.0. Exemplary additional product ions generated by fragmentation of the vitamin D2 precursor ion with m/z of about 379.2 include ions with m/z of about 283.2, 187.3, and 175.2.Table 20. Precursor Ions and Collision Cell Energies for Fragmentation of vitamin D2, vitamin D2 -[6, 19, 19]-2H3, and vitamin D2-[26, 26, 26, 27, 27, 27]-2H6 Analyte Precursor Ion (m/z) Collision Cell Energy (V) vitamin D2 397.2, 379.2 25 vitamin D2-[6, 19, 19]-2H3 400.2, 382.2 25 vitamin D2-[26, 26, 26, 27, 27, 27]-2H6 403.2, 385.2 25 - Exemplary Q1 scan spectra from the tandem mass spectrometric analysis of vitamin D3, vitamin D3-[6, 19, 19]-2H3, and vitamin D3-[26, 26, 26, 27, 27, 27]-2H6 are shown in
Figures 8A ,9A , and10A , respectively. These analyses were conducted by directly injecting standard solutions containing the analyte of interest into a Finnigan TSQ Quantum Ultra MS/MS system (Thermo Electron Corporation). A liquid chromatography mobile phase was simulated by passing 800 µL/min of 80% acetonitrile, 20% water with 0.1% formic acid through an HPLC column, upstream of introduction of the analyte. The spectra were collected by scanning Q1 across a m/z range of about 300 to 450. - Exemplary product ion scans generated from two different precursor ions for each of vitamin D3, vitamin D3-[6, 19, 19]-2H3, and vitamin D3-[26, 26, 26, 27, 27, 27]-2H6 are presented in
Figures 8B-C ,9B-C , and10B-C , respectively. The precursor ions selected in Q1 and the collision energies used to generate these product ion spectra are indicated in Table 21. - Exemplary MRM transitions for the quantitation of vitamin D3 include fragmenting a precursor ion with a m/z of about 385.2 to a product ion with a m/z of about 147.0; and fragmenting a precursor ion with a m/z of about 367.2 to a product ion with a m/z of about 159.0. Exemplary MRM transitions for the quantitation of vitamin D3-[6, 19, 19]-2H3 include fragmenting a precursor ion with a m/z of about 388.2 to a product ion with a m/z of about 147.0; and fragmenting a precursor ion with a m/z of about 370.2 to a product ion with a m/z of about 162.0. Exemplary MRM transitions for the quantitation of vitamin D3-[26, 26, 26, 27, 27, 27]-2H6 include fragmenting a precursor ion with a m/z of about 391.2 to a product ion with a m/z of about 159.1; and fragmenting a precursor ion with a m/z of about 373.2 to a product ion with a m/z of about 159.0. However, as can be seen in the product ion scans in
Figures 8B-C ,9B-C , and10B-C , several other product ions are generated upon fragmentation of the precursor ions. Additional product ions may be selected from those indicated inFigures 8B-C ,9B-C , and10B-C to replace or augment the exemplary fragment ions. For example, additional product ions generated by fragmentation of the vitamin D3 precursor ion with m/z of about 385.2 include ions with m/z of about 159.0, 133.1, and 107.1. Exemplary additional product ions generated by fragmentation of the vitamin D3 precursor ion with m/z of about 367.2 include ions with m/z of about 172.9, 145.0, and 119.1.Table 21. Precursor Ions and Collision Cell Energies for Fragmentation of vitamin D3, vitamin D3 -[6, 19, 19]-2H3, and vitamin D3-[26, 26, 26, 27, 27, 27]-2H6 Analyte Precursor Ion (m/z) Collision Cell Energy (V) vitamin D3 385.2, 367.2 25 vitamin D3-[6, 19, 19]-2H3 388.2, 370.2 25 vitamin D3-[26, 26, 26, 27, 27, 27]-2H6 391.2, 373.2 25 - PTAD derivatives of vitamin D2, vitamin D2-[6, 19, 19]-2H3, vitamin D2-[26, 26, 26, 27, 27, 27]-2H6, vitamin D3, vitamin D3-[6, 19, 19]-2H3, and vitamin D3-[26, 26, 26, 27, 27, 27]-2H6 were prepared by treating aliquots of stock solutions of each analyte with PTAD in acetonitrile. The derivatization reactions was allowed to proceed for approximately one hour, and were quenched by adding water to the reaction mixture. The derivatized analytes were then analyzed according to the procedure outlined above in Examples 2-3.
- Exemplary Q1 scan spectra from the analysis of samples containing PTAD-vitamin D2, PTAD-vitamin D2-[6, 19, 19]-2H3, and PTAD-vitamin D2-[26, 26, 26, 27, 27, 27]-2H6 are shown in
Figures 11A ,12A , and13A , respectively. These analyses were conducted by directly injecting standard solutions containing the analyte of interest into a Finnigan TSQ Quantum Ultra MS/MS system (Thermo Electron Corporation). A liquid chromatography mobile phase was simulated by passing 800 µL/min of 80% acetonitrile, 20% water with 0.1% formic acid through an HPLC column, upstream of introduction of the analyte. The analytes were ionized by APCI as described above. The spectra were collected by scanning Q1 across a m/z range of about 500 to 620. - Exemplary product ion scans generated from precursor ions for each of PTAD-vitamin D2, PTAD-vitamin D2-[6, 19, 19]-2H3, and PTAD-vitamin D2-[26, 26, 26, 27, 27, 27]-2H6 are presented in
Figures 11B ,12B , and13B , respectively. The precursor ions selected in Q1 and the collision energies used to generate these product ion spectra are indicated in Table 22. - An exemplary MRM transition for the quantitation of PTAD-vitamin D2 includes fragmenting a precursor ion with a m/z of about 572.2 to a product ion with a m/z of about 297.9. An exemplary MRM transition for the quantitation of PTAD-vitamin D2-[6, 19, 19]-2H3 includes fragmenting a precursor ion with a m/z of about 575.2 to a product ion with a m/z of about 301.0. An exemplary MRM transition for the quantitation of PTAD-vitamin D2-[26, 26, 26, 27, 27, 27]-2H6 includes fragmenting a precursor ion with a m/z of about 578.2 to a product ion with a m/z of about 297.9. However, as can be seen in the product ion scans in
Figures 11B ,12B , and13B , several other product ions are generated upon fragmentation of the precursor ions. Additional product ions may be selected from those indicated inFigures 11B ,12B , and13B to replace or augment the exemplary fragment ions. For example, additional product ions generated by fragmentation of the PTAD-vitamin D2 precursor ion with m/z of about 572.2 include ions with m/z of about 280.1.Table 22. Precursor Ions and Collision Cell Energies for Fragmentation of PTAD-vitamin D2, PTAD-vitamin D2-[6, 19, 19]-2H3, and PTAD-vitamin D2-[26, 26, 26, 27, 27, 27]-2H6 Analyte Precursor Ion (m/z) Collision Cell Energy (V) PTAD-vitamin D2 572.2 15 PTAD-vitamin D2-[6, 19, 19]-2H3 575.2 15 PTAD-vitamin D2-[26, 26, 26, 27, 27, 27]-2H6 578.2 15 - Exemplary Q1 scan spectra from the analysis of samples containing PTAD-vitamin D3, PTAD-vitamin D3-[6, 19, 19]-2H3, and PTAD-vitamin D3-[26, 26, 26, 27, 27, 27]-2H6 are shown in
Figures 14A ,15A , and16A , respectively. These analyses were conducted by directly injecting standard solutions containing the analyte of interest into a Finnigan TSQ Quantum Ultra MS/MS system (Thermo Electron Corporation). A liquid chromatography mobile phase was simulated by passing 800 µL/min of 80% acetonitrile, 20% water with 0.1% formic acid through an HPLC column, upstream of introduction of the analyte. The spectra were collected by scanning Q1 across a m/z range of about 500 to 620. - Exemplary product ion scans generated from precursor ions for each of PTAD-vitamin D3, PTAD-vitamin D3-[6, 19, 19]-2H3, and PTAD-vitamin D3-[26, 26, 26, 27, 27, 27]-2H6 are presented in
Figures 14B ,15B , and16B , respectively. The precursor ions selected in Q1 and the collision energies used to generate these product ion spectra are indicated in Table 23. - An exemplary MRM transition for the quantitation of PTAD-vitamin D3 includes fragmenting a precursor ion with a m/z of about 560.2 to a product ion with a m/z of about 298.0. An exemplary MRM transition for the quantitation of PTAD-vitamin D3-[6, 19, 19]-2H3 includes fragmenting a precursor ion with a m/z of about 563.2 to a product ion with a m/z of about 301.0. An exemplary MRM transition for the quantitation of PTAD-vitamin D3-[26, 26, 26, 27, 27, 27]-2H6 includes fragmenting a precursor ion with a m/z of about 566.2 to a product ion with a m/z of about 298.0. However, as can be seen in the product ion scans in
Figures 14B ,15B , and16B , several other product ions are generated upon fragmentation of the precursor ions. Additional product ions may be selected from those indicated inFigures 14B ,15B , and16B to replace or augment the exemplary fragment ions. For example, additional product ions generated by fragmentation of the PTAD-vitamin D3 precursor ion with m/z of about 560.2 include ions with m/z of about 280.0.Table 23. Precursor Ions and Collision Cell Energies for Fragmentation of PTAD-vitamin D3, PTAD-vitamin D3-[6, 19, 19]-2H3, and PTAD-vitamin D3-[26, 26, 26, 27, 27, 27]-2H6 Analyte Precursor Ion (m/z) Collision Cell Energy (V) PTAD-vitamin D3 560.2 15 PTAD-vitamin D3-[6, 19, 19]-2H3 563.2 15 PTAD-vitamin D3-[26, 26, 26, 27, 27, 27]-2H6 566.2 15
Claims (6)
- A method for determining the amount of non-metabolized vitamin D2 in a sample by tandem mass spectrometry, the method comprising the steps of:(i) subjecting non-metabolized vitamin D2 from a sample to an ionization source under conditions suitable to generate one or more precursor ions detectable by mass spectrometry selected from the group consisting of ions with a mass to charge ratio (m/z) of 379.2 ± 0.5;(ii) fragmenting at least one of said precursor ions to generate one or more fragment ions detectable by mass spectrometry, wherein the fragment ions comprise one or more ions selected from the group consisting of ions with m/z of 283.2 ± 0.5, 187.3 ± 0.5, and 175.2 ± 0.5;(iii) determining the amount of one or more of the ions generated in steps (i) and (ii) by mass spectrometry; and(iv) relating the presence of non-metabolized vitamin D2 ions determined in step (iii) to the presence of non-metabolized vitamin D2 in the sample,
- The method of claim 1, wherein the sample is subjected to an extraction column prior to ionization, and optionally wherein
the extraction column is a solid phase extraction (SPE) column, or
the extraction column is a turbulent flow liquid chromatography (TFLC) column, and/or
the sample is further subjected to an analytical column prior to ionization, and optionally wherein
the analytical column is a high performance liquid chromatography (HPLC) column, or
the extraction and analytical columns and the ionization source of step (i) are connected in an on-line fashion. - The method of any one of claims 1-2, wherein said ionization source is an atmospheric pressure chemical ionization (APCI) source, and/or said tandem mass spectrometry is conducted as multiple reaction monitoring, precursor ion scanning, or product ion scanning.
- The method of claim 1, further comprising detecting non-metabolized vitamin D3 in the sample.
- The method of claim 4, wherein the non-metabolized vitamin D2 and non-metabolized vitamin D3 are ionized simultaneously.
- The method of any one of claims 1-5, wherein the sample comprises a biological sample, and optionally wherein
said biological sample is from a human, and the amount of non-metabolized vitamin D2 determined in the sample is the amount present in the sample when taken from the human, and/or optionally wherein the sample comprises serum or plasma.
Applications Claiming Priority (3)
| Application Number | Priority Date | Filing Date | Title |
|---|---|---|---|
| US28593809P | 2009-12-11 | 2009-12-11 | |
| US28594309P | 2009-12-11 | 2009-12-11 | |
| PCT/US2010/059765 WO2011072163A1 (en) | 2009-12-11 | 2010-12-09 | Mass spectrometric determination of non-derivatized, non-metabolized vitamin d |
Publications (3)
| Publication Number | Publication Date |
|---|---|
| EP2510339A1 EP2510339A1 (en) | 2012-10-17 |
| EP2510339A4 EP2510339A4 (en) | 2013-11-27 |
| EP2510339B1 true EP2510339B1 (en) | 2019-09-18 |
Family
ID=44145925
Family Applications (1)
| Application Number | Title | Priority Date | Filing Date |
|---|---|---|---|
| EP10836711.1A Not-in-force EP2510339B1 (en) | 2009-12-11 | 2010-12-09 | Mass spectrometric determination of non-derivatized, non-metabolized vitamin d |
Country Status (6)
| Country | Link |
|---|---|
| US (8) | US20120025067A1 (en) |
| EP (1) | EP2510339B1 (en) |
| JP (3) | JP6113504B2 (en) |
| CN (1) | CN102753964A (en) |
| CA (1) | CA2783797C (en) |
| WO (2) | WO2011072163A1 (en) |
Families Citing this family (12)
| Publication number | Priority date | Publication date | Assignee | Title |
|---|---|---|---|---|
| US7745226B2 (en) * | 2005-04-06 | 2010-06-29 | Quest Diagnostics Investments Incorporated | Methods for detecting vitamin D metabolites |
| US7977117B2 (en) | 2009-12-03 | 2011-07-12 | Quest Diagnostics Investments Incorprated | Vitamin D metabolite determination utilizing mass spectrometry following derivatization |
| WO2011072163A1 (en) | 2009-12-11 | 2011-06-16 | Quest Diagnostics Investments Incorporated | Mass spectrometric determination of non-derivatized, non-metabolized vitamin d |
| CN107607662B (en) | 2009-12-11 | 2020-05-08 | 奎斯特诊断投资公司 | Mass spectrometry of steroids in multiplex samples |
| WO2011091436A1 (en) * | 2010-01-25 | 2011-07-28 | Dh Technologies Development Pte. Ltd. | Quantitative analysis of vitamin d3, vitamin d2, and metabolites thereof |
| WO2014149847A2 (en) | 2013-03-15 | 2014-09-25 | Riaz Abrar | Ionization within ion trap using photoionization and electron ionization |
| CN108027353A (en) * | 2015-03-28 | 2018-05-11 | 帝肯样品制备股份有限公司 | Solid Phase Extraction, with crown ether derivatization and mass spectrum, method, reagent and kit |
| CN105403631B (en) * | 2015-10-28 | 2017-12-08 | 浙江省疾病预防控制中心 | Vitamin D in a kind of quick detection health food3The method of content |
| WO2018198043A1 (en) * | 2017-04-28 | 2018-11-01 | Waters Technologies Corporation | Methods for quantifying total vitamin d |
| EP3746781A4 (en) * | 2018-01-29 | 2021-11-24 | DH Technologies Development Pte. Ltd. | Methods and systems for detection of vitamin d metabolites |
| CN111999372A (en) * | 2020-07-09 | 2020-11-27 | 山东师范大学 | Micro-droplet electrospray device and method capable of screening quinoxaline derivative synthesis conditions at high flux |
| WO2023155000A1 (en) * | 2022-02-15 | 2023-08-24 | Mcmaster University | High throughput rapid screening of vitamin d |
Family Cites Families (68)
| Publication number | Priority date | Publication date | Assignee | Title |
|---|---|---|---|---|
| US3030084A (en) | 1958-11-06 | 1962-04-17 | Tillotson Mfg Co | Charge forming apparatus |
| US4332591A (en) * | 1978-01-19 | 1982-06-01 | Sumitomo Chemical Company, Limited | Analytical method and apparatus for the determination of total nitrogen contents in aqueous systems |
| US5030772A (en) | 1990-02-14 | 1991-07-09 | Deluca Hector F | Process for preparing vitamin D2 compounds and the corresponding 1 α-hydroxylated derivatives |
| US5605798A (en) | 1993-01-07 | 1997-02-25 | Sequenom, Inc. | DNA diagnostic based on mass spectrometry |
| JPH06341980A (en) | 1993-02-24 | 1994-12-13 | Kureha Chem Ind Co Ltd | Determination method for vitamin d3 derivative |
| EP1347493A3 (en) | 1993-05-28 | 2005-11-23 | Baylor College Of Medicine | Method and apparatus for desorption and ionization of analytes |
| JP2968910B2 (en) | 1993-07-14 | 1999-11-02 | ヤマサ醤油株式会社 | Antibodies against 1α, 25 (OH) 2 vitamin D3 and uses thereof |
| WO1995033279A1 (en) | 1994-05-31 | 1995-12-07 | University Of Warwick | Tandem mass spectrometry apparatus |
| DE19531152A1 (en) | 1994-12-15 | 1996-06-20 | Bayer Ag | Substituted N-aryl nitrogen heterocycles |
| US5614408A (en) * | 1995-10-18 | 1997-03-25 | The United States Of America As Represented By The Secretary Of Agricultural | Monoclonal antibodies to potato, tomato, and eggplant glycoalkaloids and assays for the same |
| US5772874A (en) | 1995-11-02 | 1998-06-30 | Cohesive Technologies, Inc. | High performance liquid chromatography method and apparatus |
| WO1997026532A1 (en) | 1996-01-19 | 1997-07-24 | Cohesive Technologies, Inc. | High performance liquid chromatography method and apparatus |
| EP1164203B1 (en) | 1996-11-06 | 2007-10-10 | Sequenom, Inc. | DNA Diagnostics based on mass spectrometry |
| US5916523A (en) * | 1996-12-04 | 1999-06-29 | Antek Instruments, Inc. | Methods for near simultaneous chemiluminescent sulfur and nitrogen detection |
| AU7497798A (en) * | 1997-05-16 | 1998-12-08 | F. Hoffmann-La Roche Ag | 3-epi compounds of vitamin d3 and uses thereof |
| GB9717926D0 (en) | 1997-08-22 | 1997-10-29 | Micromass Ltd | Methods and apparatus for tandem mass spectrometry |
| GB9719187D0 (en) | 1997-09-09 | 1997-11-12 | Glaxo Group Ltd | Compounds |
| JP2002502086A (en) | 1998-01-23 | 2002-01-22 | アナリティカ オブ ブランフォード インコーポレーテッド | Mass spectrometry from the surface |
| EP1097132B1 (en) | 1998-06-25 | 2003-12-17 | Immundiagnostik Gesellschaft für Produktion und Vertrieb von Labordiagnostika mbH | Functional vitamin d derivatives and a method for determining 25-hydroxy-vitamin d and 1alpha,25-dihydroxy-vitamin d |
| WO2001040177A2 (en) | 1999-12-02 | 2001-06-07 | Women And Infants Hospital | Esters of vitamin d3 and uses thereof |
| GB0029729D0 (en) | 2000-12-06 | 2001-01-17 | Ids Ltd | Method for detection of vitamin D metabolites |
| US7087395B1 (en) | 2001-01-16 | 2006-08-08 | Quest Diagnostics Investments Incorporated | Vitamin D assay |
| US20050064422A1 (en) | 2001-11-29 | 2005-03-24 | Barnidge David R | Polypeptide quantitation |
| TWI286554B (en) | 2002-06-27 | 2007-09-11 | Chugai Pharmaceutical Co Ltd | Ferrocene compounds and uses thereof |
| CN101782581A (en) | 2002-10-03 | 2010-07-21 | 诺曼·利·安德森 | High sensitivity quantitation of peptides by mass spectrometry |
| US7632686B2 (en) | 2002-10-03 | 2009-12-15 | Anderson Forschung Group | High sensitivity quantitation of peptides by mass spectrometry |
| CA2519626C (en) | 2003-04-14 | 2013-06-18 | Georgetown University | Thyroid hormone analysis by mass spectrometry with minimal sample preparation |
| WO2004090525A1 (en) * | 2003-04-14 | 2004-10-21 | Georgetown University | Steroid hormone analysis by mass spectrometry |
| US6977143B1 (en) | 2003-09-08 | 2005-12-20 | Quest Diagnostics Investments Incorporated | Determination of testosterone by mass spectrometry |
| WO2005050226A1 (en) * | 2003-11-14 | 2005-06-02 | Irm Llc | Fluorous labeling for selective processing of biologically-derived samples |
| JP4555994B2 (en) | 2003-12-19 | 2010-10-06 | 日立化成工業株式会社 | Backlight device and liquid crystal display device |
| CN1993134A (en) | 2004-05-19 | 2007-07-04 | 默克公司 | Composition for inhibiting bone resorption comprising bisphosphoric acid (alendronic acid) and vitamin D (cholecalciferol) |
| CA2480549A1 (en) | 2004-09-15 | 2006-03-15 | Phytronix Technologies Inc. | Ionization source for mass spectrometer |
| US20060094039A1 (en) | 2004-09-20 | 2006-05-04 | Ron Rosenfeld | Diagnosis of fetal aneuploidy |
| US7700365B2 (en) | 2004-10-29 | 2010-04-20 | Mayo Foundation For Medical Education And Research | Vitamin D deficiencies |
| US20070037286A1 (en) | 2005-02-09 | 2007-02-15 | Subhasish Purkayastha | Thyroxine-containing compound analysis methods |
| JP2008534955A (en) | 2005-03-31 | 2008-08-28 | ジョージタウン ユニバーシティ | Advantageous thyroxine and free triiodothyronine analysis by mass spectrometry |
| EP1886112B1 (en) | 2005-04-06 | 2014-07-09 | Washington University St. Louis | Methods for measuring the metabolism of neurally derived biomolecules in vivo |
| US7745226B2 (en) | 2005-04-06 | 2010-06-29 | Quest Diagnostics Investments Incorporated | Methods for detecting vitamin D metabolites |
| US7972867B2 (en) | 2005-04-06 | 2011-07-05 | Quest Diagnostics Investments Incorporated | Methods for detecting vitamin D metabolites by mass spectrometry |
| US20060236886A1 (en) | 2005-04-20 | 2006-10-26 | Agfa-Gevaert | Process for the offset printing of a catalytic species via a hydrophilic phase |
| WO2007039193A1 (en) | 2005-09-29 | 2007-04-12 | Roche Diagnostics Gmbh | Antibodies against 25-hydroxyvitamin d |
| US20070105179A1 (en) | 2005-11-09 | 2007-05-10 | Dionex Corporation | Methods of detecting N-and O-linked oligosaccharides in glycoproteins |
| US7855057B2 (en) | 2006-03-23 | 2010-12-21 | Millipore Corporation | Protein splice variant/isoform discrimination and quantitative measurements thereof |
| WO2008097246A2 (en) | 2006-05-24 | 2008-08-14 | Swce | Extraction and detection system and method |
| WO2007139956A2 (en) | 2006-05-26 | 2007-12-06 | Laboratory Corporation Of America Holdings | Methods and systems for the quantitative analysis of biomarkers |
| CN101467048B (en) | 2006-06-06 | 2014-04-02 | 霍夫曼-拉罗奇有限公司 | Improved measurement of vitamin D |
| US7906341B2 (en) | 2006-06-30 | 2011-03-15 | Dh Technologies Development Pte, Ltd. | Methods, mixtures, kits and compositions pertaining to analyte determination |
| WO2008027861A1 (en) | 2006-08-30 | 2008-03-06 | Ge Healthcare Bio-Sciences Corp. | System and method for characterizing membranes and membrane filtration devices |
| US7999084B2 (en) * | 2007-05-16 | 2011-08-16 | Agilent Technologies, Inc. | Devices and methods for reducing matrix effects |
| US7807172B2 (en) | 2007-06-13 | 2010-10-05 | University Of Washington | Methods and compositions for detecting thyroglobulin in a biological sample |
| JP4883540B2 (en) | 2007-06-21 | 2012-02-22 | 国立大学法人福井大学 | Protein analysis methods using isotope compounds as labels |
| JP5080945B2 (en) | 2007-11-09 | 2012-11-21 | 株式会社日立ハイテクノロジーズ | Mass spectrometer and mass spectrometry method |
| US7972868B2 (en) | 2007-11-28 | 2011-07-05 | Quest Diagnostics Investments Incorporated | Methods for detecting dihydroxyvitamin D metabolites by mass spectrometry |
| US8030084B2 (en) | 2007-12-06 | 2011-10-04 | Quest Diagnostics Investments Incorporated | Thyroglobulin quantitation by mass spectrometry |
| US20110212534A1 (en) | 2008-08-11 | 2011-09-01 | Taylor Robert L | Methods for determining levels of 1,25 dihydroxy vitamin d2 and d3 |
| US20110301063A1 (en) | 2009-02-24 | 2011-12-08 | Netzel Brian C | Multiplexing derivatized anayltes using mass spectroscopy |
| US8034627B2 (en) | 2009-12-03 | 2011-10-11 | Quest Diagnostics Investments Incorporated | Methods for detecting dihydroxyvitamin D metabolites by mass spectrometry |
| US7977117B2 (en) | 2009-12-03 | 2011-07-12 | Quest Diagnostics Investments Incorprated | Vitamin D metabolite determination utilizing mass spectrometry following derivatization |
| CN107607662B (en) | 2009-12-11 | 2020-05-08 | 奎斯特诊断投资公司 | Mass spectrometry of steroids in multiplex samples |
| WO2011072163A1 (en) | 2009-12-11 | 2011-06-16 | Quest Diagnostics Investments Incorporated | Mass spectrometric determination of non-derivatized, non-metabolized vitamin d |
| WO2011091436A1 (en) | 2010-01-25 | 2011-07-28 | Dh Technologies Development Pte. Ltd. | Quantitative analysis of vitamin d3, vitamin d2, and metabolites thereof |
| WO2011116028A1 (en) | 2010-03-15 | 2011-09-22 | Anderson Forschung Group, Inc. | Improved mass spectrometric assays for peptides |
| EP2633325B1 (en) | 2010-10-29 | 2016-12-28 | Cohesive Technologies Inc. | Lc-ms separation and detection of vitamin d metabolites |
| JPWO2012111249A1 (en) | 2011-02-14 | 2014-07-03 | 学校法人麻布獣医学園 | Method for detecting mass change in mass spectrometry and method for quantifying absolute amount of stable isotope-labeled protein |
| US9140695B2 (en) | 2012-01-18 | 2015-09-22 | University Of Utah Research Foundation | Methods for analysis of free and autoantibody-bound biomarkers and associated compositions, devices, and systems |
| JP5902357B2 (en) | 2012-09-20 | 2016-04-13 | クエスト ダイアグノスティックス インヴェストメンツ インコーポレイテッド | Thyroglobulin quantification by mass spectrometry |
| JP7209363B2 (en) | 2020-04-13 | 2023-01-20 | リオモ インク | Stability evaluation system, program and method |
-
2010
- 2010-12-09 WO PCT/US2010/059765 patent/WO2011072163A1/en active Application Filing
- 2010-12-09 JP JP2012543290A patent/JP6113504B2/en active Active
- 2010-12-09 EP EP10836711.1A patent/EP2510339B1/en not_active Not-in-force
- 2010-12-09 US US12/964,710 patent/US20120025067A1/en not_active Abandoned
- 2010-12-09 CN CN2010800635404A patent/CN102753964A/en active Pending
- 2010-12-09 CA CA2783797A patent/CA2783797C/en active Active
- 2010-12-09 WO PCT/US2010/059771 patent/WO2011072168A1/en active Application Filing
- 2010-12-09 US US12/964,717 patent/US20110240840A1/en not_active Abandoned
-
2015
- 2015-07-31 JP JP2015152480A patent/JP6290145B2/en active Active
-
2016
- 2016-06-27 US US15/194,009 patent/US20170115314A1/en not_active Abandoned
-
2018
- 2018-02-07 JP JP2018020278A patent/JP6728254B2/en active Active
- 2018-08-01 US US16/051,849 patent/US10753950B2/en active Active
-
2020
- 2020-08-24 US US17/001,425 patent/US11280799B2/en active Active
-
2022
- 2022-03-21 US US17/700,320 patent/US11549954B2/en active Active
- 2022-12-30 US US18/091,726 patent/US11852636B2/en active Active
-
2023
- 2023-11-07 US US18/503,388 patent/US20240077503A1/en active Pending
Non-Patent Citations (1)
| Title |
|---|
| None * |
Also Published As
| Publication number | Publication date |
|---|---|
| US20120025067A1 (en) | 2012-02-02 |
| US11852636B2 (en) | 2023-12-26 |
| CN102753964A (en) | 2012-10-24 |
| US20220214366A1 (en) | 2022-07-07 |
| US20230146212A1 (en) | 2023-05-11 |
| JP6290145B2 (en) | 2018-03-07 |
| US20180348236A1 (en) | 2018-12-06 |
| JP2013513802A (en) | 2013-04-22 |
| JP6728254B2 (en) | 2020-07-22 |
| JP2018105878A (en) | 2018-07-05 |
| US20240077503A1 (en) | 2024-03-07 |
| CA2783797C (en) | 2021-06-08 |
| JP6113504B2 (en) | 2017-04-12 |
| US20170115314A1 (en) | 2017-04-27 |
| US10753950B2 (en) | 2020-08-25 |
| US20110240840A1 (en) | 2011-10-06 |
| US11549954B2 (en) | 2023-01-10 |
| JP2016026287A (en) | 2016-02-12 |
| EP2510339A1 (en) | 2012-10-17 |
| WO2011072163A1 (en) | 2011-06-16 |
| CA2783797A1 (en) | 2011-06-16 |
| US11280799B2 (en) | 2022-03-22 |
| WO2011072168A1 (en) | 2011-06-16 |
| EP2510339A4 (en) | 2013-11-27 |
| US20210041464A1 (en) | 2021-02-11 |
Similar Documents
| Publication | Publication Date | Title |
|---|---|---|
| US11808773B2 (en) | Mass spectrometry of steroidal compounds in multiplexed patient samples | |
| US11885820B2 (en) | Vitamin D metabolite determination utilizing mass spectrometry following derivatization | |
| US11852636B2 (en) | Mass spectrometric determination of non-derivatized, non-metabolized vitamin D |
Legal Events
| Date | Code | Title | Description |
|---|---|---|---|
| PUAI | Public reference made under article 153(3) epc to a published international application that has entered the european phase |
Free format text: ORIGINAL CODE: 0009012 |
|
| 17P | Request for examination filed |
Effective date: 20120711 |
|
| AK | Designated contracting states |
Kind code of ref document: A1 Designated state(s): AL AT BE BG CH CY CZ DE DK EE ES FI FR GB GR HR HU IE IS IT LI LT LU LV MC MK MT NL NO PL PT RO RS SE SI SK SM TR |
|
| DAX | Request for extension of the european patent (deleted) | ||
| RIC1 | Information provided on ipc code assigned before grant |
Ipc: G01N 24/00 20060101AFI20130927BHEP Ipc: G01N 33/68 20060101ALI20130927BHEP Ipc: G01N 33/92 20060101ALI20130927BHEP Ipc: G01N 33/74 20060101ALI20130927BHEP |
|
| A4 | Supplementary search report drawn up and despatched |
Effective date: 20131028 |
|
| RIC1 | Information provided on ipc code assigned before grant |
Ipc: G01N 33/92 20060101ALI20131022BHEP Ipc: G01N 33/68 20060101ALI20131022BHEP Ipc: G01N 33/74 20060101ALI20131022BHEP Ipc: G01N 24/00 20060101AFI20131022BHEP |
|
| 17Q | First examination report despatched |
Effective date: 20150206 |
|
| STAA | Information on the status of an ep patent application or granted ep patent |
Free format text: STATUS: EXAMINATION IS IN PROGRESS |
|
| GRAP | Despatch of communication of intention to grant a patent |
Free format text: ORIGINAL CODE: EPIDOSNIGR1 |
|
| STAA | Information on the status of an ep patent application or granted ep patent |
Free format text: STATUS: GRANT OF PATENT IS INTENDED |
|
| INTG | Intention to grant announced |
Effective date: 20190408 |
|
| GRAS | Grant fee paid |
Free format text: ORIGINAL CODE: EPIDOSNIGR3 |
|
| GRAA | (expected) grant |
Free format text: ORIGINAL CODE: 0009210 |
|
| STAA | Information on the status of an ep patent application or granted ep patent |
Free format text: STATUS: THE PATENT HAS BEEN GRANTED |
|
| AK | Designated contracting states |
Kind code of ref document: B1 Designated state(s): AL AT BE BG CH CY CZ DE DK EE ES FI FR GB GR HR HU IE IS IT LI LT LU LV MC MK MT NL NO PL PT RO RS SE SI SK SM TR |
|
| REG | Reference to a national code |
Ref country code: GB Ref legal event code: FG4D |
|
| REG | Reference to a national code |
Ref country code: CH Ref legal event code: EP |
|
| REG | Reference to a national code |
Ref country code: DE Ref legal event code: R096 Ref document number: 602010061160 Country of ref document: DE |
|
| REG | Reference to a national code |
Ref country code: AT Ref legal event code: REF Ref document number: 1181923 Country of ref document: AT Kind code of ref document: T Effective date: 20191015 |
|
| REG | Reference to a national code |
Ref country code: IE Ref legal event code: FG4D |
|
| REG | Reference to a national code |
Ref country code: NL Ref legal event code: MP Effective date: 20190918 |
|
| PG25 | Lapsed in a contracting state [announced via postgrant information from national office to epo] |
Ref country code: BG Free format text: LAPSE BECAUSE OF FAILURE TO SUBMIT A TRANSLATION OF THE DESCRIPTION OR TO PAY THE FEE WITHIN THE PRESCRIBED TIME-LIMIT Effective date: 20191218 Ref country code: NO Free format text: LAPSE BECAUSE OF FAILURE TO SUBMIT A TRANSLATION OF THE DESCRIPTION OR TO PAY THE FEE WITHIN THE PRESCRIBED TIME-LIMIT Effective date: 20191218 Ref country code: LT Free format text: LAPSE BECAUSE OF FAILURE TO SUBMIT A TRANSLATION OF THE DESCRIPTION OR TO PAY THE FEE WITHIN THE PRESCRIBED TIME-LIMIT Effective date: 20190918 Ref country code: FI Free format text: LAPSE BECAUSE OF FAILURE TO SUBMIT A TRANSLATION OF THE DESCRIPTION OR TO PAY THE FEE WITHIN THE PRESCRIBED TIME-LIMIT Effective date: 20190918 Ref country code: SE Free format text: LAPSE BECAUSE OF FAILURE TO SUBMIT A TRANSLATION OF THE DESCRIPTION OR TO PAY THE FEE WITHIN THE PRESCRIBED TIME-LIMIT Effective date: 20190918 Ref country code: HR Free format text: LAPSE BECAUSE OF FAILURE TO SUBMIT A TRANSLATION OF THE DESCRIPTION OR TO PAY THE FEE WITHIN THE PRESCRIBED TIME-LIMIT Effective date: 20190918 |
|
| REG | Reference to a national code |
Ref country code: LT Ref legal event code: MG4D |
|
| PG25 | Lapsed in a contracting state [announced via postgrant information from national office to epo] |
Ref country code: AL Free format text: LAPSE BECAUSE OF FAILURE TO SUBMIT A TRANSLATION OF THE DESCRIPTION OR TO PAY THE FEE WITHIN THE PRESCRIBED TIME-LIMIT Effective date: 20190918 Ref country code: GR Free format text: LAPSE BECAUSE OF FAILURE TO SUBMIT A TRANSLATION OF THE DESCRIPTION OR TO PAY THE FEE WITHIN THE PRESCRIBED TIME-LIMIT Effective date: 20191219 Ref country code: LV Free format text: LAPSE BECAUSE OF FAILURE TO SUBMIT A TRANSLATION OF THE DESCRIPTION OR TO PAY THE FEE WITHIN THE PRESCRIBED TIME-LIMIT Effective date: 20190918 Ref country code: RS Free format text: LAPSE BECAUSE OF FAILURE TO SUBMIT A TRANSLATION OF THE DESCRIPTION OR TO PAY THE FEE WITHIN THE PRESCRIBED TIME-LIMIT Effective date: 20190918 |
|
| REG | Reference to a national code |
Ref country code: AT Ref legal event code: MK05 Ref document number: 1181923 Country of ref document: AT Kind code of ref document: T Effective date: 20190918 |
|
| PG25 | Lapsed in a contracting state [announced via postgrant information from national office to epo] |
Ref country code: IT Free format text: LAPSE BECAUSE OF FAILURE TO SUBMIT A TRANSLATION OF THE DESCRIPTION OR TO PAY THE FEE WITHIN THE PRESCRIBED TIME-LIMIT Effective date: 20190918 Ref country code: PT Free format text: LAPSE BECAUSE OF FAILURE TO SUBMIT A TRANSLATION OF THE DESCRIPTION OR TO PAY THE FEE WITHIN THE PRESCRIBED TIME-LIMIT Effective date: 20200120 Ref country code: AT Free format text: LAPSE BECAUSE OF FAILURE TO SUBMIT A TRANSLATION OF THE DESCRIPTION OR TO PAY THE FEE WITHIN THE PRESCRIBED TIME-LIMIT Effective date: 20190918 Ref country code: PL Free format text: LAPSE BECAUSE OF FAILURE TO SUBMIT A TRANSLATION OF THE DESCRIPTION OR TO PAY THE FEE WITHIN THE PRESCRIBED TIME-LIMIT Effective date: 20190918 Ref country code: NL Free format text: LAPSE BECAUSE OF FAILURE TO SUBMIT A TRANSLATION OF THE DESCRIPTION OR TO PAY THE FEE WITHIN THE PRESCRIBED TIME-LIMIT Effective date: 20190918 Ref country code: EE Free format text: LAPSE BECAUSE OF FAILURE TO SUBMIT A TRANSLATION OF THE DESCRIPTION OR TO PAY THE FEE WITHIN THE PRESCRIBED TIME-LIMIT Effective date: 20190918 Ref country code: ES Free format text: LAPSE BECAUSE OF FAILURE TO SUBMIT A TRANSLATION OF THE DESCRIPTION OR TO PAY THE FEE WITHIN THE PRESCRIBED TIME-LIMIT Effective date: 20190918 Ref country code: RO Free format text: LAPSE BECAUSE OF FAILURE TO SUBMIT A TRANSLATION OF THE DESCRIPTION OR TO PAY THE FEE WITHIN THE PRESCRIBED TIME-LIMIT Effective date: 20190918 |
|
| PG25 | Lapsed in a contracting state [announced via postgrant information from national office to epo] |
Ref country code: CZ Free format text: LAPSE BECAUSE OF FAILURE TO SUBMIT A TRANSLATION OF THE DESCRIPTION OR TO PAY THE FEE WITHIN THE PRESCRIBED TIME-LIMIT Effective date: 20190918 Ref country code: SM Free format text: LAPSE BECAUSE OF FAILURE TO SUBMIT A TRANSLATION OF THE DESCRIPTION OR TO PAY THE FEE WITHIN THE PRESCRIBED TIME-LIMIT Effective date: 20190918 Ref country code: SK Free format text: LAPSE BECAUSE OF FAILURE TO SUBMIT A TRANSLATION OF THE DESCRIPTION OR TO PAY THE FEE WITHIN THE PRESCRIBED TIME-LIMIT Effective date: 20190918 Ref country code: IS Free format text: LAPSE BECAUSE OF FAILURE TO SUBMIT A TRANSLATION OF THE DESCRIPTION OR TO PAY THE FEE WITHIN THE PRESCRIBED TIME-LIMIT Effective date: 20200224 |
|
| REG | Reference to a national code |
Ref country code: DE Ref legal event code: R097 Ref document number: 602010061160 Country of ref document: DE |
|
| PLBE | No opposition filed within time limit |
Free format text: ORIGINAL CODE: 0009261 |
|
| STAA | Information on the status of an ep patent application or granted ep patent |
Free format text: STATUS: NO OPPOSITION FILED WITHIN TIME LIMIT |
|
| PG2D | Information on lapse in contracting state deleted |
Ref country code: IS |
|
| PG25 | Lapsed in a contracting state [announced via postgrant information from national office to epo] |
Ref country code: DK Free format text: LAPSE BECAUSE OF FAILURE TO SUBMIT A TRANSLATION OF THE DESCRIPTION OR TO PAY THE FEE WITHIN THE PRESCRIBED TIME-LIMIT Effective date: 20190918 Ref country code: IS Free format text: LAPSE BECAUSE OF FAILURE TO SUBMIT A TRANSLATION OF THE DESCRIPTION OR TO PAY THE FEE WITHIN THE PRESCRIBED TIME-LIMIT Effective date: 20200119 |
|
| REG | Reference to a national code |
Ref country code: CH Ref legal event code: PL |
|
| 26N | No opposition filed |
Effective date: 20200619 |
|
| REG | Reference to a national code |
Ref country code: BE Ref legal event code: MM Effective date: 20191231 |
|
| PG25 | Lapsed in a contracting state [announced via postgrant information from national office to epo] |
Ref country code: SI Free format text: LAPSE BECAUSE OF FAILURE TO SUBMIT A TRANSLATION OF THE DESCRIPTION OR TO PAY THE FEE WITHIN THE PRESCRIBED TIME-LIMIT Effective date: 20190918 Ref country code: MC Free format text: LAPSE BECAUSE OF FAILURE TO SUBMIT A TRANSLATION OF THE DESCRIPTION OR TO PAY THE FEE WITHIN THE PRESCRIBED TIME-LIMIT Effective date: 20190918 |
|
| PG25 | Lapsed in a contracting state [announced via postgrant information from national office to epo] |
Ref country code: IE Free format text: LAPSE BECAUSE OF NON-PAYMENT OF DUE FEES Effective date: 20191209 Ref country code: LU Free format text: LAPSE BECAUSE OF NON-PAYMENT OF DUE FEES Effective date: 20191209 Ref country code: FR Free format text: LAPSE BECAUSE OF NON-PAYMENT OF DUE FEES Effective date: 20191231 |
|
| PG25 | Lapsed in a contracting state [announced via postgrant information from national office to epo] |
Ref country code: CH Free format text: LAPSE BECAUSE OF NON-PAYMENT OF DUE FEES Effective date: 20191231 Ref country code: LI Free format text: LAPSE BECAUSE OF NON-PAYMENT OF DUE FEES Effective date: 20191231 Ref country code: BE Free format text: LAPSE BECAUSE OF NON-PAYMENT OF DUE FEES Effective date: 20191231 |
|
| PGFP | Annual fee paid to national office [announced via postgrant information from national office to epo] |
Ref country code: GB Payment date: 20201202 Year of fee payment: 11 Ref country code: DE Payment date: 20201124 Year of fee payment: 11 |
|
| PG25 | Lapsed in a contracting state [announced via postgrant information from national office to epo] |
Ref country code: CY Free format text: LAPSE BECAUSE OF FAILURE TO SUBMIT A TRANSLATION OF THE DESCRIPTION OR TO PAY THE FEE WITHIN THE PRESCRIBED TIME-LIMIT Effective date: 20190918 |
|
| PG25 | Lapsed in a contracting state [announced via postgrant information from national office to epo] |
Ref country code: MT Free format text: LAPSE BECAUSE OF FAILURE TO SUBMIT A TRANSLATION OF THE DESCRIPTION OR TO PAY THE FEE WITHIN THE PRESCRIBED TIME-LIMIT Effective date: 20190918 Ref country code: HU Free format text: LAPSE BECAUSE OF FAILURE TO SUBMIT A TRANSLATION OF THE DESCRIPTION OR TO PAY THE FEE WITHIN THE PRESCRIBED TIME-LIMIT; INVALID AB INITIO Effective date: 20101209 |
|
| PG25 | Lapsed in a contracting state [announced via postgrant information from national office to epo] |
Ref country code: TR Free format text: LAPSE BECAUSE OF FAILURE TO SUBMIT A TRANSLATION OF THE DESCRIPTION OR TO PAY THE FEE WITHIN THE PRESCRIBED TIME-LIMIT Effective date: 20190918 |
|
| PG25 | Lapsed in a contracting state [announced via postgrant information from national office to epo] |
Ref country code: MK Free format text: LAPSE BECAUSE OF FAILURE TO SUBMIT A TRANSLATION OF THE DESCRIPTION OR TO PAY THE FEE WITHIN THE PRESCRIBED TIME-LIMIT Effective date: 20190918 |
|
| REG | Reference to a national code |
Ref country code: DE Ref legal event code: R119 Ref document number: 602010061160 Country of ref document: DE |
|
| GBPC | Gb: european patent ceased through non-payment of renewal fee |
Effective date: 20211209 |
|
| PG25 | Lapsed in a contracting state [announced via postgrant information from national office to epo] |
Ref country code: GB Free format text: LAPSE BECAUSE OF NON-PAYMENT OF DUE FEES Effective date: 20211209 Ref country code: DE Free format text: LAPSE BECAUSE OF NON-PAYMENT OF DUE FEES Effective date: 20220701 |