EP2468187A1 - Endoscope system and processor apparatus thereof, and method for generating images - Google Patents
Endoscope system and processor apparatus thereof, and method for generating images Download PDFInfo
- Publication number
- EP2468187A1 EP2468187A1 EP11191043A EP11191043A EP2468187A1 EP 2468187 A1 EP2468187 A1 EP 2468187A1 EP 11191043 A EP11191043 A EP 11191043A EP 11191043 A EP11191043 A EP 11191043A EP 2468187 A1 EP2468187 A1 EP 2468187A1
- Authority
- EP
- European Patent Office
- Prior art keywords
- image
- oxygen saturation
- light
- blood volume
- signal
- Prior art date
- Legal status (The legal status is an assumption and is not a legal conclusion. Google has not performed a legal analysis and makes no representation as to the accuracy of the status listed.)
- Granted
Links
- 238000000034 method Methods 0.000 title claims description 10
- 229910052760 oxygen Inorganic materials 0.000 claims abstract description 177
- 239000001301 oxygen Substances 0.000 claims abstract description 177
- QVGXLLKOCUKJST-UHFFFAOYSA-N atomic oxygen Chemical compound [O] QVGXLLKOCUKJST-UHFFFAOYSA-N 0.000 claims abstract description 176
- 210000004369 blood Anatomy 0.000 claims abstract description 162
- 239000008280 blood Substances 0.000 claims abstract description 162
- 238000010521 absorption reaction Methods 0.000 claims abstract description 26
- 108010054147 Hemoglobins Proteins 0.000 claims abstract description 16
- 102000001554 Hemoglobins Human genes 0.000 claims abstract description 16
- 238000005286 illumination Methods 0.000 claims description 27
- OAICVXFJPJFONN-UHFFFAOYSA-N Phosphorus Chemical compound [P] OAICVXFJPJFONN-UHFFFAOYSA-N 0.000 claims description 23
- 230000005284 excitation Effects 0.000 claims description 18
- 238000003384 imaging method Methods 0.000 claims description 16
- 210000004204 blood vessel Anatomy 0.000 claims description 15
- 238000001914 filtration Methods 0.000 claims description 4
- 239000013307 optical fiber Substances 0.000 description 8
- 230000003595 spectral effect Effects 0.000 description 8
- 238000009825 accumulation Methods 0.000 description 7
- 206010028980 Neoplasm Diseases 0.000 description 4
- 238000005452 bending Methods 0.000 description 4
- 238000004364 calculation method Methods 0.000 description 4
- 238000006243 chemical reaction Methods 0.000 description 4
- 230000007423 decrease Effects 0.000 description 4
- 238000010586 diagram Methods 0.000 description 4
- 238000000295 emission spectrum Methods 0.000 description 4
- 201000011591 microinvasive gastric cancer Diseases 0.000 description 4
- 230000002792 vascular Effects 0.000 description 4
- INGWEZCOABYORO-UHFFFAOYSA-N 2-(furan-2-yl)-7-methyl-1h-1,8-naphthyridin-4-one Chemical compound N=1C2=NC(C)=CC=C2C(O)=CC=1C1=CC=CO1 INGWEZCOABYORO-UHFFFAOYSA-N 0.000 description 3
- 108010064719 Oxyhemoglobins Proteins 0.000 description 3
- 108010002255 deoxyhemoglobin Proteins 0.000 description 3
- 230000003902 lesion Effects 0.000 description 3
- 230000031700 light absorption Effects 0.000 description 3
- 239000000126 substance Substances 0.000 description 3
- 238000000149 argon plasma sintering Methods 0.000 description 2
- 201000011510 cancer Diseases 0.000 description 2
- 239000003086 colorant Substances 0.000 description 2
- 206010021143 Hypoxia Diseases 0.000 description 1
- 230000000295 complement effect Effects 0.000 description 1
- 230000001419 dependent effect Effects 0.000 description 1
- 239000000835 fiber Substances 0.000 description 1
- 230000001146 hypoxic effect Effects 0.000 description 1
- 239000011159 matrix material Substances 0.000 description 1
- 229910044991 metal oxide Inorganic materials 0.000 description 1
- 150000004706 metal oxides Chemical class 0.000 description 1
- 238000012986 modification Methods 0.000 description 1
- 230000004048 modification Effects 0.000 description 1
- 210000004877 mucosa Anatomy 0.000 description 1
- 239000004065 semiconductor Substances 0.000 description 1
- 238000004088 simulation Methods 0.000 description 1
- 210000001519 tissue Anatomy 0.000 description 1
- 229910052724 xenon Inorganic materials 0.000 description 1
- FHNFHKCVQCLJFQ-UHFFFAOYSA-N xenon atom Chemical compound [Xe] FHNFHKCVQCLJFQ-UHFFFAOYSA-N 0.000 description 1
Images


Classifications
-
- A—HUMAN NECESSITIES
- A61—MEDICAL OR VETERINARY SCIENCE; HYGIENE
- A61B—DIAGNOSIS; SURGERY; IDENTIFICATION
- A61B5/00—Measuring for diagnostic purposes; Identification of persons
- A61B5/145—Measuring characteristics of blood in vivo, e.g. gas concentration, pH value; Measuring characteristics of body fluids or tissues, e.g. interstitial fluid, cerebral tissue
- A61B5/1455—Measuring characteristics of blood in vivo, e.g. gas concentration, pH value; Measuring characteristics of body fluids or tissues, e.g. interstitial fluid, cerebral tissue using optical sensors, e.g. spectral photometrical oximeters
- A61B5/1459—Measuring characteristics of blood in vivo, e.g. gas concentration, pH value; Measuring characteristics of body fluids or tissues, e.g. interstitial fluid, cerebral tissue using optical sensors, e.g. spectral photometrical oximeters invasive, e.g. introduced into the body by a catheter
-
- A—HUMAN NECESSITIES
- A61—MEDICAL OR VETERINARY SCIENCE; HYGIENE
- A61B—DIAGNOSIS; SURGERY; IDENTIFICATION
- A61B1/00—Instruments for performing medical examinations of the interior of cavities or tubes of the body by visual or photographical inspection, e.g. endoscopes; Illuminating arrangements therefor
- A61B1/00002—Operational features of endoscopes
- A61B1/00004—Operational features of endoscopes characterised by electronic signal processing
- A61B1/00009—Operational features of endoscopes characterised by electronic signal processing of image signals during a use of endoscope
- A61B1/000094—Operational features of endoscopes characterised by electronic signal processing of image signals during a use of endoscope extracting biological structures
-
- A—HUMAN NECESSITIES
- A61—MEDICAL OR VETERINARY SCIENCE; HYGIENE
- A61B—DIAGNOSIS; SURGERY; IDENTIFICATION
- A61B1/00—Instruments for performing medical examinations of the interior of cavities or tubes of the body by visual or photographical inspection, e.g. endoscopes; Illuminating arrangements therefor
- A61B1/00002—Operational features of endoscopes
- A61B1/00043—Operational features of endoscopes provided with output arrangements
- A61B1/00045—Display arrangement
- A61B1/0005—Display arrangement combining images e.g. side-by-side, superimposed or tiled
-
- A—HUMAN NECESSITIES
- A61—MEDICAL OR VETERINARY SCIENCE; HYGIENE
- A61B—DIAGNOSIS; SURGERY; IDENTIFICATION
- A61B1/00—Instruments for performing medical examinations of the interior of cavities or tubes of the body by visual or photographical inspection, e.g. endoscopes; Illuminating arrangements therefor
- A61B1/06—Instruments for performing medical examinations of the interior of cavities or tubes of the body by visual or photographical inspection, e.g. endoscopes; Illuminating arrangements therefor with illuminating arrangements
- A61B1/063—Instruments for performing medical examinations of the interior of cavities or tubes of the body by visual or photographical inspection, e.g. endoscopes; Illuminating arrangements therefor with illuminating arrangements for monochromatic or narrow-band illumination
-
- A—HUMAN NECESSITIES
- A61—MEDICAL OR VETERINARY SCIENCE; HYGIENE
- A61B—DIAGNOSIS; SURGERY; IDENTIFICATION
- A61B1/00—Instruments for performing medical examinations of the interior of cavities or tubes of the body by visual or photographical inspection, e.g. endoscopes; Illuminating arrangements therefor
- A61B1/06—Instruments for performing medical examinations of the interior of cavities or tubes of the body by visual or photographical inspection, e.g. endoscopes; Illuminating arrangements therefor with illuminating arrangements
- A61B1/0638—Instruments for performing medical examinations of the interior of cavities or tubes of the body by visual or photographical inspection, e.g. endoscopes; Illuminating arrangements therefor with illuminating arrangements providing two or more wavelengths
-
- A—HUMAN NECESSITIES
- A61—MEDICAL OR VETERINARY SCIENCE; HYGIENE
- A61B—DIAGNOSIS; SURGERY; IDENTIFICATION
- A61B1/00—Instruments for performing medical examinations of the interior of cavities or tubes of the body by visual or photographical inspection, e.g. endoscopes; Illuminating arrangements therefor
- A61B1/06—Instruments for performing medical examinations of the interior of cavities or tubes of the body by visual or photographical inspection, e.g. endoscopes; Illuminating arrangements therefor with illuminating arrangements
- A61B1/0646—Instruments for performing medical examinations of the interior of cavities or tubes of the body by visual or photographical inspection, e.g. endoscopes; Illuminating arrangements therefor with illuminating arrangements with illumination filters
-
- A—HUMAN NECESSITIES
- A61—MEDICAL OR VETERINARY SCIENCE; HYGIENE
- A61B—DIAGNOSIS; SURGERY; IDENTIFICATION
- A61B1/00—Instruments for performing medical examinations of the interior of cavities or tubes of the body by visual or photographical inspection, e.g. endoscopes; Illuminating arrangements therefor
- A61B1/06—Instruments for performing medical examinations of the interior of cavities or tubes of the body by visual or photographical inspection, e.g. endoscopes; Illuminating arrangements therefor with illuminating arrangements
- A61B1/0653—Instruments for performing medical examinations of the interior of cavities or tubes of the body by visual or photographical inspection, e.g. endoscopes; Illuminating arrangements therefor with illuminating arrangements with wavelength conversion
-
- A—HUMAN NECESSITIES
- A61—MEDICAL OR VETERINARY SCIENCE; HYGIENE
- A61B—DIAGNOSIS; SURGERY; IDENTIFICATION
- A61B1/00—Instruments for performing medical examinations of the interior of cavities or tubes of the body by visual or photographical inspection, e.g. endoscopes; Illuminating arrangements therefor
- A61B1/06—Instruments for performing medical examinations of the interior of cavities or tubes of the body by visual or photographical inspection, e.g. endoscopes; Illuminating arrangements therefor with illuminating arrangements
- A61B1/0655—Control therefor
-
- G—PHYSICS
- G06—COMPUTING; CALCULATING OR COUNTING
- G06T—IMAGE DATA PROCESSING OR GENERATION, IN GENERAL
- G06T7/00—Image analysis
- G06T7/0002—Inspection of images, e.g. flaw detection
- G06T7/0012—Biomedical image inspection
-
- G—PHYSICS
- G06—COMPUTING; CALCULATING OR COUNTING
- G06T—IMAGE DATA PROCESSING OR GENERATION, IN GENERAL
- G06T7/00—Image analysis
- G06T7/60—Analysis of geometric attributes
- G06T7/62—Analysis of geometric attributes of area, perimeter, diameter or volume
-
- A—HUMAN NECESSITIES
- A61—MEDICAL OR VETERINARY SCIENCE; HYGIENE
- A61B—DIAGNOSIS; SURGERY; IDENTIFICATION
- A61B1/00—Instruments for performing medical examinations of the interior of cavities or tubes of the body by visual or photographical inspection, e.g. endoscopes; Illuminating arrangements therefor
- A61B1/00163—Optical arrangements
- A61B1/00186—Optical arrangements with imaging filters
-
- A—HUMAN NECESSITIES
- A61—MEDICAL OR VETERINARY SCIENCE; HYGIENE
- A61B—DIAGNOSIS; SURGERY; IDENTIFICATION
- A61B1/00—Instruments for performing medical examinations of the interior of cavities or tubes of the body by visual or photographical inspection, e.g. endoscopes; Illuminating arrangements therefor
- A61B1/04—Instruments for performing medical examinations of the interior of cavities or tubes of the body by visual or photographical inspection, e.g. endoscopes; Illuminating arrangements therefor combined with photographic or television appliances
- A61B1/05—Instruments for performing medical examinations of the interior of cavities or tubes of the body by visual or photographical inspection, e.g. endoscopes; Illuminating arrangements therefor combined with photographic or television appliances characterised by the image sensor, e.g. camera, being in the distal end portion
-
- A—HUMAN NECESSITIES
- A61—MEDICAL OR VETERINARY SCIENCE; HYGIENE
- A61B—DIAGNOSIS; SURGERY; IDENTIFICATION
- A61B1/00—Instruments for performing medical examinations of the interior of cavities or tubes of the body by visual or photographical inspection, e.g. endoscopes; Illuminating arrangements therefor
- A61B1/06—Instruments for performing medical examinations of the interior of cavities or tubes of the body by visual or photographical inspection, e.g. endoscopes; Illuminating arrangements therefor with illuminating arrangements
- A61B1/0661—Endoscope light sources
- A61B1/0669—Endoscope light sources at proximal end of an endoscope
-
- A—HUMAN NECESSITIES
- A61—MEDICAL OR VETERINARY SCIENCE; HYGIENE
- A61B—DIAGNOSIS; SURGERY; IDENTIFICATION
- A61B1/00—Instruments for performing medical examinations of the interior of cavities or tubes of the body by visual or photographical inspection, e.g. endoscopes; Illuminating arrangements therefor
- A61B1/06—Instruments for performing medical examinations of the interior of cavities or tubes of the body by visual or photographical inspection, e.g. endoscopes; Illuminating arrangements therefor with illuminating arrangements
- A61B1/07—Instruments for performing medical examinations of the interior of cavities or tubes of the body by visual or photographical inspection, e.g. endoscopes; Illuminating arrangements therefor with illuminating arrangements using light-conductive means, e.g. optical fibres
-
- G—PHYSICS
- G06—COMPUTING; CALCULATING OR COUNTING
- G06T—IMAGE DATA PROCESSING OR GENERATION, IN GENERAL
- G06T2207/00—Indexing scheme for image analysis or image enhancement
- G06T2207/10—Image acquisition modality
- G06T2207/10024—Color image
-
- G—PHYSICS
- G06—COMPUTING; CALCULATING OR COUNTING
- G06T—IMAGE DATA PROCESSING OR GENERATION, IN GENERAL
- G06T2207/00—Indexing scheme for image analysis or image enhancement
- G06T2207/10—Image acquisition modality
- G06T2207/10068—Endoscopic image
-
- G—PHYSICS
- G06—COMPUTING; CALCULATING OR COUNTING
- G06T—IMAGE DATA PROCESSING OR GENERATION, IN GENERAL
- G06T2207/00—Indexing scheme for image analysis or image enhancement
- G06T2207/30—Subject of image; Context of image processing
- G06T2207/30004—Biomedical image processing
- G06T2207/30092—Stomach; Gastric
Definitions
- the present invention relates to an endoscope system for displaying information on oxygen saturation of hemoglobin in blood and information on blood volume, a processor apparatus of an endoscope system, and a method for generating images.
- functional information such as oxygen saturation of hemoglobin in blood and blood vessel depth is obtained from an image signal from an endoscope apparatus.
- the functional information is obtained based on light absorption property of blood vessels and scattering property of a living tissue.
- an image representing the functional information is generated.
- colors are assigned according to different oxygen saturation levels.
- a pseudo-color oxygen saturation image is generated based on the colors assigned.
- Such oxygen saturation image facilitates finding, for example, a cancer causing the oxygen saturation specifically low. Accordingly, diagnostic performance improves.
- an undifferentiated early gastric cancer causes blood density (the blood volume) in a tumor area extremely low compared with well-differentiated cancer.
- To find the undifferentiated early gastric cancer without fail it is desired to obtain information on the blood volume from the image signal, in addition to the information on the oxygen saturation.
- the Japanese Patent No. 2648494 is only capable of obtaining the oxygen saturation. Accordingly, it is difficult to find a lesion site such as the undifferentiated early gastric cancer characterized by both the oxygen saturation and the blood volume.
- An object of the present invention is to provide an endoscope system capable of displaying both information on blood volume and information on oxygen saturation, a processor apparatus of an endoscope system, and a method for generating images.
- the endoscope system of the present invention includes an illuminating section, an image signal obtaining section, a blood volume and oxygen saturation calculating section, a blood volume and oxygen saturation image generator, and a display section.
- the illuminating section projects illumination light to a portion to be observed.
- the portion includes a blood vessel.
- the image signal obtaining section obtains at least first and second image signals from reflection light reflected from the portion.
- the reflection light is in a wavelength range from 460 nm to 700 nm.
- the first image signal is obtained from first reflection light including a wavelength range in which an absorption coefficient varies in accordance with oxygen saturation of hemoglobin in blood.
- the second image signal is obtained from second reflection light including a wavelength range in which an absorption coefficient varies in accordance with blood volume.
- the blood volume and oxygen saturation calculating section obtains information on the blood volume and on the oxygen saturation based on the first and second image signals.
- the blood volume and oxygen saturation image generator generates a blood volume image and an oxygen saturation image.
- the blood volume image represents the information on the blood volume.
- the oxygen saturation image represents the information on the oxygen saturation.
- the display section displays the blood volume image and the oxygen saturation image simultaneously or selectively.
- the image signal obtaining section further obtains a third signal as a reference signal to the first and second image signals.
- the third signal is obtained from third reflection light including an arbitrary wavelength range in the wavelength range from 460 nm to 700 nm.
- the blood volume and oxygen saturation image generator has a first color table for blood volume and a second color table for oxygen saturation.
- the first color table stores pseudo color information varying in accordance with the blood volume.
- the second color table stores pseudo color information varying in accordance with the oxygen saturation.
- the images of the blood vessel are generated in pseudo color using the first and second color tables.
- one of the first and second color tables varies in chroma and the other varies in hue.
- the blood volume and oxygen saturation obtaining section includes a signal ratio calculator, correlation storage, and a calculator.
- the signal ratio calculator obtains a first signal ratio and a second signal ratio based on the first to third image signals.
- the first signal ratio depends on the blood volume.
- the second signal ratio depends on both the blood volume and the oxygen saturation.
- the correlation storage stores a first correlation between the blood volume and the first signal ratio and a second correlation between the oxygen saturation and the first and second signal ratios.
- the calculator obtains the information on the blood volume from the first correlation and the information on the oxygen saturation from the second correlation.
- the blood volume corresponds to the first signal ratio.
- the oxygen saturation corresponds to the second signal ratio.
- the image signal obtaining section has a color image sensor provided with R, G, and B color filters on its imaging surface.
- the illuminating section projects light, having a wavelength range in which the absorption coefficient varies in accordance with a change in the oxygen saturation of hemoglobin in blood, as the illumination light to the portion to obtain the first image signal.
- the illuminating section projects white light as the illumination light to obtain the second and third image signals.
- the white light is pseudo white light generated by applying excitation light having a predetermined wavelength to a phosphor.
- the illuminating section projects white light as the illumination light to the portion to obtain the first to third image signals.
- the white light is pseudo white light generated by applying excitation light having a predetermined wavelength to a phosphor.
- the illuminating section successively projects light in a wavelength range from 460 nm to 480 nm, light in a wavelength range from 540 nm to 580 nm, and light in a wavelength range from 590 nm to 700 nm as the illumination light.
- the light in each of the wavelength ranges is generated by filtering white light with a narrowband filter.
- the illuminating section simultaneously projects light in a wavelength range from 460 nm to 480 nm and light in a wavelength range from 540 nm to 700 nm as the illumination light.
- the illuminating section successively projects light in a wavelength range from 530 nm to 550 nm, light in a wavelength range from 555 nm to 565 nm, and light in a wavelength range from 590 nm to 700 nm as the illumination light.
- the light in each of the wavelength ranges is generated by filtering white light with a narrowband filter.
- a processor apparatus used with an endoscope includes a receiving section, a blood volume and oxygen saturation calculating section, and a blood volume and oxygen saturation image generator.
- the receiving section receives the first and second image signals from the endoscope.
- the blood volume and oxygen saturation calculating section obtains information on the blood volume and on the oxygen saturation based on the first and second image signals.
- the blood volume and oxygen saturation image generator generates a blood volume image and an oxygen saturation image.
- the blood volume image represents the information on the blood volume.
- the oxygen saturation image represents the information on the oxygen saturation.
- a method for generating images comprising a projecting step, an image signal obtaining step, an information obtaining step, and a generating step.
- illumination light is projected to a portion to be observed.
- the portion includes a blood vessel.
- image signal obtaining step at least first and second image signals are obtained from reflection light reflected from the portion.
- the reflection light is in a wavelength range from 460 nm to 700 nm.
- the first image signal is obtained from first reflection light including a wavelength range in which an absorption coefficient varies in accordance with oxygen saturation of hemoglobin in blood.
- the second image signal is obtained from second reflection light including a wavelength range in which an absorption coefficient varies in accordance with blood volume.
- the information obtaining step information on the blood volume and on the oxygen saturation is obtained based on the first and second image signals.
- the generating step a blood volume image and an oxygen saturation image are generated.
- the blood volume image represents the information on the blood volume.
- the oxygen saturation image represents the information on the oxygen saturation.
- the blood volume image representing the information on the blood volume and the oxygen saturation image representing the information on the oxygen saturation can be displayed. Thereby, it becomes easy to find a lesion site.
- an endoscope system 10 of a first embodiment is provided with a light source apparatus 11, an endoscope apparatus 12, a processor apparatus 13, a display device 14, and an input device 15.
- the light source apparatus 11 generates light in a predetermined wavelength range.
- the endoscope apparatus 12 guides the light from the light source apparatus 11 and applies the light as illumination light to a portion to be observed (hereinafter referred to as the target portion) of a subject.
- the endoscope apparatus 12 captures an image of the light reflected from the target portion and the like.
- the processor apparatus 13 performs image processing to an image signal obtained with the endoscope apparatus 12.
- the display device 14 displays an endoscopic image and the like from the processor apparatus 13.
- the input device 15 includes a keyboard, for example.
- the endoscope system 10 has two observation modes: a normal light mode and a functional information mode.
- a normal light mode a normal light image is displayed on the display device 14.
- the normal light image is a subject image of visible light in a wavelength range from blue to red.
- an oxygen saturation image and a blood volume image are displayed on the display device 14.
- the oxygen saturation image is a pseudo color image showing information on oxygen saturation of hemoglobin in blood in blood vessel (s) included in the target portion.
- the blood volume image is a pseudo color image showing information on blood volume in blood vessel(s) included in the target portion.
- the observation mode is switched as necessary based on a command inputted from a selection switch 17 of the endoscope apparatus 12 or the input device 15, for example.
- the light source apparatus 11 is provided with two kinds of laser light sources LD1 and LD2, a light source controller 20, a combiner 21, and a splitter 22.
- the laser light source LD1 generates narrowband light beams (oxygen saturation measuring beams) used for measuring the oxygen saturation.
- the laser light source LD2 applies excitation light beams to a phosphor 50, placed at a front end of the endoscope apparatus 12, to generate white light (pseudo white light).
- the light beams from the laser light source LD1 are incident on an optical fiber 24 through a condenser lens (not shown).
- the light beams from the laser light source LD2 are incident on an optical fiber 25 through a condenser lens (not shown).
- a broad area InGaN laser diode, an InGaNAs laser diode, or a GaNAs laser diode can be used, for example.
- the light source controller 20 controls the laser light sources LD1 and LD2 to adjust emission timing of each of the laser light sources LD1 and LD2 and a light quantity ratio between the laser light sources LD1 and LD2.
- the laser light source LD1 in the normal light mode, the laser light source LD1 is turned off and the laser light source LD2 is turned on.
- the laser light sources LD1 and the LD2 are turned on alternately at predetermined time intervals.
- the combiner 21 combines the light beams from the optical fiber 24 and the light beams from the optical fiber 25.
- the splitter 22 splits the combined light beams into four paths. Out of the four paths of light beams, the light beams from the laser light source LD1 are transmitted through light guides 26 and 27.
- the light beams from the laser light source LD2 are transmitted through light guides 28 and 29.
- Each of the light guides 26 to 29 is composed of a bundle fiber that is a plurality of optical fibers bundled together. Note that the light beams from the laser light sources LD1 and LD2 may be directly incident on the light guides 26 to 29 without using the combiner 21 and the splitter 22.
- the endoscope apparatus 12 is composed of an electronic endoscope and is provided with a scope 32, an illuminating section 33, an imaging section 34, an operation section 35, and a connector section 36.
- the illuminating section 33 applies the four paths of light beams transmitted through the respective light guides 26 to 29 to the target portion.
- the imaging section 34 captures an image of the target portion.
- the operation section 35 is used for bending an end portion of the scope 32 and for performing operation for observation.
- the connector section 36 connects the scope 32, the light source apparatus 11, and the processor apparatus 13 in a detachable manner.
- the scope 32 is provided with a flexible portion 38, a bending portion 39, and a distal portion 40 in this order from the operation section 35 side.
- the flexible portion 38 is flexible inside the subject when the scope 32 is inserted into the subject.
- the bending portion 39 is bent by rotating an angle knob 35a disposed in the operation section 35.
- the bending portion 39 can be bent at any angle in a vertical or horizontal direction to direct the distal portion 40 to the target portion.
- the distal portion 40 is provided with the illuminating section 33 and the imaging section 34.
- the imaging section 34 is provided with a capture window 42 substantially at the center of the distal portion 40.
- the capture window 42 passes the light reflected from the target portion and the like.
- the illuminating section 33 includes two illumination windows 43 and 44 provided on respective sides of the imaging section 34. Each of the illumination windows 43 and 44 projects two types of light, the oxygen saturation measuring beams and the white light, to the target portion.
- Two projection units 46 and 47 are disposed behind the illumination window 43.
- the projection unit 46 projects the oxygen saturation measuring beams from the light guide 26 to the target portion through a lens 48.
- the projection unit 47 applies the excitation light beams from the light guide 28 to the phosphor 50 to project white light.
- the white light is projected to the target portion through a lens 51.
- projection units 53 and 54 are disposed behind the illumination window 44.
- the projection unit 53 is similar to the projection unit 46.
- the projection unit 54 is similar to the projection unit 47.
- the capture window 42 is disposed between the illumination windows 43 and 44.
- the four projection units 46, 47, 53, and 54 are arranged such that long and short dashed lines L1 between the output surfaces of the projection units 47 and 54 and long and short dashed lines L2 between the output surfaces of the projection units 46 and 53 cross each other at a center portion of the capture window 42. This arrangement prevents unevenness in illumination.
- Each of the projection units 47 and 54 is provided with the phosphor 50.
- the projection units 46 and 53 are not provided with the phosphor 50.
- the plate-like phosphor 50 includes several kinds of fluorescent substances, for example, YAG fluorescent substances or BAM (BaMgAl 10 O 17 ). These fluorescent substances absorb a part of the excitation light beams from the laser light source LD2 to emit green to yellow light (fluorescence). When the excitation light is applied to the phosphor 50, the green to yellow fluorescence emitted from the phosphor 50 and the excitation light, passed through the phosphor 50 without being absorbed, are combined to generate the white light (pseudo white light).
- the phosphor may be referred to as Micro White (registered trademark) .
- the white light emitted from each of the projection units 47 and 54 (each having the phosphor 50) has an emission spectrum including a wavelength range of the excitation light having the center wavelength of 445 nm and a wavelength range approximately from 450 nm to 700 nm in which emission intensity of the fluorescence generated by the excitation light increases.
- the oxygen saturation measuring beams emitted from each of the projection units 46 and 53 (neither having the phosphor 50) has an emission spectrum in a wavelength range around the center wavelength of 473 nm.
- the white light of the present invention does not necessarily include all wavelength components of the visible light. Like the above pseudo white light, the white light only needs to include light in a specific wavelength range, for example, light of a primary color, R(red), G(green), or B (blue) . In other words, the white light may include light having the wavelength components from green to red or light having the wavelength components from blue to green, for example.
- An objective lens unit (not shown) is provided behind the capture window 42.
- the objective lens unit takes in light (image light) reflected from the target portion of the subject.
- An image sensor 60 is provided behind the objective lens unit.
- the image sensor 60 is a CCD (charge coupled device) or a CMOS (complementary metal-oxide semiconductor), for example.
- the image sensor 60 receives the image light of the target portion to generate an image thereof.
- a light receiving surface (imaging surface) of the image sensor 60 receives the light from objective lens unit. Then the image sensor 60 photoelectrically converts the light to output an imaging signal (analog signal).
- the image sensor 60 is a color CCD.
- On the light receiving surface three kinds of pixels, R pixels each provided with a red color filter, G pixels each provided with a green color filter, and B pixels each provided with a blue color filter are arranged in a matrix with a predetermined pattern.
- the blue color filter has spectral characteristic 63.
- the green color filter has spectral characteristic 64.
- the red color filter has spectral characteristic 65. Accordingly, out of the light reflected from the target portion, the white light passes through all of the red, green, and blue color filters. Thereby, a color signal is outputted from each of the R, G, and B pixels of the image sensor 60.
- the B pixel mainly outputs the color signal.
- a three-color signal being the imaging signal (analog signal) outputted from the image sensor 60, is inputted to an A/D converter 68 through a scope cable 67.
- the A/D converter 68 converts the imaging signal into an image signal (digital signal) corresponding to a voltage level of the imaging signal. After the conversion, the image signal is inputted to an image processor 73 of the processor apparatus 13 through the connector section 36.
- An imaging controller 70 controls imaging of the image sensor 60.
- two steps, an accumulation step and a read-out step are performed in a single frame period.
- the accumulation step electric charge obtained by the photoelectric conversion of the white light (445 nm + phosphor) is accumulated.
- the white light (445 nm + phosphor) denotes that the white light is generated by applying the excitation light at 445 nm to the phosphor 50.
- the read-out step the electric charge accumulated is read out.
- the accumulation step and the read-out step are repeated alternately in the normal light mode.
- the functional information mode as shown in Fig. 6B for the first frame, two steps, an accumulation step and a read-out step are performed in a single frame period.
- the accumulation step the electric charge obtained by photoelectric conversion of the oxygen saturation measuring beams (the narrowband light at 473 nm) is accumulated.
- the read-out step the electric charge accumulated is read out.
- the second frame two steps, an accumulation step and a read-out step are performed.
- the electric charge obtained by photoelectric conversion of the white light (445 nm + Micro White) is accumulated.
- the read-out step the electric charge accumulated is read out. This imaging control using two frames is repeated in the functional information mode.
- the image signal of the first frame is composed of a blue signal (B signal) B1 from the B pixel of the image sensor 60, a green signal (G signal) G1 from the G pixel of the image sensor 60, and a red signal (R signal) R1 from the R pixel of the image sensor 60.
- the image signal of the second frame is the same as the normal light image signal.
- the image signal of the second frame is composed of a B signal B2 from the B pixel, a G signal G2 from the G pixel, and an R signal R2 from the R pixel.
- the channels include, for example, an air/water channel and a forceps channel through which a sample collecting device or the like is inserted.
- the processor apparatus 13 is provided with a controller 72, the image processor 73, and storage 74.
- the controller 72 is connected to the display device 14 and the input device 15.
- the controller 72 controls operations of the image processor 73, the light source controller 20 of the light source apparatus 11, the imaging controller 70 of the endoscope apparatus 12, and the display device 14, according to a command instructing the observation mode and the like.
- the command is issued from the selection switch 17 or the input device 15 of the endoscope apparatus 12.
- the image processor 73 is provided with a normal light image processing section 80 and a functional image processing section (blood volume and oxygen saturation calculating section) 82.
- the image processor 73 performs predetermined image processing to the image signal from the endoscope apparatus 12.
- the normal light image processing section 80 performs predetermined image processing to the image signal to generate a normal light image.
- the functional image processing section 82 calculates information on the blood volume and on the oxygen saturation of hemoglobin in blood of the target portion based on the image signal inputted from the endoscope apparatus 12.
- the functional image processing section 82 generates a blood volume image showing the blood volume in pseudo color and an oxygen saturation image showing the oxygen saturation in pseudo color.
- the functional image processing section 82 is provided with a signal ratio calculator 84, correlation storage 85, a blood volume and an oxygen saturation calculator 86, a blood volume image generator 87, and an oxygen saturation image generator 88.
- the signal ratio calculator 84 calculates a signal ratio between the image signal of the first frame and the image signal of the second frame obtained in the functional information mode, relative to picture elements located at the same positions or coordinates in the first and second frames. The signal ratio is calculated for every picture element in the image signal. In this embodiment, the signal ratio calculator 84 calculates a signal ratio B1/G2 between the B signal B1 of the first frame and the G signal G2 of the second frame, and a signal ratio R2/G2 between the R signal R2 of the second frame and the G signal G2 of the second frame.
- the signal ratios may be calculated only for the picture elements in vascular portions of the image signals. In this case, the vascular portion is determined based on a difference between an image signal of the vascular portion and an image signal of a portion other than the vascular portion.
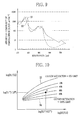
- the correlation storage 85 stores a correlation between the signal ratio R2/G2 and the blood volume, and a correlation between the oxygen saturation and the signal ratios B1/G2 and R2/G2. As shown in Fig. 7 , the correlation between the signal ratio and the blood volume is stored in a one-dimensional table. The correlation is defined or determined such that the signal ratio R2/G2 increases with the blood volume. The signal ratio R2/G2 is stored in log scale.
- the correlation between the signal ratios and the oxygen saturation is stored in a two dimensional table.
- the two dimensional table defines contour lines of the oxygen saturation on a two dimensional space.
- the positions and shapes of the contour lines are obtained by physical simulation of light scattering, and vary according to the blood volume. For example, a space between the contour lines increases or decreases when there is a change in the blood volume.
- the signal ratios B1/G2 and R2/G2 are stored in log scale.
- a characteristic line 90 shows an absorption coefficient of oxyhemoglobin.
- a characteristic line 91 shows an absorption coefficient of deoxyhemoglobin.
- the B signal including a signal of the light at 473nm is highly dependent on both the oxygen saturation and the blood volume.
- the signal ratios B1/G2 and R2/G2 are used in addition to the B signal B1.
- the signal ratios B1/G2 and R2/G2 are obtained from the B signal B1, the R signal R2, and the G signal G2.
- the R signal R2 corresponds to the light which varies depending mainly on the blood volume.
- the G signal G2 is a reference signal for the B signal B1 and the R signal R2.
- the blood volume and the oxygen saturation calculator 86 obtains both the blood volume and the oxygen saturation in each picture element using the correlations stored in the correlation storage 85 and the signal ratios B1/G2 and R2/G2 obtained by the signal ratio calculator 84.
- the blood volume is a value corresponding to the signal ratio R2/G2 obtained by the signal ratio calculator 84.
- a point P corresponding to the signal ratios B1*/G2* and R2*/G2*, obtained by the signal ratio calculator 84 is determined in the two-dimensional space.
- the percentage of the oxygen saturation is the percentage expressed by the contour line where the point P is positioned.
- the point P is positioned on the contour line of "60%", so the percentage of the oxygen saturation is 60%.
- the oxygen saturation is determined to be 0%.
- the oxygen saturation is determined to be 100%. Note that when the point P is positioned outside of a range between the lower limit line 93 and the upper limit line 94, the reliability of the oxygen saturation in the picture element may be reduced so as not to display the oxygen saturation.
- the blood volume image generator 87 generates a blood volume image showing the blood volume, calculated by the blood volume and the oxygen saturation calculator 86, in pseudo-color.
- the blood volume image is composed of a video signal.
- the video signal includes luminance Y and color difference signals Cb and Cr.
- the G signal G2 of the normal light image signal is assigned to the luminance Y.
- the G signal G2 corresponds to the reflected light in a wavelength range in which the light absorption by the hemoglobin is rather large. Accordingly, the image generated based on the G signal G2 allows visible observation of blood vessels and surface unevenness of mucosa, for example.
- overall brightness of the pseudo color image is defined or determined.
- a color table 87a signal values corresponding to the blood volume are assigned to the color difference signals Cb and Cr, respectively.
- the signal value of the color difference signal Cb decreases as the blood volume increases.
- the signal value of the color difference signal Cr increases as the blood volume increases. Accordingly, redness of the blood volume image increases as the blood volume increases. The redness decreases in chroma and becomes closer to monochromatic as the blood volume decreases.
- the oxygen saturation image generator 88 generates the oxygen saturation image showing the oxygen saturation, obtained by the blood volume and the oxygen saturation calculator 86, in pseudo color.
- the oxygen saturation image is composed of a video signal.
- the video signal includes luminance Y and color difference signals Cb and Cr.
- the G signal G2 of the normal light image signal is assigned to the luminance Y.
- signal values corresponding to the oxygen saturation are assigned to the color difference signals Cb and Cr, respectively.
- a signal value of the color difference signal Cr is defined to be positive, while a signal value of the color difference signal Cb is defined to be negative.
- the signal value of the color difference signal Cr is defined to be negative, while the signal value of the color difference signal Cb is defined to be positive.
- the oxygen saturation is at a medium level, a relationship in magnitude between the signal value of the color difference signal Cr and the signal value of the color difference signal Cb reverses. So, as the oxygen saturation increases, the hue or color of the oxygen saturation image changes from blue to light blue to green to yellow to orange to red.
- the blood volume image and the oxygen saturation image generated are displayed on the display device 14.
- the oxygen saturation image and the blood volume image may be displayed side by side simultaneously after their sizes are reduced.
- a user may operate an image selecting means (not shown) provided in the input device 15 to select one of the oxygen saturation image and the blood volume image.
- the image selected is displayed on the display device 14.
- the narrowband oxygen saturation measuring beams at the center wavelength of 473 nm are applied from the distal portion 40 to the target portion of the subject.
- the light reflected from the target portion is captured by the image sensor 60.
- the image sensor 60 is a color CCD composed of B pixels, G pixels, and R pixels. Thereby, an image signal of a first frame is obtained.
- the image signal of the first frame is composed of a B signal B1, a G signal G1, and a R signal R1.
- the white light generated by the excitation light at the center wavelength of 445 nm, is applied to the target portion of the subject through the distal portion 40.
- the image sensor 60 captures the light reflected from the target portion and the like. Thereby, an image signal (the normal light image signal) of a second frame is obtained.
- the image signal of the second frame is composed of a B signal B2, a G signal G2, and a R signal R2.
- the signal ratio calculator 84 obtains the signal ratios B1/G2 and R2/G2 between the image signal of the first frame and the image signal of the second frame, relative to the picture elements located at the same positions or coordinates in the first and second frames. The signal ratios are obtained for every picture element. Thereafter, based on the correlations stored in the correlation storage 85, the blood volume and the oxygen saturation calculator 86 obtains the blood volume corresponding to the signal ratio R2/G2 calculated by the signal ratio calculator 84. The blood volume and the oxygen saturation calculator 86 also obtains the oxygen saturation corresponding to the signal ratios B1/G2 and R2/G2 calculated by the signal ratio calculator 84. The blood volume and the oxygen saturation are obtained for every picture element.
- the color table 87a in the blood volume image generator 87 is referred to.
- the color difference signals Cb and Cr corresponding to the blood volume are obtained.
- the blood volume image is generated based on the color difference signals Cb and Cr and the luminance Y.
- the G signal G2 of the normal light image signal is assigned to the luminance Y.
- the blood volume image shows the blood vessels in pseudo color in accordance with their blood volumes.
- the oxygen saturation image is generated.
- the oxygen saturation image shows the blood vessels in pseudo color in accordance with their oxygen saturations.
- the blood volume image and the oxygen saturation image are displayed on the display device 14.
- the blood volume and the oxygen saturation are calculated using two frames of image signals.
- the image signal of the first frame is obtained by applying the narrowband light having the center wavelength of 473 nm.
- the image signal of the second frame is obtained by applying the white light.
- the white light is emitted from the phosphor being excited by the excitation light having the center wavelength of 445 nm.
- the white light may be generated by applying the excitation light having the center wavelength of 473 nm, emitted from the laser light source LD1, to the phosphor 50.
- the blood volume and the oxygen saturation can be obtained from an image signal of a single frame captured while the white light is applied to the target portion of the subject.
- an endoscope system 100 shown in Fig. 17 applies two paths of light beams from the respective projection units 47 and 54.
- the B signal B includes a signal corresponding to the excitation light having the center wavelength of 473 nm and a signal corresponding to a small amount of light out of the light from the phosphor being excited by the excitation light.
- the G signal G includes a signal corresponding to spectral illumination in a wavelength range mainly from 540 nm to 580 nm out of the light from the phosphor being excited.
- the R signal R includes a signal corresponding to spectral illumination in a wavelength range from 590 nm to 700 nm out of the light from the phosphor being excited and a signal corresponding to a small amount of the excitation light.
- the signal ratio used for the calculation of the blood volume is R/G.
- the signal ratios used for the calculation of the oxygen saturation are B/G and R/G.
- the signal ratio R/G corresponds to the signal ratio R2/G2.
- the signal ratio B/G corresponds to the signal ratio B1/G2.
- an endoscope system 120 of a second embodiment uses the light source apparatus 11 of a rotating-filter type.
- the endoscope system 120 is provided with a broadband light source 121, a rotating filter 122, an optical fiber 123, and a rotation controller 124.
- the broadband light source 121 is a xenon light source, for example, and emits white light having spectral intensity shown in Fig. 19 .
- the rotating filter 122 allows the whole of the white light or a wavelength component of the oxygen saturation measuring beams out of the white light to pass therethrough.
- the light passed through the rotating filter 122 is incident on the optical fiber 123.
- the rotation controller 124 controls the rotation of the rotating filter 122.
- the light incident on the optical fiber 123 is split into two paths of light beams by the splitter 22.
- One of the two paths of light beams is applied from the projection unit 46 to the target portion of the subject through the light guide 26.
- the other path of the light beams is applied from the projection unit 53 to the target portion of the subject through the light guide 27.
- Remaining reference numerals denote parts similar to those in the endoscope system 10, so descriptions thereof are omitted.
- the rotating filter 122 is provided with a bandpass filter 125 and an opening 126.
- the bandpass filter 125 allows the oxygen saturation measuring beams (see Fig. 4 ) in the wavelength range from 460 nm to 480 nm to pass therethrough.
- the opening 126 allows the whole of white light to pass therethrough.
- the B signal B2 of the normal light image signal includes a signal of the light in the wavelength range from 400 nm to 530 nm.
- the G signal G2 includes a signal of the light in the wavelength range from 540 nm to 580 nm.
- the R signal R2 includes a signal of the light in the wavelength range from 590 nm to 700 nm.
- a rotating filter 130 shown in Fig. 21 may be used instead of the rotating filter 122 shown in Fig. 20 .
- the rotating filter 130 is provided with first to third transmitting sections 131 to 133.
- the first transmitting section 131 allows first light beams to pass therethrough.
- the first light beams are in a wavelength range from 460 nm to 480 nm.
- the second transmitting section 132 allows second light beams to pass therethrough.
- the second light beams are in a wavelength range from 540 nm to 580 nm.
- the third transmitting section 133 allows third light beams to pass therethrough.
- the third light beams are in a wavelength range from 590 nm to 700 nm.
- the monochrome image sensor 60 When the rotating filter 130 is used, the monochrome image sensor 60 is used.
- the monochrome image sensor 60 captures an image every time the light beams, passed through the rotating filter 130, are applied.
- three frames of image signals are obtained, respectively.
- an image signal obtained when the first light beams are applied is defined as the B signal B.
- An image signal obtained when the second light beams are applied is defined as the G signal G.
- An image signal obtained when the third light beams are applied is defined as the R signal R.
- the signal ratio used for the calculation of the blood volume is R/G.
- the signal ratios used for the calculation of the oxygen saturation are B/G and R/G.
- the signal ratio R/G corresponds to the signal ratio R2/G2 of the first embodiment.
- the signal ratio B/G corresponds to the signal ratio B1/G2 of the first embodiment.
- the method for calculating the blood volume and the oxygen saturation is similar to that of the first embodiment, so descriptions thereof are omitted.
- the G signal G is assigned to the luminance.
- a rotating filter 150 shown in Fig. 22 may be used instead of the rotating filter 130 shown in Fig. 21 .
- the rotating filter 150 is provided with first to third transmitting sections 151 to 153.
- the first transmitting section 151 of the rotating filter 150 allows first light beams to pass therethrough.
- the first light beams are in a wavelength range from 530 nm to 550 nm.
- the second transmitting section 152 allows second light beams to pass therethrough.
- the second light beams are in a wavelength range from 555 nm to 565 nm.
- the third transmitting section 153 allows third light beams to pass therethrough.
- the third light beams are in a wavelength range from 590 nm to 700 nm.
- the color image sensor 60 captures an image every time first, second, or third light beams are applied.
- the first and second light beams are detected mainly by the G pixel of the image sensor 60. Accordingly, when the first and second light beams are applied, the G signals Ga and Gb are obtained as the image signals, respectively.
- the third light beams are detected mainly by the R pixel of the image sensor 60. Thereby, the R signal Rc is obtained as the image signal.
- the image signals Ga and Rc are obtained from reflected light beams in the two respective wavelength ranges in each of which the absorption coefficient varies in accordance with a change in the oxygen saturation of hemoglobin in blood.
- the image signal Gb is obtained from the reflected light in a wavelength range in which the absorption coefficient is unchanged. Accordingly, the signal ratio Ga/Gb varies depending on the oxygen saturation and the blood volume. The signal ratio Rc/Gb varies depending mainly on the blood volume.
- the signal ratio Rc/Gb is used for calculating the blood volume.
- the signal ratios Ga/Gb and Rc/Gb are used for calculating the oxygen saturation.
- the signal ratio Rc/Gb corresponds to the signal ratio R2/G2 of the first embodiment.
- the signal ratio Ga/Gb corresponds to the signal ratio B1/G2 of the first embodiment.
- the method for calculating the blood volume and the oxygen saturation is similar to that in the first embodiment, so descriptions thereof are omitted.
- the G signal Ga or Gb is assigned to the luminance.
- an endoscope system 200 of a third embodiment uses a half prism 201, a reflection prism 202, and narrowband filters 203 and 204 to generate the light beams used for calculating the blood volume and the oxygen saturation.
- Remaining reference numerals denote parts similar to those of the endoscope system 120 in the second embodiment.
- the half prism 201 splits the white light, emitted from the broadband light source 121, into two paths of light beams.
- One of the two paths of the light beams is incident on the narrowband filter 203.
- the other path of the light beams is reflected by the reflection prism 202 and then incident on the narrowband filter 204.
- the narrowband filter 203 allows the light beams in a wavelength range from 460 nm to 480 nm to pass therethrough.
- the narrowband filter 204 allows the light beams in a wavelength range from 540 nm to 700 nm to pass therethrough.
- the light beams passed through the narrowband filter 203 are applied to the target portion of the subject through a lens 203a and the light guide 26.
- the light beams passed through the narrowband filter 204 are applied to the target portion of the subject through a lens 204a and the light guide 27.
- the light beams passed through the narrowband filters 203 and 204 are applied simultaneously to the target portion of the subject.
- the color image sensor 60 is used in the similar manner to the first embodiment. Accordingly, in the image signal obtained by the image capture, the B signal B includes a signal corresponding to the light beams in the wavelength range from 460 nm to 480 nm.
- the G signal G includes a signal corresponding to the light beams in the wavelength range from 540 nm to 580 nm.
- the R signal R includes a signal corresponding to the light beams in the wavelength range from 590 nm to 700 nm.
- the signal ratio R/G is used for calculating the blood volume.
- the signal ratios B/G and R/G are used for calculating the oxygen saturation.
- the signal ratio R/G corresponds to the signal ratio R2/G2 of the first embodiment.
- the signal ratio B/G corresponds to the signal ratio B1/G2 of the first embodiment.
- a method for calculating the blood volume and the oxygen saturation is similar to that of the first embodiment, so descriptions thereof are omitted.
- the G signal G is assigned to the luminance.
- the information on the blood volume and on the oxygen saturation is expressed in pseudo color.
- the information on the blood volume and on the oxygen saturation may be expressed in monochrome gradation.
Abstract
Description
- The present invention relates to an endoscope system for displaying information on oxygen saturation of hemoglobin in blood and information on blood volume, a processor apparatus of an endoscope system, and a method for generating images.
- Recently, diagnoses using an endoscope have been performed commonly. In addition to normal observation of a portion of a subject using an endoscope apparatus with illumination of broadband light (white light), special observation using illumination of narrowband light has come into practice. By using the narrowband light, blood vessels in the portion being observed are highlighted in display.
- Furthermore, functional information such as oxygen saturation of hemoglobin in blood and blood vessel depth is obtained from an image signal from an endoscope apparatus. The functional information is obtained based on light absorption property of blood vessels and scattering property of a living tissue. Then, an image representing the functional information is generated. For example, in Japanese Patent No.
2648494 - Out of cancers causing a low-oxygen or hypoxic condition, an undifferentiated early gastric cancer causes blood density (the blood volume) in a tumor area extremely low compared with well-differentiated cancer. To find the undifferentiated early gastric cancer without fail, it is desired to obtain information on the blood volume from the image signal, in addition to the information on the oxygen saturation. The Japanese Patent No.
2648494 - An object of the present invention is to provide an endoscope system capable of displaying both information on blood volume and information on oxygen saturation, a processor apparatus of an endoscope system, and a method for generating images.
- To achieve the above and other objects, the endoscope system of the present invention includes an illuminating section, an image signal obtaining section, a blood volume and oxygen saturation calculating section, a blood volume and oxygen saturation image generator, and a display section. The illuminating section projects illumination light to a portion to be observed. The portion includes a blood vessel. The image signal obtaining section obtains at least first and second image signals from reflection light reflected from the portion. The reflection light is in a wavelength range from 460 nm to 700 nm. The first image signal is obtained from first reflection light including a wavelength range in which an absorption coefficient varies in accordance with oxygen saturation of hemoglobin in blood. The second image signal is obtained from second reflection light including a wavelength range in which an absorption coefficient varies in accordance with blood volume. The blood volume and oxygen saturation calculating section obtains information on the blood volume and on the oxygen saturation based on the first and second image signals. The blood volume and oxygen saturation image generator generates a blood volume image and an oxygen saturation image. The blood volume image represents the information on the blood volume. The oxygen saturation image represents the information on the oxygen saturation. The display section displays the blood volume image and the oxygen saturation image simultaneously or selectively.
- It is preferable that the image signal obtaining section further obtains a third signal as a reference signal to the first and second image signals. The third signal is obtained from third reflection light including an arbitrary wavelength range in the wavelength range from 460 nm to 700 nm.
- It is preferable that the blood volume and oxygen saturation image generator has a first color table for blood volume and a second color table for oxygen saturation. The first color table stores pseudo color information varying in accordance with the blood volume. The second color table stores pseudo color information varying in accordance with the oxygen saturation. The images of the blood vessel are generated in pseudo color using the first and second color tables.
- It is preferable that one of the first and second color tables varies in chroma and the other varies in hue.
- It is preferable that the blood volume and oxygen saturation obtaining section includes a signal ratio calculator, correlation storage, and a calculator. The signal ratio calculator obtains a first signal ratio and a second signal ratio based on the first to third image signals. The first signal ratio depends on the blood volume. The second signal ratio depends on both the blood volume and the oxygen saturation. The correlation storage stores a first correlation between the blood volume and the first signal ratio and a second correlation between the oxygen saturation and the first and second signal ratios. The calculator obtains the information on the blood volume from the first correlation and the information on the oxygen saturation from the second correlation. The blood volume corresponds to the first signal ratio. The oxygen saturation corresponds to the second signal ratio.
- It is preferable that the image signal obtaining section has a color image sensor provided with R, G, and B color filters on its imaging surface.
- It is preferable that the illuminating section projects light, having a wavelength range in which the absorption coefficient varies in accordance with a change in the oxygen saturation of hemoglobin in blood, as the illumination light to the portion to obtain the first image signal. The illuminating section projects white light as the illumination light to obtain the second and third image signals.
- It is preferable that the white light is pseudo white light generated by applying excitation light having a predetermined wavelength to a phosphor.
- It is preferable that the illuminating section projects white light as the illumination light to the portion to obtain the first to third image signals.
- It is preferable that the white light is pseudo white light generated by applying excitation light having a predetermined wavelength to a phosphor.
- It is preferable that the illuminating section successively projects light in a wavelength range from 460 nm to 480 nm, light in a wavelength range from 540 nm to 580 nm, and light in a wavelength range from 590 nm to 700 nm as the illumination light.
- It is preferable that the light in each of the wavelength ranges is generated by filtering white light with a narrowband filter.
- It is preferable that the illuminating section simultaneously projects light in a wavelength range from 460 nm to 480 nm and light in a wavelength range from 540 nm to 700 nm as the illumination light.
- It is preferable that the illuminating section successively projects light in a wavelength range from 530 nm to 550 nm, light in a wavelength range from 555 nm to 565 nm, and light in a wavelength range from 590 nm to 700 nm as the illumination light.
- It is preferable that the light in each of the wavelength ranges is generated by filtering white light with a narrowband filter.
- A processor apparatus used with an endoscope includes a receiving section, a blood volume and oxygen saturation calculating section, and a blood volume and oxygen saturation image generator. The receiving section receives the first and second image signals from the endoscope. The blood volume and oxygen saturation calculating section obtains information on the blood volume and on the oxygen saturation based on the first and second image signals. The blood volume and oxygen saturation image generator generates a blood volume image and an oxygen saturation image. The blood volume image represents the information on the blood volume. The oxygen saturation image represents the information on the oxygen saturation.
- A method for generating images comprising a projecting step, an image signal obtaining step, an information obtaining step, and a generating step. In the projecting step, illumination light is projected to a portion to be observed. The portion includes a blood vessel. In the image signal obtaining step, at least first and second image signals are obtained from reflection light reflected from the portion. The reflection light is in a wavelength range from 460 nm to 700 nm. The first image signal is obtained from first reflection light including a wavelength range in which an absorption coefficient varies in accordance with oxygen saturation of hemoglobin in blood. The second image signal is obtained from second reflection light including a wavelength range in which an absorption coefficient varies in accordance with blood volume. In the information obtaining step, information on the blood volume and on the oxygen saturation is obtained based on the first and second image signals. In the generating step, a blood volume image and an oxygen saturation image are generated. The blood volume image represents the information on the blood volume. The oxygen saturation image represents the information on the oxygen saturation.
- According to the present invention, the blood volume image representing the information on the blood volume and the oxygen saturation image representing the information on the oxygen saturation can be displayed. Thereby, it becomes easy to find a lesion site.
- The above and other objects and advantages of the present invention will be more apparent from the following detailed description of the preferred embodiments when read in connection with the accompanied drawings, wherein like reference numerals designate like or corresponding parts throughout the several views, and wherein:
-
Fig. 1 is an external view of an endoscope system of a first embodiment; -
Fig. 2 is a block diagram showing a configuration of an endoscope system; -
Fig. 3 is a front view of a distal portion; -
Fig. 4 is a graph showing emission spectra of oxygen saturation measuring beams and white light; -
Fig. 5 is a graph showing spectral characteristic of R, G, and B color filters; -
Fig. 6A is an explanatory view showing operation of an image sensor in a normal light mode; -
Fig. 6B is an explanatory view showing operation of the image sensor in a functional information mode; -
Fig. 7 is a graph showing a correlation between blood volume and a signal ratio R2/G2; -
Fig. 8 is a graph showing a correlation between oxygen saturation and signal ratios B1/G2 and R2/G2; -
Fig. 9 is a graph showing absorption coefficients of hemoglobin; -
Fig. 10 is a graph describing how to determine the oxygen saturation from the signal ratio with the use of the graph ofFig. 8 ; -
Fig. 11 is a graph showing a relation between the blood volume and color difference signals; -
Fig. 12 is a graph showing a relation between the oxygen saturation and the color difference signals; -
Fig. 13 shows a screen of a display device displaying a blood volume image and an oxygen saturation image side by side; -
Fig. 14 shows the screen displaying one of the blood volume image and the oxygen saturation image; -
Fig. 15 is a flowchart showing steps for generating the blood volume image and the oxygen saturation image; -
Fig. 16 is an explanatory view showing generation of the blood volume image and the oxygen saturation image; -
Fig. 17 is a block diagram showing a configuration of another endoscope system in the first embodiment; -
Fig. 18 is a block diagram showing a configuration of an endoscope system of a second embodiment; -
Fig. 19 is a graph showing an emission spectrum of the white light; -
Fig. 20 is a front view of a rotating filter; -
Fig. 21 is a front view of a rotating filter of another embodiment; -
Fig. 22 is a front view of a rotating filter of further another embodiment; and -
Fig. 23 is a block diagram showing a configuration of an endoscope system of a third embodiment. - In
Figs. 1 and2 , anendoscope system 10 of a first embodiment is provided with alight source apparatus 11, anendoscope apparatus 12, aprocessor apparatus 13, adisplay device 14, and aninput device 15. Thelight source apparatus 11 generates light in a predetermined wavelength range. Theendoscope apparatus 12 guides the light from thelight source apparatus 11 and applies the light as illumination light to a portion to be observed (hereinafter referred to as the target portion) of a subject. Theendoscope apparatus 12 captures an image of the light reflected from the target portion and the like. Theprocessor apparatus 13 performs image processing to an image signal obtained with theendoscope apparatus 12. Thedisplay device 14 displays an endoscopic image and the like from theprocessor apparatus 13. Theinput device 15 includes a keyboard, for example. - The
endoscope system 10 has two observation modes: a normal light mode and a functional information mode. In the normal light mode, a normal light image is displayed on thedisplay device 14. The normal light image is a subject image of visible light in a wavelength range from blue to red. In the functional information mode, an oxygen saturation image and a blood volume image are displayed on thedisplay device 14. The oxygen saturation image is a pseudo color image showing information on oxygen saturation of hemoglobin in blood in blood vessel (s) included in the target portion. The blood volume image is a pseudo color image showing information on blood volume in blood vessel(s) included in the target portion. The observation mode is switched as necessary based on a command inputted from aselection switch 17 of theendoscope apparatus 12 or theinput device 15, for example. - The
light source apparatus 11 is provided with two kinds of laser light sources LD1 and LD2, alight source controller 20, acombiner 21, and asplitter 22. The laser light source LD1 generates narrowband light beams (oxygen saturation measuring beams) used for measuring the oxygen saturation. The laser light source LD2 applies excitation light beams to aphosphor 50, placed at a front end of theendoscope apparatus 12, to generate white light (pseudo white light). The light beams from the laser light source LD1 are incident on anoptical fiber 24 through a condenser lens (not shown). The light beams from the laser light source LD2 are incident on anoptical fiber 25 through a condenser lens (not shown). For each of the laser light sources LD1 and LD2, a broad area InGaN laser diode, an InGaNAs laser diode, or a GaNAs laser diode can be used, for example. - The
light source controller 20 controls the laser light sources LD1 and LD2 to adjust emission timing of each of the laser light sources LD1 and LD2 and a light quantity ratio between the laser light sources LD1 and LD2. In this embodiment, in the normal light mode, the laser light source LD1 is turned off and the laser light source LD2 is turned on. On the other hand, in the functional information mode, the laser light sources LD1 and the LD2 are turned on alternately at predetermined time intervals. - The
combiner 21 combines the light beams from theoptical fiber 24 and the light beams from theoptical fiber 25. Thesplitter 22 splits the combined light beams into four paths. Out of the four paths of light beams, the light beams from the laser light source LD1 are transmitted through light guides 26 and 27. The light beams from the laser light source LD2 are transmitted through light guides 28 and 29. Each of the light guides 26 to 29 is composed of a bundle fiber that is a plurality of optical fibers bundled together. Note that the light beams from the laser light sources LD1 and LD2 may be directly incident on the light guides 26 to 29 without using thecombiner 21 and thesplitter 22. - The
endoscope apparatus 12 is composed of an electronic endoscope and is provided with ascope 32, an illuminatingsection 33, animaging section 34, anoperation section 35, and aconnector section 36. The illuminatingsection 33 applies the four paths of light beams transmitted through the respective light guides 26 to 29 to the target portion. Theimaging section 34 captures an image of the target portion. Theoperation section 35 is used for bending an end portion of thescope 32 and for performing operation for observation. Theconnector section 36 connects thescope 32, thelight source apparatus 11, and theprocessor apparatus 13 in a detachable manner. - The
scope 32 is provided with aflexible portion 38, a bendingportion 39, and adistal portion 40 in this order from theoperation section 35 side. Theflexible portion 38 is flexible inside the subject when thescope 32 is inserted into the subject. The bendingportion 39 is bent by rotating anangle knob 35a disposed in theoperation section 35. The bendingportion 39 can be bent at any angle in a vertical or horizontal direction to direct thedistal portion 40 to the target portion. - The
distal portion 40 is provided with the illuminatingsection 33 and theimaging section 34. Theimaging section 34 is provided with acapture window 42 substantially at the center of thedistal portion 40. Thecapture window 42 passes the light reflected from the target portion and the like. The illuminatingsection 33 includes twoillumination windows imaging section 34. Each of theillumination windows - Two
projection units illumination window 43. Theprojection unit 46 projects the oxygen saturation measuring beams from thelight guide 26 to the target portion through alens 48. Theprojection unit 47 applies the excitation light beams from thelight guide 28 to thephosphor 50 to project white light. The white light is projected to the target portion through alens 51. Similarly,projection units illumination window 44. Theprojection unit 53 is similar to theprojection unit 46. Theprojection unit 54 is similar to theprojection unit 47. - As shown in
Fig. 3 , in thedistal portion 40, thecapture window 42 is disposed between theillumination windows projection units projection units projection units capture window 42. This arrangement prevents unevenness in illumination. Each of theprojection units phosphor 50. Theprojection units phosphor 50. - The plate-
like phosphor 50 includes several kinds of fluorescent substances, for example, YAG fluorescent substances or BAM (BaMgAl10O17). These fluorescent substances absorb a part of the excitation light beams from the laser light source LD2 to emit green to yellow light (fluorescence). When the excitation light is applied to thephosphor 50, the green to yellow fluorescence emitted from thephosphor 50 and the excitation light, passed through thephosphor 50 without being absorbed, are combined to generate the white light (pseudo white light). The phosphor may be referred to as Micro White (registered trademark) . - Accordingly, as shown in
Fig. 4 , the white light emitted from each of theprojection units 47 and 54 (each having the phosphor 50) has an emission spectrum including a wavelength range of the excitation light having the center wavelength of 445 nm and a wavelength range approximately from 450 nm to 700 nm in which emission intensity of the fluorescence generated by the excitation light increases. On the other hand, the oxygen saturation measuring beams emitted from each of theprojection units 46 and 53 (neither having the phosphor 50) has an emission spectrum in a wavelength range around the center wavelength of 473 nm. - The white light of the present invention does not necessarily include all wavelength components of the visible light. Like the above pseudo white light, the white light only needs to include light in a specific wavelength range, for example, light of a primary color, R(red), G(green), or B (blue) . In other words, the white light may include light having the wavelength components from green to red or light having the wavelength components from blue to green, for example.
- An objective lens unit (not shown) is provided behind the
capture window 42. The objective lens unit takes in light (image light) reflected from the target portion of the subject. Animage sensor 60 is provided behind the objective lens unit. Theimage sensor 60 is a CCD (charge coupled device) or a CMOS (complementary metal-oxide semiconductor), for example. Theimage sensor 60 receives the image light of the target portion to generate an image thereof. - A light receiving surface (imaging surface) of the
image sensor 60 receives the light from objective lens unit. Then theimage sensor 60 photoelectrically converts the light to output an imaging signal (analog signal). Theimage sensor 60 is a color CCD. On the light receiving surface, three kinds of pixels, R pixels each provided with a red color filter, G pixels each provided with a green color filter, and B pixels each provided with a blue color filter are arranged in a matrix with a predetermined pattern. - As shown in
Fig. 5 , the blue color filter has spectral characteristic 63. The green color filter has spectral characteristic 64. The red color filter has spectral characteristic 65. Accordingly, out of the light reflected from the target portion, the white light passes through all of the red, green, and blue color filters. Thereby, a color signal is outputted from each of the R, G, and B pixels of theimage sensor 60. On the other hand, because the center wavelength of the oxygen saturation measuring beams is 473 nm, the B pixel mainly outputs the color signal. - A three-color signal, being the imaging signal (analog signal) outputted from the
image sensor 60, is inputted to an A/D converter 68 through ascope cable 67. The A/D converter 68 converts the imaging signal into an image signal (digital signal) corresponding to a voltage level of the imaging signal. After the conversion, the image signal is inputted to animage processor 73 of theprocessor apparatus 13 through theconnector section 36. - An
imaging controller 70 controls imaging of theimage sensor 60. As shown inFig. 6A , in the normal light mode, two steps, an accumulation step and a read-out step are performed in a single frame period. In the accumulation step, electric charge obtained by the photoelectric conversion of the white light (445 nm + phosphor) is accumulated. In this embodiment, the white light (445 nm + phosphor) denotes that the white light is generated by applying the excitation light at 445 nm to thephosphor 50. In the read-out step, the electric charge accumulated is read out. The accumulation step and the read-out step are repeated alternately in the normal light mode. - On the other hand, in the functional information mode as shown in
Fig. 6B , for the first frame, two steps, an accumulation step and a read-out step are performed in a single frame period. In the accumulation step, the electric charge obtained by photoelectric conversion of the oxygen saturation measuring beams (the narrowband light at 473 nm) is accumulated. In the read-out step, the electric charge accumulated is read out. Next, for the second frame, two steps, an accumulation step and a read-out step are performed. In the accumulation step, the electric charge obtained by photoelectric conversion of the white light (445 nm + Micro White) is accumulated. In the read-out step, the electric charge accumulated is read out. This imaging control using two frames is repeated in the functional information mode. - The image signal of the first frame is composed of a blue signal (B signal) B1 from the B pixel of the
image sensor 60, a green signal (G signal) G1 from the G pixel of theimage sensor 60, and a red signal (R signal) R1 from the R pixel of theimage sensor 60. The image signal of the second frame is the same as the normal light image signal. The image signal of the second frame is composed of a B signal B2 from the B pixel, a G signal G2 from the G pixel, and an R signal R2 from the R pixel. - Through the
operation section 35 and thescope 32 of theendoscope apparatus 12, various channels (not shown) are provided. The channels include, for example, an air/water channel and a forceps channel through which a sample collecting device or the like is inserted. - The
processor apparatus 13 is provided with acontroller 72, theimage processor 73, andstorage 74. Thecontroller 72 is connected to thedisplay device 14 and theinput device 15. Thecontroller 72 controls operations of theimage processor 73, thelight source controller 20 of thelight source apparatus 11, theimaging controller 70 of theendoscope apparatus 12, and thedisplay device 14, according to a command instructing the observation mode and the like. The command is issued from theselection switch 17 or theinput device 15 of theendoscope apparatus 12. - The
image processor 73 is provided with a normal lightimage processing section 80 and a functional image processing section (blood volume and oxygen saturation calculating section) 82. Theimage processor 73 performs predetermined image processing to the image signal from theendoscope apparatus 12. The normal lightimage processing section 80 performs predetermined image processing to the image signal to generate a normal light image. - The functional
image processing section 82 calculates information on the blood volume and on the oxygen saturation of hemoglobin in blood of the target portion based on the image signal inputted from theendoscope apparatus 12. The functionalimage processing section 82 generates a blood volume image showing the blood volume in pseudo color and an oxygen saturation image showing the oxygen saturation in pseudo color. The functionalimage processing section 82 is provided with asignal ratio calculator 84,correlation storage 85, a blood volume and anoxygen saturation calculator 86, a bloodvolume image generator 87, and an oxygensaturation image generator 88. - The
signal ratio calculator 84 calculates a signal ratio between the image signal of the first frame and the image signal of the second frame obtained in the functional information mode, relative to picture elements located at the same positions or coordinates in the first and second frames. The signal ratio is calculated for every picture element in the image signal. In this embodiment, thesignal ratio calculator 84 calculates a signal ratio B1/G2 between the B signal B1 of the first frame and the G signal G2 of the second frame, and a signal ratio R2/G2 between the R signal R2 of the second frame and the G signal G2 of the second frame. The signal ratios may be calculated only for the picture elements in vascular portions of the image signals. In this case, the vascular portion is determined based on a difference between an image signal of the vascular portion and an image signal of a portion other than the vascular portion. - The
correlation storage 85 stores a correlation between the signal ratio R2/G2 and the blood volume, and a correlation between the oxygen saturation and the signal ratios B1/G2 and R2/G2. As shown inFig. 7 , the correlation between the signal ratio and the blood volume is stored in a one-dimensional table. The correlation is defined or determined such that the signal ratio R2/G2 increases with the blood volume. The signal ratio R2/G2 is stored in log scale. - On the other hand, as shown in
Fig. 8 , the correlation between the signal ratios and the oxygen saturation is stored in a two dimensional table. The two dimensional table defines contour lines of the oxygen saturation on a two dimensional space. The positions and shapes of the contour lines are obtained by physical simulation of light scattering, and vary according to the blood volume. For example, a space between the contour lines increases or decreases when there is a change in the blood volume. Here, the signal ratios B1/G2 and R2/G2 are stored in log scale. - The above-described correlations are closely related to light absorption property and light scattering property of oxyhemoglobin and deoxyhemoglobin shown in
Fig. 9 . InFig. 9 , acharacteristic line 90 shows an absorption coefficient of oxyhemoglobin. Acharacteristic line 91 shows an absorption coefficient of deoxyhemoglobin. As shown inFig. 9 , it is easy to obtain information on the oxygen saturation at 473 nm, for example, where a difference between the absorption coefficient of the oxyhemoglobin and the absorption coefficient of the deoxyhemoglobin is large. However, the B signal including a signal of the light at 473nm is highly dependent on both the oxygen saturation and the blood volume. To obtain the oxygen saturation accurately without depending on the blood volume, the signal ratios B1/G2 and R2/G2 are used in addition to the B signal B1. The signal ratios B1/G2 and R2/G2 are obtained from the B signal B1, the R signal R2, and the G signal G2. The R signal R2 corresponds to the light which varies depending mainly on the blood volume. The G signal G2 is a reference signal for the B signal B1 and the R signal R2. - Based on wavelength dependence of the absorption coefficient of hemoglobin in blood, there are three important points.
- 1. In a wavelength range close to 470 nm, for example, in a blue wavelength range with the center wavelength of 470 nm ± 10 nm, the absorption coefficient varies significantly in accordance with a change in the oxygen saturation.
- 2. When averaged in a green wavelength range from 540 nm to 580 nm, the absorption coefficient is likely to be unaffected by the oxygen saturation.
- 3. In a red wavelength range from 590 nm to 700 nm, the absorption coefficient appears to vary significantly in accordance with a change in the oxygen saturation. Actually, however, the absorption coefficient is likely to be unaffected by the oxygen saturation because the value of the absorption coefficient is extremely small.
- The blood volume and the
oxygen saturation calculator 86 obtains both the blood volume and the oxygen saturation in each picture element using the correlations stored in thecorrelation storage 85 and the signal ratios B1/G2 and R2/G2 obtained by thesignal ratio calculator 84. In the one-dimensional table in thecorrelation storage 85, the blood volume is a value corresponding to the signal ratio R2/G2 obtained by thesignal ratio calculator 84. To obtain the oxygen saturation, as shown inFig. 10 , first, a point P corresponding to the signal ratios B1*/G2* and R2*/G2*, obtained by thesignal ratio calculator 84, is determined in the two-dimensional space. - As shown in
Fig. 10 , when the point P is positioned between a lower limit line 93 (the oxygen saturation = 0% limit) and an upper limit line 94 (the oxygen saturation = 100% limit), the percentage of the oxygen saturation is the percentage expressed by the contour line where the point P is positioned. For example, inFig. 10 , the point P is positioned on the contour line of "60%", so the percentage of the oxygen saturation is 60%. If the point P is positioned outside of a range between thelower limit line 93 and theupper limit line 94, for example, when the point P is positioned above thelower limit line 93, the oxygen saturation is determined to be 0%. When the point P is positioned below theupper limit line 94, the oxygen saturation is determined to be 100%. Note that when the point P is positioned outside of a range between thelower limit line 93 and theupper limit line 94, the reliability of the oxygen saturation in the picture element may be reduced so as not to display the oxygen saturation. - The blood
volume image generator 87 generates a blood volume image showing the blood volume, calculated by the blood volume and theoxygen saturation calculator 86, in pseudo-color. The blood volume image is composed of a video signal. The video signal includes luminance Y and color difference signals Cb and Cr. The G signal G2 of the normal light image signal is assigned to the luminance Y. The G signal G2 corresponds to the reflected light in a wavelength range in which the light absorption by the hemoglobin is rather large. Accordingly, the image generated based on the G signal G2 allows visible observation of blood vessels and surface unevenness of mucosa, for example. By assigning the G signal G2 to the luminance Y, overall brightness of the pseudo color image is defined or determined. - On the other hand, according to a color table 87a, signal values corresponding to the blood volume are assigned to the color difference signals Cb and Cr, respectively. As shown in
Fig. 11 , in the color table 87a, the signal value of the color difference signal Cb decreases as the blood volume increases. Conversely, the signal value of the color difference signal Cr increases as the blood volume increases. Accordingly, redness of the blood volume image increases as the blood volume increases. The redness decreases in chroma and becomes closer to monochromatic as the blood volume decreases. - The oxygen
saturation image generator 88 generates the oxygen saturation image showing the oxygen saturation, obtained by the blood volume and theoxygen saturation calculator 86, in pseudo color. The oxygen saturation image is composed of a video signal. The video signal includes luminance Y and color difference signals Cb and Cr. The G signal G2 of the normal light image signal is assigned to the luminance Y. According to a color table 88a, signal values corresponding to the oxygen saturation are assigned to the color difference signals Cb and Cr, respectively. - As shown in
Fig. 12 , in the color table 88a, when the oxygen saturation is high, a signal value of the color difference signal Cr is defined to be positive, while a signal value of the color difference signal Cb is defined to be negative. When the oxygen saturation is low, on the other hand, the signal value of the color difference signal Cr is defined to be negative, while the signal value of the color difference signal Cb is defined to be positive. When the oxygen saturation is at a medium level, a relationship in magnitude between the signal value of the color difference signal Cr and the signal value of the color difference signal Cb reverses. So, as the oxygen saturation increases, the hue or color of the oxygen saturation image changes from blue to light blue to green to yellow to orange to red. - The blood volume image and the oxygen saturation image generated are displayed on the
display device 14. As shown inFig. 13 , the oxygen saturation image and the blood volume image may be displayed side by side simultaneously after their sizes are reduced. Alternatively, as shown inFig. 14 , a user may operate an image selecting means (not shown) provided in theinput device 15 to select one of the oxygen saturation image and the blood volume image. The image selected is displayed on thedisplay device 14. Using both the blood volume image and the oxygen saturation image for the endoscopic diagnosing improves the capability to diagnose a lesion, for example, undifferentiated early gastric cancer, showing a distinctive feature both in the oxygen saturation and the blood volume. - Next, the operation of the present invention is described with reference to
Figs. 15 and16 . When the observation mode is switched to the functional information mode using theselection switch 17 of theendoscope apparatus 12, the narrowband oxygen saturation measuring beams at the center wavelength of 473 nm are applied from thedistal portion 40 to the target portion of the subject. The light reflected from the target portion is captured by theimage sensor 60. Theimage sensor 60 is a color CCD composed of B pixels, G pixels, and R pixels. Thereby, an image signal of a first frame is obtained. The image signal of the first frame is composed of a B signal B1, a G signal G1, and a R signal R1. - After the image signal of the first frame is obtained, the white light, generated by the excitation light at the center wavelength of 445 nm, is applied to the target portion of the subject through the
distal portion 40. Theimage sensor 60 captures the light reflected from the target portion and the like. Thereby, an image signal (the normal light image signal) of a second frame is obtained. The image signal of the second frame is composed of a B signal B2, a G signal G2, and a R signal R2. - When the image signal of the second frame is obtained, the
signal ratio calculator 84 obtains the signal ratios B1/G2 and R2/G2 between the image signal of the first frame and the image signal of the second frame, relative to the picture elements located at the same positions or coordinates in the first and second frames. The signal ratios are obtained for every picture element. Thereafter, based on the correlations stored in thecorrelation storage 85, the blood volume and theoxygen saturation calculator 86 obtains the blood volume corresponding to the signal ratio R2/G2 calculated by thesignal ratio calculator 84. The blood volume and theoxygen saturation calculator 86 also obtains the oxygen saturation corresponding to the signal ratios B1/G2 and R2/G2 calculated by thesignal ratio calculator 84. The blood volume and the oxygen saturation are obtained for every picture element. - When the blood volume and the oxygen saturation are obtained for each picture element, the color table 87a in the blood
volume image generator 87 is referred to. Thereby, the color difference signals Cb and Cr corresponding to the blood volume are obtained. The blood volume image is generated based on the color difference signals Cb and Cr and the luminance Y. The G signal G2 of the normal light image signal is assigned to the luminance Y. The blood volume image shows the blood vessels in pseudo color in accordance with their blood volumes. Similarly, with the use of the color table 88a, the oxygen saturation image is generated. The oxygen saturation image shows the blood vessels in pseudo color in accordance with their oxygen saturations. The blood volume image and the oxygen saturation image are displayed on thedisplay device 14. - In the first embodiment, the blood volume and the oxygen saturation are calculated using two frames of image signals. The image signal of the first frame is obtained by applying the narrowband light having the center wavelength of 473 nm. The image signal of the second frame is obtained by applying the white light. The white light is emitted from the phosphor being excited by the excitation light having the center wavelength of 445 nm. Alternatively, as shown in
Fig. 17 , the white light may be generated by applying the excitation light having the center wavelength of 473 nm, emitted from the laser light source LD1, to thephosphor 50. In this case, the blood volume and the oxygen saturation can be obtained from an image signal of a single frame captured while the white light is applied to the target portion of the subject. Unlike theendoscope system 10 using the fourprojection units endoscope system 100 shown inFig. 17 applies two paths of light beams from therespective projection units - In the image signal, the B signal B includes a signal corresponding to the excitation light having the center wavelength of 473 nm and a signal corresponding to a small amount of light out of the light from the phosphor being excited by the excitation light. The G signal G includes a signal corresponding to spectral illumination in a wavelength range mainly from 540 nm to 580 nm out of the light from the phosphor being excited. The R signal R includes a signal corresponding to spectral illumination in a wavelength range from 590 nm to 700 nm out of the light from the phosphor being excited and a signal corresponding to a small amount of the excitation light.
- Accordingly, the signal ratio used for the calculation of the blood volume is R/G. The signal ratios used for the calculation of the oxygen saturation are B/G and R/G. The signal ratio R/G corresponds to the signal ratio R2/G2. The signal ratio B/G corresponds to the signal ratio B1/G2. Methods for calculating the blood volume and the oxygen saturation are similar to the above, so explanations thereof are omitted. To generate the pseudo-color blood volume image and the pseudo-color oxygen saturation image, the G signal G is assigned to the luminance.
- As shown in
Fig. 18 , anendoscope system 120 of a second embodiment uses thelight source apparatus 11 of a rotating-filter type. Theendoscope system 120 is provided with abroadband light source 121, arotating filter 122, anoptical fiber 123, and arotation controller 124. Thebroadband light source 121 is a xenon light source, for example, and emits white light having spectral intensity shown inFig. 19 . Therotating filter 122 allows the whole of the white light or a wavelength component of the oxygen saturation measuring beams out of the white light to pass therethrough. The light passed through therotating filter 122 is incident on theoptical fiber 123. Therotation controller 124 controls the rotation of therotating filter 122. The light incident on theoptical fiber 123 is split into two paths of light beams by thesplitter 22. One of the two paths of light beams is applied from theprojection unit 46 to the target portion of the subject through thelight guide 26. The other path of the light beams is applied from theprojection unit 53 to the target portion of the subject through thelight guide 27. Remaining reference numerals denote parts similar to those in theendoscope system 10, so descriptions thereof are omitted. - As shown in
Fig. 20 , therotating filter 122 is provided with abandpass filter 125 and anopening 126. Out of the white light, thebandpass filter 125 allows the oxygen saturation measuring beams (seeFig. 4 ) in the wavelength range from 460 nm to 480 nm to pass therethrough. Theopening 126 allows the whole of white light to pass therethrough. By rotating therotating filter 122, the oxygen saturation measuring beams and the white light are applied alternately to the target portion of the subject. Similar to the first embodiment, the image signal of the first frame is obtained when the oxygen saturation measuring beams are applied. The image signal of the second frame is obtained when the white light is applied. The oxygen saturation image is generated from the two frames of image signals in the similar manner to the first embodiment. - In the second embodiment, because the white light has the spectral intensity property shown in
Fig. 19 , the B signal B2 of the normal light image signal includes a signal of the light in the wavelength range from 400 nm to 530 nm. The G signal G2 includes a signal of the light in the wavelength range from 540 nm to 580 nm. The R signal R2 includes a signal of the light in the wavelength range from 590 nm to 700 nm. A method for calculating the blood volume and the oxygen saturation is similar to that of the first embodiment, so the descriptions thereof are omitted. - In the second embodiment, a
rotating filter 130 shown inFig. 21 may be used instead of therotating filter 122 shown inFig. 20 . Therotating filter 130 is provided with first to third transmittingsections 131 to 133. Out of the white light from thebroadband light source 121, thefirst transmitting section 131 allows first light beams to pass therethrough. The first light beams are in a wavelength range from 460 nm to 480 nm. Out of the white light, thesecond transmitting section 132 allows second light beams to pass therethrough. The second light beams are in a wavelength range from 540 nm to 580 nm. Out of the white light, thethird transmitting section 133 allows third light beams to pass therethrough. The third light beams are in a wavelength range from 590 nm to 700 nm. When therotating filter 130 is rotated, the first to third light beams are applied to the target portion of the subject successively and repeatedly. - When the
rotating filter 130 is used, themonochrome image sensor 60 is used. Themonochrome image sensor 60 captures an image every time the light beams, passed through therotating filter 130, are applied. By the application of the first to third light beams, three frames of image signals are obtained, respectively. Out of the image signals, an image signal obtained when the first light beams are applied is defined as the B signal B. An image signal obtained when the second light beams are applied is defined as the G signal G. An image signal obtained when the third light beams are applied is defined as the R signal R. - Accordingly, the signal ratio used for the calculation of the blood volume is R/G. The signal ratios used for the calculation of the oxygen saturation are B/G and R/G. The signal ratio R/G corresponds to the signal ratio R2/G2 of the first embodiment. The signal ratio B/G corresponds to the signal ratio B1/G2 of the first embodiment. The method for calculating the blood volume and the oxygen saturation is similar to that of the first embodiment, so descriptions thereof are omitted. To generate the pseudo-color blood volume image and the pseudo-color oxygen saturation image, the G signal G is assigned to the luminance.
- In the second embodiment, a
rotating filter 150 shown inFig. 22 may be used instead of therotating filter 130 shown inFig. 21 . Therotating filter 150 is provided with first to third transmittingsections 151 to 153. Out of the white light, thefirst transmitting section 151 of therotating filter 150 allows first light beams to pass therethrough. The first light beams are in a wavelength range from 530 nm to 550 nm. Thesecond transmitting section 152 allows second light beams to pass therethrough. The second light beams are in a wavelength range from 555 nm to 565 nm. Thethird transmitting section 153 allows third light beams to pass therethrough. The third light beams are in a wavelength range from 590 nm to 700 nm. When therotating filter 150 is rotated, the first to third light beams are applied successively and repeatedly to the target portion of the subject. - When the
rotating filter 150 is used, thecolor image sensor 60 captures an image every time first, second, or third light beams are applied. The first and second light beams are detected mainly by the G pixel of theimage sensor 60. Accordingly, when the first and second light beams are applied, the G signals Ga and Gb are obtained as the image signals, respectively. On the other hand, the third light beams are detected mainly by the R pixel of theimage sensor 60. Thereby, the R signal Rc is obtained as the image signal. Here, the image signals Ga and Rc are obtained from reflected light beams in the two respective wavelength ranges in each of which the absorption coefficient varies in accordance with a change in the oxygen saturation of hemoglobin in blood. The image signal Gb is obtained from the reflected light in a wavelength range in which the absorption coefficient is unchanged. Accordingly, the signal ratio Ga/Gb varies depending on the oxygen saturation and the blood volume. The signal ratio Rc/Gb varies depending mainly on the blood volume. - The signal ratio Rc/Gb is used for calculating the blood volume. The signal ratios Ga/Gb and Rc/Gb are used for calculating the oxygen saturation. The signal ratio Rc/Gb corresponds to the signal ratio R2/G2 of the first embodiment. The signal ratio Ga/Gb corresponds to the signal ratio B1/G2 of the first embodiment. The method for calculating the blood volume and the oxygen saturation is similar to that in the first embodiment, so descriptions thereof are omitted. To generate the pseudo-color blood volume image and the pseudo-color oxygen saturation image, the G signal Ga or Gb is assigned to the luminance.
- As shown in
Fig. 23 , instead of therotating filter 122 shown in the second embodiment, anendoscope system 200 of a third embodiment uses ahalf prism 201, areflection prism 202, andnarrowband filters endoscope system 120 in the second embodiment. - In the
light source apparatus 11, thehalf prism 201 splits the white light, emitted from thebroadband light source 121, into two paths of light beams. One of the two paths of the light beams is incident on thenarrowband filter 203. The other path of the light beams is reflected by thereflection prism 202 and then incident on thenarrowband filter 204. Out of the white light, thenarrowband filter 203 allows the light beams in a wavelength range from 460 nm to 480 nm to pass therethrough. Thenarrowband filter 204 allows the light beams in a wavelength range from 540 nm to 700 nm to pass therethrough. The light beams passed through thenarrowband filter 203 are applied to the target portion of the subject through alens 203a and thelight guide 26. The light beams passed through thenarrowband filter 204 are applied to the target portion of the subject through alens 204a and thelight guide 27. The light beams passed through thenarrowband filters - To capture an image of the target portion of the subject, the
color image sensor 60 is used in the similar manner to the first embodiment. Accordingly, in the image signal obtained by the image capture, the B signal B includes a signal corresponding to the light beams in the wavelength range from 460 nm to 480 nm. The G signal G includes a signal corresponding to the light beams in the wavelength range from 540 nm to 580 nm. The R signal R includes a signal corresponding to the light beams in the wavelength range from 590 nm to 700 nm. - Accordingly, the signal ratio R/G is used for calculating the blood volume. The signal ratios B/G and R/G are used for calculating the oxygen saturation. The signal ratio R/G corresponds to the signal ratio R2/G2 of the first embodiment. The signal ratio B/G corresponds to the signal ratio B1/G2 of the first embodiment. A method for calculating the blood volume and the oxygen saturation is similar to that of the first embodiment, so descriptions thereof are omitted. To generate the pseudo-color blood volume image and the pseudo-color oxygen saturation image, the G signal G is assigned to the luminance.
- In the above embodiment, in generating the blood volume image and the oxygen saturation image, the information on the blood volume and on the oxygen saturation is expressed in pseudo color. Alternatively, the information on the blood volume and on the oxygen saturation may be expressed in monochrome gradation.
- Various changes and modifications are possible in the present invention and may be understood to be within the present invention.
Claims (17)
- An endoscope system (10, 120, 200) comprising:an illuminating section (33) for projecting illumination light to a portion to be observed, the portion including a blood vessel;an image signal obtaining section (34, 60) for obtaining at least first and second image signals from reflection light reflected from the portion, the reflection light being in a wavelength range from 460 nm to 700 nm, the first image signal being obtained from first reflection light including a wavelength range in which an absorption coefficient varies in accordance with oxygen saturation of hemoglobin in blood, the second image signal being obtained from second reflection light including a wavelength range in which an absorption coefficient varies in accordance with blood volume;a blood volume and oxygen saturation calculating section (82) for obtaining information on the blood volume and on the oxygen saturation based on the first and second image signals;a blood volume and oxygen saturation image generator (87, 88) for generating a blood volume image and an oxygen saturation image, the blood volume image representing the information on the blood volume, the oxygen saturation image representing the information on the oxygen saturation; anda display section (14) for displaying the blood volume image and the oxygen saturation image simultaneously or selectively.
- The endoscope system of claim 1, wherein the image signal obtaining section further obtains a third signal as a reference signal to the first and second image signals, and the third signal is obtained from third reflection light including an arbitrary wavelength range in the wavelength range from 460 nm to 700 nm.
- The endoscope system of claim 2, wherein the blood volume and oxygen saturation image generator has a first color table (87a) for blood volume and a second color table (88a) for oxygen saturation, and the first color table stores pseudo color information varying in accordance with the blood volume, and the second color table stores pseudo color information varying in accordance with the oxygen saturation, and the images of the blood vessel are generated in pseudo color using the first and second color tables.
- The endoscope system of claim 3, wherein one of the first and second color tables varies in chroma and the other varies in hue.
- The endoscope system of claim 3, wherein the blood volume and oxygen saturation obtaining section includes:a signal ratio calculator (84) for obtaining a first signal ratio and a second signal ratio based on the first to third image signals, and the first signal ratio depends on the blood volume, and the second signal ratio depends on both the blood volume and the oxygen saturation;correlation storage (85) for storing a first correlation between the blood volume and the first signal ratio and a second correlation between the oxygen saturation and the first and second signal ratios; anda calculator (86) for obtaining the information on the blood volume from the first correlation and the information on the oxygen saturation from the second correlation, and the blood volume corresponds to the first signal ratio, and the oxygen saturation corresponds to the second signal ratio.
- The endoscope system of claim 5, wherein the image signal obtaining section has a color image sensor (60) provided with R, G, and B color filters on its imaging surface.
- The endoscope system of claim 6, wherein the illuminating section projects light, having a wavelength range in which the absorption coefficient varies in accordance with a change in the oxygen saturation of hemoglobin in blood, as the illumination light to the portion to obtain the first image signal, and the illuminating section projects white light as the illumination light to obtain the second and third image signals.
- The endoscope system of claim 7, wherein the white light is pseudo white light generated by applying excitation light having a predetermined wavelength to a phosphor.
- The endoscope system of claim 6, wherein the illuminating section projects white light as the illumination light to the portion to obtain the first to third image signals.
- The endoscope system of claim 9, wherein the white light is pseudo white light generated by applying excitation light having a predetermined wavelength to a phosphor (50).
- The endoscope system of claim 5, wherein the illuminating section successively projects light in a wavelength range from 460 nm to 480 nm, light in a wavelength range from 540 nm to 580 nm, and light in a wavelength range from 590 nm to 700 nm as the illumination light.
- The endoscope system of claim 11, wherein the light in each of the wavelength ranges is generated by filtering white light with a narrowband filter (130).
- The endoscope system of claim 6, wherein the illuminating section simultaneously projects light in a wavelength range from 460 nm to 480 nm and light in a wavelength range from 540 nm to 700 nm as the illumination light.
- The endoscope system of claim 6, wherein the illuminating section successively projects light in a wavelength range from 530 nm to 550 nm, light in a wavelength range from 555 nm to 565 nm, and light in a wavelength range from 590 nm to 700 nm as the illumination light.
- The endoscope system of claim 14, wherein the light in each of the wavelength ranges is generated by filtering white light with a narrowband filter (150).
- A processor apparatus (13) used with an endoscope, the processor apparatus having an image signal obtaining section (34, 60) for obtaining at least first and second image signals from reflection light reflected from a portion to be observed, the portion including a blood vessel, the reflection light being in a wavelength range from 460 nm to 700 nm, the first image signal being obtained from first reflection light including a wavelength range in which an absorption coefficient varies in accordance with oxygen saturation of hemoglobin in blood, the second image signal being obtained from second reflection light including a wavelength range in which an absorption coefficient varies in accordance with blood volume; the processor apparatus including:a receiving section (73) for receiving the first and second image signals from the endoscope;a blood volume and oxygen saturation calculating section (82) for obtaining information on the blood volume and on the oxygen saturation based on the first and second image signals; anda blood volume and oxygen saturation image generator (87, 88) for generating a blood volume image and an oxygen saturation image, the blood volume image representing the information on the blood volume, the oxygen saturation image representing the information on the oxygen saturation.
- A method for generating images comprising the steps of:projecting illumination light to a portion to be observed, the portion including a blood vessel;obtaining at least first and second image signals from reflection light reflected from the portion, the reflection light being in a wavelength range from 460 nm to 700 nm, the first image signal being obtained from first reflection light including a wavelength range in which an absorption coefficient varies in accordance with oxygen saturation of hemoglobin in blood, the second image signal being obtained from second reflection light including a wavelength range in which an absorption coefficient varies in accordance with blood volume;obtaining information on the blood volume and on the oxygen saturation based on the first and second image signals; andgenerating a blood volume image and an oxygen saturation image, the blood volume image representing the information on the blood volume, the oxygen saturation image representing the information on the oxygen saturation.
Applications Claiming Priority (1)
| Application Number | Priority Date | Filing Date | Title |
|---|---|---|---|
| JP2010284596A JP5222934B2 (en) | 2010-12-21 | 2010-12-21 | Endoscope system, processor device for endoscope system, and method for operating endoscope system |
Publications (2)
| Publication Number | Publication Date |
|---|---|
| EP2468187A1 true EP2468187A1 (en) | 2012-06-27 |
| EP2468187B1 EP2468187B1 (en) | 2019-03-27 |
Family
ID=45093486
Family Applications (1)
| Application Number | Title | Priority Date | Filing Date |
|---|---|---|---|
| EP11191043.6A Active EP2468187B1 (en) | 2010-12-21 | 2011-11-29 | Endoscope system and processor apparatus thereof, and method for generating images |
Country Status (3)
| Country | Link |
|---|---|
| US (1) | US8738108B2 (en) |
| EP (1) | EP2468187B1 (en) |
| JP (1) | JP5222934B2 (en) |
Cited By (4)
| Publication number | Priority date | Publication date | Assignee | Title |
|---|---|---|---|---|
| EP3023050A1 (en) * | 2014-11-21 | 2016-05-25 | Hoya Corporation | Analyzing device and analyzing method |
| US9826893B2 (en) | 2012-08-17 | 2017-11-28 | Hoya Corporation | Electronic endoscope system and light source for endoscope |
| US10426325B2 (en) | 2014-09-03 | 2019-10-01 | Hoya Corporation | Image capturing system and electronic endoscope system |
| US10722155B2 (en) | 2013-05-30 | 2020-07-28 | Hoya Corporation | Method and device for generating image showing concentration distribution of biological substances in biological tissue |
Families Citing this family (10)
| Publication number | Priority date | Publication date | Assignee | Title |
|---|---|---|---|---|
| US9107567B2 (en) * | 2012-12-27 | 2015-08-18 | Christie Digital Systems Usa, Inc. | Spectral imaging with a color wheel |
| JP6140056B2 (en) * | 2013-09-26 | 2017-05-31 | 富士フイルム株式会社 | Endoscope system, processor device for endoscope system, method for operating endoscope system, method for operating processor device |
| JP6132731B2 (en) | 2013-09-27 | 2017-05-24 | 富士フイルム株式会社 | Optical measuring device |
| JP2015068709A (en) | 2013-09-27 | 2015-04-13 | 富士フイルム株式会社 | Optical measurement device |
| JP5972312B2 (en) * | 2014-03-24 | 2016-08-17 | 富士フイルム株式会社 | Medical image processing apparatus and operating method thereof |
| WO2015150106A1 (en) * | 2014-03-31 | 2015-10-08 | Koninklijke Philips N.V. | Device, system and method for tumor detection and/or monitoring |
| US20170035333A1 (en) * | 2015-08-04 | 2017-02-09 | Osram Opto Semiconductors Gmbh | Apparatus for Measuring a Vital Function of a Living Creature |
| JP6272956B2 (en) * | 2016-07-21 | 2018-01-31 | 富士フイルム株式会社 | Endoscope system, processor device for endoscope system, method for operating endoscope system, method for operating processor device |
| EP3590412A4 (en) * | 2017-03-03 | 2020-06-03 | Fujifilm Corporation | Endoscope system, processor device, and endoscope system operation method |
| JP6650919B2 (en) * | 2017-11-27 | 2020-02-19 | Hoya株式会社 | Diagnostic system and information processing device |
Citations (4)
| Publication number | Priority date | Publication date | Assignee | Title |
|---|---|---|---|---|
| US4914512A (en) * | 1988-01-19 | 1990-04-03 | Kabushiki Kaisha Toshiba | Electronic endoscope apparatus capable of displaying hemoglobin concentration on color image |
| US4998973A (en) * | 1987-06-16 | 1991-03-12 | Kabushiki Kaisha Toshiba | Endoscope |
| US5512940A (en) * | 1993-03-19 | 1996-04-30 | Olympus Optical Co., Ltd. | Image processing apparatus, endoscope image sensing and processing apparatus, and image processing method for performing different displays depending upon subject quantity |
| JP2648494B2 (en) | 1988-05-02 | 1997-08-27 | オリンパス光学工業株式会社 | Endoscope device |
Family Cites Families (6)
| Publication number | Priority date | Publication date | Assignee | Title |
|---|---|---|---|---|
| JP2978053B2 (en) * | 1994-05-06 | 1999-11-15 | オリンパス光学工業株式会社 | Biological imaging device and blood information calculation processing circuit |
| JP4054222B2 (en) * | 2002-06-05 | 2008-02-27 | オリンパス株式会社 | Light source device for endoscope device |
| JP5302491B2 (en) * | 2003-12-22 | 2013-10-02 | 日亜化学工業株式会社 | LIGHT EMITTING DEVICE AND ENDOSCOPE DEVICE |
| EP1845837B1 (en) * | 2005-01-21 | 2013-05-29 | Verisante Technology, Inc. | Method and apparatus for measuring cancerous changes from reflectance spectral measurements obtained during endoscopic imaging |
| JP4354425B2 (en) * | 2005-04-11 | 2009-10-28 | オリンパスメディカルシステムズ株式会社 | Endoscope insertion part and endoscope |
| JP2007167339A (en) * | 2005-12-21 | 2007-07-05 | 国立大学法人 東京医科歯科大学 | Method and apparatus for measuring blood concentration and blood flow in dental pulp |
-
2010
- 2010-12-21 JP JP2010284596A patent/JP5222934B2/en active Active
-
2011
- 2011-11-29 EP EP11191043.6A patent/EP2468187B1/en active Active
- 2011-11-29 US US13/306,693 patent/US8738108B2/en active Active
Patent Citations (4)
| Publication number | Priority date | Publication date | Assignee | Title |
|---|---|---|---|---|
| US4998973A (en) * | 1987-06-16 | 1991-03-12 | Kabushiki Kaisha Toshiba | Endoscope |
| US4914512A (en) * | 1988-01-19 | 1990-04-03 | Kabushiki Kaisha Toshiba | Electronic endoscope apparatus capable of displaying hemoglobin concentration on color image |
| JP2648494B2 (en) | 1988-05-02 | 1997-08-27 | オリンパス光学工業株式会社 | Endoscope device |
| US5512940A (en) * | 1993-03-19 | 1996-04-30 | Olympus Optical Co., Ltd. | Image processing apparatus, endoscope image sensing and processing apparatus, and image processing method for performing different displays depending upon subject quantity |
Cited By (6)
| Publication number | Priority date | Publication date | Assignee | Title |
|---|---|---|---|---|
| US9826893B2 (en) | 2012-08-17 | 2017-11-28 | Hoya Corporation | Electronic endoscope system and light source for endoscope |
| US10722155B2 (en) | 2013-05-30 | 2020-07-28 | Hoya Corporation | Method and device for generating image showing concentration distribution of biological substances in biological tissue |
| US10426325B2 (en) | 2014-09-03 | 2019-10-01 | Hoya Corporation | Image capturing system and electronic endoscope system |
| US11224335B2 (en) | 2014-09-03 | 2022-01-18 | Hoya Corporation | Image capturing system and electronic endoscope system |
| EP3023050A1 (en) * | 2014-11-21 | 2016-05-25 | Hoya Corporation | Analyzing device and analyzing method |
| US10031070B2 (en) | 2014-11-21 | 2018-07-24 | Hoya Corporation | Analyzing device and analyzing method based on images of biological tissue captured under illumination of light with different illumination wavelength ranges |
Also Published As
| Publication number | Publication date |
|---|---|
| US8738108B2 (en) | 2014-05-27 |
| JP5222934B2 (en) | 2013-06-26 |
| JP2012130504A (en) | 2012-07-12 |
| EP2468187B1 (en) | 2019-03-27 |
| US20120157803A1 (en) | 2012-06-21 |
Similar Documents
| Publication | Publication Date | Title |
|---|---|---|
| EP2468187B1 (en) | Endoscope system and processor apparatus thereof, and method for generating images | |
| US9801573B2 (en) | Endoscope system, processor device, and method for operating endoscope system | |
| EP2476373B1 (en) | Endoscope system and processor apparatus thereof | |
| EP2465431B1 (en) | Endoscope system and processor of endoscope system | |
| EP2526854B1 (en) | Endoscope system and method for assisting in diagnostic endoscopy | |
| US9918613B2 (en) | Endoscope system and operating method thereof | |
| US9345392B2 (en) | Endoscope system and method for imaging exposure control | |
| JP5702755B2 (en) | Endoscope system, processor device for endoscope system, and method for operating endoscope system | |
| US9414741B2 (en) | Endoscopic diagnosis system | |
| US20130245411A1 (en) | Endoscope system, processor device thereof, and exposure control method | |
| US20140340497A1 (en) | Processor device, endoscope system, and operation method of endoscope system | |
| EP2505121A1 (en) | Endoscope apparatus | |
| US9595117B2 (en) | Image processing device and method for operating endoscope system | |
| JP2013099464A (en) | Endoscope system, processor device in endoscope system, and image display method | |
| US10003774B2 (en) | Image processing device and method for operating endoscope system | |
| JP5558331B2 (en) | Endoscope system, processor device for endoscope system, and method for operating endoscope system |
Legal Events
| Date | Code | Title | Description |
|---|---|---|---|
| AK | Designated contracting states |
Kind code of ref document: A1 Designated state(s): AL AT BE BG CH CY CZ DE DK EE ES FI FR GB GR HR HU IE IS IT LI LT LU LV MC MK MT NL NO PL PT RO RS SE SI SK SM TR |
|
| AX | Request for extension of the european patent |
Extension state: BA ME |
|
| PUAI | Public reference made under article 153(3) epc to a published international application that has entered the european phase |
Free format text: ORIGINAL CODE: 0009012 |
|
| 17P | Request for examination filed |
Effective date: 20121025 |
|
| STAA | Information on the status of an ep patent application or granted ep patent |
Free format text: STATUS: EXAMINATION IS IN PROGRESS |
|
| 17Q | First examination report despatched |
Effective date: 20161222 |
|
| GRAP | Despatch of communication of intention to grant a patent |
Free format text: ORIGINAL CODE: EPIDOSNIGR1 |
|
| STAA | Information on the status of an ep patent application or granted ep patent |
Free format text: STATUS: GRANT OF PATENT IS INTENDED |
|
| RIC1 | Information provided on ipc code assigned before grant |
Ipc: A61B 1/05 20060101ALI20180912BHEP Ipc: A61B 5/1459 20060101AFI20180912BHEP Ipc: A61B 1/00 20060101ALI20180912BHEP Ipc: G06T 7/00 20060101ALI20180912BHEP Ipc: A61B 1/06 20060101ALI20180912BHEP Ipc: A61B 1/07 20060101ALI20180912BHEP |
|
| INTG | Intention to grant announced |
Effective date: 20181008 |
|
| INTG | Intention to grant announced |
Effective date: 20181008 |
|
| GRAS | Grant fee paid |
Free format text: ORIGINAL CODE: EPIDOSNIGR3 |
|
| GRAA | (expected) grant |
Free format text: ORIGINAL CODE: 0009210 |
|
| STAA | Information on the status of an ep patent application or granted ep patent |
Free format text: STATUS: THE PATENT HAS BEEN GRANTED |
|
| AK | Designated contracting states |
Kind code of ref document: B1 Designated state(s): AL AT BE BG CH CY CZ DE DK EE ES FI FR GB GR HR HU IE IS IT LI LT LU LV MC MK MT NL NO PL PT RO RS SE SI SK SM TR |
|
| REG | Reference to a national code |
Ref country code: GB Ref legal event code: FG4D |
|
| REG | Reference to a national code |
Ref country code: CH Ref legal event code: EP |
|
| REG | Reference to a national code |
Ref country code: AT Ref legal event code: REF Ref document number: 1112031 Country of ref document: AT Kind code of ref document: T Effective date: 20190415 |
|
| REG | Reference to a national code |
Ref country code: IE Ref legal event code: FG4D |
|
| REG | Reference to a national code |
Ref country code: DE Ref legal event code: R096 Ref document number: 602011057479 Country of ref document: DE |
|
| PG25 | Lapsed in a contracting state [announced via postgrant information from national office to epo] |
Ref country code: NO Free format text: LAPSE BECAUSE OF FAILURE TO SUBMIT A TRANSLATION OF THE DESCRIPTION OR TO PAY THE FEE WITHIN THE PRESCRIBED TIME-LIMIT Effective date: 20190627 Ref country code: FI Free format text: LAPSE BECAUSE OF FAILURE TO SUBMIT A TRANSLATION OF THE DESCRIPTION OR TO PAY THE FEE WITHIN THE PRESCRIBED TIME-LIMIT Effective date: 20190327 Ref country code: LT Free format text: LAPSE BECAUSE OF FAILURE TO SUBMIT A TRANSLATION OF THE DESCRIPTION OR TO PAY THE FEE WITHIN THE PRESCRIBED TIME-LIMIT Effective date: 20190327 Ref country code: SE Free format text: LAPSE BECAUSE OF FAILURE TO SUBMIT A TRANSLATION OF THE DESCRIPTION OR TO PAY THE FEE WITHIN THE PRESCRIBED TIME-LIMIT Effective date: 20190327 |
|
| REG | Reference to a national code |
Ref country code: NL Ref legal event code: MP Effective date: 20190327 |
|
| PG25 | Lapsed in a contracting state [announced via postgrant information from national office to epo] |
Ref country code: LV Free format text: LAPSE BECAUSE OF FAILURE TO SUBMIT A TRANSLATION OF THE DESCRIPTION OR TO PAY THE FEE WITHIN THE PRESCRIBED TIME-LIMIT Effective date: 20190327 Ref country code: RS Free format text: LAPSE BECAUSE OF FAILURE TO SUBMIT A TRANSLATION OF THE DESCRIPTION OR TO PAY THE FEE WITHIN THE PRESCRIBED TIME-LIMIT Effective date: 20190327 Ref country code: BG Free format text: LAPSE BECAUSE OF FAILURE TO SUBMIT A TRANSLATION OF THE DESCRIPTION OR TO PAY THE FEE WITHIN THE PRESCRIBED TIME-LIMIT Effective date: 20190627 Ref country code: GR Free format text: LAPSE BECAUSE OF FAILURE TO SUBMIT A TRANSLATION OF THE DESCRIPTION OR TO PAY THE FEE WITHIN THE PRESCRIBED TIME-LIMIT Effective date: 20190628 Ref country code: HR Free format text: LAPSE BECAUSE OF FAILURE TO SUBMIT A TRANSLATION OF THE DESCRIPTION OR TO PAY THE FEE WITHIN THE PRESCRIBED TIME-LIMIT Effective date: 20190327 Ref country code: NL Free format text: LAPSE BECAUSE OF FAILURE TO SUBMIT A TRANSLATION OF THE DESCRIPTION OR TO PAY THE FEE WITHIN THE PRESCRIBED TIME-LIMIT Effective date: 20190327 |
|
| REG | Reference to a national code |
Ref country code: AT Ref legal event code: MK05 Ref document number: 1112031 Country of ref document: AT Kind code of ref document: T Effective date: 20190327 |
|
| PG25 | Lapsed in a contracting state [announced via postgrant information from national office to epo] |
Ref country code: ES Free format text: LAPSE BECAUSE OF FAILURE TO SUBMIT A TRANSLATION OF THE DESCRIPTION OR TO PAY THE FEE WITHIN THE PRESCRIBED TIME-LIMIT Effective date: 20190327 Ref country code: AL Free format text: LAPSE BECAUSE OF FAILURE TO SUBMIT A TRANSLATION OF THE DESCRIPTION OR TO PAY THE FEE WITHIN THE PRESCRIBED TIME-LIMIT Effective date: 20190327 Ref country code: PT Free format text: LAPSE BECAUSE OF FAILURE TO SUBMIT A TRANSLATION OF THE DESCRIPTION OR TO PAY THE FEE WITHIN THE PRESCRIBED TIME-LIMIT Effective date: 20190727 Ref country code: IT Free format text: LAPSE BECAUSE OF FAILURE TO SUBMIT A TRANSLATION OF THE DESCRIPTION OR TO PAY THE FEE WITHIN THE PRESCRIBED TIME-LIMIT Effective date: 20190327 Ref country code: RO Free format text: LAPSE BECAUSE OF FAILURE TO SUBMIT A TRANSLATION OF THE DESCRIPTION OR TO PAY THE FEE WITHIN THE PRESCRIBED TIME-LIMIT Effective date: 20190327 Ref country code: SK Free format text: LAPSE BECAUSE OF FAILURE TO SUBMIT A TRANSLATION OF THE DESCRIPTION OR TO PAY THE FEE WITHIN THE PRESCRIBED TIME-LIMIT Effective date: 20190327 Ref country code: CZ Free format text: LAPSE BECAUSE OF FAILURE TO SUBMIT A TRANSLATION OF THE DESCRIPTION OR TO PAY THE FEE WITHIN THE PRESCRIBED TIME-LIMIT Effective date: 20190327 Ref country code: EE Free format text: LAPSE BECAUSE OF FAILURE TO SUBMIT A TRANSLATION OF THE DESCRIPTION OR TO PAY THE FEE WITHIN THE PRESCRIBED TIME-LIMIT Effective date: 20190327 |
|
| PG25 | Lapsed in a contracting state [announced via postgrant information from national office to epo] |
Ref country code: SM Free format text: LAPSE BECAUSE OF FAILURE TO SUBMIT A TRANSLATION OF THE DESCRIPTION OR TO PAY THE FEE WITHIN THE PRESCRIBED TIME-LIMIT Effective date: 20190327 Ref country code: PL Free format text: LAPSE BECAUSE OF FAILURE TO SUBMIT A TRANSLATION OF THE DESCRIPTION OR TO PAY THE FEE WITHIN THE PRESCRIBED TIME-LIMIT Effective date: 20190327 |
|
| PG25 | Lapsed in a contracting state [announced via postgrant information from national office to epo] |
Ref country code: IS Free format text: LAPSE BECAUSE OF FAILURE TO SUBMIT A TRANSLATION OF THE DESCRIPTION OR TO PAY THE FEE WITHIN THE PRESCRIBED TIME-LIMIT Effective date: 20190727 Ref country code: AT Free format text: LAPSE BECAUSE OF FAILURE TO SUBMIT A TRANSLATION OF THE DESCRIPTION OR TO PAY THE FEE WITHIN THE PRESCRIBED TIME-LIMIT Effective date: 20190327 |
|
| REG | Reference to a national code |
Ref country code: DE Ref legal event code: R097 Ref document number: 602011057479 Country of ref document: DE |
|
| PG25 | Lapsed in a contracting state [announced via postgrant information from national office to epo] |
Ref country code: DK Free format text: LAPSE BECAUSE OF FAILURE TO SUBMIT A TRANSLATION OF THE DESCRIPTION OR TO PAY THE FEE WITHIN THE PRESCRIBED TIME-LIMIT Effective date: 20190327 |
|
| PLBE | No opposition filed within time limit |
Free format text: ORIGINAL CODE: 0009261 |
|
| STAA | Information on the status of an ep patent application or granted ep patent |
Free format text: STATUS: NO OPPOSITION FILED WITHIN TIME LIMIT |
|
| PG25 | Lapsed in a contracting state [announced via postgrant information from national office to epo] |
Ref country code: SI Free format text: LAPSE BECAUSE OF FAILURE TO SUBMIT A TRANSLATION OF THE DESCRIPTION OR TO PAY THE FEE WITHIN THE PRESCRIBED TIME-LIMIT Effective date: 20190327 |
|
| 26N | No opposition filed |
Effective date: 20200103 |
|
| PG25 | Lapsed in a contracting state [announced via postgrant information from national office to epo] |
Ref country code: TR Free format text: LAPSE BECAUSE OF FAILURE TO SUBMIT A TRANSLATION OF THE DESCRIPTION OR TO PAY THE FEE WITHIN THE PRESCRIBED TIME-LIMIT Effective date: 20190327 |
|
| REG | Reference to a national code |
Ref country code: CH Ref legal event code: PL |
|
| PG25 | Lapsed in a contracting state [announced via postgrant information from national office to epo] |
Ref country code: LI Free format text: LAPSE BECAUSE OF NON-PAYMENT OF DUE FEES Effective date: 20191130 Ref country code: MC Free format text: LAPSE BECAUSE OF FAILURE TO SUBMIT A TRANSLATION OF THE DESCRIPTION OR TO PAY THE FEE WITHIN THE PRESCRIBED TIME-LIMIT Effective date: 20190327 Ref country code: LU Free format text: LAPSE BECAUSE OF NON-PAYMENT OF DUE FEES Effective date: 20191129 Ref country code: CH Free format text: LAPSE BECAUSE OF NON-PAYMENT OF DUE FEES Effective date: 20191130 |
|
| REG | Reference to a national code |
Ref country code: BE Ref legal event code: MM Effective date: 20191130 |
|
| PG25 | Lapsed in a contracting state [announced via postgrant information from national office to epo] |
Ref country code: IE Free format text: LAPSE BECAUSE OF NON-PAYMENT OF DUE FEES Effective date: 20191129 |
|
| PG25 | Lapsed in a contracting state [announced via postgrant information from national office to epo] |
Ref country code: BE Free format text: LAPSE BECAUSE OF NON-PAYMENT OF DUE FEES Effective date: 20191130 |
|
| PGFP | Annual fee paid to national office [announced via postgrant information from national office to epo] |
Ref country code: GB Payment date: 20201118 Year of fee payment: 10 Ref country code: FR Payment date: 20201013 Year of fee payment: 10 |
|
| PG25 | Lapsed in a contracting state [announced via postgrant information from national office to epo] |
Ref country code: CY Free format text: LAPSE BECAUSE OF FAILURE TO SUBMIT A TRANSLATION OF THE DESCRIPTION OR TO PAY THE FEE WITHIN THE PRESCRIBED TIME-LIMIT Effective date: 20190327 |
|
| PG25 | Lapsed in a contracting state [announced via postgrant information from national office to epo] |
Ref country code: MT Free format text: LAPSE BECAUSE OF FAILURE TO SUBMIT A TRANSLATION OF THE DESCRIPTION OR TO PAY THE FEE WITHIN THE PRESCRIBED TIME-LIMIT Effective date: 20190327 Ref country code: HU Free format text: LAPSE BECAUSE OF FAILURE TO SUBMIT A TRANSLATION OF THE DESCRIPTION OR TO PAY THE FEE WITHIN THE PRESCRIBED TIME-LIMIT; INVALID AB INITIO Effective date: 20111129 |
|
| PG25 | Lapsed in a contracting state [announced via postgrant information from national office to epo] |
Ref country code: MK Free format text: LAPSE BECAUSE OF FAILURE TO SUBMIT A TRANSLATION OF THE DESCRIPTION OR TO PAY THE FEE WITHIN THE PRESCRIBED TIME-LIMIT Effective date: 20190327 |
|
| GBPC | Gb: european patent ceased through non-payment of renewal fee |
Effective date: 20211129 |
|
| PG25 | Lapsed in a contracting state [announced via postgrant information from national office to epo] |
Ref country code: GB Free format text: LAPSE BECAUSE OF NON-PAYMENT OF DUE FEES Effective date: 20211129 |
|
| PG25 | Lapsed in a contracting state [announced via postgrant information from national office to epo] |
Ref country code: FR Free format text: LAPSE BECAUSE OF NON-PAYMENT OF DUE FEES Effective date: 20211130 |
|
| P01 | Opt-out of the competence of the unified patent court (upc) registered |
Effective date: 20230515 |
|
| PGFP | Annual fee paid to national office [announced via postgrant information from national office to epo] |
Ref country code: DE Payment date: 20231003 Year of fee payment: 13 |