EP2465063B1 - Graphical interface for analyte meter - Google Patents
Graphical interface for analyte meter Download PDFInfo
- Publication number
- EP2465063B1 EP2465063B1 EP10752465.4A EP10752465A EP2465063B1 EP 2465063 B1 EP2465063 B1 EP 2465063B1 EP 10752465 A EP10752465 A EP 10752465A EP 2465063 B1 EP2465063 B1 EP 2465063B1
- Authority
- EP
- European Patent Office
- Prior art keywords
- meter
- computing device
- connection
- test sensor
- transistors
- Prior art date
- Legal status (The legal status is an assumption and is not a legal conclusion. Google has not performed a legal analysis and makes no representation as to the accuracy of the status listed.)
- Active
Links
- 239000012491 analyte Substances 0.000 title claims description 19
- 238000012360 testing method Methods 0.000 claims description 87
- 238000012956 testing procedure Methods 0.000 claims description 21
- 238000005259 measurement Methods 0.000 claims description 18
- 238000012545 processing Methods 0.000 claims description 14
- 239000012530 fluid Substances 0.000 claims description 7
- XUIMIQQOPSSXEZ-UHFFFAOYSA-N Silicon Chemical compound [Si] XUIMIQQOPSSXEZ-UHFFFAOYSA-N 0.000 claims description 2
- 229910052710 silicon Inorganic materials 0.000 claims description 2
- 239000010703 silicon Substances 0.000 claims description 2
- 239000008103 glucose Substances 0.000 description 14
- 238000002955 isolation Methods 0.000 description 13
- 238000000034 method Methods 0.000 description 13
- 210000004369 blood Anatomy 0.000 description 12
- 239000008280 blood Substances 0.000 description 12
- WQZGKKKJIJFFOK-GASJEMHNSA-N Glucose Natural products OC[C@H]1OC(O)[C@H](O)[C@@H](O)[C@@H]1O WQZGKKKJIJFFOK-GASJEMHNSA-N 0.000 description 9
- 239000003153 chemical reaction reagent Substances 0.000 description 8
- 238000004891 communication Methods 0.000 description 8
- 238000006243 chemical reaction Methods 0.000 description 6
- 210000001124 body fluid Anatomy 0.000 description 5
- 239000010839 body fluid Substances 0.000 description 5
- 206010012601 diabetes mellitus Diseases 0.000 description 5
- BPYKTIZUTYGOLE-IFADSCNNSA-N Bilirubin Chemical compound N1C(=O)C(C)=C(C=C)\C1=C\C1=C(C)C(CCC(O)=O)=C(CC2=C(C(C)=C(\C=C/3C(=C(C=C)C(=O)N\3)C)N2)CCC(O)=O)N1 BPYKTIZUTYGOLE-IFADSCNNSA-N 0.000 description 4
- HVYWMOMLDIMFJA-DPAQBDIFSA-N cholesterol Chemical compound C1C=C2C[C@@H](O)CC[C@]2(C)[C@@H]2[C@@H]1[C@@H]1CC[C@H]([C@H](C)CCCC(C)C)[C@@]1(C)CC2 HVYWMOMLDIMFJA-DPAQBDIFSA-N 0.000 description 4
- 238000001514 detection method Methods 0.000 description 4
- 230000003287 optical effect Effects 0.000 description 4
- 230000008569 process Effects 0.000 description 4
- 238000012986 modification Methods 0.000 description 3
- 230000004048 modification Effects 0.000 description 3
- JVTAAEKCZFNVCJ-UHFFFAOYSA-M Lactate Chemical compound CC(O)C([O-])=O JVTAAEKCZFNVCJ-UHFFFAOYSA-M 0.000 description 2
- 238000004458 analytical method Methods 0.000 description 2
- 230000008901 benefit Effects 0.000 description 2
- 235000012000 cholesterol Nutrition 0.000 description 2
- 238000013523 data management Methods 0.000 description 2
- 238000000840 electrochemical analysis Methods 0.000 description 2
- 238000005516 engineering process Methods 0.000 description 2
- 210000003722 extracellular fluid Anatomy 0.000 description 2
- NOESYZHRGYRDHS-UHFFFAOYSA-N insulin Chemical compound N1C(=O)C(NC(=O)C(CCC(N)=O)NC(=O)C(CCC(O)=O)NC(=O)C(C(C)C)NC(=O)C(NC(=O)CN)C(C)CC)CSSCC(C(NC(CO)C(=O)NC(CC(C)C)C(=O)NC(CC=2C=CC(O)=CC=2)C(=O)NC(CCC(N)=O)C(=O)NC(CC(C)C)C(=O)NC(CCC(O)=O)C(=O)NC(CC(N)=O)C(=O)NC(CC=2C=CC(O)=CC=2)C(=O)NC(CSSCC(NC(=O)C(C(C)C)NC(=O)C(CC(C)C)NC(=O)C(CC=2C=CC(O)=CC=2)NC(=O)C(CC(C)C)NC(=O)C(C)NC(=O)C(CCC(O)=O)NC(=O)C(C(C)C)NC(=O)C(CC(C)C)NC(=O)C(CC=2NC=NC=2)NC(=O)C(CO)NC(=O)CNC2=O)C(=O)NCC(=O)NC(CCC(O)=O)C(=O)NC(CCCNC(N)=N)C(=O)NCC(=O)NC(CC=3C=CC=CC=3)C(=O)NC(CC=3C=CC=CC=3)C(=O)NC(CC=3C=CC(O)=CC=3)C(=O)NC(C(C)O)C(=O)N3C(CCC3)C(=O)NC(CCCCN)C(=O)NC(C)C(O)=O)C(=O)NC(CC(N)=O)C(O)=O)=O)NC(=O)C(C(C)CC)NC(=O)C(CO)NC(=O)C(C(C)O)NC(=O)C1CSSCC2NC(=O)C(CC(C)C)NC(=O)C(NC(=O)C(CCC(N)=O)NC(=O)C(CC(N)=O)NC(=O)C(NC(=O)C(N)CC=1C=CC=CC=1)C(C)C)CC1=CN=CN1 NOESYZHRGYRDHS-UHFFFAOYSA-N 0.000 description 2
- 238000007726 management method Methods 0.000 description 2
- 239000000463 material Substances 0.000 description 2
- 230000000007 visual effect Effects 0.000 description 2
- 229930091371 Fructose Natural products 0.000 description 1
- RFSUNEUAIZKAJO-ARQDHWQXSA-N Fructose Chemical compound OC[C@H]1O[C@](O)(CO)[C@@H](O)[C@@H]1O RFSUNEUAIZKAJO-ARQDHWQXSA-N 0.000 description 1
- 239000005715 Fructose Substances 0.000 description 1
- 102000001554 Hemoglobins Human genes 0.000 description 1
- 108010054147 Hemoglobins Proteins 0.000 description 1
- 102000004877 Insulin Human genes 0.000 description 1
- 108090001061 Insulin Proteins 0.000 description 1
- HBBGRARXTFLTSG-UHFFFAOYSA-N Lithium ion Chemical compound [Li+] HBBGRARXTFLTSG-UHFFFAOYSA-N 0.000 description 1
- 230000005856 abnormality Effects 0.000 description 1
- 230000009471 action Effects 0.000 description 1
- 230000004913 activation Effects 0.000 description 1
- 230000003321 amplification Effects 0.000 description 1
- WQZGKKKJIJFFOK-VFUOTHLCSA-N beta-D-glucose Chemical compound OC[C@H]1O[C@@H](O)[C@H](O)[C@@H](O)[C@@H]1O WQZGKKKJIJFFOK-VFUOTHLCSA-N 0.000 description 1
- 230000001419 dependent effect Effects 0.000 description 1
- 235000005911 diet Nutrition 0.000 description 1
- 230000037213 diet Effects 0.000 description 1
- 229940079593 drug Drugs 0.000 description 1
- 239000003814 drug Substances 0.000 description 1
- -1 e.g. Substances 0.000 description 1
- 230000005611 electricity Effects 0.000 description 1
- 238000003487 electrochemical reaction Methods 0.000 description 1
- 230000036541 health Effects 0.000 description 1
- 229940125396 insulin Drugs 0.000 description 1
- 150000002632 lipids Chemical class 0.000 description 1
- 239000004973 liquid crystal related substance Substances 0.000 description 1
- 229910001416 lithium ion Inorganic materials 0.000 description 1
- 238000012423 maintenance Methods 0.000 description 1
- 235000012054 meals Nutrition 0.000 description 1
- 238000013508 migration Methods 0.000 description 1
- 230000005012 migration Effects 0.000 description 1
- 238000003199 nucleic acid amplification method Methods 0.000 description 1
- 210000002381 plasma Anatomy 0.000 description 1
- 238000011160 research Methods 0.000 description 1
- 238000012552 review Methods 0.000 description 1
- 210000002966 serum Anatomy 0.000 description 1
- 230000005236 sound signal Effects 0.000 description 1
- 238000007619 statistical method Methods 0.000 description 1
- 238000012546 transfer Methods 0.000 description 1
- 150000003626 triacylglycerols Chemical class 0.000 description 1
- 210000002700 urine Anatomy 0.000 description 1
Images


Classifications
-
- A—HUMAN NECESSITIES
- A61—MEDICAL OR VETERINARY SCIENCE; HYGIENE
- A61B—DIAGNOSIS; SURGERY; IDENTIFICATION
- A61B5/00—Measuring for diagnostic purposes; Identification of persons
- A61B5/74—Details of notification to user or communication with user or patient ; user input means
- A61B5/7475—User input or interface means, e.g. keyboard, pointing device, joystick
-
- A—HUMAN NECESSITIES
- A61—MEDICAL OR VETERINARY SCIENCE; HYGIENE
- A61B—DIAGNOSIS; SURGERY; IDENTIFICATION
- A61B5/00—Measuring for diagnostic purposes; Identification of persons
- A61B5/145—Measuring characteristics of blood in vivo, e.g. gas concentration, pH value; Measuring characteristics of body fluids or tissues, e.g. interstitial fluid, cerebral tissue
- A61B5/14532—Measuring characteristics of blood in vivo, e.g. gas concentration, pH value; Measuring characteristics of body fluids or tissues, e.g. interstitial fluid, cerebral tissue for measuring glucose, e.g. by tissue impedance measurement
-
- G—PHYSICS
- G16—INFORMATION AND COMMUNICATION TECHNOLOGY [ICT] SPECIALLY ADAPTED FOR SPECIFIC APPLICATION FIELDS
- G16H—HEALTHCARE INFORMATICS, i.e. INFORMATION AND COMMUNICATION TECHNOLOGY [ICT] SPECIALLY ADAPTED FOR THE HANDLING OR PROCESSING OF MEDICAL OR HEALTHCARE DATA
- G16H40/00—ICT specially adapted for the management or administration of healthcare resources or facilities; ICT specially adapted for the management or operation of medical equipment or devices
- G16H40/60—ICT specially adapted for the management or administration of healthcare resources or facilities; ICT specially adapted for the management or operation of medical equipment or devices for the operation of medical equipment or devices
- G16H40/63—ICT specially adapted for the management or administration of healthcare resources or facilities; ICT specially adapted for the management or operation of medical equipment or devices for the operation of medical equipment or devices for local operation
-
- G—PHYSICS
- G16—INFORMATION AND COMMUNICATION TECHNOLOGY [ICT] SPECIALLY ADAPTED FOR SPECIFIC APPLICATION FIELDS
- G16Z—INFORMATION AND COMMUNICATION TECHNOLOGY [ICT] SPECIALLY ADAPTED FOR SPECIFIC APPLICATION FIELDS, NOT OTHERWISE PROVIDED FOR
- G16Z99/00—Subject matter not provided for in other main groups of this subclass
-
- A—HUMAN NECESSITIES
- A61—MEDICAL OR VETERINARY SCIENCE; HYGIENE
- A61B—DIAGNOSIS; SURGERY; IDENTIFICATION
- A61B2562/00—Details of sensors; Constructional details of sensor housings or probes; Accessories for sensors
- A61B2562/02—Details of sensors specially adapted for in-vivo measurements
- A61B2562/0295—Strip shaped analyte sensors for apparatus classified in A61B5/145 or A61B5/157
Definitions
- the present invention relates generally to methods and systems for presenting information to a user of a diagnostic system. More specifically, the methods and systems according to aspects of the present invention provide a graphical user interface for a diagnostic system. Additionally, the graphical user interface provides information for operating the diagnostic system.
- lactate, cholesterol and bilirubin are monitored in certain individuals.
- individuals with diabetes frequently check the glucose level in their body fluids to regulate the glucose intake in their diets. The results of such tests can be used to determine what, if any, insulin or other medication needs to be administered.
- Diagnostic systems such as blood-glucose systems, may employ a meter or instrument to calculate the concentration of an analyte in a sample of body fluid.
- test sensors are used to test a sample of blood.
- a test sensor contains biosensing or reagent material that reacts with the analyte, e.g., blood glucose, in the sample.
- the testing end of the sensor may be placed into contact with the fluid being tested (e.g., blood) that has accumulated on a person's finger after the finger has been pricked.
- a sufficient amount of fluid to be tested may be drawn from the testing end by capillary action to the reagent material in the sensor.
- the meter receives the test sensor and applies optical or electrochemical testing methods to by measure an output, such as current or color, from the reaction between the analyte and the reagent in the test sensor.
- Diagnostic systems typically employ a graphical user interface to display the results of the testing to the user.
- the graphical user interface may also be employed to display instructions to the user.
- document EP 1 457 913 A2 relates to a method of managing data for a plurality of analyte test instruments connected to a data communication network comprising the steps of: detecting via host computer the connection of each instrument to the data communication network; uploading data received from each instrument to the host computer; processing the upload data on the host computer for operational review; and downloading configuration data from the host computer to each test instrument, the downloaded data comprising instrument specific set up and control data.
- diagnostic systems include a meter that is configured to receive a test sensor during a testing procedure.
- the diagnostic systems also include a computing device coupled to the meter.
- the test sensor receives a fluid sample during the testing procedure.
- the meter includes a measurement system that determines a measurement of a concentration of an analyte in the fluid sample.
- the computing device receives and processes the measurement from the meter.
- the computing device has enhanced processing and presentation capabilities that provide visual and/or audio instructions on how to operate the diagnostic systems, especially when an error or exceptional condition arises.
- Diagnostic systems employ a graphical user interface (GUI), or display, that provides clear and easy-to-follow instructions for conducting the testing procedure.
- GUI graphical user interface
- a processing device in a diagnostic system executes software that is stored on computer-readable media to present illustrative graphics, textual information, and/or audio on a corresponding user interface for each step during the testing procedure.
- the user receives clear step-by-step instructions to minimize the chance of user error during the testing procedure.
- the software may enhance the presentation of instructions by employing animation.
- the GUI also presents illustrative graphics, textual information, and/or audio that guide the user through appropriate steps when an error or exceptional condition occurs during the testing procedure.
- the accuracy of the testing procedure may be affected by the temperature of the test sensor.
- the actual measurement may be corrected based on the actual test sensor temperature taken right before the reaction begins, in some cases, the accuracy of the testing procedure is improved by replacing the test sensor with one that has a temperature within a preferred range.
- the GUI presents illustrative graphics, textual information, and/or audio that instruct the user to replace the test sensor when the diagnostic system senses that the test sensor temperature is outside a preferred range.
- a diagnostic system employs a meter in combination with an external device, such as a conventional personal computer, a personal data assistant (PDA), or smart phone.
- an external device such as a conventional personal computer, a personal data assistant (PDA), or smart phone.
- the software is loaded on the external device to allow a processor of the external device to execute the software and to present illustrative graphics, textual information, and/or audio on a user interface of the external device.
- the software is a part of an data management system that is executed on the external device to manage, analyze, and present test results that have been stored by the meter.
- the data management system takes advantage of greater processing and display capabilities to provide enhanced functionality, which may not be otherwise possible with the processor and user interface on a meter.
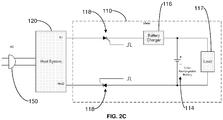
- FIG. 1 provides a non-limiting example of a diabetes-management system 10, which allows individuals to actively monitor and record measurements of their blood glucose concentration.
- the diabetes-management system 100 includes a blood-glucose meter (BGM) 110 and a computing device 120.
- a connection 140 allows the meter 110 to communicate with the computing device 120.
- the meter 110 obtains point-in-time measurements of blood-glucose concentrations in blood samples and communicates the measurement data to the computing device 120.
- the computing device 120 executes data management software 126 (executable program instructions stored on computer-readable media) to process the measurement data from the meter 110.
- the meter 110 engages a test sensor 130, which receives a blood sample for analysis.
- a test sensor 130 receives a blood sample for analysis.
- a user may employ a lancing device to pierce a finger or other area of the body to produce a blood sample at the skin surface. The user may then collect the blood sample by placing the test sensor 130 into contact with the sample.
- the test sensor may be an electrochemical test sensor or an optical test sensor.
- the meter 110 includes a reaction-detection system for measuring the glucose concentration of the blood sample collected by the test sensor 130.
- the reaction-detection system may include contacts for the electrodes to detect the electrochemical reaction for an electrochemical test sensor.
- the reaction-detection system may include an optical detector to detect the chromatic reaction for an optical test sensor.
- the meter 110 employs at least one processor 112, which executes programmed instructions according to a measurement algorithm. Data processed by the processor 112 is stored in a memory 113.
- the meter 110 includes a user interface 115 that includes a display that shows information regarding the test results.
- the computing device 120 may be selected from a variety of processing devices, such as desktop or laptop personal computers (PCs), handheld or pocket personal computers (HPCs), compatible personal digital assistants (PDAs), and smart phones.
- the processing devices may employ a variety of operating systems and configurations.
- the operating system may be a version of Microsoft® Windows® or Apple® Mac® OS.
- the computing device 120 is a smart phone, the operating system may correspond with Blackberry® devices from Research in Motion Limited or iPhone® from Apple®.
- the computing device 120 includes a processor 122 that is capable of receiving and executing any number of programmed instructions provided on computer-readable media.
- the computing device 120 includes a user interface 125 for displaying graphics, text, and/or other audiovisual content.
- the user interface 125 may be incorporated into the housing of the computing device 120, but it is understood that the user interface 125 may be a separate component, such as a display monitor, that is coupled to the computing device 120.
- the meter 110 stores test results and provides a user interface 115 to display test results
- the test results collected by the meter 110 are communicated to the computing device 120 for additional processing by the data management software 126 and display by the user interface 125.
- the software 126 on the computing device 120 provides more advanced functionality for managing, processing, and displaying test results and related information.
- the computing device 120 provides an enhanced user interface 125 that provides advanced visual and/or audio presentation capabilities.
- the computing device 120 may also allow information to be communicated to the user via audio signals.
- the computing device 120 through network connectivity, may provide the diagnostic system 10 with access to other functionality and data sources.
- the computing device 120 may provide processing and presentation capabilities that are not available with the meter 110. It is noted, however, that the meter 110 can fully operate to measure and display an analyte concentration when it is not connected to the computing device 120.
- the meter 110 includes a communications interface element 111 that enables the meter 110 to connect with the communications interface element 121 of the computing device 120.
- the communications interface elements 111 and 121 employ wired or wireless interface technologies, such as USB or Bluetooth® technology, to make the devices compatible and enable the appropriate data connections.
- the meter 110 includes a power supply 114.
- the power supply 114 may be a lithium-ion rechargeable battery that receives recharging power from the computing device 120 via the connection 140.
- the connection 140 between the meter 110 and the computing device 120 includes signal line connections as well as DC power line connections that allow the meter 110 to draw low voltage current from the computing device 120.
- some embodiments employing power line connections between the meter 110 and the computer device 120 protect the user against the danger of electric shock from the power source of the computing device 120. These embodiments provide such protection particularly when the user conducts a test while the meter 110 remains physically connected to the computing device 120.
- the computing device 120 can draw power from an AC source 150.
- the computing device 120 is normally isolated from the AC power lines to protect the user. This feature is called primary isolation and protection. However, if the primary isolation/protection for the computing device 120 fails, electricity from the AC power lines can be unsafely delivered via the computing device 120 to the user.
- the user may be shocked when touching the tip of the test strip 130.
- testing can be disabled when the meter 110 is connected to the computing device 120.
- aspects of the present invention electrically isolate the meter 110 from the computing device 120 but allow the meter 110 to remain mechanically connected to the computing device 120 during testing.
- the meter 110 is electrically isolated from power of the computing device 120 through switches and other standard isolation techniques, such as an isolated DC-DC converter.
- Isolated DC-DC converters normally use a small transformer, called a flyback transformer.
- isolated DC-DC converters allow the user to conduct testing with the meter 110 while it remains mechanically connected to the computing device 120.
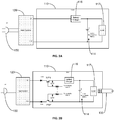
- FIGS. 2B-C illustrate example connections between the meter 110 and the computing device 120 that electrically isolate the meter 110 from the power of the computing device 120, particularly when the primary isolation/protection for the computing device fails.
- two transistors NPN and PNP during normal operation are turned on when particular voltages are supplied by the microcontroller on the meter 110 to the base input of the transistors NPN and PNP.
- the NPN transistor is turned on.
- the PNP transistor is turned on.
- the corresponding two diodes shown in FIG. 4 are forwardly biased so that the current can flow through the diodes when the transistors are turned on.
- the rechargeable battery 114 inside the meter 110 can then be charged via the battery charger 116.
- the microcontroller and other electronics inside the meter 110 are shown collectively as load 117 in FIG. 4 because they draw power from the battery 114.
- the microcontroller turns off the transistors, and the meter 110 operates solely on power from the battery 114.
- the two power lines (labeled as 5V and GND) can carry the power line voltages. Therefore, the voltage relative to the meter 110 can be as high as 310 peak volts.
- the voltage can be positive and negative.
- the diodes are inversely biased and do not conduct current.
- the NPN and PNP transistors are turned off and do not conduct current.
- the diodes and the transistors need to have a break down voltage of over 400 V to achieve adequate protection for the user.
- the values for resistors R1 and R2 shown in FIG. 2B should be sufficiently large. Their values are determined together with the hFE (amplification) of the transistors to provide sufficient protection to the user during normal operation and in the event of a break down of the primary isolation/protection.
- the embodiment of FIG. 2B can advantageously be implemented at a lower cost and with a smaller geometry, i.e., requiring less board space on the meter 110.
- the secondary isolation/protection does not necessarily have to be designed with the same level of protection as the primary isolation/protection thus minimizing cost is possible.
- thyristors 118 such as silicon controlled rectifiers (SCRs) are employed for secondary isolation/protection.
- SCRs silicon controlled rectifiers
- the SCR 118 turns on. There is no need to turn the SCR 118 off, because when there is no AC line failure, the charge current maintains the on-state of the SCR 118.
- the AC changes polarity every 1/50 (Europe) or 1/60 seconds (North America) and the SCR turns off when the polarity is reversed thereby protecting the user.
- aspects of the present invention automatically electrically isolate the meter 110 from the power source of a coupled computing device 120 when the user begins to conduct a test with the meter 110, e.g., when the user inserts the test strip 130 into the meter 110. This feature protects the user from failure of the primary isolation/protection for the computing device 120.
- the computing device 120 may be selected from a variety of processing devices, including portable computing devices.
- FIG. 3 illustrates a highly portable miniature meter 210 that is compatible with portable computing devices.
- the size of the miniature meter 210 allows it to be easily coupled to a portable computing device, such as a PALM® handheld, a Blackberry® device, or an Apple® iPhone® device, via a physical connection.
- the miniature meter 210 may be approximately 20 mm x 15 mm x 5 mm in size.
- the miniature meter 210 includes a user interface 215, which, for example, may employ graphic liquid crystal display (LCD) or organic light-emitting diode (OLED), segment LCD or OLED, or the like.
- the graphical user interface 215 may have an area up to approximately 40% of a face of the miniature meter 210 and may have a thickness of approximately 0.3 mm.
- the miniature meter 210 measures the analyte concentration of the sample on a test sensor.
- the miniature meter 210 stores the analyte concentration and the analyte concentration can be displayed on the user interface 215.
- the miniature meter 210 stores a minimum of one week of test results. This memory requirement is lower than other meters. For instance, at four tests per day, there are 28 test results for a week. Each test result requires approximately 8 bytes of storage so the total memory required would be approximately 224 bytes.
- the miniature meter 210 is coupled to an Apple® iPhone® device 220.
- the Apple® iPhone® device 220 provides more advanced functionality for managing, processing, and displaying test results and related information.
- the Apple® iPhone® device 220 includes a user interface 225 that displays information based on the data received from the miniature meter 210.
- the computing device 120 executes data management software 126 and presents data and information relating to the meter 110 on the user interface 125 of the computing device 110. Moreover, the computing device 120 can present the data and information while the meter 110 remains coupled to the computing device during testing. In particular, the user interface 125 presents clear and easy-to-follow instructions for conducting the testing procedure on the meter 110. For example, the computing device 120 executes software 126 that is stored on computer-readable media to present illustrative graphics, textual information, and/or audio for each step during the testing procedure. As such, the user receives clear step-by-step instructions to minimize the chance of user error during the testing procedure. In some embodiments, the software 126 may enhance the presentation of instructions by employing animation.
- the user interface 125 may show an animated person or character (e.g., a cartoon depiction of a health care provider, diabetes care educator, the user, or a person of the user's choice) to guide the user through the steps in a more engaging and personable manner.
- an animated person or character e.g., a cartoon depiction of a health care provider, diabetes care educator, the user, or a person of the user's choice
- the user interface 125 also shows illustrative graphics, textual information, and/or audio that guide or assist the user through appropriate steps when an error or exceptional condition occurs during the testing procedure.
- the temperature of the reagent on the test sensor 130 may affect the accuracy of the concentration of analyte calculated by the meter, as the level of reaction between the analyte and the reagent may be dependent on the temperature of the reagent.
- some embodiments of the present invention determine a temperature for the reagent and use this calculated temperature to produce a more accurate measurement of the analyte concentration.
- the meter 110 has a temperature-measuring system which provides a calculated temperature as a variable input for a measurement algorithm.
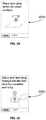
- the user interface may present illustrative graphics and textual information (as well as audio) that instruct the user to replace the test sensor when the diagnostic system senses that the test sensor temperature is outside a preferred range. Examples of such illustrative graphics and textual information are shown in FIGS. 5A-E .
- the illustrative graphics and textual information on the screen 300A shown in FIG. 5A alerts the user to an exceptional condition regarding the test sensor 130 and instructs the user to remove the test sensor 130.
- the screen 300B in FIG. 5B then instructs the user to place the removed test sensor 130 on a clean surface.
- the screen 300C instructs the user to retrieve another test sensor from a test sensor container, reminding the user how to handle the test sensors 130. Because the removed test sensor 130 has been placed on the clean surface, the user cannot accidentally select the removed test sensor 130 from the container.
- the screen 300D in FIG. 5D then instructs the user to insert the new test sensor into the meter 110, reminding the user again how to handle the test sensors 130.
- the screen 300E finally instructs the user to return the removed test sensor 130 to the test sensor container for later use.
- the user may step through the sequence of screens 300A-E corresponding to FIGS. 5A-E by operating the "Next" pushbutton when the user is ready to move to the subsequent screen.
- the user interface 125 may show an automated slideshow that loops through screens 300A-E.
- the graphical information in screens 300A-E may be shown as an animated presentation.
- the user interface 125 may provide any information that may guide or assist the user in the operation of the meter and is not limited to presenting the types of information shown in screens 300A-E.
- the user interface 125 may present screens that guide a user through a migration from one type of meter to another; such a feature would promote loyalty to a particular brand or line of meters.
- the computing device 120 includes data management software 126.
- the software 126 on the computing device 120 includes a collection of programs or computer code that receives and processes data measured by the meter 110.
- the software 126 processes and/or displays this input in a manner that is desired by the user. This information may be used by, for example, a user, home care provider (HCP), and/or a physician.
- HCP home care provider
- the software 126 can provide the advanced displays and data processing that may be required by a user who tests multiple times a day (e.g., about six to about ten times a day).
- the software 126 may include a product similar to WINGLUCOFACTS® Diabetes Management Software available from Bayer HealthCare LLC (Tarrytown, New York).
- the software 126 may provide a complete tool kit that receives and stores test results from a blood-glucose measurement system, receives and stores other testing information such as test times and meal markers, tracks test results in an electronic logbook, calculates averages and provides statistical analysis of outlier test results, summarizes and provides feedback on the test results, provides a customizable graphical user interface (GUI), displays user-friendly charts and graphs of the test results, tracks test results against user-specific target ranges, provides predictive analysis, and/or sends data to healthcare professionals via fax, email, etc.
- GUI graphical user interface
- a meter is configured as a miniature meter 210 that is highly portable and that can be coupled to a portable computing device, such as the Apple® iPhone® 220.
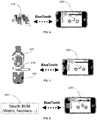
- FIG. 6 illustrates the miniature meter 210 communicating wirelessly, e.g., via Bluetooth®, with the Apple® iPhone® 220.
- the Apple® iPhone® 220 is executing data management software.
- FIG. 7 illustrates a meter that is configured as a miniature meter component 410 of an integrated lancet device 400.
- the integrated lancet device 400 combines a lancet 420 for producing a sample at a skin surface with a meter 410 for analyzing the sample.
- the meter 410 may be integral with the lancet 420 or may be removably coupled to the lancet 420.
- the meter 410 in FIG. 7 communicates wirelessly, e.g., via Bluetooth®, with the Apple® iPhone® 220. However, the communication may be via a wired connection.
- FIG. 8 illustrates a meter that is configured as a "stealth" meter 510 that is discretely configured as a watch, necklace, or the like.
- the "stealth" meter 510 in FIG. 8 communicates wirelessly, e.g., via Bluetooth®, with the Apple® iPhone® 220. However, the communication may be via a wired connection.
- the meter 110 rather than the computing device 120, may be employed to execute its own software and present information, such as that shown in screens 300A-E of FIGS. 5A-E . This is particularly advantageous in embodiments that do not allow any communication between the meter 110 and the computing device 120 when testing is being conducted with the meter.
- aspects of the present invention are not limited to blood-glucose measurement systems and are applicable to broader diagnostic systems.
- Analytes that may be analyzed include glucose, lipid profiles (e.g., cholesterol, triglycerides, LDL and HDL), microalbumin, hemoglobin A1 C fructose, lactate, or bilirubin. It is contemplated that other analyte information may be determined (e.g., analyte concentrations).
- the analytes may be in, for example, a whole blood sample, a blood serum sample, a blood plasma sample, other body fluids like ISF (interstitial fluid) and urine, and non-body fluids.
- ISF interstitial fluid
Description
- This application claims priority to
U.S. Provisional Patent Application No. 61/233,113, filed August 11, 2009 - The present invention relates generally to methods and systems for presenting information to a user of a diagnostic system. More specifically, the methods and systems according to aspects of the present invention provide a graphical user interface for a diagnostic system. Additionally, the graphical user interface provides information for operating the diagnostic system.
- The quantitative determination of analytes in body fluids is of great importance in the diagnoses and maintenance of certain physiological abnormalities. For example, lactate, cholesterol and bilirubin are monitored in certain individuals. In particular, it is important that individuals with diabetes frequently check the glucose level in their body fluids to regulate the glucose intake in their diets. The results of such tests can be used to determine what, if any, insulin or other medication needs to be administered.
- Diagnostic systems, such as blood-glucose systems, may employ a meter or instrument to calculate the concentration of an analyte in a sample of body fluid. In some types of diagnostic systems, test sensors are used to test a sample of blood. A test sensor contains biosensing or reagent material that reacts with the analyte, e.g., blood glucose, in the sample. For example, the testing end of the sensor may be placed into contact with the fluid being tested (e.g., blood) that has accumulated on a person's finger after the finger has been pricked. A sufficient amount of fluid to be tested may be drawn from the testing end by capillary action to the reagent material in the sensor. The meter receives the test sensor and applies optical or electrochemical testing methods to by measure an output, such as current or color, from the reaction between the analyte and the reagent in the test sensor. Diagnostic systems typically employ a graphical user interface to display the results of the testing to the user. The graphical user interface may also be employed to display instructions to the user.
- Diagnostic systems require the user to complete several steps during the testing procedure. The accuracy of such testing methods, however, depend on the manner in which the user completes the steps. Furthermore, document
US 2003/0176183 A1 discloses a module acting as a meter and configured to receive a test strip. This meter includes a glucose measurement circuit and can be connected to a computer. In addition,document EP 1 457 913 A2 relates to a method of managing data for a plurality of analyte test instruments connected to a data communication network comprising the steps of: detecting via host computer the connection of each instrument to the data communication network; uploading data received from each instrument to the host computer; processing the upload data on the host computer for operational review; and downloading configuration data from the host computer to each test instrument, the downloaded data comprising instrument specific set up and control data. - In view of the foregoing, it would be desirable to have systems and methods that provide a diagnostic system with a graphical user interface that provides users with clear and easy-to-follow instructions for conducting the testing procedure of diagnostic systems to produce accurate results. Moreover, it would be desirable to have a graphical user interface that provides users with instructions on how to operate the diagnostic systems when an error or exceptional condition arises.The objects are solved according to the present invention by a system according to
claim 1. - Accordingly, diagnostic systems according to aspects of the present invention include a meter that is configured to receive a test sensor during a testing procedure. The diagnostic systems also include a computing device coupled to the meter. The test sensor receives a fluid sample during the testing procedure. The meter includes a measurement system that determines a measurement of a concentration of an analyte in the fluid sample. The computing device receives and processes the measurement from the meter. In particular, the computing device has enhanced processing and presentation capabilities that provide visual and/or audio instructions on how to operate the diagnostic systems, especially when an error or exceptional condition arises.
- Diagnostic systems according to aspects of the present invention employ a graphical user interface (GUI), or display, that provides clear and easy-to-follow instructions for conducting the testing procedure. For example, a processing device in a diagnostic system executes software that is stored on computer-readable media to present illustrative graphics, textual information, and/or audio on a corresponding user interface for each step during the testing procedure. As such, the user receives clear step-by-step instructions to minimize the chance of user error during the testing procedure. In some embodiments, the software may enhance the presentation of instructions by employing animation.
- In some embodiments, the GUI also presents illustrative graphics, textual information, and/or audio that guide the user through appropriate steps when an error or exceptional condition occurs during the testing procedure. For example, because the result of the chemical reaction between the analyte and a reagent on the test sensor may vary at different temperatures, the accuracy of the testing procedure may be affected by the temperature of the test sensor. Although the actual measurement may be corrected based on the actual test sensor temperature taken right before the reaction begins, in some cases, the accuracy of the testing procedure is improved by replacing the test sensor with one that has a temperature within a preferred range. Thus, in some embodiments, the GUI presents illustrative graphics, textual information, and/or audio that instruct the user to replace the test sensor when the diagnostic system senses that the test sensor temperature is outside a preferred range.
- Although the meter may include the processing device, the software, and the GUI for presenting the illustrative graphics, textual information, and/or audio, it is understood that diagnostic systems according to the aspects of the present invention employ a variety of architectures. For example, a diagnostic system employs a meter in combination with an external device, such as a conventional personal computer, a personal data assistant (PDA), or smart phone. As such, the software is loaded on the external device to allow a processor of the external device to execute the software and to present illustrative graphics, textual information, and/or audio on a user interface of the external device. Indeed, in some embodiments, the software is a part of an data management system that is executed on the external device to manage, analyze, and present test results that have been stored by the meter. Is such embodiments, the data management system takes advantage of greater processing and display capabilities to provide enhanced functionality, which may not be otherwise possible with the processor and user interface on a meter.
- While it may be advantageous to show the illustrative graphics, textual information, and/or audio during the actual testing procedure, it is understood that the illustrative graphics and/or textual information may be shown separately as a tutorial.
- Still other aspects, features, and advantages of the present invention are readily apparent from the following detailed description, by illustrating a number of exemplary embodiments and implementations, including the best mode contemplated for carrying out the present invention. The present invention is also capable of other and different embodiments, and its several details can be modified in various respects, all without departing from the spirit and scope of the present invention. Accordingly, the drawings and descriptions are to be regarded as illustrative in nature, and not as restrictive. The invention is to cover all modifications, equivalents, and alternatives falling within the spirit and scope of the invention.
-
-
FIG. 1 illustrates an embodiment of a diagnostic system including meter and a computing device according to aspects of the present invention. -
FIG. 2A illustrates a connection between a meter and a computing device. -
FIG. 2B illustrates a connection between a meter and a computing device that provides secondary isolation/protection from the power source of the computing device, according to aspects of the present invention. -
FIG. 2C illustrates another connection between a meter and a computing device that provides secondary isolation/protection from the power source of the computing device. -
FIG. 3 illustrates a miniature blood glucose meter according to aspects of the present invention. -
FIG. 4 illustrates the miniature blood glucose meter coupled to a smart phone according to aspects of the present invention. -
FIGS. 5A-E illustrates example graphical and textual information that may be displayed by a diagnostic system according to aspects of the present invention. -
FIG. 6 illustrates an alternative embodiment of a meter according to aspects of the present invention. -
FIG. 7 illustrates another alternative embodiment of a meter according to aspects of the present invention. -
FIG. 8 illustrates yet another alternative embodiment of a meter according to aspects of the present invention. -
FIG. 1 provides a non-limiting example of a diabetes-management system 10, which allows individuals to actively monitor and record measurements of their blood glucose concentration. As shown inFIG. 1 , the diabetes-management system 100 includes a blood-glucose meter (BGM) 110 and acomputing device 120. Aconnection 140 allows themeter 110 to communicate with thecomputing device 120. Themeter 110 obtains point-in-time measurements of blood-glucose concentrations in blood samples and communicates the measurement data to thecomputing device 120. Thecomputing device 120 executes data management software 126 (executable program instructions stored on computer-readable media) to process the measurement data from themeter 110. - As illustrated in
FIG. 1 , themeter 110 engages atest sensor 130, which receives a blood sample for analysis. For example, a user may employ a lancing device to pierce a finger or other area of the body to produce a blood sample at the skin surface. The user may then collect the blood sample by placing thetest sensor 130 into contact with the sample. As is well known in the art, the test sensor may be an electrochemical test sensor or an optical test sensor. - The
meter 110 includes a reaction-detection system for measuring the glucose concentration of the blood sample collected by thetest sensor 130. For example, the reaction-detection system may include contacts for the electrodes to detect the electrochemical reaction for an electrochemical test sensor. Alternatively, the reaction-detection system may include an optical detector to detect the chromatic reaction for an optical test sensor. To calculate the actual concentration of analyte from the electrochemical or chromatic reaction measured by the reaction-detection system and to generally control the procedure for testing the sample, themeter 110 employs at least oneprocessor 112, which executes programmed instructions according to a measurement algorithm. Data processed by theprocessor 112 is stored in amemory 113. Furthermore, themeter 110 includes auser interface 115 that includes a display that shows information regarding the test results. - The
computing device 120 may be selected from a variety of processing devices, such as desktop or laptop personal computers (PCs), handheld or pocket personal computers (HPCs), compatible personal digital assistants (PDAs), and smart phones. The processing devices may employ a variety of operating systems and configurations. For example, if thecomputing device 120 is a desktop or laptop personal computer, the operating system may be a version of Microsoft® Windows® or Apple® Mac® OS. Alternatively, if thecomputing device 120 is a smart phone, the operating system may correspond with Blackberry® devices from Research in Motion Limited or iPhone® from Apple®. - The
computing device 120 includes aprocessor 122 that is capable of receiving and executing any number of programmed instructions provided on computer-readable media. In addition, thecomputing device 120 includes auser interface 125 for displaying graphics, text, and/or other audiovisual content. Theuser interface 125 may be incorporated into the housing of thecomputing device 120, but it is understood that theuser interface 125 may be a separate component, such as a display monitor, that is coupled to thecomputing device 120. - Although the
meter 110 stores test results and provides auser interface 115 to display test results, the test results collected by themeter 110 are communicated to thecomputing device 120 for additional processing by thedata management software 126 and display by theuser interface 125. Thesoftware 126 on thecomputing device 120 provides more advanced functionality for managing, processing, and displaying test results and related information. In addition, thecomputing device 120 provides anenhanced user interface 125 that provides advanced visual and/or audio presentation capabilities. In addition to providing high resolution graphics, thecomputing device 120 may also allow information to be communicated to the user via audio signals. Moreover, thecomputing device 120, through network connectivity, may provide thediagnostic system 10 with access to other functionality and data sources. - In general, the
computing device 120 may provide processing and presentation capabilities that are not available with themeter 110. It is noted, however, that themeter 110 can fully operate to measure and display an analyte concentration when it is not connected to thecomputing device 120. - As shown in
FIG. 1 , themeter 110 includes acommunications interface element 111 that enables themeter 110 to connect with thecommunications interface element 121 of thecomputing device 120. The communications interfaceelements - As shown further in
FIG. 1 , themeter 110 includes apower supply 114. Thepower supply 114 may be a lithium-ion rechargeable battery that receives recharging power from thecomputing device 120 via theconnection 140. In this embodiment, theconnection 140 between themeter 110 and thecomputing device 120 includes signal line connections as well as DC power line connections that allow themeter 110 to draw low voltage current from thecomputing device 120. - As such, some embodiments employing power line connections between the
meter 110 and thecomputer device 120 protect the user against the danger of electric shock from the power source of thecomputing device 120. These embodiments provide such protection particularly when the user conducts a test while themeter 110 remains physically connected to thecomputing device 120. As shown inFIG. 2A , thecomputing device 120 can draw power from anAC source 150. Thecomputing device 120 is normally isolated from the AC power lines to protect the user. This feature is called primary isolation and protection. However, if the primary isolation/protection for thecomputing device 120 fails, electricity from the AC power lines can be unsafely delivered via thecomputing device 120 to the user. Thus, when themeter 110 is plugged into thecomputing device 120 and the user performs a test with thetest strip 130, the user may be shocked when touching the tip of thetest strip 130. As a secondary precaution, testing can be disabled when themeter 110 is connected to thecomputing device 120. However, it is inconvenient for the user to disconnect themeter 110 from thecomputing device 120 each time to perform a test and to reconnect themeter 110 to transfer test results to thecomputing device 120. To eliminate this inconvenience, aspects of the present invention electrically isolate themeter 110 from thecomputing device 120 but allow themeter 110 to remain mechanically connected to thecomputing device 120 during testing. - In some embodiments, the
meter 110 is electrically isolated from power of thecomputing device 120 through switches and other standard isolation techniques, such as an isolated DC-DC converter. Isolated DC-DC converters normally use a small transformer, called a flyback transformer. Advantageously, isolated DC-DC converters allow the user to conduct testing with themeter 110 while it remains mechanically connected to thecomputing device 120. -
FIGS. 2B-C illustrate example connections between themeter 110 and thecomputing device 120 that electrically isolate themeter 110 from the power of thecomputing device 120, particularly when the primary isolation/protection for the computing device fails. - Referring to
FIG. 2B , two transistors NPN and PNP during normal operation are turned on when particular voltages are supplied by the microcontroller on themeter 110 to the base input of the transistors NPN and PNP. For example, when the voltage between the base and emitter of the NPN transistor is over 0.7 V, the NPN transistor is turned on. When the voltage between the base and emitter is over -0.7 V, the PNP transistor is turned on. The corresponding two diodes shown inFIG. 4 are forwardly biased so that the current can flow through the diodes when the transistors are turned on. Therechargeable battery 114 inside themeter 110 can then be charged via thebattery charger 116. The microcontroller and other electronics inside themeter 110 are shown collectively asload 117 inFIG. 4 because they draw power from thebattery 114. - Referring still to
FIG. 2B , when thetest strip 130 is received by themeter 110, the microcontroller turns off the transistors, and themeter 110 operates solely on power from thebattery 114. When the primary isolation/protection breaks down, the two power lines (labeled as 5V and GND) can carry the power line voltages. Therefore, the voltage relative to themeter 110 can be as high as 310 peak volts. The voltage can be positive and negative. When the high voltage is negative, the diodes are inversely biased and do not conduct current. When the high voltage is positive, the NPN and PNP transistors are turned off and do not conduct current. (Diodes or transistors alone will not provide sufficient protection when the polarity of the high voltage changes, as in the case of an AC power lines.) The diodes and the transistors need to have a break down voltage of over 400 V to achieve adequate protection for the user. The values for resistors R1 and R2 shown inFIG. 2B should be sufficiently large. Their values are determined together with the hFE (amplification) of the transistors to provide sufficient protection to the user during normal operation and in the event of a break down of the primary isolation/protection. - Compared to other isolation/protection techniques, such as an isolated DC-DC converter, the embodiment of
FIG. 2B can advantageously be implemented at a lower cost and with a smaller geometry, i.e., requiring less board space on themeter 110. The secondary isolation/protection does not necessarily have to be designed with the same level of protection as the primary isolation/protection thus minimizing cost is possible. - Referring to
FIG. 2C ,thyristors 118, such as silicon controlled rectifiers (SCRs), are employed for secondary isolation/protection. When the proper activation signal (short pulse) is applied to the gate input, theSCR 118 turns on. There is no need to turn theSCR 118 off, because when there is no AC line failure, the charge current maintains the on-state of theSCR 118. In the event of AC line failure, the AC changes polarity every 1/50 (Europe) or 1/60 seconds (North America) and the SCR turns off when the polarity is reversed thereby protecting the user. - In sum, aspects of the present invention automatically electrically isolate the
meter 110 from the power source of a coupledcomputing device 120 when the user begins to conduct a test with themeter 110, e.g., when the user inserts thetest strip 130 into themeter 110. This feature protects the user from failure of the primary isolation/protection for thecomputing device 120. - As described previously, the
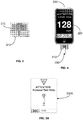
computing device 120 may be selected from a variety of processing devices, including portable computing devices.FIG. 3 illustrates a highly portableminiature meter 210 that is compatible with portable computing devices. The size of theminiature meter 210 allows it to be easily coupled to a portable computing device, such as a PALM® handheld, a Blackberry® device, or an Apple® iPhone® device, via a physical connection. For example, theminiature meter 210 may be approximately 20 mm x 15 mm x 5 mm in size. Theminiature meter 210 includes auser interface 215, which, for example, may employ graphic liquid crystal display (LCD) or organic light-emitting diode (OLED), segment LCD or OLED, or the like. Thegraphical user interface 215 may have an area up to approximately 40% of a face of theminiature meter 210 and may have a thickness of approximately 0.3 mm. - As shown in
FIG. 4 , theminiature meter 210 measures the analyte concentration of the sample on a test sensor. Theminiature meter 210 stores the analyte concentration and the analyte concentration can be displayed on theuser interface 215. For example, theminiature meter 210 stores a minimum of one week of test results. This memory requirement is lower than other meters. For instance, at four tests per day, there are 28 test results for a week. Each test result requires approximately 8 bytes of storage so the total memory required would be approximately 224 bytes. - As further illustrated in
FIG. 4 , theminiature meter 210 is coupled to an Apple®iPhone® device 220. The Apple®iPhone® device 220 provides more advanced functionality for managing, processing, and displaying test results and related information. In particular, the Apple®iPhone® device 220 includes auser interface 225 that displays information based on the data received from theminiature meter 210. - Generally, the
computing device 120 executesdata management software 126 and presents data and information relating to themeter 110 on theuser interface 125 of thecomputing device 110. Moreover, thecomputing device 120 can present the data and information while themeter 110 remains coupled to the computing device during testing. In particular, theuser interface 125 presents clear and easy-to-follow instructions for conducting the testing procedure on themeter 110. For example, thecomputing device 120 executessoftware 126 that is stored on computer-readable media to present illustrative graphics, textual information, and/or audio for each step during the testing procedure. As such, the user receives clear step-by-step instructions to minimize the chance of user error during the testing procedure. In some embodiments, thesoftware 126 may enhance the presentation of instructions by employing animation. For example, theuser interface 125 may show an animated person or character (e.g., a cartoon depiction of a health care provider, diabetes care educator, the user, or a person of the user's choice) to guide the user through the steps in a more engaging and personable manner. - In some embodiments, the
user interface 125 also shows illustrative graphics, textual information, and/or audio that guide or assist the user through appropriate steps when an error or exceptional condition occurs during the testing procedure. For example, the temperature of the reagent on thetest sensor 130 may affect the accuracy of the concentration of analyte calculated by the meter, as the level of reaction between the analyte and the reagent may be dependent on the temperature of the reagent. As such, some embodiments of the present invention determine a temperature for the reagent and use this calculated temperature to produce a more accurate measurement of the analyte concentration. In particular, themeter 110 has a temperature-measuring system which provides a calculated temperature as a variable input for a measurement algorithm. Although the actual measurement is corrected based on the actual test sensor temperature, in some cases, however, the accuracy of the testing procedure is improved by replacing thetest sensor 130 with one that has a temperature within a preferred range, e.g., closer to the ambient temperature. Thus, when the temperature-measuring system determines that the temperature of thetest sensor 130 is not in an acceptable range, the user interface may present illustrative graphics and textual information (as well as audio) that instruct the user to replace the test sensor when the diagnostic system senses that the test sensor temperature is outside a preferred range. Examples of such illustrative graphics and textual information are shown inFIGS. 5A-E . - The illustrative graphics and textual information on the
screen 300A shown inFIG. 5A alerts the user to an exceptional condition regarding thetest sensor 130 and instructs the user to remove thetest sensor 130. Thescreen 300B inFIG. 5B then instructs the user to place the removedtest sensor 130 on a clean surface. As shown inFIG. 5C , thescreen 300C instructs the user to retrieve another test sensor from a test sensor container, reminding the user how to handle thetest sensors 130. Because the removedtest sensor 130 has been placed on the clean surface, the user cannot accidentally select the removedtest sensor 130 from the container. Thescreen 300D inFIG. 5D then instructs the user to insert the new test sensor into themeter 110, reminding the user again how to handle thetest sensors 130. As shown inFIG. 5E , thescreen 300E finally instructs the user to return the removedtest sensor 130 to the test sensor container for later use. - The user may step through the sequence of
screens 300A-E corresponding toFIGS. 5A-E by operating the "Next" pushbutton when the user is ready to move to the subsequent screen. Alternatively, theuser interface 125 may show an automated slideshow that loops throughscreens 300A-E. Alternatively, as discussed previously, the graphical information inscreens 300A-E may be shown as an animated presentation. - While it may be advantageous to present the illustrative graphics, textual information, and/or audio during the actual testing procedure or operation of the
meter 110, it is understood that the illustrative graphics, textual information, and/or audio may be shown separately as a tutorial. Furthermore, it is understood that theuser interface 125 may provide any information that may guide or assist the user in the operation of the meter and is not limited to presenting the types of information shown inscreens 300A-E. For example, theuser interface 125 may present screens that guide a user through a migration from one type of meter to another; such a feature would promote loyalty to a particular brand or line of meters. - As described previously, the
computing device 120 includesdata management software 126. Thesoftware 126 on thecomputing device 120 includes a collection of programs or computer code that receives and processes data measured by themeter 110. Thesoftware 126 processes and/or displays this input in a manner that is desired by the user. This information may be used by, for example, a user, home care provider (HCP), and/or a physician. Advantageously, thesoftware 126 can provide the advanced displays and data processing that may be required by a user who tests multiple times a day (e.g., about six to about ten times a day). For example, thesoftware 126 may include a product similar to WINGLUCOFACTS® Diabetes Management Software available from Bayer HealthCare LLC (Tarrytown, New York). As such, thesoftware 126 may provide a complete tool kit that receives and stores test results from a blood-glucose measurement system, receives and stores other testing information such as test times and meal markers, tracks test results in an electronic logbook, calculates averages and provides statistical analysis of outlier test results, summarizes and provides feedback on the test results, provides a customizable graphical user interface (GUI), displays user-friendly charts and graphs of the test results, tracks test results against user-specific target ranges, provides predictive analysis, and/or sends data to healthcare professionals via fax, email, etc. - Diagnostic systems according to the aspects of the present invention employ a variety of architectures and configurations. As described previously with reference to
FIG. 4 , a meter is configured as aminiature meter 210 that is highly portable and that can be coupled to a portable computing device, such as the Apple® iPhone® 220. In an alternative embodiment, howeverFIG. 6 illustrates theminiature meter 210 communicating wirelessly, e.g., via Bluetooth®, with the Apple® iPhone® 220. As shown inFIG. 5 , the Apple® iPhone® 220 is executing data management software. - In another alternative embodiment,
FIG. 7 illustrates a meter that is configured as aminiature meter component 410 of anintegrated lancet device 400. Theintegrated lancet device 400 combines alancet 420 for producing a sample at a skin surface with ameter 410 for analyzing the sample. Themeter 410 may be integral with thelancet 420 or may be removably coupled to thelancet 420. By way of example, themeter 410 inFIG. 7 communicates wirelessly, e.g., via Bluetooth®, with the Apple® iPhone® 220. However, the communication may be via a wired connection. - In yet another embodiment,
FIG. 8 illustrates a meter that is configured as a "stealth"meter 510 that is discretely configured as a watch, necklace, or the like. By way of example, the "stealth"meter 510 inFIG. 8 communicates wirelessly, e.g., via Bluetooth®, with the Apple® iPhone® 220. However, the communication may be via a wired connection. - It is understood that the
meter 110, rather than thecomputing device 120, may be employed to execute its own software and present information, such as that shown inscreens 300A-E ofFIGS. 5A-E . This is particularly advantageous in embodiments that do not allow any communication between themeter 110 and thecomputing device 120 when testing is being conducted with the meter. - Furthermore, it is also understood that aspects of the present invention are not limited to blood-glucose measurement systems and are applicable to broader diagnostic systems. Analytes that may be analyzed include glucose, lipid profiles (e.g., cholesterol, triglycerides, LDL and HDL), microalbumin, hemoglobin A1C fructose, lactate, or bilirubin. It is contemplated that other analyte information may be determined (e.g., analyte concentrations). The analytes may be in, for example, a whole blood sample, a blood serum sample, a blood plasma sample, other body fluids like ISF (interstitial fluid) and urine, and non-body fluids.
- While the invention is susceptible to various modifications and alternative forms, specific embodiments and methods thereof have been shown by way of example in the drawings and are described in detail herein. It should be understood, however, that it is not intended to limit the invention to the particular forms or methods disclosed, but, to the contrary, the intention is to cover all modifications, equivalents and alternatives falling within the spirit and scope of the invention.
Claims (10)
- A system (10) for determining an analyte concentration in a fluid sample, the system (10) comprising:a meter (110) that is configured to receive a test sensor (130) during a testing procedure, the test sensor (130) receiving a fluid sample during the testing procedure, the meter (110) including a measurement system (112, 113) that determines a measurement of a concentration of an analyte in the fluid sample, the meter (110) including a rechargeable battery (114) and a connection (140), the connection (140) being configured to electrically and mechanically couple the meter (110) to external computing devices; anda computing device (120) electrically and mechanically coupled to the meter (110) via the connection (140), the computing device (120) receiving and processing the measurement from the meter (110), the computing device (120) including a power source (150), characterized in that the rechargeable battery (114) of the meter (110) is rechargeable with power from the power source (150), wherein the meter (110) receives the power via the connection (140),wherein the connection (140) is configured to electrically isolate the meter (110) from the power source of the computing device (120) when the testing procedure is initiated while the meter (110) remains mechanically coupled to the computing device (120) via the connection (140).
- The system (10) of claim 1, wherein the testing procedure is initiated upon the meter (110) receiving the test sensor (130).
- The system (10) of claim 1, wherein the connection (140) includes an isolated DC-DC converter.
- The system (10) of claim 1, wherein the meter (110) includes a microcontroller and the connection (140) includes a transistor and a diode, the microcontroller turning the transistor on and current flowing through the diode from the computing device (120) when the test sensor (130) is not received by the meter (110), and the microcontroller turning the transistor off and the meter (110) operating solely on power from the battery when the test sensor (130) is received by the meter (110).
- The system (10) of claim 5, wherein the transistor and the diode operate to prevent the flow of current from the computing device (120) when a high voltage occurs over the connection due to a failure on the computing device (120).
- The system (10) of claim 1, wherein the connection (140) includes a silicon controlled rectifier (SCR), the SCR turning off when a failure occurs on the computing device (120) and a reversal of polarity occurs at the SCR with a resulting flow of alternating current.
- The system (10) of claim 1, wherein the connection (140) includes signal line connections and DC power line connections configured to transmit low voltage current from the computing device (120) to the meter (110).
- The system (10) of claim 1, wherein the connection (140) includes first and second transistors with first and second diodes forwardly biased such that current flows through the diodes when the transistors are turned on.
- The system (10) of claim 8, wherein the meter (110) includes a microcontroller connected to the first and second transistors, and wherein the transistors are turned on when the microcontroller supplies minimum voltages to the base inputs of the transistors.
- The system (10) of claim 8, wherein the connection (140) further includes first and second resistors connected to the first and second transistors, respectively.
Priority Applications (1)
| Application Number | Priority Date | Filing Date | Title |
|---|---|---|---|
| EP18154034.5A EP3352108B1 (en) | 2009-08-11 | 2010-08-11 | Graphical interface for analyte meter |
Applications Claiming Priority (2)
| Application Number | Priority Date | Filing Date | Title |
|---|---|---|---|
| US23311309P | 2009-08-11 | 2009-08-11 | |
| PCT/US2010/045175 WO2011019820A2 (en) | 2009-08-11 | 2010-08-11 | Graphical interface for analyte meter |
Related Child Applications (1)
| Application Number | Title | Priority Date | Filing Date |
|---|---|---|---|
| EP18154034.5A Division EP3352108B1 (en) | 2009-08-11 | 2010-08-11 | Graphical interface for analyte meter |
Publications (2)
| Publication Number | Publication Date |
|---|---|
| EP2465063A2 EP2465063A2 (en) | 2012-06-20 |
| EP2465063B1 true EP2465063B1 (en) | 2018-01-31 |
Family
ID=43086837
Family Applications (2)
| Application Number | Title | Priority Date | Filing Date |
|---|---|---|---|
| EP18154034.5A Active EP3352108B1 (en) | 2009-08-11 | 2010-08-11 | Graphical interface for analyte meter |
| EP10752465.4A Active EP2465063B1 (en) | 2009-08-11 | 2010-08-11 | Graphical interface for analyte meter |
Family Applications Before (1)
| Application Number | Title | Priority Date | Filing Date |
|---|---|---|---|
| EP18154034.5A Active EP3352108B1 (en) | 2009-08-11 | 2010-08-11 | Graphical interface for analyte meter |
Country Status (5)
| Country | Link |
|---|---|
| US (1) | US20120142084A1 (en) |
| EP (2) | EP3352108B1 (en) |
| JP (1) | JP2013501940A (en) |
| ES (1) | ES2903107T3 (en) |
| WO (1) | WO2011019820A2 (en) |
Families Citing this family (4)
| Publication number | Priority date | Publication date | Assignee | Title |
|---|---|---|---|---|
| CA2935945A1 (en) * | 2014-01-10 | 2015-07-16 | Ascensia Diabetes Care Holdings Ag | Methods and apparatus for representing blood glucose variation graphically |
| US9689753B2 (en) * | 2014-05-22 | 2017-06-27 | Roche Diabetes Care, Inc. | Handheld analyte meter with recharging control for improved analyte testing |
| US10436773B2 (en) | 2016-01-18 | 2019-10-08 | Jana Care, Inc. | Mobile device based multi-analyte testing analyzer for use in medical diagnostic monitoring and screening |
| US11536732B2 (en) | 2020-03-13 | 2022-12-27 | Jana Care, Inc. | Devices, systems, and methods for measuring biomarkers in biological fluids |
Citations (1)
| Publication number | Priority date | Publication date | Assignee | Title |
|---|---|---|---|---|
| EP1457913A2 (en) * | 1998-07-31 | 2004-09-15 | Abbott Laboratories | Method of managing data for a plurality of analyte test instruments |
Family Cites Families (6)
| Publication number | Priority date | Publication date | Assignee | Title |
|---|---|---|---|---|
| US6699188B2 (en) * | 2000-06-22 | 2004-03-02 | Guidance Interactive Technologies | Interactive reward devices and methods |
| WO2002078512A2 (en) * | 2001-04-02 | 2002-10-10 | Therasense, Inc. | Blood glucose tracking apparatus and methods |
| JP2003302406A (en) * | 2002-04-05 | 2003-10-24 | Sony Corp | Self blood sugar measurement system and self-blood sugar measurement unit |
| KR100472092B1 (en) * | 2002-05-14 | 2005-03-08 | 주식회사 헬스피아 | A blood sugar test device using a wireless phone and a method to transmit the blood sugar level to internet server |
| US9529762B2 (en) * | 2003-06-30 | 2016-12-27 | Becton, Dickinson And Company | Self powered serial-to-serial or USB-to-serial cable with loopback and isolation |
| US8696597B2 (en) * | 2006-04-03 | 2014-04-15 | Nipro Diagnostics, Inc. | Diagnostic meter |
-
2010
- 2010-08-11 EP EP18154034.5A patent/EP3352108B1/en active Active
- 2010-08-11 ES ES18154034T patent/ES2903107T3/en active Active
- 2010-08-11 WO PCT/US2010/045175 patent/WO2011019820A2/en active Application Filing
- 2010-08-11 EP EP10752465.4A patent/EP2465063B1/en active Active
- 2010-08-11 US US13/389,778 patent/US20120142084A1/en not_active Abandoned
- 2010-08-11 JP JP2012524840A patent/JP2013501940A/en active Pending
Patent Citations (1)
| Publication number | Priority date | Publication date | Assignee | Title |
|---|---|---|---|---|
| EP1457913A2 (en) * | 1998-07-31 | 2004-09-15 | Abbott Laboratories | Method of managing data for a plurality of analyte test instruments |
Also Published As
| Publication number | Publication date |
|---|---|
| EP2465063A2 (en) | 2012-06-20 |
| WO2011019820A4 (en) | 2011-07-28 |
| WO2011019820A2 (en) | 2011-02-17 |
| JP2013501940A (en) | 2013-01-17 |
| US20120142084A1 (en) | 2012-06-07 |
| ES2903107T3 (en) | 2022-03-31 |
| WO2011019820A3 (en) | 2011-05-05 |
| EP3352108A1 (en) | 2018-07-25 |
| EP3352108B1 (en) | 2021-10-06 |
Similar Documents
| Publication | Publication Date | Title |
|---|---|---|
| US9770202B2 (en) | Modular analyte measurement system with extendable strip port | |
| JP5718947B2 (en) | Analyte testing method and system for reporting high blood sugar and low blood sugar trends | |
| JP5329562B2 (en) | Test system | |
| US20170319113A1 (en) | Modular Analyte Measurement Systems, Modular Components Thereof and Related Methods | |
| US20100331654A1 (en) | Systems for diabetes management and methods | |
| US9320432B2 (en) | Analyte meter communication module | |
| US20140081662A1 (en) | Sensor-Based Informatics Telemedicine Disease Management Solution | |
| JP5855118B2 (en) | Analyte test method and system with high and low analyte trend notification | |
| JP2014502858A (en) | Analyte test method and system with high and low analyte trend notification | |
| US20140318987A1 (en) | Analyte meter test strip detection | |
| EP2465063B1 (en) | Graphical interface for analyte meter | |
| US20180130551A1 (en) | Blood glucose management device for calculating bolus insulin | |
| US20150044650A1 (en) | Positive reinforcement messages to users based on analytics of prior physiological measurements | |
| WO2014178085A2 (en) | A system integrated with communicating device for medical analysis of biological matter | |
| KR20130116290A (en) | Analyte testing method and system with high and low analyte trends notification |
Legal Events
| Date | Code | Title | Description |
|---|---|---|---|
| PUAI | Public reference made under article 153(3) epc to a published international application that has entered the european phase |
Free format text: ORIGINAL CODE: 0009012 |
|
| 17P | Request for examination filed |
Effective date: 20120312 |
|
| AK | Designated contracting states |
Kind code of ref document: A2 Designated state(s): AL AT BE BG CH CY CZ DE DK EE ES FI FR GB GR HR HU IE IS IT LI LT LU LV MC MK MT NL NO PL PT RO SE SI SK SM TR |
|
| DAX | Request for extension of the european patent (deleted) | ||
| RAP1 | Party data changed (applicant data changed or rights of an application transferred) |
Owner name: BAYER HEALTHCARE LLC |
|
| 17Q | First examination report despatched |
Effective date: 20150710 |
|
| RAP1 | Party data changed (applicant data changed or rights of an application transferred) |
Owner name: ASCENSIA DIABETES CARE HOLDINGS AG |
|
| GRAP | Despatch of communication of intention to grant a patent |
Free format text: ORIGINAL CODE: EPIDOSNIGR1 |
|
| STAA | Information on the status of an ep patent application or granted ep patent |
Free format text: STATUS: GRANT OF PATENT IS INTENDED |
|
| INTG | Intention to grant announced |
Effective date: 20170811 |
|
| GRAS | Grant fee paid |
Free format text: ORIGINAL CODE: EPIDOSNIGR3 |
|
| GRAA | (expected) grant |
Free format text: ORIGINAL CODE: 0009210 |
|
| STAA | Information on the status of an ep patent application or granted ep patent |
Free format text: STATUS: THE PATENT HAS BEEN GRANTED |
|
| AK | Designated contracting states |
Kind code of ref document: B1 Designated state(s): AL AT BE BG CH CY CZ DE DK EE ES FI FR GB GR HR HU IE IS IT LI LT LU LV MC MK MT NL NO PL PT RO SE SI SK SM TR |
|
| REG | Reference to a national code |
Ref country code: GB Ref legal event code: FG4D Ref country code: CH Ref legal event code: EP |
|
| REG | Reference to a national code |
Ref country code: AT Ref legal event code: REF Ref document number: 967963 Country of ref document: AT Kind code of ref document: T Effective date: 20180215 |
|
| REG | Reference to a national code |
Ref country code: IE Ref legal event code: FG4D |
|
| REG | Reference to a national code |
Ref country code: DE Ref legal event code: R096 Ref document number: 602010048350 Country of ref document: DE |
|
| REG | Reference to a national code |
Ref country code: NL Ref legal event code: MP Effective date: 20180131 |
|
| REG | Reference to a national code |
Ref country code: LT Ref legal event code: MG4D |
|
| REG | Reference to a national code |
Ref country code: AT Ref legal event code: MK05 Ref document number: 967963 Country of ref document: AT Kind code of ref document: T Effective date: 20180131 |
|
| PG25 | Lapsed in a contracting state [announced via postgrant information from national office to epo] |
Ref country code: FI Free format text: LAPSE BECAUSE OF FAILURE TO SUBMIT A TRANSLATION OF THE DESCRIPTION OR TO PAY THE FEE WITHIN THE PRESCRIBED TIME-LIMIT Effective date: 20180131 Ref country code: HR Free format text: LAPSE BECAUSE OF FAILURE TO SUBMIT A TRANSLATION OF THE DESCRIPTION OR TO PAY THE FEE WITHIN THE PRESCRIBED TIME-LIMIT Effective date: 20180131 Ref country code: NO Free format text: LAPSE BECAUSE OF FAILURE TO SUBMIT A TRANSLATION OF THE DESCRIPTION OR TO PAY THE FEE WITHIN THE PRESCRIBED TIME-LIMIT Effective date: 20180430 Ref country code: ES Free format text: LAPSE BECAUSE OF FAILURE TO SUBMIT A TRANSLATION OF THE DESCRIPTION OR TO PAY THE FEE WITHIN THE PRESCRIBED TIME-LIMIT Effective date: 20180131 Ref country code: LT Free format text: LAPSE BECAUSE OF FAILURE TO SUBMIT A TRANSLATION OF THE DESCRIPTION OR TO PAY THE FEE WITHIN THE PRESCRIBED TIME-LIMIT Effective date: 20180131 Ref country code: NL Free format text: LAPSE BECAUSE OF FAILURE TO SUBMIT A TRANSLATION OF THE DESCRIPTION OR TO PAY THE FEE WITHIN THE PRESCRIBED TIME-LIMIT Effective date: 20180131 |
|
| REG | Reference to a national code |
Ref country code: FR Ref legal event code: PLFP Year of fee payment: 9 |
|
| PG25 | Lapsed in a contracting state [announced via postgrant information from national office to epo] |
Ref country code: BG Free format text: LAPSE BECAUSE OF FAILURE TO SUBMIT A TRANSLATION OF THE DESCRIPTION OR TO PAY THE FEE WITHIN THE PRESCRIBED TIME-LIMIT Effective date: 20180430 Ref country code: IS Free format text: LAPSE BECAUSE OF FAILURE TO SUBMIT A TRANSLATION OF THE DESCRIPTION OR TO PAY THE FEE WITHIN THE PRESCRIBED TIME-LIMIT Effective date: 20180531 Ref country code: SE Free format text: LAPSE BECAUSE OF FAILURE TO SUBMIT A TRANSLATION OF THE DESCRIPTION OR TO PAY THE FEE WITHIN THE PRESCRIBED TIME-LIMIT Effective date: 20180131 Ref country code: LV Free format text: LAPSE BECAUSE OF FAILURE TO SUBMIT A TRANSLATION OF THE DESCRIPTION OR TO PAY THE FEE WITHIN THE PRESCRIBED TIME-LIMIT Effective date: 20180131 Ref country code: AT Free format text: LAPSE BECAUSE OF FAILURE TO SUBMIT A TRANSLATION OF THE DESCRIPTION OR TO PAY THE FEE WITHIN THE PRESCRIBED TIME-LIMIT Effective date: 20180131 Ref country code: PL Free format text: LAPSE BECAUSE OF FAILURE TO SUBMIT A TRANSLATION OF THE DESCRIPTION OR TO PAY THE FEE WITHIN THE PRESCRIBED TIME-LIMIT Effective date: 20180131 Ref country code: GR Free format text: LAPSE BECAUSE OF FAILURE TO SUBMIT A TRANSLATION OF THE DESCRIPTION OR TO PAY THE FEE WITHIN THE PRESCRIBED TIME-LIMIT Effective date: 20180501 |
|
| PG25 | Lapsed in a contracting state [announced via postgrant information from national office to epo] |
Ref country code: EE Free format text: LAPSE BECAUSE OF FAILURE TO SUBMIT A TRANSLATION OF THE DESCRIPTION OR TO PAY THE FEE WITHIN THE PRESCRIBED TIME-LIMIT Effective date: 20180131 Ref country code: RO Free format text: LAPSE BECAUSE OF FAILURE TO SUBMIT A TRANSLATION OF THE DESCRIPTION OR TO PAY THE FEE WITHIN THE PRESCRIBED TIME-LIMIT Effective date: 20180131 Ref country code: IT Free format text: LAPSE BECAUSE OF FAILURE TO SUBMIT A TRANSLATION OF THE DESCRIPTION OR TO PAY THE FEE WITHIN THE PRESCRIBED TIME-LIMIT Effective date: 20180131 Ref country code: AL Free format text: LAPSE BECAUSE OF FAILURE TO SUBMIT A TRANSLATION OF THE DESCRIPTION OR TO PAY THE FEE WITHIN THE PRESCRIBED TIME-LIMIT Effective date: 20180131 |
|
| REG | Reference to a national code |
Ref country code: DE Ref legal event code: R097 Ref document number: 602010048350 Country of ref document: DE |
|
| REG | Reference to a national code |
Ref country code: DE Ref legal event code: R079 Ref document number: 602010048350 Country of ref document: DE Free format text: PREVIOUS MAIN CLASS: G06F0019000000 Ipc: G16Z0099000000 |
|
| PG25 | Lapsed in a contracting state [announced via postgrant information from national office to epo] |
Ref country code: CZ Free format text: LAPSE BECAUSE OF FAILURE TO SUBMIT A TRANSLATION OF THE DESCRIPTION OR TO PAY THE FEE WITHIN THE PRESCRIBED TIME-LIMIT Effective date: 20180131 Ref country code: SK Free format text: LAPSE BECAUSE OF FAILURE TO SUBMIT A TRANSLATION OF THE DESCRIPTION OR TO PAY THE FEE WITHIN THE PRESCRIBED TIME-LIMIT Effective date: 20180131 Ref country code: SM Free format text: LAPSE BECAUSE OF FAILURE TO SUBMIT A TRANSLATION OF THE DESCRIPTION OR TO PAY THE FEE WITHIN THE PRESCRIBED TIME-LIMIT Effective date: 20180131 Ref country code: DK Free format text: LAPSE BECAUSE OF FAILURE TO SUBMIT A TRANSLATION OF THE DESCRIPTION OR TO PAY THE FEE WITHIN THE PRESCRIBED TIME-LIMIT Effective date: 20180131 |
|
| PLBE | No opposition filed within time limit |
Free format text: ORIGINAL CODE: 0009261 |
|
| STAA | Information on the status of an ep patent application or granted ep patent |
Free format text: STATUS: NO OPPOSITION FILED WITHIN TIME LIMIT |
|
| 26N | No opposition filed |
Effective date: 20181102 |
|
| PG25 | Lapsed in a contracting state [announced via postgrant information from national office to epo] |
Ref country code: SI Free format text: LAPSE BECAUSE OF FAILURE TO SUBMIT A TRANSLATION OF THE DESCRIPTION OR TO PAY THE FEE WITHIN THE PRESCRIBED TIME-LIMIT Effective date: 20180131 |
|
| PG25 | Lapsed in a contracting state [announced via postgrant information from national office to epo] |
Ref country code: MC Free format text: LAPSE BECAUSE OF FAILURE TO SUBMIT A TRANSLATION OF THE DESCRIPTION OR TO PAY THE FEE WITHIN THE PRESCRIBED TIME-LIMIT Effective date: 20180131 |
|
| PG25 | Lapsed in a contracting state [announced via postgrant information from national office to epo] |
Ref country code: LU Free format text: LAPSE BECAUSE OF NON-PAYMENT OF DUE FEES Effective date: 20180811 |
|
| REG | Reference to a national code |
Ref country code: BE Ref legal event code: MM Effective date: 20180831 |
|
| REG | Reference to a national code |
Ref country code: IE Ref legal event code: MM4A |
|
| PG25 | Lapsed in a contracting state [announced via postgrant information from national office to epo] |
Ref country code: IE Free format text: LAPSE BECAUSE OF NON-PAYMENT OF DUE FEES Effective date: 20180811 |
|
| PG25 | Lapsed in a contracting state [announced via postgrant information from national office to epo] |
Ref country code: BE Free format text: LAPSE BECAUSE OF NON-PAYMENT OF DUE FEES Effective date: 20180831 |
|
| PG25 | Lapsed in a contracting state [announced via postgrant information from national office to epo] |
Ref country code: MT Free format text: LAPSE BECAUSE OF NON-PAYMENT OF DUE FEES Effective date: 20180811 |
|
| PG25 | Lapsed in a contracting state [announced via postgrant information from national office to epo] |
Ref country code: TR Free format text: LAPSE BECAUSE OF FAILURE TO SUBMIT A TRANSLATION OF THE DESCRIPTION OR TO PAY THE FEE WITHIN THE PRESCRIBED TIME-LIMIT Effective date: 20180131 |
|
| PG25 | Lapsed in a contracting state [announced via postgrant information from national office to epo] |
Ref country code: HU Free format text: LAPSE BECAUSE OF FAILURE TO SUBMIT A TRANSLATION OF THE DESCRIPTION OR TO PAY THE FEE WITHIN THE PRESCRIBED TIME-LIMIT; INVALID AB INITIO Effective date: 20100811 Ref country code: PT Free format text: LAPSE BECAUSE OF FAILURE TO SUBMIT A TRANSLATION OF THE DESCRIPTION OR TO PAY THE FEE WITHIN THE PRESCRIBED TIME-LIMIT Effective date: 20180131 |
|
| PG25 | Lapsed in a contracting state [announced via postgrant information from national office to epo] |
Ref country code: CY Free format text: LAPSE BECAUSE OF FAILURE TO SUBMIT A TRANSLATION OF THE DESCRIPTION OR TO PAY THE FEE WITHIN THE PRESCRIBED TIME-LIMIT Effective date: 20180131 Ref country code: MK Free format text: LAPSE BECAUSE OF NON-PAYMENT OF DUE FEES Effective date: 20180131 |
|
| PGFP | Annual fee paid to national office [announced via postgrant information from national office to epo] |
Ref country code: CH Payment date: 20200903 Year of fee payment: 11 |
|
| REG | Reference to a national code |
Ref country code: CH Ref legal event code: PL |
|
| PG25 | Lapsed in a contracting state [announced via postgrant information from national office to epo] |
Ref country code: LI Free format text: LAPSE BECAUSE OF NON-PAYMENT OF DUE FEES Effective date: 20210831 Ref country code: CH Free format text: LAPSE BECAUSE OF NON-PAYMENT OF DUE FEES Effective date: 20210831 |
|
| P01 | Opt-out of the competence of the unified patent court (upc) registered |
Effective date: 20230512 |
|
| PGFP | Annual fee paid to national office [announced via postgrant information from national office to epo] |
Ref country code: GB Payment date: 20230828 Year of fee payment: 14 |
|
| PGFP | Annual fee paid to national office [announced via postgrant information from national office to epo] |
Ref country code: FR Payment date: 20230825 Year of fee payment: 14 Ref country code: DE Payment date: 20230829 Year of fee payment: 14 |