EP2424435B1 - Performance reports associated with continuous sensor data from multiple analysis time periods - Google Patents
Performance reports associated with continuous sensor data from multiple analysis time periods Download PDFInfo
- Publication number
- EP2424435B1 EP2424435B1 EP10770372.0A EP10770372A EP2424435B1 EP 2424435 B1 EP2424435 B1 EP 2424435B1 EP 10770372 A EP10770372 A EP 10770372A EP 2424435 B1 EP2424435 B1 EP 2424435B1
- Authority
- EP
- European Patent Office
- Prior art keywords
- host
- analysis time
- time period
- analyte
- performance
- Prior art date
- Legal status (The legal status is an assumption and is not a legal conclusion. Google has not performed a legal analysis and makes no representation as to the accuracy of the status listed.)
- Active
Links
- 238000004458 analytical method Methods 0.000 title claims description 146
- WQZGKKKJIJFFOK-GASJEMHNSA-N Glucose Natural products OC[C@H]1OC(O)[C@H](O)[C@@H](O)[C@@H]1O WQZGKKKJIJFFOK-GASJEMHNSA-N 0.000 claims description 116
- 239000008103 glucose Substances 0.000 claims description 116
- 239000012491 analyte Substances 0.000 claims description 99
- 238000000034 method Methods 0.000 claims description 46
- 238000013500 data storage Methods 0.000 claims description 20
- 230000004044 response Effects 0.000 claims description 8
- 230000008859 change Effects 0.000 claims description 5
- 230000005540 biological transmission Effects 0.000 claims 1
- 230000000977 initiatory effect Effects 0.000 claims 1
- 210000004369 blood Anatomy 0.000 description 34
- 239000008280 blood Substances 0.000 description 34
- 206010012601 diabetes mellitus Diseases 0.000 description 19
- NOESYZHRGYRDHS-UHFFFAOYSA-N insulin Chemical compound N1C(=O)C(NC(=O)C(CCC(N)=O)NC(=O)C(CCC(O)=O)NC(=O)C(C(C)C)NC(=O)C(NC(=O)CN)C(C)CC)CSSCC(C(NC(CO)C(=O)NC(CC(C)C)C(=O)NC(CC=2C=CC(O)=CC=2)C(=O)NC(CCC(N)=O)C(=O)NC(CC(C)C)C(=O)NC(CCC(O)=O)C(=O)NC(CC(N)=O)C(=O)NC(CC=2C=CC(O)=CC=2)C(=O)NC(CSSCC(NC(=O)C(C(C)C)NC(=O)C(CC(C)C)NC(=O)C(CC=2C=CC(O)=CC=2)NC(=O)C(CC(C)C)NC(=O)C(C)NC(=O)C(CCC(O)=O)NC(=O)C(C(C)C)NC(=O)C(CC(C)C)NC(=O)C(CC=2NC=NC=2)NC(=O)C(CO)NC(=O)CNC2=O)C(=O)NCC(=O)NC(CCC(O)=O)C(=O)NC(CCCNC(N)=N)C(=O)NCC(=O)NC(CC=3C=CC=CC=3)C(=O)NC(CC=3C=CC=CC=3)C(=O)NC(CC=3C=CC(O)=CC=3)C(=O)NC(C(C)O)C(=O)N3C(CCC3)C(=O)NC(CCCCN)C(=O)NC(C)C(O)=O)C(=O)NC(CC(N)=O)C(O)=O)=O)NC(=O)C(C(C)CC)NC(=O)C(CO)NC(=O)C(C(C)O)NC(=O)C1CSSCC2NC(=O)C(CC(C)C)NC(=O)C(NC(=O)C(CCC(N)=O)NC(=O)C(CC(N)=O)NC(=O)C(NC(=O)C(N)CC=1C=CC=CC=1)C(C)C)CC1=CN=CN1 NOESYZHRGYRDHS-UHFFFAOYSA-N 0.000 description 16
- 235000012054 meals Nutrition 0.000 description 13
- 238000010586 diagram Methods 0.000 description 11
- 208000013016 Hypoglycemia Diseases 0.000 description 10
- 238000004891 communication Methods 0.000 description 10
- 230000002218 hypoglycaemic effect Effects 0.000 description 10
- 230000002641 glycemic effect Effects 0.000 description 9
- 238000012545 processing Methods 0.000 description 9
- 102000004877 Insulin Human genes 0.000 description 8
- 108090001061 Insulin Proteins 0.000 description 8
- 230000006870 function Effects 0.000 description 8
- 229940125396 insulin Drugs 0.000 description 8
- 238000007619 statistical method Methods 0.000 description 8
- 238000004590 computer program Methods 0.000 description 7
- 201000001421 hyperglycemia Diseases 0.000 description 7
- 238000005259 measurement Methods 0.000 description 6
- 239000000126 substance Substances 0.000 description 6
- 230000000670 limiting effect Effects 0.000 description 5
- 238000002560 therapeutic procedure Methods 0.000 description 5
- 238000009499 grossing Methods 0.000 description 3
- 230000036541 health Effects 0.000 description 3
- 230000003345 hyperglycaemic effect Effects 0.000 description 3
- 230000008569 process Effects 0.000 description 3
- 238000007920 subcutaneous administration Methods 0.000 description 3
- 238000004364 calculation method Methods 0.000 description 2
- 238000006243 chemical reaction Methods 0.000 description 2
- HVYWMOMLDIMFJA-DPAQBDIFSA-N cholesterol Chemical compound C1C=C2C[C@@H](O)CC[C@]2(C)[C@@H]2[C@@H]1[C@@H]1CC[C@H]([C@H](C)CCCC(C)C)[C@@]1(C)CC2 HVYWMOMLDIMFJA-DPAQBDIFSA-N 0.000 description 2
- 238000010276 construction Methods 0.000 description 2
- 238000013523 data management Methods 0.000 description 2
- 230000001419 dependent effect Effects 0.000 description 2
- 230000002650 habitual effect Effects 0.000 description 2
- 238000007726 management method Methods 0.000 description 2
- 230000007935 neutral effect Effects 0.000 description 2
- 238000012502 risk assessment Methods 0.000 description 2
- 230000001960 triggered effect Effects 0.000 description 2
- 102100026189 Beta-galactosidase Human genes 0.000 description 1
- 108010059881 Lactase Proteins 0.000 description 1
- 241000124008 Mammalia Species 0.000 description 1
- 241001112258 Moca Species 0.000 description 1
- 208000001647 Renal Insufficiency Diseases 0.000 description 1
- 206010040943 Skin Ulcer Diseases 0.000 description 1
- 206010040860 Skin haemorrhages Diseases 0.000 description 1
- 241000700605 Viruses Species 0.000 description 1
- 230000001133 acceleration Effects 0.000 description 1
- 230000002730 additional effect Effects 0.000 description 1
- 239000003472 antidiabetic agent Substances 0.000 description 1
- QVGXLLKOCUKJST-UHFFFAOYSA-N atomic oxygen Chemical compound [O] QVGXLLKOCUKJST-UHFFFAOYSA-N 0.000 description 1
- 230000006399 behavior Effects 0.000 description 1
- 230000008901 benefit Effects 0.000 description 1
- WQZGKKKJIJFFOK-VFUOTHLCSA-N beta-D-glucose Chemical compound OC[C@H]1O[C@@H](O)[C@H](O)[C@@H](O)[C@@H]1O WQZGKKKJIJFFOK-VFUOTHLCSA-N 0.000 description 1
- 108010005774 beta-Galactosidase Proteins 0.000 description 1
- 239000013060 biological fluid Substances 0.000 description 1
- 230000000740 bleeding effect Effects 0.000 description 1
- 210000004204 blood vessel Anatomy 0.000 description 1
- 239000000872 buffer Substances 0.000 description 1
- 210000001175 cerebrospinal fluid Anatomy 0.000 description 1
- 239000007795 chemical reaction product Substances 0.000 description 1
- 239000003795 chemical substances by application Substances 0.000 description 1
- 235000012000 cholesterol Nutrition 0.000 description 1
- 229940107161 cholesterol Drugs 0.000 description 1
- 238000011281 clinical therapy Methods 0.000 description 1
- 239000000470 constituent Substances 0.000 description 1
- 238000007796 conventional method Methods 0.000 description 1
- 230000003247 decreasing effect Effects 0.000 description 1
- 238000001514 detection method Methods 0.000 description 1
- 230000006866 deterioration Effects 0.000 description 1
- 208000037265 diseases, disorders, signs and symptoms Diseases 0.000 description 1
- 208000035475 disorder Diseases 0.000 description 1
- 239000003814 drug Substances 0.000 description 1
- 238000001647 drug administration Methods 0.000 description 1
- 238000005516 engineering process Methods 0.000 description 1
- 230000002255 enzymatic effect Effects 0.000 description 1
- 210000003722 extracellular fluid Anatomy 0.000 description 1
- 238000001914 filtration Methods 0.000 description 1
- 230000037406 food intake Effects 0.000 description 1
- 235000012631 food intake Nutrition 0.000 description 1
- 230000010030 glucose lowering effect Effects 0.000 description 1
- 125000002791 glucosyl group Chemical group C1([C@H](O)[C@@H](O)[C@H](O)[C@H](O1)CO)* 0.000 description 1
- 229940088597 hormone Drugs 0.000 description 1
- 239000005556 hormone Substances 0.000 description 1
- 230000006872 improvement Effects 0.000 description 1
- 238000001802 infusion Methods 0.000 description 1
- 239000004615 ingredient Substances 0.000 description 1
- 230000010354 integration Effects 0.000 description 1
- 230000003993 interaction Effects 0.000 description 1
- 230000002452 interceptive effect Effects 0.000 description 1
- 201000006370 kidney failure Diseases 0.000 description 1
- 229940116108 lactase Drugs 0.000 description 1
- 210000004880 lymph fluid Anatomy 0.000 description 1
- 230000005055 memory storage Effects 0.000 description 1
- 230000004060 metabolic process Effects 0.000 description 1
- 239000002207 metabolite Substances 0.000 description 1
- 230000004048 modification Effects 0.000 description 1
- 238000012986 modification Methods 0.000 description 1
- 239000003607 modifier Substances 0.000 description 1
- 238000012806 monitoring device Methods 0.000 description 1
- 238000012544 monitoring process Methods 0.000 description 1
- 230000003287 optical effect Effects 0.000 description 1
- 230000008520 organization Effects 0.000 description 1
- 229910052760 oxygen Inorganic materials 0.000 description 1
- 239000001301 oxygen Substances 0.000 description 1
- 210000000496 pancreas Anatomy 0.000 description 1
- 230000000737 periodic effect Effects 0.000 description 1
- 230000037081 physical activity Effects 0.000 description 1
- 230000002829 reductive effect Effects 0.000 description 1
- 230000000717 retained effect Effects 0.000 description 1
- 230000035945 sensitivity Effects 0.000 description 1
- 231100000019 skin ulcer Toxicity 0.000 description 1
- 210000002700 urine Anatomy 0.000 description 1
- 230000000007 visual effect Effects 0.000 description 1
- 210000000707 wrist Anatomy 0.000 description 1
Images


Classifications
-
- G—PHYSICS
- G16—INFORMATION AND COMMUNICATION TECHNOLOGY [ICT] SPECIALLY ADAPTED FOR SPECIFIC APPLICATION FIELDS
- G16H—HEALTHCARE INFORMATICS, i.e. INFORMATION AND COMMUNICATION TECHNOLOGY [ICT] SPECIALLY ADAPTED FOR THE HANDLING OR PROCESSING OF MEDICAL OR HEALTHCARE DATA
- G16H50/00—ICT specially adapted for medical diagnosis, medical simulation or medical data mining; ICT specially adapted for detecting, monitoring or modelling epidemics or pandemics
- G16H50/20—ICT specially adapted for medical diagnosis, medical simulation or medical data mining; ICT specially adapted for detecting, monitoring or modelling epidemics or pandemics for computer-aided diagnosis, e.g. based on medical expert systems
-
- A—HUMAN NECESSITIES
- A61—MEDICAL OR VETERINARY SCIENCE; HYGIENE
- A61B—DIAGNOSIS; SURGERY; IDENTIFICATION
- A61B5/00—Measuring for diagnostic purposes; Identification of persons
- A61B5/0002—Remote monitoring of patients using telemetry, e.g. transmission of vital signals via a communication network
- A61B5/0031—Implanted circuitry
-
- A—HUMAN NECESSITIES
- A61—MEDICAL OR VETERINARY SCIENCE; HYGIENE
- A61B—DIAGNOSIS; SURGERY; IDENTIFICATION
- A61B5/00—Measuring for diagnostic purposes; Identification of persons
- A61B5/145—Measuring characteristics of blood in vivo, e.g. gas concentration, pH value; Measuring characteristics of body fluids or tissues, e.g. interstitial fluid, cerebral tissue
- A61B5/14503—Measuring characteristics of blood in vivo, e.g. gas concentration, pH value; Measuring characteristics of body fluids or tissues, e.g. interstitial fluid, cerebral tissue invasive, e.g. introduced into the body by a catheter or needle or using implanted sensors
-
- A—HUMAN NECESSITIES
- A61—MEDICAL OR VETERINARY SCIENCE; HYGIENE
- A61B—DIAGNOSIS; SURGERY; IDENTIFICATION
- A61B5/00—Measuring for diagnostic purposes; Identification of persons
- A61B5/145—Measuring characteristics of blood in vivo, e.g. gas concentration, pH value; Measuring characteristics of body fluids or tissues, e.g. interstitial fluid, cerebral tissue
- A61B5/14532—Measuring characteristics of blood in vivo, e.g. gas concentration, pH value; Measuring characteristics of body fluids or tissues, e.g. interstitial fluid, cerebral tissue for measuring glucose, e.g. by tissue impedance measurement
-
- A—HUMAN NECESSITIES
- A61—MEDICAL OR VETERINARY SCIENCE; HYGIENE
- A61B—DIAGNOSIS; SURGERY; IDENTIFICATION
- A61B5/00—Measuring for diagnostic purposes; Identification of persons
- A61B5/145—Measuring characteristics of blood in vivo, e.g. gas concentration, pH value; Measuring characteristics of body fluids or tissues, e.g. interstitial fluid, cerebral tissue
- A61B5/14546—Measuring characteristics of blood in vivo, e.g. gas concentration, pH value; Measuring characteristics of body fluids or tissues, e.g. interstitial fluid, cerebral tissue for measuring analytes not otherwise provided for, e.g. ions, cytochromes
-
- A—HUMAN NECESSITIES
- A61—MEDICAL OR VETERINARY SCIENCE; HYGIENE
- A61B—DIAGNOSIS; SURGERY; IDENTIFICATION
- A61B5/00—Measuring for diagnostic purposes; Identification of persons
- A61B5/48—Other medical applications
- A61B5/486—Bio-feedback
-
- A—HUMAN NECESSITIES
- A61—MEDICAL OR VETERINARY SCIENCE; HYGIENE
- A61B—DIAGNOSIS; SURGERY; IDENTIFICATION
- A61B5/00—Measuring for diagnostic purposes; Identification of persons
- A61B5/68—Arrangements of detecting, measuring or recording means, e.g. sensors, in relation to patient
- A61B5/6801—Arrangements of detecting, measuring or recording means, e.g. sensors, in relation to patient specially adapted to be attached to or worn on the body surface
- A61B5/6802—Sensor mounted on worn items
- A61B5/681—Wristwatch-type devices
-
- A—HUMAN NECESSITIES
- A61—MEDICAL OR VETERINARY SCIENCE; HYGIENE
- A61B—DIAGNOSIS; SURGERY; IDENTIFICATION
- A61B5/00—Measuring for diagnostic purposes; Identification of persons
- A61B5/72—Signal processing specially adapted for physiological signals or for diagnostic purposes
- A61B5/7271—Specific aspects of physiological measurement analysis
- A61B5/7275—Determining trends in physiological measurement data; Predicting development of a medical condition based on physiological measurements, e.g. determining a risk factor
-
- A—HUMAN NECESSITIES
- A61—MEDICAL OR VETERINARY SCIENCE; HYGIENE
- A61B—DIAGNOSIS; SURGERY; IDENTIFICATION
- A61B5/00—Measuring for diagnostic purposes; Identification of persons
- A61B5/74—Details of notification to user or communication with user or patient ; user input means
- A61B5/742—Details of notification to user or communication with user or patient ; user input means using visual displays
- A61B5/743—Displaying an image simultaneously with additional graphical information, e.g. symbols, charts, function plots
-
- G—PHYSICS
- G16—INFORMATION AND COMMUNICATION TECHNOLOGY [ICT] SPECIALLY ADAPTED FOR SPECIFIC APPLICATION FIELDS
- G16H—HEALTHCARE INFORMATICS, i.e. INFORMATION AND COMMUNICATION TECHNOLOGY [ICT] SPECIALLY ADAPTED FOR THE HANDLING OR PROCESSING OF MEDICAL OR HEALTHCARE DATA
- G16H15/00—ICT specially adapted for medical reports, e.g. generation or transmission thereof
-
- A—HUMAN NECESSITIES
- A61—MEDICAL OR VETERINARY SCIENCE; HYGIENE
- A61B—DIAGNOSIS; SURGERY; IDENTIFICATION
- A61B2560/00—Constructional details of operational features of apparatus; Accessories for medical measuring apparatus
- A61B2560/04—Constructional details of apparatus
- A61B2560/0443—Modular apparatus
- A61B2560/045—Modular apparatus with a separable interface unit, e.g. for communication
Definitions
- SMBG self-monitoring blood glucose
- WO 2007/005170 A2 discloses a diabetes data management system which selects variable threshold parameters to that are utilized in a report.
- a first low threshold glucose reading and a fist high threshold glucose reading for a before meal event timeframe are selected.
- a second low threshold glucose reading and a second high threshold glucose reading are selected for an after meal event timeframe.
- the threshold readings are stored in a database.
- the diabetes data management system analyzes glucose behavior around meal events.
- the system receives a plurality of glucose readings for a time period, receives a first time range as a pre-meal analysis period for the first meal event and receives a second time range as a post-meal analysis period for the first meal event.
- the system creates a graph which highlights the pre-meal analysis period, the post-meal analysis period, and displays the plurality of glucose readings for the time period.
- WO 2005/093629 A2 discloses a device comprising a display for displaying graphics, text and /or combinations thereof, a processor that is interfaced with said display, wherein the processor is configured to cause the display to display in a diagram, which diagram comprises a time axis indicating time relative to a habitual meal of a diabetic patient and a second axis on which units of blood glucose values are indicated, the following items: a) an indication at the point of time of the habitual meal, b) a mean or a median value of pre meal blood glucose values and/or d) a set of pre meal blood glucose measurements, and c) a mean or a median value of post meal blood glucose values, and/or e) a set of post meal blood glucose measurements.
- said displayed items can be used as a dialogue tool between the diabetic patient and a health care personal. Furthermore, said displayed items on the device can be used as an aid in self-management of diabetes.
- Said device can be a drug administration device or a blood glucose measuring device
- the present invention provides a method, performed by a host computing device, of analysing continuous analyte sensor data associated with a host, in accordance with claim 1.
- the present invention also provides a system for generating performance reports associated with continuous analyte sensor data in accordance with claim 15 All embodiments which do not fall under the scope of the claims are not part of the present invention.
- continuous analyte sensor is a broad term, and is to be given its ordinary and customary meaning to a person of ordinary skill in the art (and is not to be limited to a special or customized meaning), and refers without limitation to a device that continuously or continually measures a concentration of an analyte, for example, at time intervals ranging from fractions of a second up to, for example, 1, 2, or 5 minutes, or longer.
- the continuous analyte sensor is a glucose sensor such as described in U.S. Patent 6,001,067 .
- host as used herein is a broad term, and is to be given its ordinary and customary meaning to a person of ordinary skill in the art (and is not to be limited to a special or customized meaning), and refers without limitation to a mammal, such as a human implanted with a device.
- sensor data is a broad term, and is to be given its ordinary and customary meaning to a person of ordinary skill in the art (and is not to be limited to a special or customized meaning), and refers without limitation to any data associated with a sensor, such as a continuous analyte sensor.
- Sensor data includes sensor readings, such as from a raw data stream, or simply data stream, of an analog or digital signal directly related to a measured analyte from an analyte sensor (or other signal received from another sensor), as well as calibrated and/or filtered raw data.
- the sensor readings comprise digital data in "counts" converted by an A/D converter from an analog signal (e.g., voltage or amps) and each sensor reading includes one or more data points representative of a glucose concentration.
- sensor reading refers generally to a digital representation of sensor data (e.g. a blood glucose level) at a particular time.
- the term broadly encompasses a plurality of time spaced data points from a sensor, such as a from a substantially continuous glucose sensor, which comprises individual measurements taken at time intervals ranging from fractions of a second up to, e.g., 1, 2, or 5 minutes or longer.
- the sensor data includes an integrated digital value representative of one or more data points averaged over a time period.
- Sensor data may include calibrated data, smoothed data, filtered data, transformed data, and/or any other data associated with a sensor.
- transformed data examples include filtered sensor data (e.g., one or more filtered analyte concentration values), calibrated sensor data (e.g., one or more calibrated analyte concentration values), rate of change information, trend information, rate of acceleration information, sensor diagnostic information, location information, alarm/alert information, calibration information, and/or the like
- filtered sensor data e.g., one or more filtered analyte concentration values
- calibrated sensor data e.g., one or more calibrated analyte concentration values
- rate of change information e.g., trend information, rate of acceleration information, sensor diagnostic information, location information, alarm/alert information, calibration information, and/or the like
- calibration is a broad term, and is to be given its ordinary and customary meaning to a person of ordinary skill in the art (and is not to be limited to a special or customized meaning), and refers without limitation to a process of determining a relationship between sensor data and corresponding reference data, which can be used to convert sensor data into calibrated data (defined below).
- calibration can be updated or recalibrated over time as changes in the relationship between the sensor data and reference data occur, for example, due to changes in sensitivity, baseline, transport, metabolism, and the like.
- calibrated data and “calibrated data stream” as used herein are broad terms, and are to be given their ordinary and customary meaning to a person of ordinary skill in the art (and are not to be limited to a special or customized meaning), and refer without limitation to data that has been transformed from its raw state to another state using a function, for example a conversion function, to provide a meaningful value to a user.
- a function for example a conversion function
- smoothed data and filtered data are broad terms, and are to be given their ordinary and customary meaning to a person of ordinary skill in the art (and are not to be limited to a special or customized meaning), and refer without limitation to data that has been modified to make it smoother and more continuous and/or to remove or diminish outlying points, for example, by performing a moving average sensor readings.
- data filters include FIR (finite impulse response), IIR (infinite impulse response), moving average filters, and the like.
- smoothing and “filtering” as used herein are broad terms, and are to be given their ordinary and customary meaning to a person of ordinary skill in the art (and are not to be limited to a special or customized meaning), and refer without limitation to a mathematical computation that attenuates or normalizes components of a signal, such as reducing noise errors in a raw data stream.
- smoothing refers to modification of a data stream to make it smoother and more continuous or to remove or diminish outlying data points, for example, by performing a moving average a stream of sensor readings.
- time period is a broad term, and is to be given its ordinary and customary meaning to a person of ordinary skill in the art (and is not to be limited to a special or customized meaning), and refers without limitation to an amount of time including a single point in time and a path (for example, range of time) that extends from a first point in time to a second point in time.
- measured analyte values is a broad term, and is to be given its ordinary and customary meaning to a person of ordinary skill in the art (and is not to be limited to a special or customized meaning), and refers without limitation to an analyte value or set of analyte values for a time period for which analyte data has been measured by an analyte sensor.
- the term is broad enough to include data from the analyte sensor before or after data processing in the sensor and/or receiver (for example, data smoothing, calibration, or the like).
- estimated analyte values is a broad term, and is to be given its ordinary and customary meaning to a person of ordinary skill in the art (and is not to be limited to a special or customized meaning), and refers without limitation to an analyte value or set of analyte values, which have been algorithmically extrapolated from measured analyte values.
- estimated analyte values are estimated for a time period during which no data exists.
- estimated analyte values can also be estimated during a time period for which measured data exists, but is to be replaced by algorithmically extrapolated data due to a time lag in the measured data, for example.
- target analyte values and “analyte value goal” as used herein are broad terms, and are to be given their ordinary and customary meaning to a person of ordinary skill in the art (and are not to be limited to a special or customized meaning), and refer without limitation to an analyte value or set of analyte values that are clinically acceptable.
- a target analyte value is visually or audibly presented to a patient in order to aid in guiding the patient in understanding how they should avoid a clinically risky analyte concentration.
- Embodiments relate to use of analyte sensors that measure a concentration of analyte of interest or a substance indicative of the concentration or presence of the analyte.
- Such analyte sensors may use any known method, including invasive, minimally invasive, and non-invasive sensing techniques, to provide an output signal indicative of the concentration of the analyte of interest.
- an analyte sensor comprises a continuous analyte sensor, for example a subcutaneous, transdermal, or intravascular device.
- a glucose sensor can take a plurality of intermittent or periodic measurements.
- An analyte sensor can use any method of analyte-measurement, including enzymatic, chemical, physical, electrochemical, spectrophotometric, polarimetric, calorimetric, radiometric, or the like.
- an analyte sensor can be any sensor capable of determining the level of any analyte in the body, for example glucose, oxygen, lactase, hormones, cholesterol, medicaments, viruses, or the like. It should be understood that the devices and methods described herein can be applied to any device capable of continually, continuously and/or intermittently detecting a concentration of analyte and providing an output signal that represents the concentration of that analyte.
- an analyte sensor is an implantable glucose sensor, such as described with reference to U.S. Patent 6,001,067 and co-pending U.S. Patent Application Publication No. 2005/0027463 entitled, "SYSTEM AND METHODS FOR PROCESSING ANALYTE SENSOR DATA,” filed August 1, 2003 and published on February 3, 2005.
- an analyte sensor is a transcutaneous glucose sensor, such as described with reference to U.S. Patent Publication No. 2005/0143635 entitled, "CALIBRATION TECHNIQUES FOR CONTINUOUS ANALYTE SENSOR,” filed on December 3, 2004 and published on June 30, 2005.
- the continuous glucose sensor comprises a transcutaneous sensor such as described in U.S.
- a continuous glucose sensor comprises a subcutaneous sensor such as described with reference to U.S. Patent 6,579,690 to Bonnecaze et al. or U.S. Patent 6,484,046 to Say et al. , for example.
- the continuous glucose sensor comprises a refillable subcutaneous sensor such as described with reference to U.S. Patent 6,512,939 to Colvin et al. , for example.
- a continuous glucose sensor comprises an intravascular sensor such as described with reference to U.S. Patent 6,477,395 to Schulman et al. , for example.
- the continuous glucose sensor comprises an intravascular sensor such as described with reference to U.S. Patent 6,424,847 to Mastrototaro et al.
- the intermittent sensor readings may be sensed and transmitted from the continuous analyte sensor 10 on a substantially regular schedule, such as every 3 minutes, 5 minutes, 10 minutes, 30 minutes, or hour, for example, or in response to certain triggers, such as the blood glucose level of the host 40 exceeding a threshold, or in response to a request sent from another device in communication with the analyte sensor.
- the frequency of transmitting intermittent sensor readings 12 from the continuous analyte sensor 10 changes based on a current condition of the host 40.
- the continuous analyte sensor 10 may transmit intermittent sensor readings 12 at a higher frequency when the blood glucose level of the host 40 is outside of a preferred range (e.g., the host 40 is approaching hypoglycemia or hyperglycemia).
- the historical sensor data storage 30 advantageously includes multiple sensor readings for the host 40 covering multiple 24-hour periods, such as from 72 sensor readings (an average of three readings per hour) to 288 sensor readings (an average of 12 readings per hour), or more, for each 24 hour period. This frequency of sensor readings advantageously allows more accurate determination of trends of the host over a period of several hours, days, weeks, or longer.
- the intermittent sensor readings 12 are stored in the historical sensor data storage 30 so that the sensor data can be accessed by one or more computing devices, such as the host computing device 20, in order to allow the computing devices to analyze the historical sensor data and calculate one or more performance indicators, such as comparison metrics that compare sensor data from two or more analysis time periods.
- performance reports such as tables, charts, graphs, and/or any other user interface that illustrate differences and/or similarities in sensor data between analysis time periods may also be determined based on the historical sensor data stored on the historical sensor data storage 30.
- comparison of a mean blood glucose level of a host over a first one week period may be compared to a mean blood glucose level of the host over a second one week period in order to determine a general comparison of how the hosts blood glucose levels changed (overall) between the two one week periods.
- Comparison of the performance indicators and/or comparison metrics e.g. the mean blood glucose levels for each of the two weeks
- Performance reports may indicate glucose variability over and/or between more than two time periods, for example, a week-by-week comparison over a month's sensor data (e.g., 4 time periods). For example, a user may select a start and/or end date of an overall analysis time period for analysis (e.g., a last month or last quarter) and then select how many periods in which to divide the analysis time period.
- the continuous analyte sensor 10 includes a communication interface (not shown) for enabling data to be transmitted and/or received over one or more data networks.
- the data can be transmitted or received wirelessly, through the use of wires, or both.
- Data transmitted to a receiving device can be first packetized and processed according to one or more standardized network protocols.
- the communication may accommodate any wired or wireless protocol including, without limitation, USB, FireWire, Ethernet, Gigabit Ethernet, MoCA, radio frequency tuners, modems, ANT, WiFi, Blutooth, WiMax, and/or Infrared Data Association.
- continuous analyte sensor 10 can transmit the intermittent sensor readings 12A and 12B via the communication interface to the historical sensor data storage 30.
- Historical sensor data storage 30 can include any type of module adapted to enable digital information, including the intermittent sensor readings 12A and 12B, to be stored, retained, and retrieved. Additionally, historical sensor data storage 30 may comprise any combination of volatile and non-volatile storage devices, including without limitation RAM, DRAM, SRAM, ROM, and/or flash memory. Note also that historical sensor data storage 30 may be organized in any number of architectural configurations, through the use of registers, memory caches, data buffers, main memory, mass storage, and/or removable media, for example. Furthermore, historical sensor data storage 30 need not be a physically separate device, but can reside with sensor 10, host computer 20, or other computing device in communication with sensor 10 or host computer 20.
- the host computing device 20 comprises any suitable electronic device for accessing the historical sensor data stored on the historical sensor data storage 30, analyzing at least portions of the historical sensor data, and generating one or more comparison metrics and/or performance reports indicating a performance of the host as a comparison of sensor data from two different analysis time periods (to the host and/or other interested parties, such as a caretaker or medical advisor).
- the host computing device 20 comprises a performance report module 22 that is configured for execution by the host computing device in order to access historical sensor data from a first and a second analysis time period, perform analysis (e.g., mathematical and/or statistical analysis) on the sensor data from each of the analysis time periods, and generate one or more performance indicators that indicate differences in the sample data from the two analysis time periods.
- analysis e.g., mathematical and/or statistical analysis
- the performance report module 22 may be further configured to generate one or more performance reports, such as graphs, charts, tables, etc., that include and/or otherwise illustrate the determined performance indicators, which may be displayed on a display device of the host computing device 20 or other display device.
- the analysis time periods may be any time period, such as one day, one week, two weeks, three weeks, one month, two months, three months, six months, one year, or any other time period.
- the performance report module 22 provides the host 40 with reports that indicate changes in sensor data over various time periods.
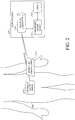
- FIG 2 is a diagram illustrating a continuous analyte sensor 210 in communication with a mobile receiver 220 in accordance with one embodiment.
- the mobile receiver 220 can be a portable receiver that is carried by a host 240, for example.
- the host 240 has diabetes and the mobile receiver 220 tracks a blood glucose level of the host 240 based on intermittent sensor readings 212 from the continuous analyte sensor 210.
- Continuous analyte sensor 210 can be the same sensor as analyte sensor 10 described with reference to Figure 1 .
- the mobile receiver 220 can be configured to be worn by the host 240, such as on the wrist of the host 240, or supported by a belt or clip on the host 240.
- the mobile receiver 220 can comprise a mobile electronic device that includes other functionality, such as a mobile telephone, personal digital assistant, personal computer, smart phone, digital media player, exercise monitoring device, geographic position-tracking device (e.g., GPS) or any other similar device.
- mobile receiver 220 includes some or all of the functionality of the host computing device 20 described with reference to Figure 1 .
- the continuous analytes sensor 210 transmits intermittent sensor readings 212 to the mobile receiver 220, which comprises historical sensor data storage 230 for storing sensor data (e.g. such as volatile and/or nonvolatile memory), including the received intermittent sensor readings 212.
- the mobile receiver 220 stores sensor data from the continuous analytes sensor 210 that may be analyzed in order to determine performance indicators and generate performance reports associated with host 240.
- historical sensor data storage 230 includes some or all of the functionality of the historical sensor data storage 30 described with reference to Figure 1 .
- Figure 3 is a flow diagram illustrating a method of generating performance indicators associated with sample data of a host in accordance with one embodiment.
- continuous sensor readings from two analysis time periods such as sequential or nonsequential time periods, are selected for analysis.
- the sample data from the two analysis time periods is then analyzed to generate one or more performance indicators, which may be displayed as part of one or more of multiple possible performance reports that generally indicate changes in the sensor data of the host from one analysis period to the next analysis period.
- sample data from more than two analysis time periods may be selected and analyzed, such that performance indicators are generated from each of the more than two analysis time periods and performance reports that indicate changes in the sensor data and/or performance indicators over the more than two analysis time periods may be generated.
- the historical sensor data storage 310 which can be data storage 30 or 230, stores sensor data received from a continuous analyte sensor, such as sensor 10 or 210.
- the sensor data may span various time periods, such as weeks, months, years, or longer.
- the historical sensor data may include sensor readings that are received as frequently as every minute, and thus can include multiple readings per hour.
- continuous sensor data from analysis time period 320 and continuous sensor data from analysis time period 330 are both transmitted to a statistical analysis module 340.
- the statistical analysis module 340 can be configured to analyze the sensor data from each of the analysis time periods and generate one or more statistical values associated with the sensor data (e.g., the sensor readings) for each of the time periods.
- the length of the analysis time periods may also vary.
- each of the analysis time periods is one week, while in another embodiment each of the analysis time periods is a quarter of a year.
- Other analysis time periods can be one or more hours, days, weeks, months, quarters of a year or years.
- the statistical analysis module 340 which may comprise computer program code that is executed by a computing device, such as the host computing device 20 or the mobile receiver 220 ( Figure 1 or Figure 2 , respectively), generates statistical values 350 based on continuous sensor data from analysis time period 320 and generates statistical values 360 based on continuous sensor data from analysis time period 330.
- the statistical values for each analysis time period can vary, but generally include one or more indications of glucose variability during the selected time period.
- the statistical values 350, 360 associated with the two (or more) selected analysis time periods are received by a comparison module 370 that is configured to compare the statistical values in order to generate one or more performance indicators 380, such as comparison metrics, that are indicative of relationships between the sensor data from the first and second analysis time periods.
- the performance indicators 380 may include numbers, scores, percentages, trends, averages, grades, ranks, images, graphs, charts, and/or any other indicia that are indicative of differences and/or similarities between the statistical values 350, 360 and/or sensor data 320, 330 associated with respective first and second analysis time periods.
- the performance indicators may also include comparison metrics, such as one or more overall trends in the improvement (or lack thereof) in a variety of areas for the two or more analysis time periods. Such comparison metrics can be expressed, for example, by analyzing a predetermined, selectable, or changing, quantity of analysis time periods and generating a smoothed or filtered trend of the analysis times periods using one or more statistical parameters.
- target data provided by a caretaker can be used instead of sample data of a host for an analysis time period in order to achieve similar target comparison results.
- multiple analysis time periods such as three or more, may be analyzed in generating performance reports using target data.
- two analysis time periods comprising host sample data and one analysis time period comprising target data supplied by a physician may be analyzed in generating performance reports for the host.
- a caretaker e.g., doctor
- can upload performance criteria e.g., including performance criteria that are applied to the one or more performance indicators in order to determine if the host has (or hasn't) met desired performance goals
- performance criteria e.g., including performance criteria that are applied to the one or more performance indicators in order to determine if the host has (or hasn't) met desired performance goals
- the performance report module 22, 222 ( Figures 1 , 2 , respectively) comprises the statistical analysis module 340 and/or comparison module 370 discussed with respect to Figure 3 .
- the host computing device 20 and/or the mobile receiver 220 may be configured to generate statistical values for each of multiple analysis time periods as well as performance indicators and/or performance reports (e.g., user interfaces) including the performance indicators.
- Figure 4 is a flow diagram illustrating the historical sensor data storage 310, the statistical analysis module 340, and the comparison module 370 of Figure 3 , wherein specific exemplary data is shown communicated between the components.
- analysis time period data 420 comprises sensor data including 72-300 sensor readings for each day from January to March of a particular year (e.g. 2008) and the analysis time period data 430 comprises sensor data including 72-300 sensor readings for each day from April to June of that same year (e.g., 2008).
- the analysis time periods comprise consecutive quarters of a year.
- the sensor data may include fewer or additional sensor readings for each 24 hour period.
- a host may not use a continuous analytes sensor, or may not properly use a continuous analyte sensor (e.g., the sensor may not be used while on vacation or during exercise or other physical activities, and sensor readings may not be received when the battery of the receiver low or is dead, for example), such that no sensor readings are received.
- sensor readings for one or more days (or more) within one of the first or second analysis time periods may include no (or very few) sensor readings. While lack of readings for such a short time period may not be ideal, the embodiments described herein can continue to provide statistical values, performance indicators, and/or performance reports notwithstanding the absence of sensor readings for certain such periods.
- the statistical analysis module 340 determines a mean glucose level for each of the first and second analysis time periods.
- mean glucose level 450 represents the sample readings during the January to March analysis time period and mean glucose level 460 represents the sample readings during the April to June analysis time period.
- other statistical values may be generated by the statistical analysis module 340.
- the comparison module 370 receives the mean glucose levels 450, 460 and determines a percentage difference between the quarterly mean glucose levels 450, 460. This percentage difference may be in cluded in one or more performance reports as an indicator of performance of the host from one quarter to the next.
- Figure 5 illustrates one exemplary performance report 500 that includes statistical values and performance indicators for each of two analysis time periods, which in this example are months.
- the performance report 500 illustrates statistical values associated with a first analysis time period (from January 29 to February 27) in column 510 and statistical values associated with a second analysis period (from February 28 to March 27) in column 520.
- the performance report 500 also indicates performance indicators indicative of similarities between the statistical values in columns 510 and 520 in column 530. For example, in a row 540, the mean glucose levels of the sensor readings during each of the analysis time periods are provided in columns 510, 520, and a percentage change in the mean glucose levels between the two analysis time periods is indicated in column 530 of row 540.
- the performance report 500 also includes a column 535 that provides a graphical performance indicator that indicates whether a particular performance indicator is generally positive (e.g., indicated by a smiley face or similar graphic), negative (e.g., indicated by a warning indicator - as illustrated in Figure 5 , a frowney face or similar graphic), or neutral (e.g., indicated by a neutral face or similar graphic).
- row 542 indicates statistics for the standard deviation of sensor readings during the analysis time periods, wherein in the specific exemplary standard deviations have improved by 2% from the first analysis period to the second analysis period, as illustrated in column 530 of row 542.
- the performance indicators of column 535 may be based on a combination of more than one statistical value and/or performance indicator.
- performance indicators may be provided as combinations of time spent in particular ranges, days/percentage of days that sensors are used, and/or any other performance indicators that are available in order to better provide the host, caretakers, and/or any other interested entity in suitable indicators of performance of the host.
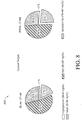
- Figure 6A is an exemplary performance report 600 illustrating sensor readings for each of two analysis time periods in accordance with one embodiment.
- two line graphs illustrate average blood glucose levels for each hour of a 24 hour period over the course of the relevant analysis time periods, which in this embodiment include a first analysis time period from January 29 to February 27 and a second analysis time period from February 28 to March 27.
- the same data that is illustrated in the line graphs of Figure 6A is shown in table format, such that the average blood glucose levels for each one hour period during the relevant time periods are shown in each field.
- the blood glucose level of 214 mg/dL indicates that during the first analysis time period from January 29 to February 27 the host had an average blood glucose level of 214 mg/dL during the hour from 12 am to 12:59 am (which may have included from 5-60 sensor readings per day during that time period).
- the blood glucose level of 145 mg/dL indicates that during the time period from January 29 to February 27 the host had an average blood glucose level of 145 mg/dL during the hour from 1 am to 1:59 am.
- Each of the fields of the table of Figure 6B may be associated with multiple sample readings from multiple days, such as 2-20 sample readings per day, for example. In other embodiments, continuous sensor readings may be averaged over shorter or longer time periods, such as periods of 10 minutes, 30 minutes, or two hours, for example.
- the performance report 800 may include a performance indicator, such as a comparison pie graph, that shows a difference between the percentage time in each of the ranges between the two comparison time periods.
- a performance indicator such as a comparison pie graph
- the graph may illustrate that the host decreased 4% from the first analysis period to the second analysis time period in the amount of time spent in the high range.
- A1c% values are not indicated in the report 700 or report 800, in one embodiment, a user can input A1c% values - via host computer 20 or mobile receiver 220, for example.
- performance report module 22, 222 can calculate estimated A1c% values based on historical sensor data stored in historical sensor storage 30, 203, for example.
- an estimated A1c% can be calculated based on continuous glucose sensor readings.
- the inputted and/or estimated A1c% values can then be illustrated in the performance reports 700 and 800.
- SD standard deviation
- %CV percentage coefficient of variation
- Performance reports can also be based on or include a variety of other statistical information.
- performance report module 22, 222 can calculate a Glycemic Variability Index (GVI) and generate a performance report that indicates the calculated GVI.
- GVI Glycemic Variability Index
- the GVI can indicate a quality of glucose control over time based on continuous analyte sensor data.
- SD standard deviation
- %CV percentage coefficient of variation
- IQR interquart
- a computing device supporting user interface 900 automatically calculates and displays on user interface 900 the end date of the first analysis period and the start date and end date of the second analysis period.
- the user can also modify the second start date by inputting a different start date in the field 920 of the user interface 900. In this way, a user can compare two analysis periods that are nonconsecutive.
- a user can input a different analysis time period by selecting a desired analysis time period via drop down menu 930.
- the drop down menu 930 can allow the user to select one of a variety of analysis time periods, such as days, months, quarters, or years, or other custom time periods.
- the host computing device 20 accesses historical continuous sensor data for each of two (or more) analysis time periods.
- the host computing device 20 may access historical sensor data storage 30 that stores continuous sensor readings for a period of weeks, months, years, or mores.
- the historical sensor data can include multiple sensor readings per hour, such as more than 72 sensor readings per 24 hour period from a continuous analyte sensor.
- the historical sensor data for the analysis time periods may be stored local to the host computing device 20, e.g. on a hard drive or optical drive of the computing device, or may be accessed via one or more network connections, e.g., via a local area connections to a server that stores the data.
- one or more user-selected performance reports are generated including the user-selected performance indicators and/or other determined statistical values.
- performance reports may be delivered to the user via a web interface, e.g., via a web browser, or via a stand-alone software application.
- the performance reports illustrate differences and/or similarities in sensor data for extended periods of time (e.g., comparisons of consecutive weeks, months, or quarters).
- a group of items linked with the conjunction 'and' should not be read as requiring that each and every one of those items be present in the grouping, but rather should be read as 'and/or' unless expressly stated otherwise.
- a group of items linked with the conjunction 'or' should not be read as requiring mutual exclusivity among that group, but rather should be read as 'and/or' unless expressly stated otherwise.
Landscapes
- Health & Medical Sciences (AREA)
- Life Sciences & Earth Sciences (AREA)
- Engineering & Computer Science (AREA)
- Medical Informatics (AREA)
- Public Health (AREA)
- Physics & Mathematics (AREA)
- General Health & Medical Sciences (AREA)
- Biomedical Technology (AREA)
- Pathology (AREA)
- Heart & Thoracic Surgery (AREA)
- Molecular Biology (AREA)
- Surgery (AREA)
- Animal Behavior & Ethology (AREA)
- Biophysics (AREA)
- Veterinary Medicine (AREA)
- Optics & Photonics (AREA)
- Epidemiology (AREA)
- Primary Health Care (AREA)
- Emergency Medicine (AREA)
- Nuclear Medicine, Radiotherapy & Molecular Imaging (AREA)
- Computer Networks & Wireless Communication (AREA)
- Radiology & Medical Imaging (AREA)
- Databases & Information Systems (AREA)
- Data Mining & Analysis (AREA)
- Signal Processing (AREA)
- Psychiatry (AREA)
- Computer Vision & Pattern Recognition (AREA)
- Artificial Intelligence (AREA)
- Physiology (AREA)
- Biodiversity & Conservation Biology (AREA)
- Measurement Of The Respiration, Hearing Ability, Form, And Blood Characteristics Of Living Organisms (AREA)
- Investigating Or Analysing Biological Materials (AREA)
Description
- Systems and methods for providing performance reports to persons with diabetes that generally indicate a measure of a glucose variability of the person over multiple analysis time periods are provided.
- Diabetes mellitus is a disorder in which the pancreas cannot create sufficient insulin (Type I or insulin dependent) and/or in which insulin is not effective (
Type 2 or non-insulin dependent). In the diabetic state, the victim suffers from high blood sugar, which may cause an array of physiological derangements (for example, kidney failure, skin ulcers, or bleeding into the vitreous of the eye) associated with the deterioration of small blood vessels. A hypoglycemic reaction (low blood sugar) may be induced by an inadvertent overdose of insulin, or after a normal dose of insulin or glucose-lowering agent accompanied by extraordinary exercise or insufficient food intake. - Conventionally, a person with diabetes carries a self-monitoring blood glucose (SMBG) monitor, which typically requires uncomfortable finger pricking methods. Due to the lack of comfort and convenience, a person with diabetes will normally only measure his or her glucose levels two to four times per day. Unfortunately, these time intervals are so far apart that the person with diabetes will likely find out too late about hyper- or hypo-glycemic conditions. In fact, it is not only unlikely that a person with diabetes will take a timely SMBG value, it is likely that the person with diabetes will not know if their blood glucose value is going up (higher) or down (lower) based on conventional methods. Thus, their ability to make educated insulin therapy decisions is inhibited.
- Some attempts have been made to continuously measure the glucose concentration in a person with diabetes. More frequent measurements can allow the person with diabetes to know of essentially current blood sugar conditions and to make appropriate decisions in response to the current conditions.
-
WO 2007/005170 A2 discloses a diabetes data management system which selects variable threshold parameters to that are utilized in a report. A first low threshold glucose reading and a fist high threshold glucose reading for a before meal event timeframe are selected. A second low threshold glucose reading and a second high threshold glucose reading are selected for an after meal event timeframe. The threshold readings are stored in a database. The diabetes data management system analyzes glucose behavior around meal events. The system receives a plurality of glucose readings for a time period, receives a first time range as a pre-meal analysis period for the first meal event and receives a second time range as a post-meal analysis period for the first meal event. The system creates a graph which highlights the pre-meal analysis period, the post-meal analysis period, and displays the plurality of glucose readings for the time period. -
US 2002/0193679 A1 discloses a communication station which is for use with a medical device (such as an infusion pump) and a processing device (such as a computer). The communication station includes a housing, a medical device interface coupled to the housing, a processing device interface coupled to the housing and a processor coupled to the housing. The device interface interfaces with the medical device, and the processing device interface interfaces with the processing device. The processor provides a communication path between the medical device and the processing device such that programming and instructions may be communicated from the processing device to the medical device and data may be transferred from the medical device to the processing device. The communication station may be combined with a system that is capable of generating reports either locally or remotely. In addition, the medical device interface may be a cradle that is configurable to attach to different shaped medical devices. -
WO 2005/093629 A2 discloses a device comprising a display for displaying graphics, text and /or combinations thereof, a processor that is interfaced with said display, wherein the processor is configured to cause the display to display in a diagram, which diagram comprises a time axis indicating time relative to a habitual meal of a diabetic patient and a second axis on which units of blood glucose values are indicated, the following items: a) an indication at the point of time of the habitual meal, b) a mean or a median value of pre meal blood glucose values and/or d) a set of pre meal blood glucose measurements, and c) a mean or a median value of post meal blood glucose values, and/or e) a set of post meal blood glucose measurements. It is an advantage that said displayed items can be used as a dialogue tool between the diabetic patient and a health care personal. Furthermore, said displayed items on the device can be used as an aid in self-management of diabetes. Said device can be a drug administration device or a blood glucose measuring device - The present invention provides a method, performed by a host computing device, of analysing continuous analyte sensor data associated with a host, in accordance with
claim 1. - The present invention also provides a system for generating performance reports associated with continuous analyte sensor data in accordance with
claim 15 All embodiments which do not fall under the scope of the claims are not part of the present invention. - Various embodiments of the present invention are described in detail with reference to the following figures. The drawings are provided for purposes of illustration only and merely depict typical or example embodiments of the invention. These drawings are provided to facilitate the reader's understanding of the invention and shall not be considered limiting of the breadth, scope, or applicability of the invention. It should be noted that for clarity and ease of illustration these drawings are not necessarily made to scale.
-
Figure 1 is a schematic diagram of a performance report system using a host computing device in accordance with one embodiment. -
Figure 2 is a schematic diagram of a performance report system using a mobile receiver in accordance with one embodiment. -
Figure 3 is a flow diagram illustrating a method of generating performance indicators associated with sample data of a host in accordance with one embodiment. -
Figure 4 is a flow diagram illustrating components ofFigure 3 , wherein specific exemplary data is shown communicated between the components. -
Figures 5-8 illustrate exemplary performance reports that include statistical values and performance indicators in accordance with various embodiments. -
Figure 9 is an exemplary user interface in accordance with one embodiment. -
Figure 10 is a flowchart illustrating a method of generating performance reports indicating performance indicators between continuous sensor data from two or more analysis time periods in accordance with one embodiment. -
Figure 11 is a flowchart of a method of receiving user input for generating customized performance reports in accordance with one embodiment. - In the following description of exemplary embodiments, reference is made to the accompanying drawings which form a part hereof, and in which it is shown by way of illustration specific embodiments in which the invention can be practiced. It is to be understood that other embodiments can be used and structural changes can be made without departing from the scope of the invention.
- Below are definitions of certain terms.
- The term "analyte" as used herein is a broad term, and is to be given its ordinary and customary meaning to a person of ordinary skill in the art (and is not to be limited to a special or customized meaning), and refers without limitation to a substance or chemical constituent in a biological fluid (for example, blood, interstitial fluid, cerebral spinal fluid, lymph fluid or urine) that can be analyzed. Analytes can include naturally occurring substances, artificial substances, metabolites, and/or reaction products.
- The term "continuous analyte sensor" as used herein is a broad term, and is to be given its ordinary and customary meaning to a person of ordinary skill in the art (and is not to be limited to a special or customized meaning), and refers without limitation to a device that continuously or continually measures a concentration of an analyte, for example, at time intervals ranging from fractions of a second up to, for example, 1, 2, or 5 minutes, or longer. In one exemplary embodiment, the continuous analyte sensor is a glucose sensor such as described in
U.S. Patent 6,001,067 . - The term "host" as used herein is a broad term, and is to be given its ordinary and customary meaning to a person of ordinary skill in the art (and is not to be limited to a special or customized meaning), and refers without limitation to a mammal, such as a human implanted with a device.
- The term "sensor data" as used herein is a broad term, and is to be given its ordinary and customary meaning to a person of ordinary skill in the art (and is not to be limited to a special or customized meaning), and refers without limitation to any data associated with a sensor, such as a continuous analyte sensor. Sensor data includes sensor readings, such as from a raw data stream, or simply data stream, of an analog or digital signal directly related to a measured analyte from an analyte sensor (or other signal received from another sensor), as well as calibrated and/or filtered raw data. In one example, the sensor readings comprise digital data in "counts" converted by an A/D converter from an analog signal (e.g., voltage or amps) and each sensor reading includes one or more data points representative of a glucose concentration. Thus, the terms sensor reading refers generally to a digital representation of sensor data (e.g. a blood glucose level) at a particular time. The term broadly encompasses a plurality of time spaced data points from a sensor, such as a from a substantially continuous glucose sensor, which comprises individual measurements taken at time intervals ranging from fractions of a second up to, e.g., 1, 2, or 5 minutes or longer. In another example, the sensor data includes an integrated digital value representative of one or more data points averaged over a time period. Sensor data may include calibrated data, smoothed data, filtered data, transformed data, and/or any other data associated with a sensor.
- The term "transformed sensor data" as used herein is a broad term, and is to be given its ordinary and customary meaning to a person of ordinary skill in the art (and is not to be limited to a special or customized meaning), and refers without limitation to any data that is derived, either fully or in part, from sensor readings from one or more sensors. For example, sensor readings over a time period (e.g., 5 minutes) may be processed in order to generated transformed sensor data including one or more trend indicators (e.g., a 5 minute trend). Other examples of transformed data include filtered sensor data (e.g., one or more filtered analyte concentration values), calibrated sensor data (e.g., one or more calibrated analyte concentration values), rate of change information, trend information, rate of acceleration information, sensor diagnostic information, location information, alarm/alert information, calibration information, and/or the like
- The term "calibration" as used herein is a broad term, and is to be given its ordinary and customary meaning to a person of ordinary skill in the art (and is not to be limited to a special or customized meaning), and refers without limitation to a process of determining a relationship between sensor data and corresponding reference data, which can be used to convert sensor data into calibrated data (defined below). In some embodiments, such as continuous analyte sensors, for example, calibration can be updated or recalibrated over time as changes in the relationship between the sensor data and reference data occur, for example, due to changes in sensitivity, baseline, transport, metabolism, and the like.
- The terms "calibrated data" and "calibrated data stream" as used herein are broad terms, and are to be given their ordinary and customary meaning to a person of ordinary skill in the art (and are not to be limited to a special or customized meaning), and refer without limitation to data that has been transformed from its raw state to another state using a function, for example a conversion function, to provide a meaningful value to a user.
- The terms "smoothed data" and "filtered data" as used herein are broad terms, and are to be given their ordinary and customary meaning to a person of ordinary skill in the art (and are not to be limited to a special or customized meaning), and refer without limitation to data that has been modified to make it smoother and more continuous and/or to remove or diminish outlying points, for example, by performing a moving average sensor readings. Examples of data filters include FIR (finite impulse response), IIR (infinite impulse response), moving average filters, and the like.
- The terms "smoothing" and "filtering" as used herein are broad terms, and are to be given their ordinary and customary meaning to a person of ordinary skill in the art (and are not to be limited to a special or customized meaning), and refer without limitation to a mathematical computation that attenuates or normalizes components of a signal, such as reducing noise errors in a raw data stream. In some embodiments, smoothing refers to modification of a data stream to make it smoother and more continuous or to remove or diminish outlying data points, for example, by performing a moving average a stream of sensor readings.
- The term "time period" as used herein is a broad term, and is to be given its ordinary and customary meaning to a person of ordinary skill in the art (and is not to be limited to a special or customized meaning), and refers without limitation to an amount of time including a single point in time and a path (for example, range of time) that extends from a first point in time to a second point in time.
- The term "measured analyte values" as used herein is a broad term, and is to be given its ordinary and customary meaning to a person of ordinary skill in the art (and is not to be limited to a special or customized meaning), and refers without limitation to an analyte value or set of analyte values for a time period for which analyte data has been measured by an analyte sensor. The term is broad enough to include data from the analyte sensor before or after data processing in the sensor and/or receiver (for example, data smoothing, calibration, or the like).
- The term "estimated analyte values" as used herein is a broad term, and is to be given its ordinary and customary meaning to a person of ordinary skill in the art (and is not to be limited to a special or customized meaning), and refers without limitation to an analyte value or set of analyte values, which have been algorithmically extrapolated from measured analyte values. Typically, estimated analyte values are estimated for a time period during which no data exists. However, estimated analyte values can also be estimated during a time period for which measured data exists, but is to be replaced by algorithmically extrapolated data due to a time lag in the measured data, for example.
- The term "alarm" as used herein is a broad term, and is to be given its ordinary and customary meaning to a person of ordinary skill in the art (and is not to be limited to a special or customized meaning), and refers without limitation to audible, visual, or tactile signals that are triggered in response to detection of clinical risk to a patient. In one embodiment, hyperglycemic and hypoglycemic alarms are triggered when present or future clinical danger is assessed based on continuous analyte data.
- The terms "target analyte values" and "analyte value goal" as used herein are broad terms, and are to be given their ordinary and customary meaning to a person of ordinary skill in the art (and are not to be limited to a special or customized meaning), and refer without limitation to an analyte value or set of analyte values that are clinically acceptable. In one example, a target analyte value is visually or audibly presented to a patient in order to aid in guiding the patient in understanding how they should avoid a clinically risky analyte concentration.
- The term "module" as used herein is a broad term, and is to be given its ordinary and customary meaning to a person of ordinary skill in the art (and is not to be limited to a special or customized meaning), and refers without limitation to software, firmware, hardware, and any combination of these elements for performing the associated functions described herein. Additionally, for purpose of discussion, the various modules are described from time-to-time as discrete modules; however, as would be apparent to one of ordinary skill in the art, two or more modules may be combined to form a single module that performs the associated functions according embodiments.
- The terms "computer program product", "computer-readable medium", and the like as used herein are broad terms, and are to be given their ordinary and customary meaning to a person of ordinary skill in the art (and are not to be limited to a special or customized meaning), and refer without limitation to media such as, memory storage devices, or storage unit. These, and other forms of computer-readable media, may be involved in storing one or more instructions for use by a processor to cause the processor to perform specified operations. Such instructions, generally referred to as "computer program code" (which may be grouped in the form of computer programs or other groupings), which when executed, enable a computing system to carry out specific functions in accordance with the computer program code.
- Embodiments relate to use of analyte sensors that measure a concentration of analyte of interest or a substance indicative of the concentration or presence of the analyte. Such analyte sensors may use any known method, including invasive, minimally invasive, and non-invasive sensing techniques, to provide an output signal indicative of the concentration of the analyte of interest. In some embodiments, an analyte sensor comprises a continuous analyte sensor, for example a subcutaneous, transdermal, or intravascular device. In some embodiments, a glucose sensor can take a plurality of intermittent or periodic measurements. An analyte sensor can use any method of analyte-measurement, including enzymatic, chemical, physical, electrochemical, spectrophotometric, polarimetric, calorimetric, radiometric, or the like. Generally, an analyte sensor can be any sensor capable of determining the level of any analyte in the body, for example glucose, oxygen, lactase, hormones, cholesterol, medicaments, viruses, or the like. It should be understood that the devices and methods described herein can be applied to any device capable of continually, continuously and/or intermittently detecting a concentration of analyte and providing an output signal that represents the concentration of that analyte.
- In one embodiment, an analyte sensor is an implantable glucose sensor, such as described with reference to
U.S. Patent 6,001,067 and co-pendingU.S. Patent Application Publication No. 2005/0027463 entitled, "SYSTEM AND METHODS FOR PROCESSING ANALYTE SENSOR DATA," filed August 1, 2003 and published on February 3, 2005. In another embodiment, an analyte sensor is a transcutaneous glucose sensor, such as described with reference toU.S. Patent Publication No. 2005/0143635 entitled, "CALIBRATION TECHNIQUES FOR CONTINUOUS ANALYTE SENSOR," filed on December 3, 2004 and published on June 30, 2005. In another embodiment, the continuous glucose sensor comprises a transcutaneous sensor such as described inU.S. Patent 6,565,509 to Say et al. , for example. In a further embodiment, a continuous glucose sensor comprises a subcutaneous sensor such as described with reference toU.S. Patent 6,579,690 to Bonnecaze et al. orU.S. Patent 6,484,046 to Say et al. , for example. In another embodiment, the continuous glucose sensor comprises a refillable subcutaneous sensor such as described with reference toU.S. Patent 6,512,939 to Colvin et al. , for example. In another embodiment, a continuous glucose sensor comprises an intravascular sensor such as described with reference toU.S. Patent 6,477,395 to Schulman et al. , for example. In another embodiment, the continuous glucose sensor comprises an intravascular sensor such as described with reference toU.S. Patent 6,424,847 to Mastrototaro et al. -
Figure 1 is a diagram illustrating acontinuous analyte sensor 10 transmitting intermittent sensor readings 12 (includingsensor readings sensor data storage 30. Theintermittent sensor readings 12 can each comprise sensor data, such as calibrated data, smoothed data, filtered data, and/or transformed data. Depending on the embodiment, theintermittent sensor readings 12 include indications of one or more analyte levels of a host 40 (e.g. such as a blood glucose level of the host 40) and/or any quantity of transformed sensor data, including filtered and/or smoothed sensor data. The intermittent sensor readings may be sensed and transmitted from thecontinuous analyte sensor 10 on a substantially regular schedule, such as every 3 minutes, 5 minutes, 10 minutes, 30 minutes, or hour, for example, or in response to certain triggers, such as the blood glucose level of thehost 40 exceeding a threshold, or in response to a request sent from another device in communication with the analyte sensor. In some embodiments, the frequency of transmittingintermittent sensor readings 12 from thecontinuous analyte sensor 10 changes based on a current condition of thehost 40. For example, thecontinuous analyte sensor 10 may transmitintermittent sensor readings 12 at a higher frequency when the blood glucose level of thehost 40 is outside of a preferred range (e.g., thehost 40 is approaching hypoglycemia or hyperglycemia). With the use of acontinuous analyte sensor 10, the historicalsensor data storage 30 advantageously includes multiple sensor readings for thehost 40 covering multiple 24-hour periods, such as from 72 sensor readings (an average of three readings per hour) to 288 sensor readings (an average of 12 readings per hour), or more, for each 24 hour period. This frequency of sensor readings advantageously allows more accurate determination of trends of the host over a period of several hours, days, weeks, or longer. - In the embodiment of
Figure 1 , theintermittent sensor readings 12 are stored in the historicalsensor data storage 30 so that the sensor data can be accessed by one or more computing devices, such as thehost computing device 20, in order to allow the computing devices to analyze the historical sensor data and calculate one or more performance indicators, such as comparison metrics that compare sensor data from two or more analysis time periods. In some embodiments, performance reports, such as tables, charts, graphs, and/or any other user interface that illustrate differences and/or similarities in sensor data between analysis time periods may also be determined based on the historical sensor data stored on the historicalsensor data storage 30. For example, comparison of a mean blood glucose level of a host over a first one week period (e.g., based on at least 72 sensor readings per day from a continuous analyte sensor) may be compared to a mean blood glucose level of the host over a second one week period in order to determine a general comparison of how the hosts blood glucose levels changed (overall) between the two one week periods. Comparison of the performance indicators and/or comparison metrics (e.g. the mean blood glucose levels for each of the two weeks) may be displayed in one of multiple performance reports, such a graphs, charts, tables, reports, etc. Performance reports may indicate glucose variability over and/or between more than two time periods, for example, a week-by-week comparison over a month's sensor data (e.g., 4 time periods). For example, a user may select a start and/or end date of an overall analysis time period for analysis (e.g., a last month or last quarter) and then select how many periods in which to divide the analysis time period. - In one embodiment, the
continuous analyte sensor 10 includes a communication interface (not shown) for enabling data to be transmitted and/or received over one or more data networks. The data can be transmitted or received wirelessly, through the use of wires, or both. Data transmitted to a receiving device can be first packetized and processed according to one or more standardized network protocols. The communication may accommodate any wired or wireless protocol including, without limitation, USB, FireWire, Ethernet, Gigabit Ethernet, MoCA, radio frequency tuners, modems, ANT, WiFi, Blutooth, WiMax, and/or Infrared Data Association. In this manner,continuous analyte sensor 10 can transmit theintermittent sensor readings sensor data storage 30. - Historical
sensor data storage 30 can include any type of module adapted to enable digital information, including theintermittent sensor readings sensor data storage 30 may comprise any combination of volatile and non-volatile storage devices, including without limitation RAM, DRAM, SRAM, ROM, and/or flash memory. Note also that historicalsensor data storage 30 may be organized in any number of architectural configurations, through the use of registers, memory caches, data buffers, main memory, mass storage, and/or removable media, for example. Furthermore, historicalsensor data storage 30 need not be a physically separate device, but can reside withsensor 10,host computer 20, or other computing device in communication withsensor 10 orhost computer 20. - The
host computing device 20 comprises any suitable electronic device for accessing the historical sensor data stored on the historicalsensor data storage 30, analyzing at least portions of the historical sensor data, and generating one or more comparison metrics and/or performance reports indicating a performance of the host as a comparison of sensor data from two different analysis time periods (to the host and/or other interested parties, such as a caretaker or medical advisor). For example, in the embodiment ofFigure 1 thehost computing device 20 comprises aperformance report module 22 that is configured for execution by the host computing device in order to access historical sensor data from a first and a second analysis time period, perform analysis (e.g., mathematical and/or statistical analysis) on the sensor data from each of the analysis time periods, and generate one or more performance indicators that indicate differences in the sample data from the two analysis time periods. Theperformance report module 22 may be further configured to generate one or more performance reports, such as graphs, charts, tables, etc., that include and/or otherwise illustrate the determined performance indicators, which may be displayed on a display device of thehost computing device 20 or other display device. Depending on the embodiment, the analysis time periods may be any time period, such as one day, one week, two weeks, three weeks, one month, two months, three months, six months, one year, or any other time period. Thus, theperformance report module 22 provides thehost 40 with reports that indicate changes in sensor data over various time periods. -
Figure 2 is a diagram illustrating acontinuous analyte sensor 210 in communication with amobile receiver 220 in accordance with one embodiment. Themobile receiver 220 can be a portable receiver that is carried by ahost 240, for example. In one exemplary environment, thehost 240 has diabetes and themobile receiver 220 tracks a blood glucose level of thehost 240 based onintermittent sensor readings 212 from thecontinuous analyte sensor 210. (Continuous analyte sensor 210 can be the same sensor asanalyte sensor 10 described with reference toFigure 1 .) Themobile receiver 220 can be configured to be worn by thehost 240, such as on the wrist of thehost 240, or supported by a belt or clip on thehost 240. Themobile receiver 220 can comprise a mobile electronic device that includes other functionality, such as a mobile telephone, personal digital assistant, personal computer, smart phone, digital media player, exercise monitoring device, geographic position-tracking device (e.g., GPS) or any other similar device. In one embodiment,mobile receiver 220 includes some or all of the functionality of thehost computing device 20 described with reference toFigure 1 . - In the embodiment of
Figure 2 , thecontinuous analytes sensor 210 transmitsintermittent sensor readings 212 to themobile receiver 220, which comprises historicalsensor data storage 230 for storing sensor data (e.g. such as volatile and/or nonvolatile memory), including the receivedintermittent sensor readings 212. Thus, themobile receiver 220 stores sensor data from thecontinuous analytes sensor 210 that may be analyzed in order to determine performance indicators and generate performance reports associated withhost 240. In one embodiment, historicalsensor data storage 230 includes some or all of the functionality of the historicalsensor data storage 30 described with reference toFigure 1 . - The
mobile receiver 220 can also comprises aperformance report module 222 that is configured to determine one or more performance indicators indicating comparisons of sensor data from two or more analysis time periods and to generate one or more performance reports (e.g., user interfaces that are displayable on a display device) that illustrate certain of the performance indicators. The exemplarymobile receiver 220 also includes adisplay 250 configured to depict the performance indicators and/or certain user interfaces generated by theperformance report module 222. In addition, themobile receiver 220 may include a telemetry module (or other transceiver) that is configured to receive and transmit sensor data and/or performance reports to and from other devices, such as one or more computing devices that may analyze the sensor data and generate performance reports and/or other reports associated with the sensor data. Such devices may transmit generated reports back to themobile receiver 220 such that the reports can be depicted to behost 240 on thedisplay 250. -
Figure 3 is a flow diagram illustrating a method of generating performance indicators associated with sample data of a host in accordance with one embodiment. In the embodiment ofFigure 3 , continuous sensor readings from two analysis time periods, such as sequential or nonsequential time periods, are selected for analysis. The sample data from the two analysis time periods is then analyzed to generate one or more performance indicators, which may be displayed as part of one or more of multiple possible performance reports that generally indicate changes in the sensor data of the host from one analysis period to the next analysis period. In some embodiments, sample data from more than two analysis time periods may be selected and analyzed, such that performance indicators are generated from each of the more than two analysis time periods and performance reports that indicate changes in the sensor data and/or performance indicators over the more than two analysis time periods may be generated. - In the example of
Figure 3 , the historicalsensor data storage 310, which can bedata storage sensor Figure 3 , continuous sensor data fromanalysis time period 320 and continuous sensor data fromanalysis time period 330 are both transmitted to astatistical analysis module 340. Thestatistical analysis module 340 can be configured to analyze the sensor data from each of the analysis time periods and generate one or more statistical values associated with the sensor data (e.g., the sensor readings) for each of the time periods. The length of the analysis time periods may also vary. For example, in one embodiment, each of the analysis time periods is one week, while in another embodiment each of the analysis time periods is a quarter of a year. Other analysis time periods can be one or more hours, days, weeks, months, quarters of a year or years. Thestatistical analysis module 340, which may comprise computer program code that is executed by a computing device, such as thehost computing device 20 or the mobile receiver 220 (Figure 1 orFigure 2 , respectively), generatesstatistical values 350 based on continuous sensor data fromanalysis time period 320 and generatesstatistical values 360 based on continuous sensor data fromanalysis time period 330. The statistical values for each analysis time period can vary, but generally include one or more indications of glucose variability during the selected time period. The glucose variability may include first, second, or even third order indications of glucose variability. Examples of blood glucose variability include a mean glucose level, a standard deviation of glucose levels during the analysis time period, a trend during the analysis time period, a percentage and/or quantity of days during the analysis time period in which the host was within a target glucose range, a percentage and/or quantity of days within the time period in which the host used the continuous analyte sensor for a minimum time, and any other related statistic. - In the embodiment of
Figure 3 , thestatistical values comparison module 370 that is configured to compare the statistical values in order to generate one ormore performance indicators 380, such as comparison metrics, that are indicative of relationships between the sensor data from the first and second analysis time periods. Theperformance indicators 380 may include numbers, scores, percentages, trends, averages, grades, ranks, images, graphs, charts, and/or any other indicia that are indicative of differences and/or similarities between thestatistical values sensor data - In one embodiment, target sensor data is used instead of the
continuous sensor data performance report module 22, 222 (Figures 1 and2 ) and compared to actual data from the host from a previous analysis time period in order to gauge performance of the host with respect to the target performance goals set by the host's physician. - For example, in the embodiment of
Figure 3 , thecontinuous sensor data 320 may comprise sensor data of thehost continuous sensor data 330. Thus, in this example, when the statistical values and comparison metrics are generated, as described in further detail below, the performance reports and comparison metrics that are generated show the relative performance of the host with respect to the targets provided by the host's physician. - In any of the embodiments discussed herein, target data provided by a caretaker can be used instead of sample data of a host for an analysis time period in order to achieve similar target comparison results. Additionally, multiple analysis time periods, such as three or more, may be analyzed in generating performance reports using target data. Thus, in one embodiment, two analysis time periods comprising host sample data and one analysis time period comprising target data supplied by a physician may be analyzed in generating performance reports for the host.
- In one embodiment,
performance indicators 380 include and/or initiate display of other information to the host, such as statistical, clinical, expert, and/or therapy recommendations/advice that may be aimed at improving overall glucose control, diabetes management, modified timing, and/or amount of pre-prandial insulin dose information, for example. Such information can be associated with respective criteria, such as criteria associated with one or more statistical values, performance indicators, and/or ranges of these values. Thus, if criteria for a particular clinical/therapy recommendation are met, such as if a particular trend in glucose variability is met by a host, the particular clinical/therapy recommendation may be displayed (or otherwise provided, e.g., audibly spoken to the patient via a speaker on the receiver) to the host. A caretaker, such as a parent, guardian, or doctor, can define performance criteria that define when clinical therapy recommendations or other expert advice are provided to the host. The host can be provided with expert advice, e.g., advice from a doctor of the host, via an avatar that is displayed on a display of the host's receiver in response to one or more of the host's performance indicators matching criteria associated with one or more performance criteria established by the host and/or a caretaker of the host, for example. Thus, a caretaker (e.g., doctor) can upload performance criteria (e.g., including performance criteria that are applied to the one or more performance indicators in order to determine if the host has (or hasn't) met desired performance goals) and provide real-time feedback to the host via thereceiver 220 and/or thecomputing device 20, as well as receive the performance information via upload of the information to the caretaker's computing device. - In one embodiment, one or more performance reports that include the
performance indicators 380 are generated for display to the host, such as via thehost computing device 20 and/or themobile receiver 220 ofFigures 1 and2 , for example. - In one embodiment, the
performance report module 22, 222 (Figures 1 ,2 , respectively) comprises thestatistical analysis module 340 and/orcomparison module 370 discussed with respect toFigure 3 . Thus, thehost computing device 20 and/or themobile receiver 220 may be configured to generate statistical values for each of multiple analysis time periods as well as performance indicators and/or performance reports (e.g., user interfaces) including the performance indicators. -
Figure 4 is a flow diagram illustrating the historicalsensor data storage 310, thestatistical analysis module 340, and thecomparison module 370 ofFigure 3 , wherein specific exemplary data is shown communicated between the components. For example, analysistime period data 420 comprises sensor data including 72-300 sensor readings for each day from January to March of a particular year (e.g. 2008) and the analysistime period data 430 comprises sensor data including 72-300 sensor readings for each day from April to June of that same year (e.g., 2008). Thus, in this embodiment the analysis time periods comprise consecutive quarters of a year. In other embodiments, the sensor data may include fewer or additional sensor readings for each 24 hour period. In addition, those of skill in the art will recognize that during certain periods, a host may not use a continuous analytes sensor, or may not properly use a continuous analyte sensor (e.g., the sensor may not be used while on vacation or during exercise or other physical activities, and sensor readings may not be received when the battery of the receiver low or is dead, for example), such that no sensor readings are received. Thus, sensor readings for one or more days (or more) within one of the first or second analysis time periods may include no (or very few) sensor readings. While lack of readings for such a short time period may not be ideal, the embodiments described herein can continue to provide statistical values, performance indicators, and/or performance reports notwithstanding the absence of sensor readings for certain such periods. - In the embodiment of
Figure 4 , thestatistical analysis module 340 determines a mean glucose level for each of the first and second analysis time periods. Here,mean glucose level 450 represents the sample readings during the January to March analysis time period and meanglucose level 460 represents the sample readings during the April to June analysis time period. In other embodiments, other statistical values may be generated by thestatistical analysis module 340. Thecomparison module 370 receives themean glucose levels mean glucose levels -
Figures 5-8 illustrate exemplary performance reports that include various statistical values and performance indicators in accordance with various embodiments. -
Figure 5 illustrates oneexemplary performance report 500 that includes statistical values and performance indicators for each of two analysis time periods, which in this example are months. In particular, theperformance report 500 illustrates statistical values associated with a first analysis time period (from January 29 to February 27) incolumn 510 and statistical values associated with a second analysis period (from February 28 to March 27) incolumn 520. Theperformance report 500 also indicates performance indicators indicative of similarities between the statistical values incolumns column 530. For example, in arow 540, the mean glucose levels of the sensor readings during each of the analysis time periods are provided incolumns column 530 ofrow 540. Theperformance report 500 also includes acolumn 535 that provides a graphical performance indicator that indicates whether a particular performance indicator is generally positive (e.g., indicated by a smiley face or similar graphic), negative (e.g., indicated by a warning indicator - as illustrated inFigure 5 , a frowney face or similar graphic), or neutral (e.g., indicated by a neutral face or similar graphic). In theillustrative performance report 500,row 542 indicates statistics for the standard deviation of sensor readings during the analysis time periods, wherein in the specific exemplary standard deviations have improved by 2% from the first analysis period to the second analysis period, as illustrated incolumn 530 ofrow 542. - The
illustrative performance report 500 also indicates inrows column 530 of each respective row. Theperformance report 500 also includes in row 560 a number of days the analyte sensor was used by this host in each of the two analysis time periods, as well as a change in the number of days the sensor was used by the host incolumn 530 ofrow 560. - In one embodiment, the performance indicators of
column 535, for example, may be based on a combination of more than one statistical value and/or performance indicator. For example, performance indicators may be provided as combinations of time spent in particular ranges, days/percentage of days that sensors are used, and/or any other performance indicators that are available in order to better provide the host, caretakers, and/or any other interested entity in suitable indicators of performance of the host. -
Figure 6A is anexemplary performance report 600 illustrating sensor readings for each of two analysis time periods in accordance with one embodiment. With reference toFigure 6A , two line graphs illustrate average blood glucose levels for each hour of a 24 hour period over the course of the relevant analysis time periods, which in this embodiment include a first analysis time period from January 29 to February 27 and a second analysis time period from February 28 to March 27. InFigure 6B , the same data that is illustrated in the line graphs ofFigure 6A is shown in table format, such that the average blood glucose levels for each one hour period during the relevant time periods are shown in each field. For example, infield 610, the blood glucose level of 214 mg/dL indicates that during the first analysis time period from January 29 to February 27 the host had an average blood glucose level of 214 mg/dL during the hour from 12 am to 12:59 am (which may have included from 5-60 sensor readings per day during that time period). Similarly, the blood glucose level of 145 mg/dL indicates that during the time period from January 29 to February 27 the host had an average blood glucose level of 145 mg/dL during the hour from 1 am to 1:59 am. Each of the fields of the table ofFigure 6B may be associated with multiple sample readings from multiple days, such as 2-20 sample readings per day, for example. In other embodiments, continuous sensor readings may be averaged over shorter or longer time periods, such as periods of 10 minutes, 30 minutes, or two hours, for example. -
Figure 7 is anexemplary performance report 700 illustrating a bar graph showing exemplary success metrics from each of the two compared analysis time periods. In the embodiment ofFigure 7 , bar graphs for each of the two analysis time periods are provided side-by-side for each of a number of statistical values. Thus, the viewer can easily distinguish a general performance of the host based on differences in the bar graphs for various statistical values. InFigure 7 , the performance report illustrates bar graphs for each of the two analysis time periods including A1c% values 710, mean glucose values 720, standard deviation values 730, percentage intarget values 740, and days sensor usedvalues 750. In other embodiments, additional or fewer statistical values may be included in a similar performance report. -
Figure 8 is anexemplary performance report 800 illustrating pie graphs showing percentage of time that a host was in each of a plurality of predefined blood glucose ranges during each of the two analysis time periods. In this embodiment, the predefined ranges include a hypoglycemia range, a target range, a higher range, and a hyperglycemia range. In other embodiments, the ranges may include fewer or additional ranges. Depending on the embodiment, the ranges may be predefined by a software application and/or may be user-definable, such as by a host, caretaker of a host, or physician. Additionally, theperformance report 800 may include a performance indicator, such as a comparison pie graph, that shows a difference between the percentage time in each of the ranges between the two comparison time periods. For example, the graph may illustrate that the host decreased 4% from the first analysis period to the second analysis time period in the amount of time spent in the high range. - Although A1c% values are not indicated in the
report 700 or report 800, in one embodiment, a user can input A1c% values - viahost computer 20 ormobile receiver 220, for example. In another embodiment,performance report module 22, 222 (Figures 1 and2 , respectively) can calculate estimated A1c% values based on historical sensor data stored inhistorical sensor storage 30, 203, for example. In other words, an estimated A1c% can be calculated based on continuous glucose sensor readings. In either embodiment, the inputted and/or estimated A1c% values can then be illustrated in the performance reports 700 and 800. - There are a myriad of ways an estimated A1c% can be calculated using continuous analyte sensor readings. For example, an estimated A1c% can be calculated based on a magnitude and amount of time that a host's continuous glucose sensor readings fall outside of or inside a predetermined range during an analysis time period. For example, the estimated A1c% can be calculated by integrating the area bounded between a host's glucose level (based on the host's continuous glucose sensor readings during an analysis time period) and upper and/or lower levels of the predetermined range, while the host's glucose level falls outside of the predetermined range. In another example, the A1c% value is based only on a time and magnitude that the host's glucose level, as indicated by the host's continuous glucose sensor readings, exceed a threshold.
- An estimated A1c% can be based on other statistical calculations (in addition to or in place of the exemplary integration calculation mentioned above), including one or more of the following: weighting glucose values based the time of the day the glucose values were measured, standard deviation (SD), percentage coefficient of variation (%CV), interquartile range (IQR), mean amplitude of glucose excursion (MAGE), mean of daily differences (MODD), continuous overlapping net glycemic action over an n-hour period (CONGAn), a weighted average of glucose values (MR) (e.g., M100 is M at 100mg=dL), a measure of quality of glycemic control based on mean and SD (J), the Glycemic Risk Assessment Diabetes Equation (GRADE), the Index of Glycemic Control (IGC), the High Blood Glucose Index (HBGI), the Low Blood Glucose Index (LBGI), the Average Daily Risk Range (ADRR), and percentage of glucose values within specified ranges.
- Performance reports can also be based on or include a variety of other statistical information. For example,
performance report module - In one embodiment, the GVI is representative of a magnitude and amount of time that a host's glucose levels fall outside of or inside a predetermined range during an analysis time period. For example, the GVI can be calculated by integrating the area bounded between a host's glucose level over an analysis time period (based on the host's continuous glucose sensor readings) and upper and/or lower levels of the predetermined range, while the host's glucose level falls outside of the predetermined range. The predetermined range can define a range of acceptable glucose concentration levels of the host. The upper and lower thresholds of the range can be set and modified by the host or the host's caretaker or healthcare provider using
host computing device 20 ormobile receiver 220, for example. - In one embodiment, the GVI is calculated using additional or other statistical values based on the host's continuous blood glucose sensor readings, including one or more of: weighting glucose values based the time of the day the glucose values were measured, standard deviation (SD), percentage coefficient of variation (%CV), interquartile range (IQR), mean amplitude of glucose excursion (MAGE), mean of daily differences (MODD), continuous overlapping net glycemic action over an n-hour period (CONGAn), a weighted average of glucose values (MR) (e.g., M100 is M at 100mg=dL), a measure of quality of glycemic control based on mean and SD (J), the Glycemic Risk Assessment Diabetes Equation (GRADE), the Index of Glycemic Control (IGC), the High Blood Glucose Index (HBGI), the Low Blood Glucose Index (LBGI), the Average Daily Risk Range (ADRR), and percentage of glucose values within specified ranges.
- The GVI can also be separated into different GVI components to provide a more comprehensive indication of a host's glucose control. In one embodiment, the GVI can include a total GVI component (GVItotal), a hyperglycemia GVI component (GVIhyper) and a hypoglycemia component (GVIhypo). The GVIhyper component can be indicative of hyperglycemia control based entirely or substantially in part on sensor values that exceed an upper threshold of a predetermined range (i.e. a hyperglycemia threshold); for example, based on a time and magnitude of continuous sensor readings exceeding the upper threshold. The GVIhypo component can be indicative of hypoglycemia control based entirely or partially on sensor values that fall below a lower threshold of a predetermined range (i.e. a hypoglycemia threshold); for example, based on a time and magnitude of continuous sensor readings falling below the lower threshold. The GVItotal can be a sum of the GVIhyper and GVIhypo components. A value for each of these components can be displayed on an electronic device, such as on
computing device 20 orreceiver 220. In this manner, a user can obtain a better understanding of a host's glucose control because the user can obtain a measure over overall control (GVItotal), in addition to measures of control in hyperglycemia (GVIhyper) and hypoglycemia (GVIhypo) ranges. -
Figure 9 is anexemplary user interface 900 in accordance with one embodiment. Theuser interface 900 can combine performance reports and/or other performance indicators, such as those described above, into a single user interface for display and interaction with a user. Theuser interface 900 can be implemented using computer program code stored on a computing device used by a host to monitor and track blood glucose levels. For example, theperformance report module 22, which may reside on thehost computing device 20 and/or other suitable computing device, may comprise computer program code configured to analyze sensor historical data, generate one or more performance reports, and implement theuser interface 900 ofFigure 9 . - As illustrated in
Figure 9 , theuser interface 900 includesfields entry field 910 and a start date of a second analysis period in theentry field 920. In the embodiment illustrated inFigure 9 , the default analysis time period is set for one week and the start date of the second analysis period is defaulted to begin immediately after the end date of the first analysis period (i.e. defaulted to have consecutive analysis periods). Thus, in this embodiment, a computing device supporting user interface 900 (e.g.,device 20 ofFigure 1 ) automatically calculates and displays onuser interface 900 the end date of the first analysis period and the start date and end date of the second analysis period. The user can also modify the second start date by inputting a different start date in thefield 920 of theuser interface 900. In this way, a user can compare two analysis periods that are nonconsecutive. Additionally, if a different analysis time period is desired, a user can input a different analysis time period by selecting a desired analysis time period via drop downmenu 930. The drop downmenu 930 can allow the user to select one of a variety of analysis time periods, such as days, months, quarters, or years, or other custom time periods. After selecting the analysis time period of interest, a computing device supporting user interface 900 (e.g.,device 20 ofFigure 1 ) can access relevant, associated historical sensor data (stored instorage 30, for example) and generate statistical values, performance indicators, and performance reports for display to the host and/or others on a display of a computing device, such ashost computing device 20 ormobile receiver 220. For example, theuser interface 900 ofFigure 9 includes many of the performance reports illustrated inFigures 5-8 , discussed above. - It should also be understood that
user interface 900 can be modified to display any of the other performance statistics (e.g., performance reports, performance indicators, and/or statistical values based on sensor readings) described herein. In addition, more than two time analysis periods can be selected and displayed onuser interface 900. Furthermore, theuser interface 900 can be modified to display performance reports that compare multiple analysis time periods with target sensor data. - In one embodiment, performance statistics generated by the
computing device 20 and/ormobile receiver 220 may be transmitted to a physician's computing device, personal health records system, and/or other networked health record system. The performance statistics can be transmitted with or without the underlying continuous sensor readings on which the performance statistics are based. In this manner, the need/desire for transmitting all of the continuous sensor readings to a remote device, e.g. a central storage device accessible by the host's physician, may be reduced, because the performance statistics can provide all of the information desired by the physician. For example, if the physician receives a performance report showing how the host's glucose variability has changed month over month and/or quarter over quarter, the physician may not be as interested in viewing, or may not need to view, the individual glucose readings generated from the host'scontinuous analyte sensor 10, 210 (Figures 1 and2 ), because the performance report may provide all of the information needed by the physician. - In one embodiment, a report module (not shown) generates a user interface that may be used by a caretaker, such as a doctor, in order to allow the caretaker access to sensor data from multiple hosts and, accordingly, to statistical values, performance indicators, and performance reports for multiple host. Accordingly, such a user interface may allow the physician to view comparisons of performance across multiple selectable population groups. For example, a user interface may be configured to allow a caretaker to select patients based on any one or more demographic (or other) criteria, such as age, gender, etc. Thus, the caretaker may compare the performance of all male patients between the ages of five and fifteen, comparing the period from December-March to July-August, and request a certain set of performance indicators and/or performance reports. For example, the physician may request that performance indicators indicating percentage of time in each of certain ranges and percentage of time the sensors are used are included in performance reports. Accordingly, the report module provides the caretaker with a broader based performance report that may be used to provide therapy recommendations to patients, for example.
- In one embodiment, the
user interface 900 is capable of automatically recognizing another other electronic device upon connection with the other device. The connection can be either a wireless or wire connection. In this manner, a user does not have to perform any additional actions to tell the either device that the other device is there. These functions can be accomplished using Plug and Play (PnP) or Universal Plug and Play (UPnP) protocols, both of which were developed by Microsoft Corporation. As a non-limiting example, theuser interface 900, incorporated into a hand-held mobile device, for example, can automatically install on a computing device, such ashost computing device 20 ormobile receiver 220, obtain historical sensor data and/or generate a performance report based on the historical sensor data, upon connection of theuser interface 900 with another electric device. -
Figure 10 is a flowchart illustrating a method of generating performance reports indicating performance indicators between continuous sensor data from two or more analysis time periods in accordance with one embodiment. The various tasks performed in connection with the method ofFigure 10 may be implemented by software, hardware, firmware, a computer-readable medium storing computer executable instructions for performing the process method, or any combination thereof. In addition, the various tasks performed in connection with the method ofFigure 10 may be performed by any suitable computing device, such as thehost computing device 20 ofFigure 1 , themobile receiver 220 ofFigure 2 , and/or any other suitable computing device. For ease of convenience, the method of Figured 10 may be described from time-to-time with respect to thehost computing device 20; however, any reference to thehost computing device 20 should be construed to cover any other suitable computing device, includingmobile receiver 220. Furthermore, a task associated with a block may be performed by one computing device while other tasks associated with the same block or other blocks may be performed by other computing device(s). Depending on the embodiment, the method ofFigure 10 may include fewer or additional blocks and the blocks may be performed in a different order than is described and illustrated inFigure 10 . - Beginning in block 1010, the
host computing device 20 accesses historical continuous sensor data for each of two (or more) analysis time periods. For example, thehost computing device 20 may access historicalsensor data storage 30 that stores continuous sensor readings for a period of weeks, months, years, or mores. The historical sensor data can include multiple sensor readings per hour, such as more than 72 sensor readings per 24 hour period from a continuous analyte sensor. The historical sensor data for the analysis time periods may be stored local to thehost computing device 20, e.g. on a hard drive or optical drive of the computing device, or may be accessed via one or more network connections, e.g., via a local area connections to a server that stores the data. - Moving to block 1020, the
host computing device 20 determines one or more statistical values for each of the analysis time periods. The calculated statistical values may include, for example, one or more indications of glucose variability, such as mean glucose levels, standard deviation of glucose levels during the analysis time period, percentage and/or quantity of days during the analysis time period in which the host was within a target glucose range, a hyperglycemic range, a hypoglycemic range, and/or any other custom defined range, a percentage and/or quantity of days within the time period in which the host used the continuous analyte sensor for a minimum time, and any other related statistic. - Next, in
block 1030 thehost computing device 20 determines one or more performance indicators that indicate differences and/or similarities between the statistical values and/or sensor data of the two or more analysis time periods. The performance indicators may include comparison metrics, such as numbers, scores, percentages, trends, averages, grades, ranks, images, graphs, charts, and/or any other indicia that are indicative of differences and/or similarities between the statistical values deterring inblock 1020. - Moving to block 1040, the host computing device generates one or more performance reports, such as interactive user interfaces, tables, charts, graphs, or any other reports that are illustrative of differences and/or similarities in the continuous sensor readings from the analysis time periods. The performance reports may include reports such as those illustrated in
Figures 5-9 , for example, and/or any other performance report. The performance reports may then be displayed on a user interface of a computing device, such as theuser interface 900. -
Figure 11 is a flowchart of a method of receiving user input for generating customized performance reports, wherein the performance reports include performance indicators indicating comparisons between continuous sensor data from two or more analysis time periods, in accordance with one embodiment. The various tasks performed in connection with the method ofFigure 11 may be implemented by software, hardware, firmware, a computer-readable medium storing computer executable instructions for performing the process method, or any combination thereof. In addition, the various tasks performed in connection with the method ofFigure 10 may be performed by any suitable computing device, such as thehost computing device 20 ofFigure 1 , themobile receiver 220 ofFigure 2 , and/or any other suitable computing device. For ease of convenience, the method of Figured 11 may be described from time-to-time with respect to thehost computing device 20; however, any reference to thehost computing device 20 should be construed to cover any other suitable computing device. Furthermore, a task associated with certain of the blocks may be performed by one computing device while other tasks associated with the same or other blocks may be performed by other computing device(s). Depending on the embodiment, the method ofFigure 11 may include fewer or additional blocks and the blocks may be performed in a different order than is described and illustrated inFigure 11 . - Beginning in
block 1110, a user, such as thehost 40, doctor, or caretaker, provide the analysis time periods that are to be analyzed in performance reports. For example, a host executing theperformance report module 22 on thehost computing device 20 may be presented with a user interface, such as the user interface ofFigure 9 , wherein the host can select the analysis time period via one or more interface controls. As noted above with reference toFigure 9 , theuser interface 900 includes interface controls that allow selection of a default analysis time periods (e.g., via drop down menu 930) and selection of a start date for the first analysis time period (e.g., in field 910), as well as a start date for the second analysis time period (e.g., in field 920). In one embodiment, selection of the analysis time periods is provided via a web accessible user interface. - Next, in
block 1120 the user optionally provides an indication of one or more performance indicators and/or performance reports of interest. For example, one user may want to see a performance report indicating percentage differences of times in which the host was in each of three target blood glucose ranges in two consecutive quarters, while another user may want to see a performance report indicating percentage differences in hours that sensor readings were received from one week to the next over a period of several weeks. In certain embodiments, one or more default performance indicators are preselected and will be determined unless they are deselected by the user. - Moving to block 1130, the historical sensor data associated with the host during the analysis time periods is accessed. As noted above with reference to block 1010, such data may be accessed either local to the host computing device or remote to the host computing device via one or more network connections. Advantageously, the historical sensor data for each of the selected analysis periods includes multiple sensor readings, such as from 72-288 sensor readings, per 24 hour period.
- In
block 1140, the host computing device determines one or more statistical values for each of the user-selected analysis time periods. The calculated statistical values may include, for example, one or more of various indications of glucose variability. - Next, in
block 1150, one or more user-selected performance reports are generated including the user-selected performance indicators and/or other determined statistical values. For example, performance reports may be delivered to the user via a web interface, e.g., via a web browser, or via a stand-alone software application. Advantageously, the performance reports illustrate differences and/or similarities in sensor data for extended periods of time (e.g., comparisons of consecutive weeks, months, or quarters). - Note that one or more of the functions described in any of the above embodiments can be performed by firmware stored in a computer-readable storage medium and executed by a processor of
computing device 20 orreceiver 220. The firmware can also be stored and/or transported within any computer-readable storage medium for use by or in connection with an instruction execution system, apparatus, or device, such as a computer-based system, processor-containing system, or other system that can fetch the instructions from the instruction execution system, apparatus, or device and execute the instructions. - While various embodiments of the invention have been described above, it should be understood that they have been presented by way of example only, and not by way of limitation. Likewise, the various diagrams may depict an example architectural or other configuration for the disclosure, which is done to aid in understanding the features and functionality that can be included in the disclosure. The disclosure is not restricted to the illustrated example architectures or configurations, but can be implemented using a variety of alternative architectures and configurations. Additionally, although the disclosure is described above in terms of various exemplary embodiments and implementations, it should be understood that the various features and functionality described in one or more of the individual embodiments are not limited in their applicability to the particular embodiment with which they are described. They instead can be applied, alone or in some combination, to one or more of the other embodiments of the disclosure, whether or not such embodiments are described, and whether or not such features are presented as being a part of a described embodiment. Thus the breadth and scope of the present disclosure should not be limited by any of the above-described exemplary embodiments.
- It will be appreciated that, for clarity purposes, the above description has described embodiments with reference to different functional units. However, it will be apparent that any suitable distribution of functionality between different functional units may be used without detracting from the invention. For example, functionality illustrated to be performed by separate computing devices may be performed by the same computing device. Likewise, functionality illustrated to be performed by a single computing device may be distributed amongst several computing devices. Hence, references to specific functional units are only to be seen as references to suitable means for providing the described functionality, rather than indicative of a strict logical or physical structure or organization.
- Unless otherwise defined, all terms (including technical and scientific terms) are to be given their ordinary and customary meaning to a person of ordinary skill in the art, and are not to be limited to a special or customized meaning unless expressly so defined herein.
- Terms and phrases used in this application, and variations thereof, especially in the appended claims, unless otherwise expressly stated, should be construed as open ended as opposed to limiting. As examples of the foregoing, the term 'including' should be read to mean 'including, without limitation,' 'including but not limited to,' or the like; the term 'comprising' as used herein is synonymous with 'including,' 'containing,' or 'characterized by,' and is inclusive or open-ended and does not exclude additional, unrecited elements or method steps; the term 'having' should be interpreted as 'having at least;' the term 'includes' should be interpreted as 'includes but is not limited to;' the term 'example' is used to provide exemplary instances of the item in discussion, not an exhaustive or limiting list thereof; adjectives such as 'known', 'normal', 'standard', and terms of similar meaning should not be construed as limiting the item described to a given time period or to an item available as of a given time, but instead should be read to encompass known, normal, or standard technologies that may be available or known now or at any time in the future; and use of terms like 'preferably,' 'preferred,' 'desired,' or 'desirable,' and words of similar meaning should not be understood as implying that certain features are critical, essential, or even important to the structure or function of the invention, but instead as merely intended to highlight alternative or additional features that may or may not be utilized in a particular embodiment of the invention. Likewise, a group of items linked with the conjunction 'and' should not be read as requiring that each and every one of those items be present in the grouping, but rather should be read as 'and/or' unless expressly stated otherwise. Similarly, a group of items linked with the conjunction 'or' should not be read as requiring mutual exclusivity among that group, but rather should be read as 'and/or' unless expressly stated otherwise.
- With respect to the use of substantially any plural and/or singular terms herein, those having skill in the art can translate from the plural to the singular and/or from the singular to the plural as is appropriate to the context and/or application. The various singular/plural permutations may be expressly set forth herein for sake of clarity.
- It will be further understood by those within the art that if a specific number of an introduced claim recitation is intended, such an intent will be explicitly recited in the claim, and in the absence of such recitation no such intent is present. For example, as an aid to understanding, the following appended claims may contain usage of the introductory phrases "at least one" and "one or more" to introduce claim recitations. However, the use of such phrases should not be construed to imply that the introduction of a claim recitation by the indefinite articles "a" or "an" limits any particular claim containing such introduced claim recitation to embodiments containing only one such recitation, even when the same claim includes the introductory phrases "one or more" or "at least one" and indefinite articles such as "a" or "an" (e.g., "a" and/or "an" should typically be interpreted to mean "at least one" or "one or more"); the same holds true for the use of definite articles used to introduce claim recitations. In addition, even if a specific number of an introduced claim recitation is explicitly recited, those skilled in the art will recognize that such recitation should typically be interpreted to mean at least the recited number (e.g., the bare recitation of "two recitations," without other modifiers, typically means at least two recitations, or two or more recitations). Furthermore, in those instances where a convention analogous to "at least one of A, B, and C, etc." is used, in general such a construction is intended in the sense one having skill in the art would understand the convention (e.g., "a system having at least one of A, B, and C" would include but not be limited to systems that have A alone, B alone, C alone, A and B together, A and C together, B and C together, and/or A, B, and C together, etc.). In those instances where a convention analogous to "at least one of A, B, or C, etc." is used, in general such a construction is intended in the sense one having skill in the art would understand the convention (e.g., "a system having at least one of A, B, or C" would include but not be limited to systems that have A alone, B alone, C alone, A and B together, A and C together, B and C together, and/or A, B, and C together, etc.). It will be further understood by those within the art that virtually any disjunctive word and/or phrase presenting two or more alternative terms, whether in the description, claims, or drawings, should be understood to contemplate the possibilities of including one of the terms, either of the terms, or both terms. For example, the phrase "A or B" will be understood to include the possibilities of "A" or "B" or "A and B."
- All numbers expressing quantities of ingredients, reaction conditions, and so forth used in the specification are to be understood as being modified in all instances by the term 'about.' Accordingly, unless indicated to the contrary, the numerical parameters set forth herein are approximations that may vary depending upon the desired properties sought to be obtained.
Claims (15)
- A method, performed by a host computing device (220), of analyzing continuous analyte sensor data (310) associated with a host (240), wherein the continuous analyte sensor data is representative of analyte levels of the host (240), the method comprising:accessing (1010) a plurality of analyte readings (310) associated with a host (240) during first and second analysis time periods, wherein each analyte reading is indicative of an analyte level of the host (240) at a respective time;determining (1020) one or more first statistical values (350) associated with the first analysis time period based on the analyte readings of the host (240) received during the first analysis time period;determining (1020) one or more second statistical values (360) associated with the second analysis time period based on the analyte readings of the host (240) received during the second analysis time period;comparing the first one or more statistical values and the second one or more statistical values in order to determine (1030), as a comparison metric, a number indicating a relationship between the first one or more statistical values (350) and the second one or more statistical (360) values;generating (1040) a performance report including the comparison metric, the performance report indicating a change between the plurality of analyte readings of the first and second analysis time periods, wherein the performance report is indicative of analyte control by the host (240) over the first and second analysis time periods; andtransmitting the performance report to a computing device of a physician.
- The method of claim 1, further comprising:receiving at least one performance criteria uploaded by a physician;applying the at least one performance criteria to the comparison metric in order to determine whether the host (240) has met at a performance goal; and receiving real-time feedback from the physician.
- The method of Claim 1, wherein the performance report further indicates a relationship between the plurality of analyte readings of the two or more analysis time periods and target sensor data.
- The method of Claim 1, further comprising:
initiating transmission of appropriate clinical feedback to the host in response to determining that the relationship between the plurality of analyte readings meets criteria indicative of providing the host with clinical feedback. - The method of Claim 1, wherein the plurality of analyte readings comprises more than 72 glucose readings for each 24 hour period of an at least one week period.
- The method of Claim 1, further comprising:receiving from a user an indication of a first starting date of the first analysis time period;determining a first ending date of the first analysis time period by adding a predetermined time period to the first starting date;determining a second starting date of the second analysis time period; anddetermining a second ending date of the second analysis time period by adding the predetermined time period to the second starting date.
- The method of Claim 6, wherein the second starting date of the second analysis time period is a day that immediately follows the first ending date.
- The method of Claim 6, wherein the one or more first statistical values (350) comprise a first mean analyte level of the analyte levels received during the first analysis time period.
- The method of Claim 8, wherein the one or more second statistical values (360) comprise a second mean analyte level of the analyte levels received during the second analysis time period.
- The method of Claim 9, wherein the comparison metric indicates at least a percentage difference between the first mean analyte level and second mean analyte level.
- The method Claim 1, further comprising:intermittently receiving analyte sensor data from one or more analyte sensors (210) associated with a host (240) at each of a plurality of sample times;determining a plurality of glucose levels of the host (240) at each of the plurality of sample times, wherein the glucose levels are based on at least respective analyte sensor data; andstoring the plurality of glucose levels on a storage device,wherein:accessing (1010) a plurality of analyte readings associated with a host (240) during first and second analysis time periods comprises accessing at least the glucose levels associated with the host (240) during a first analysis time period and a second analysis time period;determining (1020) one or more first statistical values (350) associated with the first analysis time period comprises determining a first mean glucose level of the host (240) during the first analysis time period, the first mean glucose level being based on each of the glucose levels of the host (240) received during the first analysis time period;determining (1020) one or more second statistical values (360) associated with the second analysis time period comprises determining a second mean glucose level of the host (240) during the second analysis time period, the second mean glucose level being based on each of the glucose levels of the host (240) received during the second analysis time period;the relationship indicated by the comparison metric between the first one or more statistical values and the second one or more statistical values comprises at least a percentage difference between the first mean glucose level of the host during the first analysis time period and the second mean glucose level of the host during the second analysis time period; andthe relationship in the performance report is based on the percentage difference.
- The method of Claim 11, wherein the predetermined time period is selected from the group consisting of 1 week, 1 month, 2 months, 3 months, 4 months, 5 months, 6 months, 9 months, and 1 year.
- The method of Claim 11, wherein the first analysis time period and the second analysis time period each comprise substantially a quarter of a year.
- The method of one of Claims 6-13, wherein the predetermined time period is selected by the user.
- A system (220) for generating performance reports associated with continuous analyte sensor data (310), comprising:a computer-implemented user interface (250) configured to receive performance report generation instructions from a user;a data storage module (230) configured to store continuous analyte sensor data indicative of one or more analyte levels of a host (240);a continuous analyte sensor (210) configured to generate the continuous sensor analyte data and transmit the continuous sensor analyte data to the data storage module; anda performance report module (222) communicatively coupled to the user interface and the data storage module and configured to implement one of the methods of Claims 1-14, wherein the user interface (250) is additionally configured to display the generated performance report.
Priority Applications (2)
| Application Number | Priority Date | Filing Date | Title |
|---|---|---|---|
| EP21177144.9A EP3925533B1 (en) | 2009-04-30 | 2010-04-29 | Performance reports associated with continuous sensor data from multiple analysis time periods |
| EP24158967.0A EP4374790A3 (en) | 2009-04-30 | 2010-04-29 | Performance reports associated with continuous sensor data from multiple analysis time periods |
Applications Claiming Priority (2)
| Application Number | Priority Date | Filing Date | Title |
|---|---|---|---|
| US17443609P | 2009-04-30 | 2009-04-30 | |
| PCT/US2010/033045 WO2010127169A2 (en) | 2009-04-30 | 2010-04-29 | Performance reports associated with continuous sensor data from multiple analysis time periods |
Related Child Applications (2)
| Application Number | Title | Priority Date | Filing Date |
|---|---|---|---|
| EP24158967.0A Division EP4374790A3 (en) | 2009-04-30 | 2010-04-29 | Performance reports associated with continuous sensor data from multiple analysis time periods |
| EP21177144.9A Division EP3925533B1 (en) | 2009-04-30 | 2010-04-29 | Performance reports associated with continuous sensor data from multiple analysis time periods |
Publications (3)
| Publication Number | Publication Date |
|---|---|
| EP2424435A2 EP2424435A2 (en) | 2012-03-07 |
| EP2424435A4 EP2424435A4 (en) | 2013-06-19 |
| EP2424435B1 true EP2424435B1 (en) | 2021-06-02 |
Family
ID=43032787
Family Applications (3)
| Application Number | Title | Priority Date | Filing Date |
|---|---|---|---|
| EP24158967.0A Pending EP4374790A3 (en) | 2009-04-30 | 2010-04-29 | Performance reports associated with continuous sensor data from multiple analysis time periods |
| EP21177144.9A Active EP3925533B1 (en) | 2009-04-30 | 2010-04-29 | Performance reports associated with continuous sensor data from multiple analysis time periods |
| EP10770372.0A Active EP2424435B1 (en) | 2009-04-30 | 2010-04-29 | Performance reports associated with continuous sensor data from multiple analysis time periods |
Family Applications Before (2)
| Application Number | Title | Priority Date | Filing Date |
|---|---|---|---|
| EP24158967.0A Pending EP4374790A3 (en) | 2009-04-30 | 2010-04-29 | Performance reports associated with continuous sensor data from multiple analysis time periods |
| EP21177144.9A Active EP3925533B1 (en) | 2009-04-30 | 2010-04-29 | Performance reports associated with continuous sensor data from multiple analysis time periods |
Country Status (3)
| Country | Link |
|---|---|
| US (3) | US20110004085A1 (en) |
| EP (3) | EP4374790A3 (en) |
| WO (1) | WO2010127169A2 (en) |
Families Citing this family (143)
| Publication number | Priority date | Publication date | Assignee | Title |
|---|---|---|---|---|
| US8480580B2 (en) | 1998-04-30 | 2013-07-09 | Abbott Diabetes Care Inc. | Analyte monitoring device and methods of use |
| US8974386B2 (en) | 1998-04-30 | 2015-03-10 | Abbott Diabetes Care Inc. | Analyte monitoring device and methods of use |
| US8346337B2 (en) | 1998-04-30 | 2013-01-01 | Abbott Diabetes Care Inc. | Analyte monitoring device and methods of use |
| US6175752B1 (en) * | 1998-04-30 | 2001-01-16 | Therasense, Inc. | Analyte monitoring device and methods of use |
| US6949816B2 (en) | 2003-04-21 | 2005-09-27 | Motorola, Inc. | Semiconductor component having first surface area for electrically coupling to a semiconductor chip and second surface area for electrically coupling to a substrate, and method of manufacturing same |
| US9066695B2 (en) | 1998-04-30 | 2015-06-30 | Abbott Diabetes Care Inc. | Analyte monitoring device and methods of use |
| US8688188B2 (en) | 1998-04-30 | 2014-04-01 | Abbott Diabetes Care Inc. | Analyte monitoring device and methods of use |
| US8465425B2 (en) | 1998-04-30 | 2013-06-18 | Abbott Diabetes Care Inc. | Analyte monitoring device and methods of use |
| US6560471B1 (en) | 2001-01-02 | 2003-05-06 | Therasense, Inc. | Analyte monitoring device and methods of use |
| US7381184B2 (en) | 2002-11-05 | 2008-06-03 | Abbott Diabetes Care Inc. | Sensor inserter assembly |
| USD914881S1 (en) | 2003-11-05 | 2021-03-30 | Abbott Diabetes Care Inc. | Analyte sensor electronic mount |
| US10226207B2 (en) | 2004-12-29 | 2019-03-12 | Abbott Diabetes Care Inc. | Sensor inserter having introducer |
| US9398882B2 (en) | 2005-09-30 | 2016-07-26 | Abbott Diabetes Care Inc. | Method and apparatus for providing analyte sensor and data processing device |
| US20090105569A1 (en) | 2006-04-28 | 2009-04-23 | Abbott Diabetes Care, Inc. | Introducer Assembly and Methods of Use |
| US9259175B2 (en) | 2006-10-23 | 2016-02-16 | Abbott Diabetes Care, Inc. | Flexible patch for fluid delivery and monitoring body analytes |
| US7883464B2 (en) | 2005-09-30 | 2011-02-08 | Abbott Diabetes Care Inc. | Integrated transmitter unit and sensor introducer mechanism and methods of use |
| US7697967B2 (en) | 2005-12-28 | 2010-04-13 | Abbott Diabetes Care Inc. | Method and apparatus for providing analyte sensor insertion |
| US9788771B2 (en) | 2006-10-23 | 2017-10-17 | Abbott Diabetes Care Inc. | Variable speed sensor insertion devices and methods of use |
| US9743862B2 (en) | 2011-03-31 | 2017-08-29 | Abbott Diabetes Care Inc. | Systems and methods for transcutaneously implanting medical devices |
| US8029441B2 (en) | 2006-02-28 | 2011-10-04 | Abbott Diabetes Care Inc. | Analyte sensor transmitter unit configuration for a data monitoring and management system |
| US8333714B2 (en) | 2006-09-10 | 2012-12-18 | Abbott Diabetes Care Inc. | Method and system for providing an integrated analyte sensor insertion device and data processing unit |
| US9572534B2 (en) | 2010-06-29 | 2017-02-21 | Abbott Diabetes Care Inc. | Devices, systems and methods for on-skin or on-body mounting of medical devices |
| US20110054275A1 (en) * | 2009-08-31 | 2011-03-03 | Abbott Diabetes Care Inc. | Mounting Unit Having a Sensor and Associated Circuitry |
| US8512243B2 (en) | 2005-09-30 | 2013-08-20 | Abbott Diabetes Care Inc. | Integrated introducer and transmitter assembly and methods of use |
| US20070027381A1 (en) * | 2005-07-29 | 2007-02-01 | Therasense, Inc. | Inserter and methods of use |
| US7731657B2 (en) | 2005-08-30 | 2010-06-08 | Abbott Diabetes Care Inc. | Analyte sensor introducer and methods of use |
| US9521968B2 (en) * | 2005-09-30 | 2016-12-20 | Abbott Diabetes Care Inc. | Analyte sensor retention mechanism and methods of use |
| US11298058B2 (en) | 2005-12-28 | 2022-04-12 | Abbott Diabetes Care Inc. | Method and apparatus for providing analyte sensor insertion |
| WO2007120363A2 (en) | 2005-12-28 | 2007-10-25 | Abbott Diabetes Care, Inc. | Medical device insertion |
| US7885698B2 (en) | 2006-02-28 | 2011-02-08 | Abbott Diabetes Care Inc. | Method and system for providing continuous calibration of implantable analyte sensors |
| US8346335B2 (en) | 2008-03-28 | 2013-01-01 | Abbott Diabetes Care Inc. | Analyte sensor calibration management |
| US7618369B2 (en) | 2006-10-02 | 2009-11-17 | Abbott Diabetes Care Inc. | Method and system for dynamically updating calibration parameters for an analyte sensor |
| US9339217B2 (en) | 2011-11-25 | 2016-05-17 | Abbott Diabetes Care Inc. | Analyte monitoring system and methods of use |
| US8140312B2 (en) | 2007-05-14 | 2012-03-20 | Abbott Diabetes Care Inc. | Method and system for determining analyte levels |
| US8374668B1 (en) | 2007-10-23 | 2013-02-12 | Abbott Diabetes Care Inc. | Analyte sensor with lag compensation |
| US7653425B2 (en) | 2006-08-09 | 2010-01-26 | Abbott Diabetes Care Inc. | Method and system for providing calibration of an analyte sensor in an analyte monitoring system |
| US8473022B2 (en) | 2008-01-31 | 2013-06-25 | Abbott Diabetes Care Inc. | Analyte sensor with time lag compensation |
| US7771320B2 (en) | 2006-09-07 | 2010-08-10 | Nike, Inc. | Athletic performance sensing and/or tracking systems and methods |
| EP2146625B1 (en) | 2007-04-14 | 2019-08-14 | Abbott Diabetes Care Inc. | Method and apparatus for providing data processing and control in medical communication system |
| US8239166B2 (en) | 2007-05-14 | 2012-08-07 | Abbott Diabetes Care Inc. | Method and apparatus for providing data processing and control in a medical communication system |
| US8560038B2 (en) | 2007-05-14 | 2013-10-15 | Abbott Diabetes Care Inc. | Method and apparatus for providing data processing and control in a medical communication system |
| US8260558B2 (en) | 2007-05-14 | 2012-09-04 | Abbott Diabetes Care Inc. | Method and apparatus for providing data processing and control in a medical communication system |
| US8103471B2 (en) | 2007-05-14 | 2012-01-24 | Abbott Diabetes Care Inc. | Method and apparatus for providing data processing and control in a medical communication system |
| US9125548B2 (en) | 2007-05-14 | 2015-09-08 | Abbott Diabetes Care Inc. | Method and apparatus for providing data processing and control in a medical communication system |
| US8600681B2 (en) | 2007-05-14 | 2013-12-03 | Abbott Diabetes Care Inc. | Method and apparatus for providing data processing and control in a medical communication system |
| US8444560B2 (en) | 2007-05-14 | 2013-05-21 | Abbott Diabetes Care Inc. | Method and apparatus for providing data processing and control in a medical communication system |
| WO2008150917A1 (en) * | 2007-05-31 | 2008-12-11 | Abbott Diabetes Care, Inc. | Insertion devices and methods |
| EP2171031B1 (en) | 2007-06-21 | 2018-12-05 | Abbott Diabetes Care Inc. | Health management devices and methods |
| US8617069B2 (en) * | 2007-06-21 | 2013-12-31 | Abbott Diabetes Care Inc. | Health monitor |
| US8160900B2 (en) | 2007-06-29 | 2012-04-17 | Abbott Diabetes Care Inc. | Analyte monitoring and management device and method to analyze the frequency of user interaction with the device |
| US8409093B2 (en) | 2007-10-23 | 2013-04-02 | Abbott Diabetes Care Inc. | Assessing measures of glycemic variability |
| US8591410B2 (en) | 2008-05-30 | 2013-11-26 | Abbott Diabetes Care Inc. | Method and apparatus for providing glycemic control |
| US8924159B2 (en) | 2008-05-30 | 2014-12-30 | Abbott Diabetes Care Inc. | Method and apparatus for providing glycemic control |
| US8986208B2 (en) | 2008-09-30 | 2015-03-24 | Abbott Diabetes Care Inc. | Analyte sensor sensitivity attenuation mitigation |
| US20100198034A1 (en) | 2009-02-03 | 2010-08-05 | Abbott Diabetes Care Inc. | Compact On-Body Physiological Monitoring Devices and Methods Thereof |
| WO2010121084A1 (en) | 2009-04-15 | 2010-10-21 | Abbott Diabetes Care Inc. | Analyte monitoring system having an alert |
| US8483967B2 (en) | 2009-04-29 | 2013-07-09 | Abbott Diabetes Care Inc. | Method and system for providing real time analyte sensor calibration with retrospective backfill |
| EP4374790A3 (en) | 2009-04-30 | 2024-07-31 | DexCom, Inc. | Performance reports associated with continuous sensor data from multiple analysis time periods |
| US9184490B2 (en) | 2009-05-29 | 2015-11-10 | Abbott Diabetes Care Inc. | Medical device antenna systems having external antenna configurations |
| EP3689237B1 (en) | 2009-07-23 | 2021-05-19 | Abbott Diabetes Care, Inc. | Method of manufacturing and system for continuous analyte measurement |
| WO2011025999A1 (en) * | 2009-08-29 | 2011-03-03 | Abbott Diabetes Care Inc. | Analyte sensor |
| DK3718922T3 (en) | 2009-08-31 | 2022-04-19 | Abbott Diabetes Care Inc | Glucose monitoring system and procedure |
| EP3001194B1 (en) * | 2009-08-31 | 2019-04-17 | Abbott Diabetes Care, Inc. | Medical devices and methods |
| US20110106126A1 (en) * | 2009-08-31 | 2011-05-05 | Michael Love | Inserter device including rotor subassembly |
| WO2011041449A1 (en) * | 2009-09-29 | 2011-04-07 | Abbott Diabetes Care Inc. | Sensor inserter having introducer |
| EP2482720A4 (en) | 2009-09-29 | 2014-04-23 | Abbott Diabetes Care Inc | Method and apparatus for providing notification function in analyte monitoring systems |
| WO2011041531A1 (en) | 2009-09-30 | 2011-04-07 | Abbott Diabetes Care Inc. | Interconnect for on-body analyte monitoring device |
| USD924406S1 (en) | 2010-02-01 | 2021-07-06 | Abbott Diabetes Care Inc. | Analyte sensor inserter |
| EP2552532A1 (en) | 2010-03-24 | 2013-02-06 | Abbott Diabetes Care, Inc. | Medical device inserters and processes of inserting and using medical devices |
| US8543354B2 (en) * | 2010-06-23 | 2013-09-24 | Medtronic Minimed, Inc. | Glucose sensor signal stability analysis |
| US11064921B2 (en) | 2010-06-29 | 2021-07-20 | Abbott Diabetes Care Inc. | Devices, systems and methods for on-skin or on-body mounting of medical devices |
| US10136845B2 (en) | 2011-02-28 | 2018-11-27 | Abbott Diabetes Care Inc. | Devices, systems, and methods associated with analyte monitoring devices and devices incorporating the same |
| US9532737B2 (en) * | 2011-02-28 | 2017-01-03 | Abbott Diabetes Care Inc. | Devices, systems, and methods associated with analyte monitoring devices and devices incorporating the same |
| US8844007B2 (en) | 2011-04-08 | 2014-09-23 | Dexcom, Inc. | Systems and methods for processing and transmitting sensor data |
| US20130035865A1 (en) | 2011-08-05 | 2013-02-07 | Dexcom, Inc. | Systems and methods for detecting glucose level data patterns |
| FI3689235T3 (en) * | 2011-09-28 | 2024-06-19 | Abbott Diabetes Care Inc | Methods for analyte monitoring management and analyte measurement data management, and articles of manufacture related thereto |
| US9069536B2 (en) | 2011-10-31 | 2015-06-30 | Abbott Diabetes Care Inc. | Electronic devices having integrated reset systems and methods thereof |
| US8710993B2 (en) | 2011-11-23 | 2014-04-29 | Abbott Diabetes Care Inc. | Mitigating single point failure of devices in an analyte monitoring system and methods thereof |
| LT3831283T (en) | 2011-12-11 | 2023-08-10 | Abbott Diabetes Care, Inc. | Analyte sensor devices, connections, and methods |
| WO2013138369A1 (en) | 2012-03-16 | 2013-09-19 | Dexcom, Inc. | Systems and methods for processing analyte sensor data |
| US20130267812A1 (en) | 2012-04-04 | 2013-10-10 | Dexcom, Inc. | Transcutaneous analyte sensors, applicators therefor, and associated methods |
| US20130325352A1 (en) | 2012-06-05 | 2013-12-05 | Dexcom, Inc. | Calculation engine based on histograms |
| US10598627B2 (en) | 2012-06-29 | 2020-03-24 | Dexcom, Inc. | Devices, systems, and methods to compensate for effects of temperature on implantable sensors |
| US10881339B2 (en) | 2012-06-29 | 2021-01-05 | Dexcom, Inc. | Use of sensor redundancy to detect sensor failures |
| US20140012510A1 (en) | 2012-07-09 | 2014-01-09 | Dexcom, Inc | Systems and methods for leveraging smartphone features in continuous glucose monitoring |
| EP2890297B1 (en) | 2012-08-30 | 2018-04-11 | Abbott Diabetes Care, Inc. | Dropout detection in continuous analyte monitoring data during data excursions |
| US9907492B2 (en) | 2012-09-26 | 2018-03-06 | Abbott Diabetes Care Inc. | Method and apparatus for improving lag correction during in vivo measurement of analyte concentration with analyte concentration variability and range data |
| US9788765B2 (en) | 2012-09-28 | 2017-10-17 | Dexcom, Inc. | Zwitterion surface modifications for continuous sensors |
| US20140129151A1 (en) | 2012-11-07 | 2014-05-08 | Dexcom, Inc. | Systems and methods for managing glycemic variability |
| US9495380B2 (en) | 2012-12-20 | 2016-11-15 | Bank Of America Corporation | Access reviews at IAM system implementing IAM data model |
| US9483488B2 (en) | 2012-12-20 | 2016-11-01 | Bank Of America Corporation | Verifying separation-of-duties at IAM system implementing IAM data model |
| US9529629B2 (en) | 2012-12-20 | 2016-12-27 | Bank Of America Corporation | Computing resource inventory system |
| US9542433B2 (en) | 2012-12-20 | 2017-01-10 | Bank Of America Corporation | Quality assurance checks of access rights in a computing system |
| US9477838B2 (en) | 2012-12-20 | 2016-10-25 | Bank Of America Corporation | Reconciliation of access rights in a computing system |
| US9189644B2 (en) | 2012-12-20 | 2015-11-17 | Bank Of America Corporation | Access requests at IAM system implementing IAM data model |
| US9639594B2 (en) | 2012-12-20 | 2017-05-02 | Bank Of America Corporation | Common data model for identity access management data |
| US9489390B2 (en) | 2012-12-20 | 2016-11-08 | Bank Of America Corporation | Reconciling access rights at IAM system implementing IAM data model |
| US9537892B2 (en) | 2012-12-20 | 2017-01-03 | Bank Of America Corporation | Facilitating separation-of-duties when provisioning access rights in a computing system |
| US10383580B2 (en) * | 2012-12-31 | 2019-08-20 | Abbott Diabetes Care Inc. | Analysis of glucose median, variability, and hypoglycemia risk for therapy guidance |
| US9585563B2 (en) | 2012-12-31 | 2017-03-07 | Dexcom, Inc. | Remote monitoring of analyte measurements |
| US9730620B2 (en) | 2012-12-31 | 2017-08-15 | Dexcom, Inc. | Remote monitoring of analyte measurements |
| US9445445B2 (en) | 2013-03-14 | 2016-09-13 | Dexcom, Inc. | Systems and methods for processing and transmitting sensor data |
| US10335075B2 (en) | 2013-03-14 | 2019-07-02 | Dexcom, Inc. | Advanced calibration for analyte sensors |
| EP3401818B1 (en) | 2013-03-14 | 2023-12-06 | Dexcom, Inc. | Systems and methods for processing and transmitting sensor data |
| US9737250B2 (en) | 2013-03-15 | 2017-08-22 | Dexcom, Inc. | Membrane for continuous analyte sensors |
| US20150013674A1 (en) * | 2013-07-15 | 2015-01-15 | Covidien Lp | System and method for monitoring and reporting status of a ventilated patient |
| EP3066600B1 (en) | 2013-11-07 | 2022-02-16 | Dexcom, Inc. | Systems and methods for transmitting and continuous monitoring of analyte values |
| CA3220825A1 (en) | 2014-04-10 | 2015-10-15 | Dexcom, Inc. | Sensors for continuous analyte monitoring, and related methods |
| US10154095B2 (en) * | 2014-05-21 | 2018-12-11 | N.Io Innovation, Llc | System and method for aggregating and acting on signals from one or more remote sources in real time using a configurable platform instance |
| EP3204880B1 (en) * | 2014-10-06 | 2024-06-05 | Dexcom, Inc. | System and method for data analytics and visualization |
| US20160328990A1 (en) | 2015-05-07 | 2016-11-10 | Dexcom, Inc. | System and method for educating users, including responding to patterns |
| US10213139B2 (en) | 2015-05-14 | 2019-02-26 | Abbott Diabetes Care Inc. | Systems, devices, and methods for assembling an applicator and sensor control device |
| AU2016260547B2 (en) | 2015-05-14 | 2020-09-03 | Abbott Diabetes Care Inc. | Compact medical device inserters and related systems and methods |
| WO2017011346A1 (en) | 2015-07-10 | 2017-01-19 | Abbott Diabetes Care Inc. | System, device and method of dynamic glucose profile response to physiological parameters |
| CN107771056B (en) | 2015-09-10 | 2021-11-16 | 德克斯康公司 | Transcutaneous analyte sensors and monitors, calibrations thereof, and associated methods |
| US10470660B2 (en) | 2015-09-10 | 2019-11-12 | Dexcom, Inc. | Transcutaneous analyte sensors and monitors, calibration thereof, and associated methods |
| LT3364861T (en) | 2015-10-21 | 2022-04-25 | Dexcom, Inc. | Transcutaneous analyte sensors, applicators therefor, and associated methods |
| US20170181645A1 (en) | 2015-12-28 | 2017-06-29 | Dexcom, Inc. | Systems and methods for remote and host monitoring communications |
| EP4253536A3 (en) | 2015-12-30 | 2023-12-20 | DexCom, Inc. | Diffusion resistance layer for analyte sensors |
| EP4088658B1 (en) | 2016-03-31 | 2023-12-06 | DexCom, Inc. | Systems and methods for display device and sensor electronics unit communication |
| US10869624B2 (en) | 2016-10-18 | 2020-12-22 | Senseonics, Incorporated | Real time assessement of sensor performance and prediction of the end of the functional life of an implanted sensor |
| CA3050721A1 (en) | 2017-01-23 | 2018-07-26 | Abbott Diabetes Care Inc. | Systems, devices and methods for analyte sensor insertion |
| WO2018175489A1 (en) | 2017-03-21 | 2018-09-27 | Abbott Diabetes Care Inc. | Methods, devices and system for providing diabetic condition diagnosis and therapy |
| US10382290B2 (en) * | 2017-05-02 | 2019-08-13 | Netscout Systems, Inc | Service analytics |
| JP6409095B1 (en) * | 2017-06-14 | 2018-10-17 | 日機装株式会社 | Blood purification system |
| JP6410880B1 (en) * | 2017-06-14 | 2018-10-24 | 日機装株式会社 | Blood purification system |
| DK3928688T3 (en) | 2017-06-23 | 2022-08-29 | Dexcom Inc | TRANSCUNATE ANALYTE SENSORS, APPLICATORS THEREOF AND CANNULEE HUBS WITH ANTI-ROTATION ELEMENT |
| AU2018319524B2 (en) * | 2017-08-21 | 2024-06-13 | Dexcom, Inc. | Continuous glucose monitors and related sensors utilizing mixed model and bayesian calibration algorithms |
| US11331022B2 (en) | 2017-10-24 | 2022-05-17 | Dexcom, Inc. | Pre-connected analyte sensors |
| US11943876B2 (en) | 2017-10-24 | 2024-03-26 | Dexcom, Inc. | Pre-connected analyte sensors |
| WO2019094908A1 (en) * | 2017-11-13 | 2019-05-16 | Senseonics, Incorporated | Analyte monitoring system and method for determining system usage |
| USD926325S1 (en) | 2018-06-22 | 2021-07-27 | Dexcom, Inc. | Wearable medical monitoring device |
| JP2020014665A (en) * | 2018-07-25 | 2020-01-30 | 日本光電工業株式会社 | Biological information display device and method for outputting biological information displaying data |
| JP2020123084A (en) * | 2019-01-30 | 2020-08-13 | 株式会社Nsd | Bio-information self management system and method therefor, and device used for the same |
| BR112021019398A2 (en) * | 2019-03-29 | 2021-12-07 | Mysugr Gmbh | Computer-implemented method, system for determining relative risk, and computer program product |
| USD1002852S1 (en) | 2019-06-06 | 2023-10-24 | Abbott Diabetes Care Inc. | Analyte sensor device |
| US11540752B1 (en) * | 2020-03-25 | 2023-01-03 | Tula Health, Inc. | Devices, systems, and methods for individualized chronic health condition management |
| KR20220046169A (en) * | 2020-10-07 | 2022-04-14 | 삼성전자주식회사 | Apparatus and method for managing user health |
| USD999913S1 (en) | 2020-12-21 | 2023-09-26 | Abbott Diabetes Care Inc | Analyte sensor inserter |
| USD1013544S1 (en) | 2022-04-29 | 2024-02-06 | Biolinq Incorporated | Wearable sensor |
| USD1012744S1 (en) | 2022-05-16 | 2024-01-30 | Biolinq Incorporated | Wearable sensor with illuminated display |
| US20240252067A1 (en) * | 2023-01-10 | 2024-08-01 | Abbott Diabetes Care Inc. | Systems, devices, and methods for wellness monitoring with physiological sensors |
| USD1035004S1 (en) | 2023-02-28 | 2024-07-09 | Biolinq Incorporated | Wearable sensor |
Family Cites Families (102)
| Publication number | Priority date | Publication date | Assignee | Title |
|---|---|---|---|---|
| DE3379589D1 (en) | 1982-10-25 | 1989-05-18 | Hellgren Lars G I | Enzyme composition for cleaning, the use thereof and preparation of the composition |
| DE3752345T2 (en) | 1986-04-30 | 2002-08-22 | Igen International, Inc. | Electroluminescent compounds and intermediates for manufacturing |
| EP0288793A3 (en) | 1987-04-22 | 1990-04-25 | Abbott Laboratories | Cartridge and methods for performing a solid-phase immunoassay |
| AU619231B2 (en) | 1987-12-21 | 1992-01-23 | Abbott Laboratories | Chromatographic binding assay devices and methods |
| US5866322A (en) | 1988-01-29 | 1999-02-02 | Abbott Laboratories | Method for performing Rubella assay |
| US5244630A (en) | 1988-04-22 | 1993-09-14 | Abbott Laboratories | Device for performing solid-phase diagnostic assay |
| EP0352631A3 (en) | 1988-07-25 | 1991-07-10 | Abbott Laboratories | Optical fiber distribution system for an optical fiber sensor |
| US4907857A (en) | 1988-07-25 | 1990-03-13 | Abbott Laboratories | Optical fiber distribution system for an optical fiber sensor |
| US4925268A (en) | 1988-07-25 | 1990-05-15 | Abbott Laboratories | Fiber-optic physiological probes |
| WO1990007575A1 (en) | 1988-12-30 | 1990-07-12 | Anderson David M | Stabilized microporous materials and hydrogel materials |
| DK115989D0 (en) | 1989-03-09 | 1989-03-09 | Nordisk Gentofte | METHOD AND METHOD FOR MEASURING A LIQUID COMPONENT |
| CA1341592C (en) | 1989-07-07 | 2009-04-14 | Abbott Laboratories | Ion capture reagents and methods for performing binding assays |
| EP0440044A1 (en) | 1990-01-31 | 1991-08-07 | Abbott Laboratories | Avoidance of human anti-mouse antibody interference in in vitro diagnostic testing |
| DE69127482T2 (en) | 1990-02-07 | 1998-03-19 | Abbott Lab | Alkaline phosphatase with improved specific activity for use in indicator reagents |
| ES2089057T3 (en) | 1990-07-18 | 1996-10-01 | Abbott Lab | AN ANALYTE SUBSTITUTE REAGENT FOR USE IN SPECIFIC FIXATION TEST METHODS, DEVICES AND KITS. |
| AU650503B2 (en) | 1990-11-09 | 1994-06-23 | Abbott Laboratories | Amplified heterogeneous chemiluminescent immunoassay |
| AU9146491A (en) | 1990-12-28 | 1992-08-17 | Abbott Laboratories | Simultaneous determination of multiple analytes using a time-resolved heterogeneous chemiluminescence assay |
| AU1356792A (en) | 1991-01-25 | 1992-08-27 | Markwell Medical Institute, Inc. | Implantable biological fluid measuring device |
| EP0573572B1 (en) | 1991-02-27 | 1998-01-21 | Boehringer Mannheim Corporation | Improved test strip |
| JP3127160B2 (en) | 1991-02-27 | 2001-01-22 | ロシュ ダイアグノスティックス コーポレーション | Improved methods and reagents for measuring an analyte |
| WO1992015701A1 (en) | 1991-02-27 | 1992-09-17 | Boehringer Mannheim Corporation | Improved method and reagent for determination of an analyte |
| ES2121016T3 (en) | 1991-05-30 | 1998-11-16 | Abbott Lab | REAGENTS AND PROCEDURES THAT ALLOW PERFORMANCE OF FIXATION ANALYSIS WITH ION CAPTURE IN TWO STAGES. |
| WO1992021980A1 (en) | 1991-05-30 | 1992-12-10 | Abbott Laboratories | Devices for performing ion-capture binding assays |
| ES2136090T3 (en) | 1991-05-30 | 1999-11-16 | Abbott Lab | REAGENTS CONTAINING A NON-SPECIFIC FIXING INHIBITOR FOR FIXING ANALYSIS WITH ION CAPTURE. |
| EP0641388B1 (en) | 1991-05-30 | 1998-09-09 | Abbott Laboratories | Ion-capture assays using a binding member conjugated to carboxymethylamylose |
| CA2110296A1 (en) | 1991-05-30 | 1992-12-10 | Steven Kline | Methods and reagents for performing ion-capture digoxin assays |
| WO1993020444A1 (en) | 1992-03-27 | 1993-10-14 | Abbott Laboratories | Methods for providing homogeneous reagents |
| US5352803A (en) | 1992-03-30 | 1994-10-04 | Abbott Laboratories | 5(6)-methyl substituted fluorescein derivatives |
| AU3945893A (en) | 1992-04-09 | 1993-11-18 | Abbott Laboratories | Assay for detection of HIV antigen and HIV antibody |
| DE69333007T2 (en) | 1992-07-07 | 2004-04-01 | Abbott Laboratories, Abbott Park | ALKALINE PHOSPHATASE ENZYME WITH IMPROVED SPECIFIC ACTIVITY USED AS INDICATOR REAGENTS |
| US5603868A (en) | 1992-10-30 | 1997-02-18 | Abbott Laboratories | Chemiluminescent electron-rich aryl-substituted 1,2-dioxetanes |
| AU666821B2 (en) | 1993-08-05 | 1996-02-22 | Bayer Corporation | Analyte detection device and process |
| US5497772A (en) * | 1993-11-19 | 1996-03-12 | Alfred E. Mann Foundation For Scientific Research | Glucose monitoring system |
| US5443080A (en) | 1993-12-22 | 1995-08-22 | Americate Transtech, Inc. | Integrated system for biological fluid constituent analysis |
| AU1880995A (en) | 1994-03-02 | 1995-09-18 | Abbott Laboratories | Hiv immunoassay utilizing recombinant protein and synthetic peptide reagents |
| AU1997895A (en) | 1994-03-15 | 1995-10-03 | Abbott Laboratories | Ion-capture reagents and methods for performing binding assays |
| EP0763204A1 (en) | 1994-05-31 | 1997-03-19 | Abbott Laboratories | Detection of different hiv genotypes utilizing a synthetic peptide-modified immunoassay |
| IE72524B1 (en) | 1994-11-04 | 1997-04-23 | Elan Med Tech | Analyte-controlled liquid delivery device and analyte monitor |
| US5640470A (en) | 1995-03-27 | 1997-06-17 | Abbott Laboratories | Fiber-optic detectors with terpolymeric analyte-permeable matrix coating |
| US5705330A (en) | 1995-04-14 | 1998-01-06 | Abbott Laboratories | Chemiluminescent immunoassay for antibody detection |
| US6020122A (en) | 1995-06-07 | 2000-02-01 | Abbott Laboratories | Hepatitis C virus second envelope (HCV-E2) glycoprotein expression system |
| CA2223090C (en) | 1995-06-07 | 2010-05-18 | Abbott Laboratories | Improved hapten-peptide conjugates to detect anti-hiv-1 or anti-hiv-2 antibodies |
| US6325978B1 (en) | 1998-08-04 | 2001-12-04 | Ntc Technology Inc. | Oxygen monitoring and apparatus |
| DE19781162C2 (en) | 1996-10-30 | 2002-05-23 | Mercury Diagnostics Inc | Test strips for the analysis of a body fluid sample and for evaluation in a test instrument |
| US5928155A (en) | 1997-01-24 | 1999-07-27 | Cardiox Corporation | Cardiac output measurement with metabolizable analyte containing fluid |
| US6001067A (en) | 1997-03-04 | 1999-12-14 | Shults; Mark C. | Device and method for determining analyte levels |
| US6270455B1 (en) | 1997-03-28 | 2001-08-07 | Health Hero Network, Inc. | Networked system for interactive communications and remote monitoring of drug delivery |
| US5922533A (en) | 1997-08-15 | 1999-07-13 | Abbott Laboratories | Rapid assay for simultaneous detection and differentiation of antibodies to HIV groups |
| US6081736A (en) | 1997-10-20 | 2000-06-27 | Alfred E. Mann Foundation | Implantable enzyme-based monitoring systems adapted for long term use |
| US6119028A (en) | 1997-10-20 | 2000-09-12 | Alfred E. Mann Foundation | Implantable enzyme-based monitoring systems having improved longevity due to improved exterior surfaces |
| CA2308029A1 (en) | 1997-10-31 | 1999-05-14 | Abbott Laboratories | Reagents and methods useful for detecting diseases of the breast |
| US6579690B1 (en) | 1997-12-05 | 2003-06-17 | Therasense, Inc. | Blood analyte monitoring through subcutaneous measurement |
| US6134461A (en) | 1998-03-04 | 2000-10-17 | E. Heller & Company | Electrochemical analyte |
| US7647237B2 (en) * | 1998-04-29 | 2010-01-12 | Minimed, Inc. | Communication station and software for interfacing with an infusion pump, analyte monitor, analyte meter, or the like |
| US6175752B1 (en) | 1998-04-30 | 2001-01-16 | Therasense, Inc. | Analyte monitoring device and methods of use |
| CA2332112C (en) | 1998-05-13 | 2004-02-10 | Cygnus, Inc. | Monitoring of physiological analytes |
| US6558320B1 (en) | 2000-01-20 | 2003-05-06 | Medtronic Minimed, Inc. | Handheld personal data assistant (PDA) with a medical device and method of using the same |
| US6554798B1 (en) | 1998-08-18 | 2003-04-29 | Medtronic Minimed, Inc. | External infusion device with remote programming, bolus estimator and/or vibration alarm capabilities |
| CN102226766B (en) | 1998-08-26 | 2017-03-01 | 医药及科学传感器公司 | Based on optical sensing device further |
| US6087182A (en) | 1998-08-27 | 2000-07-11 | Abbott Laboratories | Reagentless analysis of biological samples |
| US6424847B1 (en) | 1999-02-25 | 2002-07-23 | Medtronic Minimed, Inc. | Glucose monitor calibration methods |
| CA2382113A1 (en) | 1999-08-31 | 2001-03-08 | Cme Telemetrix Inc. | Method of calibrating a spectroscopic device |
| CA2381539A1 (en) | 1999-09-15 | 2001-03-22 | Medtronic Minimed, Inc. | Glucose sensing molecules having selected fluorescent properties |
| IT1314759B1 (en) | 2000-05-08 | 2003-01-03 | Menarini Farma Ind | INSTRUMENTATION FOR MEASUREMENT AND CONTROL OF THE CONTENT OF GLUCOSIOLACTATE OR OTHER METABOLITES IN BIOLOGICAL FLUIDS |
| WO2001088534A2 (en) | 2000-05-16 | 2001-11-22 | Cygnus, Inc. | Methods for improving performance and reliability of biosensors |
| WO2002024065A1 (en) | 2000-09-22 | 2002-03-28 | Knobbe, Lim & Buckingham | Method and apparatus for real-time estimation and control of pysiological parameters |
| US6574490B2 (en) | 2001-04-11 | 2003-06-03 | Rio Grande Medical Technologies, Inc. | System for non-invasive measurement of glucose in humans |
| US7167734B2 (en) | 2001-04-13 | 2007-01-23 | Abbott Laboratories | Method for optical measurements of tissue to determine disease state or concentration of an analyte |
| US6613379B2 (en) | 2001-05-08 | 2003-09-02 | Isense Corp. | Implantable analyte sensor |
| US7399277B2 (en) * | 2001-12-27 | 2008-07-15 | Medtronic Minimed, Inc. | System for monitoring physiological characteristics |
| EP1702561B1 (en) | 2002-03-22 | 2011-05-04 | Animas Technologies LLC | Improving performance for an analyte monitoring device |
| US20070227907A1 (en) | 2006-04-04 | 2007-10-04 | Rajiv Shah | Methods and materials for controlling the electrochemistry of analyte sensors |
| AU2003240018A1 (en) | 2002-05-31 | 2003-12-19 | Dow Corning Toray Silicone Co., Ltd. | Cartridge for moisture-curable sealant |
| US8460243B2 (en) | 2003-06-10 | 2013-06-11 | Abbott Diabetes Care Inc. | Glucose measuring module and insulin pump combination |
| US7591801B2 (en) | 2004-02-26 | 2009-09-22 | Dexcom, Inc. | Integrated delivery device for continuous glucose sensor |
| US7778680B2 (en) | 2003-08-01 | 2010-08-17 | Dexcom, Inc. | System and methods for processing analyte sensor data |
| JP2007507278A (en) | 2003-10-06 | 2007-03-29 | ナイキャスト リミテッド | Method and apparatus for coating medical implants |
| EP2239566B1 (en) | 2003-12-05 | 2014-04-23 | DexCom, Inc. | Calibration techniques for a continuous analyte sensor |
| US8147426B2 (en) | 2003-12-31 | 2012-04-03 | Nipro Diagnostics, Inc. | Integrated diagnostic test system |
| US8165651B2 (en) | 2004-02-09 | 2012-04-24 | Abbott Diabetes Care Inc. | Analyte sensor, and associated system and method employing a catalytic agent |
| JP2007535974A (en) * | 2004-03-26 | 2007-12-13 | ノボ・ノルデイスク・エー/エス | Display device for related data of diabetic patients |
| US7310544B2 (en) * | 2004-07-13 | 2007-12-18 | Dexcom, Inc. | Methods and systems for inserting a transcutaneous analyte sensor |
| US20060017575A1 (en) | 2004-07-20 | 2006-01-26 | Medtronic, Inc. | Alert system and method for an implantable medical device |
| WO2006050485A1 (en) * | 2004-11-02 | 2006-05-11 | Lifescan, Inc. | Method and computer program for pattern analysis and reporting of chronic disease state management data |
| US7904158B2 (en) | 2005-04-28 | 2011-03-08 | Medtronic, Inc. | Measurement of coronary sinus parameters to optimize left ventricular performance |
| US20060276771A1 (en) | 2005-06-06 | 2006-12-07 | Galley Paul J | System and method providing for user intervention in a diabetes control arrangement |
| WO2007002579A2 (en) | 2005-06-23 | 2007-01-04 | Bioveris Corporation | Assay cartridges and methods for point of care instruments |
| US20070016449A1 (en) * | 2005-06-29 | 2007-01-18 | Gary Cohen | Flexible glucose analysis using varying time report deltas and configurable glucose target ranges |
| US7526409B2 (en) * | 2005-10-07 | 2009-04-28 | Oracle International Corporation | Automatic performance statistical comparison between two periods |
| US7941200B2 (en) | 2005-12-08 | 2011-05-10 | Roche Diagnostics Operations, Inc. | System and method for determining drug administration information |
| US7824333B2 (en) * | 2006-03-31 | 2010-11-02 | Lifescan, Inc. | Diabetes management methods and systems |
| US8478406B2 (en) | 2006-04-24 | 2013-07-02 | Medtronic, Inc. | Apparatus and methods of delivering an enhanced refractory period stimulation therapy |
| US20080071157A1 (en) | 2006-06-07 | 2008-03-20 | Abbott Diabetes Care, Inc. | Analyte monitoring system and method |
| WO2009008892A1 (en) | 2006-08-15 | 2009-01-15 | Optiscan Biomedical Corporation | Accurate and timely body fluid analysis |
| US20080306353A1 (en) * | 2006-11-03 | 2008-12-11 | Douglas Joel S | Calculation device for metabolic control of critically ill and/or diabetic patients |
| WO2008076868A2 (en) | 2006-12-18 | 2008-06-26 | Abbott Laboratories | Methods and compositions related to modulation of receptor tyrosine kinase orphan receptor-1 (ror-1) |
| US20080154513A1 (en) * | 2006-12-21 | 2008-06-26 | University Of Virginia Patent Foundation | Systems, Methods and Computer Program Codes for Recognition of Patterns of Hyperglycemia and Hypoglycemia, Increased Glucose Variability, and Ineffective Self-Monitoring in Diabetes |
| US8260558B2 (en) * | 2007-05-14 | 2012-09-04 | Abbott Diabetes Care Inc. | Method and apparatus for providing data processing and control in a medical communication system |
| EP2006786B1 (en) * | 2007-06-18 | 2018-05-09 | Roche Diabetes Care GmbH | Method and glucose monitoring system for monitoring individual metabolic response and for generating nutritional feedback |
| EP2031527A1 (en) * | 2007-07-27 | 2009-03-04 | Sensile Pat AG | Portable medical device |
| US20100095229A1 (en) * | 2008-09-18 | 2010-04-15 | Abbott Diabetes Care, Inc. | Graphical user interface for glucose monitoring system |
| EP4374790A3 (en) | 2009-04-30 | 2024-07-31 | DexCom, Inc. | Performance reports associated with continuous sensor data from multiple analysis time periods |
-
2010
- 2010-04-29 EP EP24158967.0A patent/EP4374790A3/en active Pending
- 2010-04-29 EP EP21177144.9A patent/EP3925533B1/en active Active
- 2010-04-29 US US12/770,618 patent/US20110004085A1/en not_active Abandoned
- 2010-04-29 EP EP10770372.0A patent/EP2424435B1/en active Active
- 2010-04-29 WO PCT/US2010/033045 patent/WO2010127169A2/en active Application Filing
-
2017
- 2017-02-01 US US15/422,196 patent/US11437141B2/en active Active
-
2022
- 2022-08-04 US US17/817,457 patent/US20220392643A1/en active Pending
Non-Patent Citations (1)
| Title |
|---|
| None * |
Also Published As
| Publication number | Publication date |
|---|---|
| EP2424435A2 (en) | 2012-03-07 |
| EP3925533A1 (en) | 2021-12-22 |
| EP4374790A3 (en) | 2024-07-31 |
| US11437141B2 (en) | 2022-09-06 |
| US20110004085A1 (en) | 2011-01-06 |
| US20220392643A1 (en) | 2022-12-08 |
| EP3925533B1 (en) | 2024-04-10 |
| WO2010127169A2 (en) | 2010-11-04 |
| EP4374790A2 (en) | 2024-05-29 |
| EP2424435A4 (en) | 2013-06-19 |
| US20170143251A1 (en) | 2017-05-25 |
| WO2010127169A3 (en) | 2011-02-03 |
Similar Documents
| Publication | Publication Date | Title |
|---|---|---|
| US20220392643A1 (en) | Performance reports associated with continuous sensor data from multiple analysis time periods | |
| US12014821B2 (en) | Systems and methods for managing glycemic variability | |
| JP7416859B2 (en) | Systems and methods for processing analyte data and generating reports | |
| RU2749187C2 (en) | Computer-implemented method and portable apparatus for analysis of glucose control data indicating glucose level in bodily fluid | |
| US10019554B2 (en) | Glycemic risk determination based on variability of glucose | |
| JP6986007B2 (en) | Systems, devices and methods of dynamic glucose profile response to physiological parameters | |
| US10791969B2 (en) | Method and system for method for determining a blood glucose level for a patient | |
| US20230046040A1 (en) | Devices, systems, and methods for analyte monitoring having a selectable or variable response rate | |
| CN113261065A (en) | Systems, devices, and methods for improving meal and therapy interfaces in analyte monitoring systems | |
| CA2952759A1 (en) | A method and a device for determining a body fluid glucose level of a patient, and a computer program product | |
| Vashist et al. | Continuous glucose monitoring systems |
Legal Events
| Date | Code | Title | Description |
|---|---|---|---|
| PUAI | Public reference made under article 153(3) epc to a published international application that has entered the european phase |
Free format text: ORIGINAL CODE: 0009012 |
|
| 17P | Request for examination filed |
Effective date: 20110831 |
|
| AK | Designated contracting states |
Kind code of ref document: A2 Designated state(s): AT BE BG CH CY CZ DE DK EE ES FI FR GB GR HR HU IE IS IT LI LT LU LV MC MK MT NL NO PL PT RO SE SI SK SM TR |
|
| DAX | Request for extension of the european patent (deleted) | ||
| A4 | Supplementary search report drawn up and despatched |
Effective date: 20130521 |
|
| RIC1 | Information provided on ipc code assigned before grant |
Ipc: A61B 5/145 20060101AFI20130514BHEP |
|
| STAA | Information on the status of an ep patent application or granted ep patent |
Free format text: STATUS: EXAMINATION IS IN PROGRESS |
|
| 17Q | First examination report despatched |
Effective date: 20171212 |
|
| GRAP | Despatch of communication of intention to grant a patent |
Free format text: ORIGINAL CODE: EPIDOSNIGR1 |
|
| STAA | Information on the status of an ep patent application or granted ep patent |
Free format text: STATUS: GRANT OF PATENT IS INTENDED |
|
| INTG | Intention to grant announced |
Effective date: 20201215 |
|
| GRAS | Grant fee paid |
Free format text: ORIGINAL CODE: EPIDOSNIGR3 |
|
| GRAA | (expected) grant |
Free format text: ORIGINAL CODE: 0009210 |
|
| STAA | Information on the status of an ep patent application or granted ep patent |
Free format text: STATUS: THE PATENT HAS BEEN GRANTED |
|
| REG | Reference to a national code |
Ref country code: CH Ref legal event code: EP |
|
| AK | Designated contracting states |
Kind code of ref document: B1 Designated state(s): AT BE BG CH CY CZ DE DK EE ES FI FR GB GR HR HU IE IS IT LI LT LU LV MC MK MT NL NO PL PT RO SE SI SK SM TR |
|
| REG | Reference to a national code |
Ref country code: GB Ref legal event code: FG4D |
|
| REG | Reference to a national code |
Ref country code: AT Ref legal event code: REF Ref document number: 1397686 Country of ref document: AT Kind code of ref document: T Effective date: 20210615 |
|
| REG | Reference to a national code |
Ref country code: IE Ref legal event code: FG4D |
|
| REG | Reference to a national code |
Ref country code: DE Ref legal event code: R096 Ref document number: 602010067084 Country of ref document: DE |
|
| REG | Reference to a national code |
Ref country code: NL Ref legal event code: FP |
|
| REG | Reference to a national code |
Ref country code: SE Ref legal event code: TRGR |
|
| REG | Reference to a national code |
Ref country code: LT Ref legal event code: MG9D |
|
| PG25 | Lapsed in a contracting state [announced via postgrant information from national office to epo] |
Ref country code: BG Free format text: LAPSE BECAUSE OF FAILURE TO SUBMIT A TRANSLATION OF THE DESCRIPTION OR TO PAY THE FEE WITHIN THE PRESCRIBED TIME-LIMIT Effective date: 20210902 Ref country code: HR Free format text: LAPSE BECAUSE OF FAILURE TO SUBMIT A TRANSLATION OF THE DESCRIPTION OR TO PAY THE FEE WITHIN THE PRESCRIBED TIME-LIMIT Effective date: 20210602 Ref country code: FI Free format text: LAPSE BECAUSE OF FAILURE TO SUBMIT A TRANSLATION OF THE DESCRIPTION OR TO PAY THE FEE WITHIN THE PRESCRIBED TIME-LIMIT Effective date: 20210602 Ref country code: LT Free format text: LAPSE BECAUSE OF FAILURE TO SUBMIT A TRANSLATION OF THE DESCRIPTION OR TO PAY THE FEE WITHIN THE PRESCRIBED TIME-LIMIT Effective date: 20210602 |
|
| REG | Reference to a national code |
Ref country code: NO Ref legal event code: T2 Effective date: 20210602 |
|
| REG | Reference to a national code |
Ref country code: AT Ref legal event code: MK05 Ref document number: 1397686 Country of ref document: AT Kind code of ref document: T Effective date: 20210602 |
|
| PG25 | Lapsed in a contracting state [announced via postgrant information from national office to epo] |
Ref country code: PL Free format text: LAPSE BECAUSE OF FAILURE TO SUBMIT A TRANSLATION OF THE DESCRIPTION OR TO PAY THE FEE WITHIN THE PRESCRIBED TIME-LIMIT Effective date: 20210602 Ref country code: LV Free format text: LAPSE BECAUSE OF FAILURE TO SUBMIT A TRANSLATION OF THE DESCRIPTION OR TO PAY THE FEE WITHIN THE PRESCRIBED TIME-LIMIT Effective date: 20210602 Ref country code: GR Free format text: LAPSE BECAUSE OF FAILURE TO SUBMIT A TRANSLATION OF THE DESCRIPTION OR TO PAY THE FEE WITHIN THE PRESCRIBED TIME-LIMIT Effective date: 20210903 |
|
| PG25 | Lapsed in a contracting state [announced via postgrant information from national office to epo] |
Ref country code: SK Free format text: LAPSE BECAUSE OF FAILURE TO SUBMIT A TRANSLATION OF THE DESCRIPTION OR TO PAY THE FEE WITHIN THE PRESCRIBED TIME-LIMIT Effective date: 20210602 Ref country code: SM Free format text: LAPSE BECAUSE OF FAILURE TO SUBMIT A TRANSLATION OF THE DESCRIPTION OR TO PAY THE FEE WITHIN THE PRESCRIBED TIME-LIMIT Effective date: 20210602 Ref country code: CZ Free format text: LAPSE BECAUSE OF FAILURE TO SUBMIT A TRANSLATION OF THE DESCRIPTION OR TO PAY THE FEE WITHIN THE PRESCRIBED TIME-LIMIT Effective date: 20210602 Ref country code: EE Free format text: LAPSE BECAUSE OF FAILURE TO SUBMIT A TRANSLATION OF THE DESCRIPTION OR TO PAY THE FEE WITHIN THE PRESCRIBED TIME-LIMIT Effective date: 20210602 Ref country code: RO Free format text: LAPSE BECAUSE OF FAILURE TO SUBMIT A TRANSLATION OF THE DESCRIPTION OR TO PAY THE FEE WITHIN THE PRESCRIBED TIME-LIMIT Effective date: 20210602 Ref country code: PT Free format text: LAPSE BECAUSE OF FAILURE TO SUBMIT A TRANSLATION OF THE DESCRIPTION OR TO PAY THE FEE WITHIN THE PRESCRIBED TIME-LIMIT Effective date: 20211004 Ref country code: ES Free format text: LAPSE BECAUSE OF FAILURE TO SUBMIT A TRANSLATION OF THE DESCRIPTION OR TO PAY THE FEE WITHIN THE PRESCRIBED TIME-LIMIT Effective date: 20210602 Ref country code: AT Free format text: LAPSE BECAUSE OF FAILURE TO SUBMIT A TRANSLATION OF THE DESCRIPTION OR TO PAY THE FEE WITHIN THE PRESCRIBED TIME-LIMIT Effective date: 20210602 |
|
| REG | Reference to a national code |
Ref country code: DE Ref legal event code: R097 Ref document number: 602010067084 Country of ref document: DE |
|
| PLBE | No opposition filed within time limit |
Free format text: ORIGINAL CODE: 0009261 |
|
| STAA | Information on the status of an ep patent application or granted ep patent |
Free format text: STATUS: NO OPPOSITION FILED WITHIN TIME LIMIT |
|
| PG25 | Lapsed in a contracting state [announced via postgrant information from national office to epo] |
Ref country code: DK Free format text: LAPSE BECAUSE OF FAILURE TO SUBMIT A TRANSLATION OF THE DESCRIPTION OR TO PAY THE FEE WITHIN THE PRESCRIBED TIME-LIMIT Effective date: 20210602 |
|
| 26N | No opposition filed |
Effective date: 20220303 |
|
| PG25 | Lapsed in a contracting state [announced via postgrant information from national office to epo] |
Ref country code: IT Free format text: LAPSE BECAUSE OF FAILURE TO SUBMIT A TRANSLATION OF THE DESCRIPTION OR TO PAY THE FEE WITHIN THE PRESCRIBED TIME-LIMIT Effective date: 20210602 |
|
| REG | Reference to a national code |
Ref country code: CH Ref legal event code: PL |
|
| REG | Reference to a national code |
Ref country code: BE Ref legal event code: MM Effective date: 20220430 |
|
| PG25 | Lapsed in a contracting state [announced via postgrant information from national office to epo] |
Ref country code: MC Free format text: LAPSE BECAUSE OF FAILURE TO SUBMIT A TRANSLATION OF THE DESCRIPTION OR TO PAY THE FEE WITHIN THE PRESCRIBED TIME-LIMIT Effective date: 20210602 Ref country code: LU Free format text: LAPSE BECAUSE OF NON-PAYMENT OF DUE FEES Effective date: 20220429 Ref country code: LI Free format text: LAPSE BECAUSE OF NON-PAYMENT OF DUE FEES Effective date: 20220430 Ref country code: CH Free format text: LAPSE BECAUSE OF NON-PAYMENT OF DUE FEES Effective date: 20220430 |
|
| REG | Reference to a national code |
Ref country code: DE Ref legal event code: R082 Ref document number: 602010067084 Country of ref document: DE Representative=s name: DENTONS PATENT SOLUTIONS RECHTSANWALTSGESELLSC, DE Ref country code: DE Ref legal event code: R082 Ref document number: 602010067084 Country of ref document: DE |
|
| PG25 | Lapsed in a contracting state [announced via postgrant information from national office to epo] |
Ref country code: BE Free format text: LAPSE BECAUSE OF NON-PAYMENT OF DUE FEES Effective date: 20220430 |
|
| REG | Reference to a national code |
Ref country code: DE Ref legal event code: R082 Ref document number: 602010067084 Country of ref document: DE Representative=s name: DENTONS PATENT SOLUTIONS RECHTSANWALTSGESELLSC, DE |
|
| P01 | Opt-out of the competence of the unified patent court (upc) registered |
Effective date: 20230519 |
|
| PG25 | Lapsed in a contracting state [announced via postgrant information from national office to epo] |
Ref country code: HU Free format text: LAPSE BECAUSE OF FAILURE TO SUBMIT A TRANSLATION OF THE DESCRIPTION OR TO PAY THE FEE WITHIN THE PRESCRIBED TIME-LIMIT; INVALID AB INITIO Effective date: 20100429 |
|
| PGFP | Annual fee paid to national office [announced via postgrant information from national office to epo] |
Ref country code: NL Payment date: 20240320 Year of fee payment: 15 Ref country code: IE Payment date: 20240322 Year of fee payment: 15 |
|
| PG25 | Lapsed in a contracting state [announced via postgrant information from national office to epo] |
Ref country code: MK Free format text: LAPSE BECAUSE OF FAILURE TO SUBMIT A TRANSLATION OF THE DESCRIPTION OR TO PAY THE FEE WITHIN THE PRESCRIBED TIME-LIMIT Effective date: 20210602 Ref country code: CY Free format text: LAPSE BECAUSE OF FAILURE TO SUBMIT A TRANSLATION OF THE DESCRIPTION OR TO PAY THE FEE WITHIN THE PRESCRIBED TIME-LIMIT Effective date: 20210602 |
|
| PGFP | Annual fee paid to national office [announced via postgrant information from national office to epo] |
Ref country code: GB Payment date: 20240321 Year of fee payment: 15 |
|
| PGFP | Annual fee paid to national office [announced via postgrant information from national office to epo] |
Ref country code: SE Payment date: 20240320 Year of fee payment: 15 Ref country code: NO Payment date: 20240322 Year of fee payment: 15 Ref country code: FR Payment date: 20240320 Year of fee payment: 15 |
|
| PG25 | Lapsed in a contracting state [announced via postgrant information from national office to epo] |
Ref country code: TR Free format text: LAPSE BECAUSE OF FAILURE TO SUBMIT A TRANSLATION OF THE DESCRIPTION OR TO PAY THE FEE WITHIN THE PRESCRIBED TIME-LIMIT Effective date: 20210602 |
|
| PGFP | Annual fee paid to national office [announced via postgrant information from national office to epo] |
Ref country code: DE Payment date: 20240320 Year of fee payment: 15 |
|
| PG25 | Lapsed in a contracting state [announced via postgrant information from national office to epo] |
Ref country code: MT Free format text: LAPSE BECAUSE OF FAILURE TO SUBMIT A TRANSLATION OF THE DESCRIPTION OR TO PAY THE FEE WITHIN THE PRESCRIBED TIME-LIMIT Effective date: 20210602 |