EP2420823A1 - Standoff explosives detector using deep-uv raman spectroscopy - Google Patents
Standoff explosives detector using deep-uv raman spectroscopy Download PDFInfo
- Publication number
- EP2420823A1 EP2420823A1 EP11177529A EP11177529A EP2420823A1 EP 2420823 A1 EP2420823 A1 EP 2420823A1 EP 11177529 A EP11177529 A EP 11177529A EP 11177529 A EP11177529 A EP 11177529A EP 2420823 A1 EP2420823 A1 EP 2420823A1
- Authority
- EP
- European Patent Office
- Prior art keywords
- raman
- target substance
- laser light
- return signal
- power
- Prior art date
- Legal status (The legal status is an assumption and is not a legal conclusion. Google has not performed a legal analysis and makes no representation as to the accuracy of the status listed.)
- Withdrawn
Links
- 238000001069 Raman spectroscopy Methods 0.000 title claims abstract description 90
- 239000002360 explosive Substances 0.000 title claims description 39
- 238000000034 method Methods 0.000 claims abstract description 18
- 239000013076 target substance Substances 0.000 claims abstract description 17
- 238000012545 processing Methods 0.000 claims abstract description 4
- 230000001678 irradiating effect Effects 0.000 claims abstract 2
- 239000000463 material Substances 0.000 claims description 23
- TZRXHJWUDPFEEY-UHFFFAOYSA-N Pentaerythritol Tetranitrate Chemical compound [O-][N+](=O)OCC(CO[N+]([O-])=O)(CO[N+]([O-])=O)CO[N+]([O-])=O TZRXHJWUDPFEEY-UHFFFAOYSA-N 0.000 claims description 10
- 230000003287 optical effect Effects 0.000 claims description 10
- 238000004458 analytical method Methods 0.000 claims description 4
- 239000000470 constituent Substances 0.000 claims description 2
- 239000000126 substance Substances 0.000 description 23
- 230000005284 excitation Effects 0.000 description 19
- 238000001514 detection method Methods 0.000 description 13
- 238000001228 spectrum Methods 0.000 description 13
- PAWQVTBBRAZDMG-UHFFFAOYSA-N 2-(3-bromo-2-fluorophenyl)acetic acid Chemical group OC(=O)CC1=CC=CC(Br)=C1F PAWQVTBBRAZDMG-UHFFFAOYSA-N 0.000 description 12
- 230000003595 spectral effect Effects 0.000 description 7
- 238000005516 engineering process Methods 0.000 description 6
- 238000002474 experimental method Methods 0.000 description 6
- 238000010521 absorption reaction Methods 0.000 description 5
- 230000003750 conditioning effect Effects 0.000 description 5
- 239000000835 fiber Substances 0.000 description 5
- 238000011109 contamination Methods 0.000 description 4
- 230000004044 response Effects 0.000 description 4
- 230000035945 sensitivity Effects 0.000 description 4
- 230000008901 benefit Effects 0.000 description 3
- 239000002575 chemical warfare agent Substances 0.000 description 3
- 238000006731 degradation reaction Methods 0.000 description 3
- 230000010354 integration Effects 0.000 description 3
- 230000003993 interaction Effects 0.000 description 3
- 239000002243 precursor Substances 0.000 description 3
- 238000012360 testing method Methods 0.000 description 3
- SPSSULHKWOKEEL-UHFFFAOYSA-N 2,4,6-trinitrotoluene Chemical compound CC1=C([N+]([O-])=O)C=C([N+]([O-])=O)C=C1[N+]([O-])=O SPSSULHKWOKEEL-UHFFFAOYSA-N 0.000 description 2
- IJGRMHOSHXDMSA-UHFFFAOYSA-N Atomic nitrogen Chemical compound N#N IJGRMHOSHXDMSA-UHFFFAOYSA-N 0.000 description 2
- FYDSPEWNDZOWPU-UHFFFAOYSA-N [3-nitrooxy-2,2-bis(nitrooxymethyl)propyl] nitrate;1,3,5-trinitro-1,3,5-triazinane Chemical compound [O-][N+](=O)N1CN([N+]([O-])=O)CN([N+]([O-])=O)C1.[O-][N+](=O)OCC(CO[N+]([O-])=O)(CO[N+]([O-])=O)CO[N+]([O-])=O FYDSPEWNDZOWPU-UHFFFAOYSA-N 0.000 description 2
- XAGFODPZIPBFFR-UHFFFAOYSA-N aluminium Chemical compound [Al] XAGFODPZIPBFFR-UHFFFAOYSA-N 0.000 description 2
- 229910052782 aluminium Inorganic materials 0.000 description 2
- 238000013459 approach Methods 0.000 description 2
- QVGXLLKOCUKJST-UHFFFAOYSA-N atomic oxygen Chemical compound [O] QVGXLLKOCUKJST-UHFFFAOYSA-N 0.000 description 2
- 239000003124 biologic agent Substances 0.000 description 2
- 230000015556 catabolic process Effects 0.000 description 2
- 230000008859 change Effects 0.000 description 2
- 239000013043 chemical agent Substances 0.000 description 2
- 239000003795 chemical substances by application Substances 0.000 description 2
- 239000000356 contaminant Substances 0.000 description 2
- 230000007423 decrease Effects 0.000 description 2
- 238000013461 design Methods 0.000 description 2
- 230000000694 effects Effects 0.000 description 2
- 238000001914 filtration Methods 0.000 description 2
- 238000002189 fluorescence spectrum Methods 0.000 description 2
- 239000011521 glass Substances 0.000 description 2
- 238000013507 mapping Methods 0.000 description 2
- 239000001301 oxygen Substances 0.000 description 2
- 229910052760 oxygen Inorganic materials 0.000 description 2
- 230000035515 penetration Effects 0.000 description 2
- 238000012935 Averaging Methods 0.000 description 1
- 240000000594 Heliconia bihai Species 0.000 description 1
- 241001465754 Metazoa Species 0.000 description 1
- 241000282372 Panthera onca Species 0.000 description 1
- 238000001237 Raman spectrum Methods 0.000 description 1
- BQCADISMDOOEFD-UHFFFAOYSA-N Silver Chemical compound [Ag] BQCADISMDOOEFD-UHFFFAOYSA-N 0.000 description 1
- -1 biologicals Substances 0.000 description 1
- 229960000074 biopharmaceutical Drugs 0.000 description 1
- 239000013590 bulk material Substances 0.000 description 1
- 231100000481 chemical toxicant Toxicity 0.000 description 1
- 150000001875 compounds Chemical class 0.000 description 1
- 230000008878 coupling Effects 0.000 description 1
- 238000010168 coupling process Methods 0.000 description 1
- 238000005859 coupling reaction Methods 0.000 description 1
- 230000003247 decreasing effect Effects 0.000 description 1
- 238000011161 development Methods 0.000 description 1
- 238000010586 diagram Methods 0.000 description 1
- 238000009472 formulation Methods 0.000 description 1
- 239000001257 hydrogen Substances 0.000 description 1
- 229910052739 hydrogen Inorganic materials 0.000 description 1
- 238000005286 illumination Methods 0.000 description 1
- 238000003384 imaging method Methods 0.000 description 1
- 239000003317 industrial substance Substances 0.000 description 1
- 238000007689 inspection Methods 0.000 description 1
- 230000002452 interceptive effect Effects 0.000 description 1
- 239000000203 mixture Substances 0.000 description 1
- 229910052757 nitrogen Inorganic materials 0.000 description 1
- 239000013307 optical fiber Substances 0.000 description 1
- 238000001782 photodegradation Methods 0.000 description 1
- 230000008569 process Effects 0.000 description 1
- 239000013558 reference substance Substances 0.000 description 1
- 238000005070 sampling Methods 0.000 description 1
- 238000007493 shaping process Methods 0.000 description 1
- 229910052709 silver Inorganic materials 0.000 description 1
- 239000004332 silver Substances 0.000 description 1
- 230000007480 spreading Effects 0.000 description 1
- 231100000331 toxic Toxicity 0.000 description 1
- 230000002588 toxic effect Effects 0.000 description 1
- 239000003440 toxic substance Substances 0.000 description 1
- 238000002211 ultraviolet spectrum Methods 0.000 description 1
- 230000000007 visual effect Effects 0.000 description 1
Images



Classifications
-
- G—PHYSICS
- G01—MEASURING; TESTING
- G01N—INVESTIGATING OR ANALYSING MATERIALS BY DETERMINING THEIR CHEMICAL OR PHYSICAL PROPERTIES
- G01N21/00—Investigating or analysing materials by the use of optical means, i.e. using sub-millimetre waves, infrared, visible or ultraviolet light
- G01N21/62—Systems in which the material investigated is excited whereby it emits light or causes a change in wavelength of the incident light
- G01N21/63—Systems in which the material investigated is excited whereby it emits light or causes a change in wavelength of the incident light optically excited
- G01N21/65—Raman scattering
-
- G—PHYSICS
- G01—MEASURING; TESTING
- G01J—MEASUREMENT OF INTENSITY, VELOCITY, SPECTRAL CONTENT, POLARISATION, PHASE OR PULSE CHARACTERISTICS OF INFRARED, VISIBLE OR ULTRAVIOLET LIGHT; COLORIMETRY; RADIATION PYROMETRY
- G01J3/00—Spectrometry; Spectrophotometry; Monochromators; Measuring colours
- G01J3/02—Details
- G01J3/0205—Optical elements not provided otherwise, e.g. optical manifolds, diffusers, windows
- G01J3/0237—Adjustable, e.g. focussing
-
- G—PHYSICS
- G01—MEASURING; TESTING
- G01J—MEASUREMENT OF INTENSITY, VELOCITY, SPECTRAL CONTENT, POLARISATION, PHASE OR PULSE CHARACTERISTICS OF INFRARED, VISIBLE OR ULTRAVIOLET LIGHT; COLORIMETRY; RADIATION PYROMETRY
- G01J3/00—Spectrometry; Spectrophotometry; Monochromators; Measuring colours
- G01J3/02—Details
- G01J3/0278—Control or determination of height or angle information for sensors or receivers
-
- G—PHYSICS
- G01—MEASURING; TESTING
- G01J—MEASUREMENT OF INTENSITY, VELOCITY, SPECTRAL CONTENT, POLARISATION, PHASE OR PULSE CHARACTERISTICS OF INFRARED, VISIBLE OR ULTRAVIOLET LIGHT; COLORIMETRY; RADIATION PYROMETRY
- G01J3/00—Spectrometry; Spectrophotometry; Monochromators; Measuring colours
- G01J3/28—Investigating the spectrum
- G01J3/44—Raman spectrometry; Scattering spectrometry ; Fluorescence spectrometry
-
- G—PHYSICS
- G01—MEASURING; TESTING
- G01N—INVESTIGATING OR ANALYSING MATERIALS BY DETERMINING THEIR CHEMICAL OR PHYSICAL PROPERTIES
- G01N21/00—Investigating or analysing materials by the use of optical means, i.e. using sub-millimetre waves, infrared, visible or ultraviolet light
- G01N21/17—Systems in which incident light is modified in accordance with the properties of the material investigated
- G01N2021/1793—Remote sensing
-
- G—PHYSICS
- G01—MEASURING; TESTING
- G01N—INVESTIGATING OR ANALYSING MATERIALS BY DETERMINING THEIR CHEMICAL OR PHYSICAL PROPERTIES
- G01N21/00—Investigating or analysing materials by the use of optical means, i.e. using sub-millimetre waves, infrared, visible or ultraviolet light
- G01N21/17—Systems in which incident light is modified in accordance with the properties of the material investigated
- G01N21/25—Colour; Spectral properties, i.e. comparison of effect of material on the light at two or more different wavelengths or wavelength bands
- G01N21/31—Investigating relative effect of material at wavelengths characteristic of specific elements or molecules, e.g. atomic absorption spectrometry
- G01N21/33—Investigating relative effect of material at wavelengths characteristic of specific elements or molecules, e.g. atomic absorption spectrometry using ultraviolet light
-
- G—PHYSICS
- G01—MEASURING; TESTING
- G01N—INVESTIGATING OR ANALYSING MATERIALS BY DETERMINING THEIR CHEMICAL OR PHYSICAL PROPERTIES
- G01N21/00—Investigating or analysing materials by the use of optical means, i.e. using sub-millimetre waves, infrared, visible or ultraviolet light
- G01N21/62—Systems in which the material investigated is excited whereby it emits light or causes a change in wavelength of the incident light
- G01N21/63—Systems in which the material investigated is excited whereby it emits light or causes a change in wavelength of the incident light optically excited
- G01N21/65—Raman scattering
- G01N21/658—Raman scattering enhancement Raman, e.g. surface plasmons
Definitions
- the present invention is related to Raman spectroscopy, and more particularly to systems and methods for performing stand-off Raman spectroscopy using laser light in the deep ultraviolet spectral region.
- Prior remote sensor technologies designed to measure surface-deposited chemical contamination used vehicles and associated test equipment that retrieved a physical sample of the contaminant and then used an extremely cumbersome and time-consuming process to analyze the sample, e.g., a mechanical sampling wheel system coupled with a mass spectrometer to test for chemical agents.
- standoff surface detection refers to a category of technologies that permit detection of a substance without actually having to physically come in contact with the substance.
- the goal of these detection systems is to provide the capability to detect, identify, locate, quantify, warn, and report chemical and biological threats and thereby give military forces or civilian personnel sufficient early warning to avoid (further) contamination and deploy appropriate counter measures.
- Raman spectroscopy is a technique used to characterize materials and thereafter to identify such materials.
- a laser transmitter serves as a spectrally narrow light source with high irradiance.
- the laser illuminates a known or an unknown substance, such as a chemical compound, biological agent, or explosive material, among others.
- a portion of the incident light is Raman scattered by the substance. This light is scattered in all spatial directions as well as shifted spectrally to discrete wavelengths. These wavelength shifts correspond to unique vibrational energies associated with the molecular bonds in the substance.
- the Raman scattered light is collected by a telescope and is coupled into a dispersive optical system.
- the telescope focuses the collected light onto, e.g., an optical fiber bundle.
- individual fibers are oriented linearly to form an entrance slit for a grating-based spectrograph.
- An electro-optical detector array records the optical spectrum of the Raman scattered light. This spectrum serves as a "fingerprint" for the known or unknown substance.
- An analysis computer stores the reference spectral information along with information identifying the known substance, and more often, employs pattern-matching algorithms to identify the unknown substance from a spectral library of previously analyzed and "fingerprinted" reference substances.
- the present invention provides a unique implementation of a Raman spectroscopy system that can be employed to avoid having to be in the immediate vicinity of dangerous substances or items. More specifically, with embodiments in accordance with the present invention, personnel are provided the capability to perform remote yet sensitive site exploitation including inspection of buildings, equipment, vehicles, aircraft, and other manmade or natural surfaces for the presence of unknown substances or items including, but not limited to, explosive material (e.g., TNT and RDX), homemade explosives and their precursors, and chemicals including chemical warfare agents (CWAs), and toxic industrial chemicals (TICs).
- explosive material e.g., TNT and RDX
- CWAs chemical warfare agents
- TICs toxic industrial chemicals
- Raman signatures tend to be distinctive and unique to a material; thus this "optical fingerprinting" technique for identifying explosives at standoff distances has received much attention.
- Raman signals can be generated with laser excitation, and numerous studies have been conducted to evaluate Raman spectroscopy for explosives detection in the near-infrared, visible, and UV spectral regions. This flexibility has spurred the development of Raman systems, some capable of detecting explosives from tens of meters.
- ammonium nitrate can be detected outdoors from a distance of 470 meters with a 532-nm Raman system, but the data were recorded using essentially laboratory conditions. Specifically, a 500-mL container of bulk AN was interrogated for a period of 1-10 seconds with pulse energies of 320 mJ at a repetition rate of 10 Hz (i.e., ⁇ 3.2 Watts of laser power). Increasing the distance and detecting many types of explosives at very low concentrations continues to be an area of interest.
- Described herein is a UV Raman sensor that has been shown to detect TNT, PETN, and AN at concentrations as low as 3-50 ⁇ g/cm 2 from a standoff distance of 10 meters using moderate laser power (-100 mW). Importantly, this level of sensitivity has been demonstrated for explosive residues on field relevant backgrounds in a timeframe on the order of seconds. These are key points because real-world backgrounds such as painted surfaces of vehicle panels often limit the sensitivity of Raman spectroscopy by overwhelming the Raman signal with fluorescence. Furthermore, the choice of excitation wavelength is related to the amount of material present.
- Embodiments of the present invention use a deep UV laser to generate Raman scattering from the surface chemical.
- Raman scattering is generally much stronger with UV laser light than with visible and IR light due to the well-known ⁇ 4 effect and the onset of a phenomenon known as resonance enhancement.
- resonance enhancement tends to emphasize the spectral features of the targeted explosives as compared to the spectral features obtained from the background, making it possible to detect small quantities of explosives.
- the system is solar blind and interference from background fluorescence is minimal.
- a single-frequency laser can be employed, and processing does not require picture-to-picture registration is required for differential imaging techniques.
- FIG. 1 depicts a Raman spectroscopy system in accordance with one possible implementation of the present invention.
- a scanner 170 includes a UV laser 10 that is tuned to a single frequency in the wavelength region below 400 nm, preferably below 250 nm, and more preferably around 248nm in order to avoid fluorescence from relevant surfaces, as will be discussed in more detail below.
- the laser's outgoing UV beam is permitted to radiate to a target substance via a safety shutter 20 and beam conditioning optics 30.
- the beam conditioning optics 30 adjust the beam's characteristics to match the interrogation spot size of a receiver telescope 70. This beam radiates from the system to a surface on which trace amounts of, e.g., an unknown chemical, such as an explosive material or precursor, have been deposited.
- trace amounts as used herein is meant to refer to substance residues, smears and the like, and is meant to be distinguished from bulk material.
- a trace amount may be on the order of less than, e.g., 100 ⁇ g/cm 2 .
- the UV laser light interacts with the target surface and surface deposited chemical.
- the return light consists of Rayleigh scattered and Raman scattered light from the surface and the target chemical.
- a rangefinder 40 detects the range from the system to the interrogated surface. Data from the rangefinder 40 can be used by control electronics 50 to control the beam conditioning optics 30 and, via an autofocus control module 60, the focus of the receiving telescope 70.
- the telescope 70 receives the Rayleigh and Raman scattered light and focuses it first onto optical filtering and beam shaping or conditioning module 80.
- the optical filtering component filters the Rayleigh scattered (basic UV laser light) and focuses the resulting filtered light onto the end of a fiber optic bundle 90.
- the near end of the fiber optic bundle is arranged in a nearly round configuration to maximize coupling.
- the far end, the end closest to a spectrograph 100 is preferably arranged in a linear array of individual fibers, fashioning a slit. Depending on the specific design, the linear array may be arranged in a shallow v-arrangement to offset optical effects that occur in the spectrograph 100.
- the spectrograph 100 uses a grating and optical components to disperse the received light into its constituent wavelengths and focus the light onto a Charge Coupled Device or other array detector, referred to generally as camera 110.
- Camera 110 may be an intensified CCD (ICCD) in order to amplify the Raman return signal.
- ICCD intensified CCD
- the camera 110 converts the optical signal into an electrical waveform that represents the amplitude of the light in each wavelength bin.
- This signal is then processed and compared against a library of signatures in an analysis computer 120. Processing may include removal of any residual baseline from the received signal and pre-conditioning the library spectra with the system's spectral response so that the measured signal and library spectra appear to have been measured by the same system.
- the analysis computer 120 determines a match, it provides the operator with visual, audible, and/or textual notification (indicated by reference numeral 130) indicating the presence, name, etc. of the detected material.
- the scene to be analyzed may be viewed using a video camera 140.
- the system illuminates the telescope's field of view using a designator 150, which indicates to the system operator the interrogation area. In some applications the beam of the range finder 40 may be used as the designator.
- the operator directs the system to scan the area of interest using a scan control computer 160 that controls the overall scanner 170. Scanning may be accomplished either manually while watching the video scene or the operator can designate an area on the video display which he wishes to scan.
- the scan control computer 160 then calculates the scanning path of the UV laser 10 and telescope 70. Scanning can also be used as part of mapping functionality to map an area of interest in regard to the presence of one or more target substances.
- this system can be used to remotely interrogate surfaces for specific chemicals, including explosives and their precursors. Other chemicals could also be detected if their spectra are included in the active library used by the algorithm.
- the system may be deployed on a movable or mobile vehicle.
- An important aspect of embodiments described herein is the selection of the laser light wavelength. Minimizing interference from fluorescence on real-world backgrounds, while simultaneously avoiding sample degradation, was determined to be a primary driver for selecting a suitable laser wavelength in a system that does not use more complicated fast gating detectors. Phenomenology studies were undertaken to spectroscopically characterize explosives on real-world backgrounds, including 32 vehicle panels (several of which are listed in the table below). As will be discussed in more detail below, laser excitation at 248 nm adequately minimizes fluorescence-interference and sample-degradation.
- Raman photon efficiency factor is the Raman signal strength divided by excitation wavelength. While Albrecht theory can predict the wavelength for highest Raman cross section, this approximation alone fails to take into account the effect of re-absorption and light penetration into the sample on Raman signal strength.
- Figure 2 is a plot of the Raman photon efficiency factor, which can be described in 3 regions:
- High Resonance, High absorptivity Modest increasing Raman scattering strength relative to molar absorptivity resulting in higher probability of photo/thermal induced change or degradation.
- FIGS 3A-C Shown in Figures 3A-C are fluorescence spectra obtained from 17 randomly selected painted vehicle surfaces, recorded with a Ti:sapphire laser operating at 257 nm, 253 nm, and 248 nm, respectively.
- the strength of the observed fluorescence decreases significantly as the excitation wavelength is shifted from 257 nm to 248 nm.
- studies have shown that the intensity of the Raman signal from the explosives of interest do not change as dramatically with excitation wavelength.
- the Raman to Fluorescence Power Ratio that is larger with 248-nm excitation is of importance.
- the Raman to Fluorescence Power ratios in the waveband of interest was derived by computing absolute spectrum variance over the Raman signal waveband of 700 - 2000 wavenumbers (cm -1 ). It is of note that including the Carbon-Hydrogen bond (CH) region of the signature (waveband 2000 - 3000) would decrease values even further, but the predominant information used in detecting and identifying the explosive residue is contained in the waveband used and therefore a better system design metric.
- CH Carbon-Hydrogen bond
- vehicle panels #5, #15, #31, and #32 were randomly selected for testing with deposited explosive residues.
- the spectra obtained from these panels are shown in Figures 5A and 5B .
- This set of Raman spectra qualitatively represents the four types of spectra that were observed. Note that the intensity of the recorded signal from vehicle panel #15 was found to be considerably stronger than other vehicle panels.
- the spectrum of #31 has been vertically offset in Figure 5B for clarity. Raman bands attributable to ambient nitrogen and oxygen are marked. The oxygen Raman band is obscured by overlap with Raman bands from each surface.
- embodiments of the present invention employ "deep uv" laser wavelengths, namely those at 250 nm or below.
- the use of this particular wavelength range is non-trivial, since it has been established that fluorescence at 262 nm, and even perhaps for all wavelengths from 250 nm to 1000nm, will render detection of trace explosives at significant stand off range (> 5 meters) difficult if not impossible.
- the Raman sensor described herein also has the capability to interrogate bulk samples of larger than trace amounts.
- detectable substances include explosive materials, toxic chemicals, biologicals, and chemical warfare agents, and other materials that have Raman signatures.
Landscapes
- Physics & Mathematics (AREA)
- Spectroscopy & Molecular Physics (AREA)
- General Physics & Mathematics (AREA)
- Health & Medical Sciences (AREA)
- Nuclear Medicine, Radiotherapy & Molecular Imaging (AREA)
- Life Sciences & Earth Sciences (AREA)
- Chemical & Material Sciences (AREA)
- Analytical Chemistry (AREA)
- Biochemistry (AREA)
- General Health & Medical Sciences (AREA)
- Immunology (AREA)
- Pathology (AREA)
- Investigating, Analyzing Materials By Fluorescence Or Luminescence (AREA)
Abstract
Description
- The present invention is related to Raman spectroscopy, and more particularly to systems and methods for performing stand-off Raman spectroscopy using laser light in the deep ultraviolet spectral region.
- The danger of exposure to chemical or biological agents can be severe. Whether a result of unintended release, by way of, e.g., an accident, or a result of intentional delivery, it is desirable to quickly and accurately identify (1) the type of agent that has been released and (2) the precise area of contamination. Early and accurate detection of such dangerous substances can be a significant factor in reducing potential casualties and limiting further spreading of the agent, e.g., by wind, human and animal contact, etc.
- It is likewise important to be able to quickly and accurately identify the presence of explosive materials. Such detection is particularly important in security and military settings. The sooner detection can take place, the sooner personnel can be evacuated or other appropriate measures taken.
- Prior remote sensor technologies designed to measure surface-deposited chemical contamination used vehicles and associated test equipment that retrieved a physical sample of the contaminant and then used an extremely cumbersome and time-consuming process to analyze the sample, e.g., a mechanical sampling wheel system coupled with a mass spectrometer to test for chemical agents.
- In view of the complexity of such approaches, newer, simpler technologies were desired. One emerging technology in response to this desire is referred to, generally, as "standoff surface detection," and refers to a category of technologies that permit detection of a substance without actually having to physically come in contact with the substance. The goal of these detection systems is to provide the capability to detect, identify, locate, quantify, warn, and report chemical and biological threats and thereby give military forces or civilian personnel sufficient early warning to avoid (further) contamination and deploy appropriate counter measures.
- One of the technologies that enables standoff surface detection is Raman spectroscopy. Raman spectroscopy is a technique used to characterize materials and thereafter to identify such materials. Typically, a laser transmitter serves as a spectrally narrow light source with high irradiance. The laser illuminates a known or an unknown substance, such as a chemical compound, biological agent, or explosive material, among others. A portion of the incident light is Raman scattered by the substance. This light is scattered in all spatial directions as well as shifted spectrally to discrete wavelengths. These wavelength shifts correspond to unique vibrational energies associated with the molecular bonds in the substance.
- In conventional standoff Raman spectroscopy systems, the Raman scattered light is collected by a telescope and is coupled into a dispersive optical system. The telescope focuses the collected light onto, e.g., an optical fiber bundle. At the opposite end of the fiber bundle, individual fibers are oriented linearly to form an entrance slit for a grating-based spectrograph. An electro-optical detector array records the optical spectrum of the Raman scattered light. This spectrum serves as a "fingerprint" for the known or unknown substance. An analysis computer stores the reference spectral information along with information identifying the known substance, and more often, employs pattern-matching algorithms to identify the unknown substance from a spectral library of previously analyzed and "fingerprinted" reference substances.
- Laboratory-based Raman spectroscopy systems have been in use for many years. Recently, portable Raman systems have become possible as a result of components that have decreased in size and unique integration techniques. A description of one such portable system can be found in
US 6,608,677 , which is incorporated herein by reference. Aspects of that system are described inUS 7,796,251 , entitled Method, Apparatus and System for Rapid and Sensitive Standoff Detection of Surface Contaminants, which is also incorporated herein by reference. Truck mounted Raman sensors have also been fielded to date. Reference may also be made toUS 6,788,407 , also incorporated herein by reference, for still further discussion of Raman spectrometry. - Notwithstanding these known systems, there remains a need to provide different forms of Raman sensors to meet the needs of both civilian and military personnel responsible for identifying, especially, trace amounts or residues of explosive substances.
- The present invention provides a unique implementation of a Raman spectroscopy system that can be employed to avoid having to be in the immediate vicinity of dangerous substances or items. More specifically, with embodiments in accordance with the present invention, personnel are provided the capability to perform remote yet sensitive site exploitation including inspection of buildings, equipment, vehicles, aircraft, and other manmade or natural surfaces for the presence of unknown substances or items including, but not limited to, explosive material (e.g., TNT and RDX), homemade explosives and their precursors, and chemicals including chemical warfare agents (CWAs), and toxic industrial chemicals (TICs). One significant advantage of embodiments of the present invention is the ability to search for and detect improvised explosive devices (IEDs) or traces of explosives on vehicles without having to place personnel in the same location in which explosives might be hidden.
- Other advantages of embodiments of the present invention include the fact that the technology (1) is a non-contact standoff system, (2) allows mapping of the surface contamination, and (3) provides quick response (typically only seconds to perform detection).
- These and other features of embodiments of the present invention and their attendant advantages will be more fully appreciated upon a reading for the following detailed description in conjunction with the associated drawings.
-
-
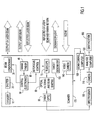
Figure 1 is a schematic functional diagram of a Raman spectroscopy system in accordance with an embodiment of the present invention. -
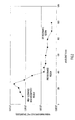
Figure 2 depicts a plot of Raman photon efficiency factor including three identified resonance regions. -
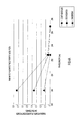
Figure 3A-C depict plots of fluorescence spectra recorded from vehicle panels used in connection with experiments conducted in accordance with an embodiment of the present invention. -
Figures 4A andB show Raman to fluorescence power ratio data for explosive material PETN and Semtex. -
Figures 5A and 5B depict plots of spectra of selected vehicle panels used in connection with experiments conducted in accordance with an embodiment of the present invention. -
Figures 6A and 6B depict plots of the Raman shift for PETN and TNT using 248-nm excitation at a 10 meter standoff. -
Figures 7A and 7B depict plots of the Raman shift for AN residues on aluminum-coated glass and a surface of a vehicle panel in connection with methodologies according to an embodiment of the present invention. - Raman signatures tend to be distinctive and unique to a material; thus this "optical fingerprinting" technique for identifying explosives at standoff distances has received much attention. Raman signals can be generated with laser excitation, and numerous studies have been conducted to evaluate Raman spectroscopy for explosives detection in the near-infrared, visible, and UV spectral regions. This flexibility has spurred the development of Raman systems, some capable of detecting explosives from tens of meters.
- In this regard, many academic studies have focused on only one aspect of Raman spectroscopy for explosives detection, such as demonstrating the feasibility of long standoff distances or the potential of a particular dual-sensor concept. By and large, these studies have been performed under experimental conditions that are not particularly analogous to real-world field operations. For example, the study presented in Pettersson, A.; Wallin, S.; Ostmark, H.; Ehlerding, A.; Johansson, I.; Nordberg, M.; Ellis, H.; Al-Khalili, A. Proc. of SPIE, 2010, 7664, 76641K-1 demonstrated that ammonium nitrate (AN) can be detected outdoors from a distance of 470 meters with a 532-nm Raman system, but the data were recorded using essentially laboratory conditions. Specifically, a 500-mL container of bulk AN was interrogated for a period of 1-10 seconds with pulse energies of 320 mJ at a repetition rate of 10 Hz (i.e., ∼ 3.2 Watts of laser power). Increasing the distance and detecting many types of explosives at very low concentrations continues to be an area of interest. Described herein is a UV Raman sensor that has been shown to detect TNT, PETN, and AN at concentrations as low as 3-50 µg/cm2 from a standoff distance of 10 meters using moderate laser power (-100 mW). Importantly, this level of sensitivity has been demonstrated for explosive residues on field relevant backgrounds in a timeframe on the order of seconds. These are key points because real-world backgrounds such as painted surfaces of vehicle panels often limit the sensitivity of Raman spectroscopy by overwhelming the Raman signal with fluorescence. Furthermore, the choice of excitation wavelength is related to the amount of material present.
- Detecting some explosives can be particularly challenging because Raman scattering from these materials is insufficient to overcome the limitations imposed by absorption.
- In general, strong absorption limits penetration into the target by the incident laser beam, minimizing the volume of material that can contribute to the Raman signal. The emerging Raman signal is also absorbed by the target along its path to the receiver. Consequently, the amount of material that can contribute to the observed Raman signal is limited to a thin layer for strongly absorbing explosives. RDX and HMX absorb strongly between 225 nm and 275 nm, and the thickness of material that contributes to the signal is predicted to be less than 0.3 µm (for 257-nm excitation). Ultimately, signal strength depends on the efficiency of Raman scattering as well as absorption. For example, because Raman scattering from TNT is ∼100× greater than from RDX with 257-nm excitation, Raman signals obtained from TNT are considerably larger than those from RDX, despite the fact that absorption limits the theoretical interaction depth for TNT to ∼100 nm.
- Embodiments of the present invention use a deep UV laser to generate Raman scattering from the surface chemical. Raman scattering is generally much stronger with UV laser light than with visible and IR light due to the well-known ν4 effect and the onset of a phenomenon known as resonance enhancement. Importantly, unlike the Raman signals obtained with visible and IR lasers, resonance enhancement tends to emphasize the spectral features of the targeted explosives as compared to the spectral features obtained from the background, making it possible to detect small quantities of explosives. Moreover, the system is solar blind and interference from background fluorescence is minimal. A single-frequency laser can be employed, and processing does not require picture-to-picture registration is required for differential imaging techniques.
-
Figure 1 depicts a Raman spectroscopy system in accordance with one possible implementation of the present invention. Ascanner 170 includes aUV laser 10 that is tuned to a single frequency in the wavelength region below 400 nm, preferably below 250 nm, and more preferably around 248nm in order to avoid fluorescence from relevant surfaces, as will be discussed in more detail below. The laser's outgoing UV beam is permitted to radiate to a target substance via asafety shutter 20 andbeam conditioning optics 30. Thebeam conditioning optics 30 adjust the beam's characteristics to match the interrogation spot size of areceiver telescope 70. This beam radiates from the system to a surface on which trace amounts of, e.g., an unknown chemical, such as an explosive material or precursor, have been deposited. The phrase "trace amounts" as used herein is meant to refer to substance residues, smears and the like, and is meant to be distinguished from bulk material. A trace amount may be on the order of less than, e.g., 100µg/cm2. - The UV laser light interacts with the target surface and surface deposited chemical. The return light consists of Rayleigh scattered and Raman scattered light from the surface and the target chemical. In parallel with the UV laser, a
rangefinder 40 detects the range from the system to the interrogated surface. Data from therangefinder 40 can be used bycontrol electronics 50 to control thebeam conditioning optics 30 and, via anautofocus control module 60, the focus of the receivingtelescope 70. - The
telescope 70 receives the Rayleigh and Raman scattered light and focuses it first onto optical filtering and beam shaping orconditioning module 80. The optical filtering component filters the Rayleigh scattered (basic UV laser light) and focuses the resulting filtered light onto the end of afiber optic bundle 90. The near end of the fiber optic bundle is arranged in a nearly round configuration to maximize coupling. The far end, the end closest to aspectrograph 100 is preferably arranged in a linear array of individual fibers, fashioning a slit. Depending on the specific design, the linear array may be arranged in a shallow v-arrangement to offset optical effects that occur in thespectrograph 100. Thespectrograph 100 uses a grating and optical components to disperse the received light into its constituent wavelengths and focus the light onto a Charge Coupled Device or other array detector, referred to generally ascamera 110.Camera 110 may be an intensified CCD (ICCD) in order to amplify the Raman return signal. Thecamera 110 converts the optical signal into an electrical waveform that represents the amplitude of the light in each wavelength bin. This signal is then processed and compared against a library of signatures in ananalysis computer 120. Processing may include removal of any residual baseline from the received signal and pre-conditioning the library spectra with the system's spectral response so that the measured signal and library spectra appear to have been measured by the same system. When theanalysis computer 120 determines a match, it provides the operator with visual, audible, and/or textual notification (indicated by reference numeral 130) indicating the presence, name, etc. of the detected material. - The scene to be analyzed may be viewed using a
video camera 140. The system illuminates the telescope's field of view using adesignator 150, which indicates to the system operator the interrogation area. In some applications the beam of therange finder 40 may be used as the designator. The operator directs the system to scan the area of interest using ascan control computer 160 that controls theoverall scanner 170. Scanning may be accomplished either manually while watching the video scene or the operator can designate an area on the video display which he wishes to scan. Thescan control computer 160 then calculates the scanning path of theUV laser 10 andtelescope 70. Scanning can also be used as part of mapping functionality to map an area of interest in regard to the presence of one or more target substances. - As will be appreciated by those skilled in the art, this system can be used to remotely interrogate surfaces for specific chemicals, including explosives and their precursors. Other chemicals could also be detected if their spectra are included in the active library used by the algorithm. In one possible implementation, the system may be deployed on a movable or mobile vehicle.
- An important aspect of embodiments described herein is the selection of the laser light wavelength. Minimizing interference from fluorescence on real-world backgrounds, while simultaneously avoiding sample degradation, was determined to be a primary driver for selecting a suitable laser wavelength in a system that does not use more complicated fast gating detectors. Phenomenology studies were undertaken to spectroscopically characterize explosives on real-world backgrounds, including 32 vehicle panels (several of which are listed in the table below). As will be discussed in more detail below, laser excitation at 248 nm adequately minimizes fluorescence-interference and sample-degradation.
- Raman responses from several explosives were surveyed using laser excitation between 225 and 275 nm. It was concluded that excitation near 257 nm might be well-suited for detecting explosives residues for the following reasons:
- 1) Preliminary data recorded from a few randomly selected vehicle panels indicated that fluorescence generated by laser excitation at wavelengths longer than 257 nm would greatly reduce sensitivity towards trace explosives.
- 2) Simple predictions indicated that the strength of the Raman signal favored longer excitation wavelengths, with 257 nm being near the maximum for some of the explosives tested.
- 3) Strongly absorbing samples tended to yield Raman signatures that showed evidence for photodegradation when recorded with laser wavelengths shorter than 257 nm.
- These factors generally describe the "Raman photon efficiency factor," which is the Raman signal strength divided by excitation wavelength. While Albrecht theory can predict the wavelength for highest Raman cross section, this approximation alone fails to take into account the effect of re-absorption and light penetration into the sample on Raman signal strength.
Figure 2 , is a plot of the Raman photon efficiency factor, which can be described in 3 regions: - Off Resonance wavelength: Dominance of ν4 dependence; minor variances due to molar absorptivity.
- Approaching or Pre Resonance: Dramatic increase in Raman scattering & relatively lower increase in molar absorptivity.
- High Resonance, High absorptivity: Modest increasing Raman scattering strength relative to molar absorptivity resulting in higher probability of photo/thermal induced change or degradation.
- What was found is that as the excitation wavelength approaches resonance, Raman signal strength is balanced by increased scattering strength, but lower photon-molecule interactions. As the excitation wavelength moves closer to optimum resonance, Raman signal strength increasing further is inhibited by much lower photon-molecule interactions to the point at which signal strength is competing with system noise/interference or efficiency. While energetic/explosive materials can be classified in a small set of groups, each material will have a unique Raman photon efficiency profile. Experiments to collect data on signal strength vs. laser wavelength showed that excitation near 257 nm was near the maximum signal possible (theoretically) for explosive materials PETN, and explosive material components UN and AN for samples that were 100 microns thick. Similar data for explosive materials TNT, RDX, and HMX showed a smaller degree of variation for 100-micron samples, but the signal strength was always better at longer wavelengths.
- To obtain additional data, further studies compared 257-nm Raman signals of explosives with spectra obtained from randomly selected vehicle panels to determine if fluorescence would severely limit sensitivity. Some of the vehicle panels exhibited overwhelming fluorescence under 257-nm illumination. As such, three additional laser wavelengths were also evaluated: 253 nm, 248 nm, and 244 nm. Because the excitation wavelength was being incremented in small steps (Δλ = 4 nm or 5 nm), it was possible to identify a "Raman to Fluorescence Power Ratio" at which the Raman signal was optimal in regard to interfering signals from the background and the Raman photon efficiency factor. Shown in
Figures 3A-C are fluorescence spectra obtained from 17 randomly selected painted vehicle surfaces, recorded with a Ti:sapphire laser operating at 257 nm, 253 nm, and 248 nm, respectively. As can be seen, the strength of the observed fluorescence decreases significantly as the excitation wavelength is shifted from 257 nm to 248 nm. Importantly, studies have shown that the intensity of the Raman signal from the explosives of interest do not change as dramatically with excitation wavelength. Thus, the Raman to Fluorescence Power Ratio that is larger with 248-nm excitation is of importance. This point is underscored by the data presented inFigures 4A and4B , which show Raman to Fluorescence power ratios for PETN and Semtex (a formulation including PETN and RDX), respectively, disposed on the indicated vehicle as a background for the explosive material. - Details of vehicles used in experiments described herein include:
Panel # Year Make & Model Color 2 1995 Lincoln Continental dark blue 4 1994 Ford Econoline silver 5* 1994 Ford Thunderbird teal 15* 1993 Pontiac Firebird orange 31* 1995 VW Jetta red 32* 1991 Jaguar X86 burgundy - Panels from vehicles denoted by an asterisk are employed in separate experiments as discussed further below.
- The Raman to Fluorescence Power ratios in the waveband of interest was derived by computing absolute spectrum variance over the Raman signal waveband of 700 - 2000 wavenumbers (cm-1). It is of note that including the Carbon-Hydrogen bond (CH) region of the signature (waveband 2000 - 3000) would decrease values even further, but the predominant information used in detecting and identifying the explosive residue is contained in the waveband used and therefore a better system design metric.
- Experiments have shown the ability to detect TNT, PETN, and AN at concentrations as low as 3-50 µg/cm2 from a standoff distance of 10 meters using moderate laser power (-100 mW). Notably, positive detections were reported for samples containing masses as low as 45 µg of PETN, 5 µg of RDX, and 500 ng AN.
- More specifically,
vehicle panels # 5, #15, #31, and #32 (see table above) were randomly selected for testing with deposited explosive residues. The spectra obtained from these panels are shown inFigures 5A and 5B . This set of Raman spectra qualitatively represents the four types of spectra that were observed. Note that the intensity of the recorded signal fromvehicle panel # 15 was found to be considerably stronger than other vehicle panels. The spectrum of #31 has been vertically offset inFigure 5B for clarity. Raman bands attributable to ambient nitrogen and oxygen are marked. The oxygen Raman band is obscured by overlap with Raman bands from each surface. - Shown in
Figures 6A and 6B andFigures 7A and 7B are spectra obtained from residues of PETN (Figure 6A ), TNT (Figure 6B ) and AN (Figures 7A and 7B ) deposited onto various surfaces at 10-meter standoff using 248-nm excitation. Each spectrum shown inFigures 6A and 6B corresponds to the average of 25 contiguous acquisitions (for a total integration time of 850 msec), and those inFigures 7A and 7B correspond to varying amounts of signal averaging. More specifically,Figure 7A depicts UV spectra of AN residues on aluminum-coated glass, andFigure 7B shows a plot ofvehicle surface # 31. The corresponding number of acquisitions, each 34 msec in duration, is shown on the right-hand side ofFigure 7B . Traces have been vertically offset for clarity. Estimated surface concentrations of AN forFigure 7A and Figure 7B were ∼10µg/cm2 and -20 µg/cm2, respectively, which are barely detectable by the eye. - In all cases it was possible to find a portion of the dataset that yielded signal-to-noise ratios greater than 10 for the prominent band of AN in less than one second of total integration (25 acquisitions).
- As noted, embodiments of the present invention employ "deep uv" laser wavelengths, namely those at 250 nm or below. The use of this particular wavelength range is non-trivial, since it has been established that fluorescence at 262 nm, and even perhaps for all wavelengths from 250 nm to 1000nm, will render detection of trace explosives at significant stand off range (> 5 meters) difficult if not impossible. The Raman sensor described herein also has the capability to interrogate bulk samples of larger than trace amounts.
- As mentioned, detectable substances include explosive materials, toxic chemicals, biologicals, and chemical warfare agents, and other materials that have Raman signatures.
- The systems and methods described herein may be embodied in other specific forms without departing from the spirit or essential characteristics thereof. The foregoing embodiments are therefore to be considered in all respects illustrative and not meant to be limiting.
Claims (11)
- A method of performing Raman spectroscopy, comprising:irradiating, with laser light, a trace amount of a target substance disposed on a painted surface;receiving reflected laser light and a Raman return signal from the trace amount of the target substance;processing the Raman return signal using, at least, a spectrograph and camera to obtain a Raman signature for the target substance; andwherein a ratio of a power of the Raman return signal to fluorescence power is at least about 0.1.
- The method of claim 1, further comprising identifying the target substance based on the Raman signature for the target substance and a database of Raman signatures.
- The method of claim 1 or 2, wherein the ratio of the power of the Raman return signal to fluorescence power is between 0.1 and 0.5, preferably about 0.2, or is greater than 0.5.
- The method of one of the preceding claims, wherein the target substance- is located or disposed on a panel of a vehicle; or- comprises explosive material residue at a concentration of no more than about 100 µg/cm2, and in particular of no more than about 50 µg/cm2; and further in particular of no more than about 5 µg/cm2.
- The method of one of the preceding claims, wherein the laser light has a wavelength of about 248 nm.
- The method of one of the preceding claims, wherein the power of the laser light is about 100 mW.
- The method of one of the preceding claims, wherein the Raman return signal is detected from a standoff distance of at least 10 meters and the target substance is- no more than 45 µg of PETN;- no more than 5 µg of RDX; and/or- no more than 500 ng of AN.
- The method of one of the preceding claims, wherein a standoff distance between a laser emitting the laser light and the target substance is about 10 meters.
- An apparatus, comprising:a laser that produces laser light at a wavelength of 248 nm;a telescope configured to receive a Raman return signal from a trace amount of a target substance excited by the laser light;a spectrograph configured to disperse the Raman return signal received via the telescope into its constituent wavelengths and generate a corresponding optical signal; anda camera, in communication with the spectrograph, configured to convert the optical signal output from the spectrograph into an electrical signal, wherein, when the apparatus is in use, a ratio of a power of the Raman return signal to fluorescence power is at least about 0.1.
- The apparatus of claim 9, further comprising an analysis computer configured to compare the electrical signal to respective ones of Raman signatures stored in a library and to identify the target substance.
- The apparatus of claim 9 or 10, wherein the power of the laser light is about 100mW.
Applications Claiming Priority (2)
| Application Number | Priority Date | Filing Date | Title |
|---|---|---|---|
| US37446510P | 2010-08-17 | 2010-08-17 | |
| US13/150,757 US8665433B2 (en) | 2010-08-17 | 2011-06-01 | Standoff explosives detector using deep-UV Raman spectroscopy |
Publications (2)
| Publication Number | Publication Date |
|---|---|
| EP2420823A1 true EP2420823A1 (en) | 2012-02-22 |
| EP2420823A8 EP2420823A8 (en) | 2012-05-30 |
Family
ID=44514558
Family Applications (1)
| Application Number | Title | Priority Date | Filing Date |
|---|---|---|---|
| EP11177529A Withdrawn EP2420823A1 (en) | 2010-08-17 | 2011-08-15 | Standoff explosives detector using deep-uv raman spectroscopy |
Country Status (5)
| Country | Link |
|---|---|
| US (1) | US8665433B2 (en) |
| EP (1) | EP2420823A1 (en) |
| JP (1) | JP5885964B2 (en) |
| AU (1) | AU2011211364A1 (en) |
| CA (1) | CA2749473C (en) |
Cited By (2)
| Publication number | Priority date | Publication date | Assignee | Title |
|---|---|---|---|---|
| CN104713865A (en) * | 2013-12-13 | 2015-06-17 | 中国科学院大连化学物理研究所 | Deep ultraviolet laser Raman spectrometer |
| EP3505915A1 (en) * | 2017-12-26 | 2019-07-03 | Nuctech Company Limited | Raman spectrum detection apparatus and method based on power of reflected light and image recognition |
Families Citing this family (14)
| Publication number | Priority date | Publication date | Assignee | Title |
|---|---|---|---|---|
| US9262692B2 (en) * | 2011-11-04 | 2016-02-16 | Polestar Technologies, Inc. | Methods and systems for detection and identification of concealed materials |
| US9305237B2 (en) * | 2011-11-04 | 2016-04-05 | Polestar Technologies, Inc. | Methods and systems for detection and identification of concealed materials |
| PL2880440T3 (en) | 2012-07-30 | 2019-05-31 | In Ovo B V | DETERMINING GENDER, LIFE AND / OR DEVELOPMENT STAGE OF BIRDS IN OVO |
| EP3734256A1 (en) * | 2014-04-17 | 2020-11-04 | Battelle Memorial Institute | Explosives detection using raman spectroscopy |
| JP6230957B2 (en) * | 2014-05-29 | 2017-11-15 | 株式会社日立国際電気 | Inspection apparatus and inspection method |
| US9551649B2 (en) | 2015-05-28 | 2017-01-24 | Src, Inc. | Surface sampling method, device, and system for enhanced detection of chemical and biological agents |
| US10274404B1 (en) * | 2017-02-15 | 2019-04-30 | SpecTree LLC | Pulsed jet sampling of particles and vapors from substrates |
| US10753829B2 (en) * | 2016-02-15 | 2020-08-25 | Spectree, Llc | Aerodynamic sampling of particles and vapors from surfaces for real-time analysis |
| WO2017204636A2 (en) * | 2016-05-24 | 2017-11-30 | In Ovo B.V. | Method and system for the non-destructive in ovo determination of fowl gender |
| DE102018129807A1 (en) | 2017-11-24 | 2019-06-27 | Deutsches Zentrum für Luft- und Raumfahrt e.V. | Method and system for classifying chemical and biological substances |
| JP7406510B2 (en) * | 2018-05-30 | 2023-12-27 | ペンダー・テクノロジーズ,リミテッド・ライアビリティ・カンパニー | Method and apparatus for standoff difference Raman spectroscopy with improved eye safety and reduced risk of explosion |
| CN112362635A (en) * | 2020-11-02 | 2021-02-12 | 公安部第三研究所 | Remote material detection device based on ultraviolet Raman spectrum analysis |
| CN114993952B (en) * | 2022-06-08 | 2025-10-17 | 中国科学院微电子研究所 | Multifunctional SERS detection method and system |
| CN121090497B (en) * | 2025-09-16 | 2026-05-15 | 中验检测股份有限公司 | A method and system for detecting residual items on outer packaging based on Raman spectroscopy |
Citations (5)
| Publication number | Priority date | Publication date | Assignee | Title |
|---|---|---|---|---|
| US6608677B1 (en) | 1998-11-09 | 2003-08-19 | Brookhaven Science Associates Llc | Mini-lidar sensor for the remote stand-off sensing of chemical/biological substances and method for sensing same |
| US6788407B1 (en) | 2002-03-18 | 2004-09-07 | Itt Manufacturing Enterprises, Inc. | Laser interrogation of surface agents |
| US20070165236A1 (en) * | 2006-01-17 | 2007-07-19 | Honeywell International Inc. | Optochemical sensor |
| US20100171951A1 (en) * | 2009-01-05 | 2010-07-08 | Misra Anupam Kumar | Methods and apparatus for remote raman and laser-induced breakdown spectrometry |
| US7796251B2 (en) | 2006-03-22 | 2010-09-14 | Itt Manufacturing Enterprises, Inc. | Method, apparatus and system for rapid and sensitive standoff detection of surface contaminants |
Family Cites Families (14)
| Publication number | Priority date | Publication date | Assignee | Title |
|---|---|---|---|---|
| US3403061A (en) * | 1960-02-01 | 1968-09-24 | Atomic Energy Commission Usa | Process of conditioning particulate materials for use in organic explosives |
| US6205354B1 (en) * | 1999-06-18 | 2001-03-20 | University Of Utah | Method and apparatus for noninvasive measurement of carotenoids and related chemical substances in biological tissue |
| US6669094B2 (en) * | 2002-02-04 | 2003-12-30 | Jan N. Hodges | Method of embedding and recovering encoded item identification information in an emulsion by means of radiant energy |
| US7548311B2 (en) | 2005-04-29 | 2009-06-16 | Ahura Corporation | Method and apparatus for conducting Raman spectroscopy |
| US7420664B2 (en) | 2005-07-14 | 2008-09-02 | Chemimage Corporation | System and method for robot mounted sensor |
| US8072595B1 (en) * | 2005-08-29 | 2011-12-06 | Optech Ventures, Llc | Time correlation system and method |
| EP1969325A2 (en) * | 2005-12-23 | 2008-09-17 | Chemimage Corporation | Chemical imaging explosives (chimed) optical sensor |
| US7383129B1 (en) | 2006-09-07 | 2008-06-03 | Itt Manufacturing Enterprises, Inc. | Method and system for geo-referencing and visualization of detected contaminants |
| US8159662B2 (en) * | 2007-10-24 | 2012-04-17 | Exelis Inc. | Systems and methods for remote unmanned raman spectroscopy |
| US7760352B2 (en) * | 2008-03-18 | 2010-07-20 | Itt Manufacturing Enterprises, Inc. | Dual pulse single event Raman spectroscopy |
| JP2009258030A (en) * | 2008-04-21 | 2009-11-05 | Jeol Ltd | Method for acquiring raman spectra |
| US7933013B2 (en) * | 2008-05-23 | 2011-04-26 | Itt Manufacturing Enterprises, Inc. | Detection of materials based on raman scattering and laser-induced fluorescence by deep UV excitation |
| JP2010101757A (en) * | 2008-10-23 | 2010-05-06 | Itt Manufacturing Enterprises Inc | System and method for remote unmanned raman spectroscopy |
| US9662047B2 (en) * | 2010-08-05 | 2017-05-30 | Massachusetts Institute Of Technology | Portable raman diagnostic system |
-
2011
- 2011-06-01 US US13/150,757 patent/US8665433B2/en active Active - Reinstated
- 2011-08-09 CA CA2749473A patent/CA2749473C/en active Active
- 2011-08-11 AU AU2011211364A patent/AU2011211364A1/en not_active Abandoned
- 2011-08-15 EP EP11177529A patent/EP2420823A1/en not_active Withdrawn
- 2011-08-16 JP JP2011178105A patent/JP5885964B2/en not_active Expired - Fee Related
Patent Citations (5)
| Publication number | Priority date | Publication date | Assignee | Title |
|---|---|---|---|---|
| US6608677B1 (en) | 1998-11-09 | 2003-08-19 | Brookhaven Science Associates Llc | Mini-lidar sensor for the remote stand-off sensing of chemical/biological substances and method for sensing same |
| US6788407B1 (en) | 2002-03-18 | 2004-09-07 | Itt Manufacturing Enterprises, Inc. | Laser interrogation of surface agents |
| US20070165236A1 (en) * | 2006-01-17 | 2007-07-19 | Honeywell International Inc. | Optochemical sensor |
| US7796251B2 (en) | 2006-03-22 | 2010-09-14 | Itt Manufacturing Enterprises, Inc. | Method, apparatus and system for rapid and sensitive standoff detection of surface contaminants |
| US20100171951A1 (en) * | 2009-01-05 | 2010-07-08 | Misra Anupam Kumar | Methods and apparatus for remote raman and laser-induced breakdown spectrometry |
Non-Patent Citations (4)
| Title |
|---|
| DAVID D. TUSCHEL ET AL: "Deep Ultraviolet Resonance Raman Spectroscopy of Explosives", AIP CONFERENCE PROCEEDINGS, 1 January 2010 (2010-01-01), pages 869 - 870, XP055011407, ISSN: 0094-243X, DOI: 10.1063/1.3482860 * |
| GAFT M ET AL: "UV gated Raman spectroscopy for standoff detection of explosives", OPTICAL MATERIALS, ELSEVIER SCIENCE PUBLISHERS B.V. AMSTERDAM, NL, vol. 30, no. 11, 1 July 2008 (2008-07-01), pages 1739 - 1746, XP022713651, ISSN: 0925-3467, [retrieved on 20080102], DOI: 10.1016/J.OPTMAT.2007.11.013 * |
| NAGLI L ET AL: "Absolute Raman cross-sections of some explosives: Trend to UV", OPTICAL MATERIALS, ELSEVIER SCIENCE PUBLISHERS B.V. AMSTERDAM, NL, vol. 30, no. 11, 1 July 2008 (2008-07-01), pages 1747 - 1754, XP022713652, ISSN: 0925-3467, [retrieved on 20080221], DOI: 10.1016/J.OPTMAT.2007.11.019 * |
| W. F. HUG ET AL: "Performance status of a small robot-mounted or hand-held, solar-blind, standoff chemical, biological, and explosives (CBE) sensor", PROCEEDINGS OF SPIE, vol. 7304, 1 January 2009 (2009-01-01), pages 73040Z - 73040Z-8, XP055011463, ISSN: 0277-786X, DOI: 10.1117/12.817881 * |
Cited By (4)
| Publication number | Priority date | Publication date | Assignee | Title |
|---|---|---|---|---|
| CN104713865A (en) * | 2013-12-13 | 2015-06-17 | 中国科学院大连化学物理研究所 | Deep ultraviolet laser Raman spectrometer |
| CN104713865B (en) * | 2013-12-13 | 2017-09-29 | 中国科学院大连化学物理研究所 | A kind of deep ultraviolet laser Raman spectrometer |
| EP3505915A1 (en) * | 2017-12-26 | 2019-07-03 | Nuctech Company Limited | Raman spectrum detection apparatus and method based on power of reflected light and image recognition |
| US10775310B2 (en) | 2017-12-26 | 2020-09-15 | Nutech Company Limited | Raman spectrum detection apparatus and method based on power of reflected light and image recognition |
Also Published As
| Publication number | Publication date |
|---|---|
| US8665433B2 (en) | 2014-03-04 |
| US20120044478A1 (en) | 2012-02-23 |
| JP2012042471A (en) | 2012-03-01 |
| EP2420823A8 (en) | 2012-05-30 |
| AU2011211364A1 (en) | 2012-03-08 |
| JP5885964B2 (en) | 2016-03-16 |
| CA2749473C (en) | 2019-12-03 |
| CA2749473A1 (en) | 2012-02-17 |
Similar Documents
| Publication | Publication Date | Title |
|---|---|---|
| US8665433B2 (en) | Standoff explosives detector using deep-UV Raman spectroscopy | |
| KR101694717B1 (en) | Detection of chemicals with infrared light | |
| US8421017B2 (en) | Analyte detection with infrared light | |
| US6608677B1 (en) | Mini-lidar sensor for the remote stand-off sensing of chemical/biological substances and method for sensing same | |
| Izake | Forensic and homeland security applications of modern portable Raman spectroscopy | |
| US7692775B2 (en) | Time and space resolved standoff hyperspectral IED explosives LIDAR detection | |
| US7692776B2 (en) | Chemical imaging explosives (CHIMED) optical sensor | |
| Zachhuber et al. | Stand-off spatial offset Raman spectroscopy for the detection of concealed content in distant objects | |
| Macarthur et al. | Dual-comb scanning spectrometer for remote sensing of traces of explosives | |
| Guicheteau et al. | Applications of spatially offset Raman spectroscopy to defense and security | |
| Lee et al. | Detection of hazardous chemical using dual-wavelength Raman spectroscopy in the ultraviolet region | |
| Cantu et al. | Explosives and warfare agents remote Raman detection on realistic background s amples | |
| US9606062B2 (en) | Method and a system for detection of hazardous chemicals in a non-metallic container | |
| Kullander et al. | Raman efficiency in the middle ultraviolet band for G‐series nerve agents and sulfur mustard | |
| Zhevlakov et al. | Remote laser spectroscopy of oil and gas deposits | |
| Gomer et al. | STARR: shortwave-targeted agile Raman robot for the detection and identification of emplaced explosives | |
| Higdon et al. | Laser interrogation of surface agents (LISA) for chemical agent reconnaissance | |
| Wilsenack et al. | First results of a QCL-OPA based standoff system, for detecting hazardous substances in the IR-fingerprint domain | |
| Stothard et al. | Routes to enabling Raman detection of in-theatre biological contaminants over extended range: spatial heterodyne spectroscopy, time-resolved Raman measurements, and the march towards the deep-UV | |
| Chen et al. | A review on several key problems of standoff trace explosives detection by optical-related technology | |
| Hernández-Rivera et al. | Remote raman and infrared spectroscopy detection of high explosives | |
| Chyba et al. | Field tests of the laser interrogation of surface agents (lisa) system for on-the-move standoff sensing of chemical agents | |
| Bar | Raman-based point and proximal detection and imaging | |
| Hernández‐Rivera | Vibrational spectroscopy of chemical warfare agents | |
| Zachhuber et al. | Stand off spatial offset Raman spectroscopy: a distant look behind the scenes |
Legal Events
| Date | Code | Title | Description |
|---|---|---|---|
| AK | Designated contracting states |
Kind code of ref document: A1 Designated state(s): AL AT BE BG CH CY CZ DE DK EE ES FI FR GB GR HR HU IE IS IT LI LT LU LV MC MK MT NL NO PL PT RO RS SE SI SK SM TR |
|
| AX | Request for extension of the european patent |
Extension state: BA ME |
|
| PUAI | Public reference made under article 153(3) epc to a published international application that has entered the european phase |
Free format text: ORIGINAL CODE: 0009012 |
|
| RIN1 | Information on inventor provided before grant (corrected) |
Inventor name: PENDALL-JONES, JAMES Inventor name: REZAC, JEROMY Inventor name: LAVALLEY, HOWARD N Inventor name: DARE, RYAN EDWARD |
|
| RIN1 | Information on inventor provided before grant (corrected) |
Inventor name: REZAC, JEROMY Inventor name: LAVALLEY, HOWARD N. Inventor name: PENDALL-JONES, JAMES Inventor name: DARE, RYAN EDWARD |
|
| RAP1 | Party data changed (applicant data changed or rights of an application transferred) |
Owner name: EXELIS INC. |
|
| 17P | Request for examination filed |
Effective date: 20120815 |
|
| RAP1 | Party data changed (applicant data changed or rights of an application transferred) |
Owner name: EXELIS INC. |
|
| R17P | Request for examination filed (corrected) |
Effective date: 20120815 |
|
| RAP1 | Party data changed (applicant data changed or rights of an application transferred) |
Owner name: EAGLE TECHNOLOGY, LLC |
|
| RIN1 | Information on inventor provided before grant (corrected) |
Inventor name: DARE, RYAN EDWARD Inventor name: LAVALLEY, HOWARD N. Inventor name: REZAC, JEROMY Inventor name: PENDALL-JONES, JAMES |
|
| 17Q | First examination report despatched |
Effective date: 20170407 |
|
| STAA | Information on the status of an ep patent application or granted ep patent |
Free format text: STATUS: THE APPLICATION HAS BEEN WITHDRAWN |
|
| 18W | Application withdrawn |
Effective date: 20171011 |