EP2401689B1 - Improved diagnosis of liver fibrosis or cirrhosis - Google Patents
Improved diagnosis of liver fibrosis or cirrhosis Download PDFInfo
- Publication number
- EP2401689B1 EP2401689B1 EP10707497.3A EP10707497A EP2401689B1 EP 2401689 B1 EP2401689 B1 EP 2401689B1 EP 10707497 A EP10707497 A EP 10707497A EP 2401689 B1 EP2401689 B1 EP 2401689B1
- Authority
- EP
- European Patent Office
- Prior art keywords
- fibrosis
- fibrometer
- lse
- liver
- index
- Prior art date
- Legal status (The legal status is an assumption and is not a legal conclusion. Google has not performed a legal analysis and makes no representation as to the accuracy of the status listed.)
- Active
Links
Images


Classifications
-
- A—HUMAN NECESSITIES
- A61—MEDICAL OR VETERINARY SCIENCE; HYGIENE
- A61B—DIAGNOSIS; SURGERY; IDENTIFICATION
- A61B5/00—Measuring for diagnostic purposes; Identification of persons
- A61B5/41—Detecting, measuring or recording for evaluating the immune or lymphatic systems
- A61B5/414—Evaluating particular organs or parts of the immune or lymphatic systems
- A61B5/416—Evaluating particular organs or parts of the immune or lymphatic systems the spleen
-
- A—HUMAN NECESSITIES
- A61—MEDICAL OR VETERINARY SCIENCE; HYGIENE
- A61B—DIAGNOSIS; SURGERY; IDENTIFICATION
- A61B5/00—Measuring for diagnostic purposes; Identification of persons
- A61B5/42—Detecting, measuring or recording for evaluating the gastrointestinal, the endocrine or the exocrine systems
- A61B5/4222—Evaluating particular parts, e.g. particular organs
- A61B5/4244—Evaluating particular parts, e.g. particular organs liver
-
- G—PHYSICS
- G16—INFORMATION AND COMMUNICATION TECHNOLOGY [ICT] SPECIALLY ADAPTED FOR SPECIFIC APPLICATION FIELDS
- G16H—HEALTHCARE INFORMATICS, i.e. INFORMATION AND COMMUNICATION TECHNOLOGY [ICT] SPECIALLY ADAPTED FOR THE HANDLING OR PROCESSING OF MEDICAL OR HEALTHCARE DATA
- G16H50/00—ICT specially adapted for medical diagnosis, medical simulation or medical data mining; ICT specially adapted for detecting, monitoring or modelling epidemics or pandemics
- G16H50/20—ICT specially adapted for medical diagnosis, medical simulation or medical data mining; ICT specially adapted for detecting, monitoring or modelling epidemics or pandemics for computer-aided diagnosis, e.g. based on medical expert systems
-
- A—HUMAN NECESSITIES
- A61—MEDICAL OR VETERINARY SCIENCE; HYGIENE
- A61B—DIAGNOSIS; SURGERY; IDENTIFICATION
- A61B8/00—Diagnosis using ultrasonic, sonic or infrasonic waves
- A61B8/08—Clinical applications
-
- A—HUMAN NECESSITIES
- A61—MEDICAL OR VETERINARY SCIENCE; HYGIENE
- A61B—DIAGNOSIS; SURGERY; IDENTIFICATION
- A61B8/00—Diagnosis using ultrasonic, sonic or infrasonic waves
- A61B8/48—Diagnostic techniques
- A61B8/485—Diagnostic techniques involving measuring strain or elastic properties
Definitions
- This invention relates to an improved diagnosis method of liver fibrosis or cirrhosis, through combination of at least one FibroMeter and at least one Fibroscan, in an individual, especially in an individual suffering from a condition involving significant or severe fibrosis or cirrhosis.
- the method of the invention leads to scores called SF or C-index and optionally to combination thereof.
- Liver biopsy is the historical means in order to diagnose liver disease in patients. However, since liver biopsy is invasive and expensive, non-invasive diagnosis of liver fibrosis has gained considerable attention over the last 10 years as an alternative to liver biopsy.
- the first generation of simple blood fibrosis tests combined common indirect blood markers into a simple ratio, like APRI (5) or more recently FIB-4 (6).
- the second generation of calculated tests combined indirect and/or direct fibrosis markers by logistic regression, like Fibrotest (7), ELF score (8), FibroMeter (9), Fibrospect (10), and Hepascore (11).
- WO03073822 describes a non-invasive method for the diagnosis of liver disease and its severity, by measuring levels of specific variables, including biological variables and clinical variables, and combining said variables into mathematical functions to provide a score, often called "score of fibrosis".
- the method of WO03073822 is also useful for monitoring the efficacy of a treatment of a liver disease or condition.
- a further non-invasive diagnosis method of liver fibrosis is to use physical methods, for example ultrasonographic elastometry (12) in order to collect data useful for the diagnostic of fibrosis, such as for example " Liver Stiffness Evaluation” (LSE).
- ultrasonographic elastometry (12)
- LSE Liver Stiffness Evaluation
- liver biopsy has been combined into sequential algorithms in order to increase the diagnostic accuracy and limit the rate of liver biopsy (13-16).
- These sequential algorithms are usually based on a stepwise diagnosis including blood tests as a first step, followed by liver biopsy for the remaining grey zone of indeterminate cases.
- clinical applicability of these multiple-step sequential algorithms is difficult.
- liver biopsy is still required in 20 to 50% of patients.
- the diagnostic target of the present invention can be:
- liver fibrosis is an on-going process, and that there is a important medical need for continuing to improve the diagnosis of liver fibrosis and to improve the monitoring of the treatment of a liver disease or condition. Moreover, due to price and invasiveness of biopsy, there is still a need to reduce liver biopsy requirement.
- the diagnostic methods are appreciated by their performance, i.e. their ability to correctly classify the tested individuals, as to their fibrosis development.
- the Applicant surprisingly realized that combining scores from blood tests and data issued from imaging means, resulted in a score having an incredibly high diagnostic performance (accuracy).
- the Applicant compared for the first time the diagnostic accuracy of imaging data, such as for example liver stiffness evaluation, and 5 blood tests, and compared their accuracy to the accuracy of their synchronous combination, either in a large population of patients with various causes of liver diseases or conditions (see example 2) or in an homogeneous population in terms of cause, such as for example patients suffering from chronic hepatitis C (see example 1).
- LSE Liver Stiffness Evaluation
- the Applicant has found that the combination of diagnostic information from FibroMeter and data from FibroscanTM, i.e., LSE data, provided several advantages and unexpected accurate results for the diagnosis of liver fibrosis, from significant fibrosis to severe fibrosis and cirrhosis.
- the Applicant has also set up a first algorithm, called Angers SF-algorithm, combining scores from blood test and Fibroscan data, appeared to be, at the date of priority of the present application, the best solution among known alternatives to the Applicant, such as high correct classification and low liver biopsy requirement, reflected by a low liver biopsy/accuracy ratio.
- Angers SF-algorithm a first algorithm
- the present invention thus relates to a non-invasive method leading to a score obtained by a binary logistic regression, combining FibroMeter score and Fibroscan data for assessing, with a high accuracy, the presence or the severity of fibrosis in an individual.
- the synchronous combination set forth in the invention results in the accumulation of FibroMeter and Fibroscan advantages, in the subtraction of their drawbacks, thereby significantly increasing the single diagnostic accuracy for liver fibrosis.
- the method of the invention includes repeating several times, at least twice, the method, in order to obtain at least two scores.
- the method of the invention may also include, in a further step, the combination of at least two scores as described hereabove (i.e. two scores obtained by a binary logistic regression, combining FibroMeter score and Fibroscan, data), said combination being implemented in an algorithm based on the diagnostic reliable intervals (see for example table 5 of example 1). Carrying out this further step leads to three new scores/classifications called F ⁇ 2 index, F ⁇ 3 index, F4 index) for the non-invasive diagnosis of fibrosis. Implementing this further step is of high industrial interest, and results in extended accuracy.
- the invention also relates to a method wherein the combination through a mathematical function, of at least one FibroMeter and of at least one data issued from Fibroscan, is performed at least twice and the at least two resulting scores are combined in an algorithm based on the diagnostic reliable intervals.
- the method of the invention improves the diagnostic accuracy and markedly reduces the biopsy requirement in algorithms.
- This invention therefore relates to a method of diagnosing the presence and/or severity of a liver pathology and/or of monitoring the effectiveness of a curative treatment against a liver pathology in an individual, comprising the combination, of at least one blood test and at least one data issued from a physical method of diagnosing liver fibrosis, i.e., ultrasonographic elastometry (like Fibroscan or ARFI) data, said combination being performed through a mathematical function.
- the medical imaging data are LSE data.
- the mathematical function is known to one skilled in the art.
- the mathematical function preferably is a binary logistic regression.
- the method of the invention includes:
- the combination is a synchronous combination.
- Synchronous combination is a one-step combination of data of step a) and data of step b) into a new score usually by binary logistic regression.
- Performance of synchronous combination is carried out as follows: the results of the FibroMeter and the data from FibroscanTM, such as for example LSE data, are recorded in a first step. Then, their values are computerized to obtain the combined score.
- the Applicant noticed that, unexpectedly, the score resulting from the implementation of the method of the invention, attesting the presence or the severity of a liver disease or condition, resulting from the synchronous combination of a FibroMeter and LSE data from a physical method, obtained through Fibroscan, had an improved accuracy and, consequently, decreased the biopsy requirement in sequential algorithms (for diagnosis of significant fibrosis: biopsy requirement ⁇ 20%, for diagnosis of cirrhosis: biopsy requirement ⁇ 10%).
- the accuracy of the method of the invention is higher than 75%, preferably 80 to 99%, more preferably 85 to 95%, even more preferably around 90%. The accuracy means the number of patients correctly classified.
- the liver disease or condition is significant porto-septal fibrosis, severe porto-septal fibrosis, centrolobular fibrosis, cirrhosis, persinusoidal fibrosis, the fibrosis being from alcoholic or non-alcoholic origin.
- the individual is a patient with chronic Hepatitis C.
- the blood test is a FibroMeter score.
- FIBROMETERTM is a family of blood tests the content of which depends on the cause of chronic liver disease and the diagnostic target with details in the following table: FibroMeter Age Sex A2M AH PI PLT AST Urea GGT Bili ALT Fer Glu F virus x x x x x x x x x x AOF virus x x x x x x F alcohol x x x x AOF alcohol x x x x X A2M : alpha2-macroglobulin, HA: hyaluronic acid, PI: prothrombin index, PLT;platelets, Bili: bilirubin, Fer: ferritin, Glu: glucose ; F fibrosis score (Metavir), AOF : area of fibrosis, NAFLD : non alcoholic fatty liver disease
- the data are LSE data.
- the data are issued from a Fibroscan.
- This score corresponds to the p logit wherein p is the probability of presence of a significant or severe fibrosis, or of cirrhosis.
- a lesion for example significant fibrosis
- a diagnostic threshold generally equal to 0,5 or equal to maximal Youden index (Se + Spe -1) or equal to maximal diagnostic performance (unless otherwise specified).
- coefficients that may be used in the binary regression of the method of the invention are the following: 3.9066 FM + 0.1870 FS - 2.8345, Where FM: FibroMeter value, FS: Fibroscan value.
- coefficients that may be used in the binary regression of the method of the invention are the following: 3.6128 FM + 0.1484 FS - 6.4999
- coefficients that may be used in the binary regression of the method of the invention are the following: 3.3135 FM + 0.1377 FS - 4.2485.
- FM FibroMeter value
- FS Fibroscan value.
- beta coefficients with 95% confidence intervals specifically observed in chronic viral hepatitis C may be for example: Diagnostic target FibroMeter Fibroscan Constant Significant fibrosis (Metavir ⁇ F2) 3.90657157 (2.73122696 ; 5.08191618) 0.18702583 (0.08912122 ; 0.28493045) -2.83445806 (-3.68641133 ; - 1.98250480) Severe fibrosis (Metavir ⁇ F3) 3.31347460 (2.09369314 ; 4.53325606) 0.13767514 (0.08253199 ; 0.19281830) 4.24854774 (-5.18908296 ; - 3.30801253) Cirrhosis (Metavir F4) 3.61284547 (1.49920710 ; 5.72648384 0.14837243 0.09607115 ; 0.20067372) -6.49993316 (-8.28162434 ; -4.71824198) wherein
- the blood score is the FibroMeter score and the physical method data are LSE data through ultrasonographic elastometry, i.e., Fibroscan.
- the FibroMeter was always identified as the first independent predictor of significant fibrosis despite a slightly lower AUROC than LSE. Indeed, the FibroMeter provided the highest diagnostic accuracy in logistic regression. In addition, the FibroMeter might be the most accurate and robust among common blood tests (18).
- the synchronous combination of FibroMeter and LSE was the most accurate for the diagnosis of significant fibrosis as well as for cirrhosis.
- the presence or severity of liver disease or condition is diagnosed in two steps, first step being the FibroMeter blood test and second step being collecting data from a physical method, preferably LSE data, and wherein the combination of FibroMeter blood test and said data is performed through logistic regression.
- the liver biopsy/accuracy ratio may range from 0.10 for cirrhosis to 0.22 for clinically significant fibrosis ; whereas this ratio ranges from 0.25 to 0.51 in classical algorithms without synchronous combination.
- the method of the invention leads to a significant fibrosis score, called significant fibrosis-index (SF-index).
- SF-index significant fibrosis-index
- This score was set up by using results from experimentations in a group of patients with both blood tests (preferably FibroMeter) and imaging data (preferably LSE data).
- the method of the invention leads to a cirrhosis score, called C-index implementing the method of the invention, for the diagnosis of patients with cirrhosis.
- the Applicant noticed that the method of the invention provided a significantly higher AUROC than the blood test or physical data, for example LSE, alone, especially for the diagnosis of significant fibrosis, and a gain in predictive values for cirrhosis (see for example Table 4 of Example 2).
- SF-index inherited the lowest misclassification rate provided by each single test in each fibrosis stage: the blood test in F0/1 stages, and LSE in F ⁇ 2 stages (see for example Figure 1 ). Moreover, the SF-index resolved 66% of discordant cases between the blood test and LSE (see for example Table 5 of Example 2). Finally, SF-index significantly increased the rate of patients included in the interval of ⁇ 90% predictive values (see for example Table 6 of Example 2). Therefore, SF-index induced a highly significant lower rate of Liver Biopsy than the blood test or LSE in sequential algorithm. Moreover, the three simple intervals of reliable diagnosis determined by SF-index (F0/1, F1 ⁇ 1, and F ⁇ 2) provided a non-invasive diagnosis in 100% of the population with 90.6% accuracy without liver biopsy requirement (see for example Figure 3a ).
- the C-index although it afforded no apparent significant gain in accuracy for cirrhosis diagnosis compared to LSE alone (see for example Table 3, 4 of Example 2 ), it did provide two advantages: 1) it resolved 68.4% of discordant cases between LSE and the blood test (see for example Table 5 of Example 2 ), and 2) the patient rate with ⁇ 90% predictive values was significantly higher than with LSE or blood test alone (see for example Table 6 of Example 2 ), thus resulting in a very low rate of Liver Biopsy required in the algorithm (9%). Finally, the C-index allowed for a non-invasive diagnosis of cirrhosis in 100% of patients, with 90.3% accuracy, by considering three intervals of reliable individual diagnosis: no cirrhosis, F ⁇ 2, and cirrhosis, without liver biopsy requirement.
- the Applicant showed that the Padova algorithm had a significantly higher diagnostic accuracy for significant fibrosis than the Bordeaux and Angers algorithms.
- this accuracy was mainly due to the high rate of required Liver Biopsy.
- the rates of required Liver Biopsy and of correctly classified patients among those not requiring Liver Biopsy are more appropriate descriptors than overall diagnostic accuracy.
- the Angers algorithm provided the best solution between high diagnostic accuracy (91.9%) and the lowest rate of required Liver Biopsy (20.2%).
- a part of apparently misclassified patients provided by an algorithm are in fact attributable to the misclassification of Liver Biopsy used as the reference (sampling error and observer variability).
- the method of the invention significantly increases the diagnostic accuracy of tests for significant fibrosis, and increases the reliability of individual diagnosis via predictive values for significant fibrosis and cirrhosis.
- the combination resolves discordant results between non-invasive tests and reduces non-concordant results with liver biopsy (LB). It also decreases the LB requirement in the traditional diagnosis of significant fibrosis or cirrhosis when they are the unique binary diagnostic targets.
- the new method of reliable individual diagnosis which adds an intermediate diagnostic target to the previous binary diagnostic target, suppresses or considerably diminishes any LB requirement.
- a simple sequential algorithm including the synchronous blood test score + imaging data combination, provided high diagnostic accuracy while lowering LB requirement, notably to less than 10% for cirrhosis diagnosis.
- the method of the invention may also include, in a further step, the combination of a SF-index and a C-index in an algorithm based on the diagnostic reliable intervals (see for example table 5 of example 1).
- liver fibrosis tests were performed: Fibroscan (FS), Fibrotest, FibroMeter (FM, for significant fibrosis or cirrhosis), Hepascore, Fib4, and APRI.
- FS Fibroscan
- FM FibroMeter
- Hepascore Fib4
- APRI APRI
- Reference for liver fibrosis was Metavir F staging. Fibrosis tests independently associated with significant fibrosis (F ⁇ 2) or cirrhosis (F4) were identified by stepwise binary logistic regression repeated on 1000 bootstrap samples of 349 patients.
- the exploratory set included 349 patients. 132 patients from the 512 of the Fibrostar study were already included in the exploratory set. We thus removed these patients from the validation set which finally included 380 patients.
- the characteristics of both exploratory and validation sets are detailed in the Table 1 of Example 1. Among the 2 groups, 93.5% of liver biopsy were considered as reliable.
- Cirrhosis - The fibrosis tests most frequently selected by the 1000 bootstrap multivariate analyses were also LSE and FibroMeter ( Table 2 of Example 1 ). The regression score of F4-index including these 2 fibrosis tests and specifically designed for the diagnosis of cirrhosis was: 3.6128 FibroMeter + 0.1484 LSE result - 6.4999. F4-index had a higher AUROC than FM and LSE, but the difference was significant only with FibroMeter ( Table 3 of Example 1 ).
- F ⁇ 3-index provided 4 IRD (F ⁇ 2, F2 ⁇ 1, F ⁇ 2, F ⁇ 3; Figure 1b ) which well classified 91.7% of patients without any liver biopsy performed.
- the first classification was derived from both F ⁇ 2- and F ⁇ 3-indexes used with their IRD ( Table 5 of Example 1 ).
- Classification A included 6 classes: F0/1, F1/2, F2 ⁇ 1, F2/3, F ⁇ 2, and F ⁇ 3. It provided 86.2% diagnostic accuracy in the exploratory set.
- the second classification was derived from the IRD of F ⁇ 2- and F4 indexes ( Table 5 of Example 1 ).
- the third classification was derived from the IRD for significant fibrosis of FibroMeter, and those for severe fibrosis of LSE ( Table 5 of Example 1 ). Results of FibroMeter and LSE RDI were discordant in 2 patients which had thus undetermined diagnosis ( Table 5 of Example 1 ).
- Example 1 Patients characteristics at inclusion All Set p Exploratory Validation Patients (n) 729 349 380 - Male sex (%) 61.3 60.2 62.4 0.531 Age (years) 51.7 ⁇ 11.2 52.1 ⁇ 11.2 51.3 ⁇ 11.2 0.347 Metavir F (%): ⁇ 10 -3 - 0 4.0 1.4 6.3 - 1 37.7 30.7 44.2 - 2 25.8 35.5 16.8 - 3 17.6 20.6 14.7 - 4 15.0 11.7 17.9 0.020 Significant fibrosis (%) 58.3 67.9 49.5 ⁇ 10 -3 Reliable biopsy (%) 93.5 92.6 94.2 0.391 LSE result (kPa) 10.0 ⁇ 7.9 9.9 ⁇ 8.1 10.1 ⁇ 7.7 0.755 IQR/median ⁇ 0.21 (%) 66.9 66.2 67.6 0.700 LSE: liver stiffness evaluation; kPa: kilopascal; IQR: interquartile range Table 2 of Example
- Stepwise binary logistic regressions were performed on 1000 bootstrap samples of 349 subjects from the exploratory set.
- the table depicts the number of times any fibrosis test was selected across the 1000 multivariate analyses. For each diagnostic target, LSE and FibroMeter were the mostly selected variables.
- Cut-offs for NPV ⁇ 90% and PPV ⁇ 90% were calculated in the exploratory set and tested in the validation set and the whole population.
- Cut-offs for NPV ⁇ 95% FibroMeter: ⁇ 0.757, Fibroscan: ⁇ 14.5, F4-index: ⁇ 0.244; cut-offs for PPV ⁇ 90%: Fibroscan: ⁇ 34.1, F4-index: ⁇ 0.817; Cut-offs for PPV ⁇ 95%: Fibroscan: ⁇ 35.6, F4-index: ⁇ 0.896.
- Example 1 Implementation of 3 new classifications for the non invasive diagnosis of fibrosis, derived from the interpretation of the interval of reliable diagnosis of several fibrosis tests (F ⁇ 2- and F ⁇ 3 indexes, F ⁇ 3- and F ⁇ 4 indexes, FibroMeter and Fibroscan).
- the new classifications are depicted in italic (into brackets: rate of well classified patients in each class of the new classification according to liver biopsy results). Grey cells correspond to discordant results.
- liver fibrosis evaluation was considered as reliable when biopsy length was ⁇ 15 mm and/or portal tract number ⁇ 8 (17).
- LSE FibroScan®, EchoSensTM, Paris, France
- LSE conditions were those recommended by the manufacturer, as detailed elsewhere (21, 22).
- LSE was stopped when 10 valid measurements were recorded.
- the LSE result was expressed in kPa and corresponded to the median of all valid measurements performed within the LSE. Interquartile range (kPa) was defined as previously described (21).
- diagnostic cut-off values of fibrosis tests were calculated according to the highest Youden index (sensitivity + specificity -1). This technique allows maximizing the diagnostic accuracy with equilibrium between a high sensitivity and a high specificity by selecting an appropriate diagnostic cut-off.
- the diagnostic cut-off is here the values of blood test or LSE that distinguishes the patients as having or not the diagnostic target (significant fibrosis or cirrhosis).
- AUROC receiver operating characteristic curve
- Sample size was determined to show a significant difference for the diagnosis of significant fibrosis between FM and synchronous combination in the exploratory population.
- ⁇ risk 0.05
- ⁇ risk 0.20
- significant fibrosis prevalence 0.70
- AUROC correlation 0.70
- a bilateral test the sample size was 159 patients for the following hypothesis of AUROC: FM: 0.84
- synchronous combination 0.90.
- the software programs used for statistical analyses were SPSS for Windows, version 11.5.1 (SPSS Inc., Chicago, IL, USA) and SAS 9.1 (SAS Institute Inc., Cary, NC, USA).
- the characteristics of the 390 patients are summarized in Table 1 of Example 2.
- Mean age of patients was 52.4 years, 67.9% were male, and 74.4% had significant fibrosis.
- 89.5% of patients had a liver biopsy considered as reliable.
- Liver Stiffness Evaluation failure occurred in 12 patients (overall failure rate: 3.1%).
- 332 had all 5 blood tests and LSE available.
- Table 1 of Example 2 Patient characteristics at inclusion.
- LSE AUROC was significantly higher than that of Hepascore, FIB-4, and APRI for the diagnosis of significant fibrosis, and was not significantly different from FibroMeter and Fibrotest AUROCs.
- Table 2 of Example 2 AUROCs of blood tests and liver stiffness evaluation (LSE) as a function of diagnostic target, in the 332 patients having all 5 blood tests and LSE available.
- SF-index AUROCs were not significantly different between groups A and B.
- SF-index AUROC was significantly higher than that of FibroMeter (FM) or Liver Stiffness Evaluation (LSE) in the whole population.
- Figure 1 shows that SF-index had the better performance profile: its misclassification rate was significantly lower than LSE in Metavir F ⁇ 1 stages and significantly lower than FM in Metavir F ⁇ 2 stages.
- Discordances between LSE and FM - Discordances between fibrosis tests for the diagnostic target were calculated according to the diagnostic cut-off determined by the highest Youden index.
- FM and LSE were concordant in 279 (73.0%) patients of whom 88.9% were correctly classified according to liver biopsy (F ⁇ 1: 77.0%, F ⁇ 2: 94.3%).
- FM and LSE were discordant in the 103 (27.0%) remaining patients of whom 68 (66.0%) were correctly classified by SF-index according to liver biopsy results (Table 5 of Example 2).
- SF-index correctly classified 316 (82.7%) patients and improved correct classification (i.e., discordances between FM and LSE resolved by SF-index) in 33 (8.6%) patients.
- New sequential algorithm - SF-index included significantly more patients than FM or LSE in the classical intervals of ⁇ 90% predictive values (see Appendix for precise definition), especially in the ⁇ 90% NPV interval (Table 6 of Example 2).
- SF-index with ⁇ 90% predictive values in 81.7% of patients and liver biopsy required in the remaining 18.3% of patients, a correct diagnosis of significant fibrosis based on liver biopsy was obtained in 91.9% of patients (Table 6 of Example 2).
- This two-step sequential algorithm was called Angers SF-algorithm ( Figure 2 ).
Landscapes
- Health & Medical Sciences (AREA)
- Life Sciences & Earth Sciences (AREA)
- Engineering & Computer Science (AREA)
- Biomedical Technology (AREA)
- Medical Informatics (AREA)
- Public Health (AREA)
- General Health & Medical Sciences (AREA)
- Pathology (AREA)
- Surgery (AREA)
- Molecular Biology (AREA)
- Gastroenterology & Hepatology (AREA)
- Veterinary Medicine (AREA)
- Animal Behavior & Ethology (AREA)
- Physics & Mathematics (AREA)
- Heart & Thoracic Surgery (AREA)
- Biophysics (AREA)
- Vascular Medicine (AREA)
- Immunology (AREA)
- Endocrinology (AREA)
- Physiology (AREA)
- Databases & Information Systems (AREA)
- Epidemiology (AREA)
- Data Mining & Analysis (AREA)
- Primary Health Care (AREA)
- Investigating Or Analysing Biological Materials (AREA)
- Ultra Sonic Daignosis Equipment (AREA)
Description
- This invention relates to an improved diagnosis method of liver fibrosis or cirrhosis, through combination of at least one FibroMeter and at least one Fibroscan, in an individual, especially in an individual suffering from a condition involving significant or severe fibrosis or cirrhosis. The method of the invention leads to scores called SF or C-index and optionally to combination thereof.
- Liver biopsy is the historical means in order to diagnose liver disease in patients. However, since liver biopsy is invasive and expensive, non-invasive diagnosis of liver fibrosis has gained considerable attention over the last 10 years as an alternative to liver biopsy. The first generation of simple blood fibrosis tests combined common indirect blood markers into a simple ratio, like APRI (5) or more recently FIB-4 (6). The second generation of calculated tests combined indirect and/or direct fibrosis markers by logistic regression, like Fibrotest (7), ELF score (8), FibroMeter (9), Fibrospect (10), and Hepascore (11). For example,
WO03073822 WO03073822 - A further non-invasive diagnosis method of liver fibrosis is to use physical methods, for example ultrasonographic elastometry (12) in order to collect data useful for the diagnostic of fibrosis, such as for example "Liver Stiffness Evaluation" (LSE). In a recent article entitled "Performance of Transient Elastography for the Staging of Liver Fibrosis: A Meta Analysis" released in Gastroenterology 2008; 134:960-974 Friedrich-Rust et al validated "Transient Elastometry" for the staging of Liver Fibrosis.
- Finally, blood fibrosis tests have been combined into sequential algorithms in order to increase the diagnostic accuracy and limit the rate of liver biopsy (13-16). These sequential algorithms are usually based on a stepwise diagnosis including blood tests as a first step, followed by liver biopsy for the remaining grey zone of indeterminate cases. However, clinical applicability of these multiple-step sequential algorithms is difficult. Moreover, liver biopsy is still required in 20 to 50% of patients.
- The diagnostic target of the present invention can be:
- a fibrosis class:
- ∘ significant fibrosis, defined as Metavir stages ≥ 2 or Ishak stages ≥ 3
- ∘ severe fibrosis, defined as Metavir stages ≥ 3 or Ishak stages ≥ 4
- ∘ cirrhosis defined as Metavir stages = 4 or Ishak stages ≥ 5
- the amount of fibrosis, like the area of fibrosis expressed in surface of fibrotic tissue compared to the whole liver tissue, or the three-dimensional amount of fibrosis, expressed in volume of fibrotic tissue compared to the whole liver tissue,
- the quantitative architecture of fibrosis, reflected by the fractal dimension like that of Kolgomorov.
- One skilled in the art addressing such diagnostic technical issues, knows that the identification of reliable methods for early and accurate diagnosis of liver fibrosis is an on-going process, and that there is a important medical need for continuing to improve the diagnosis of liver fibrosis and to improve the monitoring of the treatment of a liver disease or condition. Moreover, due to price and invasiveness of biopsy, there is still a need to reduce liver biopsy requirement. The diagnostic methods are appreciated by their performance, i.e. their ability to correctly classify the tested individuals, as to their fibrosis development.
- Up to now, one skilled in the art used to implement blood tests combining blood markers and clinical markers such as age, sex, etc... on the one hand, and imagery means on the other hand. Both blood test and imaging means were deemed as having their own specific advantages and one skilled in the art used blood tests or imaging means, depending on the Metavir stage of the patient.
- The Applicant surprisingly realized that combining scores from blood tests and data issued from imaging means, resulted in a score having an incredibly high diagnostic performance (accuracy). When performing the present invention, the Applicant compared for the first time the diagnostic accuracy of imaging data, such as for example liver stiffness evaluation, and 5 blood tests, and compared their accuracy to the accuracy of their synchronous combination, either in a large population of patients with various causes of liver diseases or conditions (see example 2) or in an homogeneous population in terms of cause, such as for example patients suffering from chronic hepatitis C (see example 1).
- At the time where the Applicant conceived the invention, one skilled in the art had no information whether or not the combination of scores issued from blood tests and of data issued from imaging means was of interest. The statistical evaluation, e.g. trough differences between the AUROCs (Area Under the Receiver Operating Characteristic), i.e. the main diagnostic information ever used combining sensitivity and specificity, of this combination had not been performed yet at the date of invention.
- As an example of data of interest issued from imaging means, is the Liver Stiffness Evaluation (LSE). LSE was known for having a good accuracy for the diagnosis of cirrhosis but reproducibility of LSE was poor in early fibrosis stages. For this reason, LSE was mainly used for the diagnostic of cirrhosis.
- For early fibrosis stages, blood tests have shown higher reproducibility and accuracy than LSE.
- Surprisingly, the Applicant has found that the combination of diagnostic information from FibroMeter and data from Fibroscan™, i.e., LSE data, provided several advantages and unexpected accurate results for the diagnosis of liver fibrosis, from significant fibrosis to severe fibrosis and cirrhosis.
- The Applicant has also set up a first algorithm, called Angers SF-algorithm, combining scores from blood test and Fibroscan data, appeared to be, at the date of priority of the present application, the best solution among known alternatives to the Applicant, such as high correct classification and low liver biopsy requirement, reflected by a low liver biopsy/accuracy ratio.
- The present invention thus relates to a non-invasive method leading to a score obtained by a binary logistic regression, combining FibroMeter score and Fibroscan data for assessing, with a high accuracy, the presence or the severity of fibrosis in an individual.
- The synchronous combination set forth in the invention results in the accumulation of FibroMeter and Fibroscan advantages, in the subtraction of their drawbacks, thereby significantly increasing the single diagnostic accuracy for liver fibrosis.
- In an embodiment, the method of the invention includes repeating several times, at least twice, the method, in order to obtain at least two scores. In this embodiment, the method of the invention may also include, in a further step, the combination of at least two scores as described hereabove (i.e. two scores obtained by a binary logistic regression, combining FibroMeter score and Fibroscan, data), said combination being implemented in an algorithm based on the diagnostic reliable intervals (see for example table 5 of example 1). Carrying out this further step leads to three new scores/classifications called F≥2 index, F≥3 index, F4 index) for the non-invasive diagnosis of fibrosis. Implementing this further step is of high industrial interest, and results in extended accuracy. Thus, the invention also relates to a method wherein the combination through a mathematical function, of at least one FibroMeter and of at least one data issued from Fibroscan, is performed at least twice and the at least two resulting scores are combined in an algorithm based on the diagnostic reliable intervals.
- The method of the invention improves the diagnostic accuracy and markedly reduces the biopsy requirement in algorithms.
- This invention therefore relates to a method of diagnosing the presence and/or severity of a liver pathology and/or of monitoring the effectiveness of a curative treatment against a liver pathology in an individual, comprising the combination, of at least one blood test and at least one data issued from a physical method of diagnosing liver fibrosis, i.e., ultrasonographic elastometry (like Fibroscan or ARFI) data, said combination being performed through a mathematical function. According to the invention, the medical imaging data are LSE data.
- The mathematical function is known to one skilled in the art. The mathematical function preferably is a binary logistic regression.
- More specifically, the method of the invention includes:
- a) performing, from a blood sample of an individual, a FibroMeter score,
- b) performing a Fibroscan in order to collect data related to fibrosis, and
- c) combining the score and the data issued from physical method in a binary logistic regression, thus resulting in a new score for the diagnosis of the presence and/or severity of a liver pathology and/or of monitoring the effectiveness of a curative treatment against a liver pathology in an individual.
- In a preferred embodiment, the combination is a synchronous combination. Synchronous combination is a one-step combination of data of step a) and data of step b) into a new score usually by binary logistic regression.
- Performance of synchronous combination is carried out as follows: the results of the FibroMeter and the data from Fibroscan™, such as for example LSE data, are recorded in a first step. Then, their values are computerized to obtain the combined score.
- The Applicant noticed that, unexpectedly, the score resulting from the implementation of the method of the invention, attesting the presence or the severity of a liver disease or condition, resulting from the synchronous combination of a FibroMeter and LSE data from a physical method, obtained through Fibroscan, had an improved accuracy and, consequently, decreased the biopsy requirement in sequential algorithms (for diagnosis of significant fibrosis: biopsy requirement ≈20%, for diagnosis of cirrhosis: biopsy requirement ≈10%). According to the invention, the accuracy of the method of the invention is higher than 75%, preferably 80 to 99%, more preferably 85 to 95%, even more preferably around 90%. The accuracy means the number of patients correctly classified.
- Preferably, the liver disease or condition is significant porto-septal fibrosis, severe porto-septal fibrosis, centrolobular fibrosis, cirrhosis, persinusoidal fibrosis, the fibrosis being from alcoholic or non-alcoholic origin. According to an embodiment, the individual is a patient with chronic Hepatitis C.
- According to the invention, the blood test is a FibroMeter score.
- FIBROMETER™ is a family of blood tests the content of which depends on the cause of chronic liver disease and the diagnostic target with details in the following table:
FibroMeter Age Sex A2M AH PI PLT AST Urea GGT Bili ALT Fer Glu F virus x x x x x x X x AOF virus x x x x x x F alcohol x x x x AOF alcohol x x x x F NAFLD x x X x x X x X A2M : alpha2-macroglobulin, HA: hyaluronic acid, PI: prothrombin index, PLT;platelets, Bili: bilirubin, Fer: ferritin, Glu: glucose ; F : fibrosis score (Metavir),
AOF : area of fibrosis, NAFLD : non alcoholic fatty liver disease - Preferably, the data are LSE data. According to the invention, the data are issued from a Fibroscan.
- According to a preferred embodiment, the mathematical logistic regression function is the following:

- This score corresponds to the p logit wherein p is the probability of presence of a significant or severe fibrosis, or of cirrhosis.
- p is calculated as follows:


- The presence of a lesion (for example significant fibrosis) is determined by a probability p higher than a diagnostic threshold generally equal to 0,5 or equal to maximal Youden index (Se + Spe -1) or equal to maximal diagnostic performance (unless otherwise specified).
- According to one embodiment of the invention, for significant fibrosis, coefficients that may be used in the binary regression of the method of the invention are the following: 3.9066 FM + 0.1870 FS - 2.8345, Where FM: FibroMeter value, FS: Fibroscan value.
- According to another embodiment of the invention, for cirrhosis, coefficients that may be used in the binary regression of the method of the invention are the following: 3.6128 FM + 0.1484 FS - 6.4999
- According to yet another embodiment of the invention, for severe fibrosis, coefficients that may be used in the binary regression of the method of the invention are the following: 3.3135 FM + 0.1377 FS - 4.2485.
Where FM: FibroMeter value, FS: Fibroscan value. - Scores of binary logistic regression: beta coefficients with 95% confidence intervals specifically observed in chronic viral hepatitis C, may be for example:
Diagnostic target FibroMeter Fibroscan Constant Significant fibrosis (Metavir ≥ F2) 3.90657157 (2.73122696 ; 5.08191618) 0.18702583 (0.08912122 ; 0.28493045) -2.83445806 (-3.68641133 ; - 1.98250480) Severe fibrosis (Metavir ≥ F3) 3.31347460 (2.09369314 ; 4.53325606) 0.13767514 (0.08253199 ; 0.19281830) 4.24854774 (-5.18908296 ; - 3.30801253) Cirrhosis (Metavir F4) 3.61284547 (1.49920710 ; 5.72648384 0.14837243 0.09607115 ; 0.20067372) -6.49993316 (-8.28162434 ; -4.71824198) wherein
FM = FibroMeter™
FS = Fibroscan™ - According to the invention, the blood score is the FibroMeter score and the physical method data are LSE data through ultrasonographic elastometry, i.e., Fibroscan. In all populations tested, the FibroMeter was always identified as the first independent predictor of significant fibrosis despite a slightly lower AUROC than LSE. Indeed, the FibroMeter provided the highest diagnostic accuracy in logistic regression. In addition, the FibroMeter might be the most accurate and robust among common blood tests (18). Among the various evaluations in the Applicant's study, the synchronous combination of FibroMeter and LSE was the most accurate for the diagnosis of significant fibrosis as well as for cirrhosis.
- Advantageously, the presence or severity of liver disease or condition is diagnosed in two steps, first step being the FibroMeter blood test and second step being collecting data from a physical method, preferably LSE data, and wherein the combination of FibroMeter blood test and said data is performed through logistic regression.
- According to the method of the invention, the liver biopsy/accuracy ratio may range from 0.10 for cirrhosis to 0.22 for clinically significant fibrosis ; whereas this ratio ranges from 0.25 to 0.51 in classical algorithms without synchronous combination.
- According to one embodiment, the method of the invention leads to a significant fibrosis score, called significant fibrosis-index (SF-index). This score was set up by using results from experimentations in a group of patients with both blood tests (preferably FibroMeter) and imaging data (preferably LSE data).
- According to another embodiment of the invention, the method of the invention leads to a cirrhosis score, called C-index implementing the method of the invention, for the diagnosis of patients with cirrhosis.
- Regarding the gain in accuracy provided by the method of the invention, the Applicant noticed that the method of the invention provided a significantly higher AUROC than the blood test or physical data, for example LSE, alone, especially for the diagnosis of significant fibrosis, and a gain in predictive values for cirrhosis (see for example Table 4 of Example 2).
- Regarding the SF-index, it inherited the lowest misclassification rate provided by each single test in each fibrosis stage: the blood test in F0/1 stages, and LSE in F≥2 stages (see for example
Figure 1 ). Moreover, the SF-index resolved 66% of discordant cases between the blood test and LSE (see for example Table 5 of Example 2). Finally, SF-index significantly increased the rate of patients included in the interval of ≥90% predictive values (see for example Table 6 of Example 2). Therefore, SF-index induced a highly significant lower rate of Liver Biopsy than the blood test or LSE in sequential algorithm. Moreover, the three simple intervals of reliable diagnosis determined by SF-index (F0/1, F1±1, and F≥2) provided a non-invasive diagnosis in 100% of the population with 90.6% accuracy without liver biopsy requirement (see for exampleFigure 3a ). - Regarding the C-index, although it afforded no apparent significant gain in accuracy for cirrhosis diagnosis compared to LSE alone (see for example Table 3, 4 of Example 2), it did provide two advantages: 1) it resolved 68.4% of discordant cases between LSE and the blood test (see for example Table 5 of Example 2), and 2) the patient rate with ≥90% predictive values was significantly higher than with LSE or blood test alone (see for example Table 6 of Example 2), thus resulting in a very low rate of Liver Biopsy required in the algorithm (9%). Finally, the C-index allowed for a non-invasive diagnosis of cirrhosis in 100% of patients, with 90.3% accuracy, by considering three intervals of reliable individual diagnosis: no cirrhosis, F≥2, and cirrhosis, without liver biopsy requirement.
- Regarding sequential algorithms, as demonstrated in a recent preliminary study (34), the Applicant showed that the Padova algorithm had a significantly higher diagnostic accuracy for significant fibrosis than the Bordeaux and Angers algorithms. However, this accuracy was mainly due to the high rate of required Liver Biopsy. In fact, to evaluate the clinical interest of an algorithm, the rates of required Liver Biopsy and of correctly classified patients among those not requiring Liver Biopsy are more appropriate descriptors than overall diagnostic accuracy. In that respect, the Angers algorithm provided the best solution between high diagnostic accuracy (91.9%) and the lowest rate of required Liver Biopsy (20.2%). Finally, it should be noticed that a part of apparently misclassified patients provided by an algorithm are in fact attributable to the misclassification of Liver Biopsy used as the reference (sampling error and observer variability).
- In the work performed to reduce to practice the present invention, accuracies for the diagnosis of significant fibrosis or cirrhosis of the Bordeaux and Padova algorithms were similar to those previously published (16, 34, 35). Thus, the Applicant provides herein an independent external validation of these algorithms that were the previous reference in terms of algorithms. Interestingly, accuracies of the three algorithms were not significantly different between patients with chronic viral hepatitis and those with other cause of CLD, except for cirrhosis with the Angers C-algorithm. Because the Bordeaux and Padova algorithms were elaborated in chronic viral C hepatitis, the present invention states that these sequential algorithms can also be extended to other causes of CLD.
- Thus, the method of the invention significantly increases the diagnostic accuracy of tests for significant fibrosis, and increases the reliability of individual diagnosis via predictive values for significant fibrosis and cirrhosis. The combination resolves discordant results between non-invasive tests and reduces non-concordant results with liver biopsy (LB). It also decreases the LB requirement in the traditional diagnosis of significant fibrosis or cirrhosis when they are the unique binary diagnostic targets. Also, the new method of reliable individual diagnosis, which adds an intermediate diagnostic target to the previous binary diagnostic target, suppresses or considerably diminishes any LB requirement. Finally, a simple sequential algorithm, including the synchronous blood test score + imaging data combination, provided high diagnostic accuracy while lowering LB requirement, notably to less than 10% for cirrhosis diagnosis.
- According to an embodiment of the invention, the method of the invention may also include, in a further step, the combination of a SF-index and a C-index in an algorithm based on the diagnostic reliable intervals (see for example table 5 of example 1).
- The invention will be better understood in view of the following examples, which are read with consideration of the figures:
Figures 1 to 4 are to be read with regard to example 2.Figure 5 is to be read with regard to Example 1. -
Figure 1 : Misclassification rate (%) for significant fibrosis of FibroMeter, liver stiffness evaluation (LSE), and their synchronous combination (SF-index) as a function of Metavir fibrosis stages. Diagnostic cut-offs used for significant fibrosis were, according to the highest Youden index: FibroMeter: 0.538, LSE: 6.9 kiloPascals, and SF-index: 0.753. -
Figure 2 : Sequential algorithms for the diagnosis of significant fibrosis (Angers SF-algorithm,panel 2a) or cirrhosis (Angers C-algorithm,panel 2b). A specific score combining FibroMeter and LSE is initially used (SF-index for significant fibrosis or C-index for cirrhosis), and liver biopsy is subsequently required in case of indeterminate diagnosis. -
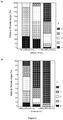
Figure 3 : Reliable diagnosis intervals for significant fibrosis (panel 3a) or cirrhosis (panel 3b): proportion of Metavir fibrosis (F) stages, according to liver biopsy, on Y axis as a function of intervals determined by thresholds of 90% negative (NPV) and positive (PPV) predictive values of SF-index (3a) or C-index (3b) on X axis. Rates of patients (%) included in the intervals of reliable diagnosis are depicted in parentheses on X axis. -
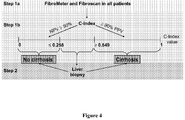
Figure 4 : Practical algorithm for the diagnosis of cirrhosis (Angers C-algorithm). A score combining FibroMeter and Fibroscan values (C-index) is calculated in a first step. According to the present study, in the first non-invasive step, cirrhosis was excluded in 70.4% of patients and affirmed in 20.2%. Liver biopsy was required in a second step in only 9.4% of patients. -
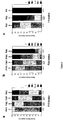
Figure 5 : Intervals of reliable diagnosis of F≥2-, F≥3- and F4-indexes.Panel 1a: proportion of Metavir fibrosis stages (F) according to the statistical diagnostic cut-off (0.500) and the thresholds of 90% negative and positive predictive values for significant fibrosis with F≥2-index.Panel 1b: proportion of Metavir fibrosis stages (F) according to the statistical diagnostic cut-off (0.500) and the thresholds of 90% negative and positive predictive values for severe fibrosis with F≥3-index.Panel 1b: proportion of Metavir fibrosis stages (F) according to the thresholds of 95% predictive values for cirrhosis with F4-index. - The following examples may be read, when appropriate, with references to the figures, and shall not be considered as limiting in any way the scope of this invention.
- Blood fibrosis tests and liver stiffness measured by ultrasonographic elastometry like Fibroscan™ are well correlated with the histological stages of fibrosis. In this study, we aimed to improve non-invasive diagnosis of liver fibrosis stages via a novel combination of blood tests and Fibroscan.
- Methods: 349 patients with chronic hepatitis C across three centres were included in the study. For each patient, a liver biopsy and the following fibrosis tests were done: Fibroscan (FS), Fibrotest, FibroMeter (FM, for significant fibrosis or cirrhosis), Hepascore, Fib4, and APRI. Reference for liver fibrosis was Metavir F staging. Fibrosis tests independently associated with significant fibrosis (F≥2) or cirrhosis (F4) were identified by stepwise binary logistic regression repeated on 1000 bootstrap samples of 349 patients.
- Results: Prevalences of diagnostic targets were, significant fibrosis: 67.9%, cirrhosis: 11.8%. Multivariate analyses on the 1000 bootstrap samples indicated that FM and FS were the tests most frequently associated with significant fibrosis or cirrhosis. We thus implemented 2 new scores combining FS and FM by using binary logistic regression: F2-score for the diagnosis of significant fibrosis and F4-score for cirrhosis. F2-score provided reliable diagnosis of significant fibrosis, with predictive values ≥90%, in 55.6% of patients. F4-score provided reliable diagnosis of cirrhosis, with predictive values ≥95%, in 89.1% of patients. An algorithm combining F2-score and F4-score, as a function of their interval of highest diagnostic accuracy, produced a new diagnostic classification (% of patients): F0/1 (9.5%), F1/2 (17.2%), F2±1 (27.2%), F2/3 (33.2%), F3±1 (10.9%), and F4 (2.0%). According to liver biopsy results, this new classification provided 88.0% diagnostic accuracy, outperforming FM (67.6%, p<10-3), FS (55.3%, p<10-3) and Fibrotest (33.2%, p<10-3) classifications. Furthermore, diagnostic accuracy of the new classification did not significantly differ over the 3 centres (92.9%, 85.7%, and 86.3%, p=0.20) or between patients with biopsies < or ≥25mm (respectively: 87.2% versus 88.5%, p=0.72). Conclusions: The non-invasive diagnosis of liver fibrosis in patients with chronic hepatitis C is improved by a combination of FibroMeter and Fibroscan. A new classification using the two scores derived from the test combination is much more accurate than single fibrosis tests and provides a non-invasive diagnosis in 100% of patients with 88% accuracy without any liver biopsy.
- The exploratory set included 349 patients. 132 patients from the 512 of the Fibrostar study were already included in the exploratory set. We thus removed these patients from the validation set which finally included 380 patients. The characteristics of both exploratory and validation sets are detailed in the Table 1 of Example 1. Among the 2 groups, 93.5% of liver biopsy were considered as reliable.
- Significant fibrosis - The fibrosis tests most frequently selected by the stepwise binary logistic regression repeated on the 1000 bootstrap samples for the diagnosis of significant fibrosis were LSE and FibroMeter (Table 2 of Example 1). F≥2-index was implemented by including these 2 fibrosis tests as independent variables in a binary logistic regression performed in the whole population of the exploratory set. The regression score of F≥2-index, specifically designed for the diagnosis of significant fibrosis, was: 3.9066 FibroMeter + 0.1870 LSE result - 2.8345. F≥2-index had a significantly higher AUROC than FibroMeter and LSE (Table 3 of Example 1).
- Severe fibrosis - The fibrosis tests most frequently selected by the 1000 bootstrap multivariate analyses were LSE and FibroMeter (Table 2 of Example 1). The regression score of F≥3-index including these 2 fibrosis tests and specifically designed for the diagnosis of severe fibrosis was: 3.3135 FibroMeter + 0.1377 LSE result - 4.2485. F≥3-index had a higher AUROC than FM and LSE, but the difference was significant only with FibroMeter (Table 3 of Example 1).
- Cirrhosis - The fibrosis tests most frequently selected by the 1000 bootstrap multivariate analyses were also LSE and FibroMeter (Table 2 of Example 1). The regression score of F4-index including these 2 fibrosis tests and specifically designed for the diagnosis of cirrhosis was: 3.6128 FibroMeter + 0.1484 LSE result - 6.4999. F4-index had a higher AUROC than FM and LSE, but the difference was significant only with FibroMeter (Table 3 of Example 1).
- Significant fibrosis - F≥2-index included 32 (9.2%) patient in the ≥90% negative predictive value (NVP) interval and 161 (46.1%) patients in the ≥90% positive predictive value (PPV) interval (Table 4 of Example 1). Thus, F≥2-index allowed a reliable diagnosis of significant fibrosis with ≥90% accuracy in 55.3% of patients, versus 33.8% with LSE (p<10-3) and 55.6 with FibroMeter (p=1.00). The indeterminate interval between F≥2-index values >0.248 and <0.784 was divided into two new intervals according to the statistical cut-off of 0.500. 90.2% of the patients included in the lower interval (>0.248 - <0.500) had F1/2 stages according to liver biopsy results, and 96.8% of patients included in the higher interval (≥0.500 - <0.784) had F1/2/3 stages
(Figure 1a) . Finally, F≥2-index provided 4 IRD: F0/1, F1/2, F2±1, and F≥2. By using these intervals, 92.0% of patients were well classified without any liver biopsy performed(Figure 1a) . FibroMeter provided the same 4 IRD which well classified 90.3% of patients (p=0.263 vs F≥2-index). - Severe fibrosis - F≥3-index included 174 (49.9%) patients in the intervals of ≥90% predictive values for severe fibrosis (Table 4 of Example 1), versus 41.8% with FibroMeter (p<10-3) and 46.4% with LSE (p=0.235). By dividing the intermediate interval of F≥3-index according to the statistical cut-off of 0.500, F≥3-index provided 4 IRD (F≤2, F2±1, F≥2, F≥3;
Figure 1b ) which well classified 91.7% of patients without any liver biopsy performed. By dividing its intermediate interval with the cut-off corresponding to the highest Youden index (9.2 kPa), LSE provided the same 4 IRD which well classified 91.1% of patients (p=0.860 vs F≥3-index). - Cirrhosis - F4-index included 313 (89.7%) patients in the intervals of ≥95% predictive values for cirrhosis (Table 4 of Example 1), versus 65.9% with FibroMeter (p<10-3) and 87.4% with LSE (p=0.096). Dividing the intermediate interval according to the cut-off 0.500 did not allow for distinguish two different groups. Finally, F4-index provided 3 IRD (F≤3, F≥2, and F4) which well classified 95.1% of patients
(Figure 1c) . - The first classification (classification A) was derived from both F≥2- and F≥3-indexes used with their IRD (Table 5 of Example 1). Classification A included 6 classes: F0/1, F1/2, F2±1, F2/3, F≥2, and F≥3. It provided 86.2% diagnostic accuracy in the exploratory set.
- The second classification (classification B) was derived from the IRD of F≥2- and F4 indexes (Table 5 of Example 1). Classification B included 6 classes (F0/1, F1/2, F2±1, F2/3, F≥2, F4) and provided 88.3% diagnostic accuracy (p=0.143 vs classification A). The third classification (classification C) was derived from the IRD for significant fibrosis of FibroMeter, and those for severe fibrosis of LSE (Table 5 of Example 1). Results of FibroMeter and LSE RDI were discordant in 2 patients which had thus undetermined diagnosis (Table 5 of Example 1). Classification C finally included 8 classes (F0/1, F1, F1/2, F2, F2±1, F2/3, F≥2, F≥3) and provided 84.0% diagnostic accuracy (p=0.229 vs classification A).
- Diagnostic accuracy offibrosis tests classifications - The rates of well classified patients by the new classifications A and B were not significantly different in the validation set (respectively: 84.2% vs 82.4%, p=0.149), but were significantly higher than those of FibroMeter, LSE and Fibrotest (Table 6 of Example 1). One patient had undetermined diagnosis with the classification C that provided 70.3% diagnostic accuracy. Among already published classifications, FibroMeter provided the highest diagnostic accuracy (69.7%, p<0,029 vs LSE and Fibrotest), and Fibrotest the lower (p<10-3 vs others). Finally, according to their diagnostic accuracies in the validation set, the classifications were ordered as follow: A, B > C > FibroMeter > LSE > Fibrotest (Table 6 of Example 1).
- Influencing factors - In the whole study population, we performed a stepwise binary logistic regression including age, sex, biopsy length, Metavir F, and IQR/median as independent variables. Misclassification by classification A was independently associated only with the ratio IQR/median. In the validation set, classification A provided 88.2% diagnostic accuracy in patients with IQR/median <0.21 versus 70.1% in patients with IQR/median≥0.21 (p=0,010). In the subgroup of patients with IQR/median <0.21, classification A had the highest diagnostic accuracy with p=0.007 versus classification B (85.5%), and p<10-3 versus others.
- Management for antiviral therapy in clinical practice - Antiviral therapy was considered when FibroMeter classification was ≥F2/3, LSE: ≥F2, Fibrotest: ≥F2, classifications A and B: ≥F2±1, and classification C: ≥F2. By using classification A, 12.1% of patients in the validation set were considered for antiviral therapy whereas they had no/mild fibrosis at liver biopsy (Table 7 of Example 1). On the other hand, 9.7% of patients had no treatment whereas they had significant fibrosis at liver biopsy. Finally, classification A provided the highest rate of patients well managed for antiviral therapy (78.2%, p<0,040 versus others classifications).
Table 1 of Example 1: Patients characteristics at inclusion All Set p Exploratory Validation Patients (n) 729 349 380 - Male sex (%) 61.3 60.2 62.4 0.531 Age (years) 51.7 ± 11.2 52.1 ± 11.2 51.3 ± 11.2 0.347 Metavir F (%): <10-3 - 0 4.0 1.4 6.3 - 1 37.7 30.7 44.2 - 2 25.8 35.5 16.8 - 3 17.6 20.6 14.7 - 4 15.0 11.7 17.9 0.020 Significant fibrosis (%) 58.3 67.9 49.5 <10-3 Reliable biopsy (%) 93.5 92.6 94.2 0.391 LSE result (kPa) 10.0 ± 7.9 9.9 ± 8.1 10.1 ± 7.7 0.755 IQR/median <0.21 (%) 66.9 66.2 67.6 0.700 LSE: liver stiffness evaluation; kPa: kilopascal; IQR: interquartile range Table 2 of Example 1: Selection of candidate predictors at bootstrapped stepwise binary logistic regressions, as a function of diagnostic target Fibrosis tests Significant fibrosis (Metavir F≥2) Severe fibrosis (Metavir F≥3) Cirrhosis (Metavir F=4) FibroMeter 920 903 610 FibroMeter F4 - - 284 Fibrotest 113 173 88 Hepascore 216 74 172 Fib4 85 103 62 APRI 350 504 59 LSE 964 1000 993 - Stepwise binary logistic regressions were performed on 1000 bootstrap samples of 349 subjects from the exploratory set. The table depicts the number of times any fibrosis test was selected across the 1000 multivariate analyses. For each diagnostic target, LSE and FibroMeter were the mostly selected variables.
Table 3: AUROC of FibroMeter, LSE and their synchronous combination as a function of diagnostic target and patient group Diagnostic target Fibrosis test Set p All Exploratory Validation Metavir F≥2 FibroMeter 0.806 ± 0.026 0.839 ± 0.022 0.333 0.813 ± 0.017 LSE 0.785 ± 0.026 0.828 ± 0.022 0.207 0.791 ± 0.017 F≥2-index 0.835 ± 0.023 0.875 ± 0.019 0.180 0.846 ± 0.015 FibroMeter vs LSE 0.513 0.685 - 0.301 FibroMeter vs F≥2-index 0.027 0.0020 - 0.0002 LSE vs F≥2-index 0.024 0.0086 - 0.0002 Metavir F≥3 FibroMeter 0.776 ± 0.025 0.880 ± 0.020 0.0012 0.829 ± 0.016 LSE 0.816 ± 0.025 0.881 ± 0.019 0.038 0.847 ± 0.016 F≥3-index 0.830 ± 0.022 0.918 ± 0.017 0.0016 0.875 ± 0.014 FibroMeter vs LSE 0.163 0.993 - 0.324 FibroMeter vs F≥3-index <10-4 0.0002 - <10-4 LSE vs F≥3-index 0.458 0.014 - 0.019 Metavir F=4 FibroMeter 0.814 ± 0.031 0.897 ± 0.021 0.027 0.861 ± 0.018 LSE 0.878 ± 0.032 0.927 ± 0.017 0.176 0.905 ± 0.017 F4-index 0.890 ± 0.028 0.947 ± 0.014 0.069 0.921 ± 0.015 FibroMeter vs LSE 0.059 0.193 - 0.026 FibroMeter vs F4-index 0.0004 0.0002 - <10-4 LSE vs F4-index 0.511 0.120 - 0.133 Table 4 of Example 1: Rate of patients included in the intervals of reliable diagnosis defined by the ≥90% negative (NPV) and positive (PPV) predictive values for significant fibrosis (Metavir F≥2) and ≥95% predictive values for cirrhosis (Metavir F=4), as a function of patient group and fibrosis test. Set Fibrosis test Metavir F≥2 Metavir F≥3 Metavir F=4 NPV ≥90% PPV ≥90% NPV+PPV ≥90% NPV ≥90% PPV ≥90% NPV+PPV ≥90% NPV ≥95% PPV ≥90% PPV ≥95% NPV+PPV ≥95% Exploratory FibroMeter 3.2 (90.9) 52.4 (89.6) 55.6 (89.7) 41.8 (89.7) 0.0 (-) 41.8 (89.7) 65.9 (94.8) 0.0 (-) 0.0 (-) 65.9 (94.8) Fibroscan 1.1 (100.0) 32.7 (90.4) 33.8 (90.7) 43.3 (90.1) 3.2 (90.9) 46.4 (90.1) 86.0 (94.7) 2.6 (88.9) 1.4 (100.0) 87.4 (94.8) F≥2-indexa 9.2 (90.6) 46.1 (90.1) 55.3 (90.2) 44.7 (89.7) 5.2 (88.9) 49.9 (89.7) 87.7 (94.8) 3.2 (90.9) 2.0 (100.0) 89.7 (94.9) Validation FibroMeter 1.2 (100.0) 47.6 (72.0) 48.8 (72.7) 47.0 (94.2) 0.0 (-) 47.0 (94.2) 64.2 (97.2) 0.0 (-) 0.0 (-) 64.2 (97.2) Fibroscan 0.9 (100.0) 37.3 (76.4) 38.2 (77.0) 44.5 (93.2) 2.1 (100.0) 46.7 (93.5) 83.3 (93.1) 2.1 (100.0) 1.8 (100.0) 85.2 (93.2) F≥3-indexa 7.6 (100.0) 41.5 (82.5) 49.1 (85.2) 51.2 (95.3) 7.3 (100.0) 58.5 (95.9) 85.2 (93.6) 2.4 (100.0) 2.1 (100.0) 87.3 (93.8) All FibroMeter 2.2 (93.3) 50.1 (81.5) 52.3 (82.0) 44.3 (92.0) 0.0 (-) 44.3 (92.0) 65.1 (95.9) 0.0 (-) 0.0 (-) 65.1 (95.9) Fibroscan 1.0 (100.0) 34.9 (83.1) 35.9 (83.6) 43.9 (91.6) 2.7 (94.4) 46.5 (91.8) 84.7 (93.9) 2.4 (93.8) 1.6 (100.0) 86.3 (94.0) F4-indexa 8.4 (94.7) 43.9 (86.6) 52.3 (87.9) 47.9 (92.6) 6.2 (95.2) 54.1 (92.9) 86.5 (94.2) 2.8 (94.7) 2.1 (100.0) 88.5 (94.3) - Cut-offs for NPV ≥90% and PPV ≥90% were calculated in the exploratory set and tested in the validation set and the whole population.
- Significant fibrosis. Cut-offs for NPV ≥90%: FibroMeter: ≤0.110, Fibroscan: ≤3.2, F≥2-index: ≤0.248; cut-offs for PPV ≥90%: FibroMeter: ≥0.608, Fibroscan: ≥9.2, F≥2-index: ≥0.784. Severe fibrosis. Cut-offs for NPV ≥90%: FibroMeter: ≤0.554, Fibroscan: ≤6.8, F≥3-index: ≤0.220; cut-offs for PPV ≥90%: Fibroscan: ≥32.3, F≥3-index: ≥0.870. Cirrhosis. Cut-offs for NPV ≥95%: FibroMeter: ≤0.757, Fibroscan: ≤14.5, F4-index: ≤0.244; cut-offs for PPV ≥90%: Fibroscan: ≥34.1, F4-index: ≥0.817; Cut-offs for PPV ≥95%: Fibroscan: ≥35.6, F4-index: ≥0.896.
- a SF-index for significant fibrosis, X-index for severe fibrosis, and C-index for cirrhosis.
Table 5 of Example 1: Implementation of 3 new classifications for the non invasive diagnosis of fibrosis, derived from the interpretation of the interval of reliable diagnosis of several fibrosis tests (F≥2- and F≥3 indexes, F≥3- and F≥4 indexes, FibroMeter and Fibroscan). The new classifications are depicted in italic (into brackets: rate of well classified patients in each class of the new classification according to liver biopsy results). Grey cells correspond to discordant results. Reliable intervals of F≥2-index F0/1 F1/2 F2±1 F≥2 Reliable intervals of F≥3-index F≤2 F0/1 (29/32) F1/2 (55/61) F1/2 (50/63) - F2±1 - - F2±1 (32/32) F2/3 (65/86) F≥2 - - - F≥2 (54/57) F≥3 - - - F3/4 (16/18) Reliable intervals of F4-index F≤3 F0/1 (29/32) F1/2 (55/61) F2±1 (92/95) F2/3 (90/118) F≥2 - - - F≥2 (35/36) F4 - - - F4 (7/7) Reliable intervals of FibroMeter for F≥2 F0/1 F1/2 F2±1 F≥2 Reliable intervals of LSE for F≥3 F≤2 F0/1 (9/9) F1/2 (68/74) F1/2 (21/23) F2 (23/45) F2±1 F1 1/1 F1/2 (23/26) F2±1 (8/9) F2/3 (43/48) F≥2 - F2 (4/13) F2/3 (6/9) F≥2 (77/80) F≥3 - - - F≥3 (10/10) Table 6 of Example 1: Diagnostic accuracies (% of well classified patients) of several fibrosis tests classifications as a function of patient group Set Exploratory Validation p All Classification Classification A 86.2 84.2 0.516 85.3 Classification B 88.3 82.4 0.038 85.4 Classification C 84.0 70.3 <10-3 77.3 FibroMeter 67.6 69.7 0.575 68.7 Fibroscana 54.4 63.3 0.024 58.7 Fibroscanb 45.0 59.0 <10-3 51.8 Fibroscanc 46.1 59.0 10-3 52.4 Fibroscand 52.7 63.9 0.004 58.1 Fibrotest 33.5 43.9 0.005 38.8 P Classification A vs classification B 0.143 0.146 - 1.000 Classification A vs classification C 0.229 <10-3 - <10-3 Classification A vs FibroMeter <10-3 <10-3 - <10-3 Classification A vs Fibroscana <10-3 <10-3 - <10-3 Classification A vs Fibrotest <10-3 <10-3 - <10-3 Classification B vs classification C 0.032 <10-3 - <10-3 Classification B vs FibroMeter <10-3 <10-3 - <10-3 Classification B vs Fibroscan a <10-3 <10-3 - <10-3 Classification B vs Fibrotest <10-3 <10-3 - <10-3 Classification C vs FibroMeter <10-3 0.720 - <10-3 Classification C vs Fibroscan a <10-3 0.049 - <10-3 Classification C vs Fibrotest <10-3 <10-3 - <10-3 FibroMeter vs Fibroscan a <10-3 0.029 - <10-3 FibroMeter vs Fibrotest <10-3 <10-3 - <10-3 Fibroscan a vs Fibrotest <10-3 <10-3 - <10-3 a 6 classes (de Ledinghen, GCB 2008); b 4 classes (Ziol 2005), c 4 classes (Stebbing 2009 + ≥9,6 kPa pour F≥3), d 3 classes (Stebbing 2009) Table 7 of Example 1: Management of patient for antiviral therapy according to the results of fibrosis tests classifications (rates of patients in the validation population, %) Liver biopsy result Management according classification result a Metavir F0/1 Metavir F≥2 Well managed No treatment Treatment No treatment Treatment Classification A 41.5 12.1 9.7 36.7 78.2 Classification B 27.0 26.7 4.2 42.1 69.1 Classification C 33.9 19.7 7.3 39.1 73.0 FibroMeter 38.3 12.2 12.8 36.7 75.0 Fibroscan (VDL) 42.5 10.8 16.9 29.8 72.3 Fibroscan (Ziol) 42.5 10.8 16.9 29.8 72.3 Fibroscan (Steb 4 cl) 41.9 11.4 16.3 30.4 72.3 Fibroscan (Steb 3 cl) 41.9 11.4 16.3 30.4 72.3 Fibrotest 30.3 20.3 7.5 41.9 72.2 a Indication for antiviral therapy : Classifications A and B : ≥ F2±1; Classification C: ≥F2; FibroMeter: ≥F2/3; Fibroscan VDL: ≥F2; Fibroscan Ziol and Stebbing 4 classes: ≥F2; Fibroscan Stebbing 3cl: ≥F2/3; Fibrotest: ≥F2 - 390 patients with chronic liver disease (CLD) hospitalized for a percutaneous liver biopsy at the University Hospitals of Angers and Bordeaux (France) were enrolled. 194 patients were included from April 2004 to June 2007 at the Angers site (group A, exploratory set), and 196 from September 2003 to April 2007 at the Bordeaux site (group B, validation set). Patients with the following cirrhosis complications were not included: ascites, variceal bleeding, systemic infection, and hepatocellular carcinoma. The non-invasive assessment of liver fibrosis by blood fibrosis tests and LSE was performed within one week prior to liver biopsy.
- Percutaneous liver biopsy was performed using Menghini's technique with a 1.4-1.6 mm diameter needle. In each site, liver fibrosis was evaluated by a senior pathologist specialized in hepatology according to Metavir staging (with a consensus reading in Angers). Significant fibrosis was defined by Metavir stages F≥2. Liver fibrosis evaluation was considered as reliable when biopsy length was ≥15 mm and/or portal tract number ≥8 (17).
- The following blood tests were calculated according to published formulas or patents: APRI, FIB-4, Fibrotest, Hepascore, and FibroMeter (FM). Cause-specific formulas were used for FibroMeter (9, 18, 19). All blood assays were performed in the same laboratories of each site. The inter-laboratory reproducibility was excellent for these tests (20).
- LSE (FibroScan®, EchoSensTM, Paris, France) was performed by an experienced observer (>50 LSE before the study), blinded for patient data. LSE conditions were those recommended by the manufacturer, as detailed elsewhere (21, 22). LSE was stopped when 10 valid measurements were recorded. The LSE result was expressed in kPa and corresponded to the median of all valid measurements performed within the LSE. Interquartile range (kPa) was defined as previously described (21).
- Quantitative variables were expressed as mean ± standard deviation, unless otherwise specified. When necessary, diagnostic cut-off values of fibrosis tests were calculated according to the highest Youden index (sensitivity + specificity -1). This technique allows maximizing the diagnostic accuracy with equilibrium between a high sensitivity and a high specificity by selecting an appropriate diagnostic cut-off. The diagnostic cut-off is here the values of blood test or LSE that distinguishes the patients as having or not the diagnostic target (significant fibrosis or cirrhosis).
- Accuracy of fibrosis tests - The performance of fibrosis tests was mainly expressed as the area under the receiver operating characteristic curve (AUROC). The reliable individual diagnosis was determined either by the traditional negative (NPV) and positive (PPV) predictive values, or by the recently described method of reliable diagnosis intervals (18) (see Appendix for precise definitions). AUROCs were compared by the Delong test (23).
- Synchronous combination of fibrosis tests - Combinations of blood tests and LSE were studied in 3 populations: group A, B, and A+B. In each population, we performed a forward binary logistic regression using significant fibrosis determined on liver biopsy as the dependent variable, and blood fibrosis tests and LSE results as independent variables. Then, by using the regression score provided by the multivariate analysis, we implemented a new fibrosis test for the diagnosis of significant fibrosis. The same methodology was used for the diagnosis of cirrhosis.
- Sample size - Sample size was determined to show a significant difference for the diagnosis of significant fibrosis between FM and synchronous combination in the exploratory population. With α risk: 0.05, β risk: 0.20, significant fibrosis prevalence: 0.70, AUROC correlation: 0.70, and a bilateral test, the sample size was 159 patients for the following hypothesis of AUROC: FM: 0.84, synchronous combination: 0.90. The software programs used for statistical analyses were SPSS for Windows, version 11.5.1 (SPSS Inc., Chicago, IL, USA) and SAS 9.1 (SAS Institute Inc., Cary, NC, USA).
- The characteristics of the 390 patients are summarized in Table 1 of Example 2. Mean age of patients was 52.4 years, 67.9% were male, and 74.4% had significant fibrosis. 89.5% of patients had a liver biopsy considered as reliable. Liver Stiffness Evaluation failure occurred in 12 patients (overall failure rate: 3.1%). Among the 390 patients included, 332 had all 5 blood tests and LSE available.
Table 1 of Example 2: Patient characteristics at inclusion. Group All (n=390) A (n=194) B (n=196) p a Age (years) 52.4 ± 13.4 50.8 ± 12.7 53.9 ± 14.0 0.03 Male sex (%) 67.9 68.0 67.9 0.97 Cause of liver disease (%) <10-3 - Virus 48.7 54.1 43.4 - Alcohol 27.2 26.3 28.1 - NAFLD 4.9 9.8 0.0 - Other 19.2 9.8 28.6 Metavir fibrosis stage (%) <10-3 - F0 7.2 4.1 10.2 - F1 18.5 19.6 17.3 - F2 23.1 26.3 19.9 - F3 20.3 27.3 13.3 - F4 31.0 22.7 39.3 <10-3 Significant fibrosis (%) 74.4 76.3 72.4 0.39 Reliable biopsy (%) 89.5 95.3 82.6 <10-3 IQR / LSE result <0.21 (%) 59.4 58.5 60.3 0.73 IQR: interquartile range (kiloPascal)
a By t-test or χ2 between the groups A and B - LSE AUROC was significantly higher than that of Hepascore, FIB-4, and APRI for the diagnosis of significant fibrosis, and was not significantly different from FibroMeter and Fibrotest AUROCs.
Table 2 of Example 2: AUROCs of blood tests and liver stiffness evaluation (LSE) as a function of diagnostic target, in the 332 patients having all 5 blood tests and LSE available. Significant fibrosis Cirrhosis AUROC: FibroMeter (FM) 0.836 0.834 Fibrotest (FT) 0.826 0.813 Hepascore (HS) 0.799 0.806 FIB-4 0.787 0.793 APRI 0.762 0.691 LSE 0.858 0.915 Comparison (p) a: FM vs FT 0.622 0.326 FM vs HS 0.074 0.101 FM vs FIB-4 0.030 0.078 FM vs APRI 0.004 <10-3 FM vs LSE 0.417 <10-3 FT vs HS 0.195 0.786 FT vs FIB-4 0.119 0.416 FT vs APRI 0.022 <10-3 FT vs LSE 0.257 <10-3 HS vs FIB-4 0.700 0.663 HS vs APRI 0.264 <10-3 HS vs LSE 0.046 <10-3 FIB-4 vs APRI 0.302 <10-3 FIB-4 vs LSE 0.016 <10-3 APRI vs LSE 0.003 <10-3 a By Delong test - Combination of non-invasive tests (Table 3 of Example 2) - In each of the three populations tested, significant fibrosis defined by liver biopsy was independently diagnosed by FibroMeter at the first step and Liver Stiffness Evaluation at the second step. The regression score provided by the binary logistic regression performed in group A (exploratory set) was: 3.6224.FM + 0.4408.LSE result - 3.9850. This score was used to implement a diagnostic synchronous combination of FibroMeter and Liver Stiffness Evaluation called significant fibrosis-index (SF-index). This new fibrosis test was then evaluated in the validation sets: group B (Bordeaux center) and the pooled group A+B.
Table 3 of Example 2: Fibrosis tests independently associated with significant fibrosis or cirrhosis defined by liver biopsy, as a function of patient group (A: Angers, B: Bordeaux). Patient Group Significant fibrosis Cirrhosis Independent variables a p Diagnostic accuracy (%) b Independent variables a p Diagnostic accuracy (%) b A 1.FibroMeter <10-3 82.0 1.LSE <10-3 89.7 2.LSE <10-3 87.6 2.FibroMeter 0.031 88.7 B 1.FibroMeter <10-3 78.2 1.LSE <10-3 82.4 2.LSE 0.012 80.3 2.FibroMeter 0.017 83.0 All 1.FibroMeter <10-3 80.6 1.LSE <10-3 85.1 2.LSE <10-3 85.3 2. FibroMeter 10-3 86.1 LSE: liver stiffness evaluation;
a Variables independently associated with significant fibrosis or cirrhosis with increasing order of step (the first step is the most accurate variable);
b Cumulative diagnostic accuracy for the second step - Performance of SF-index (Table 4 of Example 2) - SF-index AUROCs were not significantly different between groups A and B. SF-index AUROC was significantly higher than that of FibroMeter (FM) or Liver Stiffness Evaluation (LSE) in the whole population.
Figure 1 shows that SF-index had the better performance profile: its misclassification rate was significantly lower than LSE in Metavir F≤1 stages and significantly lower than FM in Metavir F≥2 stages.
- As shown on Table 4 of Example 2, SF-index inherited of the lowest misclassification rate provided by each single test in each fibrosis stage: the blood test in F0/1 stages, and LSE in F≥2 stages (see also
Figure 1 ). - Discordances between LSE and FM - Discordances between fibrosis tests for the diagnostic target were calculated according to the diagnostic cut-off determined by the highest Youden index. FM and LSE were concordant in 279 (73.0%) patients of whom 88.9% were correctly classified according to liver biopsy (F≤1: 77.0%, F≥2: 94.3%). FM and LSE were discordant in the 103 (27.0%) remaining patients of whom 68 (66.0%) were correctly classified by SF-index according to liver biopsy results (Table 5 of Example 2). Finally, SF-index correctly classified 316 (82.7%) patients and improved correct classification (i.e., discordances between FM and LSE resolved by SF-index) in 33 (8.6%) patients.
- Moreover, the SF-index resolved 66% of discordant cases between the blood test and LSE (Table 5 of Example 2).
Table 5 of Example 2: Discordances. Impact of FM+LSE index on discordances between FibroMeter (FM) and liver stiffness evaluation (LSE) for the diagnosis of significant fibrosis or cirrhosis in the whole population. Classification by fibrosis tests a Impact of FM+LSE index on classification by FM and LSE Patients (n) according to diagnostic target studied FM+LSE index b FM and LSE c F≥2 F4 Correct Both incorrect Favorable 0 0 Discordant 68 54 Both correct Neutral 248 275 Incorrect Both incorrect 31 28 Discordant Unfavorable 35 25 Both correct 0 0 Net improvement 33 d (8.6%) 29 e (7.6%) a Respective diagnostic cut-off values used for significant fibrosis or cirrhosis, according to the highest Youden index: FM: 0.538 and 0.873; LSE: 6.9 and 13.0 kiloPascals; FM+LSE index: 0.753 (SF-index) and 0.216 (C-index)
b Classification by SF-index for significant fibrosis or C-index for cirrhosis expressed as correct or incorrect according to liver biopsy.
c Classification of both tests based on liver biopsy. "Discordant" means than one test is correct and the other one is incorrect.
d Favorable (68) - unfavorable (35) effect = improvement (33)
e Favorable (54) - unfavorable (25) effect = improvement (29) - New sequential algorithm - SF-index included significantly more patients than FM or LSE in the classical intervals of ≥90% predictive values (see Appendix for precise definition), especially in the ≤90% NPV interval (Table 6 of Example 2). By using SF-index with ≥90% predictive values in 81.7% of patients and liver biopsy required in the remaining 18.3% of patients, a correct diagnosis of significant fibrosis based on liver biopsy was obtained in 91.9% of patients (Table 6 of Example 2). This two-step sequential algorithm was called Angers SF-algorithm (
Figure 2 ). - Reliable diagnosis intervals of SF-index - With this recently described method (18), accuracy is made ≥90% in the interval(s) between the previous intervals of 90% predictive values by changing the diagnostic target. The interest is to offer a reliable diagnosis for all patients. In the indeterminate interval determined by the ≥90% predictive values of SF-index, the proportion of Metavir fibrosis stages was F0: 20.0%, F1: 40.0%, and F2: 32.9% according to LIVER BIOPSY (
Figure 3a ). Thus, it was possible to obtain three intervals of reliable diagnosis: F0/1 in the ≤90% NPV interval, F1±1 in the intermediate interval (correct classification: 92.9%), and F≥2 (F3±1) in the ≥90% PPV interval. Finally, this new classification correctly classified 90.6% of patients with 0% of liver biopsy. - Comparison of algorithms (Table 7 of Example 2) - We compared the Angers SF-algorithm to those previously published in Bordeaux (24) and in Padova (16). The population tested was the 332 patients having Fibrotest, FibroMeter, APRI, and LSE available. The Padova algorithm had significantly higher accuracy (95.2%) compared to other algorithms due to a significantly higher rate of required LB. The Angers algorithm had a significantly lower rate of required liver biopsy compared to other algorithms. Thus, Angers SF-algorithm had the best compromise between high correct classification and low liver biopsy requirement, reflected by a much lower liver biopsy/accuracy ratio.
- LSE had a significantly higher AUROC than the blood tests for the diagnosis of cirrhosis.
- Combination of non-invasive tests (Table 3 of Example 2) - The most accurate combination of fibrosis tests for the diagnosis of cirrhosis was LSE + FM. The regression score provided by the binary logistic regression performed in the group A (exploratory set) was: 0.1162.LSE result + 1.9714.FM - 4.6616. This score was used to implement a diagnostic synchronous combination of LSE and FM called cirrhosis-index (C-index). This new fibrosis test was then evaluated in the validation sets: group B (Bordeaux center) and the pooled group A+B.
- Performance of C-index (Table 4 of Example 2) - C-index AUROCs were not significantly different between groups A and B. In each group tested, C-index had a significantly higher AUROC than FM, but the difference with the LSE AUROC was not significant.
- Discordances between LSE and FM - FM and LSE were concordant in 303 (79.3%) patients of whom 90.8% were correctly classified according to LIVER BIOPSY (F≤3: 94.7%, F4: 82.1%). FM and LSE were discordant in the 79 (20.7%) remaining patients of whom 54 (68.4%) were correctly classified by C-index according to LIVER BIOPSY results (Table 5 of Example 2). Finally, C-index correctly classified 329 (86.1 %) patients and improved correct classification (i.e., discordances between FM and LSE resolved by C-index) in 29 (7.6%) patients.
- New sequential algorithm (Table 6 of Example 2) - The C-index included significantly more patients than FM or LSE in the classical intervals of ≥90% predictive values. By using C-index with ≥90% predictive values in 90.6% of patients and liver biopsy required in the remaining 9.4% of patients, a correct diagnosis of cirrhosis based on liver biopsy was obtained in 91.1% of patients (Table 6 of Example 2). This two-step sequential algorithm was called Angers C-algorithm (
Figure 4 ). - Reliable diagnosis intervals of C-index - In the indeterminate interval determined by the ≥90% predictive values of C-index, the proportion of Metavir fibrosis stages was F2: 11.1%, F3: 22.2%, and F4: 58.3% according to liver (
Figure 3b ). Thus, it was possible to obtain three intervals of reliable diagnosis: no cirrhosis (F≤3) in the ≤90% NPV interval, F≥2 (F3±1) in the intermediate interval (correct classification: 91.6%), and cirrhosis (F4) in the ≥90% PPV interval. Finally, this new classification correctly classified 90.3% of patients with 0% of liver biopsy.Table 6 of Example 2: New sequential algorithm. Rates of patients included and correctly classified by fibrosis tests in the intervals of ≥90% predictive values for the diagnosis of significant fibrosis or cirrhosis in the whole population, as a function of fibrosis test. Diagnostic target Fibrosis test Rate (%) of patients included in the intervals defined by 90% predictive values Accuracy (%) ≥90% NPV Indeterminate a ≥90% PPV Fibrosis test b Algorithm c Significant fibrosis (F≥2) FibroMeter 0.3 36.4 63.4 57.3 93.7 LSE 0.5 28.8 70.7 64.1 92.9 SF-index 8.1 18.3 73.6 73.6 91.9 Cirrhosis (F4) FibroMeter 44.2 42.1 13.6 52.1 94.2 LSE 68.3 12.6 19.1 78.8 91.4 C-index 70.4 9.4 20.2 81.7 91.1 a Proportion of patients for whom diagnosis remains uncertain (NPV and PPV <90%), thus requiring a liver biopsy. Comparison of patient rates by McNemar test. Significant fibrosis: LSE vs FibroMeter: p=0.006, SF-index vs FibroMeter or LSE: p<10-3; cirrhosis: FibroMeter vs C-index or LSE: p<10-3, C-index vs LSE: p=0.02.
b Rate of patients correctly classified by the intervals of ≥90% (negative and positive) predictive values, among the whole population. Comparison of patient rates by McNemar test. Significant fibrosis: LSE vs FibroMeter: p=0.005, SF-index vs FibroMeter or LSE: p<10-3; cirrhosis: FibroMeter vs C-index or LSE: p<10-3, C-index vs LSE: p=0.007.
c Algorithm is defined by a two-step procedure: the fibrosis test is initially used with the interval of ≥90% predictive values, and a liver biopsy is subsequently required for patients included in the interval of indeterminate diagnosis. Thus, algorithm accuracy is calculated as the sum of patients correctly classified by the fibrosis test in the whole population (4th result column) and liver biopsy requirement (2nd result column) where accuracy is 100% by definition. Comparison of rates by McNemar test between FibroMeter and C-index for cirrhosis: p=0.04, others: p: NS. - Comparison of sequential algorithms (Table 7 of Example 2) - The Bordeaux algorithm had significantly higher accuracy for cirrhosis compared to other algorithms. However, Angers C-algorithm had a significantly lower rate of required liver biopsy compared to other algorithms. Thus, as for significant fibrosis, Angers C-algorithm had the best compromise between high correct classification and low liver biopsy requirement, reflected by a much lower liver biopsy/accuracy ratio.
Table 7 of Example 2: Comparison of accuracies and liver biopsy (LB) requirements between sequential algorithms of Angers (present study), Bordeaux (24), and Padova (16), for the diagnosis of significant fibrosis or cirrhosis. Population tested is the 332 patients having FibroMeter, Fibrotest, APRI and LSE available together. Grey cells indicate the most important results. Diagnostic target Algorithm Blood test accuracy (%) a LB (%) b Algorithm accuracy (%) LB/accuracy ratio d All causes c Virus Other Significant fibrosis Angers SF 89.8 20.2 91.9 92.2 91.5 0.22 Bordeaux 86.5 28.6 90.4 88.8 92.2 0.33 Padova 91.1 46.1 95.2 95.0 95.4 0.51 Cirrhosis Angers C 90.0 9.3 91.0 93.9 87.6 0.10 Bordeaux 92.3 25.3 94.3 94.4 94.1 0.27 Padova 81.1 20.5 84.9 86.0 83.7 0.25 a Accuracy (%) of blood tests included in patients without liver biopsy whose proportion can be deduced from the following column. Paired comparison was not possible.
b Rate (%) of liver biopsy required by the algorithm. Comparison of rates by McNemar test. Significant fibrosis: Angers vs Bordeaux: p=0.02, Padova vs Angers or Bordeaux: p<10-3; cirrhosis: Angers vs Bordeaux or Padova: p<10-3; Bordeaux vs Padova: p=0.129.
c Comparison of patient rates by McNemar test. Significant fibrosis: Padova vs Angers: p=0.02, or Bordeaux: p=0.007; Angers vs Bordeaux: p=0.50; cirrhosis: Bordeaux vs Angers: p=0.04, or Padova: p<10-3; Angers vs Padova: p=0.007.
d Ratio: rate of required liver biopsy (2nd result column) / blood test accuracy (1st result column). -
- 1. Oberti F, Valsesia E, Pilette C, Rousselet MC, Bedossa P, Aube C, et al. Noninvasive diagnosis of hepatic fibrosis or cirrhosis. Gastroenterology 1997;113:1609-1616.
- 2. Croquet V, Vuillemin E, Ternisien C, Pilette C, Oberti F, Gallois Y, et al. Prothrombin index is an indirect marker of severe liver fibrosis. Eur J Gastroenterol Hepatol 2002;14:1133-1141.
- 3. Afdhal NH, Nunes D. Evaluation of liver fibrosis: a concise review. Am J Gastroenterol 2004;99:1160-1174.
- 4. Sebastiani G, Alberti A. Non invasive fibrosis biomarkers reduce but not substitute the need for liver biopsy. World J Gastroenterol 2006;12:3682-3694.
- 5. Wai CT, Greenson JK, Fontana RJ, Kalbfleisch JD, Marrero JA, Conjeevaram HS, et al. A simple noninvasive index can predict both significant fibrosis and cirrhosis in patients with chronic hepatitis C. Hepatology 2003;38:518-526.
- 6. Sterling RK, Lissen E, Clumeck N, Sola R, Correa MC, Montaner J, et al. Development of a simple noninvasive index to predict significant fibrosis in patients with HIV/HCV coinfection. Hepatology 2006;43:1317-1325.
- 7. Imbert-Bismut F, Ratziu V, Pieroni L, Charlotte F, Benhamou Y, Poynard T. Biochemical markers of liver fibrosis in patients with hepatitis C virus infection: a prospective study. Lancet 2001;357:1069-1075.
- 8. Rosenberg WM, Voelker M, Thiel R, Becka M, Burt A, Schuppan D, et al. Serum markers detect the presence of liver fibrosis: a cohort study. Gastroenterology 2004;127:1704-1713.
- 9. Cales P, Oberti F, Michalak S, Hubert-Fouchard I, Rousselet MC, Konate A, et al. A novel panel of blood markers to assess the degree of liver fibrosis. Hepatology 2005;42:1373-1381.
- 10. Patel K, Gordon SC, Jacobson I, Hezode C, Oh E, Smith KM, et al. Evaluation of a panel of non-invasive serum markers to differentiate mild from moderate-to-advanced liver fibrosis in chronic hepatitis C patients. J Hepatol 2004;41:935-942.
- 11. Adams LA, Bulsara M, Rossi E, DeBoer B, Speers D, George J, et al. Hepascore: an accurate validated predictor of liver fibrosis in chronic hepatitis C infection. Clin Chem 2005;51:1867-1873.
- 12. Sandrin L, Fourquet B, Hasquenoph JM, Yon S, Fournier C, Mal F, et al. Transient elastography: a new noninvasive method for assessment of hepatic fibrosis. Ultrasound Med Biol 2003;29:1705-1713.
- 13. Bourliere M, Penaranda G, Ouzan D, Renou C, Botta-Fridlund D, Tran A, et al. Optimized stepwise combination algorithms of non-invasive liver fibrosis scores including Hepascore in hepatitis C virus patients. Aliment Pharmacol Ther 2008;28:458-467.
- 14. Bourliere M, Penaranda G, Renou C, Botta-Fridlund D, Tran A, Portal I, et al. Validation and comparison of indexes for fibrosis and cirrhosis prediction in chronic hepatitis C patients: proposal for a pragmatic approach classification without liver biopsy. J Viral Hepat 2006;13:659-670.
- 15. Sebastiani G, Vario A, Guido M, Alberti A. Sequential algorithms combining non-invasive markers and biopsy for the assessment of liver fibrosis in chronic hepatitis B. World J Gastroenterol 2007;13:525-531.
- 16. Sebastiani G, Vario A, Guido M, Noventa F, Plebani M, Pistis R, et al. Stepwise combination algorithms of non-invasive markers to diagnose significant fibrosis in chronic hepatitis C. J Hepatol 2006;44:686-693.
- 17. Nousbaum JB, Cadranel JF, Bonnemaison G, Bourliere M, Chiche L, Chor H, et al. Clinical practice guidelines on the use of liver biopsy. Gastroenterol Clin Biol 2002;26:848-878.
- 18. Cales P, De Ledinghen V, Halfon P, Bacq Y, Leroy V, Boursier J, et al. Evaluating accuracy and increasing the reliable diagnosis rate of blood tests for liver fibrosis in chronic hepatitis C. Liver Int 2008;28:1352-1362.
- 19. Cales P, Laine F, Boursier J, Deugnier Y, Moal V, Oberti F, et al. Comparison of blood tests for liver fibrosis specific or not to NAFLD. J Hepatol 2009;50:165-173.
- 20. Cales P, Veillon P, Konate A, Mathieu E, Ternisien C, Chevailler A, et al. Reproducibility of blood tests of liver fibrosis in clinical practice. Clin Biochem 2008;41:10-18.
- 21. Boursier J, Konate A, Gorea G, Reaud S, Quemener E, Oberti F, et al. Reproducibility of liver stiffness measurement by ultrasonographic elastometry. Clin Gastroenterol Hepatol 2008;6:1263-1269.
- 22. Boursier J, Konate A, Guilluy M, Gorea G, Sawadogo A, Quemener E, et al. Learning curve and interobserver reproducibility evaluation of liver stiffness measurement by transient elastography. Eur J Gastroenterol Hepatol 2008;20:693-701.
- 23. DeLong ER, DeLong DM, Clarke-Pearson DL. Comparing the areas under two or more correlated receiver operating characteristic curves: a nonparametric approach. Biometrics 1988;44:837-845.
- 24. Castera L, Vergniol J, Foucher J, Le Bail B, Chanteloup E, Haaser M, et al. Prospective comparison of transient elastography, Fibrotest, APRI, and liver biopsy for the assessment of fibrosis in chronic hepatitis C. Gastroenterology 2005;128:343-350.
- 25. Lucidarme D, Foucher J, Le Bail B, Vergniol J, Castera L, Duburque C, et al. Factors of Accuracy of Transient Elastography (Fibroscan) for the Diagnosis of Liver Fibrosis in Chronic Hepatitis C. Hepatology 2009; in press.
- 26. Bossuyt PM, Reitsma JB, Bruns DE, Gatsonis CA, Glasziou PP, Irwig LM, et al. The STARD statement for reporting studies of diagnostic accuracy: explanation and elaboration. Clin Chem 2003;49:7-18.
- 27. Halfon P, Bacq Y, De Muret A, Penaranda G, Bourliere M, Ouzan D, et al. Comparison of test performance profile for blood tests of liver fibrosis in chronic hepatitis C. J Hepatol 2007;46:395-402.
- 28. Boursier J, Bacq Y, Halfon P, Leroy V, De Ledinghen V, De Muret A, et al. Improved diagnostic accuracy of blood tests for severe fibrosis and cirrhosis in chronic hepatitis C. Eur J Gastroenterol Hepatol 2009;21:28-38.
- 29. Castera L. Use of elastometry (FibroScan) for the non-invasive staging of liver fibrosis. Gastroenterol Clin Biol 2007;31:524-530.
- 30. Fraquelli M, Rigamonti C, Casazza G, Conte D, Donato MF, Ronchi G, et al. Reproducibility of transient elastography in the evaluation of liver fibrosis in patients with chronic liver disease. Gut 2007;56:968-973.
- 31. Friedrich-Rust M, Ong MF, Martens S, Sarrazin C, Bojunga J, Zeuzem S, et al. Performance of transient elastography for the staging of liver fibrosis: a meta-analysis. Gastroenterology 2008;134:960-974.
- 32. Cales P, Boursier J, Rousselet MC, Michalak S, Oberti F, Gallois Y, et al. Comparison of reproducibility of histology, blood tests and Fibroscan for liver fibrosis. Hepatology 2007;46:834A.
- 33. Cales P, Boursier J, De Ledinghen V, Halfon P, Bacq Y, Leroy V, et al. Evaluation and improvement of a reliable diagnosis of cirrhosis by blood tests. Gastroenterol Clin Biol 2008;32:1050-1060.
- 34. Castera L, Sebastiani G, Le Bail B, De Ledinghen V, Couzigou P, Alberti A. Prospective comparison of two algorithms combining non invasive tests for staging of liver fibrosis in chronic hepatitis C. Hepatology 2007;46:320A.
- 35. Sebastiani G, Halfon P, Castera L, Mangia A, Di Marco V, Pirisi M, et al. Large-scale multicenter comparison of three algorithms combining serum non-invasive markers for liver fibrosis in chronic hepatitis C. J Hepatol 2008;48:S282.
- 36. Poynard T, Halfon P, Castera L, Munteanu M, Imbert-Bismut F, Ratziu V, et al. Standardization of ROC curve areas for diagnostic evaluation of liver fibrosis markers based on prevalences of fibrosis stages. Clin Chem 2007;53:1615-1622.
- 37. Lambert J, Halfon P, Penaranda G, Bedossa P, Cacoub P, Carrat F. How to measure the diagnostic accuracy of noninvasive liver fibrosis indices: the area under the ROC curve revisited. Clin Chem 2008;54:1372-1378.
- 38. Obuchowski NA. An ROC-type measure of diagnostic accuracy when the gold standard is continuous-scale. Stat Med 2006;25:481-493.
Claims (6)
- A method of diagnosing the presence and/or severity of a liver pathology and/or of monitoring the effectiveness of a curative treatment against a liver pathology in an individual, leading to a score, comprising:a) performing, from a blood sample of an individual, at least one FibroMeter,b) performing at least one Fibroscan in order to collect at least one data of liver stiffness evaluation (LSE), andc) combining said at least one FibroMeter and said at least one LSE data in a mathematical binary logistic regression function of formula p = 1/(1+exp(- a0 - a1 x1 - a2 x2)), wherein a0 is a constant, x1 and x2 are independent variables corresponding to the FibroMeter value obtained at step a) and the Fibroscan value obtained at step b), and a1 and a2 are coefficients associated with said FibroMeter value and said Fibroscan value, thus resulting in a new score for the diagnosis of the presence and/or severity of a liver pathology and/or of monitoring the effectiveness of a curative treatment against a liver pathology in an individual,wherein said liver pathology is a significant porto-septal fibrosis, severe porto-septal fibrosis, centrolobular fibrosis, cirrhosis, perisinusoidal fibrosis, the fibrosis being of non-alcoholic origin.
- The method according to claim 1, wherein the liver pathology is significant fibrosis and wherein the constant a0 is -2.8345 with a 95% confidence interval of [-3.6864; -1.9825], the coefficient a1 associated with the FibroMeter value is 3.9066 with a 95% confidence interval of [2.7312; 5.0819] and the coefficient a2 associated with the Fibroscan value is 0.1870 with a 95% confidence interval of [0.0891; 0.2849].
- The method according to claim 1, wherein the liver pathology is severe fibrosis and wherein the constant a0 is -4.2485 with a 95% confidence interval of [-5.1891; -3.3080], the coefficient a1 associated with the FibroMeter value is 3.3135 with a 95% confidence interval of [2.0937; 4.5332] and the coefficient a2 associated with the Fibroscan value is 0.1377 with a 95% confidence interval of [0.0825; 0.1928].
- The method according to claim 1, wherein the liver pathology is cirrhosis and wherein the constant a0 is -6.4999 with a 95% confidence interval of [-8.2816; -4.7182], the coefficient a1 associated with the FibroMeter value is 3.6128 with a 95% confidence interval of [1.4992; 5.7265] and the coefficient a2 associated with the Fibroscan value is 0.1484 with a 95% confidence interval of [0.0961; 0.2007].
- The method according to any one of claims 1 to 4, wherein the individual is a patient with chronic hepatitis C.
- The method according to any one of claims 1 to 5, wherein the combination through a mathematical binary logistic regression function, of at least one FibroMeter and of at least one LSE data issued from Fibroscan, is performed at least twice and the at least two resulting scores are combined in an algorithm based on the diagnostic reliable intervals.
Applications Claiming Priority (2)
| Application Number | Priority Date | Filing Date | Title |
|---|---|---|---|
| US15565909P | 2009-02-26 | 2009-02-26 | |
| PCT/EP2010/052506 WO2010097472A1 (en) | 2009-02-26 | 2010-02-26 | Improved diagnosis of liver fibrosis or cirrhosis |
Publications (2)
| Publication Number | Publication Date |
|---|---|
| EP2401689A1 EP2401689A1 (en) | 2012-01-04 |
| EP2401689B1 true EP2401689B1 (en) | 2018-05-09 |
Family
ID=42167629
Family Applications (1)
| Application Number | Title | Priority Date | Filing Date |
|---|---|---|---|
| EP10707497.3A Active EP2401689B1 (en) | 2009-02-26 | 2010-02-26 | Improved diagnosis of liver fibrosis or cirrhosis |
Country Status (7)
| Country | Link |
|---|---|
| US (1) | US9585613B2 (en) |
| EP (1) | EP2401689B1 (en) |
| JP (1) | JP5887141B2 (en) |
| CN (1) | CN102334122B (en) |
| BR (1) | BRPI1008488A2 (en) |
| ES (1) | ES2683631T3 (en) |
| WO (1) | WO2010097472A1 (en) |
Families Citing this family (30)
| Publication number | Priority date | Publication date | Assignee | Title |
|---|---|---|---|---|
| US20170082603A1 (en) * | 2009-02-26 | 2017-03-23 | Universite D'angers | Diagnosis of liver fibrosis or cirrhosis |
| EP2498195A1 (en) * | 2011-03-11 | 2012-09-12 | Centre Hospitalier Universitaire d'Angers | Non-invasive method for assessing the presence or severity of liver fibrosis based on a new detailed classification |
| EP2727520B1 (en) * | 2011-06-29 | 2019-08-21 | Inner Mongolia Furui Medical Science Co., Ltd | Hepatic fibrosis detection apparatus and system |
| EP2600266A1 (en) * | 2011-12-02 | 2013-06-05 | Biopredictive | Method of diagnosis of fibrotic diseases |
| JP6075973B2 (en) * | 2012-06-04 | 2017-02-08 | 富士通株式会社 | HEALTH STATE JUDGING DEVICE AND ITS OPERATION METHOD |
| EP2684513A1 (en) | 2012-07-13 | 2014-01-15 | Universite D'angers | Method for providing reliable non-invasive diagnostic tests |
| CA2891281C (en) * | 2012-11-12 | 2023-11-28 | The Regents Of The University Of Colorado, A Body Corporate | Disease severity index for assessment of chronic liver disease and method for diagnosis of three distinct subtypes of primary sclerosing cholangitis |
| WO2014083480A1 (en) | 2012-11-30 | 2014-06-05 | Koninklijke Philips N.V. | Tissue surface roughness quantification based on image data and determination of a presence of disease based thereon |
| RU2016107170A (en) * | 2013-08-02 | 2017-09-07 | Экоусенс | NON-INVASIVE SYSTEM FOR CALCULATING A RELIABLE, STANDARDIZED AND FULL ASSESSMENT OF A HUMAN OR ANIMAL |
| DE102013216362A1 (en) * | 2013-08-19 | 2015-02-19 | Siemens Healthcare Diagnostics Products Gmbh | Analysis method for classification support |
| CN105581777B (en) * | 2014-11-06 | 2018-08-28 | 香港中文大学 | Method for screening vitamin D deficiency using skin colorimetry |
| FR3036943A1 (en) * | 2015-06-02 | 2016-12-09 | Echosens | NON-INVASIVE HEPATIC LESION DETECTION DEVICE |
| WO2017210147A1 (en) | 2016-05-29 | 2017-12-07 | Wei Jia | Liver disease-related biomarkers and methods of use thereof |
| JP7007361B2 (en) * | 2016-08-01 | 2022-01-24 | センター ホスピタリア ユニバーシタイア ダンガース | Multi-target fibrosis test |
| KR101914655B1 (en) | 2017-01-24 | 2018-11-02 | 이화여자대학교 산학협력단 | Method for providing information of diagnosing for colonic adenoma |
| EP3373012A1 (en) | 2017-03-07 | 2018-09-12 | Biopredictive | Method of diagnosis of drug induced liver injury |
| US12360113B2 (en) | 2017-10-16 | 2025-07-15 | Biopredictive | Method of prognosis and follow up of primary liver cancer |
| EP3470843A1 (en) | 2017-10-16 | 2019-04-17 | Biopredictive | Method of prognosis of primary liver cancer |
| CN108185990B (en) * | 2017-12-28 | 2020-11-20 | 杭州筹图科技有限公司 | A kind of identification method and device of fiber septum connecting PT and CV |
| CN108378870B (en) * | 2018-01-19 | 2020-10-02 | 无锡海斯凯尔医学技术有限公司 | Tissue inflammation activity training device |
| CN108309348B (en) * | 2018-01-19 | 2020-10-30 | 无锡海斯凯尔医学技术有限公司 | Tissue Fibrosis Detection Device |
| CN108095767B (en) * | 2018-01-19 | 2020-10-02 | 无锡海斯凯尔医学技术有限公司 | Tissue inflammation activity degree detection device |
| EP3599615A1 (en) * | 2018-07-27 | 2020-01-29 | Biopredictive | Method of diagnosis of liver steatosis |
| CN110265139A (en) * | 2019-02-01 | 2019-09-20 | 中国医药大学附设医院 | Liver fibrosis assessment models, liver fibrosis assessment system and its appraisal procedure |
| WO2021051335A1 (en) * | 2019-09-19 | 2021-03-25 | 北京大学人民医院(北京大学第二临床医学院) | Hepatitis c liver fibrosis feature information extraction method and apparatus |
| CN111783792B (en) * | 2020-05-31 | 2023-11-28 | 浙江大学 | A method for extracting significant texture features from B-ultrasound images and its application |
| KR102647669B1 (en) * | 2020-07-31 | 2024-03-14 | 고려대학교 산학협력단 | MR-based method of providing information for diagnosis of nonalcoholic steatohepatitis |
| CN114300119A (en) * | 2021-12-07 | 2022-04-08 | 泰州市人民医院 | Liver disease detection training method and system based on Multi-Cnn-Former |
| CN115602319B (en) * | 2022-12-07 | 2023-03-10 | 南方医科大学南方医院 | A non-invasive liver fibrosis assessment device |
| GB2630963A (en) * | 2023-06-15 | 2024-12-18 | Intelligent Ultrasound Ltd | Apparatus for analysing medical images |
Family Cites Families (25)
| Publication number | Priority date | Publication date | Assignee | Title |
|---|---|---|---|---|
| US7668661B2 (en) * | 2000-04-28 | 2010-02-23 | Siemens Healthcare Diagnostics Inc. | Liver disease-related methods and systems |
| ES2288962T3 (en) | 2000-04-28 | 2008-02-01 | Bayer Aktiengesellschaft | DIAGNOSIS OF HEPATIC FIBROSIS WITH ALGORITHMS OF SERIAL MARKERS. |
| ES2259291T3 (en) * | 2000-08-21 | 2006-10-01 | Assistance Publique, Hopitaux De Paris | METHOD OF FIBROTIC DISEASE DIAGNOSIS USING BIOCHEMICAL MARKERS. |
| US6631330B1 (en) * | 2000-08-21 | 2003-10-07 | Assistance Publique-Hopitaux De Paris (Ap-Hp) | Diagnosis method of inflammatory, fibrotic or cancerous disease using biochemical markers |
| US6986995B2 (en) | 2002-02-28 | 2006-01-17 | Prometheus Laboratories, Inc. | Methods of diagnosing liver fibrosis |
| EP1541090B1 (en) * | 2002-07-31 | 2019-05-15 | Hitachi, Ltd. | Ultrasonic diagnosis system and distortion distribution display method |
| ES2543160T3 (en) * | 2003-01-14 | 2015-08-17 | Vib Vzw | A serum marker to measure liver fibrosis |
| FR2870348B1 (en) | 2004-05-14 | 2010-08-27 | Univ Angers | METHOD FOR DIAGNOSING THE PRESENCE AND / OR SEVERITY OF A HEPATHIC PATHOLOGY IN A SUBJECT |
| ES2303925T3 (en) * | 2004-08-12 | 2008-09-01 | F. Hoffmann-La Roche Ag | METHOD FOR DIAGNOSING HEPATIC FIBROSIS. |
| ES2282780T3 (en) * | 2004-08-12 | 2007-10-16 | F. Hoffmann-La Roche Ag | METHOD FOR THE DIAGNOSIS OF HEPATIC FIBROSIS. |
| US7860656B2 (en) * | 2005-02-03 | 2010-12-28 | Assistance Publique-Hopitaux De Paris (Ap-Hp) | Diagnosis method of hepatic steatosis using biochemical markers |
| US7856319B2 (en) * | 2005-02-03 | 2010-12-21 | Assistance Publique-Hopitaux De Paris (Ap-Hp) | Diagnosis method of alcoholic steato-hepatitis using biochemical markers |
| CN1841068A (en) * | 2005-03-31 | 2006-10-04 | 深圳益生堂生物企业有限公司 | Protein chip for detecting serum marker relative to hepatic fibrosis |
| US7307423B2 (en) * | 2005-05-05 | 2007-12-11 | Wisconsin A.Umni Research Foundation | Magnetic resonance elastography using multiple drivers |
| ES2288358B1 (en) * | 2005-07-01 | 2008-11-16 | Proyecto De Biomedicina Cima, S.L. | FIBROSIS MARKERS. |
| EP1960004A4 (en) * | 2005-11-11 | 2011-04-20 | Breathid 2006 | RESPIRATORY TEST DEVICE AND METHOD |
| US7766833B2 (en) * | 2005-11-23 | 2010-08-03 | General Electric Company | Ablation array having independently activated ablation elements |
| US8676511B2 (en) * | 2006-03-24 | 2014-03-18 | Gary Jeffrey | Method and system for predicting liver fibrosis and related pathologies |
| US8118744B2 (en) * | 2007-02-09 | 2012-02-21 | Duke University | Methods, systems and computer program products for ultrasound shear wave velocity estimation and shear modulus reconstruction |
| WO2008144391A1 (en) * | 2007-05-16 | 2008-11-27 | Mayo Foundation For Medical Education And Research | Portal vein pressure measurement using elastography |
| WO2009074628A1 (en) * | 2007-12-13 | 2009-06-18 | INSERM (Institut National de la Santé et de la Recherche Médicale) | Polypeptides, cyclic polypeptides and pharmaceutical comprising thereof for non invasive specific imaging of fibrosis |
| WO2009137354A1 (en) * | 2008-05-05 | 2009-11-12 | Mayo Foundation For Medical Education And Research | Method for assessing the probability of disease development in tissue |
| US7981627B2 (en) * | 2008-07-17 | 2011-07-19 | Ramot At Tel-Aviv University Ltd. | Methods for diagnosing and monitoring liver diseases |
| US20100049029A1 (en) * | 2008-08-20 | 2010-02-25 | Hong Kong Applied Science And Technology Research Institute Co., Ltd. | Piezoelectric magnetic resonance elastograph (mre) driver system |
| ES2621838T3 (en) * | 2008-11-18 | 2017-07-05 | Universite D'angers | Non-invasive in vitro method for quantification of liver lesions |
-
2010
- 2010-02-26 WO PCT/EP2010/052506 patent/WO2010097472A1/en not_active Ceased
- 2010-02-26 ES ES10707497.3T patent/ES2683631T3/en active Active
- 2010-02-26 EP EP10707497.3A patent/EP2401689B1/en active Active
- 2010-02-26 CN CN201080009537.4A patent/CN102334122B/en not_active Expired - Fee Related
- 2010-02-26 US US13/203,397 patent/US9585613B2/en active Active
- 2010-02-26 JP JP2011551498A patent/JP5887141B2/en not_active Expired - Fee Related
- 2010-02-26 BR BRPI1008488A patent/BRPI1008488A2/en not_active Application Discontinuation
Non-Patent Citations (1)
| Title |
|---|
| E. NGUYEN-KHAC ET AL: "Assessment of asymptomatic liver fibrosis in alcoholic patients using fibroscan: prospective comparison with seven non-invasive laboratory tests", ALIMENTARY PHARMACOLOGY & THERAPEUTICS., vol. 28, no. 10, 1 November 2008 (2008-11-01), GB, pages 1188 - 1198, XP055304318, ISSN: 0269-2813, DOI: 10.1111/j.1365-2036.2008.03831.x * |
Also Published As
| Publication number | Publication date |
|---|---|
| ES2683631T3 (en) | 2018-09-27 |
| WO2010097472A1 (en) | 2010-09-02 |
| US20110306849A1 (en) | 2011-12-15 |
| EP2401689A1 (en) | 2012-01-04 |
| JP5887141B2 (en) | 2016-03-16 |
| BRPI1008488A2 (en) | 2017-05-30 |
| CN102334122A (en) | 2012-01-25 |
| JP2012518507A (en) | 2012-08-16 |
| US9585613B2 (en) | 2017-03-07 |
| CN102334122B (en) | 2018-04-27 |
Similar Documents
| Publication | Publication Date | Title |
|---|---|---|
| US9585613B2 (en) | Diagnosis of liver fibrosis and cirrhosis | |
| Loomba et al. | Advances in non-invasive assessment of hepatic fibrosis | |
| Tapper et al. | Noninvasive imaging biomarker assessment of liver fibrosis by elastography in NAFLD | |
| Friedrich-Rust et al. | Real-time elastography for noninvasive assessment of liver fibrosis in chronic viral hepatitis | |
| Ferraioli et al. | Noninvasive assessment of liver steatosis in children: the clinical value of controlled attenuation parameter | |
| Friedrich‐Rust et al. | Performance of acoustic radiation force impulse imaging for the staging of liver fibrosis: a pooled meta‐analysis | |
| US20170082603A1 (en) | Diagnosis of liver fibrosis or cirrhosis | |
| Bohte et al. | Non-invasive evaluation of liver fibrosis: a comparison of ultrasound-based transient elastography and MR elastography in patients with viral hepatitis B and C | |
| Friedrich‐Rust et al. | Acoustic radiation force impulse imaging for non‐invasive assessment of liver fibrosis in chronic hepatitis B | |
| Yashima et al. | Acoustic radiation force impulse elastography for noninvasive assessment of chronic pancreatitis | |
| Dawod et al. | Non-invasive testing in metabolic dysfunction-associated steatotic liver disease | |
| Ying et al. | Clinical utility of acoustic radiation force impulse imaging for identification of malignant liver lesions: a meta-analysis | |
| Kiani et al. | Acoustic radiation force impulse imaging for assessing liver fibrosis in alcoholic liver disease | |
| CN103517668B (en) | The non invasive method of the presence of liver fibrosis or severity is assessed based on new exhaustive division | |
| Balakrishnan et al. | Liver and spleen stiffness measurements by point shear wave elastography via acoustic radiation force impulse: intraobserver and interobserver variability and predictors of variability in a US population | |
| Shao et al. | Steatosis grading consistency between controlled attenuation parameter and MRI-PDFF in monitoring metabolic associated fatty liver disease | |
| Friedrich-Rust et al. | Point shear wave elastography by acoustic radiation force impulse quantification in comparison to transient elastography for the noninvasive assessment of liver fibrosis in chronic hepatitis C: a prospective international multicenter study | |
| EP2786287B1 (en) | Method of diagnosis of fibrotic diseases | |
| Conti et al. | Assessment of liver fibrosis with elastography point quantification vs other noninvasive methods | |
| Yoneda et al. | Advances in ultrasound elastography for nonalcoholic fatty liver disease | |
| Thiele et al. | Contemporary use of elastography in liver fibrosis and portal hypertension | |
| Lakshmana et al. | Value of shear wave elastography in the evaluation of chronic kidney disease | |
| Castera et al. | Noninvasive diagnosis of liver fibrosis in patients with chronic hepatitis C | |
| Vidal-González et al. | Assessment of non-alcoholic fatty liver disease by non-invasive methods: present and future perspectives | |
| Huang et al. | Diagnostic accuracy of tissue Doppler echocardiography for patients with acute heart failure |
Legal Events
| Date | Code | Title | Description |
|---|---|---|---|
| PUAI | Public reference made under article 153(3) epc to a published international application that has entered the european phase |
Free format text: ORIGINAL CODE: 0009012 |
|
| 17P | Request for examination filed |
Effective date: 20110926 |
|
| AK | Designated contracting states |
Kind code of ref document: A1 Designated state(s): AT BE BG CH CY CZ DE DK EE ES FI FR GB GR HR HU IE IS IT LI LT LU LV MC MK MT NL NO PL PT RO SE SI SK SM TR |
|
| DAX | Request for extension of the european patent (deleted) | ||
| 17Q | First examination report despatched |
Effective date: 20160928 |
|
| STAA | Information on the status of an ep patent application or granted ep patent |
Free format text: STATUS: EXAMINATION IS IN PROGRESS |
|
| GRAP | Despatch of communication of intention to grant a patent |
Free format text: ORIGINAL CODE: EPIDOSNIGR1 |
|
| STAA | Information on the status of an ep patent application or granted ep patent |
Free format text: STATUS: GRANT OF PATENT IS INTENDED |
|
| INTG | Intention to grant announced |
Effective date: 20171206 |
|
| GRAS | Grant fee paid |
Free format text: ORIGINAL CODE: EPIDOSNIGR3 |
|
| GRAA | (expected) grant |
Free format text: ORIGINAL CODE: 0009210 |
|
| STAA | Information on the status of an ep patent application or granted ep patent |
Free format text: STATUS: THE PATENT HAS BEEN GRANTED |
|
| AK | Designated contracting states |
Kind code of ref document: B1 Designated state(s): AT BE BG CH CY CZ DE DK EE ES FI FR GB GR HR HU IE IS IT LI LT LU LV MC MK MT NL NO PL PT RO SE SI SK SM TR |
|
| REG | Reference to a national code |
Ref country code: GB Ref legal event code: FG4D |
|
| RIN1 | Information on inventor provided before grant (corrected) |
Inventor name: BOURSIER, JEROME Inventor name: CALES, PAUL |
|
| REG | Reference to a national code |
Ref country code: CH Ref legal event code: EP Ref country code: AT Ref legal event code: REF Ref document number: 998199 Country of ref document: AT Kind code of ref document: T Effective date: 20180515 |
|
| REG | Reference to a national code |
Ref country code: IE Ref legal event code: FG4D |
|
| REG | Reference to a national code |
Ref country code: DE Ref legal event code: R096 Ref document number: 602010050478 Country of ref document: DE |
|
| REG | Reference to a national code |
Ref country code: NL Ref legal event code: MP Effective date: 20180509 |
|
| REG | Reference to a national code |
Ref country code: LT Ref legal event code: MG4D |
|
| REG | Reference to a national code |
Ref country code: ES Ref legal event code: FG2A Ref document number: 2683631 Country of ref document: ES Kind code of ref document: T3 Effective date: 20180927 |
|
| PG25 | Lapsed in a contracting state [announced via postgrant information from national office to epo] |
Ref country code: FI Free format text: LAPSE BECAUSE OF FAILURE TO SUBMIT A TRANSLATION OF THE DESCRIPTION OR TO PAY THE FEE WITHIN THE PRESCRIBED TIME-LIMIT Effective date: 20180509 Ref country code: BG Free format text: LAPSE BECAUSE OF FAILURE TO SUBMIT A TRANSLATION OF THE DESCRIPTION OR TO PAY THE FEE WITHIN THE PRESCRIBED TIME-LIMIT Effective date: 20180809 Ref country code: NO Free format text: LAPSE BECAUSE OF FAILURE TO SUBMIT A TRANSLATION OF THE DESCRIPTION OR TO PAY THE FEE WITHIN THE PRESCRIBED TIME-LIMIT Effective date: 20180809 Ref country code: SE Free format text: LAPSE BECAUSE OF FAILURE TO SUBMIT A TRANSLATION OF THE DESCRIPTION OR TO PAY THE FEE WITHIN THE PRESCRIBED TIME-LIMIT Effective date: 20180509 Ref country code: LT Free format text: LAPSE BECAUSE OF FAILURE TO SUBMIT A TRANSLATION OF THE DESCRIPTION OR TO PAY THE FEE WITHIN THE PRESCRIBED TIME-LIMIT Effective date: 20180509 |
|
| REG | Reference to a national code |
Ref country code: DE Ref legal event code: R079 Ref document number: 602010050478 Country of ref document: DE Free format text: PREVIOUS MAIN CLASS: G06F0019000000 Ipc: G16Z0099000000 |
|
| PG25 | Lapsed in a contracting state [announced via postgrant information from national office to epo] |
Ref country code: LV Free format text: LAPSE BECAUSE OF FAILURE TO SUBMIT A TRANSLATION OF THE DESCRIPTION OR TO PAY THE FEE WITHIN THE PRESCRIBED TIME-LIMIT Effective date: 20180509 Ref country code: HR Free format text: LAPSE BECAUSE OF FAILURE TO SUBMIT A TRANSLATION OF THE DESCRIPTION OR TO PAY THE FEE WITHIN THE PRESCRIBED TIME-LIMIT Effective date: 20180509 Ref country code: NL Free format text: LAPSE BECAUSE OF FAILURE TO SUBMIT A TRANSLATION OF THE DESCRIPTION OR TO PAY THE FEE WITHIN THE PRESCRIBED TIME-LIMIT Effective date: 20180509 Ref country code: GR Free format text: LAPSE BECAUSE OF FAILURE TO SUBMIT A TRANSLATION OF THE DESCRIPTION OR TO PAY THE FEE WITHIN THE PRESCRIBED TIME-LIMIT Effective date: 20180810 |
|
| REG | Reference to a national code |
Ref country code: AT Ref legal event code: MK05 Ref document number: 998199 Country of ref document: AT Kind code of ref document: T Effective date: 20180509 |
|
| PG25 | Lapsed in a contracting state [announced via postgrant information from national office to epo] |
Ref country code: PL Free format text: LAPSE BECAUSE OF FAILURE TO SUBMIT A TRANSLATION OF THE DESCRIPTION OR TO PAY THE FEE WITHIN THE PRESCRIBED TIME-LIMIT Effective date: 20180509 Ref country code: EE Free format text: LAPSE BECAUSE OF FAILURE TO SUBMIT A TRANSLATION OF THE DESCRIPTION OR TO PAY THE FEE WITHIN THE PRESCRIBED TIME-LIMIT Effective date: 20180509 Ref country code: DK Free format text: LAPSE BECAUSE OF FAILURE TO SUBMIT A TRANSLATION OF THE DESCRIPTION OR TO PAY THE FEE WITHIN THE PRESCRIBED TIME-LIMIT Effective date: 20180509 Ref country code: RO Free format text: LAPSE BECAUSE OF FAILURE TO SUBMIT A TRANSLATION OF THE DESCRIPTION OR TO PAY THE FEE WITHIN THE PRESCRIBED TIME-LIMIT Effective date: 20180509 Ref country code: AT Free format text: LAPSE BECAUSE OF FAILURE TO SUBMIT A TRANSLATION OF THE DESCRIPTION OR TO PAY THE FEE WITHIN THE PRESCRIBED TIME-LIMIT Effective date: 20180509 Ref country code: CZ Free format text: LAPSE BECAUSE OF FAILURE TO SUBMIT A TRANSLATION OF THE DESCRIPTION OR TO PAY THE FEE WITHIN THE PRESCRIBED TIME-LIMIT Effective date: 20180509 Ref country code: SK Free format text: LAPSE BECAUSE OF FAILURE TO SUBMIT A TRANSLATION OF THE DESCRIPTION OR TO PAY THE FEE WITHIN THE PRESCRIBED TIME-LIMIT Effective date: 20180509 |
|
| REG | Reference to a national code |
Ref country code: DE Ref legal event code: R097 Ref document number: 602010050478 Country of ref document: DE |
|
| PG25 | Lapsed in a contracting state [announced via postgrant information from national office to epo] |
Ref country code: SM Free format text: LAPSE BECAUSE OF FAILURE TO SUBMIT A TRANSLATION OF THE DESCRIPTION OR TO PAY THE FEE WITHIN THE PRESCRIBED TIME-LIMIT Effective date: 20180509 |
|
| PLBE | No opposition filed within time limit |
Free format text: ORIGINAL CODE: 0009261 |
|
| STAA | Information on the status of an ep patent application or granted ep patent |
Free format text: STATUS: NO OPPOSITION FILED WITHIN TIME LIMIT |
|
| 26N | No opposition filed |
Effective date: 20190212 |
|
| PG25 | Lapsed in a contracting state [announced via postgrant information from national office to epo] |
Ref country code: SI Free format text: LAPSE BECAUSE OF FAILURE TO SUBMIT A TRANSLATION OF THE DESCRIPTION OR TO PAY THE FEE WITHIN THE PRESCRIBED TIME-LIMIT Effective date: 20180509 |
|
| REG | Reference to a national code |
Ref country code: CH Ref legal event code: PL |
|
| PG25 | Lapsed in a contracting state [announced via postgrant information from national office to epo] |
Ref country code: MC Free format text: LAPSE BECAUSE OF FAILURE TO SUBMIT A TRANSLATION OF THE DESCRIPTION OR TO PAY THE FEE WITHIN THE PRESCRIBED TIME-LIMIT Effective date: 20180509 Ref country code: LU Free format text: LAPSE BECAUSE OF NON-PAYMENT OF DUE FEES Effective date: 20190226 |
|
| REG | Reference to a national code |
Ref country code: BE Ref legal event code: MM Effective date: 20190228 |
|
| REG | Reference to a national code |
Ref country code: IE Ref legal event code: MM4A |
|
| PG25 | Lapsed in a contracting state [announced via postgrant information from national office to epo] |
Ref country code: LI Free format text: LAPSE BECAUSE OF NON-PAYMENT OF DUE FEES Effective date: 20190228 Ref country code: CH Free format text: LAPSE BECAUSE OF NON-PAYMENT OF DUE FEES Effective date: 20190228 |
|
| PG25 | Lapsed in a contracting state [announced via postgrant information from national office to epo] |
Ref country code: IE Free format text: LAPSE BECAUSE OF NON-PAYMENT OF DUE FEES Effective date: 20190226 |
|
| PG25 | Lapsed in a contracting state [announced via postgrant information from national office to epo] |
Ref country code: BE Free format text: LAPSE BECAUSE OF NON-PAYMENT OF DUE FEES Effective date: 20190228 |
|
| PG25 | Lapsed in a contracting state [announced via postgrant information from national office to epo] |
Ref country code: TR Free format text: LAPSE BECAUSE OF FAILURE TO SUBMIT A TRANSLATION OF THE DESCRIPTION OR TO PAY THE FEE WITHIN THE PRESCRIBED TIME-LIMIT Effective date: 20180509 |
|
| PGFP | Annual fee paid to national office [announced via postgrant information from national office to epo] |
Ref country code: ES Payment date: 20200322 Year of fee payment: 11 Ref country code: IT Payment date: 20200225 Year of fee payment: 11 |
|
| PG25 | Lapsed in a contracting state [announced via postgrant information from national office to epo] |
Ref country code: MT Free format text: LAPSE BECAUSE OF NON-PAYMENT OF DUE FEES Effective date: 20190226 Ref country code: PT Free format text: LAPSE BECAUSE OF FAILURE TO SUBMIT A TRANSLATION OF THE DESCRIPTION OR TO PAY THE FEE WITHIN THE PRESCRIBED TIME-LIMIT Effective date: 20180910 |
|
| PG25 | Lapsed in a contracting state [announced via postgrant information from national office to epo] |
Ref country code: CY Free format text: LAPSE BECAUSE OF FAILURE TO SUBMIT A TRANSLATION OF THE DESCRIPTION OR TO PAY THE FEE WITHIN THE PRESCRIBED TIME-LIMIT Effective date: 20180509 |
|
| PG25 | Lapsed in a contracting state [announced via postgrant information from national office to epo] |
Ref country code: IS Free format text: LAPSE BECAUSE OF FAILURE TO SUBMIT A TRANSLATION OF THE DESCRIPTION OR TO PAY THE FEE WITHIN THE PRESCRIBED TIME-LIMIT Effective date: 20180909 |
|
| PG25 | Lapsed in a contracting state [announced via postgrant information from national office to epo] |
Ref country code: HU Free format text: LAPSE BECAUSE OF FAILURE TO SUBMIT A TRANSLATION OF THE DESCRIPTION OR TO PAY THE FEE WITHIN THE PRESCRIBED TIME-LIMIT; INVALID AB INITIO Effective date: 20100226 |
|
| PG25 | Lapsed in a contracting state [announced via postgrant information from national office to epo] |
Ref country code: IT Free format text: LAPSE BECAUSE OF NON-PAYMENT OF DUE FEES Effective date: 20210226 |
|
| REG | Reference to a national code |
Ref country code: ES Ref legal event code: FD2A Effective date: 20220513 |
|
| PG25 | Lapsed in a contracting state [announced via postgrant information from national office to epo] |
Ref country code: MK Free format text: LAPSE BECAUSE OF FAILURE TO SUBMIT A TRANSLATION OF THE DESCRIPTION OR TO PAY THE FEE WITHIN THE PRESCRIBED TIME-LIMIT Effective date: 20180509 |
|
| PG25 | Lapsed in a contracting state [announced via postgrant information from national office to epo] |
Ref country code: ES Free format text: LAPSE BECAUSE OF NON-PAYMENT OF DUE FEES Effective date: 20210227 |
|
| P01 | Opt-out of the competence of the unified patent court (upc) registered |
Effective date: 20230530 |
|
| PGFP | Annual fee paid to national office [announced via postgrant information from national office to epo] |
Ref country code: DE Payment date: 20240219 Year of fee payment: 15 Ref country code: GB Payment date: 20240219 Year of fee payment: 15 |
|
| PGFP | Annual fee paid to national office [announced via postgrant information from national office to epo] |
Ref country code: FR Payment date: 20250228 Year of fee payment: 16 |
|
| REG | Reference to a national code |
Ref country code: DE Ref legal event code: R119 Ref document number: 602010050478 Country of ref document: DE |
|
| GBPC | Gb: european patent ceased through non-payment of renewal fee |
Effective date: 20250226 |
|
| PG25 | Lapsed in a contracting state [announced via postgrant information from national office to epo] |
Ref country code: DE Free format text: LAPSE BECAUSE OF NON-PAYMENT OF DUE FEES Effective date: 20250902 |
|
| PG25 | Lapsed in a contracting state [announced via postgrant information from national office to epo] |
Ref country code: GB Free format text: LAPSE BECAUSE OF NON-PAYMENT OF DUE FEES Effective date: 20250226 |