EP2377950B1 - Gene expression markers for colorectal cancer prognosis - Google Patents
Gene expression markers for colorectal cancer prognosis Download PDFInfo
- Publication number
- EP2377950B1 EP2377950B1 EP10177406.5A EP10177406A EP2377950B1 EP 2377950 B1 EP2377950 B1 EP 2377950B1 EP 10177406 A EP10177406 A EP 10177406A EP 2377950 B1 EP2377950 B1 EP 2377950B1
- Authority
- EP
- European Patent Office
- Prior art keywords
- seq
- expression
- colorectal cancer
- cancer
- gene
- Prior art date
- Legal status (The legal status is an assumption and is not a legal conclusion. Google has not performed a legal analysis and makes no representation as to the accuracy of the status listed.)
- Not-in-force
Links
Images
Classifications
-
- C—CHEMISTRY; METALLURGY
- C12—BIOCHEMISTRY; BEER; SPIRITS; WINE; VINEGAR; MICROBIOLOGY; ENZYMOLOGY; MUTATION OR GENETIC ENGINEERING
- C12Q—MEASURING OR TESTING PROCESSES INVOLVING ENZYMES, NUCLEIC ACIDS OR MICROORGANISMS; COMPOSITIONS OR TEST PAPERS THEREFOR; PROCESSES OF PREPARING SUCH COMPOSITIONS; CONDITION-RESPONSIVE CONTROL IN MICROBIOLOGICAL OR ENZYMOLOGICAL PROCESSES
- C12Q1/00—Measuring or testing processes involving enzymes, nucleic acids or microorganisms; Compositions therefor; Processes of preparing such compositions
- C12Q1/68—Measuring or testing processes involving enzymes, nucleic acids or microorganisms; Compositions therefor; Processes of preparing such compositions involving nucleic acids
- C12Q1/6876—Nucleic acid products used in the analysis of nucleic acids, e.g. primers or probes
- C12Q1/6883—Nucleic acid products used in the analysis of nucleic acids, e.g. primers or probes for diseases caused by alterations of genetic material
- C12Q1/6886—Nucleic acid products used in the analysis of nucleic acids, e.g. primers or probes for diseases caused by alterations of genetic material for cancer
-
- G—PHYSICS
- G01—MEASURING; TESTING
- G01N—INVESTIGATING OR ANALYSING MATERIALS BY DETERMINING THEIR CHEMICAL OR PHYSICAL PROPERTIES
- G01N33/00—Investigating or analysing materials by specific methods not covered by groups G01N1/00 - G01N31/00
- G01N33/48—Biological material, e.g. blood, urine; Haemocytometers
- G01N33/50—Chemical analysis of biological material, e.g. blood, urine; Testing involving biospecific ligand binding methods; Immunological testing
- G01N33/53—Immunoassay; Biospecific binding assay; Materials therefor
- G01N33/574—Immunoassay; Biospecific binding assay; Materials therefor for cancer
- G01N33/57407—Specifically defined cancers
- G01N33/57419—Specifically defined cancers of colon
-
- G—PHYSICS
- G01—MEASURING; TESTING
- G01N—INVESTIGATING OR ANALYSING MATERIALS BY DETERMINING THEIR CHEMICAL OR PHYSICAL PROPERTIES
- G01N33/00—Investigating or analysing materials by specific methods not covered by groups G01N1/00 - G01N31/00
- G01N33/48—Biological material, e.g. blood, urine; Haemocytometers
- G01N33/50—Chemical analysis of biological material, e.g. blood, urine; Testing involving biospecific ligand binding methods; Immunological testing
- G01N33/53—Immunoassay; Biospecific binding assay; Materials therefor
- G01N33/574—Immunoassay; Biospecific binding assay; Materials therefor for cancer
- G01N33/57407—Specifically defined cancers
- G01N33/57446—Specifically defined cancers of stomach or intestine
-
- C—CHEMISTRY; METALLURGY
- C12—BIOCHEMISTRY; BEER; SPIRITS; WINE; VINEGAR; MICROBIOLOGY; ENZYMOLOGY; MUTATION OR GENETIC ENGINEERING
- C12Q—MEASURING OR TESTING PROCESSES INVOLVING ENZYMES, NUCLEIC ACIDS OR MICROORGANISMS; COMPOSITIONS OR TEST PAPERS THEREFOR; PROCESSES OF PREPARING SUCH COMPOSITIONS; CONDITION-RESPONSIVE CONTROL IN MICROBIOLOGICAL OR ENZYMOLOGICAL PROCESSES
- C12Q2600/00—Oligonucleotides characterized by their use
- C12Q2600/106—Pharmacogenomics, i.e. genetic variability in individual responses to drugs and drug metabolism
-
- C—CHEMISTRY; METALLURGY
- C12—BIOCHEMISTRY; BEER; SPIRITS; WINE; VINEGAR; MICROBIOLOGY; ENZYMOLOGY; MUTATION OR GENETIC ENGINEERING
- C12Q—MEASURING OR TESTING PROCESSES INVOLVING ENZYMES, NUCLEIC ACIDS OR MICROORGANISMS; COMPOSITIONS OR TEST PAPERS THEREFOR; PROCESSES OF PREPARING SUCH COMPOSITIONS; CONDITION-RESPONSIVE CONTROL IN MICROBIOLOGICAL OR ENZYMOLOGICAL PROCESSES
- C12Q2600/00—Oligonucleotides characterized by their use
- C12Q2600/118—Prognosis of disease development
Definitions
- the present invention provides a gene, MYBL2, the expression levels of which are useful for predicting outcome of colorectal cancer.
- Colorectal cancer is the number two cause of cancer-related death in the United States and the European Union, accounting for 10% of all cancer-related deaths.
- colon cancer and rectal cancer may represent identical or similar disease at the molecular level, surgery for rectal cancer is complicated by anatomical issues. Possibly for this reason, the rate of local recurrence for rectal cancer is significantly higher than for colon cancer, and so the treatment approach is significantly different.
- Approximately 100,000 colon cancers are newly diagnosed each year in the United States, with about 65% of these being diagnosed as stage II/III colorectal cancer as discussed below.
- Refining a diagnosis of colorectal cancer involves evaluating the progression status of the cancer using standard classification criteria.
- Two classification systems have been widely used in.colorectal cancer, the modified Duke's or Astler-Coller staging system (Stages A-D) ( Astler VB, Coller FA., Ann Surg 1954;139:846-52 ), and more recently TNM staging (Stages I-IV) as developed by the American Joint Committee on Cancer ( AJCC Cancer Staging Manual, 6th Edition, Springer-Verlag, New York, 2002 ). Both systems apply measures of the spread of the primary tumor through layers of colon or rectal wall to the adjacent organs, lymph nodes and distant sites to evaluate tumor progression. Estimates of recurrence risk and treatment decisions in colon cancer are currently based primarily on tumor stage.
- Stage II colorectal cancers there are approximately 33,000 newly diagnosed Stage II colorectal cancers each year in the United States. Nearly all of these patients are treated by surgical resection of the tumor and, in addition, about 40% are currently treated with chemotherapy based on 5-fluorouracil (5-FU). The decision whether to administer adjuvant chemotherapy is not straightforward.
- the five-year survival rate for Stage II colon cancer patients treated with surgery alone is approximately 80%.
- Standard adjuvant treatment with 5-FU + leucovorin (folinic acid) demonstrates an absolute benefit of only 2-4% in this population and shows significant toxicity, including a rate of toxic death from chemotherapy as high as 1%. Thus, a large number of patients receive toxic therapy from which only a few benefit.
- a test capable of prognosis after surgery in Stage II colorectal cancer patients would be of great benefit for guiding treatment decisions for these patients.
- Stage III colon cancer The benefit of chemotherapy in Stage III colon cancer is more evident than it is in Stage II.
- a large proportion of the 31,000 patients annually diagnosed with Stage III colon cancer receive 5-FU-based adjuvant chemotherapy, and the absolute benefit of 5-FU + leucovorin in this setting is around 18-24%, depending on the particular regimen employed.
- Current standard-of-care chemotherapy treatment for Stage III colon cancer patients (5-FU + leucovorin or 5-FU + leucovorin + oxaliplatin) is moderately effective, achieving an improvement in 5-yr survival rate from about 50% (surgery alone) to about 65% (5-FU + leucovorin) or 70% (5-FU + leucovorin + oxaliplatin).
- Treatment with 5-FU + leucovorin alone or in combination with oxaliplatin is accompanied by a range of adverse side-effects, including toxic death in approximately 1% of patients treated. Furthermore, the three-year survival rate for Stage III colon cancer patients treated with surgery alone is about 47% and it has not been established whether a subset of Stage III patients exists for which recurrence risk resembles that observed for Stage II patients.
- a test that would quantify recurrence risk based on molecular markers rather than tumor stage alone would be useful for identifying a subset of Stage III patients that may not require adjuvant therapy to achieve acceptable outcomes.
- Staging of rectal tumors is carried out based on similar criteria as for colon tumor staging, although there are some differences resulting for example from differences in the arrangement of the draining lymph nodes.
- Stage II/III rectal tumors bear a reasonable correlation to Stage II/III colon tumors as to their state of progression.
- the rate of local recurrence and other aspects of prognosis differ between rectal cancer and colon cancer, and these differences may arise from difficulties in accomplishing total resection of rectal tumors.
- Prognostic tests for rectal cancer would have utility similar in nature as described for colon cancer prognostic tests and the same prognostic markers might well apply to both cancer types.
- HER2 HER2
- HERCEPTIN ® Genes, whose expression is associated with clinical outcome in human cancer patients, are a valuable resource for selection of targets for drug compound screening and further drug development activities.
- Molecularly targeted drugs such as HERCEPTIN ® (Genentech, Inc.) can be developed and commercialized in conjunction with a diagnostic test that can identify patients who are likely to benefit from the drug; one aspect of such a test is the identification of those patients likely to have a positive outcome without any treatment other than surgery. For example, 80% of Stage II colon cancer patients survive five years or more when treated with surgery alone. Gene markers that identify patients more likely to be among the 20% whose cancer will recur without additional treatment are useful in drug development, for example in screening patients for inclusion in a clinical trial.
- the therapy is chemotherapy and/or radiation therapy.
- the clinical outcome of the method of the invention may be expressed, for example, in terms of Recurrence-Free Interval (RFI), Overall Survival (OS), or Disease-Free Survival (DFS).
- RFID Recurrence-Free Interval
- OS Overall Survival
- DFS Disease-Free Survival
- the cancer is Dukes B (stage II) or Dukes C (stage III) colorectal cancer.
- Determining the expression level of one or more genes may be obtained, for example, by a method of gene expression profiling.
- the method of gene expression profiling may be, for example, a PCR-based method.
- the expression level may be normalized relative to the expression level of an RNA transcript of one or more reference genes.
- the method may further comprise the step of creating a report summarizing said prediction.
- RNA transcripts or their expression products it is contemplated that for every increment of an increase in the level of one or more predictive RNA transcripts or their expression products, the patient is identified to show an incremental increase in clinical outcome.
- the determination of expression levels may occur more than one time.
- the determination of expression levels may occur before the patient is subjected to any therapy following surgical resection.
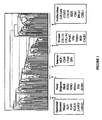
- Figure 1 shows a dendrogram representing the expression clustering of 142 genes that were statistically significantly related to recurrence-free interval (Tables 1.2A and 1.2B) in the univariate .Cox proportional hazards analysis.
- the cluster analysis used the unweighted pair-group average amalgamation method and 1-Pearson r as the distance measure.
- the identities of particular genes in clusters of interest are indicated along the x-axis.
- tumor refers to all neoplastic cell growth and proliferation, whether malignant or benign, and all pre-cancerous and cancerous cells and tissues.
- cancer and “cancerous” refer to or describe the physiological condition in mammals that is typically characterized by unregulated cell growth.
- examples of cancer include, but are not limited to, breast cancer, ovarian cancer, colon cancer, lung cancer, prostate cancer, hepatocellular cancer, gastric cancer, pancreatic cancer, cervical cancer, liver cancer, bladder cancer, cancer of the urinary tract, thyroid cancer, renal cancer, carcinoma, melanoma, and brain cancer.
- the "pathology" of cancer includes all phenomena that compromise the well-being of the patient. This includes, without limitation, abnormal or uncontrollable cell growth, metastasis, interference with the normal functioning of neighboring cells, release of cytokines or other secretory products at abnormal levels, suppression or aggravation of inflammatory or immunological response, neoplasia, premalignancy, malignancy, invasion of surrounding or distant tissues or organs, such as lymph nodes, etc.
- colonal cancer is used in the broadest sense and refers to (1) all stages and all forms of cancer arising from epithelial cells of the large intestine and/or rectum and/or (2) all stages and all forms of cancer affecting the lining of the large intestine and/or rectum.
- the colon and rectum are treated as one organ.
- Tumor T1: tumor invades submucosa; T2: tumor invades muscularis basement; T3: tumor invades through the muscularis basement into the subserose, or into the horric or perirectal tissues; T4: tumor directly invades other organs or structures, and/or perforates.
- Node N0: no regional lymph node metastasis; N1: metastasis in 1 to 3 regional lymph nodes; N2: metastasis in 4 or more regional lymph nodes.
- Stage groupings Stage I: T1 N0 M0; T2 N0 M0; Stage II: T3 N0 M0; T4 N0 M0; Stage III: any T, N1-2; M0; Stage IV: any T, any N, M1.
- Stage A the tumor penetrates into the mucosa of the bowel wall but not further.
- Stage B tumor penetrates into and through the muscularis basement of the bowel wall;
- Stage C tumor penetrates into but not through muscularis basement of the bowel wall, there is pathologic evidence of colorectal cancer in the lymph nodes; or tumor penetrates into and through the muscularis propria of the bowel wall, there is pathologic evidence of cancer in the lymph nodes;
- Stage D tumor has spread beyond the confines of the lymph nodes, into other organs, such as the liver, lung or bone.
- Prognostic factors are those variables related to the natural history of colorectal cancer, which influence the recurrence rates and outcome of patients once they have developed colorectal cancer.
- Clinical parameters that have been associated with a worse prognosis include, for example, lymph node involvement, , and high grade tumors.
- Prognostic factors are frequently used to categorize patients into subgroups with different baseline relapse risks.
- prognosis is used herein to refer to the prediction of the likelihood of cancer-attributable death or progression, including recurrence, metastatic spread, and drug resistance, of a neoplastic disease, such as colon cancer.
- prediction is used herein to refer to the likelihood that a patient will have a particular clinical outcome, whether positive or negative, following surgical removal of the primary tumor.
- the predictive methods of the present invention can be used clinically to make treatment decisions by choosing the most appropriate treatment modalities for any particular patient.
- the predictive methods of the present invention are valuable tools in predicting if a patient is likely to respond favorably to a treatment regimen, such as surgical intervention.
- the prediction may include prognostic factors.
- positive clinical outcome means an improvement in any measure of patient status, including those measures ordinarily used in the art, such as an increase in the duration of Recurrence-Free interval (RFI), an increase in the time of Overall Survival (OS), an increase in the time of Disease-Free Survival (DFS), an increase in the duration of Distant Recurrence-Free Interval (DRFI), and the like.
- An increase in the likelihood of positive clinical outcome corresponds to a decrease in the likelihood of cancer recurrence.
- risk classification means the level of risk or the prediction that a subject will experience a particular clinical outcome.
- a subject may be classified into a risk group or classified at a level of risk based on the predictive methods of the present invention.
- a "risk group” is a group of subjects or individuals with a similar level of risk for a particular clinical outcome.
- long-term survival is used herein to refer to survival for at least 3 years, more preferably for at least 5 years.
- RFI Recurrence-Free Interval
- OS Overall Survival
- DFS Disease-Free Survival
- DRFI Distant Recurrence-Free Interval
- microarray refers to an ordered arrangement of hybridizable array elements, preferably polynucleotide probes, on a substrate.
- polynucleotide when used in singular or plural, generally refers to any polyribonucleotide or polydeoxribonucleotide, which may be unmodified RNA or DNA or modified RNA or DNA.
- polynucleotides as defined herein include, without limitation, single- and double-stranded DNA, DNA including single- and double-stranded regions, single- and double-stranded RNA, and RNA including single- and double-stranded regions, hybrid molecules comprising DNA and RNA that may be single-stranded or, more typically, double-stranded or include single- and double-stranded regions.
- polynucleotide refers to triple-stranded regions comprising RNA or DNA or both RNA and DNA.
- the strands in such regions may be from the same molecule or from different molecules.
- the regions may include all of one or more of the molecules, but more typically involve only a region of some of the molecules.
- One of the molecules of a triple-helical region often is an oligonucleotide.
- polynucleotide specifically includes cDNAs.
- the term includes DNAs (including cDNAs) and RNAs that contain one or more modified bases.
- DNAs or RNAs with backbones modified for stability or for other reasons are "polynucleotides" as that term is intended herein.
- DNAs or RNAs comprising unusual bases, such as inosine, or modified bases, such as tritiated bases are included within the term "polynucleotides" as defined herein.
- polynucleotide embraces all chemically, enzymatically and/or metabolically modified forms of unmodified polynucleotides, as well as the chemical forms of DNA and RNA characteristic of viruses and cells, including simple and complex cells.
- oligonucleotide refers to a relatively short polynucleotide, including, without limitation, single-stranded deoxyribonucleotides, single- or double-stranded ribonucleotides, RNA:DNA hybrids and double-stranded DNAs. Oligonucleotides, such as single-stranded DNA probe oligonucleotides, are often synthesized by chemical methods, for example using automated oligonucleotide synthesizers that are commercially available. However, oligonucleotides can be made by a variety of other methods, including in vitro recombinant DNA-mediated techniques and by expression of DNAs in cells and organisms.
- differentially expressed gene refers to a gene whose expression is activated to a higher or lower level in a subject suffering from a disease, specifically cancer, such as colon cancer, relative to its expression in a normal or control subject.
- the terms also include genes whose expression is activated to a higher or lower level at different stages of the same disease. It is also understood that a differentially expressed gene may be either activated or inhibited at the nucleic acid level or protein level, or may be subject to alternative splicing to result in a different polypeptide product. Such differences may be evidenced by a change in mRNA levels, surface expression, secretion or other partitioning of a polypeptide, for example.
- Differential gene expression may include a comparison of expression between two or more genes or their gene products, or a comparison of the ratios of the expression between two or more genes or their gene products, or even a comparison of two differently processed products of the same gene, which differ between normal subjects and subjects suffering from a disease, specifically cancer, or between various stages of the same disease.
- Differential expression includes both quantitative, as well as qualitative, differences in the temporal or cellular expression pattern in a gene or its expression products among, for example, normal and diseased cells, or among cells which have undergone different disease events or disease stages.
- differentiated gene expression is considered to be present when there is at least an about two-fold, preferably at least about four-fold, more preferably at least about six-fold, most preferably at least about ten-fold difference between the expression of a given gene in normal and diseased subjects, or in various stages of disease development in a diseased subject.
- RNA transcript is used to refer to the level of the transcript determined by normalization to the level of reference mRNAs, which might be all measured transcripts in the specimen or a particular reference set of mRNAs.
- gene amplification refers to a process by which multiple copies of a gene or gene fragment are formed in a particular cell or cell line.
- the duplicated region (a stretch of amplified DNA) is often referred to as "amplicon.”
- amplicon usually, the amount of the messenger RNA (mRNA) produced, i.e ., the level of gene expression, also increases in the proportion of the number of copies made of the particular gene expressed.
- “Stringency” of hybridization reactions is readily determinable by one of ordinary skill in the art, and generally is an empirical calculation dependent upon probe length, washing temperature, and salt concentration. In general, longer probes require higher temperatures for proper annealing, while shorter probes need lower temperatures. Hybridization generally depends on the ability of denatured DNA to reanneal when complementary strands are present in an environment below their melting temperature. The higher the degree of desired homology between the probe and hybridizable sequence, the higher the relative temperature which can be used. As a result, it follows that higher relative temperatures would tend to make the reaction conditions more stringent, while lower temperatures less so. For additional details and explanation of stringency of hybridization reactions, see Ausubel et al., Current Protocols in Molecular Biology, Wiley Interscience Publishers, (1995 ).
- “Stringent conditions” or “high stringency conditions”, as defined herein, typically: (1) employ low ionic strength and high temperature for washing, for example 0.015 M sodium chloride/0.0015 M sodium citrate/0.1% sodium dodecyl sulfate at 50°C; (2) employ during hybridization a denaturing agent, such as formamide, for example, 50% (v/v) formamide with 0.1% bovine serum albumin/0.1% Ficoll/0.1% polyvinylpyrrolidone/50mM sodium phosphate buffer at pH 6.5 with 750 mM sodium chloride, 75 mM sodium citrate at 42°C; or (3) employ 50% formamide, 5 x SSC (0.75 M NaCl, 0.075 M sodium citrate), 50 mM sodium phosphate (pH 6.8), 0.1% sodium pyrophosphate, 5 x Denhardt's solution, sonicated salmon sperm DNA (50 ⁇ g/ml), 0.1% SDS, and 10% dextran sulfate at 42°
- Modely stringent conditions may be identified as described by Sambrook et al., Molecular Cloning: A Laboratory Manual, New York: Cold Spring Harbor Press, 1989 , and include the use of washing solution and hybridization conditions (e.g., temperature, ionic strength and %SDS) less stringent that those described above.
- washing solution and hybridization conditions e.g., temperature, ionic strength and %SDS
- moderately stringent conditions is overnight incubation at 37°C in a solution comprising: 20% formamide, 5 x SSC (150 mM NaCl, 15 mM trisodium citrate), 50 mM sodium phosphate (pH 7.6), 5 x Denhardt's solution, 10% dextran sulfate, and 20 mg/ml denatured sheared salmon sperm DNA, followed by washing the filters in 1 x SSC at about 37-50°C.
- the skilled artisan will recognize how to adjust the temperature, ionic strength, etc. as necessary to accommodate factors such as probe length and the like.
- references to “at least one,” “at least two,” “at least five,” etc. of the genes listed in any particular gene set means any one or any and all combinations of the genes listed.
- node negative cancer such as “node negative” colon cancer, is used herein to refer to cancer that has not spread to the lymph nodes.
- splicing and "RNA splicing” are used interchangeably and refer to RNA processing that removes introns and joins exons to produce mature mRNA with continuous coding sequence that moves into the cytoplasm of an eukaryotic cell.
- exon refers to any segment of an interrupted gene that is represented in the mature RNA product ( B. Lewin. Genes IV Cell Press, Cambridge Mass. 1990 ).
- intron refers to any segment of DNA that is transcribed but removed from within the transcript by splicing together the exons on either side of it.
- exon sequences occur in the mRNA sequence of a gene as defined by Ref. SEQ ID numbers.
- intron sequences are the intervening sequences within the genomic DNA of a gene, bracketed by exon sequences and having GT and AG splice consensus sequences at their 5' and 3' boundaries.
- expression cluster is used herein to refer to a group of genes which demonstrate similar expression patterns when studied within samples from a defined set of patients. As used herein, the genes within an expression cluster show similar expression patterns when studied within samples from patients with Stage II and/or Stage III cancers of the colon and/or rectum.
- the present disclosure provides prognostic gene markers for colorectal cancer.
- the disclosure provides prognostic gene markers of Stage II and/or Stage III colorectal cancer, including markers that are specifically prognostic to the outcome of either Stage II or Stage III disease and those that have prognostic value at both stages, reflecting underlying differences in tumor cells in the two stages and/or in the extent of tumor progression.
- the prognostic markers and associated information provided by the present disclosure allow physicians to make more intelligent treatment decisions, and to customize the treatment of colorectal cancer to the needs of individual patients, thereby maximizing the benefit of treatment and minimizing the exposure of patients to unnecessary treatments, which do not provide any significant benefits and often carry serious risks due to toxic side-effects.
- Disruptions in the normal functioning of various physiological processes have been implicated in the pathology in cancer.
- the relative contribution of dysfunctions in particular physiological processes to the pathology of particular cancer types is not well characterized.
- Any physiological process integrates the contributions of numerous gene products expressed by the various cells involved in the process.
- tumor cell invasion of adjacent normal tissue and intravasation of the tumor cell into the circulatory system are effected by an array of proteins that mediate various cellular characteristics, including cohesion among tumor cells, adhesion of tumor cells to normal cells and connective tissue, ability of the tumor cell first to alter its morphology and then to migrate through surrounding tissues, and ability of the tumor cell to degrade surrounding connective tissue structures.
- Multi-analyte gene expression tests can measure the expression level of one or more genes involved in each of several relevant physiologic processes or component cellular characteristics.
- the predictive power of the test and therefore its utility, can be improved by using the expression values obtained for individual genes to calculate a score which is more highly correlated with outcome than is the expression value of the individual genes.
- a quantitative score (recurrence score) that predicts the likelihood of recurrence in estrogen receptor-positive, node-negative breast cancer is describe in a co-pending U.S. Patent application (Publication Number 20050048542 ).
- the equation used to calculate such a recurrence score may group genes in order to maximize the predictive value of the recurrence score.
- the grouping of genes may be performed at least in part based on knowledge of their contribution to physiologic functions or component cellular characteristics such as discussed above.
- the formation of groups can facilitate the mathematical weighting of the contribution of various expression values to the recurrence score.
- the weighting of a gene group representing a physiological process or component cellular characteristic can reflect the contribution of that process or characteristic to the pathology of the cancer and clinical outcome. Accordingly, in an important aspect, the present disclosure also provides specific groups of the prognostic genes identified herein, that together are more reliable and powerful predictors of outcome than the individual genes or random combinations of the genes identified.
- a recurrence score based on the determination of a recurrence score, one can choose to partition patients into subgroups at any particular value(s) of the recurrence score, where all patients with values in a given range can be classified as belonging to a particular risk group. Thus, the values chosen will define subgroups of patients with respectively greater or lesser risk.
- the utility of a gene marker in predicting colon cancer outcome may not be unique to that marker.
- An alternative marker having a expression pattern that is closely similar to a particular test marker may be substituted for or used in addition to a test marker and have little impact on the overall predictive utility of the test.
- the closely similar expression patterns of two genes may result from involvement of both genes in a particular process and/or being under common regulatory control in colon tumor cells.
- the prognostic marker and associated information provided by the present invention predicting the clinical outcome in Stage II and/or Stage III cancers of the colon and/or rectum has utility in the development of drugs to treat Stage II and/or Stage III cancers of the colon and/or rectum.
- the prognostic marker and associated information provided by the present invention predicting the clinical outcome in Stage II and/or Stage III cancers of the colon and/or rectum also have utility in screening patients for inclusion in clinical trials that test the efficacy of drug compounds for the treatment of patients with Stage II and/or Stage III cancers of the colon and/or rectum.
- the prognostic marker may be used on samples collected from patients in a clinical trial and the results of the test used in conjunction with patient outcomes in order to determine whether subgroups of patients are more or less likely to show a response to the drug than the whole group or other subgroups.
- the prognostic marker and associated information provided by the present invention predicting the clinical outcome in Stage II and/or Stage III cancers of the colon and/or rectum are useful as inclusion criterion for a clinical trial. For example, a patient is more likely to be included in a clinical trial if the results of the test indicate a higher likelihood that the patient will have a poor clinical outcome if treated with surgery alone and a patient is less likely to be included in a clinical trial if the results of the test indicate a lower likelihood that the patient will have a poor clinical outcome if treated with surgery alone.
- Prognostic markers and associated information may be used to design or produce a reagent that modulates the level or activity of the gene's transcript or its expression product.
- Said reagents may include but are not limited to an antisense RNA, a small inhibitory RNA, a ribozyme, a monoclonal or polyclonal antibody.
- said gene or its transcript, or more particularly, an expression product of said transcript is used in an (screening) assay to identify a drug compound, wherein said drug compounds is used in the development of a drug to treat Stage II and/or Stage III cancers of the colon and/or rectum.
- the expression level of the gene may be determined in relation to various features of the expression products of the gene including exons, introns, protein epitopes and protein activity.
- the expression level of a gene may be inferred from analysis of the structure of the gene, for example from the analysis of the methylation pattern of gene's promoter(s).
- Methods of gene expression profiling include methods based on hybridization analysis of polynucleotides, methods based on sequencing of polynucleotides, and proteomics-based methods.
- the most commonly used methods known in the art for the quantification of mRNA expression in a sample include northern blotting and in situ hybridization ( Parker & Barnes, Methods in Molecular Biology 106:247-283 (1999 )); RNAse protection assays ( Hod, Biotechniques 13:852-854 (1992 )); and PCR-based methods, such as reverse transcription polymerase chain reaction (RT-PCR) ( Weis et al., Trends in Genetics 8:263-264 (1992 )).
- RT-PCR reverse transcription polymerase chain reaction
- antibodies may be employed that can recognize sequence-specific duplexes, including DNA duplexes, RNA duplexes, and DNA-RNA hybrid duplexes or DNA-protein duplexes.
- Representative methods for sequencing-based gene expression analysis include Serial Analysis of Gene Expression (SAGE), and gene expression analysis by massively parallel signature sequencing (MPSS).
- RT-PCR Reverse Transcriptase PCR
- RT-PCR which can be used to determine mRNA levels in various samples.
- the results can be used to compare gene expression patterns between sample sets, for example in normal and tumor tissues and in patients with or without drug treatment.
- the first step is the isolation of mRNA from a target sample.
- the starting material is typically total RNA isolated from human tumors or tumor cell lines, and corresponding normal tissues or cell lines, respectively.
- RNA can be isolated from a variety of primary tumors, including breast, lung, colon, prostate, brain, liver, kidney, pancreas, spleen, thymus, testis, ovary, uterus, etc., tumor, or tumor cell lines, with pooled DNA from healthy donors.
- mRNA can be extracted, for example, from frozen or archived paraffin-embedded and fixed (e.g. formalin-fixed) tissue samples.
- RNA isolation can be performed using purification kit, buffer set and protease from commercial manufacturers, such as Qiagen, according to the manufacturer's instructions. For example, total RNA from cells in culture can be isolated using Qiagen RNeasy mini-columns.
- RNA isolation kits include MasterPureTM Complete DNA and RNA Purification Kit (EPICENTRE®, Madison, WI), and Paraffin Block RNA Isolation Kit (Ambion, Inc.). Total RNA from tissue samples can be isolated using RNA Stat-60 (Tel-Test). RNA prepared from tumor can be isolated, for example, by cesium chloride density gradient centrifugation.
- RNA cannot serve as a template for PCR
- the first step in gene expression profiling by RT-PCR is the reverse transcription of the RNA template into cDNA, followed by its exponential amplification in a PCR reaction.
- the two most commonly used reverse transcriptases are avilo myeloblastosis virus reverse transcriptase (AMV-RT) and Moloney murine leukemia virus reverse transcriptase (MMLV-RT).
- AMV-RT avilo myeloblastosis virus reverse transcriptase
- MMLV-RT Moloney murine leukemia virus reverse transcriptase
- the reverse transcription step is typically primed using specific primers, random hexamers, or oligo-dT primers, depending on the circumstances and the goal of expression profiling.
- extracted RNA can be reverse-transcribed using a GeneAmp RNA PCR kit (Perkin Elmer, CA, USA), following the manufacturer's instructions.
- the derived cDNA can then be used as a template in
- the PCR step can use a variety of thermostable DNA-dependent DNA polymerases, it typically employs the Taq DNA polymerase, which has a 5'-3' nuclease activity but lacks a 3'-5' proofreading endonuclease activity.
- TaqMan® PCR typically utilizes the 5'-nuclease activity of Taq or Tth polymerase to hydrolyze a hybridization probe bound to its target amplicon, but any enzyme with equivalent 5' nuclease activity can be used.
- Two oligonucleotide primers are used to generate an amplicon typical of a PCR reaction.
- a third oligonucleotide, or probe is designed to detect nucleotide sequence located between the two PCR primers.
- the probe is non-extendible by Taq DNA polymerase enzyme, and is labeled with a reporter fluorescent dye and a quencher fluorescent dye. Any laser-induced emission from the reporter dye is quenched by the quenching dye when the two dyes are located close together as they are on the probe.
- the Taq DNA polymerase enzyme cleaves the probe in a template-dependent manner.
- the resultant probe fragments disassociate in solution, and signal from the released reporter dye is free from the quenching effect of the second fluorophore.
- One molecule of reporter dye is liberated for each new molecule synthesized, and detection of the unquenched reporter dye provides the basis for quantitative interpretation of the data.
- TaqMan® RT-PCR can be performed using commercially available equipment, such as, for example, ABI PRISM 7700 TM Sequence Detection System TM (Perkin-Elmer-Applied Biosystems, Foster City, CA, USA), or Lightcycler (Roche Molecular Biochemicals, Mannheim, Germany).
- the 5' nuclease procedure is run on a real-time quantitative PCR device such as the ABI PRISM 7700 TM Sequence Detection System TM .
- the system consists of a thermocycler, laser, charge-coupled device (CCD), camera and computer.
- the system amplifies samples in a 96-well format on a thermocycler.
- laser-induced fluorescent signal is collected in real-time through fiber optics cables for all 96 wells, and detected at the CCD.
- the system includes software for running the instrument and for analyzing the data.
- 5'-Nuclease assay data are initially expressed as Ct, or the threshold cycle.
- Ct or the threshold cycle.
- fluorescence values are recorded during every cycle and represent the amount of product amplified to that point in the amplification reaction.
- the point when the fluorescent signal is first recorded as statistically significant is the threshold cycle (C t ).
- RT-PCR is usually performed using an internal standard.
- the ideal internal standard is expressed at a constant level among different tissues, and is unaffected by the experimental treatment.
- RNAs most frequently used to normalize patterns of gene expression are mRNAs for the housekeeping genes glyceraldehyde-3-phosphate-dehydrogenase (GAPDH) and ⁇ -actin.
- GPDH glyceraldehyde-3-phosphate-dehydrogenase
- ⁇ -actin glyceraldehyde-3-phosphate-dehydrogenase
- RT-PCR measures PCR product accumulation through a dual-labeled fluorigenic probe (i.e., TaqMan® probe).
- Real time PCR is compatible both with quantitative competitive PCR, where internal competitor for each target sequence is used for normalization, and with quantitative comparative PCR using a normalization gene contained within the sample, or a housekeeping gene for RT-PCR.
- quantitative competitive PCR where internal competitor for each target sequence is used for normalization
- quantitative comparative PCR using a normalization gene contained within the sample, or a housekeeping gene for RT-PCR.
- RNA isolation, purification, primer extension and amplification are given in various published journal articles (for example: T.E. Godfrey et al. J. Molec. Diagnostics 2: 84-91 (2000 ); K. Specht et al., Am. J. Pathol. 158: 419-29 (2001 )).
- a representative process starts with cutting about 10 ⁇ m thick sections of paraffin-embedded tumor tissue samples. The RNA is then extracted, and protein and DNA are removed. After analysis of the RNA concentration, RNA repair and/or amplification steps may be included, if necessary, and RNA is reverse transcribed using gene specific promoters followed by RT-PCR.
- the obtained cDNA is spiked with a synthetic DNA molecule (competitor), which matches the targeted cDNA region in all positions, except a single base, and serves as an internal standard.
- the cDNA/competitor mixture is PCR amplified and is subjected to a post-PCR shrimp alkaline phosphatase (SAP) enzyme treatment, which results in the dephosphorylation of the remaining nucleotides.
- SAP shrimp alkaline phosphatase
- the PCR products from the competitor and cDNA are subjected to primer extension, which generates distinct mass signals for the competitor- and cDNA-derives PCR products. After purification, these products are dispensed on a chip array, which is pre-loaded with components needed for analysis with matrix-assisted laser desorption ionization time-of-flight mass spectrometry (MALDI-TOF MS) analysis.
- MALDI-TOF MS matrix-assisted laser desorption ionization time-of-flight mass spectrometry
- the cDNA present in the reaction is then quantified by analyzing the ratios of the peak areas in the mass spectrum generated. For further details see, e.g. Ding and Cantor, Proc. Natl. Acad. Sci. USA 100:3059-3064 (2003 ).
- PCR-based techniques include, for example, differential display ( Liang and Pardee, Science 257:967-971 (1992 )); amplified fragment length polymorphism (iAFLP) ( Kawamoto et al., Genome Res. 12:1305-1312 (1999 )); BeadArrayTM technology (Illumina, San Diego, CA; Oliphant et al., Discovery of Markers for Disease (Supplement to Biotechniques), June 2002; Ferguson et al., Analytical Chemistry 72:5618 (2000 )); BeadsArray for Detection of Gene Expression (BADGE), using the commercially available Luminex100 LabMAP system and multiple color-coded microspheres (Luminex Corp., Austin, TX) in a rapid assay for gene expression ( Yang et al., Genome Res. 11:1888-1898 (2001 )); and high coverage expression profiling (HiCEP) analysis ( Fukumura et al., Nucl. Acids. Res. 31(16)
- PCR amplified inserts of cDNA clones are applied to a substrate in a dense array.
- the microarrayed genes, immobilized on the microchip at 10,000 elements each, are suitable for hybridization under stringent conditions.
- Fluorescently labeled cDNA probes may be generated through incorporation of fluorescent nucleotides by reverse transcription of RNA extracted from tissues of interest. Labeled cDNA probes applied to the chip hybridize with specificity to each spot of DNA on the array. After stringent washing to remove non-specifically bound probes, the chip is scanned by confocal laser microscopy or by another detection method, such as a CCD camera.
- Quantitation of hybridization of each arrayed element allows for assessment of corresponding mRNA abundance.
- dual color fluorescence separately labeled cDNA probes generated from two sources of RNA are hybridized pair wise to the array. The relative abundance of the transcripts from the two sources corresponding to each specified gene is thus determined simultaneously.
- the miniaturized scale of the hybridization affords a convenient and rapid evaluation of the expression pattern for large numbers of genes.
- Such methods have been shown to have the sensitivity required to detect rare transcripts, which are expressed at a few copies per cell, and to reproducibly detect at least approximately two-fold differences in the expression levels ( Schena et al., Proc. Natl. Acad. Sci. USA 93(2):106-149 (1996 )).
- Microarray analysis can be performed by commercially available equipment, following manufacturer's protocols, such as by using the Affymetrix GenChip technology, or Incyte's microarray technology.
- microarray methods for large-scale analysis of gene expression makes it possible to search systematically for molecular markers of cancer classification and outcome prediction in a variety of tumor types.
- Serial analysis of gene expression is a method that allows the simultaneous and quantitative analysis of a large number of gene transcripts, without the need of providing an individual hybridization probe for each transcript.
- a short sequence tag (about 10-14 bp) is generated that contains sufficient information to uniquely identify a transcript, provided that the tag is obtained from a unique position within each transcript.
- many transcripts are linked together to form long serial molecules, that can be sequenced, revealing the identity of the multiple tags simultaneously.
- the expression pattern of any population of transcripts can be quantitatively evaluated by determining the abundance of individual tags, and identifying the gene corresponding to each tag. For more details see, e.g. Velculescu et al., Science 270:484-487 (1995 ); and Velculescu et al., Cell 88:243-51 (1997 ).
- This method is a sequencing approach that combines non-gel-based signature sequencing with in vitro cloning of millions of templates on separate 5 ⁇ m diameter microbeads.
- a microbead library of DNA templates is constructed by in vitro cloning. This is followed by the assembly of a planar array of the template-containing microbeads in a flow cell at a high density (typically greater than 3 x 10 6 microbeads/cm 2 ).
- the free ends of the cloned templates on each microbead are analyzed simultaneously, using a fluorescence-based signature sequencing method that does not require DNA fragment separation. This method has been shown to simultaneously and accurately provide, in a single operation, hundreds of thousands of gene signature sequences from a yeast cDNA library.
- Immunohistochemistry methods are also suitable for detecting the expression levels of the prognostic marker of the present invention.
- antibodies or antisera preferably polyclonal antisera, and most preferably monoclonal antibodies specific for the marker are used to detect expression.
- the antibodies can be detected by direct labeling of the antibodies themselves, for example, with radioactive labels, fluorescent labels, hapten labels such as, biotin, or an enzyme such as horse radish peroxidase or alkaline phosphatase.
- unlabeled primary antibody is used in conjunction with a labeled secondary antibody, comprising antisera, polyclonal antisera or a monoclonal antibody specific for the primary antibody. Immunohistochemistry protocols and kits are well known in the art and are commercially available.
- proteome is defined as the totality of the proteins present in a sample (e.g. tissue, organism, or cell culture) at a certain point of time.
- Proteomics includes, among other things, study of the global changes of protein expression in a sample (also referred to as "expression proteomics").
- Proteomics typically includes the following steps: (1) separation of individual proteins in a sample by 2-D gel electrophoresis (2-D PAGE); (2) identification of the individual proteins recovered from the gel, e.g. my mass spectrometry or N-terminal sequencing, and (3) analysis of the data using bioinformatics.
- Proteomics methods are valuable supplements to other methods of gene expression profiling, and can be used, alone or in combination with other methods, to detect the products of the prognostic marker of the present invention.
- RNA transcripts gene expression analysis
- protein translation products protein translation products
- the expression level of genes may also' be inferred from information regarding chromatin structure, such as for example the methylation status of gene promoters and other regulatory elements and the acetylation status of histones.
- the methylation status of a promoter influences the level or expression of the gene regulated by that promoter.
- Aberrant methylation of particular gene promoters has been implicated in expression regulation, such as for example silencing of tumor suppressor genes.
- examination of the methylation status of a gene's promoter can be utilized as a surrogate for direct quantization of RNA levels.
- methylation-specific PCR Herman J.G. et al. (1996) Methylation-specific PCR: a novel PCR assay for methylation status of CpG islands. Proc. Natl Acad. Sci. USA. 93, 9821-9826 .) and bisulfite DNA sequencing ( Frommer M. et al. (1992) A genomic sequencing protocol that yields a positive display of 5-methylcytosine residues in individual DNA strands. Proc. Natl Acad. Sci. USA. 89, 1827-1831 .). More recently, microarray-based technologies have been used to characterize promoter methylation status ( Chen C.M. (2003) Methylation target array for rapid analysis of CpG island hypermethylation in multiple tissue genomes. Am. J. Pathol. 163, 37-45 .).
- a further aspect of the disclosure is the identification of gene expression clusters.
- Gene expression clusters can be identified by analysis of expression data using statistical analyses known in the art, including pairwise analysis of correlation based on Pearson correlation coefficients ( Pearson K. and Lee A. (1902) Biometrika 2, 357 ).
- an expression cluster identified herein includes BGN, CALD1, COL1A1, COL1A2, SPARC, VIM and other genes which are known to be synthesized predominantly by stromal cells and to be involved in remodeling extracellular matrix.
- This expression cluster is referred to herein as the Extracellular Matrix Remodeling/Stromal cluster.
- an expression cluster identified herein includes ANXA2, KLK6, KLK10, LAMA3, LAMC2, MASPIN, SLPI, and other genes encoding epithelial cell secreted products, most of which are secreted predominantly by epithelial cells but which may be secreted by other cell types.
- This expression cluster is referred to herein as the Epithelial/Secreted cluster.
- an expression cluster identified herein includes DUSP1, EGR1, EGR3, FOS, NR4A1, RHOB, and other genes whose transcription is upregulated early after exposure of cells to certain stimuli.
- a variety of stimuli trigger transcription of early response genes, e.g. exposure to growth factor s, which enables cells to quickly increase their motility and their ability to transport nutrients such as glucose.
- This expression cluster is referred to herein as the Early Response cluster.
- an expression cluster identified herein includes MCP1, CD68, CTSB, OPN, and other genes encoding proteins usually associated with cells of the immune system. This expression cluster is referred to herein as the Immune cluster.
- an expression cluster identified herein includes CCNE2, CDC20, SKP2, CHK1, BRCA1, CSEL1 and other genes implicated in cell proliferation and regulation of the cell cycle. This expression cluster is referred to herein as the Proliferation/Cell Cycle cluster.
- RNA isolation, purification, primer extension and amplification are provided in various published journal articles (for example: T.E. Godfrey et al,. J. Molec. Diagnostics 2: 84-91 (2000 ); K. Specht et al., Am. J. Pathol. 158: 419-29 (2001 )).
- a representative process starts with cutting about 10 ⁇ m thick sections of paraffin-embedded tumor tissue samples. The RNA is then extracted, and protein and DNA are removed.
- RNA repair and/or amplification steps may be included, if necessary, and RNA is reverse transcribed using gene specific promoters followed by RT-PCR. Finally, the data are analyzed to identify the best treatment option(s) available to the patient on the basis of the characteristic gene expression pattern identified in the tumor sample examined, dependent on the predicted likelihood of cancer recurrence.
- An important aspect of the present invention is to use the measured expression of the MYBL2 gene by colon cancer tissue to provide prognostic information. For this purpose it is necessary to correct for (normalize away) both differences in the amount of RNA assayed and variability in the quality of the RNA used. Therefore, the assay typically measures and incorporates the expression of certain normalizing genes, including well known housekeeping genes, such as GAPDH and Cyp1. Alternatively, normalization can be based on the mean or median signal (Ct) of all of the assayed genes or a large subset thereof (global normalization approach). On a gene-by-gene basis, measured normalized amount of a patient tumor mRNA is compared to the amount found in a colon cancer tissue reference set.
- Ct mean or median signal
- the number (N) of colon cancer tissues in this reference set should be sufficiently high to ensure that different reference sets (as a whole) behave essentially the same way. If this condition is met, the identity of the individual colon cancer tissues present in a particular set will have no significant impact on the relative amounts of the genes assayed.
- the colon cancer tissue reference set consists of at least about 30, preferably at least about 40 different FPE colon cancer tissue specimens. Unless noted otherwise, normalized expression levels for each mRNA/tested tumor/patient will be expressed as a percentage of the expression level measured in the reference set. More specifically, the reference set of a sufficiently high number (e.g. 40) of tumors yields a distribution of normalized levels of each mRNA species.
- the level measured in a particular tumor sample to be analyzed falls at some percentile within this range, which can be determined by methods well known in the art.
- reference to expression levels of a gene assume normalized expression relative to the reference set although this is not always explicitly stated.
- PCR primers and probes are designed based upon intron sequences present in the gene to be amplified. Accordingly, the first step in the primer/probe design is the delineation of intron sequences within the genes. This can be done by publicly available software, such as the DNA BLAT software developed by Kent, W.J., Genome Res. 12(4):656-64 (2002 ), or by the BLAST software including its variations. Subsequent steps follow well established methods of PCR primer and probe design.
- PCR primer design The most important factors considered in PCR primer design include primer length, melting temperature (Tm), and G/C content, specificity, complementary primer sequences, and 3'-end sequence.
- optimal PCR primers are generally 17-30 bases in length, and contain about 20-80%, such as, for example, about 50-60% G+C bases. Tm's between 50 and 80 °C, e.g. about 50 to 70 °C are typically preferred.
- kits comprise agents, which may include gene-specific or gene-selective probes and/or primers, for quantitating the expression of the disclosed genes for predicting prognostic outcome or response to treatment.
- agents which may include gene-specific or gene-selective probes and/or primers, for quantitating the expression of the disclosed genes for predicting prognostic outcome or response to treatment.
- kits may optionally contain reagents for the extraction of RNA from tumor samples, in particular fixed paraffin-embedded tissue samples and/or reagents for RNA amplification.
- the kits may optionally comprise the reagent(s) with an identifying description or label or instructions relating to their use in the methods of the present invention.
- kits may comprise containers (including microtiter plates suitable for use in an automated implementation of the method), each with one or more of the various reagents (typically in concentrated form) utilized in the methods, including, for example, pre-fabricated microarrays, buffers, the appropriate nucleotide triphosphates (e.g., dATP, dCTP, dGTP and dTTP; or rATP, rCTP, rGTP and UTP), reverse transcriptase, DNA polymerase, RNA polymerase, and one or more probes and primers (e.g., appropriate length poly(T) or random primers linked to a promoter reactive with the RNA polymerase).
- nucleotide triphosphates e.g., dATP, dCTP, dGTP and dTTP; or rATP, rCTP, rGTP and UTP
- reverse transcriptase DNA polymerase
- RNA polymerase e.g., RNA polyme
- the methods of this disclosure when practiced for commercial diagnostic purposes generally produce a report or summary of the normalized expression levels of one or more of the selected genes.
- the methods will produce a report comprising a prediction of the clinical outcome of a subject diagnosed with colorectal cancer following surgical resection of said cancer.
- the methods and reports can further include storing the report in a database.
- the method can further create a record in a database for the subject and populate the record with data.
- the report is a paper report, in another embodiment the report is an auditory report, in another embodiment the report is an electronic record. It is contemplated that the report is provided to a physician and/or the patient.
- the receiving of the report can further include establishing a network connection to a server computer that includes the data and report and requesting the data and report from the server computer.
- the methods provided by the present invention may also be automated in whole or in part.
- the primary objective of this study was to determine whether there is a significant relationship between the expression of each of 757 amplicons identified in Table B and clinical outcome in stage II and stage III colon cancer patients who receive colon resection (surgery) without chemotherapy.
- NSABP Study C-01 "A Clinical Trial To Evaluate Postoperative Immunotherapy And Postoperative Systemic Chemotherapy In The Management Of Resectable Colon Cancer” or NSABP Study C-02: "A Protocol To Evaluate The Postoperative Portal Vein Infusion Of 5-Flourouracil And Heparin In Adenocarcinoma Of The Colon” Details of C-01 and C-02 can be found on the NSABP Website at the following URL:
- Tissue samples from the surgery only and surgery + postoperative BCG arms of NSABP C01 and from the surgery only arm of NSABP C02 surgery were combined into one sample set.
- 270 patient samples were available after application of exclusion criteria and used in the gene expression study disclosed herein. The overall demographic and clinical characteristics of the 270 included samples were similar to the original NSABP combined cohorts.
- cycle threshold (C T ) measurements obtained by RT-PCR were normalized relative to the mean expression of a set of six reference genes.
- the resulting reference-normalized expression measurements typically range from 0 to 15, where a one unit increase generally reflects a 2-fold increase in RNA quantity.
- Table A shows qRT-PCR probe and primer sequences for all genes included in the study described in the Example.
- Table B shows target amplicons for all genes included in the study described in the Example.
- Reference Gene set for the first analysis was CLTC, FZD6, NEDD8, RPLPO, RPS 13, UBB, UBC.
- Table 1A shows associations for those genes whose increased expression is predictive of shorter Recurrence-Free Interval (RFI) based on univariate proportional hazards analysis.
- Table 1B shows associations for those genes whose increased expression is predictive of longer Recurrence-Free Interval (RFI) based on univariate proportional hazards analysis.
- Table 2A shows associations for those genes whose increased expression is predictive of decreased rate of Overall Survival (OS) based on univariate proportional hazards analysis.
- Table 2B shows associations for those genes whose increased expression is predictive of increased rate of Overall Survival (OS) based on univariate proportional hazards analysis.
- Table 3A shows associations for those genes whose increased expression is predictive of decreased rate of Disease Free Survival (DFS) based on univariate proportional hazards analysis.
- Table 3B shows associations for those genes whose increased expression is predictive of increased rate of Disease Free Survival (DFS) based on univariate proportional hazards analysis.
- DFS Disease Free Survival
- Table 4A shows associations for those genes whose increased expression is predictive of shorter Distant Recurrence-Free Interval (DRFI) based on univariate proportional hazards analysis.
- DRFI Distant Recurrence-Free Interval
- Table 4B shows associations for those genes whose increased expression is predictive of longer Distant Recurrence-Free Interval (DRFI) based on univariate proportional hazards analysis.
- DRFI Distant Recurrence-Free Interval
- Table 5A shows associations between gene expression and RFI for those genes whose increased expression is predictive of shorter Recurrence-Free Interval (RFI), based on a multivanate analysis controlling for particular demographic and clinical characteristics of patients included in the analysis.
- RFI Recurrence-Free Interval
- Table 5B shows associations between gene expression and RFI for those genes whose increased expression is predictive of longer Recurrence-Free Interval (RFI), based on a multivanate analysis controlling for particular demographic and clinical characteristics of patients included in the analysis
- Table 6 shows genes for which an association between gene expression and clinical outcome was identified based on a nonlinear proportional hazards analysis, using a 2 degree-of-freedom natural spline.
- Table 7 shows all genes exhibiting an interaction (p-value ⁇ 0.05) with tumor stage
- Table 1A shows associations between clinical outcome and gene expression for those genes which demonstrated a Hazard Ratio>1.0 and for which p ⁇ 0.1 Univariate Cox Proportional Hazards Regression analysis was applied in combined Stage II (Duke's B) and Stage III (Duke's C) patients using RFI as the metric for clinical outcome.
- Table 1B shows associations between clinical outcome and gene expression for those genes which demonstrated a Hazard Ratio ⁇ 1.0 and for which p ⁇ 0.1. Univariate Cox Proportional Hazards Regression analysis was applied in combined Stage II (Duke's B) and Stage III (Duke's C) patients using RFI as the metric for clinical outcome Table 1B Gene Hazard Ratio P Value OfficialSymbol Accession Number ORC1L 0.42 0.0728 ORC1L NM_004153 HSPA8 0.62 0.0430 HSPA8 NM_006597 E2F1 0.64 0.0009 E2F1 NM_005225 RAD54L 0.65 0.0026 RAD54L NM_003579 RPLPO 0.67 0.0150 RPLPO NM_001002 BRCA1 0.68 0.0001 BRCA1 NM_007295 DHFR 0.69 0.0096 DHFR NM_000791 SLC25A3 0.69 0.0110 SLC25A3 NM_213611 PPM1D 0.71 0.0033 PPM1D
- Table 2A shows associations between clinical outcome and gene expression for those genes which demonstrated a Hazard Ratio>1.0 and for which p ⁇ 0.1. Univariate Cox Proportional Hazards Regression analysis was applied in combined Stage II (Duke's B) and Stage III (Duke's C) patients using OS as the metric for clinical outcome.
- Table 2B shows associations between clinical outcome and gene expression for those genes which demonstrated a Hazard Ratio ⁇ 1.0 and for which p ⁇ 0.1. Univariate Cox Proportional Hazards Regression analysis was applied in combined Stage II (Duke's B) and Stage III (Duke's C) patients using OS as the metric for clinical outcome Table 2B Gene Hazard Ratio P value OfficialSymbol Accession Number HSPA8 0.62 0.0145 HSPA8 NM_006597 SKP2 0.70 0.0010 SKP2 NM_005983 DHFR 0.74 0.0085 DHFR NM_000791 PRDX4 0.74 0.0197 PRDX4 NM_006406 RRM1 0.75 0.0162 RRM1 NM_001033 SLC25A3 0.75 0.0342 SLC25A3 NM_213611 RPLPO 0.75 0.0416 RPLP0 NM_001002 E2FI 0.78 0.0190 E2F1 NM_005225 SURV 0.79 0.0086 BIRC5 NM_
- Table 3A shows associations between clinical outcome and gene expression for those genes which demonstrated a Hazard Ratio>1.0 and for which p ⁇ 0.1.
- Univanate Cox Proportional Hazards Regression analysis was applied in combined Stage II (Duke's B) and Stage III (Duke's C) patients using DFS as the metric for clinical outcome Table 3A
- Gene Hazard Ratio P Value OfficialSymbol Accesssion Number ANXA2 1.74 ⁇ .0001 ANXA2 NM_004039 CYP3A4 1.69 0.0020 CYP3A4 NM_017460 RhoC 1.53 0.0009
- Table 3B shows associations between clinical outcome and gene expression for those genes which demonstrated a Hazard Ratio ⁇ 1.0 and for which p ⁇ 0.1 Univanate Cox Proportional Hazards Regression analysis was applied in combined Stage II (Duke's B) and Stage III (Duke's C) patients using DFS as the metric for clinical outcome.
- Table 4A shows associations between clinical outcome and gene expression for those genes which demonstrated a Hazard Ratio1.0 and for which p ⁇ 0.1. Univariate Cox Proportional Hazards Regression analysis was applied in combined Stage II (Duke's B) and Stage III (Duke's C) patients using DRFI as the metric for clinical outcome.
- Table 4B shows associations between clinical outcome and gene expression for those genes which demonstrated a Hazard Ratio ⁇ 1.0 and for which p ⁇ 0.1.
- Univanate Cox Proportional Hazards Regression analysis was apple in combined Stage II (Duke's B) and Stage III (Duke's C) patients using DRFI as the metric for clinical outcome.
- Table 5A shows associations between gene expression and RFI, controlling for particular demographic and clinical characteristics of patients included in the analysis. All genes are listed whose expression correlates with RFI (p ⁇ 0.1) and which demonstrated a Hazard Ratio >1 in a multivariate analysis including the following variables: tumor location, surgery, tumor grade, nodes examined, and number of positive nodes.
- Table 5B shows associations between gene expression and RFI, controlling for particular demographic and clinical characteristics of patients included in the analysis. All genes are listed whose expression correlates with RFI (p ⁇ 0.1) and which demonstrated a Hazard Ratio ⁇ 1 in a multivariate analysis including the following variables: tumor location, surgery, tumor grade, nodes examined, and number of positive nodes Table 5B Gene HR LR Chl-Square DF P-Value BFGF 0.46674 6.95233 1 0.00837 FasI 0.47324 4.08714 1 0.04321 KIRK1 0.63331 10.28820 1 0.00134 DHFR 0.64947 7.64434 1 0.00570 BRCA1 0.65247 15.21566 1 0.00010 SLC25A3 0.67480 5.72977 1 0.01668 RAD54L 0.68215 5.38684 1 0.02029 PPMID 0.67777 10:02879 1 0.00154 CD80 0.69347 8.70087 1 0.00318 ATPSA1 0.70467
- Table 6 shows associations between gene expression and clinical outcome based on a nonlinear proportional hazards analysis, using a 2 degree-of-freedom natural spline. All genes are listed which demonstrated a departure from a strictly linear relationship (p ⁇ 0.05) with RFI in combined Stage II (Duke's B) and Stage III (Duke's C) patients
- the relationship between gene expression and RFI was not constant throughout the observed range of expression values in the study, e g. increases in gene expression may have been related to increases in duration of RFI in one portion of the observed range and with decreases in duration of RFI in a different portion of the range.
- Table 7 shows all genes exhibiting an interaction (p-value ⁇ 0.05) with tumor stage The data were modeled using a proportional hazards model of RFI with gene expression, tumor stage, and their interaction as predictors Table 7 Gene HR Stage II HR Stage III P-value for Interaction ICAM2 1.49 0.68 0.0019 CD24 1.26 0.84 0.0054 PRDX6 2.29 0.73 0.0058 HSD17B2 0.62 1.29 0.0072 ALCAM 1.61 0.94 0.0088 SIR2 2.02 1.09 0.0089 NUFIP1 1.32 0.79 0.0093 EMR3 2.14 0.57 0.0127 CDC20 0.56 0.98 0.0130 MT3 1.37 0.79 0.0134 CLTC 1.80 0.71 0.0144 CYR61 1.73 1.10 0.0145 WIF 1.34 0.78 0.0195 TFF3 1.23 0.90 0.0209 SOS1 1.46 0.79 0.0287 TMSB4X 1.34 0.74 0.0293 CENPE 3.05 0.85 0.0330 CDH11 1.49 0.96 0.0339 CAPG 0.90 1.50
- Reference Gene Set for the second analysis was ATP5E, CLTC, GPX1, NEDD8, PGK1, UBB.
- Table 1.2A shows associations for those genes whose increased expression is predictive of shorter Recurrence-Free Interval (RFI) based on univariate proportional hazards analysis.
- Table 1.2B shows associations for those genes whose increased expression is predictive of longer Recurrence-Free Interval (RFI) based on univariate proportional hazards analysis.
- Table 2.2A shows associations for those genes whose increased expression is predictive of decreased rate of Overall Survival (OS) based on univariate proportional hazards analysis.
- Table 2.2B shows associations for those genes whose increased expression is predictive of increased rate of Overall Survival (OS) based on univariate proportional hazards analysis.
- Table 3.2A shows associations for those genes whose increased expression is predictive of decreased rate of Disease Free Survival (DFS) based on univariate proportional hazards analysis.
- Table 3.2B shows associations for those genes whose increased expression is predictive of increased rate of Disease Free Survival (DFS) based on univariate proportional hazards analysis.
- DFS Disease Free Survival
- Table 4.2A shows associations for those genes whose increased expression is predictive of shorter Distant Recurrence-Free Interval (DRFI) based on univariate proportional hazards analysis.
- DRFI Distant Recurrence-Free Interval
- Table 4.2B shows associations for those genes whose increased expression is predictive of longer Distant Recurrence-Free Interval (DRFI) based on univariate proportional hazards analysis.
- DRFI Distant Recurrence-Free Interval
- Table 5.2A shows associations between gene expression and RFI for those genes whose increased expression is predictive of shorter Recurrence-Free Interval (RFI), based on a multivariate analysis controlling for particular demographic and clinical characteristics of patients included in the analysis.
- RFI Recurrence-Free Interval
- Table 5 2B shows associations between gene expression and RFI for those genes whose increased expression is predictive of longer Recurrence-Free Interval (RFI), based on a multivanate analysis controlling for particular demographic and clinical characteristics of patients included in the analysis.
- RFI Recurrence-Free Interval
- Table 6.2 shows genes for which an association between gene expression and clinical outcome was identified based on a nonlinear proportional hazards analysis, using a 2 degree-of freedom natural spline.
- Table 7 2 shows all genes exhibiting an interaction (p-value ⁇ 0.05) with tumor stage
- Table 1 2A shows associations between clinical outcome and gene expression for those genes which demonstrated a Hazard Ratio>1.0 and for which p ⁇ 0.1 Univanate Cox Proportional Hazards Regression analysis was applied in combined Stage II (Duke's B) and Stage III (Duke's C) patients using RFI as the metric for clinical outcome Gene Hazard Ratio P Value Official Symbol Accession Number RARB 2.22 0.0294 RARB NM_016152 ITGB1 2.04 0.0002 ITGB1 NM_002211 ANXA2 1.78 0.0003 ANXA2 NM_004039 CYP3A4 1.68 0.0075 CYP3A4 NM_017460 COX2 1.64 0.0604 PTGS2 NM_000963 KRAS2 1.62 0.0064 KRAS NM_004985 TJP1 1.58 0.0751 TJP1 NM_003257 KIAA0125 1.58 0.0889 KIAA0125 NM_014792 RhoB 1.57 0.0002
- Table 1 2B shows associations between clinical outcome and gene expression for those genes which demonstrated a Hazard Ratio ⁇ 1.0 and for which p ⁇ 0.1. Univariate Cox Proportional Hazards Regression analysis was applied in combmed Stage II (Duke's B) and Stage III (Duke's C) patients using RFI as the metric for clinical outcome.
- Table 2.2A shows associations between clinical outcome and gene expression for those genes which demonstrated a Hazard Ratio>1.0 and for which p ⁇ 0.1 Univariate Cox Proportional Hazards Regression analysis was applied in combined Stage II (Duke's B) and Stage III (Duke's C) patients using OS as the metric for clinical outcome Gene Hazard Ratio P Value Official Symbol Accession Number RhoC 1.66 00002 RHOC NM_175744 ITGB1 1.59 0.0049 ITGB1 NM_002211 ANXA2 1.58 0.0004 ANXA2 NM_004039 CYP3A4 1.49 0.0114 CYP3A4 NM_017460 p21 1.49 ⁇ .0001 CDKN1A NM_000389 HMLH 1.42 0.0555 MLH1 NM_000249 VEGFC 1.41 0.0095 VEGFC NM_005429 TGFBR1 1.40 0.0113 TGFBR1 NM_004612 UBC 1.38 0.0013 UBC NM_
- Table 2.2B shows associations between clinical outcome and gene expression for those genes which demonstrated a Hazard Ratio ⁇ 1.0 and for which p ⁇ 0.1.
- Univariate Cox Proportional Hazards Regression analysis was applied in combined Stage II (Duke's B) and Stage III (Duke's C) patients using OS as the metric for clinical outcome Gene Hazard Ratio P Value Official Symbol Accession Number ORC1L 0.52 0.0895 ORC1L NM_004153 HSPA8 0.64 0.0164 HSPA8 NM_006597 SKP2 0.71 0.0012 SKP2 NM_005983 PRDX4 0.74 0.0202 PRDX4 NM_006406 DHFR 0.76 0.0111 DHFR NM_000791 FGF18 0.76 0.0915 FGF18 NM_003862 SLC25A3 0.76 0.0391 SLC25A3 NM_213611 RRM1 0.77 0.0218 RRM1 NM_001033 E2F1 0.78 0.0180 E2F1
- Table 3.2A shows associations between clinical outcome and gene expression for those genes which demonstrated a Hazard Ratio> 1 0 and for which p ⁇ 0.1.
- Univariate Cox Proportional Hazards Regression analysis was applied in combined Stage II (Duke's B) and Stage III (Duke's C) patients using DFS as the metric for clinical outcome Gene Hazard Ration P Value Official Symbol Accession Number ANXA2 1.67 ⁇ .0001 ANXA2 NM_004039 CYP3A4 1.59 0.0035 CYP3A4 NM_017460 RhoC 1.52 0.0010 RHOC NM_175744 TJP1 1.44 0.0951 TJP1 NM_003257 HB-EGF 1.39 0.0023 HBEGF NM_001945 p21 1.39 0.0006 CDKN1A NM_000389 HMLH 1.37 0 .
- Table 3.2B shows associations between clinical outcome and gene expression for those genes which demonstrated a Hazard Ratio ⁇ 1 0 and for which p ⁇ 0.1.
- Univanate Cox Proportional Hazards Regression analysis was applied in combined Stage II (Duke's B) and Stage III (Duke's C) patients using DFS as the metric for clinical outcome Gene Hazard Ratio P Value Official Symbol Accession Number HSPA8 0.72 0.0604 HSPA8 NM_006597 SLC25A3 0.73 0.0126 SLC25A3 NM_213611 E2F1 0.73 0.0019 E2F1 NM_005225 IFIT1 0.74 0.0820 IFIT1 NM_001548 PPM1D 0.74 0.0007 PPM1D MM_003620 SKP2 0.75 0.0049 SKP2 NM_005983 RRM1 0.78 0.0224 RRM1 NM_001033 DDB1 0.79 0.0720 DDB1 NM_001923 NPM1 0.79 0.0255 NPM1
- Table 4 2A shows associations between clinical outcome and gene expression for those genes which demonstrated a Hazard Ratio>1.0 and for which p ⁇ 0.1 Univariate Cox Proportional Hazards Regression analysis was applied in combined Stage II (Duke's B) and Stage III (Duke's C) patients using DRFI as the metric for clinical outcome Gene Hazard Ratio P Value Official Symbol Accession Number ALDOA 3.21 0.0189 ALDOA NM_000034 DCK 2.60 0.0248 DCK NM_000788 ITGB1 2.58 0.0002 ITGB1 NM_002211 COX2 2.16 0.0198 PTGS2 NM_000963 TJP1 2.10 0.0122 TJP1 NM_003257 STAT3 1.87 0.0148 STAT3 NM_003150 ANXA5 1.83 0.0043 ANXA5 NM_001154 GHI BRAF mut4 1.82 0.0024 GHI_BRAF_mut4 TIMP1 1.80 ⁇ .0001 TIMP1 NM_003254
- Table 4 2B shows associations between clinical outcome and gene expression for those genes which demonstrated a Hazard Ratio ⁇ 1 0 and for which p ⁇ 0.1 Univariate Cox Proportional Hazards Regression analysis was applied in combined Stage II (Duke's B) and Stage III (Duke's C) patients using DRFI as the metric for clinical outcome.
- Table 5 2A shows associations between gene expression and RFI, controlling for particular demographic and clinical characteristics of patients included in the analysis All genes are listed whose expression correlates with RFI (p ⁇ 0.1) and which demonstrated a Hazard Ratio >1 in a multivanate analysis including the following variables: tumor location, year of surgery, tumor grade, treatment protocol (C-01 or C-02), BCG treatment (yes or no), and classification of patients according to lymph node status as follows: 0 positive nodes and ⁇ 12 nodes examined, 0 positive nodes and ⁇ 12 nodes examined, 1-3 positive nodes, and ⁇ 4 positive nodes.
- Table 5 2B shows associations between gene expression and RFI, controlling for particular demographic and clinical characteristics of patients included in the analysis. All genes are listed whose expression correlates with RFI (p ⁇ 0.1) and which demonstrated a Hazard Ratio ⁇ 1 in a multivanate analysis including the following variables: tumor location, year of surgery, tumor grade, treatment protocol (C-01 or C-02), BCG treatment (yes or no), and classification of patients according to lymph node status as follows. 0 positive nodes and ⁇ 12 nodes examined, 0 positive nodes and ⁇ 12 nodes examined, 1-3 positive nodes, and ⁇ 4 positive nodes.
- Table 6 2 shows associations between gene expression and clinical outcome based on a nonlinear proportional hazards analysis, using a 2 degree-of-freedom natural spline. All genes are listed which demonstrated a departure from a strictly linear relationship (p ⁇ 0.05) with RFI in combined Stage II (Duke's B) and Stage III (Duke's C) patients. The relationship between gene expression and RFI was not constant throughout the observed range of expression values in the study, e g increases in gene expression may have been related to increases in duration of RFI in one portion of the observed range and with decreases in duration of RFI in a different portion of the range.
- Table 7.2 shows all genes exhibiting an interaction (p-value ⁇ 0 1) with tumor stage
- the data were modeled using a proportional hazards model of RFI with gene expression, tumor stage, and their interaction as predictors. Patients who had 0 positive nodes but ⁇ 12 nodes examined were excluded from these analyses.
Description
- The present invention provides a gene, MYBL2, the expression levels of which are useful for predicting outcome of colorectal cancer.
- Colorectal cancer is the number two cause of cancer-related death in the United States and the European Union, accounting for 10% of all cancer-related deaths. Although colon cancer and rectal cancer may represent identical or similar disease at the molecular level, surgery for rectal cancer is complicated by anatomical issues. Possibly for this reason, the rate of local recurrence for rectal cancer is significantly higher than for colon cancer, and so the treatment approach is significantly different. Approximately 100,000 colon cancers are newly diagnosed each year in the United States, with about 65% of these being diagnosed as stage II/III colorectal cancer as discussed below.
- Refining a diagnosis of colorectal cancer involves evaluating the progression status of the cancer using standard classification criteria. Two classification systems have been widely used in.colorectal cancer, the modified Duke's or Astler-Coller staging system (Stages A-D) (Astler VB, Coller FA., Ann Surg 1954;139:846-52), and more recently TNM staging (Stages I-IV) as developed by the American Joint Committee on Cancer (AJCC Cancer Staging Manual, 6th Edition, Springer-Verlag, New York, 2002). Both systems apply measures of the spread of the primary tumor through layers of colon or rectal wall to the adjacent organs, lymph nodes and distant sites to evaluate tumor progression. Estimates of recurrence risk and treatment decisions in colon cancer are currently based primarily on tumor stage.
- There are approximately 33,000 newly diagnosed Stage II colorectal cancers each year in the United States. Nearly all of these patients are treated by surgical resection of the tumor and, in addition, about 40% are currently treated with chemotherapy based on 5-fluorouracil (5-FU). The decision whether to administer adjuvant chemotherapy is not straightforward. The five-year survival rate for Stage II colon cancer patients treated with surgery alone is approximately 80%. Standard adjuvant treatment with 5-FU + leucovorin (folinic acid) demonstrates an absolute benefit of only 2-4% in this population and shows significant toxicity, including a rate of toxic death from chemotherapy as high as 1%. Thus, a large number of patients receive toxic therapy from which only a few benefit.
- A test capable of prognosis after surgery in Stage II colorectal cancer patients would be of great benefit for guiding treatment decisions for these patients.
- The benefit of chemotherapy in Stage III colon cancer is more evident than it is in Stage II. A large proportion of the 31,000 patients annually diagnosed with Stage III colon cancer receive 5-FU-based adjuvant chemotherapy, and the absolute benefit of 5-FU + leucovorin in this setting is around 18-24%, depending on the particular regimen employed. Current standard-of-care chemotherapy treatment for Stage III colon cancer patients (5-FU + leucovorin or 5-FU + leucovorin + oxaliplatin) is moderately effective, achieving an improvement in 5-yr survival rate from about 50% (surgery alone) to about 65% (5-FU + leucovorin) or 70% (5-FU + leucovorin + oxaliplatin). Treatment with 5-FU + leucovorin alone or in combination with oxaliplatin is accompanied by a range of adverse side-effects, including toxic death in approximately 1% of patients treated. Furthermore, the three-year survival rate for Stage III colon cancer patients treated with surgery alone is about 47% and it has not been established whether a subset of Stage III patients exists for which recurrence risk resembles that observed for Stage II patients.
- A test that would quantify recurrence risk based on molecular markers rather than tumor stage alone would be useful for identifying a subset of Stage III patients that may not require adjuvant therapy to achieve acceptable outcomes.
- Staging of rectal tumors is carried out based on similar criteria as for colon tumor staging, although there are some differences resulting for example from differences in the arrangement of the draining lymph nodes. As a result, Stage II/III rectal tumors bear a reasonable correlation to Stage II/III colon tumors as to their state of progression. As noted above, the rate of local recurrence and other aspects of prognosis differ between rectal cancer and colon cancer, and these differences may arise from difficulties in accomplishing total resection of rectal tumors. Nevertheless, there is no compelling evidence that there is a difference between colon cancer and rectal cancer as to the molecular characteristics of the respective tumors. Prognostic tests for rectal cancer would have utility similar in nature as described for colon cancer prognostic tests and the same prognostic markers might well apply to both cancer types.
- In addition, there is a clear need for safer and more efficacious drugs for the treatment of colon cancer. Current chemotherapy for colon cancer is based on the relatively crude approach of administering drugs that generally interfere with the proliferation of dividing cells. Recent clinical studies have demonstrated the feasibility of developing improved drugs based on detailed molecular understanding of particular cancer types and subtypes. For example, the HER2 (ERBB2) gene is amplified and the HER2 protein is overexpressed in a subset of breast cancers; HERCEPTIN® (Genentech, Inc.) a drug developed to target HER2, is indicated only for those patients who have an higher than normal copy number of HER2 as demonstrated by fluorescent in situ hybridization (FISH) or a high level of HER2 expression as demonstrated by immunohisiochemistry. Genes, whose expression is associated with clinical outcome in human cancer patients, are a valuable resource for selection of targets for drug compound screening and further drug development activities.
- Molecularly targeted drugs, such as HERCEPTIN® (Genentech, Inc.) can be developed and commercialized in conjunction with a diagnostic test that can identify patients who are likely to benefit from the drug; one aspect of such a test is the identification of those patients likely to have a positive outcome without any treatment other than surgery. For example, 80% of Stage II colon cancer patients survive five years or more when treated with surgery alone. Gene markers that identify patients more likely to be among the 20% whose cancer will recur without additional treatment are useful in drug development, for example in screening patients for inclusion in a clinical trial.
- According to a first aspect of the present invention, there is provided a method of predicting clinical outcome for a human subject diagnosed with colorectal cancer following surgical resection of said cancer as specified in claim 1.
- According to a second aspect of the present invention, there is provided a method of determining whether a human subject diagnosed with colorectal cancer should be subjected to further therapy following surgical resection of the cancer as specified in claim 10.
- It is further contemplated that the therapy is chemotherapy and/or radiation therapy.
- The clinical outcome of the method of the invention may be expressed, for example, in terms of Recurrence-Free Interval (RFI), Overall Survival (OS), or Disease-Free Survival (DFS).
- In one embodiment, the cancer is Dukes B (stage II) or Dukes C (stage III) colorectal cancer.
- Determining the expression level of one or more genes may be obtained, for example, by a method of gene expression profiling. The method of gene expression profiling may be, for example, a PCR-based method.
- The expression level may be normalized relative to the expression level of an RNA transcript of one or more reference genes.
- The method may further comprise the step of creating a report summarizing said prediction.
- It is contemplated that for every increment of an increase in the level of one or more predictive RNA transcripts or their expression products, the patient is identified to show an incremental increase in clinical outcome.
- The determination of expression levels may occur more than one time. The determination of expression levels may occur before the patient is subjected to any therapy following surgical resection.
-
Figure 1 shows a dendrogram representing the expression clustering of 142 genes that were statistically significantly related to recurrence-free interval (Tables 1.2A and 1.2B) in the univariate .Cox proportional hazards analysis. The cluster analysis used the unweighted pair-group average amalgamation method and 1-Pearson r as the distance measure. The identities of particular genes in clusters of interest are indicated along the x-axis. - Unless defined otherwise, technical and scientific terms used herein have the same meaning as commonly understood by one of ordinary skill in the art to which this invention belongs. Singleton et al., Dictionary of Microbiology and Molecular Biology 2nd ed., J. Wiley & Sons (New York, NY 1994), and March, Advanced Organic Chemistry Reactions, Mechanisms and Structure 4th ed., John Wiley & Sons (New York, NY 1992), provide one skilled in the art with a general guide to many of the terms used in the present application.
- One skilled in the art will recognize many methods and materials similar or equivalent to those described herein, which could be used in the practice of the present invention. Indeed, the present invention is in no way limited to the methods and materials described but is limited by the appended claims. For purposes of the present invention, the following terms are defined below.
- The term "tumor," as used herein, refers to all neoplastic cell growth and proliferation, whether malignant or benign, and all pre-cancerous and cancerous cells and tissues.
- The terms "cancer" and "cancerous" refer to or describe the physiological condition in mammals that is typically characterized by unregulated cell growth. Examples of cancer include, but are not limited to, breast cancer, ovarian cancer, colon cancer, lung cancer, prostate cancer, hepatocellular cancer, gastric cancer, pancreatic cancer, cervical cancer, liver cancer, bladder cancer, cancer of the urinary tract, thyroid cancer, renal cancer, carcinoma, melanoma, and brain cancer.
- The "pathology" of cancer includes all phenomena that compromise the well-being of the patient. This includes, without limitation, abnormal or uncontrollable cell growth, metastasis, interference with the normal functioning of neighboring cells, release of cytokines or other secretory products at abnormal levels, suppression or aggravation of inflammatory or immunological response, neoplasia, premalignancy, malignancy, invasion of surrounding or distant tissues or organs, such as lymph nodes, etc.
- The term "colorectal cancer" is used in the broadest sense and refers to (1) all stages and all forms of cancer arising from epithelial cells of the large intestine and/or rectum and/or (2) all stages and all forms of cancer affecting the lining of the large intestine and/or rectum. In the staging systems used for classification of colorectal cancer, the colon and rectum are treated as one organ.
- According to the tumor, node, metastatis (TNM) staging system of the American Joint Committee on Cancer (AJCC) (Greene et al. (eds.), AJCC Cancer Staging Manual. 6th Ed. New York, NY: Springer; 2002), the various stages of colorectal cancer are defined as follows:
- Tumor: T1: tumor invades submucosa; T2: tumor invades muscularis propria; T3: tumor invades through the muscularis propria into the subserose, or into the pericolic or perirectal tissues; T4: tumor directly invades other organs or structures, and/or perforates.
- Node: N0: no regional lymph node metastasis; N1: metastasis in 1 to 3 regional lymph nodes; N2: metastasis in 4 or more regional lymph nodes.
- Metastasis:M0: mp distant metastasis; M1: distant metastasis present.
- Stage groupings: Stage I: T1 N0 M0; T2 N0 M0; Stage II: T3 N0 M0; T4 N0 M0; Stage III: any T, N1-2; M0; Stage IV: any T, any N, M1.
- According to the Modified Duke Staging System, the various stages of colorectal cancer are defined as follows:
- Stage A: the tumor penetrates into the mucosa of the bowel wall but not further. Stage B: tumor penetrates into and through the muscularis propria of the bowel wall; Stage C: tumor penetrates into but not through muscularis propria of the bowel wall, there is pathologic evidence of colorectal cancer in the lymph nodes; or tumor penetrates into and through the muscularis propria of the bowel wall, there is pathologic evidence of cancer in the lymph nodes; Stage D: tumor has spread beyond the confines of the lymph nodes, into other organs, such as the liver, lung or bone.
- Prognostic factors are those variables related to the natural history of colorectal cancer, which influence the recurrence rates and outcome of patients once they have developed colorectal cancer. Clinical parameters that have been associated with a worse prognosis include, for example, lymph node involvement, , and high grade tumors. Prognostic factors are frequently used to categorize patients into subgroups with different baseline relapse risks.
- The term "prognosis" is used herein to refer to the prediction of the likelihood of cancer-attributable death or progression, including recurrence, metastatic spread, and drug resistance, of a neoplastic disease, such as colon cancer.
- The term "prediction" is used herein to refer to the likelihood that a patient will have a particular clinical outcome, whether positive or negative, following surgical removal of the primary tumor. The predictive methods of the present invention can be used clinically to make treatment decisions by choosing the most appropriate treatment modalities for any particular patient. The predictive methods of the present invention are valuable tools in predicting if a patient is likely to respond favorably to a treatment regimen, such as surgical intervention. The prediction may include prognostic factors.
- The term "positive clinical outcome" means an improvement in any measure of patient status, including those measures ordinarily used in the art, such as an increase in the duration of Recurrence-Free interval (RFI), an increase in the time of Overall Survival (OS), an increase in the time of Disease-Free Survival (DFS), an increase in the duration of Distant Recurrence-Free Interval (DRFI), and the like. An increase in the likelihood of positive clinical outcome corresponds to a decrease in the likelihood of cancer recurrence.
- The term "risk classification" means the level of risk or the prediction that a subject will experience a particular clinical outcome. A subject may be classified into a risk group or classified at a level of risk based on the predictive methods of the present invention. A "risk group" is a group of subjects or individuals with a similar level of risk for a particular clinical outcome.
- The term "long-term" survival is used herein to refer to survival for at least 3 years, more preferably for at least 5 years.
- The term "Recurrence-Free Interval (RFI)" is used herein to refer to time in years to first colon cancer recurrence censoring for second primary cancer as a first event or death without evidence of recurrence.
- The term "Overall Survival (OS)" is used herein to refer to time in years from surgery to death from any cause.
- The term "Disease-Free Survival (DFS)" is used herein to refer to time in years to colon cancer recurrence or death from any cause.
- The term "Distant Recurrence-Free Interval (DRFI)" is used herein to refer to the time (in years) from surgery to the first anatomically distant cancer recurrence.
- The calculation of the measures listed above in practice may vary from study to study depending on the definition of events to be either censored or not considered.
- The term "microarray" refers to an ordered arrangement of hybridizable array elements, preferably polynucleotide probes, on a substrate.
- The term "polynucleotide," when used in singular or plural, generally refers to any polyribonucleotide or polydeoxribonucleotide, which may be unmodified RNA or DNA or modified RNA or DNA. Thus, for instance, polynucleotides as defined herein include, without limitation, single- and double-stranded DNA, DNA including single- and double-stranded regions, single- and double-stranded RNA, and RNA including single- and double-stranded regions, hybrid molecules comprising DNA and RNA that may be single-stranded or, more typically, double-stranded or include single- and double-stranded regions. In addition, the term "polynucleotide" as used herein refers to triple-stranded regions comprising RNA or DNA or both RNA and DNA. The strands in such regions may be from the same molecule or from different molecules. The regions may include all of one or more of the molecules, but more typically involve only a region of some of the molecules. One of the molecules of a triple-helical region often is an oligonucleotide. The term "polynucleotide" specifically includes cDNAs. The term includes DNAs (including cDNAs) and RNAs that contain one or more modified bases. Thus, DNAs or RNAs with backbones modified for stability or for other reasons are "polynucleotides" as that term is intended herein. Moreover, DNAs or RNAs comprising unusual bases, such as inosine, or modified bases, such as tritiated bases, are included within the term "polynucleotides" as defined herein. In general, the term polynucleotide" embraces all chemically, enzymatically and/or metabolically modified forms of unmodified polynucleotides, as well as the chemical forms of DNA and RNA characteristic of viruses and cells, including simple and complex cells.
- The term "oligonucleotide" refers to a relatively short polynucleotide, including, without limitation, single-stranded deoxyribonucleotides, single- or double-stranded ribonucleotides, RNA:DNA hybrids and double-stranded DNAs. Oligonucleotides, such as single-stranded DNA probe oligonucleotides, are often synthesized by chemical methods, for example using automated oligonucleotide synthesizers that are commercially available. However, oligonucleotides can be made by a variety of other methods, including in vitro recombinant DNA-mediated techniques and by expression of DNAs in cells and organisms.
- The terms "differentially expressed gene," "differential gene expression" and their synonyms, which are used interchangeably, refer to a gene whose expression is activated to a higher or lower level in a subject suffering from a disease, specifically cancer, such as colon cancer, relative to its expression in a normal or control subject. The terms also include genes whose expression is activated to a higher or lower level at different stages of the same disease. It is also understood that a differentially expressed gene may be either activated or inhibited at the nucleic acid level or protein level, or may be subject to alternative splicing to result in a different polypeptide product. Such differences may be evidenced by a change in mRNA levels, surface expression, secretion or other partitioning of a polypeptide, for example. Differential gene expression may include a comparison of expression between two or more genes or their gene products, or a comparison of the ratios of the expression between two or more genes or their gene products, or even a comparison of two differently processed products of the same gene, which differ between normal subjects and subjects suffering from a disease, specifically cancer, or between various stages of the same disease. Differential expression includes both quantitative, as well as qualitative, differences in the temporal or cellular expression pattern in a gene or its expression products among, for example, normal and diseased cells, or among cells which have undergone different disease events or disease stages. For the purpose of this invention, "differential gene expression" is considered to be present when there is at least an about two-fold, preferably at least about four-fold, more preferably at least about six-fold, most preferably at least about ten-fold difference between the expression of a given gene in normal and diseased subjects, or in various stages of disease development in a diseased subject.
- The term "over-expression" with regard to an RNA transcript is used to refer to the level of the transcript determined by normalization to the level of reference mRNAs, which might be all measured transcripts in the specimen or a particular reference set of mRNAs.
- The phrase "gene amplification" refers to a process by which multiple copies of a gene or gene fragment are formed in a particular cell or cell line. The duplicated region (a stretch of amplified DNA) is often referred to as "amplicon." Usually, the amount of the messenger RNA (mRNA) produced, i.e., the level of gene expression, also increases in the proportion of the number of copies made of the particular gene expressed.
- "Stringency" of hybridization reactions is readily determinable by one of ordinary skill in the art, and generally is an empirical calculation dependent upon probe length, washing temperature, and salt concentration. In general, longer probes require higher temperatures for proper annealing, while shorter probes need lower temperatures. Hybridization generally depends on the ability of denatured DNA to reanneal when complementary strands are present in an environment below their melting temperature. The higher the degree of desired homology between the probe and hybridizable sequence, the higher the relative temperature which can be used. As a result, it follows that higher relative temperatures would tend to make the reaction conditions more stringent, while lower temperatures less so. For additional details and explanation of stringency of hybridization reactions, see Ausubel et al., Current Protocols in Molecular Biology, Wiley Interscience Publishers, (1995).
- "Stringent conditions" or "high stringency conditions", as defined herein, typically: (1) employ low ionic strength and high temperature for washing, for example 0.015 M sodium chloride/0.0015 M sodium citrate/0.1% sodium dodecyl sulfate at 50°C; (2) employ during hybridization a denaturing agent, such as formamide, for example, 50% (v/v) formamide with 0.1% bovine serum albumin/0.1% Ficoll/0.1% polyvinylpyrrolidone/50mM sodium phosphate buffer at pH 6.5 with 750 mM sodium chloride, 75 mM sodium citrate at 42°C; or (3) employ 50% formamide, 5 x SSC (0.75 M NaCl, 0.075 M sodium citrate), 50 mM sodium phosphate (pH 6.8), 0.1% sodium pyrophosphate, 5 x Denhardt's solution, sonicated salmon sperm DNA (50 µg/ml), 0.1% SDS, and 10% dextran sulfate at 42°C, with washes at 42°C in 0.2 x SSC (sodium chloride/sodium citrate) and 50% formamide, followed by a high-stringency wash consisting of 0.1 x SSC containing EDTA at 55°C.
- "Moderately stringent conditions" may be identified as described by Sambrook et al., Molecular Cloning: A Laboratory Manual, New York: Cold Spring Harbor Press, 1989, and include the use of washing solution and hybridization conditions (e.g., temperature, ionic strength and %SDS) less stringent that those described above. An example of moderately stringent conditions is overnight incubation at 37°C in a solution comprising: 20% formamide, 5 x SSC (150 mM NaCl, 15 mM trisodium citrate), 50 mM sodium phosphate (pH 7.6), 5 x Denhardt's solution, 10% dextran sulfate, and 20 mg/ml denatured sheared salmon sperm DNA, followed by washing the filters in 1 x SSC at about 37-50°C. The skilled artisan will recognize how to adjust the temperature, ionic strength, etc. as necessary to accommodate factors such as probe length and the like.
- In the context of the present invention, reference to "at least one," "at least two," "at least five," etc. of the genes listed in any particular gene set means any one or any and all combinations of the genes listed.
- The term "node negative" cancer, such as "node negative" colon cancer, is used herein to refer to cancer that has not spread to the lymph nodes.
- The terms "splicing" and "RNA splicing" are used interchangeably and refer to RNA processing that removes introns and joins exons to produce mature mRNA with continuous coding sequence that moves into the cytoplasm of an eukaryotic cell.
- In theory, the term "exon" refers to any segment of an interrupted gene that is represented in the mature RNA product (B. Lewin. Genes IV Cell Press, Cambridge Mass. 1990). In theory the term "intron" refers to any segment of DNA that is transcribed but removed from within the transcript by splicing together the exons on either side of it. Operationally, exon sequences occur in the mRNA sequence of a gene as defined by Ref. SEQ ID numbers. Operationally, intron sequences are the intervening sequences within the genomic DNA of a gene, bracketed by exon sequences and having GT and AG splice consensus sequences at their 5' and 3' boundaries.
- The term "expression cluster" is used herein to refer to a group of genes which demonstrate similar expression patterns when studied within samples from a defined set of patients. As used herein, the genes within an expression cluster show similar expression patterns when studied within samples from patients with Stage II and/or Stage III cancers of the colon and/or rectum.
- The practice of the present invention will employ, unless otherwise indicated, conventional techniques of molecular biology (including recombinant techniques), microbiology, cell biology, and biochemistry, which are within the skill of the art. Such techniques are explained fully in the literature, such as, "Molecular Cloning: A Laboratory Manual", 2nd edition (Sambrook et al., 1989); "Oligonucleotide Synthesis" (M.J. Gait, ed., 1984); "Animal Cell Culture" (R.I. Freshney, ed., 1987); "Methods in Enzymology" (Academic Press, Inc.); "handbook of Experimental Immunology", 4th edition (D.M. Weir & C.C. Blackwell, eds., Blackwell Science Inc., 1987); "Gene Transfer Vectors for Mammalian Cells" (J.M. Miller & M.P. Calos, eds., 1987); "Current Protocols in Molecular Biology" (F.M. Ausubel et al., eds., 1987); and "PCR: The Polymerase Chain Reaction", (Mullis et al., eds., 1994).
- Based on evidence of differential expression of RNA transcripts in normal and cancer cells, the present disclosure provides prognostic gene markers for colorectal cancer. Thus, in a particular aspect, the disclosure provides prognostic gene markers of Stage II and/or Stage III colorectal cancer, including markers that are specifically prognostic to the outcome of either Stage II or Stage III disease and those that have prognostic value at both stages, reflecting underlying differences in tumor cells in the two stages and/or in the extent of tumor progression. The prognostic markers and associated information provided by the present disclosure allow physicians to make more intelligent treatment decisions, and to customize the treatment of colorectal cancer to the needs of individual patients, thereby maximizing the benefit of treatment and minimizing the exposure of patients to unnecessary treatments, which do not provide any significant benefits and often carry serious risks due to toxic side-effects.
- Disruptions in the normal functioning of various physiological processes, including proliferation, apoptosis, angiogenesis and invasion, have been implicated in the pathology in cancer. The relative contribution of dysfunctions in particular physiological processes to the pathology of particular cancer types is not well characterized. Any physiological process integrates the contributions of numerous gene products expressed by the various cells involved in the process. For example, tumor cell invasion of adjacent normal tissue and intravasation of the tumor cell into the circulatory system are effected by an array of proteins that mediate various cellular characteristics, including cohesion among tumor cells, adhesion of tumor cells to normal cells and connective tissue, ability of the tumor cell first to alter its morphology and then to migrate through surrounding tissues, and ability of the tumor cell to degrade surrounding connective tissue structures.
- Multi-analyte gene expression tests can measure the expression level of one or more genes involved in each of several relevant physiologic processes or component cellular characteristics. In some instances the predictive power of the test, and therefore its utility, can be improved by using the expression values obtained for individual genes to calculate a score which is more highly correlated with outcome than is the expression value of the individual genes. For example, the calculation of a quantitative score (recurrence score) that predicts the likelihood of recurrence in estrogen receptor-positive, node-negative breast cancer is describe in a co-pending
U.S. Patent application (Publication Number 20050048542 ). The equation used to calculate such a recurrence score may group genes in order to maximize the predictive value of the recurrence score. The grouping of genes may be performed at least in part based on knowledge of their contribution to physiologic functions or component cellular characteristics such as discussed above. The formation of groups, in addition, can facilitate the mathematical weighting of the contribution of various expression values to the recurrence score. The weighting of a gene group representing a physiological process or component cellular characteristic can reflect the contribution of that process or characteristic to the pathology of the cancer and clinical outcome. Accordingly, in an important aspect, the present disclosure also provides specific groups of the prognostic genes identified herein, that together are more reliable and powerful predictors of outcome than the individual genes or random combinations of the genes identified. - In addition, based on the determination of a recurrence score, one can choose to partition patients into subgroups at any particular value(s) of the recurrence score, where all patients with values in a given range can be classified as belonging to a particular risk group. Thus, the values chosen will define subgroups of patients with respectively greater or lesser risk.
- The utility of a gene marker in predicting colon cancer outcome may not be unique to that marker. An alternative marker having a expression pattern that is closely similar to a particular test marker may be substituted for or used in addition to a test marker and have little impact on the overall predictive utility of the test. The closely similar expression patterns of two genes may result from involvement of both genes in a particular process and/or being under common regulatory control in colon tumor cells.
- The prognostic marker and associated information provided by the present invention predicting the clinical outcome in Stage II and/or Stage III cancers of the colon and/or rectum has utility in the development of drugs to treat Stage II and/or Stage III cancers of the colon and/or rectum.
- The prognostic marker and associated information provided by the present invention predicting the clinical outcome in Stage II and/or Stage III cancers of the colon and/or rectum also have utility in screening patients for inclusion in clinical trials that test the efficacy of drug compounds for the treatment of patients with Stage II and/or Stage III cancers of the colon and/or rectum. In particular the prognostic marker may be used on samples collected from patients in a clinical trial and the results of the test used in conjunction with patient outcomes in order to determine whether subgroups of patients are more or less likely to show a response to the drug than the whole group or other subgroups.
- The prognostic marker and associated information provided by the present invention predicting the clinical outcome in Stage II and/or Stage III cancers of the colon and/or rectum are useful as inclusion criterion for a clinical trial. For example, a patient is more likely to be included in a clinical trial if the results of the test indicate a higher likelihood that the patient will have a poor clinical outcome if treated with surgery alone and a patient is less likely to be included in a clinical trial if the results of the test indicate a lower likelihood that the patient will have a poor clinical outcome if treated with surgery alone.
- Prognostic markers and associated information may be used to design or produce a reagent that modulates the level or activity of the gene's transcript or its expression product. Said reagents may include but are not limited to an antisense RNA, a small inhibitory RNA, a ribozyme, a monoclonal or polyclonal antibody.
- In a further aspect, said gene or its transcript, or more particularly, an expression product of said transcript is used in an (screening) assay to identify a drug compound, wherein said drug compounds is used in the development of a drug to treat Stage II and/or Stage III cancers of the colon and/or rectum.
- In various embodiments of the invention, various technological approaches are available for determination of expression levels of the disclosed genes, including, without limitation, RT-PCR, microarrays, serial analysis of gene expression (SAGE) and Gene Expression Analysis by Massively Parallel Signature Sequencing (MPSS), which will be discussed in detail below. In particular embodiments, the expression level of the gene may be determined in relation to various features of the expression products of the gene including exons, introns, protein epitopes and protein activity. In other embodiments, the expression level of a gene may be inferred from analysis of the structure of the gene, for example from the analysis of the methylation pattern of gene's promoter(s).
- Methods of gene expression profiling include methods based on hybridization analysis of polynucleotides, methods based on sequencing of polynucleotides, and proteomics-based methods. The most commonly used methods known in the art for the quantification of mRNA expression in a sample include northern blotting and in situ hybridization (Parker & Barnes, Methods in Molecular Biology 106:247-283 (1999)); RNAse protection assays (Hod, Biotechniques 13:852-854 (1992)); and PCR-based methods, such as reverse transcription polymerase chain reaction (RT-PCR) (Weis et al., Trends in Genetics 8:263-264 (1992)). Alternatively, antibodies may be employed that can recognize sequence-specific duplexes, including DNA duplexes, RNA duplexes, and DNA-RNA hybrid duplexes or DNA-protein duplexes. Representative methods for sequencing-based gene expression analysis include Serial Analysis of Gene Expression (SAGE), and gene expression analysis by massively parallel signature sequencing (MPSS).
- Of the techniques listed above, the most sensitive and most flexible quantitative method is RT-PCR, which can be used to determine mRNA levels in various samples. The results can be used to compare gene expression patterns between sample sets, for example in normal and tumor tissues and in patients with or without drug treatment.
- The first step is the isolation of mRNA from a target sample. The starting material is typically total RNA isolated from human tumors or tumor cell lines, and corresponding normal tissues or cell lines, respectively. Thus RNA can be isolated from a variety of primary tumors, including breast, lung, colon, prostate, brain, liver, kidney, pancreas, spleen, thymus, testis, ovary, uterus, etc., tumor, or tumor cell lines, with pooled DNA from healthy donors. If the source of mRNA is a primary tumor, mRNA can be extracted, for example, from frozen or archived paraffin-embedded and fixed (e.g. formalin-fixed) tissue samples.
- General methods for mRNA extraction are well known in the art and are disclosed in standard textbooks of molecular biology, including Ausubel et al., Current Protocols of Molecular Biology, John Wiley and Sons (1997). Methods for RNA extraction from paraffin embedded tissues are disclosed, for example, in Rupp and Locker, Lab Invest. 56:A67 (1987), and De Andrés et al., BioTechniques 18:42044 (1995). In particular, RNA isolation can be performed using purification kit, buffer set and protease from commercial manufacturers, such as Qiagen, according to the manufacturer's instructions. For example, total RNA from cells in culture can be isolated using Qiagen RNeasy mini-columns. Other commercially available RNA isolation kits include MasterPure™ Complete DNA and RNA Purification Kit (EPICENTRE®, Madison, WI), and Paraffin Block RNA Isolation Kit (Ambion, Inc.). Total RNA from tissue samples can be isolated using RNA Stat-60 (Tel-Test). RNA prepared from tumor can be isolated, for example, by cesium chloride density gradient centrifugation.
- As RNA cannot serve as a template for PCR, the first step in gene expression profiling by RT-PCR is the reverse transcription of the RNA template into cDNA, followed by its exponential amplification in a PCR reaction. The two most commonly used reverse transcriptases are avilo myeloblastosis virus reverse transcriptase (AMV-RT) and Moloney murine leukemia virus reverse transcriptase (MMLV-RT). The reverse transcription step is typically primed using specific primers, random hexamers, or oligo-dT primers, depending on the circumstances and the goal of expression profiling. For example, extracted RNA can be reverse-transcribed using a GeneAmp RNA PCR kit (Perkin Elmer, CA, USA), following the manufacturer's instructions. The derived cDNA can then be used as a template in the subsequent PCR reaction.
- Although the PCR step can use a variety of thermostable DNA-dependent DNA polymerases, it typically employs the Taq DNA polymerase, which has a 5'-3' nuclease activity but lacks a 3'-5' proofreading endonuclease activity. Thus, TaqMan® PCR typically utilizes the 5'-nuclease activity of Taq or Tth polymerase to hydrolyze a hybridization probe bound to its target amplicon, but any enzyme with equivalent 5' nuclease activity can be used. Two oligonucleotide primers are used to generate an amplicon typical of a PCR reaction. A third oligonucleotide, or probe, is designed to detect nucleotide sequence located between the two PCR primers. The probe is non-extendible by Taq DNA polymerase enzyme, and is labeled with a reporter fluorescent dye and a quencher fluorescent dye. Any laser-induced emission from the reporter dye is quenched by the quenching dye when the two dyes are located close together as they are on the probe. During the amplification reaction, the Taq DNA polymerase enzyme cleaves the probe in a template-dependent manner. The resultant probe fragments disassociate in solution, and signal from the released reporter dye is free from the quenching effect of the second fluorophore. One molecule of reporter dye is liberated for each new molecule synthesized, and detection of the unquenched reporter dye provides the basis for quantitative interpretation of the data.
- TaqMan® RT-PCR can be performed using commercially available equipment, such as, for example, ABI PRISM 7700™ Sequence Detection System™ (Perkin-Elmer-Applied Biosystems, Foster City, CA, USA), or Lightcycler (Roche Molecular Biochemicals, Mannheim, Germany). In a preferred embodiment, the 5' nuclease procedure is run on a real-time quantitative PCR device such as the ABI PRISM 7700™ Sequence Detection System™. The system consists of a thermocycler, laser, charge-coupled device (CCD), camera and computer. The system amplifies samples in a 96-well format on a thermocycler. During amplification, laser-induced fluorescent signal is collected in real-time through fiber optics cables for all 96 wells, and detected at the CCD. The system includes software for running the instrument and for analyzing the data.
- 5'-Nuclease assay data are initially expressed as Ct, or the threshold cycle. As discussed above, fluorescence values are recorded during every cycle and represent the amount of product amplified to that point in the amplification reaction. The point when the fluorescent signal is first recorded as statistically significant is the threshold cycle (Ct).
- To minimize errors and the effect of sample-to-sample variation, RT-PCR is usually performed using an internal standard. The ideal internal standard is expressed at a constant level among different tissues, and is unaffected by the experimental treatment. RNAs most frequently used to normalize patterns of gene expression are mRNAs for the housekeeping genes glyceraldehyde-3-phosphate-dehydrogenase (GAPDH) and β-actin.
- A more recent variation of the RT-PCR technique is the real time quantitative PCR, which measures PCR product accumulation through a dual-labeled fluorigenic probe (i.e., TaqMan® probe). Real time PCR is compatible both with quantitative competitive PCR, where internal competitor for each target sequence is used for normalization, and with quantitative comparative PCR using a normalization gene contained within the sample, or a housekeeping gene for RT-PCR. For further details see, e.g. Held et al., Genome Research 6:986-994 (1996).
- The steps of a representative protocol for profiling gene expression using fixed, paraffin-embedded tissues as the RNA source, including mRNA isolation, purification, primer extension and amplification are given in various published journal articles (for example: T.E. Godfrey et al. J. Molec. Diagnostics 2: 84-91 (2000); K. Specht et al., Am. J. Pathol. 158: 419-29 (2001)). Briefly, a representative process starts with cutting about 10 µm thick sections of paraffin-embedded tumor tissue samples. The RNA is then extracted, and protein and DNA are removed. After analysis of the RNA concentration, RNA repair and/or amplification steps may be included, if necessary, and RNA is reverse transcribed using gene specific promoters followed by RT-PCR.
- In the MassARRAY-based gene expression profiling method, developed by Sequenom, Inc. (San Diego, CA) following the isolation of RNA and reverse transcription, the obtained cDNA is spiked with a synthetic DNA molecule (competitor), which matches the targeted cDNA region in all positions, except a single base, and serves as an internal standard. The cDNA/competitor mixture is PCR amplified and is subjected to a post-PCR shrimp alkaline phosphatase (SAP) enzyme treatment, which results in the dephosphorylation of the remaining nucleotides. After inactivation of the alkaline phosphatase, the PCR products from the competitor and cDNA are subjected to primer extension, which generates distinct mass signals for the competitor- and cDNA-derives PCR products. After purification, these products are dispensed on a chip array, which is pre-loaded with components needed for analysis with matrix-assisted laser desorption ionization time-of-flight mass spectrometry (MALDI-TOF MS) analysis. The cDNA present in the reaction is then quantified by analyzing the ratios of the peak areas in the mass spectrum generated. For further details see, e.g. Ding and Cantor, Proc. Natl. Acad. Sci. USA 100:3059-3064 (2003).
- Further PCR-based techniques include, for example, differential display (Liang and Pardee, Science 257:967-971 (1992)); amplified fragment length polymorphism (iAFLP) (Kawamoto et al., Genome Res. 12:1305-1312 (1999)); BeadArray™ technology (Illumina, San Diego, CA; Oliphant et al., Discovery of Markers for Disease (Supplement to Biotechniques), June 2002; Ferguson et al., Analytical Chemistry 72:5618 (2000)); BeadsArray for Detection of Gene Expression (BADGE), using the commercially available Luminex100 LabMAP system and multiple color-coded microspheres (Luminex Corp., Austin, TX) in a rapid assay for gene expression (Yang et al., Genome Res. 11:1888-1898 (2001)); and high coverage expression profiling (HiCEP) analysis (Fukumura et al., Nucl. Acids. Res. 31(16) e94 (2003)).
- Differential gene expression can also be identified, or confirmed using the microarray technique. Thus, the expression profile of colon cancer-associated genes can be measured in either fresh or paraffin-embedded tumor tissue, using microarray technology. In this method, polynucleotide sequences of interest (including cDNAs and oligonucleotides) are plated, or arrayed, on a microchip substrate. The arrayed sequences are then hybridized with specific DNA probes from cells or tissues of interest. Just as in the RT-PCR method, the source of mRNA typically is total RNA isolated from human tumors or tumor cell lines, and corresponding normal tissues or cell lines. Thus RNA can be isolated from a variety of primary tumors or tumor cell lines. If the source of mRNA is a primary tumor, mRNA can be extracted, for example, from frozen or archived paraffin-embedded and fixed (e.g. formalin-fixed) tissue samples, which are routinely prepared and preserved in everyday clinical practice.
- In a specific embodiment of the microarray technique, PCR amplified inserts of cDNA clones are applied to a substrate in a dense array. Preferably at least 10,000 nucleotide sequences are applied to the substrate. The microarrayed genes, immobilized on the microchip at 10,000 elements each, are suitable for hybridization under stringent conditions. Fluorescently labeled cDNA probes may be generated through incorporation of fluorescent nucleotides by reverse transcription of RNA extracted from tissues of interest. Labeled cDNA probes applied to the chip hybridize with specificity to each spot of DNA on the array. After stringent washing to remove non-specifically bound probes, the chip is scanned by confocal laser microscopy or by another detection method, such as a CCD camera. Quantitation of hybridization of each arrayed element allows for assessment of corresponding mRNA abundance. With dual color fluorescence, separately labeled cDNA probes generated from two sources of RNA are hybridized pair wise to the array. The relative abundance of the transcripts from the two sources corresponding to each specified gene is thus determined simultaneously. The miniaturized scale of the hybridization affords a convenient and rapid evaluation of the expression pattern for large numbers of genes. Such methods have been shown to have the sensitivity required to detect rare transcripts, which are expressed at a few copies per cell, and to reproducibly detect at least approximately two-fold differences in the expression levels (Schena et al., Proc. Natl. Acad. Sci. USA 93(2):106-149 (1996)). Microarray analysis can be performed by commercially available equipment, following manufacturer's protocols, such as by using the Affymetrix GenChip technology, or Incyte's microarray technology.
- The development of microarray methods for large-scale analysis of gene expression makes it possible to search systematically for molecular markers of cancer classification and outcome prediction in a variety of tumor types.
- Serial analysis of gene expression (SAGE) is a method that allows the simultaneous and quantitative analysis of a large number of gene transcripts, without the need of providing an individual hybridization probe for each transcript. First, a short sequence tag (about 10-14 bp) is generated that contains sufficient information to uniquely identify a transcript, provided that the tag is obtained from a unique position within each transcript. Then, many transcripts are linked together to form long serial molecules, that can be sequenced, revealing the identity of the multiple tags simultaneously. The expression pattern of any population of transcripts can be quantitatively evaluated by determining the abundance of individual tags, and identifying the gene corresponding to each tag. For more details see, e.g. Velculescu et al., Science 270:484-487 (1995); and Velculescu et al., Cell 88:243-51 (1997).
- This method, described by Brenner et al., Nature Biotechnology 18:630-634 (2000), is a sequencing approach that combines non-gel-based signature sequencing with in vitro cloning of millions of templates on separate 5 µm diameter microbeads. First, a microbead library of DNA templates is constructed by in vitro cloning. This is followed by the assembly of a planar array of the template-containing microbeads in a flow cell at a high density (typically greater than 3 x 10⁶ microbeads/cm2). The free ends of the cloned templates on each microbead are analyzed simultaneously, using a fluorescence-based signature sequencing method that does not require DNA fragment separation. This method has been shown to simultaneously and accurately provide, in a single operation, hundreds of thousands of gene signature sequences from a yeast cDNA library.
- Immunohistochemistry methods are also suitable for detecting the expression levels of the prognostic marker of the present invention. Thus, antibodies or antisera, preferably polyclonal antisera, and most preferably monoclonal antibodies specific for the marker are used to detect expression. The antibodies can be detected by direct labeling of the antibodies themselves, for example, with radioactive labels, fluorescent labels, hapten labels such as, biotin, or an enzyme such as horse radish peroxidase or alkaline phosphatase. Alternatively, unlabeled primary antibody is used in conjunction with a labeled secondary antibody, comprising antisera, polyclonal antisera or a monoclonal antibody specific for the primary antibody. Immunohistochemistry protocols and kits are well known in the art and are commercially available.
- The term "proteome" is defined as the totality of the proteins present in a sample (e.g. tissue, organism, or cell culture) at a certain point of time. Proteomics includes, among other things, study of the global changes of protein expression in a sample (also referred to as "expression proteomics"). Proteomics typically includes the following steps: (1) separation of individual proteins in a sample by 2-D gel electrophoresis (2-D PAGE); (2) identification of the individual proteins recovered from the gel, e.g. my mass spectrometry or N-terminal sequencing, and (3) analysis of the data using bioinformatics. Proteomics methods are valuable supplements to other methods of gene expression profiling, and can be used, alone or in combination with other methods, to detect the products of the prognostic marker of the present invention.
- A number of methods for quantization of RNA transcripts (gene expression analysis) or their protein translation products are discussed herein. The expression level of genes may also' be inferred from information regarding chromatin structure, such as for example the methylation status of gene promoters and other regulatory elements and the acetylation status of histones.
- In particular, the methylation status of a promoter influences the level or expression of the gene regulated by that promoter. Aberrant methylation of particular gene promoters has been implicated in expression regulation, such as for example silencing of tumor suppressor genes. Thus, examination of the methylation status of a gene's promoter can be utilized as a surrogate for direct quantization of RNA levels.
- Several approaches for measuring the methylation status of particular DNA elements have been devised, including methylation-specific PCR (Herman J.G. et al. (1996) Methylation-specific PCR: a novel PCR assay for methylation status of CpG islands. Proc. Natl Acad. Sci. USA. 93, 9821-9826.) and bisulfite DNA sequencing (Frommer M. et al. (1992) A genomic sequencing protocol that yields a positive display of 5-methylcytosine residues in individual DNA strands. Proc. Natl Acad. Sci. USA. 89, 1827-1831.). More recently, microarray-based technologies have been used to characterize promoter methylation status (Chen C.M. (2003) Methylation target array for rapid analysis of CpG island hypermethylation in multiple tissue genomes. Am. J. Pathol. 163, 37-45.).
- A further aspect of the disclosure is the identification of gene expression clusters. Gene expression clusters can be identified by analysis of expression data using statistical analyses known in the art, including pairwise analysis of correlation based on Pearson correlation coefficients (Pearson K. and Lee A. (1902) Biometrika 2, 357).
- In one aspect, an expression cluster identified herein includes BGN, CALD1, COL1A1, COL1A2, SPARC, VIM and other genes which are known to be synthesized predominantly by stromal cells and to be involved in remodeling extracellular matrix. This expression cluster is referred to herein as the Extracellular Matrix Remodeling/Stromal cluster.
- In another aspect, an expression cluster identified herein includes ANXA2, KLK6, KLK10, LAMA3, LAMC2, MASPIN, SLPI, and other genes encoding epithelial cell secreted products, most of which are secreted predominantly by epithelial cells but which may be secreted by other cell types. This expression cluster is referred to herein as the Epithelial/Secreted cluster.
- In still another aspect, an expression cluster identified herein includes DUSP1, EGR1, EGR3, FOS, NR4A1, RHOB, and other genes whose transcription is upregulated early after exposure of cells to certain stimuli. A variety of stimuli trigger transcription of early response genes, e.g. exposure to growth factor s, which enables cells to quickly increase their motility and their ability to transport nutrients such as glucose. This expression cluster is referred to herein as the Early Response cluster.
- In yet another aspect, an expression cluster identified herein includes MCP1, CD68, CTSB, OPN, and other genes encoding proteins usually associated with cells of the immune system. This expression cluster is referred to herein as the Immune cluster.
- In a further aspect, an expression cluster identified herein includes CCNE2, CDC20, SKP2, CHK1, BRCA1, CSEL1 and other genes implicated in cell proliferation and regulation of the cell cycle. This expression cluster is referred to herein as the Proliferation/Cell Cycle cluster.
- The steps of a representative protocol for profiling gene expression using fixed, paraffin-embedded tissues as the RNA source, including mRNA isolation, purification, primer extension and amplification are provided in various published journal articles (for example: T.E. Godfrey et al,. J. Molec. Diagnostics 2: 84-91 (2000); K. Specht et al., Am. J. Pathol. 158: 419-29 (2001)). Briefly, a representative process starts with cutting about 10 µm thick sections of paraffin-embedded tumor tissue samples. The RNA is then extracted, and protein and DNA are removed. After analysis of the RNA concentration, RNA repair and/or amplification steps may be included, if necessary, and RNA is reverse transcribed using gene specific promoters followed by RT-PCR. Finally, the data are analyzed to identify the best treatment option(s) available to the patient on the basis of the characteristic gene expression pattern identified in the tumor sample examined, dependent on the predicted likelihood of cancer recurrence.
- An important aspect of the present invention is to use the measured expression of the MYBL2 gene by colon cancer tissue to provide prognostic information. For this purpose it is necessary to correct for (normalize away) both differences in the amount of RNA assayed and variability in the quality of the RNA used. Therefore, the assay typically measures and incorporates the expression of certain normalizing genes, including well known housekeeping genes, such as GAPDH and Cyp1. Alternatively, normalization can be based on the mean or median signal (Ct) of all of the assayed genes or a large subset thereof (global normalization approach). On a gene-by-gene basis, measured normalized amount of a patient tumor mRNA is compared to the amount found in a colon cancer tissue reference set. The number (N) of colon cancer tissues in this reference set should be sufficiently high to ensure that different reference sets (as a whole) behave essentially the same way. If this condition is met, the identity of the individual colon cancer tissues present in a particular set will have no significant impact on the relative amounts of the genes assayed. Usually, the colon cancer tissue reference set consists of at least about 30, preferably at least about 40 different FPE colon cancer tissue specimens. Unless noted otherwise, normalized expression levels for each mRNA/tested tumor/patient will be expressed as a percentage of the expression level measured in the reference set. More specifically, the reference set of a sufficiently high number (e.g. 40) of tumors yields a distribution of normalized levels of each mRNA species. The level measured in a particular tumor sample to be analyzed falls at some percentile within this range, which can be determined by methods well known in the art. Below, unless noted otherwise, reference to expression levels of a gene assume normalized expression relative to the reference set although this is not always explicitly stated.
- According to one aspect, PCR primers and probes are designed based upon intron sequences present in the gene to be amplified. Accordingly, the first step in the primer/probe design is the delineation of intron sequences within the genes. This can be done by publicly available software, such as the DNA BLAT software developed by Kent, W.J., Genome Res. 12(4):656-64 (2002), or by the BLAST software including its variations. Subsequent steps follow well established methods of PCR primer and probe design.
- In order to avoid non-specific signals, it is important to mask repetitive sequences within the introns when designing the primers and probes. This can be easily accomplished by using the Repeat Masker program available on-line through the Baylor College of Medicine, which screens DNA sequences against a library of repetitive elements and returns a query sequence in which the repetitive elements are masked. The masked intron sequences can then be used to design primer and probe sequences using any commercially or otherwise publicly available primer/probe design packages, such as Primer Express (Applied Biosystems); MGB assay-by-design (Applied Biosystems); Primer3 (Steve Rozen and Helen J. Skaletsky (2000) Primer3 on the WWW for general users and for biologist programmers. In: Krawetz S, Misener S (eds) Bioinformatics Methods and Protocols: Methods in Molecular Biology. Humana Press, Totowa, NJ, pp 365-386).
- The most important factors considered in PCR primer design include primer length, melting temperature (Tm), and G/C content, specificity, complementary primer sequences, and 3'-end sequence. In general, optimal PCR primers are generally 17-30 bases in length, and contain about 20-80%, such as, for example, about 50-60% G+C bases. Tm's between 50 and 80 °C, e.g. about 50 to 70 °C are typically preferred.
- For further guidelines for PCR primer and probe design see, e.g. Dieffenbach, C.W. et al., "General Concepts for PCR Primer Design" in: PCR Primer, A Laboratory Manual, Cold Spring Harbor Laboratory Press, New York, 1995, pp. 133-155; Innis and Gelfand, "Optimization of PCRs" in: PCR Protocols, A Guide to Methods and Applications, CRC Press, London, 1994, pp. 5-11; and Plasterer, T.N. Primerselect: Primer and probe design. Methods Mol. Biol. 70:520-527 (1997).
- The materials for use in the methods of the present invention are suited for preparation of kits produced in accordance with well known procedures. The kits comprise agents, which may include gene-specific or gene-selective probes and/or primers, for quantitating the expression of the disclosed genes for predicting prognostic outcome or response to treatment. Such kits may optionally contain reagents for the extraction of RNA from tumor samples, in particular fixed paraffin-embedded tissue samples and/or reagents for RNA amplification. In addition, the kits may optionally comprise the reagent(s) with an identifying description or label or instructions relating to their use in the methods of the present invention. The kits may comprise containers (including microtiter plates suitable for use in an automated implementation of the method), each with one or more of the various reagents (typically in concentrated form) utilized in the methods, including, for example, pre-fabricated microarrays, buffers, the appropriate nucleotide triphosphates (e.g., dATP, dCTP, dGTP and dTTP; or rATP, rCTP, rGTP and UTP), reverse transcriptase, DNA polymerase, RNA polymerase, and one or more probes and primers (e.g., appropriate length poly(T) or random primers linked to a promoter reactive with the RNA polymerase). Mathematical algorithms used to estimate or quantify prognostic or predictive information are also properly potential components of kits.
- The methods of this disclosure, when practiced for commercial diagnostic purposes generally produce a report or summary of the normalized expression levels of one or more of the selected genes. The methods will produce a report comprising a prediction of the clinical outcome of a subject diagnosed with colorectal cancer following surgical resection of said cancer. The methods and reports can further include storing the report in a database. Alternatively, the method can further create a record in a database for the subject and populate the record with data. In one embodiment the report is a paper report, in another embodiment the report is an auditory report, in another embodiment the report is an electronic record. It is contemplated that the report is provided to a physician and/or the patient. The receiving of the report can further include establishing a network connection to a server computer that includes the data and report and requesting the data and report from the server computer.
- The methods provided by the present invention may also be automated in whole or in part.
- All aspects of the present may also be practiced such that a limited number of additional genes that are co-expressed with the disclosed genes, for example as evidenced by high Pearson correlation coefficients, are included in a prognostic or predictive test in addition to and/or in place of disclosed genes.
- Having described the invention, the same will be more readily understood through reference to the following Example, which is provided by way of illustration, and is not intended to limit the invention in any way.
- The primary objective of this study was to determine whether there is a significant relationship between the expression of each of 757 amplicons identified in Table B and clinical outcome in stage II and stage III colon cancer patients who receive colon resection (surgery) without chemotherapy.
- This was an exploratory study using tissue and outcome data from National Surgical Adjuvant Breast and Bowel Project (NSABP) Studies C-01 and C-02 in up to 400 Dukes B (stage II) and Dukes C (stage III) patients who received colon resection (surgery) only or surgery and postoperative Bacillus Calmette-Guerin (BCG).
- Patients enrolled in either NSABP Study C-01: "A Clinical Trial To Evaluate Postoperative Immunotherapy And Postoperative Systemic Chemotherapy In The Management Of Resectable Colon Cancer" or NSABP Study C-02: "A Protocol To Evaluate The Postoperative Portal Vein Infusion Of 5-Flourouracil And Heparin In Adenocarcinoma Of The Colon" Details of C-01 and C-02 can be found on the NSABP Website at the following URL:
- http://www.nsabp.pitt.edu/NSABP_Protocols.htm#treatment%20closed
- Tissue samples from the surgery only and surgery + postoperative BCG arms of NSABP C01 and from the surgery only arm of NSABP C02 surgery were combined into one sample set.
- Patients enrolled in NSABP Study C-01 or NSABP Study C-02 were excluded from the present study if one or more of the following applied:
- No tumor block available from initial diagnosis in the NSABP archive.
- ■ Insufficient tumor in block as assessed by examination of hematoxylin and eosin (H&E) slide
- ■ Insufficient RNA (<700 ng) recovered from tissue sections for RT-PCR analysis.
- Of 1943 patients enrolled in NSABP Study C-01 or NSABP Study C-02, 270 patient samples were available after application of exclusion criteria and used in the gene expression study disclosed herein. The overall demographic and clinical characteristics of the 270 included samples were similar to the original NSABP combined cohorts.
- Seven hundred sixty-one genes, including seven reference genes, were chosen for expression analysis. These genes are listed in Table A together with the sequences of primers and probes used in qRT-PCR to determine expression level.
- The expression of 750 cancer-related genes and 7 genes designated for use as reference genes was quantitatively assessed for each patient using TaqMan® RT-PCR, which was performed in singlet with RNA input at 1 nanogram per reaction.
- For normalization of extraneous effects, cycle threshold (CT) measurements obtained by RT-PCR were normalized relative to the mean expression of a set of six reference genes. The resulting reference-normalized expression measurements typically range from 0 to 15, where a one unit increase generally reflects a 2-fold increase in RNA quantity.
- We compared the distribution of clinical and demographic variables for the current study cohort of evaluable tissue blocks versus the original NSABP C-01 and C-02 study populations. There were no clinically meaningful differences in the distributions.
- For each of the 757 amplicons under study, we used the Cox proportional hazard model to examine the relationship between gene expression and recurrence free interval (RFI). The likelihood ratio was used as the test of statistical significance. The method of Benjamini and Hochberg (Benjamini, Y. and Hochberg, Y. (1995). Controlling the false discovery rate: a practical and powerful approach to multiple testing. J.R. Statist. Soc. B 57, 289-300.), as well as resampling and permutation based methods (Tusher VG, Tibshirani R, Chu G (2001) Significance analysis of microarrays applied to the ionizing radiation response. Proc Natl Acad Sci USA, 98:5116-5121.; Storey JD, Tibshirani R (2001) Estimating false discovery rates under dependence, with applications to DNA microarrays. Stanford: Stanford University, Department of Statistics; Report No.: Technical Report 2001-28.; Korn EL, Troendle J, McShane L, Simon R (2001) Controlling the number of false discoveries: Application to high-dimensional genomic data. Technical Report 003. 2001. National Cancer Institute.) were applied to the resulting set of p-values to estimate false discovery rates. All analyses were repeated for each of the alternative endpoints: distant recurrence free interval (DRFI), overall survival (OS), and disease free survival (DFS).
- For each of the 757 amplicons under study, we used the Cox proportional hazard model to examine the relationship between gene expression and RFI, while controlling for the effects of other standard clinical covariates (including tumor location, surgery type, tumor grade, number of lymph nodes examined, and number of positive lymph nodes. The difference in the log likelihoods of the (reduced) model including only the standard clinical covariates and the (full) model including the standard clinical covariates plus gene expression was used as the test of statistical significance.
- For each of the 757 amplicons under study, we explored alternative functional relationships between gene expression and recurrence using several different methods. For each amplicon, we fit a Cox proportional hazards model of RFI as a function of gene expression using a 2 degree-of freedom (DF) natural spline (Stone C, Koo C. (1985) In Proceedings of the Statistical Computing Section ASA. Washington, DC, 45-48). Statistical significance was assessed by the 2 DF likelihood ratio test for the model. Functional relationships were also explored by examining the pattern of (smoothed) Martingale residuals derived from univariate Cox proportional hazards models of RFI as a strictly linear function of gene expression (Gray RJ (1992) Flexible methods for analyzing survival data using splines, with applications to breast cancer prognosis. Journal of the American Statistical Asssociation, 87:942-951.; Gray RJ (1994) Spline-based tests in survival analysis. Biometrics, 50:640-652.; Gray RJ (1990) Some diagnostic methods for Cox regression models through hazard smoothing. Biometrics, 46:93-102.). Additionally, cumulative sums of Martingale residuals from each the same Cox proportional hazards models were used to detect departures from linearity (Lin D, Wei L, Ying Z. (1993) Checking the Cox Model with Cumulative Sums of Martingale-Based Residuals. Vol. 80, No. 3, 557-572).
- We determined whether there is a significantly different relationship between gene expression and RFI in stage II and stage III patients. For each of the 757 amplicons, we tested the hypothesis that there is a significant difference between the (reduced) proportional hazards model for gene expression and tumor stage versus the (full) proportional hazards model based on gene expression, tumor stage, and their interaction. The difference in the log likelihoods of the reduced and full models was used as the test of statistical significance.
- Table A shows qRT-PCR probe and primer sequences for all genes included in the study described in the Example.
- Table B shows target amplicons for all genes included in the study described in the Example.
- Reference Gene set for the first analysis was CLTC, FZD6, NEDD8, RPLPO, RPS 13, UBB, UBC.
- Table 1A shows associations for those genes whose increased expression is predictive of shorter Recurrence-Free Interval (RFI) based on univariate proportional hazards analysis.
- Table 1B shows associations for those genes whose increased expression is predictive of longer Recurrence-Free Interval (RFI) based on univariate proportional hazards analysis.
- Table 2A shows associations for those genes whose increased expression is predictive of decreased rate of Overall Survival (OS) based on univariate proportional hazards analysis.
- Table 2B shows associations for those genes whose increased expression is predictive of increased rate of Overall Survival (OS) based on univariate proportional hazards analysis.
- Table 3A shows associations for those genes whose increased expression is predictive of decreased rate of Disease Free Survival (DFS) based on univariate proportional hazards analysis.
- Table 3B shows associations for those genes whose increased expression is predictive of increased rate of Disease Free Survival (DFS) based on univariate proportional hazards analysis.
- Table 4A shows associations for those genes whose increased expression is predictive of shorter Distant Recurrence-Free Interval (DRFI) based on univariate proportional hazards analysis.
- Table 4B shows associations for those genes whose increased expression is predictive of longer Distant Recurrence-Free Interval (DRFI) based on univariate proportional hazards analysis.
- Table 5A shows associations between gene expression and RFI for those genes whose increased expression is predictive of shorter Recurrence-Free Interval (RFI), based on a multivanate analysis controlling for particular demographic and clinical characteristics of patients included in the analysis.
- Table 5B shows associations between gene expression and RFI for those genes whose increased expression is predictive of longer Recurrence-Free Interval (RFI), based on a multivanate analysis controlling for particular demographic and clinical characteristics of patients included in the analysis
- Table 6 shows genes for which an association between gene expression and clinical outcome was identified based on a nonlinear proportional hazards analysis, using a 2 degree-of-freedom natural spline.
- Table 7 shows all genes exhibiting an interaction (p-value < 0.05) with tumor stage
- Table 1A shows associations between clinical outcome and gene expression for those genes which demonstrated a Hazard Ratio>1.0 and for which p<0.1 Univariate Cox Proportional Hazards Regression analysis was applied in combined Stage II (Duke's B) and Stage III (Duke's C) patients using RFI as the metric for clinical outcome.
Table 1A Gene Hazard Ratio P Value OfficialSymbol Accession Number RARB 2.13 0.0252 RARB NM_016152 ITGB1 1.94 0.0002 ITGB1 NM_002211 ALDOA 1.92 0.0853 ALDOA NM_000034 ANXA2 1.90 <.0001 ANXA2 NM_004039 CYP3A4 1.81 0.0038 CYP3A4 NM_017460 KRAS2 1.64 0.0043 KRAS NM_004985 COX2 1.62 0.0521 PTGS2 NM_000963 RhoC 1.61 0.0034 RHOC NM_175744 TJP1 1.60 0.0554 TJP1 NM_003257 RhoB 1.57 0.0001 RHOB NM_004040 KIAA0125 1.56 0.0940 KLAA0125 NM_014792 TIMP1 1.52 <.0001 TIMP1 NM_003254 UBC 1.49 0.0031 UBC NM_021009 ANXA5 1.49 0.0084 ANXA5 NM_001154 NTN1 1.49 0.0386 NTN1 NM_004822 AKT3 1.47 <.0001 AKT3 NM_005465 CALD1 1.46 0.0007 CALD1 NM_004342 IGFBP7 1.46 0.0019 IGFBP7 NM_001553 VEGFC 1.45 0.0092 VEGFC NM_005429 BGN 1.44 0.0002 BGN NM_001711 CYP1B1 1.44 0.0180 CYP1B1 NM_000104 DLC1 1.43 0.0012 DLC1 NM_006094 SI 1.43 0.0063 SI NM_001041 CCNE2 variant 1 1.43 0.0506 CCNE2 NM_057749 LAMC2 1.42 0.0003 LAMC2 NM_005562 TIMP2 1.42 0.0018 TIMP2 NM_003255 CDC42BPA 1.42 0.0029 CDC42BPA NM_003607 p21 1.41 0.0062 CDKN1A NM_000389 HB-EGF 1.40 0.0105 HBEGF NM_001945 TLN1 1.40 0.0260 TLN1 NM_006289 DUSP1 1.39 <.0001 DUSP1 NM_004417 ROCK1 1.39 0.0121 ROCK1 NM_005406 CTSB 1.39 0.0307 CTSB NM_001908 ITGAV 1.38 0.0020 ITGAV NM_002210 HSPG2 1.38 0.0215 HSPG2 NM_005529 GADD45B 1.37 0.0002 GADD45B NM_015675 VCL 1.37 0.0201 VCL NM_003373 SBA2 1.37 0.0250 WSB2 NM_018639 Maspin 1.36 <.0001 SERPINB5 NM_002639 CGB 1.36 0.0018 CGB NM_000737 TIMP3 1.36 0.0024 TEMP3 NM_000362 VIM 1.36 0.0073 VIM NM_003380 S100A1 1.36 0.0247 S100A1 NM_006271 INHBA 1.35 0.0008 INHBA NM_002192 SIR2 1.35 0.0039 SIRT1 NM_012238 TMSB10 1.35 0.0469 TMSB10 NM_021103 CD68 1.34 0.0036 CD68 NM_001251 RBX1 1.34 0.0469 RBX1 NM_014248 INHBB 1.34 0.0514 INHBB NM_002193 PKR2 1.34 0.0628 PKM2 NM_002654 FOS 1.33 0.0006 FOS NM_005252 FYN 1.33 0.0036 FYN NM_002037 LOXL2 1.33 0.0064 LOXL2 NM_002318 STCl 1.33 0.0101 STC1 NM_003155 DKK1 1.33 0.0208 DKK1 NM_012242 IGFBP5 1.32 0.0064 IGFBP5 NM_000599 EPAS1 1.32 0.0270 EPAS1 NM_001430 UNC5C 1.32 0.0641 UNC5C NM_003728 FAP 1.31 0.0017 FAP NM_004460 IGFBP3 1.31 0.0041 IGFBP3 NM_000598 SNAI2 1.31 0.0055 SNAI2 NM_003068 PRKCA 1.31 0.0065 PRKCA NM_002737 FST 1.31 0.0399 FST NM_006350 KCNH2 iso a/b 1.31 0.0950 KCNH2 NM_000238 CTHRC1 1.30 0.0017 CTHRC1 NM_138455 PDGFC 1.30 0.0034 PDGFC NM_016205 EGR1 1.30 0.0048 EGR1 NM_001964 TAGLN 1.30 0.0058 TAGLN NM_003186 SPARC 1.30 0.0104 SPARC NM_003118 KLF6 1.30 0.0514 KLF6 NM_001300 GRIK1 1.30 0.0753 GRIK1 NM_000830 CYR61 1.29 0.0018 CYR61 NM_001554 SLPI 1.29 0.0026 SLPI NM_003064 COL1A2 1.29 0.0076 COL1A2 NM_000089 MAPK14 1.29 0.0916 MAPK14 NM_139012 LAMA3 1.28 0.0020 LAMA3 NM_000227 THBS1 1.28 0.0053 THHS1 NM_003246 NRP2 1.28 0.0120 NRP2 NM_003872 LOX 1.27 0.0028 LOX NM_002317 S100A4 1.27 0.0067 S100A4 NM_002961 CXCR4 1.27 0.0083 CXCR4 NM_003467 CEBPB 1.27 0.0943 CEBPB NM_005194 AKAP12 1.26 0.0044 AKAP12 NM_005100 ADAMTS12 1.26 0.0100 ADAMTS12 NM_030955 CRYAB 1.25 0.0038 CRYAB NM_001885 Grb10 1.25 0.0108 GRB10 NM_005311 MCP1 1.25 0.0118 CCL2 NM_002982 COL1A1 1.25 0.0167 COL1A1 NM_000088 EFNB2 1.25 0.0241 EFNB2 NM_004093 ANXA1 1.25 0.0292 ANXA1 NM_000700 ANGPT2 1.25 0.0485 ANGPT2 NM_001147 EphB6 1.25 0.0825 EPHB6 NM_004445 HSPA1A 1.24 0.0018 HSPA1A NM_005345 TGFB3 1.24 0.0081 TGFB3 NM_003239 PTGER3 1.24 0.0306 PTGER3 NM_000957 FXYD5 1.24 0.0367 FXYD5 NM_014164 CAPG 1.24 0.0604 CAPG NM_001747 PDGFB 1.23 0.0157 PDGFB NM_002608 ANTXR1 1.23 0.0164 ANTXR1 NM_032208 TGFB1 1.23 0.0191 TGFBI NM_000358 CTGF 1.23 0.0233 CTGF NM_001901 PDGFA 1.23 0.0274 NM_002607 P14ARF 1.23 0.0362 S78535 KLK10 1.22 0.0005 KLK10 NM_002776 ITGA5 1.22 0.0178 ITGA5 NM_002205 GBP2 1.22 0.0201 GBP2 NM_004120 SIAT4A 1.22 0.0231 ST3GAL1 NM_003033 GJB2 1.22 0.0271 GJB2 NM_004004 LAT 1.22 0.0306 LAT NM_014387 CTSL 1.22 0.0331 CTSL NM_001912 DAPK1 1.22 0.0384 DAPK1 NM_004938 SKP1A 1.22 0.0542 SKP1A NM_006930 NDRG1 1.22 0.0712 NDRG1 NM_006096 ITGB5 1.22 0.0991 ITGB5 NM_002213 KLK6 1.21 0.0034 KLK6 NM_002774 SFRP2 1.21 0.0037 SFRP2 NM_003013 TMEPAI 1.21 0.0173 TMEPAI NM_020182 ID4 1.21 0.0530 ID4 NM_001546 SFRP4 1.20 0.0077 SFRP4 NM_003014 HOXB7 1.20 0.0274 HOXB7 NM_004502 GJA1 1.20 0.0311 GJA1 NM_000165 CDH11 1.20 0.0662 CDH11 NM_001797 PAI1 1.19 0.0060 SERPINE1 NM_000602 S100P 1.19 0.0119 S100P NM_005980 EGR3 1.19 0.0164 EGR3 NM_004430 EMP1 1.19 0.0460 EMP1 NM_001423 ABCC5 1.19 0.0536 ABCC5 NM_005688 FZD1 1.19 0.0701 FZD1 NM_003505 MAD 1.19 0.0811 MXD1 NM_002357 EFNA1 1.19 0.0920 EFNA1 NM_004428 OPN_osteopontin 1.18 0.0028 SPP1 NM_000582 ALDH1A1 1.18 0.0246 ALDH1A1 NM_000689 NR4A1 1.18 0.0277 NR4A1 NM_002135 SIAT7B 1.18 0.0301 ST6GALNAC2 NM_006456 p16-INK4 1.18 0.0439 L27211 TUBB 1.18 0.0761 TUBB2 NM_001069 IL6 1.18 0.0939 IL6 NM_000600 RAB32 1.18 0.0948 RAB32 NM_006834 TULP3 1.18 0.0953 TULP3 NM_003324 F3 1.17 0.0561 F3 NM_001993 PLK3 1.16 0.0792 PLK3 NM_004073 EPHA2 1.16 0.0962 EPHA2 NM_004431 SLC2A1 1.15 0.0745 SLC2A1 NM_006516 CXCL12 1.14 0.0911 CXCL12 NM_000609 S100A2 1.13 0.0287 S100A2 NM_005978 FABP4 1.13 0.0340 FABP4 NM_001442 STMY3 1.13 0.0517 MMP11 NM_005940 BCAS1 1.13 0.0939 BCAS1 NM_003657 REG4 1.11 0.0026 REG4 NM_032044 pS2 1.09 0.0605 TFF1 NM_003225 MUCZ 1.06 0.0626 MUC2 NM_002457 - Table 1B shows associations between clinical outcome and gene expression for those genes which demonstrated a Hazard Ratio<1.0 and for which p<0.1. Univariate Cox Proportional Hazards Regression analysis was applied in combined Stage II (Duke's B) and Stage III (Duke's C) patients using RFI as the metric for clinical outcome
Table 1B Gene Hazard Ratio P Value OfficialSymbol Accession Number ORC1L 0.42 0.0728 ORC1L NM_004153 HSPA8 0.62 0.0430 HSPA8 NM_006597 E2F1 0.64 0.0009 E2F1 NM_005225 RAD54L 0.65 0.0026 RAD54L NM_003579 RPLPO 0.67 0.0150 RPLPO NM_001002 BRCA1 0.68 0.0001 BRCA1 NM_007295 DHFR 0.69 0.0096 DHFR NM_000791 SLC25A3 0.69 0.0110 SLC25A3 NM_213611 PPM1D 0.71 0.0033 PPM1D NM_003620 SKP2 0.71 0.0098 SKP2 NM_005983 FASN 0.72 0.0071 FASN NM_004104 HNRPD 0.72 0.0686 HNRPD NM_031370 ENO1 0.73 0.0418 ENO1 NM_001428 RPS13 0.75 0.0786 RPS13 NM_001017 DDB1 0.75 0.0804 DDH1 NM_001923 C20 orfl 0.76 0.0122 TPX2 NM_012112 KIF22 0.76 0.0137 KIF22 NM_007317 Chk1 0.76 0.0174 CHEK1 NM_001274 TCF-1 0.77 0.0021 TCF1 NM_000545 ST14 0.77 0.0446 ST14 NM_021978 RRM1 0.77 0.0740 RRM1 NM_001033 BRCA2 0.77 0.0800 BRCA2 NM_000059 LMNB1 0.78 0.0513 LMNB1 NM_005573 CMYC 0.79 0.0086 MYC NM_002467 CDC20 0.79 0.0290 CDC20 NM_001255 CSEL1 0.79 0.0344 CSE1L NM_001316 Bax 0.79 0.0662 BAX NM_004324 NME1 0.79 0.0742 NME1 NM_000269 c-myb (MYB official) 0.80 0.0077 MYB NM_005375 CDCA7 v2 0.80 0.0159 CDCA7 NM_145810 EFP 0.80 0.0405 TRIM25 NM_005082 UBE2M 0.80 0.0437 UBE2M NM_003969 RRM2 0.81 0.0168 RRM2 NM_001034 ABCC6 0.81 0.0373 ABCC6 NM_001171 SURV 0.81 0.0584 BIRC5 NM_001168 CKS2 0.81 0.0753 CKS2 NM_001827 RAFI 0.81 0.0899 RAF1 NM_002880 EPHB2 0.82 0.0190 EPHB2 NM_004442 NOTCH1 0.82 0.0232 NOTCH1 NM_017617 UMPS 0.82 0.0456 UMPS NM_000373 CCNE2 0.82 0.0544 CCNE2 NM_057749 PI3KC2A 0.82 0.0916 PIK3C2A NM_002645 CD80 0.82 0.0954 CD80 NM_005191 AREG 0.83 0.0014 AREG NM_001657 EREG 0.83 0.0062 EREG NM_001432 MYBL2 0.83 0.0259 MYBL2 NM_002466 ABCB1 0.83 0.0322 ABCB1 NM_000927 HRAS 0.83 0.0760 HRAS NM_005343 SLC7A5 0.84 0.0585 SLC7A5 NM_003486 MAD2L1 0.84 0.0590 MAD2L1 NM_002358 Ki-67 0.85 0.0620 MK167 NM_002417 MCM2 0.85 0.0700 MCM2 NM_004526 ING5 0.85 0.0947 ING5 NM_032329 Cdx2 0.88 0.0476 CDX2 NM_001265 PTPRO 0.89 0.0642 PTPRO NM_030667 cripto (TDGF1 official) 0.90 0.0803 TDGF1 NM_003212 - Table 2A shows associations between clinical outcome and gene expression for those genes which demonstrated a Hazard Ratio>1.0 and for which p<0.1. Univariate Cox Proportional Hazards Regression analysis was applied in combined Stage II (Duke's B) and Stage III (Duke's C) patients using OS as the metric for clinical outcome.
Table 2A Gene Hazard Ratio P Value OfficialSymbol Accession Number RARB 1.75 0.0820 RARB NM_016152 RhoC 1.70 0.0001 RHOC NM_175744 ANXA2 1.64 0.0002 ANXA2 NM_004039 CYP3A4 1.58 0.0064 CYP3A4 NM_017460 p21 1.54 <.0001 CDKN1A NM_000389 ITGB1 1.54 0.0058 ITGB1 NM_002211 UBC 1.50 0.0003 UBC NM_021009 TNF 1.46 0.0859 TNF NM_000594 VEGFC 1.44 0.0049 VEGFC NM_005429 HMLH 1.44 0.0435 MLH1 NM_000249 RhoB 1.37 0.0015 RHOB NM_004040 TGFBR1 1.37 0.0127 TGFBR1 NM_004612 SPINT2 1.37 0.0235 SPINT2 NM_021102 PFNI 1.37 0.0842 PFN1 NM_005022 HSPG2 1.36 0.0115 HSPG2 NM_005529 TIMP1 1.35 0.0008 TIMP1 NM_003254 INHBB 1.35 0.0190 INHBB NM_002193 VCL 1.34 0.0099 VCL NM_003373 KCNH2 iso a/b 1.33 0.0362 KCNH2 NM_000238 LAMC2 1.32 0.0005 LAMC2 NM_005562 FXYD5 1.31 0.0021 FXYD5 NM_014164 HLA-G 1.31 0.0458 HLA-G NM_002127 GADD45B 1.30 0.0002 GADD45B NM_015675 CDC42 1.30 0.0120 CDC42 NM_001791 LAMB3 1.30 0.0163 LAMB3 NM_000228 DKK1 1.30 0.0209 DKK1 NM_012242 UNC5C 1.30 0.0452 UNC5C NM_003728 UBL1 1.29 0.0171 SUMO1 NM_003352 HB-EGF 1.29 0.0262 HBEGF NM_001945 KRAS2 1.29 0.0726 KRAS NM_004985 ID3 1.28 0.0023 ID3 NM_002167 LOXL2 1.28 0.0039 LOXL2 NM_002318 EphB6 1.28 0.0322 EPHB6 NM_004445 DUSP1 1.27 0.0003 DUSP1 NM_004417 BGN 1.27 0.0040 BGN NM_001711 CALD1 1.27 0.0119 CALD1 NM_004342 CDC42BPA 1.27 0.0151 CDC42BPA NM_003607 SBA2 1.27 0.0373 WSB2 NM_018639 INHBA 1.26 0.0018 INHBA NM_002192 NRP1 1.26 0.0113 NRP1 NM_003873 TIMP2 1.26 0.0123 TIMP2 NM_003255 KLF6 1.26 0.0444 KLF6 NM_001300 KLK10 1.25 <.0001 KLK10 NM_002776 TIMP3 1.25 0.0083 TIMP3 NM_000362 CAPG 1.25 0.0170 CAPG NM_001747 IGFBP7 1.25 0.0249 IGFBP7 NM_001553 S100A1 1.25 0.0529 S100A1 NM_006271 SHC1 1.25 0.0605 SHC1 NM_003029 CTSB 1.25 0.0766 CTSB NM_001908 ANXA5 1.25 0.0787 ANXA5 NM_001154 PKR2 1.25 0.0800 PKM2 NM_002654 HSPA1A 1.24 0.0003 HSPA1A NM_005345 CGB 1.24 0.0148 CGB NM_000737 DLC1 1.24 0.0231 DLC1 NM_006094 TMSB10 1.24 0.0890 TMSB10 NM_021103 LAMA3 1.23 0.0017 LAMA3 NM_000227 FOS 1.23 0.0028 FOS NM_005252 SNAI2 1.23 0.0123 SNAI2 NM 003068 SPARC 1.23 0.0134 SPARC NM_003118 SIR2 1.23 0.0173 SIRT1 NM_012238 KRT19 1.23 0.0217 KRT19 NM_002276 CTSD 1.23 0.0395 CTSD NM_001909 EPAS1 1.23 0.0409 EPAS1 NM_001430 GAGE4 1.23 0.0468 GAGE4 NM_001474 BMP4 1.22 0.0024 BMP4 NM_001202 PLK3 1.22 0.0056 PLK3 NM_004073 Grb10 1.22 0.0059 GRB10 NM_005311 FYN 1.22 0.0120 FYN NM_002037 STC1 1.22 0.0409 STC1 NM_003155 G-Catenin 1.22 0.0661 JUP NM_002230 HK1 1.22 0.0872 HK1 NM_000188 MADH4 1.22 0.0956 SMAD4 NM_005359 KLK6 1.21 0.0011 KLK6 NM_002774 CTHRC1 1.21 0.0065 CTHRC1 NM_138455 LAT 1.21 0.0146 LAT NM_014387 IGFBP3 1.21 0.0149 IGFBP3 NM_000598 AKT3 1.21 0.0212 AKT3 NM_005465 HSPA1B 1.21 0.0262 HSPA1B NM_005346 THY1 1.21 0.0278 THY1 NM_006288 ANXA1 1.21 0.0322 ANXA1 NM_000700 LOX 1.20 0.0067 LOX NM_002317 CD68 1.20 0.0223 CD68 NM_001251 EFNB2 1.20 0.0268 EFNB2 NM_004093 DYRK1B 1.20 0.0473 DYRK1B NM_004714 PTK2 1.20 0.0889 PTK2 NM_005607 THBS1 1.19 0.0203 THBS1 NM_003246 TAGLN 1.19 0.0263 TAGLN NM_003186 TULP3 1.19 0.0334 TULP3 NM_003324 SR-A1 1.19 0.0387 SR-A1 NM_021228 APC 1.19 0.0433 APC NM_000038 ERK1 1.19 0.0488 Z11696 VIM 1.19 0.0661 VIM NM_003380 CREBBP 1.19 0.0802 CREBBP NM_004380 ANGPT2 1.19 0.0860 ANGPT2 NM_001147 Maspin 1.18 0.0029 SERPINB5 NM_002639 PDGFB 1.18 0.0252 PDGFB NM_002608 S100A4 1.18 0.0270 S100A4 NM_002961 EGR1 1.18 0.0334 EGR1 NM_001964 IGFBP5 1.18 0.0526 IGFBP5 NM_000599 NOTCH2 1.18 0.0527 NOTCH2 NM_024408 PAI1 1.17 0.0036 SERPRNE1 NM_000602 NR4A1 1.17 0.0110 NR4A1 NM_002135 BCAS1 1.17 0.0137 BCAS1 NM_003657 BRK 1.17 0.0137 PTK6 NM_005975 AKAP12 1.17 0.0195 AKAP12 NM_005100 EMP1 1.17 0.0291 EMP1 NM_001423 SIAT4A 1.17 0.0304 ST3GAL1 NM_003033 MRP3 1.17 0.0334 ABCC3 NM_003786 COL1A1 1.17 0.0399 COL1A1 NM_000088 Upa 1.17 0.0588 PLAU NM_002658 UNC5B 1.17 0.0986 UNC5B NM_170744 PDGFC 1.16 0.0355 PDGFC NM_016205 MCP1 1.16 0.0449 CCL2 NM_002982 CTGF 1.16 0.0576 CTGF NM_001901 COL1A2 1.16 0.0612 COL1A2 NM_000089 RAB32 1.16 0.0645 RAB32 NM_006834 SIN3A 1.16 0.0787 SIN3A NM_015477 SKP1A 1.16 0.0837 SKP1A NM_006930 EFNA1 1.16 0.0957 EFNA1 NM_004428 S100A2 1.15 0.0040 S100A2 NM_005978 MMP7 1.15 0.0374 MMP7 NM_002423 HOXB7 1.15 0.0405 HOXB7 NM_004502 FAP 1.15 0.0455 FAP NM_004460 ANTXR1 1.15 0.0482 ANTXRI NM_032208 TGFBI 1.15 0.0553 TGFBI NM_000358 TMEPAI 1.14 0.0435 TMEPAI NM_020182 CYR61 1.14 0.0490 CYR61 NM_001554 SLPI 1.14 0.0724 SLPI NM_003064 TP5313 1.14 0.0831 TP5313 NM_004881 PDGFA 1.14 0.0845 NM_002607 SFRP2 1.13 0.0255 SFRP2 NM_003013 S100A8 1.13 0.0693 S100A8 NM_002964 F3 1.13 0.0708 F3 NM_001993 Bcl2 1.13 0.0962 BCL2 NM_000633 OPN_osteopontin 1.12 0.0097 SPP1 NM_000582 FZD6 1.12 0.0692 FZD6 NM_003506 OSM 1.11 0.0744 OSM NM_020530 EGLN3 1.11 0.0884 EGLN3 NM_022073 SIAT7B 1.11 0.0938 ST6GALNAC2 NM_006456 FABP4 1.10 0.0454 FABP4 NM_001442 EFNA3 1.10 0.0958 EFNA3 NM_004952 MMP2 1.10 0.0969 MMP2 NM_004530 GSIT1 1.09 0.0737 GSTT1 NM_000853 REG4 1.07 0.0286 REG4 NM_032044 - Table 2B shows associations between clinical outcome and gene expression for those genes which demonstrated a Hazard Ratio<1.0 and for which p<0.1. Univariate Cox Proportional Hazards Regression analysis was applied in combined Stage II (Duke's B) and Stage III (Duke's C) patients using OS as the metric for clinical outcome
Table 2B Gene Hazard Ratio P value OfficialSymbol Accession Number HSPA8 0.62 0.0145 HSPA8 NM_006597 SKP2 0.70 0.0010 SKP2 NM_005983 DHFR 0.74 0.0085 DHFR NM_000791 PRDX4 0.74 0.0197 PRDX4 NM_006406 RRM1 0.75 0.0162 RRM1 NM_001033 SLC25A3 0.75 0.0342 SLC25A3 NM_213611 RPLPO 0.75 0.0416 RPLP0 NM_001002 E2FI 0.78 0.0190 E2F1 NM_005225 SURV 0.79 0.0086 BIRC5 NM_001168 c-myb (MYB official) 0.80 0.0020 MYB NM 005375 BRCA1 0.80 0.0077 BRCA1 NM_007295 Chk1 0.80 0.0186 CHEK1 NM_001274 ST14 0.80 0.0407 ST14 NM_021978 TCF-1 0.81 0.0045 TCF1 NM_000545 CCNE2 0.81 0.0112 CCNE2 NM_057749 PPMID 0.81 0.0194 PPMID NM_003620 CDC20 0.81 0.0213 CDC20 NM_001255 E124 0.81 0.0585 E124 NM_004879 C20 orf1 0.82 0.0348 TPX2 NM_012112 DUT 0.83 0.0396 DUT NM_001948 CD44E 0.83 0.0439 X55150 KIF22 0.83 0.0506 KIF22 NM_007317 PPID 0.83 0.0615 PPID NM_005038 UBE2M 0.83 0.0805 UBE2M NM_003969 LMNB1 0.83 0.0868 LMNB1 NM_005573 MCM2 0.84 0.0207 MCM2 NM_004526 CDC6 0.84 0.0218 CDC6 NM_001254 MRPL40 0.84 0.0769 MRPL40 NM_003776 EPHB2 0.85 0.0253 EPHB2 NM_004442 CMYC 0.85 0.0371 MYC NM_002467 AURKB 0.85 0.0375 AURKB NM_004217 CDCA7 v2 0.85 0.0421 CDCA7 NM_145810 ABCB1 0.86 0.0390 ABCB1 NM_000927 SMARCA3 0.86 0.0601 SMARCA3 NM_003071 Cdx2 0.88 0.0166 CDX2 NM_001265 PPARG 0.88 0.0645 PPARG NM_005037 MYBL2 0.88 0.0647 MYBL2 NM_002466 EREG 0.89 0.0411 EREG NM_001432 AREG 0.90 0.0235 AREG NM_001657 - Table 3A shows associations between clinical outcome and gene expression for those genes which demonstrated a Hazard Ratio>1.0 and for which p<0.1. Univanate Cox Proportional Hazards Regression analysis was applied in combined Stage II (Duke's B) and Stage III (Duke's C) patients using DFS as the metric for clinical outcome
Table 3A Gene Hazard Ratio P Value OfficialSymbol Accesssion Number ANXA2 1.74 <.0001 ANXA2 NM_004039 CYP3A4 1.69 0.0020 CYP3A4 NM_017460 RhoC 1.53 0.0009 RHOC NM_175744 TJP1 1.45 0.0787 TJP1 NM_003257 UBC 1.43 0.0007 UBC NM_021009 p21 1.42 0.0004 CDKN1A NM_000389 HB-EGF 1.39 0.0032 HBEGF NM_001945 SPINT2 1.37 0.0154 SPINT2 NM_021102 HMLH 1.36 0.0711 MLH1 NM_000249 VEGFC 1.35 0.0157 VEGFC NM_005429 PKR2 1.34 0.0187 PKM2 NM_002654 LAMC2 1.33 0.0002 LAMC2 NM_005562 ITGB1 1.33 0.0499 ITGB1 NN_002211 TIMP1 1.32 0.0007 TIMP1 NM_003254 VCL 1.31 0.0114 VCL NM_003373 INHBB 1.31 0.0302 INHBB NM_002193 GADD45B 1.30 <.0001 GADD45B NM_015675 RhoB 1.30 0.0053 RHOB NM_004040 DUSP1 1.28 <.0001 DUSP1 NM_004417 HK1 1.28 0.0297 HK1 NM_000188 GRIK1 1.28 0.0364 GRIK1 NM_000830 FOS 1.27 0.0002 FOS NM_005252 CGB 1.27 0.0126 CGB NM_000737 KLF6 1.27 0.0288 KLF6 NM_001300 ANXA5 1.27 0.0504 ANXA5 NM_001154 KRAS2 1.27 0.0724 KRAS NM_004985 INHBA 1.16 0.0009 INHBA NM_002192 DLC1 1.26 0.0096 DLC1 NM_006094 IGFBP7 1.26 0.0116 IGFBP7 NM_001553 BGN 1.25 0.0039 BGN NM_001711 LOXL2 1.25 0.0076 LOXL2 NM_002318 STC1 1.25 0.0135 STC1 NM_003155 CTSD 1.25 0.0208 CTSD NM_001909 HSPG2 1.25 0.0485 HSPG2 NM_005529 KCNH2 iso a/b 1.25 0.0832 KCNH2 NM_000238 TIMP3 1.24 0.0057 TIMP3 NM_000362 FXYD5 1.24 0.0070 FXYD5 NM_014164 A-Catenin 1.24 0.0447 CTNNA1 NM_001903 LOX 1.23 0.0013 LOX NM_002317 EGRI 1.23 0.0037 EGR1 NM_001964 CAPG 1.23 0.0191 CAPG NM_001747 LAMB3 1.23 0.0377 LAMB3 NM_000228 GAGE4 1.23 0.0402 GAGE4 NM_001474 SHC1 1.23 0.0640 SHC1 NM_003029 MVP 1.23 0.0726 MVP MM_017458 VEGF 1.22 0.0250 VEGF NM_003376 UNC5B 1.22 0.0256 UNC5B NM_170744 CDC42BPA 1.22 0.0297 CDC42BPA NM_003607 SBA2 1.22 0.0614 WSB2 NM_018639 DKK1 1.22 0.0689 DKK1 NM_012242 EphB6 1.22 0.0763 EPHB6 NM_004445 IGFBP3 1.21 0.0078 IGFBP3 NM_000598 HSPA1B 1.21 0.0167 HSPA1B NM_005346 CALD1 1.21 0.0277 CALD1 NM_004342 TIMP2 1.21 0.0309 TIMP2 NM_003255 NR4A1 1.20 0.0023 NR4A1 NM_002135 LAMA3 1.20 0.0028 LAMA3 NM_000227 SIAT4A 1.20 0.0082 ST3GAL1 NM_003033 PDGFB 1.20 0.0084 PDGFB NM_002608 EMP1 1.20 0.0107 EMP1 NM_001423 THBS1 1.20 0.0126 THBS1 NM_003246 CD68 1.20 0.0143 CD68 NM_001251 FYN 1.20 0.0151 FYN NM_002037 TULP3 1.20 0.0213 TULP3 NM_003324 EFNA1 1.20 0.0254 EFNA1 NM_004428 SIR2 1.20 0.0255 SIRT1 NM_012238 G-Catenin 1.20 0.0689 JUP NM_002230 S100A1 1.20 0.0998 SI00A1 NM_006271 Maspin 1.19 0.0013 SERPINB5 NM_002639 HSPA1A 1.19 0.0013 HSPA1A NM_005345 SPARC 1.19 0.0359 SPARC NM_003118 PTHR1 1.19 0.0801 PTHR1 NM_000316 SNA12 1.18 0.0353 SNAI2 NM_003068 KRT19 1.18 0.0419 KRT19 NM_002276 ERK1 1.18 0.0459 Z11696 KLK10 1.17 0.0007 KLK10 NM_002776 BMP4 1.17 0.0121 BMP4 NM_001202 CYR61 1.17 0.0127 CYR61 NM_001554 Grb10 1.17 0.0216 GRB10 NM_005311 PLK3 1.17 0.0242 PLK3 NM_004073 EFNB2 1.17 0.0403 EFNB2 NM_004093 P14ARF 1.17 0.0439 S78535 ID3 1.17 0.0446 ID3 NM_002167 IGFBP5 1.17 0.0503 IGFBP5 NM_000599 THY1 1.17 0.0574 THY1 NM_006288 VIM 1.17 0.0858 VIM NM_003380 EPAS1 1.17 0.0897 EPAS1 NM_001430 PAI1 1.16 0.0039 SERPINEI NM_000602 F3 1.16 0.0172 F3 NM_001993 CTHRC1 1.16 0.0181 CTHRC1 NM_138455 ANTXR1 1.16 0.0237 ANTXR1 NM_032208 FAP 1.16 0.0289 FAP NM_004460 ADAMTS12 1.16 0.0350 ADAMTS12 NM_030955 CTGF 1.16 0.0424 CTGF NM_001901 PTGER3 1.16 0.0569 PTGER3 NM_000957 ANXA1 1.16 0.0699 ANXA1 NM_000700 NRP1 1.16 0.0797 NRP1 NM_003873 NDRG1 1.16 0.0856 NDRG1 NM_006096 KLK6 1.15 0.0092 KLK6 NM_002774 EGR3 1.15 0.0153 EGR3 NM_004430 HOB7 1.15 0.0345 HOXB7 NM_004502 PDGFC 1.15 0.0363 PDGFC NM_016205 Herstatin 1.15 0.0403 AF177761 MCP1 1.15 0.0409 CCL2 NM_002982 TGFBI 1.15 0.0437 TGFBI NM_000358 TP53I3 1.15 0.0438 TP53I3 NM_004881 SLPI 1.15 0.0457 SLPI NM_003064 PLAUR 1.15 0.0471 PLAUR NM_002659 GJB2 1.15 0.0610 GJB2 NM_004004 COLIA1 1.15 0.0647 COLIA1 NM_000088 IL6 1.15 0.0790 IL6 NM_000600 APC 1.15 0.0821 APC NM_000038 S100A2 1.14 0.0048 S100A2 NM_005978 TMEPAI 1.14 0.0300 TMEPAI NM_020182 PDGFA 1.14 0.0644 NM_002607 S100A4 1.14 0.0680 S100A4 NM_002961 TAGLN 1.14 0.0820 TAGLN NM_003186 Upa 1.14 0.0823 PLAU NM_002658 COL1A2 1.14 0.0856 COLIA2 NM_000089 OSM 1.13 0.0299 OSM NM_020530 BRK 1.13 0.0479 PTK6 NM_005975 SEMA3B 1.13 0.0525 SEMA3B NM_004636 OPN_ osteopontin 1.12 0.0084 SPP1 NM_000582 S100P 1.12 0.0283 S100P NM_005980 SFRP2 1.12 0.0291 SFRP2 NM_003013 EGLN3 1.12 0.0465 EGLN3 NM_022073 SIAT7B 1.12 0.0570 ST6GALNAC2 NM_006456 MMP7 1.12 0.0743 MMP7 NM_002423 FABP4 1.11 0.0195 FABP4 NM_001442 AKAP12 1.11 0.0899 AKAP12 NM_005100 EFNA3 1.10 0.0684 EFNA3 NM_004952 SFRP4 1.10 0.0684 SFRP4 NM_003014 CRYAB 1.10 0.0987 CRYAB NM_001885 GSTT1 1.09 0.0457 GSTT1 NM_000853 REG4 1.08 0.0074 REG4 NM_032044 pS2 1.08 0.0302 TFF1 NM_003225 MUC5B 1.08 0.0401 MUC5B XM_039877 IGFBP2 1.08 0.0873 IGFBP2 NM_000597 - Table 3B shows associations between clinical outcome and gene expression for those genes which demonstrated a Hazard Ratio<1.0 and for which p<0.1 Univanate Cox Proportional Hazards Regression analysis was applied in combined Stage II (Duke's B) and Stage III (Duke's C) patients using DFS as the metric for clinical outcome.
Table 3B Gene Hazard Ratio P Value OfficialSymbol Accession Number HSPA8 0.70 0.0487 HSPA8 NM_006597 SLC25A3 0.71 0.0084 SLC25A3 NM_213611 E2F1 0.73 0.0019 E2F1 NM_005225 SKP2 0.73 0.0038 SKP2 NM_005983 PPM1D 0.75 0.0008 PPM1D NM_003620 RRM1 0.76 0.0161 RRM1 NM_001033 RPLPO 0.76 0.0388 RPLP0 NM_001002 NPM1 0.78 0.0223 NPM1 NM_002520 DDB1 0.78 0.0673 DDB1 NM_001923 PRDX4 0.79 0.0526 PRDX4 NM_006406 BRCA1 0.80 0.0051 BRCA1 NM_007295 Chk1 0.80 0.0114 CHEK1 NM_001274 SURV 0.81 0.0155 BIRC5 NM_001168 C20 orf1 0.81 0.0195 TPX2 NM_012112 E124 0.81 0.0382 E124 NM_004879 RAD54L 0.81 0.0501 RAD54L NM_003579 DHFR 0.81 0.0530 DHFR NM_000791 c-myb (MYB official) 0.82 0.0029 MYB NM_005375 CCNE2 0.82 0.0109 CCNE2 NM_057749 K1F22 0.82 0.0235 K1F22 NM_007317 HMGB1 0.82 0.0849 HMGB1 NM_002128 LMNB1 0.83 0.0665 LMNB1 NM_005573 CDCA7 v2 0.84 0.0224 CDCA7 NM_145810 CDC20 0.84 0.0461 CDC20 NM_001255 FASN 0.84 0.0797 FASN NM_004104 ABCB1 0.85 0.0157 ABCB1 NM_000927 MCM2 0.85 0.0183 MCM2 NM_004526 DUT 0.85 0.0469 DUT NM_001948 KIF2C 0.85 0.0786 KIF2C NM_006845 MCM6 0.85 0.0791 MCM6 NM_005915 EIF4E 0.85 0.0863 E1F4E NM_001968 EPH82 0.86 0.0271 EPHB2 NM_004442 RCC1 0.86 0.0444 RCC1 NM_001269 EFP 0.86 0.0760 TRIM25 NM_005082 AREG 0.87 0.0029 AREG NM_001657 CMYC 0.87 0.0483 MYC NM_002467 GCLC 0.87 0.0824 GCLC NM_001498 TCF-1 0.88 0.0520 TCF1 NM_000545 MYBL2 0.88 0.0527 MYBL2 NM_002466 EREG 0.89 0.0237 EREG NM_001432 Cdx2 0.90 0.0353 CDX2 NM_001265 PTPRO 0.92 0.0896 PTPRO NM_030667 cripto (TDGF1 official) 0.92 0.0913 TDGF1 NM_003212 HLA-DRB1 0.93 0.0536 HLA-DRB1 NM_002124 - Table 4A shows associations between clinical outcome and gene expression for those genes which demonstrated a Hazard Ratio1.0 and for which p<0.1. Univariate Cox Proportional Hazards Regression analysis was applied in combined Stage II (Duke's B) and Stage III (Duke's C) patients using DRFI as the metric for clinical outcome.
Table 4A Gene Hazard Ratio P Value OfficialSymbol Accession Number ALDOA 3.37 00106 ALDOA NM_000034 DCK 2.74 0.0130 DCK NM_000788 ITGB1 2.50 <.0001 ITOB1 NM_002211 COX2 2.15 0.0128 PTGS2 NM_000963 TIP1 2.12 0.0072 TJP1 NM_003257 STAT3 1.98 0.0062 STAT3 NM_003150 HMLH 1.93 0.0087 MLH1 NM_000249 CYP3A4 1.90 00092 CYP3A4 NM_017460 RhoC 1.89 0.0033 RHOC NM_175744 ANXA2 1.87 00025 ANXA2 NM_004039 TIMP1 1.83 <.0001 TIMP1 NM_003254 WWOX 1.81 0.0288 wwox NM_016373 ANXA5 1.80 0.0029 ANXA5 NM_001154 FUS 1.79 0.0179 FUS NM_004960 PAD14 1.78 0.0168 PAD14 NM_012387 RBX1 1.71 0.0082 RBX1 NM_014248 CRIP2 1.71 0.0343 CRIP2 NM_001312 HB-EGF 1.69 0.0013 HBEGF NM_001945 KCNH2 iso a/b 1.69 0.0070 KCNH2 NM_000238 SBA2 1.68 0.0066 WSB2 NM_018639 RhoB 1.67 0.0010 RHOB NM_004040 VIM 1.66 0.0010 VIM NM_003380 LILRB3 1.66 0.0227 LILRB3 NM_006864 UBC 1.64 0.0051 UBC NM_021009 p21 1.63 0.0032 CDKN1A NM_000389 CCNE2 variant 1.62 0.0363 CONE2 NM_057749 RAB6C 1.61 0.0107 RAB6C NM_032144 MSH3 1.61 0.0213 MSH3 NM_002439 AKT3 1.59 0.0003 AKT3 NM_005465 P13K 1.58 0.0552 PIK3C2B NM_002646 RAP1GDS1 1.57 0.0154 RAP1GDS1 NM_021159 CTSB 1.57 0.0250 CTSB NM_001908 PRDX6 1.57 0.0770 PRDX6 NM_004905 NRP2 1.56 0.0005 NRP2 NM_003872 DLC1 1.56 0.0026 DLC1 NM_006094 BGN 1.55 0.0006 BGN NM_001711 SIR2 1.55 0.0016 SIRT1 NM_012238 CALD1 1.53 0.0046 CALD1 NM_004342 YWHAH 1.53 0.0429 YWHAH NM_003405 CDC42 1.52 0.0207 CDC42 NM_001791 ITGA5 1.51 0.0004 ITGA5 NM_002205 KLF6 1.51 0.0197 KLF6 NM_001300 TLN1 1.51 0.0414 TLN1 NM_006289 LAMC2 1.49 0.0017 LAMC2 NM_005562 STC1 1.49 0.0040 STC1 NM_003155 CDC42BPA 1.49 0.0109 CDC42BPA NM_003607 RBM5 1.49 0.0184 RBM5 NM_005778 INHBB 1.49 0.0310 INHBB NM_002193 TGFBR1 1.49 0.0502 TGFBR1 NM_004612 ADAM10 1.49 0.0819 ADAM10 NM_001110 CEBPB 1.48 0.0399 CEBPB NM_005194 AKT1 1.48 0.0846 AKT1 NM_005163 FYN 1.47 0.0036 FYN NM_002037 ARG 1.47 0.0067 ABL2 NM_005158 HEF1A 1.47 0.0221 HIF1A NM_001530 S100A1 1.47 0.0293 S100A1 NM_006271 KRAS2 1.47 0.0958 KRAS NM_004985 CTHRC1 1.46 0.0008 CTHRC1 NM_138455 IGFBP7 1.46 0.0173 IGFBP7 NM_001553 ROCK1 1.46 0.0326 ROCK1 NM_005406 VEGFC 1.46 0.0516 VEGFC NM_005429 EPASI 1.45 0.0316 EPAS1 NM_001430 DUSPI 1.44 0.0008 DUSP1 NM_004417 FST 1.44 0.0340 FST NM_006350 GADD45B 1.43 0.0013 GADD45B NM_015675 FLT4 1.43 0.0663 FLT4 NM_002020 PTEN 1.43 0.0760 PTEN NM_000314 FAP 1.42 0.0017 FAP NM_004460 PDGFC 1.42 0.0033 PDGFC NM_016205 LOXL2 1.42 0.0115 LOXL2 NM_002318 Pak1 1.42 0.0846 PAK1 NM_002576 Grb10 1.41 0.0020 GRB10 NM_005311 INHBA 1.41 0.0036 INHBA NM_002192 GJA1 1.41 0.0039 GJA1 NM_000165 CTGF 1.41 0.0053 CTGF NM_001901 COL1A2 1.41 0.0057 COL1A2 NM_000089 PTK2 1.40 0.0496 PTK2 NM_005607 THBS1 1.39 0.0059 THHS1 NM_003246 RANBP9 1.39 0.0333 RANBP9 NM_005493 RANBP2 1.39 0.0988 RANBP2 NM_006267 ITGAV 1.38 0.0210 ITGAV NM_002210 TIMP2 1.38 0.0285 TIMP2 NM_003255 PTHR1 1.38 0.0297 PTHR1 NM_000316 GADD45 1.38 0.0340 GADD45A NM_001924 c-abl 1.38 0.0526 ABL1 NM_005157 EGR1 1.37 0.0097 EGR1 NM_001964 NCAM1 1.37 0.0657 NCAM1 NM_000615 VCL 1.37 0.0845 VCL NM_003373 LOX 1.36 0.0026 LOX NM_002317 SNAI2 1.36 0.0178 SNAI2 NM_003068 SPARC 1.36 0.0198 SPARC NM_003118 CDHI1 1.36 0.0233 CDH11 NM_001797 NFKBp50 1.36 0.0767 NFKBI NM_003998 CYR61 1.35 0.0065 CYR61 NM_001554 S100A4 1.35 0.0104 S100A4 NM_002961 TAGLN 1.35 0.0168 TAGLN NM_003186 PCAF 1.34 0.0327 PCAF NM_003884 NOTCH2 1.34 0.0390 NOTCH2 NM_024408 LRPS 1.34 0.0722 LRP5 NM_002335 SI 1.34 0.0787 SI NM_001041 GBP2 1.33 0.0139 GBP2 NM_004120 Bcl2 1.33 0.0143 BCL2 NM_000633 MCP1 1.33 0.0159 CCL2 NM_002982 EPHA2 1.33 0.0184 EPHA2 NM_004431 PRKCA 1.33 0.0329 PRKCA NM_002737 TIMP3 1.33 0.0337 TIMP3 NM_000362 ANGPT2 1.33 0.0476 ANGPT2 NM_001147 CTSD 1.33 0.0766 CTSD NM_001909 SEMA3F 1.33 0.0931 SEMA3F NM_004186 BCAS1 1.32 0.0044 BCAS1 NM_003657 ANXA1 1.32 0.0458 ANXA1 NM_000700 KRT19 1.32 0.0535 KART19 NM_002276 PTPRJ 1.32 0.0618 PTPRJ NM_002843 CAPG 1.32 0.0641 CAPG NM_001747 FOS 1.31 0.0129 FOS NM_005252 COL1A1 1.31 0.0236 COL1A1 NM_000088 CXCR4 1.31 0.0251 CXCR4 NM_003467 TUBB 1.31 0.0354 TUBB2 NM_001069 PIM1 1.31 0.0373 PIM1 NM_002648 IGFBP5 1.31 0.0477 IGFBP5 NM_000599 AP-I (JUN official) 1.31 0.0519 JUN NM_002228 GCNT1 1.31 0.0534 GCNT1 NM_001490 MAX 1.31 0.0650 MAX NM_002382 PAI1 1.30 0.0017 SERPINE1 NM_000602 SLPI 1.30 0.0176 SLPI NM_003064 IGFBP3 1.30 0.0320 IGFBP3 NM_000598 DARK1 1.30 0.0402 DAPK1 NM_004938 ID3 1.30 0.0442 ID3 NM_002167 EFNA1 1.30 0.0623 EFNA1 NM_004428 AKAP12 1.29 0.0162 AKAP12 NM_005100 PDGFB 1.29 0.0242 PDGFB NM_002608 CD68 1.29 0.0524 CD68 NM_001251 FGFR1 1.29 0.0709 FGFR1 NM_023109 GSK3B 1.29 0.0765 GSK3B NM_002093 CXCL12 1.28 0.0129 CXCL12 NM_000609 DPYD 1.28 0.0186 DPYD NM_000110 LAMA3 1.28 0.0193 LAMA3 NM_000227 MRP3 1.28 0.0384 ABCC3 NM_003786 ABCC5 1.28 0.0402 ABCC5 NM_005688 PDGFA 1.28 0.0482 NM_002607 XPA 1.28 0.0740 XPA NM_000380 NDRG1 1.28 0.0786 NDRG1 NM_006096 FES 1.27 0.0458 FES NM_002005 CTSL 1.27 0.0485 CTSL NM_001912 IL6 1.27 0.0606 IL6 NM_000600 SFRP2 1.26 0.0085 SFRP2 NM_003013 Maspin 1.26 0.0096 SERPINB5 NM_002639 TGFBI 1.26 0.0470 TGFBI NM_000358 NOS3 1.26 0.0978 NOS3 NM_000603 HSPA1A 1.25 0.0161 HSPA1A NM_005345 S100A8 1.25 0.0180 S100A8 NM_002964 HOXB7 1.25 0.0396 HOXB7 NM_004502 PI4ARF 1.25 0.0697 S78535 WISP1 1.25 0.0712 WISP1 NM_003882 ID4 1.25 0.0883 ID4 NM_001546 SFRP4 1.24 0.0200 SFRP4 NM_003014 FZD6 1 24 0.0220 FZD6 NM_003506 EGR3 1.24 0.0237 EGR3 NM_004430 ALDH1A1 1.24 0.0258 ALDH1A1 NM_000689 CRYAB 1.23 0.0394 CRYAB NM_001885 TGFB3 1.23 0.0541 TGFB3 NM_003239 ANTXR1 1.13 0.0661 ANTXR1 NM_032208 KLK6 1.22 0.0211 KLK6 NM_002774 ILT-2 1.22 0.0676 LILRB1 NM_006669 EMP1 1.22 0.0871 EMP1 NM_001423 PLAUR 1.22 0.0943 PLAUR NM_002659 S100A2 1.20 0.0100 S100A2 NM_005978 MMP7 1.19 0.0810 MMP7 NM_002423 OPN_osteopontin 1.17 0.0231 SPP1 NM_000582 FABP4 1.17 0.0325 FABP4 NM_001442 KLK10 1.17 0.0452 KLK10 NM_002776 PS2 1.16 0.0140 TFF1 NM_003225 STMY3 1.15 0.0850 MMP11 NM_005940 REG4 1.14 0.0042 REG4 NM_032044 MUC2 1.09 0.0370 MUC2 NM_002457 - Table 4B shows associations between clinical outcome and gene expression for those genes which demonstrated a Hazard Ratio<1.0 and for which p<0.1. Univanate Cox Proportional Hazards Regression analysis was apple in combined Stage II (Duke's B) and Stage III (Duke's C) patients using DRFI as the metric for clinical outcome.
Gene Hazard Ratio P Value OfficialSymbol Accession Number HSPA8 0.51 0.0261 HSPA8 NM_006597 RPS13 0.58 0.0089 RPS13 NM_001017 RPLPO 0.63 0.0324 RPLP0 NM_001002 NDUFS3 0.66 0.0142 NDUFS3 NM_004551 LMNB1 0.67 0.0202 LMNB1 NM_005573 ST14 0.67 0.0206 ST14 NM_021978 BRCA1 0.68 0.0032 BRCA1 NM_007295 TMSB4X 0.68 0.0075 TMSB4X NM_021109 DHFR 0.68 0.0356 DHFR NM_000791 SKP2 0.69 0.0248 SKP2 NM_005983 TCF-1 0.70 0.0015 TCF1 NM_000545 CDC20 0.70 0.0067 CDC20 NM_001255 SLC25A3 0.70 0.0418 SLC25A3 NM_213611 NME1 0.72 0.0503 NME1 NM_000269 RRM1 0.72 0.0850 RRM1 NM_001033 MCM2 0.76 0.0168 MCM2 NM_004526 ABCC6 0.76 0.0445 ABCC6 NM_001171 CKS2 0.76 0.0869 CKS2 NM_001827 EPHB2 0.77 0.0174 EPHB2 NM_004442 C20 orf1 0.77 0.0716 TPX2 NM_012112 CSEL1 0.77 0.0725 CSE1L NM_001316 NFKBp65 0.78 0.0957 RELA NM_021975 AURKB 0.79 0.0742 AURKB NM_004217 CMYC 0.82 0.0901 MYC NM_002467 Cdx2 0.85 0.0510 CDX2 NM_001265 EREG 0.85 0.0730 EREG NM_001432 AREG 0.86 0.0365 AREG NM_001657 - Table 5A shows associations between gene expression and RFI, controlling for particular demographic and clinical characteristics of patients included in the analysis. All genes are listed whose expression correlates with RFI (p<0.1) and which demonstrated a Hazard Ratio >1 in a multivariate analysis including the following variables: tumor location, surgery, tumor grade, nodes examined, and number of positive nodes.
Table 5A Gene HR LR Chi-Square DF P-Value RARB 2.06780 4.23265 1 0.03965 CYP3A4 1.85387 7.99462 1 0.00469 ANXA2 1.80012 10.84166 1 0.00099 COX2 1.79051 4.52307 1 0.03344 RhoC 1.73986 9.97133 1 0.00159 MAPK14 1.68382 8.04253 1 0.00457 UBC 1.67323 11.69444 1 0.00063 RhoB 1.66612 15.92497 1 0.00007 ITGB1 1.65796 8.18638 1 0.00422 KRAS2 1.63873 6.80447 1 0.00909 NTN1 1.61833 5.43469 1 0.01974 ATP5E 1.60990 4.93660 1 0.02629 G-Catenin 1.58482 9.24422 1 0.00236 STC1 1.58163 11.10757 1 0.00086 SPINT2 1.52653 6.17276 1 0.01297 Claudin 4 1.50290 12.29943 1 0.00045 IGFBP7 1.48789 9.62569 1 0.00192 NCAM1 1.48294 5.11428 1 0.02373 TIMP1 1.46045 9.98492 1 0.00158 CEBPB 1.46025 5.23659 1 0.02212 KCNH2 iso a/b 1.44616 3.97304 1 0.04623 TMSB10 1.43107 4.65463 1 0.03097 VEGFC 1.41860 4.66904 1 0.03071 HB-EGF 1.41757 7.00399 1 0.00813 FST 1.41061 5.59674 1 0.01799 LAMC2 1.40860 11.33997 1 0.00076 GADD45B 1.40671 12.26323 1 0.00046 AKT3 1.40161 10.13028 1 0.00146 EFNAI 1.40048 8.86645 1 0.00290 p21 1.39939 5.42981 1 0.01980 INHBA 1.38204 11.03909 1 0.00089 CALD1 1.38009 6.93406 1 0.00846 DUSP1 1.36464 13.04379 1 0.00030 HSPG2 1.36387 4.11749 1 0.04244 GJB2 1.36358 8.42204 1 0.00371 EPAS1 1.36323 4.74318 1 0.02941 BGN 1.35821 7.66947 1 0.00562 TIMP2 1.35571 5.78791 1 0.01614 A-Catenin 1.35566 4.35623 1 0.03687 LOXL2 1.35470 7.23663 1 0.00714 DKK1 1.35126 3.88504 1 0.04872 ITGAV 1.34899 8.03554 1 0.00459 CGB 1.34840 7.06221 1 0.00787 EGR1 1.33424 8.41855 1 0.00371 TIMP3 1.33197 6.28550 1 0.01217 VIM 1.33196 4.92198 1 0.02652 TGFB1 1.32511 8.30278 1 0.00396 FXYD5 1.32500 6.22751 1 0.01258 VEGF 1.32291 4.93825 1 0.02627 ADAMTS12 1.31794 7.46749 1 0.00628 SLPI 1.31565 8.38324 1 0.00379 DLCI 1.30862 5.51638 1 0.01884 HOXB7 1.30822 8.04076 1 0.00457 TMEPAI 1.30395 8.43736 1 0.00368 IGFBP5 1.30260 5.44022 1 0.01968 CDC42BPA 1.30167 4.20771 1 0.04024 PDGFA 1.29760 5.54964 1 0.01848 GSTp 1.29594 3.96268 1 0.04652 FOS 1.29427 8.42847 1 0.00369 PDGFC 1.28813 6.81737 1 0.00903 IGFBP3 1.28701 6.33625 1 0.01183 LOX 1.28433 8.15598 1 0.00429 SPARC 1.28260 4.75876 1 0.02915 EFNB2 1.27720 4.71247 1 0.02994 Maspin 1.27645 10.57657 1 0.00115 THBS1 1.27619 6.61087 1 0.01014 TAGLN 1.26904 5.15123 1 0.02323 VEGF_altsplice1 1.26734 5.29282 1 0.02141 S100P 1.26586 9.88713 1 0.00166 HSPA1A 1.26209 8.59704 1 0.00337 MAD 1.26112 3.96163 1 0.04655 ANGPT2 1.25701 3.91148 1 0.04796 PRKCA 1.24853 4.69452 1 0.03026 F3 1.24848 5.06788 1 0.02437 FAP 1.24657 5.19589 1 0.02264 BRK 1.24507 5.44048 1 0.01968 CD68 1.23943 4.02530 1 0.04482 NR4A1 1.23772 7.09548 1 0.00773 CTHRC1 1.23465 5.21100 1 0.02244 SLC2A 1 1.22967 5.22364 1 0.02228 Grb10 1.22209 4.12811 1 0.04218 p16-INK4 1.21325 4.44296 1 0.03505 MDK 1.21116 5.25025 1 0.02194 CYR61 1.19995 4.14452 1 0.04177 LAMA3 1.19794 4.33073 1 0.03743 FOXO3A 1.19557 4.20079 1 0.04041 EFNA3 1.19439 5.51728 1 0.01883 CRYAB 1.17514 3.90435 1 0.04816 CEACAM6 1.16804 3.96486 1 0.04646 OPN_osteopontin 1.16112 5.50891 1 0.01892 KLK10 1.15851 5.65625 1 0.01739 SFRP2 1.15773 4.02893 1 0.04473 KLK6 1.15163 4.65953 1 0.03088 S100A2 1.14185 3.94284 1 0.04707 REG4 1.09037 4.16995 1 0.04115 - Table 5B shows associations between gene expression and RFI, controlling for particular demographic and clinical characteristics of patients included in the analysis. All genes are listed whose expression correlates with RFI (p<0.1) and which demonstrated a Hazard Ratio <1 in a multivariate analysis including the following variables: tumor location, surgery, tumor grade, nodes examined, and number of positive nodes
Table 5B Gene HR LR Chl-Square DF P-Value BFGF 0.46674 6.95233 1 0.00837 FasI 0.47324 4.08714 1 0.04321 KIRK1 0.63331 10.28820 1 0.00134 DHFR 0.64947 7.64434 1 0.00570 BRCA1 0.65247 15.21566 1 0.00010 SLC25A3 0.67480 5.72977 1 0.01668 RAD54L 0.68215 5.38684 1 0.02029 PPMID 0.67777 10:02879 1 0.00154 CD80 0.69347 8.70087 1 0.00318 ATPSA1 0.70467 4.06718 1 0.04372 PRKCB1 0.73152 5.21950 1 0.02234 KIF22 0.73945 5.13202 1 0.02349 Chk1 0.75865 4.38139 1 0.03633 TRAIL 0.76430 4.12533 1 0.04225 CDC20 0.77071 5.04557 1 0.02469 DUT 0.78196 4.13381 1 0.04203 ABCB1 0.79434 5.33783 1 0.02087 UMPS 0.80011 4.65425 1 0.03098 ING5 0.80230 4.04085 1 0.04441 CMYC 0.80757 4.26709 1 0.03886 GBP1 0.83015 3.98302 1 0.04596 AREG 0.86091 4.94239 1 0.02621 - Table 6 shows associations between gene expression and clinical outcome based on a nonlinear proportional hazards analysis, using a 2 degree-of-freedom natural spline. All genes are listed which demonstrated a departure from a strictly linear relationship (p<0.05) with RFI in combined Stage II (Duke's B) and Stage III (Duke's C) patients The relationship between gene expression and RFI was not constant throughout the observed range of expression values in the study, e g. increases in gene expression may have been related to increases in duration of RFI in one portion of the observed range and with decreases in duration of RFI in a different portion of the range.
Table 6 Gene P-Value Official Symbol Accession Number PTHLH 0.001 PTHLH NM_002820 CDCA7 v2 0.002 CDCA7 NM_145810 CREBBP 0.002 CREBBP NM_004380 KLF5 0.002 KLF5 NM_001730 LAMB3 0.004 LAMB3 NM_000228 TGFHR1 0.005 TGFBR1 NM_004612 NR4A1 0.005 NR4A1 NM_002135 Upa 0.005 PLAU NM_002658 Cad17 0.007 CDH17 NM_004063 S100A4 0.008 S100A4 NM_002961 A-Catenin 0.008 CTNNA1 NM_001903 EPHB2 0.009 EPHB2 NM_004442 Axin 2 0.011 AXIN2 NM_004655 PTPRJ 0.011 PTPRJ NM_002843 CAPN1 0.012 CAPN1 NM_005186 CEGP1 0.013 SCUBE2 NM_020974 APOC1 0.013 APOC1 NM_001645 GBP1 0.015 GBP1 NM_002053 SKP2 0.016 SKP2 NM_005983 ATP5E 0.016 ATP5E NM_006886 GRIK1 0.017 GRIK1 NM_000830 PRKR 0.018 EIF2AK2 NM_002759 FUT6 0.020 FUT6 NM_000150 PFN2 0.020 PFN2 NM_053024 ITGB4 0.021 ITGB4 NM_000213 MADH7 0.021 SMAD7 NM_005904 RALBP1 0.021 RALBP1 NM_006788 AKT1 0.022 AKT1 NM_005163 KLK6 0.022 KLK6 NM_002774 PLK 0.023 PLK1 NM_005030 CYP2C8 0.025 CYP2C8 NM_000770 BTF3 0.026 BTF3 NM_001207 CCNE2 variant 1 0.026 CCNE2 NM_057749 STMY3 0.030 MMP11 NM_005940 NRP1 0.030 NRP1 NM_003873 SIAT4A 0.031 ST3GAL1 NM_003033 SEMA3B 0.033 SEMA3B NM_004636 TRAG3 0.033 CSAG2 NM_004909 HSPE1 0.035 HSPE1 NM_002157 SBA2 0.036 WSB2 NM_018639 TK1 0.036 TK1 NM_003258 CCNB2 0.037 CCNB2 NM_004701 TMEPA1 0.037 TMEPAI NM_020182 SPRY2 0.037 SPRY2 NM_005842 AGXT 0.038 AGXT NM_000030 ALCAM 0.038 ALCAM NM_001627 HSPCA 0.038 HSPCA NM_005348 TIMP3 0.038 TIMP3 NM_000362 DET1 0.039 DET1 NM_017996 tusc4 0.040 TUSC4 NM_006545 SNA12 0.040 SNA12 NM_003068 CD28 0.040 CD28 NM_006139 RNF11 0.041 RNF11 NM_014372 PAI1 0.042 SERPINE1 NM_000602 XRCC1 0.042 XRCC1 NM_006297 EGLN1 0.044 EGLN1 NM_022051 EGFR 0.044 EGFR NM_005228 HES6 0.044 HES6 NM_018645 KCNK4 0.045 KCNK4 NM_016611 CXCR4 0.047 CXCR4 NM_003467 PTP4A3 0.048 PTP4A3 NM_007079 p27 0.048 CDKN1B NM_004064 MADH4 0.049 SMAD4 NM_005359 ICAM1 0.049 ICAM1 NM_000201 - Table 7 shows all genes exhibiting an interaction (p-value < 0.05) with tumor stage The data were modeled using a proportional hazards model of RFI with gene expression, tumor stage, and their interaction as predictors
Table 7 Gene HR Stage II HR Stage III P-value for Interaction ICAM2 1.49 0.68 0.0019 CD24 1.26 0.84 0.0054 PRDX6 2.29 0.73 0.0058 HSD17B2 0.62 1.29 0.0072 ALCAM 1.61 0.94 0.0088 SIR2 2.02 1.09 0.0089 NUFIP1 1.32 0.79 0.0093 EMR3 2.14 0.57 0.0127 CDC20 0.56 0.98 0.0130 MT3 1.37 0.79 0.0134 CLTC 1.80 0.71 0.0144 CYR61 1.73 1.10 0.0145 WIF 1.34 0.78 0.0195 TFF3 1.23 0.90 0.0209 SOS1 1.46 0.79 0.0287 TMSB4X 1.34 0.74 0.0293 CENPE 3.05 0.85 0.0330 CDH11 1.49 0.96 0.0339 CAPG 0.90 1.50 0.0348 TP53BP1 1.54 0.93 0.0357 MGAT5 1.25 0.73 0.0362 MADH2 1.36 0.70 0.0393 LOX 1.58 1.11 0.0396 DKK1 0.87 1.55 0.0415 CKS1B 0.31 1.75 0.0467 MMP7 0.92 1.28 0.0471 STAT5B 1.28 0.86 0.0471 CD28 0.69 1.25 0.0472 - Reference Gene Set for the second analysis was ATP5E, CLTC, GPX1, NEDD8, PGK1, UBB.
- Table 1.2A shows associations for those genes whose increased expression is predictive of shorter Recurrence-Free Interval (RFI) based on univariate proportional hazards analysis.
- Table 1.2B shows associations for those genes whose increased expression is predictive of longer Recurrence-Free Interval (RFI) based on univariate proportional hazards analysis.
- Table 2.2A shows associations for those genes whose increased expression is predictive of decreased rate of Overall Survival (OS) based on univariate proportional hazards analysis.
- Table 2.2B shows associations for those genes whose increased expression is predictive of increased rate of Overall Survival (OS) based on univariate proportional hazards analysis.
- Table 3.2A shows associations for those genes whose increased expression is predictive of decreased rate of Disease Free Survival (DFS) based on univariate proportional hazards analysis.
- Table 3.2B shows associations for those genes whose increased expression is predictive of increased rate of Disease Free Survival (DFS) based on univariate proportional hazards analysis.
- Table 4.2A shows associations for those genes whose increased expression is predictive of shorter Distant Recurrence-Free Interval (DRFI) based on univariate proportional hazards analysis.
- Table 4.2B shows associations for those genes whose increased expression is predictive of longer Distant Recurrence-Free Interval (DRFI) based on univariate proportional hazards analysis.
- Table 5.2A shows associations between gene expression and RFI for those genes whose increased expression is predictive of shorter Recurrence-Free Interval (RFI), based on a multivariate analysis controlling for particular demographic and clinical characteristics of patients included in the analysis.
- Table 5 2B shows associations between gene expression and RFI for those genes whose increased expression is predictive of longer Recurrence-Free Interval (RFI), based on a multivanate analysis controlling for particular demographic and clinical characteristics of patients included in the analysis.
- Table 6.2 shows genes for which an association between gene expression and clinical outcome was identified based on a nonlinear proportional hazards analysis, using a 2 degree-of freedom natural spline.
- Table 7 2 shows all genes exhibiting an interaction (p-value < 0.05) with tumor stage
- Table 1 2A shows associations between clinical outcome and gene expression for those genes which demonstrated a Hazard Ratio>1.0 and for which p<0.1 Univanate Cox Proportional Hazards Regression analysis was applied in combined Stage II (Duke's B) and Stage III (Duke's C) patients using RFI as the metric for clinical outcome
Gene Hazard Ratio P Value Official Symbol Accession Number RARB 2.22 0.0294 RARB NM_016152 ITGB1 2.04 0.0002 ITGB1 NM_002211 ANXA2 1.78 0.0003 ANXA2 NM_004039 CYP3A4 1.68 0.0075 CYP3A4 NM_017460 COX2 1.64 0.0604 PTGS2 NM_000963 KRAS2 1.62 0.0064 KRAS NM_004985 TJP1 1.58 0.0751 TJP1 NM_003257 KIAA0125 1.58 0.0889 KIAA0125 NM_014792 RhoB 1.57 0.0002 RHOB NM_004040 RhoC 1.56 0.0059 RHOC NM_175744 NTN1 1.54 0.0336 NTN1 NM_004822 ANXA5 1.52 0.0086 ANXA5 NM_001154 TIMP1 1.52 < 0001 TIMP1 NM_003254 AKT3 1.50 <.0001 AKT3 NM_005465 CALD1 1.48 0.0007 CALD1 NM_004342 IGFBP7 1.46 0.023 IGFBP7 NM_001553 CYP1B1 1.45 00222 CYP1B1 NM_000104 BGN 1.44 00002 BGN NM_001711 VEGFC 1.44 0.0151 VEGFC NM_005429 DLC1 1.44 0.0014 DLC1 NM_006094 SI 1.42 0.0086 SI NM_001041 TIMP2 1.42 0.0022 TIMP2 NM_003255 CDC42BPA 1.41 0.0038 CDC42BPA NM_003607 LAMC2 1.40 0.0004 LAMC2 NM_005562 ITGAV 1.40 0.0019 ITGAV NM_002210 CTSB 1.40 0.0357 CTSB NM_001908 DUSP1 1.39 <.0001 DUSP1 NM_004417 TLN1 1.39 0.0335 TLN1 NM_006289 CCNE2 variant 1 1.39 0.0708 CCNE2 NM_057749 TIMP3 1.38 0.0023 TIMP3 NM_000362 GHI 3RAF mut4 1.38 0.0537 GHI_BRAF_mut4 HB-EGF 1.38 0.0109 HBEGF NM_001945 HSPG2 1.38 0.0258 HSPG2 NM_005529 VIM 1.37 0.0077 VIM NM_003380 ROCK1 1.37 0.0168 ROCK1 NM_005406 S100A1 1.36 0.0233 S100A1 NM_006271 p21 1.36 0.0113 CDKN1A NM_000389 CGB 1.36 0.0023 CGB NM_000737 UBC 1.36 0.0137 UBC NM_021009 GADD45B 1.36 0.0003 GADD45B NM_015675 INHBA 1.35 0.0010 INHBA NM_002192 VCL 1.34 0.0286 VCL NM_003373 SIR2 1 34 0.0049 SIRT1 NM_012238 CD68 1.34 0.0042 CD68 NM_001251 Maspin 1.34 <.0001 SERPINB5 NM_002639 FST 1.33 0.0326 FST NM_006350 EPAS1 1.33 0.0306 EPAS1 NM_001430 LOXL2 1.33 0.0076 LOXL2 NM_002318 STC1 1.33 0.0119 STC1 NM_003155 UNC5C 1.32 0.0642 UNC5C NM_003728 IGFBP5 1.32 0.0080 IGFBP5 NM_000599 INHBB 1.32 0.0643 INHBB NM_002193 FAP 1.32 0.0017 FAP NM_004460 DKK1 1.31 0.0298 DKK1 NM_012242 FYN 1.31 0.0053 FYN NM_002037 CTHRC1 1.31 0.0017 CTHRC1 NM_138455 FOS 1.31 0.0010 FOS NM_005252 RBX1 1.31 0.0633 RBX1 NM_014248 TAGLN 1.31 0.0058 TAGLN NM_003186 SBA2 1.31 0.0439 WSB2 NM_018639 CYR61 1.30 0.0018 CYR61 NM_001554 SPARC 1.30 0.0117 SPARC NM_003116 SNAI2 1.30 0.0076 SNAI2 NM_003068 TMSB10 1.30 0.0757 TMSB10 NM_021103 IGFBP3 1.30 0.0056 IGFBP3 NM_000598 PDGFC 1.29 0.0040 PDGFC NM_016205 SLPI 1.29 0.0026 SLPI NM_003064 COL1A2 1.29 0.0087 COL1A2 NM_000089 NRP2 1.29 0.0112 NRP2 NM_003872 PRKCA 1.29 0.0093 PRKCA NM_002737 KLF6 1.29 0.0661 KLF6 NM_001300 THBS1 1.28 0.0062 THBS1 NM_003246 EGR1 1.28 0.0067 EGR1 NM_001964 S100A4 1.28 0.0070 S100A4 NM_002961 CXCR4 1.28 0.0089 CXCR4 NM_003467 LAMA3 1.27 0.0024 LAMA3 NM_000227 LOX 1.26 0.0036 LOX NM_002317 AKAP12 1.26 0.0046 AKAP12 NM_005100 ADAPTS12 1.26 0.0109 ADAPTS12 NM_030955 MCP1 1.25 0.0122 CCL2 NM_002982 Grb10 1.25 0.0107 GRB10 NM_005311 PTGER3 1.25 0.0240 PTGER3 NM_000957 CRYAB 1.25 0.0035 CRYAB NM_001885 ANGPT2 1.25 0.0566 ANGPT2 NM_001147 ANXA1 1.25 0.0353 ANXA1 NM_000700 EphB6 1.24 0.0960 EPHB6 NM_004445 PDGFB 1.24 0.0139 PDGFB NM_002608 COL1A1 1.24 0.0198 COL1A1 NM_000088 TGFB3 1.23 0.0094 TGFB3 NM_003239 CTGF 1.23 0.0265 CTGF NM_001901 PDGFA 1.23 0.0312 NM_002607 HSPA1A 1.23 0.0027 HSPA1A NM_005345 EFNB2 1.23 0.0331 EFNB2 NM_004093 CAPG 1.23 0.0724 CAPG NM_001747 TGFBI 1.22 0.0231 TGFBI NM_000358 SIAT4A 1.22 0.0253 ST3GAL1 NM_003033 LAT 1.22 0.0307 LAT NM_014387 ITGAS 1.22 0.0224 ITGA5 NM_002205 GBP2 1.22 0.0225 GBP2 NM_004120 ANTXR1 1.22 0.0204 ANTXR1 NM_032208 ID4 1.22 0.0512 ID4 NM_001546 SFRP2 1.22 0.0039 SFRP2 NM_003013 TMEPAI 1.21 0.0170 TMEPAI NM_020182 CTSL 1.21 0.0388 CTSL NM_001912 KLK10 1.21 0.0007 KLK10 NM_002776 FXYD5 1.21 0.0547 FXYD5 NM_014164 GJB2 1.21 0.0356 GJB2 NM_004004 P14ARF 1.21 0.0451 S78535 DAPK1 1.21 0.0525 DAPK1 NM_004938 SKP1A 1.21 0.0663 SKP1A NM_006930 SFRP4 1.21 0.0078 SFRP4 NM_003014 KLK6 1.20 0.0048 KLK6 NM_002774 GJA1 1.20 0.0345 GJA1 NM_000165 HOXB7 1.20 0.0278 HOXB7 NM_004502 NDRG1 1.20 0.0948 NDRG1 NM_006096 PAI1 1.19 0.0061 SERPINE1 NM_000602 CDH11 1.19 0.0762 CDH11 NM_001797 EGR3 1.19 0.0149 EGR3 NM_004430 EMP1 1.19 0.0533 EMP1 NM_001423 FZD1 1.19 0.0671 FZD1 NM_003505 ABCC5 1.19 0.0631 ABCC5 NM_005688 S100P 1.18 0.0160 S100P NM_005980 OPN osteopontin 1.18 0.0030 SPP1 NM_000582 p16-INK4 1.17 0.0503 L27211 NR4A1 1.17 0.0332 NR4A1 NM_002135 TUBB 1.17 0.0950 TUBB2 NM_001069 SIAT7B 1.17 0.0352 ST6GALNAC2 NM_006456 ALDH1A1 1.17 0.0299 ALDH1A1 NM_000689 F3 1.16 0.0654 F3 NM_001993 SLC2A1 1.15 0.0806 SLC2A1 NM_006516 CXCL12 1.13 0.0986 CXCL12 NM_000609 STMY3 1.13 0.0518 MMP11 NM_005940 S100A2 1.13 0.0303 S100A2 NM_005978 FABP4 1.13 0.0363 FABP4 NM_001442 REG4 1.11 0.0034 REG4 NM_032044 pS2 1.09 0.0690 TFF1 NM_003225 MUC2 1.06 0.0674 MUC2 NM_002457 - Table 1 2B shows associations between clinical outcome and gene expression for those genes which demonstrated a Hazard Ratio<1.0 and for which p<0.1. Univariate Cox Proportional Hazards Regression analysis was applied in combmed Stage II (Duke's B) and Stage III (Duke's C) patients using RFI as the metric for clinical outcome.
Gene Hazard Ratio P Value Official Symbol Accession Number ORC1L 0.41 0.0623 ORC1L NM_004153 E2F1 0.63 0.0006 E2F1 NM_005225 HSPA8 0.63 0.0346 HSPA8 NM_006597 RAD54L 0.65 0.0026 RAD54L NM_003579 BRCA1 0.68 0.0001 BRCA1 NM_007295 SLC25A3 0.70 0.0100 SLC25A3 NM_213611 PPM1D 0.71 0.0025 PPM1D NM_003620 DHFR 0.71 0.0106 DHFR NM_000791 SKP2 0.72 0.0087 SKP2 NM_005983 FASN 0.73 0.0070 FASN NM_004104 HNRPD 0.73 0.0611 HNRPD NM_031370 ENO1 0.74 0.0432 ENO1 NM_001428 C20 orf1 0.74 0.0086 TPX2 NM_012112 BRCA2 0.75 0.0515 BRCA2 NM_000059 DDB1 0.75 0.0639 DDB1 NM_001923 KIF22 0.76 0.0127 KIF22 NM_007317 RPLPO 0.76 0.0330 RPLP0 NM_001002 Chk1 0.76 0.0164 CHEK1 NM_001274 ST14 0.77 0.0392 ST14 NM_021978 Bax 0.77 0.0502 BAX NM_004324 TCF-1 0.78 0.0023 TCF1 NM_000545 LMNB1 0.78 0.0458 LMNB1 NM_005573 RRM1 0.78 0.0693 RRM1 NM_001033 CSEL1 0.79 0.0261 CSE1L NM_001316 CDC20 0.79 0.0274 CDC20 NM_001255 PRDX2 0.79 0.0930 PRDX2 NM_005809 RPS13 0.79 0.0906 RPS13 NM_001017 RAF1 0.80 0.0717 RAF1 NM_002880 CMYC 0.80 0.0095 MYC NM_002467 UBE2M 0.80 0.0390 UBE2M NM_003969 CKS2 0.80 0.0596 CKS2 NM_001827 NME1 0.80 0.0694 NME1 NM_000269 c-myb (MYB official) 0.80 0.0082 MYB NM_005375 CD80 0.80 0.0688 CD80 NM_005191 CDCA7 v2 0.81 0.0164 CDCA7 NM_145810 EFP 0.81 0.0387 TRIM25 NM_005082 CCNE2 0.81 0.0405 CCNE2 NM_057749 SURV 0.81 0.0573 BIRC5 NM_001168 RRM2 0.82 0.0181 RRM2 NM_001034 ABCC6 0.82 0.0464 ABCC6 NM_001171 UMPS 0.82 0.0371 UMPS NM_000373 PI3KC2A 0.82 0.0855 PIK3C2A NM_002645 NOTCH1 0.82 0.0222 NOTCH1 NM_017617 EIF4E 0.82 0.0928 EIF4E NM_001968 EPHB2 0.82 0.0183 EPHB2 NM_004442 AREG 0.83 0.0012 AREG NM_001657 EREG 0.83 0.0059 EREG NM_001432 MYBL2 0.83 0.0234 MYBL2 NM_002466 ABCB1 0.83 0.0342 ABCB1 NM_000927 HRAS 0.83 0.0708 HRAS NM_005343 SLC7A5 0.84 0.0547 SLC7A5 NM_003486 MAD2L1 0.84 0.0653 MAD2L1 NM_002358 ING5 0.85 0.0920 ING5 NM_032329 Ki-67 0.85 0.0562 MKI67 NM_002417 MCM2 0.85 0.0671 MCM2 NM_004526 Cdx2 0.88 0.0430 CDX2 NM_001265 HES6 0.89 0.0966 HES6 NM_018645 PTPRO 0.89 0.0664 PTPRO NM_030667 cnpto (TDGF1 official) 0.90 0.0781 TDGF1 NM_003212 - Table 2.2A shows associations between clinical outcome and gene expression for those genes which demonstrated a Hazard Ratio>1.0 and for which p<0.1 Univariate Cox Proportional Hazards Regression analysis was applied in combined Stage II (Duke's B) and Stage III (Duke's C) patients using OS as the metric for clinical outcome
Gene Hazard Ratio P Value Official Symbol Accession Number RhoC 1.66 00002 RHOC NM_175744 ITGB1 1.59 0.0049 ITGB1 NM_002211 ANXA2 1.58 0.0004 ANXA2 NM_004039 CYP3A4 1.49 0.0114 CYP3A4 NM_017460 p21 1.49 <.0001 CDKN1A NM_000389 HMLH 1.42 0.0555 MLH1 NM_000249 VEGFC 1.41 0.0095 VEGFC NM_005429 TGFBR1 1.40 0.0113 TGFBR1 NM_004612 UBC 1.38 0.0013 UBC NM_021009 RhoB 1.37 0.0016 RHOB NM_004040 HSPG2 1.37 0.0111 HSPG2 NM_005529 PFN1 1.35 0.0987 PFN1 NM_005022 TIMP1 1.35 0.0008 TIMP1 NM_003254 VCL 1.33 0.0116 VCL NM_003373 INHBB 1.32 0.0265 INHBB NM_002193 SPINT2 1.32 0.0358 SPINT2 NM_021102 GHI BRAF mut4 1.31 0.0822 GHI_BRAF_mut4 LAMC2 1.31 0.0007 LAMC2 NM_005562 KCNH2 iso a/b 1.31 0.0474 KCNH2 NM_000238 UNC5C 1.30 0.0417 UNC5C NM_003728 CDC42 1.30 0.0122 CDC42 NM_001791 UBL1 1.29 0.0169 SUMO1 NM_003352 GADD45B 1.29 0.0003 GADD45B NM_015675 KRAS2 1.29 0.0774 KRAS NM_004985 HB-EGF 1.29 0.0219 HBEGF NM_001945 DKK1 1.28 0.0304 DKK1 NM_012242 FXYD5 1.28 0.0035 FXYD5 NM_014164 CALD1 1.28 0.0107 CALD1 NM_004342 ANXA5 1.27 0.0723 ANXA5 NM_001154 HLA-G 1.27 0.0732 HLA-G NM_002127 DUSP1 1.27 0.0004 DUSP1 NM_004417 LOXL2 1.27 0.0050 LOXL2 NM_002318 CDC42BPA 1.27 0.0155 CDC42BPA NM_003607 BGN 1.27 0.0039 BGN NM_001711 LAMB3 1.27 0.0221 LAMB3 NM_000228 EphB6 1.27 0.0373 EPHB6 NM_004445 SHC1 1.27 0.0582 SHC1 NM_003029 TIMP2 1.26 0.0126 TIMP2 NM_003255 CTSB 1.26 0.0748 CTSB NM_001908 TIMP3 1.26 0.0072 TIMP3 NM_000362 ID3 1.26 0.0033 ID3 NM_002167 CAPG 1.26 0.0162 CAPG NM_001747 NRP1 1.26 0.0135 NRP1 NM_003873 INHBA 1.26 0.0021 INHBA NM_002192 KLF6 1.25 0.0477 KLF6 NM_001300 IGFBP7 1.25 0.0251 IGFBP7 NM_001553 S100A1 1.25 0.0528 S100A1 NM_006271 EPAS1 1.24 0.0382 EPAS1 NM_001430 DLC1 1.24 0.0228 DLC1 NM_006094 KLK10 1.24 <.0001 KLK10 NM_002776 SBA2 1.24 0.0493 WSB2 NM_018639 SPARC 1.24 0.0133 SPARC NM_003118 GAGE4 1.23 0.0475 GAGE4 NM_001474 HSPA1A 1.23 0.0004 HSPA1A NM_005345 SIR2 1.23 0.0179 SIRT1 NM_012238 CGB 1.23 0.0202 CGB NM_000737 Grb10 1.22 0.0059 GRB10 NM_005311 SNAI2 1.22 0.0145 SNAI2 NM_003068 LAMA3 1.22 0.0019 LAMA3 NM_000227 AKT3 1.22 0.0169 AKT3 NM_005465 FYN 1.22 0.0138 FYN NM_002037 FOS 1.22 0.0035 FOS NM_005252 CTHRC1 1.21 0.0056 CTHRC1 NM_138455 CTSD 1.21 0.0506 CTSD NM_001909 THY1 1.21 0.0290 THY1 NM_006288 ANXA1 1.21 0.0339 ANXA1 NM_000700 CD68 1.21 0.0227 CD68 NM_001251 G-Catenin 1.20 0.0789 JUP NM_002230 PLK3 1.20 0.0081 PLK3 NM_004073 STC1 1.20 0.0577 STC1 NM_003155 TAGLN 1.20 0.0238 TAGLN NM_003186 VIM 1.20 0.0632 VIM NM_003380 HSPA1B 1.20 0.0302 HSPA1B NM_005346 LAT 1.20 0.0184 LAT NM_014387 KRT19 1.20 0.0309 KRT19 NM_002276 IGFBP3 1.20 0.0167 IGFBP3 NM_000598 BMP4 1.20 0.0035 BMP4 NM_001202 KLK6 1.20 0.0014 KLK6 NM_002774 THBS1 1.20 0.0206 THBS1 NM_003246 TULP3 1.19 0.0344 TULP3 NM_003324 ERK1 1.19 0.0522 Z11696 CREBBP 1.19 0.0866 CREBBP NM_004380 S100A4 1.19 0.0259 S100A4 NM_002961 PDGFB 1.19 0.0205 PDGFB NM_002608 EFNB2 1.19 0.0299 EFNB2 NM_004093 LOX 1.19 0.0104 LOX NM_002317 PTK2 1.18 0.0983 PTK2 NM_005607 IGFBP5 1.18 0.0544 IGFBP5 NM_000599 APC 1.18 0.0461 APC NM_000038 DYRK1B 1.18 0.0681 DYRK1B NM_004714 NOTCH2 1.18 0.0533 NOTCH2 NM_024408 Maspin 1.18 0.0033 SERPINB5 NM_002639 AKAP12 1.18 0.0195 AKAP12 NM_005100 COL1A1 1.17 0.0417 COL1A1 NM_000088 EMP1 1.17 0.0295 EMP1 NM_001423 SIAT4A 1.17 0.0311 ST3GAL1 NM_003033 PAI1 1.17 0.0036 SERPINE1 NM_000602 NR4A1 1.17 0.0117 NR4A1 NM_002135 EGR1 1.17 0.0379 EGR1 NM_001964 BRK 1.17 0.0156 PTK6 NM_005975 UNC5B 1.17 0.0956 UNC5B NM_170744 SR-A1 1.17 0.0512 SR-A1 NM_021228 MRP3 1.16 0.0353 ABCC3 NM_003786 hCRA a 1.16 0.0878 U78556 Upa 1.16 0.0630 PLAU NM_002658 BCAS1 1.16 0.0147 BCAS1 NM_003657 PDGFC 1.16 0.0375 PDGFC NM_016205 COL1A2 1.16 0.0620 COL1A2 NM_000089 CTGF 1.16 0.0580 CTGF NM_001901 MCP1 1.16 0.0463 CCL2 NM_002982 RAB32 1.16 0.0686 RAB32 NM_006834 SKP1A 1.16 0.0842 SKP1A NM_006930 FAP 1.16 0.0443 FAP NM_004460 EFNA1 1.16 0.0990 EFNA1 NM_004428 HOXB7 1.15 0.0378 HOXB7 NM_004502 CYR61 1.15 0.0452 CYR61 NM_001554 TGFBI 1.15 0.0591 TGFBI NM_000358 TMEPAI 1.15 0.0419 TMEPAI NM_020182 SIN3A 1.15 0.0853 SIN3A NM_015477 S100A2 1.15 0.0038 S100A2 NM_005978 PDGFA 1.15 0.0840 NM_002607 MMP7 1.15 0.0469 MMP7 NM_002423 ANTXR1 1.15 0.0520 ANTXR1 NM_032208 SLPI 1.14 0.0755 SLPI NM_003064 SFRP2 1.13 0.0253 SFRP2 NM_003013 S100A8 1.13 0.0795 S100A8 NM_002964 TP53I3 1.13 0.0973 TP53I3 NM_004881 F3 1.13 0.0735 F3 NM_001993 OPN osteopontin 1.12 0.0100 SPP1 NM_000582 EGLN3 1.11 0.0883 EGLN3 NM_022073 FZD6 1.11 0.0791 FZD6 NM_003506 OSM 1.10 0.0913 OSM NM_020530 FABP4 1.10 0.0521 FABP4 NM_001442 GSTT1 1.09 0.0837 GSTT1 NM_000853 REG4 1.07 0.0300 REG4 NM_032044 - Table 2.2B shows associations between clinical outcome and gene expression for those genes which demonstrated a Hazard Ratio<1.0 and for which p<0.1. Univariate Cox Proportional Hazards Regression analysis was applied in combined Stage II (Duke's B) and Stage III (Duke's C) patients using OS as the metric for clinical outcome
Gene Hazard Ratio P Value Official Symbol Accession Number ORC1L 0.52 0.0895 ORC1L NM_004153 HSPA8 0.64 0.0164 HSPA8 NM_006597 SKP2 0.71 0.0012 SKP2 NM_005983 PRDX4 0.74 0.0202 PRDX4 NM_006406 DHFR 0.76 0.0111 DHFR NM_000791 FGF18 0.76 0.0915 FGF18 NM_003862 SLC25A3 0.76 0.0391 SLC25A3 NM_213611 RRM1 0.77 0.0218 RRM1 NM_001033 E2F1 0.78 0.0180 E2F1 NM_005225 SURV 0.79 0.0098 BIRC5 NM_001168 PPM1D 0.80 0.0154 PPM1D NM_003620 CCNE2 0.80 0.0090 CCNE2 NM_057749 BRCA1 0.80 0.0093 BRCA1 NM_007295 ST14 0.80 0.0438 ST14 NM_021978 c-myb (MYB official) 0.81 0.0027 MYB NM_005375 Chk1 0.81 0.0220 CHEK1 NM_001274 C20 orf1 0.81 0.0305 TPX2 NM_012112 EI24 0.81 0.0574 EI24 NM_004879 CDC20 0.82 0.0234 CDC20 NM_001255 TCF-1 0.82 0.0061 TCF1 NM_000545 PPID 0.83 0.0584 PPID NM_005038 KIF22 0.33 0.0466 KIF22 NM_007317 UBE2M 0.83 0.0850 UBE2M NM_003969 MRPL40 0.83 0.0716 MRPL40 NM_003776 RPLPO 0.84 0.0987 RPLPO NM_001002 LMNB1 0.84 0.0910 LMNB1 NM_005573 DUT 0.84 0.0401 DUT NM_001948 CD44E 0.84 0.0483 X55150 MCM2 0.85 0.0214 MCM2 NM_004526 CDC6 0.85 0.0235 CDC6 NM_001254 AURKB 0.85 0.0373 AURKB NM_004217 SMARCA3 0.86 0.0562 SMARCA3 NM_003071 COCA7 v2 0.86 0.0435 CDCA7 NM_145810 EPHB2 0.86 0.0281 EPHB2 NM_004442 CMYC 0.86 0.0441 MYC NM_002467 ABCB1 0.86 0.0352 ABCB1 NM_000927 Cdx2 0.87 0.0156 CDX2 NM_001265 PPARG 0.88 0.0655 PPARG NM_005037 MYBL2 0.88 0.0667 MYBL2 NM_002466 EREG 0.89 0.0352 EREG NM_001432 AREG 0.90 0.0221 AREG NM_001657 - Table 3.2A shows associations between clinical outcome and gene expression for those genes which demonstrated a Hazard Ratio> 1 0 and for which p<0.1. Univariate Cox Proportional Hazards Regression analysis was applied in combined Stage II (Duke's B) and Stage III (Duke's C) patients using DFS as the metric for clinical outcome
Gene Hazard Ration P Value Official Symbol Accession Number ANXA2 1.67 <.0001 ANXA2 NM_004039 CYP3A4 1.59 0.0035 CYP3A4 NM_017460 RhoC 1.52 0.0010 RHOC NM_175744 TJP1 1.44 0.0951 TJP1 NM_003257 HB-EGF 1.39 0.0023 HBEGF NM_001945 p21 1.39 0.0006 CDKN1A NM_000389 HMLH 1.37 0.0678 MLH1 NM_000249 ITGB1 1.37 0.0419 ITGB1 NM_002211 UBC 1.34 0.0024 UBC NM_021009 VEGFC 1.33 0.0246 VEGFC NM_005429 TIMP1 1.33 0.0007 TIMP1 NM_003254 CCNE2 variant 1 1.32 0.0745 CCNE2 NM_057749 SPINT2 1.32 0.0224 SPINT2 NM_021102 LAMC2 1.32 0.0002 LAMC2 NM_005562 VCL 1.31 0.0119 VCL NM_003373 RhoB 1.31 0.0049 RHOB NM_004040 PKR2 1.30 0.0258 PKM2 NM_002654 ANXA5 1.30 0.0406 ANXA5 NM_001154 GADD45B 1.30 0.0001 GADD45B NM_015675 INHBB 1.29 0.0368 INHBB NM_002193 DUSP1 1.29 <.0001 DUSP1 NM_004417 KRAS2 1.28 0.0686 KRAS NM_004985 KLF6 1.28 0.0284 KLF6 NM_001300 IGFBP7 1.27 0.0103 IGFBP7 NM_001553 GRIK1 1.27 0.0421 GRIK1 NM_000830 DLC1 1.27 0.0084 DLC1 NM_006094 FOS 1.26 0.0003 FOS NM_005252 HSPG2 1.28 0.0443 HSPG2 NM_005529 INHBA 1.26 0.0009 INHBA NM_002192 TIMP3 1.26 0.0045 TIMP3 NM_000362 BGN 1.26 0.0035 BGN NM_001711 CGB 1.26 0.0172 CGB NM_000737 HK1 1.26 0.0352 HK1 NM_000188 SHC1 1.25 0.0562 SHY1 NM_003029 STC1 1.25 0.0161 STC1 NM_003155 LOXL2 1.24 0.0078 LOXL2 NM_002318 CAPG 1.24 0.0161 CAPG NM_001747 UNC5B 1.23 0.0204 UNC5B NM_170744 MVP 1.23 0.0729 MVP NM_017458 CTSD 1.23 0.0256 CTSD NM_001909 EGR1 1.23 0.0041 EGR1 NM_001964 LOX 1.23 0.0017 LOX NM_002317 CDC42BPA 1.23 0.0278 CDC42BPA NM_003607 GAGE4 1.23 0.0425 GAUGE4 NM_001474 CALD1 1.22 0.0239 CALD1 NM_004342 FXYD5 1.22 0.0096 FXYD5 NM_014164 EphB6 1.22 0.0825 EPHB6 NM_004445 LAMB3 1.22 0.0444 LAMB3 NM_000228 VEGF 1.21 0.0267 VEGF NM_003376 PDGFB 1.21 0.0062 PDGFB NM_002608 TIMP2 1.21 0.0292 TIMP2 NM_003255 A-Catenin 1.21 0.0598 CTNNA1 NM_001903 IGFBP3 1.21 0.0081 IGFBP3 NM_000598 CD68 1.21 0.0138 CD68 NM_001251 S100A1 1.21 0.0886 S100A1 NM_006271 SIAT4A 1.21 0.0076 ST3GAL1 NM_003033 HSPA18 1.21 0.0182 HSPA1B NM_005346 DKK1 1.20 0.0900 DKK1 NM_012242 SBA2 1.20 0.0733 WSB2 NM_018639 SIR2 1.20 0.0250 SIRT1 NM_012238 THBS1 1.20 0.0119 THBS1 NM_003246 FYN 1.20 0.0158 FYN NM_002037 TULP3 1.20 0.0205 TULP3 NM_003324 LAMA3 1.20 0.0026 LAMA3 NM_000227 NR4A1 1.20 0.0022 NR4A1 NM_002135 EFNA1 1.20 0.0258 EFNA1 NM_004426 EMP1 1.20 0.0102 EMP1 NM_001423 SPARC 1.19 0.0333 SPARC NM_003118 G-Catenin 1.19 0.0761 JUP NM_002230 CYR61 1.19 0.0103 CYR61 NM_001554 Maspin 1.19 0.0015 SERPINB5 NM_002639 HSPA1A 1.18 0.0018 HSPA1A NM_005345 PTHR1 1.18 0.0856 PTHR1 NM_000316 EPAS1 1.18 0.0789 EPAS1 NM_001430 Grb10 1.18 0.0173 GRB10 NM_005311 ERK1 1.18 0.0464 Z11696 VIM 1.18 0.0772 VIM NM_003380 SNAI2 1.18 0.0379 SNAI2 NM_003068 IGFBP5 1.17 0.0492 IGFBP5 NM_000599 CTHRC1 1.17 0.0155 CTHRC1 NM_138455 THY1 1.17 0.0562 THY1 NM_006288 NRP1 1.17 0.0747 NRP1 NM_003873 PTGER3 1.17 0.0493 PTGER3 NM_000957 ID3 1.17 0.0437 ID3 NM_002167 F3 1.17 0.0157 F3 NM_001993 CTGF 1.17 0.0394 CTGF NM_001901 KRT19 1.17 0.0517 KRT19 NM_002276 PAI1 1.17 0.0033 SERPINE1 NM_000602 FAP 1.17 0.0260 FAP NM_004460 ANXA1 1.16 0.0688 ANXA1 NM_000700 KLK10 1.16 0.0009 KLK10 NM_002776 EFNB2 1.16 0.0447 EFNB2 NM_004093 P14ARF 1.16 0.0573 S78535 MCP1 1.16 0.0359 CCL2 NM_002982 PLK3 1.16 0.0296 PLK3 NM_004073 ANTXR1 1.16 0.0243 ANTXR1 NM_032208 ADAMTS12 1.16 0.0346 ADAMTS12 NM_030955 EGR3 1.16 0.0109 EGR3 NM_004430 APC 1.16 0.0733 APC NM_000038 PDGFC 1.16 0.0326 PDGFC NM_016205 BMP4 1.16 0.0151 BMP4 NM_001202 HOXB7 1.15 0.0281 HOXB7 NM_004502 NDRG1 1.15 0.0912 NDRG1 NM_006096 Herstatin 1.15 0.0380 AF177761 TMEPAI 1.15 0.0268 TMEPAI NM_020182 IL6 1.15 0.0914 IL6 NM_000600 PDGFA 1.15 0.0599 NM_002607 TGFBI 1.15 0.0439 TGFBI NM_000358 Upa 1.15 0.0740 PLAU NM_002658 S100A4 1.15 0.0621 S100A4 NM_002961 SLPI 1.15 0.0447 SLPI NM_003064 KLK6 1.15 0.0112 KLK6 NM_002774 COL1A1 1.15 0.0637 COL1A1 NM_000088 GJB2 1.15 0.0604 GJB2 NM_004004 PKD1 1.15 0.0939 PKD1 NM_000296 TP5313 1.15 0.0450 TP53I3 NM_004881 PLAUR 1.14 0.0477 PLAUR NM_002659 TAGLN 1.14 0.0739 TAGLN NM_003186 COL1A2 1.14 0.0818 COL1A2 NM_000089 S100A2 1.14 0.0045 S100A2 NM_005978 AKT3 1.14 0.0949 AKT3 NM_005465 SEMA3B 1.13 0.0467 SEMA3B NM_004636 BRK 1.13 0.0476 PTK6 NM_005975 OSM 1.13 0.0344 OSM NM_020530 SFRP2 1.12 0.0279 SFRP2 NM_003013 MRP3 1.12 0.0946 ABCC3 NM_003786 EGLN3 1.12 0.0452 EGLN3 NM_022073 SIAT7B 1.12 0.0603 ST6GALNAC2 NM_006456 OPN, osteopontin 1.12 0.0082 SPP1 NM_000582 S100P 1.12 0.0313 S100P NM_005980 AKAP12 1.12 0.0865 AKAP12 NM_005100 MMP7 1.11 0.0909 MMP7 NM_002423 FABP4 1.11 0.0214 FABP4 NM_001442 CRYAB 1.11 0.0960 CRYAB NM_001885 SFRP4 1.10 0.0625 SFRP4 NM_003014 EFNA3 1.10 0.0707 EFNA3 NM_004952 GSTT1 1.09 0.0516 GSTT1 NM_00853 pS2 1.08 0.0313 TFF1 NM_003225 REG4 1.08 0.0080 REG4 NM_032044 IGFBP2 1.08 0.0846 IGFBP2 NM_000597 MUC5B 1.08 0.0387 MUC5B XM_039877 - Table 3.2B shows associations between clinical outcome and gene expression for those genes which demonstrated a Hazard Ratio<1 0 and for which p<0.1. Univanate Cox Proportional Hazards Regression analysis was applied in combined Stage II (Duke's B) and Stage III (Duke's C) patients using DFS as the metric for clinical outcome
Gene Hazard Ratio P Value Official Symbol Accession Number HSPA8 0.72 0.0604 HSPA8 NM_006597 SLC25A3 0.73 0.0126 SLC25A3 NM_213611 E2F1 0.73 0.0019 E2F1 NM_005225 IFIT1 0.74 0.0820 IFIT1 NM_001548 PPM1D 0.74 0.0007 PPM1D MM_003620 SKP2 0.75 0.0049 SKP2 NM_005983 RRM1 0.78 0.0224 RRM1 NM_001033 DDB1 0.79 0.0720 DDB1 NM_001923 NPM1 0.79 0.0255 NPM1 NM_002520 PRDX4 0.80 0.0570 PRDX4 NM_006406 BRCA1 0.80 0.0064 BRCA1 NM_007295 C20 orf1 0.81 0.0180 TPX2 NM_012112 Chk1 0.81 0.0148 CHEK1 NM_001274 EI24 0.81 0.0417 EI24 NM_004879 CCNE2 0.81 0.0094 CCNE2 NM_057749 HMGB1 0.82 0.0852 HMGB1 NM_002128 SURV 0.82 0.0185 BIRC5 NM_001168 KIF22 0.82 0.0264 KIF22 NM_007317 RAD54L 0.82 0.0674 RAD54L NM_003579 c-myb (MYB official) 0.82 0.0038 MYB NM_005375 DHFR 0.82 0.0669 DHFR NM_000791 TNFRSF5 0.83 0.0855 CD40 NM_001250 LMNB1 0.83 0.0741 LMNB1 NM_005573 CDC20 0.85 0.0538 CDC20 NM_001255 CDCA7 v2 0.85 0.0277 CDCA7 NM_145810 FASN 0.85 0.0919 FASN NM_004104 MCM2 0.85 0.0194 MCM2 NM_004526 ABCB1 0.85 0.0169 ABCB1 NM_000927 EIF4E 0.85 0.0902 EIF4E NM_001968 DUT 0.86 0.0535 DUT NM_001948 C20ORF126 0.86 0.0932 PDRG1 NM_030815 MCM6 0.86 0.0970 MCM6 NM_005915 EFP 0.87 0.0850 TRIM25 NM_005082 EPHB2 0.87 0.0314 EPHB2 NM_004442 GCLC 0.87 0.0862 GCLC NM_001498 RCC1 0.87 0.0540 RCC1 NM_001269 AREG 0.87 0.0028 AREG NM_001657 CMYC 0.88 0.0584 MYC NM_002467 MYBL2 0.88 0.0567 MYBL2 NM_002466 TCF-1 0.88 0.0644 TCF1 NM_000545 EREG 0.89 0.0232 EREG NM_001432 Cdx2 0.90 0.0354 CDX2 NM_001265 PTPRO 0.92 0.0935 PTPRO NM_030667 cripto (TDGF1 official) 0.92 0.0950 TDGF1 NM_003212 HLA-DRB1 0.93 0.0521 HLA-DRB1 NM_002124 - Table 4 2A shows associations between clinical outcome and gene expression for those genes which demonstrated a Hazard Ratio>1.0 and for which p<0.1 Univariate Cox Proportional Hazards Regression analysis was applied in combined Stage II (Duke's B) and Stage III (Duke's C) patients using DRFI as the metric for clinical outcome
Gene Hazard Ratio P Value Official Symbol Accession Number ALDOA 3.21 0.0189 ALDOA NM_000034 DCK 2.60 0.0248 DCK NM_000788 ITGB1 2.58 0.0002 ITGB1 NM_002211 COX2 2.16 0.0198 PTGS2 NM_000963 TJP1 2.10 0.0122 TJP1 NM_003257 STAT3 1.87 0.0148 STAT3 NM_003150 ANXA5 1.83 0.0043 ANXA5 NM_001154 GHI BRAF mut4 1.82 0.0024 GHI_BRAF_mut4 TIMP1 1.80 <.0001 TIMP1 NM_003254 hMLH 1.80 0.0242 MLH1 NM_000249 PADI4 1.74 0.0288 PADI4 NM_012387 rhoC 1.74 0.0093 RHOC NM_175744 CYP3A4 1.73 0.0219 CYP3A4 NM_017460 wwox 1.72 0.0467 WWOX NM_016373 ANXA2 1.70 0.0081 ANXA2 NM_004039 LILRB3 1.70 0.0295 LILRB3 NM_006864 VIM 1.66 0.0015 VIM NM_003380 FUS 1.65 0.0432 FUS NM_004960 KCNH2 iso a/b 1.64 0.0111 KCNH2 NM_000238 RhoB 1.63 0.0019 RHOB NM_004040 CRIP2 1.62 0.0455 CRIP2 NM_001312 AKT3 1.60 0.0004 AKT3 NM_005465 RBX1 1.60 0.0195 RBX1 NM_014248 HB-EGF 1.59 0.0032 HBEGF NM_001945 NRP2 1.55 0.0007 NRP2 NM_003872 MSH3 1.55 0.0353 MSH3 NM_002439 PI3K 1.54 0.0651 PIK3C2B NM_002646 BGN 1.54 0.0009 BGN NM_001711 RAB6C 1.54 0.0210 RAB6C NM_032144 CTSB 1.53 0.0415 CTSB NM_001908 DLC1 1.53 0.0047 DLC1 NM_006094 p21 1.53 0.0085 CDKN1A NM_000389 CCNE2 variant 1 1.52 0.0647 CCNE2 NM_057749 CALD1 1.51 0.0069 CALD1 NM_004342 SBA2 1.51 0.0202 WSB2 NM_018639 SIR2 1.51 0.0028 SIRT1 NM_012238 ITGA5 1.50 0.0006 ITGA5 NM_002205 RAP1GDS1 1.50 0.0317 RAP1GDS1 NM_021159 CTHRC1 1.46 0.0010 CTHRC1 NM_138455 STC1 1.46 0.0083 STC1 NM_003155 KLF6 1.46 0.0362 KLF6 NM_001300 CDC42BPA 1.45 0.0187 CDC42BPA NM_003607 CEBPB 1.45 0.0605 CEBPB NM_005194 LAMC2 1.45 0.0031 LAMC2 NM_005562 TGFBR1 1.45 0.0824 TGFBR1 NM_004612 TLN1 1.45 0.0730 TLN1 NM_006289 CDC42 1.44 0.0387 CDC42 NM_001791 FYN 1.43 0.0070 FYN NM_002037 IGFBP7 1.43 0.0283 IGFBP7 NM_001553 ARG 1.43 0.0119 ABL2 NM_005158 HIF1A 1.42 0.0397 HIF1A NM_001530 FST 1.42 0.0460 FST NM_006350 S100A1 1.42 0.0473 S100A1 NM_006271 FAP 1.42 0.0023 FAP NM_004460 DUSP1 1.42 0.0014 DUSP1 NM_004417 EPAS1 1.41 0.0494 EPAS1 NM_001430 Grb10 1.41 0.0027 GRB10 NM_005311 VEGFC 1.41 0.0894 VEGFC NM_005429 INHBB 1.41 0.0710 INHBB NM_002193 GADD45B 1.40 0.0023 GADD45B NM_015675 UBC 1.40 0.0368 UBC NM_021009 GJA1 1.40 0.0053 GJA1 NM_000165 COL1A2 1.40 0.0086 COL1A2 NM_000089 RBM5 1.40 0.0423 RBM5 NM_005778 ROCK1 1.39 0.0604 ROCK1 NM_005406 CTGF 1.39 0.0081 CTGF NM_001901 FLT4 1.39 0.0978 FLT4 NM_002020 PDGFC 1.39 0.0052 PDGFC NM_016205 INHBA 1.39 0.0058 INHBA NM_002192 LOXL2 1.38 0.0209 LOXL2 NM_002318 THBS1 1.37 0.0090 THBS1 NM_003246 ITGAV 1.37 0.0298 ITGAV NM_002210 NCAM1 1.36 0.0714 NCAM1 NM_000615 PTHR1 1.35 0.0410 PTHR1 NM_000316 TIMP2 1.35 0.0446 TIMP2 NM_003255 LOX 1.35 0.0041 LOX NM_002317 SPARC 1.35 0.0292 SPARC NM_003118 TAGLN 1.34 0.0222 TAGLN NM_003186 CYR61 1.34 0.0086 CYR61 NM_001554 RANBP9 1.34 0.0553 RANBP9 NM_005493 GADD45 1.34 0.0604 GADD45A NM_001924 S100A4 1.34 0.0141 S100A4 NM_002961 SNA12 1.33 0.0263 SNA12 NM_003068 EGR1 1.33 0.0174 EGR1 NM_001964 CDH11 1.33 0.0355 CDH11 NM_001797 SI 1.33 0.0967 SI NM_001041 PTK2 1.33 0.0911 PTK2 NM_005607 MCP1 1.32 0.0215 CCL2 NM_002982 PCAF 1.32 0.0463 PCAF NM_003884 c-abl 1.32 0.0868 ABL1 NM_005157 TIMP3 1.32 0.0455 TIMP3 NM_000362 ANGPT2 1.31 0.0711 ANGPT2 NM_001147 NOTCH2 1.30 0.0645 NOTCH2 NM_024408 GBP2 1.30 0.0218 GBP2 NM_004120 PAI1 1.30 0.0022 SERPINE1 NM_000602 CXCR4 1.30 0.0341 CXCR4 NM_003467 BCAS1 1.30 0.0060 BCAS1 MM_003657 COL1A1 1.29 0.0349 COL1A1 NM_000088 PIM1 1.29 0.0507 PIM1 NM_002648 PDGFB 1.29 0.0288 PDGFB NM_002608 Bcl2 1.29 0.0270 BCL2 NM_000633 SLP1 1.29 0.0222 SLP1 NM_003064 IGFBP5 1.29 0.0676 IGFBP5 NM_000599 ANXA1 1.29 0.0690 ANXA1 NM_000700 FGFR1 1.28 0.0790 FGFR1 NM_023109 CAPG 1.28 0.0987 CAPG NM_001747 PRKCA 1.28 0.0548 PRKCA NM_002737 EPHA2 1.28 0.0339 EPHA2 NM_004431 AKAP12 1.28 0.0215 AKAP12 NM_005100 FOS 1.28 0.0219 FOS NM_005252 CXCL12 1.27 0.0169 CXCL12 NM_000609 GCNT1 1.27 0.0875 GCNT1 NM_001490 IGFBP3 1.27 0.0499 IGFBP3 NM_000598 DPYD 1.27 0.0259 DPYD NM_000110 CD68 1.27 0.0752 CD68 NM_001251 EFNA1 1.27 0.0890 EFNA1 NM_004428 ABCC5 1.26 0.0536 ABCC5 NM_005688 TUBB 1.26 0.0635 TUBB2 NM_001069 PDGFA 1.26 0.0676 NM_002607 DAPK1 1.26 0.0701 DAPK1 NM_004938 SFRP2 1.25 0.0109 SFRP2 NM_003013 ID3 1.25 0.0744 ID3 NM_002167 CTSL 1.25 0.0679 CTSL NM_001912 LAMA3 1.25 0.0299 LAMA3 NM_000227 KRT19 1.25 0.0982 KRT19 NM_002276 S100AB 1.25 0.0228 S100A8 NM_002964 IL6 1.25 0.0933 IL6 NM_000600 MRP3 1.25 0.0538 ABCC3 NM_003786 FES 1.25 0.0694 FES NM_002005 AP-1 (JUN official) 1.25 0.0974 JUN NM_002228 WISP1 1.24 0.0897 WISP1 NM_003882 SFRP4 1.24 0.0250 SFRP4 NM_003014 TGFBI 1.24 0.0692 TGFBI NM_000358 Maspin 1.24 0.0152 SERPINB5 NM_002639 HOXB7 1.23 0.0541 HOXB7 NM_004502 P14ARF 1.23 0.0944 S78535 HSPA1A 1.23 0.0259 HSPA1A NM_005345 EGR3 1.22 0.0312 EGR3 NM_004430 CRYAB 1.22 0.0483 CRYAB NM_001885 ALDH1A1 1.22 0.0372 ALDH1A1 NM_000689 TGFB3 1.22 0.0673 TGFB3 NM_003239 KLK6 1.21 0.0288 KLK6 NM_002774 ANTXR1 1.21 0.0942 ANTXR1 NM_032208 FZD6 1.20 0.0479 FZD6 NM_003506 ILT-2 1.20 0.0930 LILRB1 NM_006669 S100A2 1.20 0.0116 S100A2 NM_005978 MMP7 1.18 0.0987 MMP7 NM_002423 FABP4 1.17 0.0371 FABP4 NM_001442 OPN, osteopontin 1.17 0.0301 SPP1 NM_000582 KLK10 1.16 0.0581 KLK10 NM_002776 pS2 1.15 0.0186 TFF1 NM_003225 REG4 1.14 0.0053 REG4 NM_032044 MUC2 1.09 0.0429 MUC2 NM_002457 - Table 4 2B shows associations between clinical outcome and gene expression for those genes which demonstrated a Hazard Ratio<1 0 and for which p<0.1 Univariate Cox Proportional Hazards Regression analysis was applied in combined Stage II (Duke's B) and Stage III (Duke's C) patients using DRFI as the metric for clinical outcome.
Gene Hazard Ratio P Value Official Symbol Accession Number HSPCA8 0.48 0.0114 HSPA8 NM_006597 RPS13 0.64 0.0082 RPS13 NM_001017 NDUFS3 0.66 0.0096 NDUFS3 NM_004551 ST14 0.66 0.0132 ST14 NM_021978 LMNB1 0.66 0.0135 LMNB1 NM_005573 TMSB4X 0.67 0.0039 TMSB4X NM_021109 DHFR 0.68 0.0260 DHFR NM_000791 BRCA1 0.68 0.0029 BRCA1 NM_007295 SKP2 0.68 0.0151 SKP2 NM_005983 SLC25A3 0.69 0.0265 SLC25A3 NM_213611 CDC20 0.69 0.0048 CDC20 NM_001255 RPLPO 0.70 0.0320 RPLPO NM_001002 TCF-1 0.70 0.0013 TCF1 NM_000545 RRM1 0.71 0.0598 RRM1 NM_001033 ATP5A1 0.71 0.0827 ATP5A1 NM_004046 NME1 0.73 0.0378 NME1 NM_000269 CKS2 0.74 0.0537 CKS2 NM_001827 EI24 0.74 0.0639 EI24 NM_004879 C20 orf1 0.74 0.0435 TPX2 NM_012112 SDC1 0.74 0.0930 SDC1 NM_002997 CSEL1 0.75 0.0443 CSE1L NM_001316 ABCC6 0.76 0.0416 ABCC6 NM_001171 MCM2 0.76 0.0136 MCM2 NM_004526 NFKBp65 0.77 0.0672 RELA NM_021975 EPHB2 0.77 0.0133 EPHB2 NM_004442 FASN 0.78 0.0980 FASN NM_004104 AURKB 0.78 0.0528 AURKB NM_004217 VDR 0.79 0.0832 VDR NM_000376 UMPS 0.80 0.0721 UMPS NM_000373 UBE2C 0.81 0.0860 UBE2C NM_007019 CMYC 0.82 0.0742 MYC NM_002467 MYBL2 0.83 0.0780 MYBL2 NM_002466 Cdx2 0.84 0.0392 CDX2 NM_001265 MX1 0.85 0.0786 MX1 NM_002462 EREG 0.85 0.0638 EREG NM_001432 AREG 0.85 0.0295 AREG NM_001657 - Table 5 2A shows associations between gene expression and RFI, controlling for particular demographic and clinical characteristics of patients included in the analysis All genes are listed whose expression correlates with RFI (p<0.1) and which demonstrated a Hazard Ratio >1 in a multivanate analysis including the following variables: tumor location, year of surgery, tumor grade, treatment protocol (C-01 or C-02), BCG treatment (yes or no), and classification of patients according to lymph node status as follows: 0 positive nodes and <12 nodes examined, 0 positive nodes and ≥12 nodes examined, 1-3 positive nodes, and ≥4 positive nodes.
Gene Hazard Ratio LR Chl-Square DF P value Official Symbol Accession Number RARB 2.02 3.42 1 0.0644 RARB NM_016152 COX2 1.69 313 1 0.0768 PTGS2 NM_000963 RhoC 1.60 8.71 1 0.0032 RHOC NM_175744 CYP3A4 1.57 5.15 1 0.0233 CYP3A4 NM_017460 RhoB 1.54 12.40 1 0.0004 RHOB NM_004040 ANXA2 1.54 701 1 0.0081 ANXA2 NM_004039 ITGB1 1.54 5.54 1 0.0186 ITGB1 NM_002211 NTN1 1.53 3.63 1 0.0568 NTN1 NM_004822 KRAS2 1.51 4.83 1 0.0279 KRAS NM_004985 IGFBP7 1.44 8.53 1 0.0035 IGFBP7 NM_001553 TIMP1 1.43 9.03 1 0.0027 TIMP1 NM_003254 wwox 1.43 2.73 1 0.0988 wwox NM_016373 CYP1B1 1.39 369 1 0.0548 CYP1B1 NM_000104 KCNH2 iso a/b 1.38 3.23 1 0.0723 KCNH2 NM_000238 STC1 1.37 6.55 1 0.0105 STC1 NM_003155 ITGAV 1.37 937 1 0.0022 ITGAV NM_002210 VEGFC 1.37 3.62 1 0.0571 VEGFC NM_005429 G-Catenin 1.36 4.78 1 0.0287 JUP NM_002230 S100A1 1.34 4.12 1 0.0423 S100A1 NM_006271 GADD45B 1.34 9.63 1 0.0019 GADD45B NM_015675 NCAM1 1.33 300 1 0.0832 NCAM1 NM_000615 CALD1 1.33 6.05 1 0.0139 CALD1 NM_004342 FST 1.33 4.24 1 0.0396 FST NM_006350 INHBA 1.33 9.68 1 0.0019 INHBA NM_002192 BGN 1.33 727 1 0.0070 BGN NM_001711 Claudin 4 1.33 713 1 0.0076 CLDN4 MM_001305 CEBPB 1.33 2.96 1 0.0851 CEBPB NM_005194 LAMC2 1.32 8.62 1 0.0033 LAMC2 NM_005562 SPINT2 1.32 3.14 1 0.0762 SPINT2 NM_021102 AKT3 1.32 7.54 1 0.0060 AKT3 NM_005465 TIMP3 1.32 6.33 1 0.0119 TIMP3 NM_000362 MAPK14 1.31 2.75 1 0.0972 MAPK14 NM_139012 HB-EGF 1.31 4.74 1 0.0294 HBEGF NM_001945 DUSP1 1.30 11.34 1 0 0008 DUSP1 NM_004411 EFNA1 1.30 5.87 1 0.0154 EFNA1 NM_004428 PTK2 1.29 360 1 0.0576 PTK2 NM_005607 DLC1 1.29 519 1 0.0227 DLC1 NM_006094 EPAS1 1.28 3.30 1 0.0693 EPAS1 NM_001430 THBS1 1.28 7.51 1 0.0061 THBS1 NM_003246 TIMP2 1.28 4.20 1 0.0404 TIMP2 NM_003255 TGFBI 1.27 668 1 0.0098 TGFBI NM_000358 DKK1 1.27 3.05 1 0.0806 DKK1 NM_012242 SPARC 1.26 4.37 1 0.0366 SPARC NM_003118 PDGFC 1.26 674 1 0.0094 PDGFC NM_016205 RAB6C 1.26 3.27 1 0.0704 RAB6C NM_032144 LOXL2 1.26 4.48 1 0.0343 LOXL2 NM_002318 CD68 1.25 4.68 1 0.0305 CD68 NM_001251 LOX 1.25 7.16 1 0.0075 LOX NM_002317 COC42BPA 1.25 335 1 0.0671 CDC42BPA NM_003607 TAGLN 1.25 483 1 0.0279 TAGLN NM_003186 CTHRC1 1.25 5.96 1 0.0146 CTHRC1 NM_138455 PDGFA 1.25 4.63 1 0.0314 NM_002607 TMEPAI 1.24 563 1 0.0176 TMEPAI NM_020182 RAB32 1.24 4.48 1 0.0343 RAB32 NM_006834 HSPA1A 1.24 8.19 1 0.0042 HSPA1A NM_005345 VIM 1.24 2.97 1 0.0848 VIM NM_003380 IGFBP5 1.23 3.69 1 0.0549 IGFBP5 NM_000599 EGR1 1.23 5.12 1 0.0236 EGR1 NM_001964 ANGPT2 1.23 296 1 0.0852 ANGPT2 NM_001147 NDRG1 1.22 291 1 0.0879 NDRG1 NM_006096 VEGF_altsplice1 1.22 4.08 1 0.0433 AF486837 SLPI 1.22 4.94 1 0.0262 SLPI NM_003064 FOS 1.22 567 1 0.0172 FOS NM_005252 VEGF 1.22 2.80 1 0.0942 VEGF NM_003376 ADAMTS12 1.22 4.40 1 0.0359 ADAMTS12 NM_030955 Maspin 1.22 7.60 1 0.0058 SERPINB5 NM_002639 CGB 1.22 3.25 1 0.0713 CGB NM_000737 CYR61 1.21 5.22 1 0.0224 CYR61 NM_001554 GJB2 1.21 3.77 1 0.0522 GJB2 NM_004004 IGFBP3 1.21 4.24 1 0.0396 IGFBP73 NM_000598 PRKCA 1.21 3.81 1 0.0508 PRKCA NM_002737 S100P 1.21 6.98 1 0.0082 S100P NM_005980 NRP2 1.21 3.25 1 0.0714 NRP2 NM_003872 EFNB2 1.21 3.00 1 0.0834 EFNB2 NM_004093 COL1A2 1.21 3.59 1 0.0581 COL1A2 NM_000089 VEGFB 1.20 2.80 1 0.0942 VEGFB NM_003377 HOXB7 1.20 4.37 1 0.0367 HOXB7 NM_004502 Grb10 1.20 3.91 1 0.0480 GRB10 NM_005311 FAP 1.20 4.12 1 0.0425 FAP NM_004460 GJA1 1.20 4.80 1 0.0285 GJA1 NM_000165 CTGF 1.19 3.38 1 0.0660 CTGF NM_001901 NR4A1 1.18 5.13 1 0.0235 NR4A1 NM_002135 COL1A1 1.18 2.77 1 0.0961 COL1A1 NM_000088 ABCC5 1.17 2.80 1 0.0945 ABCC5 NM_005688 EMP1 1.17 3.06 1 0.0804 EMP1 NM_001423 SFRP2 1.17 4.89 1 0.0270 SFRP2 NM_003013 SLC2A1 1.17 3.52 1 0.0606 SLC2A1 NM_006516 F3 1.17 3.10 1 0.0783 F3 NM_001993 S100A4 1.17 2.87 1 0.0900 S100A4 NM_002961 BRK 1.17 2.81 1 0.0935 PTK6 NM_005975 CRYAB 1.17 3.77 1 0.0523 CRYAB NM_001885 MDK 1.16 3.84 1 0.0500 MDK NM_002391 OPN, osteopontin 1.16 6.07 1 0.0138 SPP1 NM_000582 SFRP4 1.16 4.09 1 0.0432 SFRP4 NM_003014 SIAT4A 1.16 2.76 1 0.0969 ST3GAL1 NM_003033 LAMA3 1.16 3.23 1 0.0725 LAMA3 NM_000227 AKAP12 1.15 2.74 1 0.0976 AKAP12 NM_005100 KLK10 1.15 5.23 1 0.0221 KLK10 NM_002776 EGR3 1.14 3.16 1 0.0755 EGR3 NM_004430 PAI1 1.13 3.39 1 0.0655 SERPINE1 NM_000602 CEACAM6 1.13 2.98 1 0.0845 CEACAM6 NM_002483 KLK6 1.13 3.74 1 0.0532 KLK6 NM_002774 Nkd-1 1.11 3.34 1 0.0674 NKD1 NM_033119 IGFBP2 1.11 3.15 1 0.0758 IGFBP2 NM_000597 REG4 1.08 3.51 1 0.0610 REG4 NM_032044 - Table 5 2B shows associations between gene expression and RFI, controlling for particular demographic and clinical characteristics of patients included in the analysis. All genes are listed whose expression correlates with RFI (p<0.1) and which demonstrated a Hazard Ratio <1 in a multivanate analysis including the following variables: tumor location, year of surgery, tumor grade, treatment protocol (C-01 or C-02), BCG treatment (yes or no), and classification of patients according to lymph node status as follows. 0 positive nodes and <12 nodes examined, 0 positive nodes and ≥12 nodes examined, 1-3 positive nodes, and ≥4 positive nodes.
Gene Hazard Ratio LR Chi-Square DF P Value Official Symbol Accession Number Fasl 0.43 5.57 1 0.0183 FASLG NM_000639 BFGF 0.57 4.68 1 0.0306 NUDT6 NM_007083 EstR1 0.57 3.22 1 0.0726 ESR1 NM_000125 IFIT1 0.60 4.30 1 0.0381 IFIT1 NM_001548 KLRK1 0.64 10.81 1 0.0010 KLRK1 NM_007360 E2F1 0.65 7.49 1 0.0062 E2F1 NM_005225 BRCA1 0.66 16.33 1 <.0001 BRCA1 NM_007295 RAD54L 0.67 6.36 1 0.0117 RAD54L NM_003579 ATP5A1 0.67 5.50 1 0.0190 ATP5A1 NM_004046 MCM3 0.68 2.84 1 0.0922 MCM3 NM_002388 DHFR 0.68 7.44 1 0.0064 DHFR NM_000791 HSPA8 0.68 2.96 1 0.0855 HSPA8 NM_006597 APG-1 0.71 5.86 1 0.0155 HSPA4L NM_014278 BRCA2 0.71 4.69 1 0.0304 BRCA2 NM_000059 TRAIL 0.71 7.27 1 0.0070 TNFSF10 NM_003810 SLC25A3 0.71 5.56 1 0.0184 SLC25A3 NM_213611 PPM1D 0.72 8.02 1 0.0046 PPM1D NM_003620 Chk1 0.73 6.61 1 0.0102 CHEK1 NM_001274 CD80 0.73 6.85 1 0.0089 CD80 NM_005191 MADH2 0.73 3.93 1 0.0476 SMAD2 NM_005901 KIF22 0.75 5.77 1 0.0163 KIF22 NM_007317 TNFRSF5 0.76 3.52 1 0.0607 CD40 NM_001250 C20 orf1 0.76 4.82 1 0.0281 TPX2 NM_012112 ENO1 0.76 2.88 1 0.0894 ENO1 NM_001428 PRKCB1 0.77 4.25 1 0.0393 PRKCB1 NM_002738 RAF1 0.77 4.17 1 0.0412 RAF1 NM_002880 RRM1 0.78 3.07 1 0.0799 RRM1 NM_001033 UBE2M 0.78 4.43 1 0.0352 UBE2M NM_003969 SKP2 0.79 3.42 1 0.0644 SKP2 NM_005983 DUT 0.79 4.38 1 0.0364 DUT NM_001948 EI24 0.80 2.85 1 0.0912 EI24 NM_004879 UMPS 0.80 4.96 1 0.0260 UMPS NM_000373 EFP 0.81 3.83 1 0.0502 TRIM25 NM_005082 HRAS 0.81 3.80 1 0.0513 HRAS NM_005343 CDC20 0.81 3.78 1 0.0519 CDC20 NM_001255 CSF1 0.82 2.86 1 0.0910 CSF1 NM_000757 CKS2 0.82 2.90 1 0.0886 CKS2 NM_001827 ABCB1 0.82 4.02 1 0.0450 ABCB1 NM_000927 CDC6 0.83 4.23 1 0.0397 CDC6 NM_001254 GBP1 0.83 4.34 1 0.0373 GBP1 NM_002053 SURV 0.83 2.91 1 0.0878 BIRCS NM_001168 CCNE2 0.83 2.75 1 0.0975 CCNE2 NM_057749 RRM2 0.83 4.19 1 0.0407 RRM2 NM_001034 CMYC 0.84 3.34 1 0.0677 MYC NM_002467 TCF-1 0.84 3.96 1 . 0.0466 TCF1 NM_000545 c-myb (MYB official) 0.84 3.72 1 0.0538 MYB NM_005375 NOTCH1 0.85 3.39 1 0.0658 NOTCH1 NM_017617 MCM2 0.85 3.30 1 0.0693 MCM2 NM_004526 ING5 0.85 2.84 1 0.0922 ING5 NM_032329 AREG 0.88 3.72 1 0.0538 AREG NM_001657 HLA-DRB1 0.90 3.84 1 0.0500 HLA-DRB1 NM_002124 - Table 6 2 shows associations between gene expression and clinical outcome based on a nonlinear proportional hazards analysis, using a 2 degree-of-freedom natural spline. All genes are listed which demonstrated a departure from a strictly linear relationship (p<0.05) with RFI in combined Stage II (Duke's B) and Stage III (Duke's C) patients. The relationship between gene expression and RFI was not constant throughout the observed range of expression values in the study, e g increases in gene expression may have been related to increases in duration of RFI in one portion of the observed range and with decreases in duration of RFI in a different portion of the range.
Gene P Value Official Symbol Accession Number PTHLH <.0001 PTHLH NM_002820 TGFBR1 0.0011 TGFBR1 NM_004612 CDCA7 v2 0.0020 CDCA7 NM_145810 S100A4 0.0034 S100A4 NM_002961 CREBBP 0.0040 CREBBP NM_004380 Upa 0.0040 PLAU NM_002658 KLF5 0.0048 KLF5 NM_001730 CYP2C8 0.0070 CYP2C8 NM_000770 HES6 0.0090 HES6 NM_018645 Cad17 0.0093 CDH17 NM_004063 CEGP1 0.0100 SCUBE2 NM_020974 GHI k-ras mut3 0.0100 GHI_k-ras_mut3 AKT1 0.0104 AKT1 NM_005163 LAMBS 0.0111 LAMB3 NM_000228 CAPG 0.0120 CAPG NM_001747 FUT6 0.0130 FUT6 NM_000150 A-Catenin 0.0141 CTNNA1 NM_001903 CAPN1 0.0167 CAPN1 NM_005186 HSPE1 0.0180 HSPE1 NM_002157 MADH4 0.0180 SMAD4 NM_005359 STMY3 0.0190 MMP11 NM_005940 TRAG3 0.0200 CSAG2 NM_004909 GBP1 0.0200 GBP1 NM_002053 EFNA1 0.0210 EFNA1 NM_004428 SEMA3B 0.0210 SEMA3B NM_004636 CLTC 0.0216 CLTC NM_004859 BRK 0.0240 PTK6 NM_005975 Fas 0.0240 FAS NM_000043 CCNE2 variant 1 0.0243 CCNE2 NM_057749 TMEPAI 0.0246 TMEPAI NM_020182 PTPRJ 0.0260 PTPRJ NM_002643 SKP2 0.0261 SKP2 NM_005983 AGXT 0.0273 AGXT NM_000030 MAP2 0.0320 MAP2 NM_031846 PFN2 0.0330 PFN2 NM_053024 ATP5E 0.0350 ATP5E NM_006886 NRP1 0.0352 NRP1 NM_003873 MYH11 0.0360 MYH11 NM_002474 clAP2 0.0369 BIRC3 NM_001165 INHBA 0.0370 INHBA NM_002192 EGLN1 0.0371 EGLN1 NM_022051 GRIK1 0.0380 GRIK1 NM_000830 KDR 0.0380 KDR NM_002253 KLK6 0.0388 KLK6 NM_002774 APOC1 0.0390 APOC1 NM_001645 EP300 0.0390 EP300 NM_001429 DET1 0.0390 DET1 NM_017996 ITGB4 0.0394 ITGB4 NM_000213 CD3z 0.0400 CD3Z NM_000734 MAX 0.0400 MAX NM_002382 PAI1 0.0407 SERPINE1 NM_000602 MADH7 0.0430 SMAD7 NM_005904 SIR2 0.0440 SIRT1 NM_012238 NEDD8 0.0440 NEDD8 NM_006156 EPHB2 0.0445 EPHB2 NM_004442 BTF3 0.0460 BTF3 NM_001207 CD34 0.0470 CD34 NM_001773 VEGF_altsplice2 0.0480 AF214570 Wnt-5b 0.0480 WNT5B NM_032642 RXRA 0.0482 RXRA NM_002957 tusc4 0.0486 TUSC4 NM_006545 - Table 7.2 shows all genes exhibiting an interaction (p-value < 0 1) with tumor stage The data were modeled using a proportional hazards model of RFI with gene expression, tumor stage, and their interaction as predictors. Patients who had 0 positive nodes but <12 nodes examined were excluded from these analyses.
Gene HR Stage II HR P Value for Interaction Official Symbol Accession Number SOS1 3.35 0.81 0.0009 SOS1 NM_005633 ALCAM 2.36 0.94 0.0020 ALCAM NM_001627 pS2 1.58 1.04 0.0040 TFF1 NM_003225 TGFB2 1.83 0.95 0.0064 TGFB2 NM_003238 TFF3 1.57 0.90 0.0066 TFF3 NM_003226 KLF6 0.35 1.34 0.0092 KLF6 NM_001300 SNRPF 0.50 1.16 0.0106 SNRPF NM_003095 CENPA 2.41 0.94 0.0106 CENPA NM_001809 HES6 1.69 0.86 0.0119 HES6 NM_018645 CLDN1 0.51 0.95 0.0124 CLAN1 NM_021101 FGF2 0.19 0.97 0.0125 FGF2 NM_002006 LEF 1.94 0.94 0.0141 LEF1 NM_016269 MADH2 2.70 0.74 0.0145 SMAD2 NM_005901 TP53BP1 2.31 0.91 0.0153 TP53BP1 NM_005657 CCR7 1.89 0.98 0.0182 CCR7 NM_001838 MRP3 2.26 1.08 0.0204 ABCC3 NM_003786 UPP1 0.16 1.02 0.0208 UPP1 NM_003364 PTEN 3.46 1.00 0.0216 PTEN NM_000314 ST14 1.64 0.66 0.0223 ST14 NM_021978 FYN 2.28 1.10 0.0241 FYN NM_002037 CD24 1.33 0.84 0.0260 CD24 NM_013230 LMYC 1.80 0.82 0.0275 RLF NM_012421 CDC42BPA 2.82 1.12 0.0315 COC42BPA NM_003607 CAV1 2.11 0.95 0.0364 CAV1 NM_001753 CHFR 1.81 0.99 0.0382 CHFR NM_018223 MGAT5 1.59 0.72 0.0383 MGAT5 NM_002410 FPGS 1.93 0.71 0.0402 FPGS NM_004957 EMR3 2.63 0.57 0.0488 EMR3 NM_032571 SIR2 2.17 1.07 0.0538 SIRT1 NM_012238 PTK2B 1.44 0.93 0.0542 PTK2B NM_004103 Axin 2 1.38 0.90 0.0549 AXIN2 NM_004655 TRAG3 0.46 1.12 0.0570 CSAG2 NM_004909 MMP7 0.78 1.28 0.0608 MMP7 NM_002423 PFN2 1.33 0.84 0.0610 PFN2 NM_053024 PTPRJ 2.05 1.00 0.0632 PTPRJ NM_002843 CXCR4 1.96 1.08 0.0644 CXCR4 NM_003467 CCNA2 1.55 0.79 0.0661 CCNA2 NM_001237 MMP12 0.74 1.11 0.0685 MMP12 NM_002426 KRT8 0.64 1.27 0.0694 KRT8 NM_002273 ABCC5 2.06 1.14 0.0704 ABCC5 NM_005688 PRDX6 2.09 0.74 0.0711 PRDX6 NM_004905 WIF 1.54 0.77 0.0738 WIF1 NM_007191 cdc25A 2.48 0.94 0.0769 CDC25A NM_001789 KLF5 1.87 1.03 0.0772 KLF5 NM_001730 LRP5 1.92 0.98 0.0783 LRP5 NM_002335 PTPD1 0.54 1.00 0.0789 PTPN21 NM_007039 RALBP1 2.20 0.91 0.0791 RALBP1 NM_006788 TP53BP2 1.82 1.05 0.0819 TP53BP2 NM_005426 STAT5B 1.57 0.86 0.0822 STAT5B NM_012448 PPARG 1.32 0.79 0.0844 PPARG NM_005037 HB-EGF 0.50 1.38 0.0845 HBEGF NM_001945 RARA 1.77 0.96 0.0848 RARA NM_000964 GCNT1 1.86 1.07 0.0883 GCNT1 NM_001490 KI-67 1.53 0.86 0.0885 MKI67 NM_002417 EFNB2 1.76 1.05 0.0895 EFNB2 NM-004093 LGMN 0.59 1.37 0.0900 LGMN NM_001008530 DKK1 0.68 1.51 0.0922 DKK1 NM_012242 MADH4 2.04 0.98 0.0964 SMAD4 NM_005359 BIK 1.53 0.94 0.0966 BIK NM_001197 CD44v3 1.58 0.97 0.0996 AJ251595v3 


TABLE B Gene Locus Link Sequence Sequence ID Number A-Catenin NM_00190 3.1 
SEQ ID NO:2272 ABCB1 NM_00092 7.2 
SEQ ID NO:2273 ABCC5 NM_00568 8.1 
SEQ ID NO:2274 ABCC6 NM_00117 1.2 
SEQ ID NO:2275 ACP1 NM_00430 0.2 GCTACCAAGTCCGTGCTGTTTGTGTGTCTGGGTAACATTTGTCGATCACCCATTGCAGAAGCAGTTTTC SEQ ID NO:2276 ADAM 10 NM_00111 0.1 CCCATCAACTTGTGCCAGTACAGGGTCTGTGCAGTGGAGTAGGCACTTCAGTGGTCGAACCATCACC SEQ ID NO:2277 ADAM17 NM_00318 3.3 
SEQ ID NO:2278 ADAMTS12 NM_03095 5.2 
SEQ ID NO:2279 ADPRT NM_00161 8.2 
SEQ ID NO:2280 AGXT NM_00003 0.1 
SEQ ID NO:2281 AKAP12 NM_00510 0.2 
SEQ ID NO:2282 AKT1 NM_00516 3.1 
SEQ ID NO:2283 AKT2 NM_00162 6.2 
SEQ ID NO:2284 AKT3 NM_00546 5.1 
SEQ ID NO:2285 AL137428 AL137428. 1 CAAGAAGAGGCTCTACCCTGGGACTGGGAATTTCCAAGGCCACCTTTGAGGATCGCAGAGCTCATTT SEQ ID NO:2286 ALCAM NM_00162 7.1 GAGGAATATGGAATCCAAGGGGGCCAGTTCCTGCCGTCTGCTCTTCTGCCTCTTGATCTCCGCCAC SEQ ID NO:2287 ALDH1A1 NM_00068 9.1 
SEQ ID NO:2288 ALDOA NM_00003 4.2 GCCTGTACGTGCCAGCTCCCCGACTGCCAGAGCCTCAACTGTCTCTGCTTCGAGATCAAGCTCCGATGA SEQ ID NO:2289 AMFR NM_00114 4.2 
SEQ ID NO:2290 ANGPT2 NM_00114 7.1 CCGTGAAAGCTGCTCTGTAAAAGCTGACACAGCCCTCCCAAGTGAGCAGGACTGTTCTTCCCACTGCAA SEQ ID NO:2291 ANTXR1 NM_03220 8.1 CTCCAGGTGTACCTCCAACCCTAGCCTTCTCCCACAGCTGCCTACAACAGAGTCTCCCAGCCTTCTC SEQ ID NO:2292 ANXA1 NM_00070 0.1 GCCCCTATCCTACCTTCAATCCATCCTCGGATGTCGCTGCCTTGCATAAGGCCATAATGGTTAAAGG SEQ ID NO:2293 ANXA2 NM_00403 9.1 
SEQ ID NO:2294 ANXA5 NM_00115 4.2 GCTCAAGCCTGGAAGATGACGTGGTGGGGGACACTTCAGGGTACTACCAGCGGATGTTGGTGGTTCT SEQ ID NO:2295 AP-1 (JUN official) NM_00222 8.2 
SEQ ID NO:2296 APC NM_00003 8.1 GGACAGCAGGAATGTGTTTCTCCATACAGGTCACGGGGAGCCAATGGTTCAGAAACAAATCGAGTGGGT SEQ ID NO:2297 APEX-1 NM_00164 1.2 GATGAAGCCTTTCGCAAGTTCCTGAAGGGCCTGGCTTCCCGAAAGCCCCTTGTGCTGTGTGGAGACCT SEQ ID NO:2298 APG-1 NM_01427 8.2 ACCCCGGCCTGTATATCATTGGGATCAAGAACTCGAGCCATTGGAAATGCAGCAAAGAGCCAGATAG SEQ ID NO:2299 APN (ANPEP official) NM_00115 0.1 
SEQ ID NO:2300 APOC1 NM_00164 5.3 
SEQ ID NO:2301 AREG NM_00165 7.1 
SEQ ID NO:2302 ARG NM_00515 8.2 
SEQ ID NO:2303 ARHF NM_01903 4.2 
SEQ ID NO:2304 ATOH1 NM_00517 2.1 GCAGCCACCTGCAACTTTGCAGGCGAGAGAGCATCCCGTCTACCCGCCTGAGCTGTCCCTCCTGGA SEQ ID NO:2305 ATP5A1 NM_00404 6.3 GATGCTGCCACTCAACAACTTTTGAGTCGTGGCGTGCGTCTAACTGAGTTGCTGAAGCAAGGACA SEQ ID NO:2306 ATP5E NM_00688 6.2 CCGCTTTCGCTACAGCATGGTGGCCTACTGGAGACAGGCTGGACTCAGCTACATCCGATACTCCCA SEQ ID NO:2307 AURKB NM_00421 7.1 AGCTGCAGAAGAGCTGCACATTTGACGAGCAGCGAACAGCCACGATCATGGAGGAGTTGGCAGATGC SEQ ID NO:2308 Axin 2 NM_00465 5.2 GGCTATGTCTTTGCACCAGCCACCAGCGCCAACGACAGTGAGATATCCAGTGATGCGCTGACGGAT SEQ ID NO:2309 axin1 NM_00350 2.2 CCGTGTGACAGCATCGTTGTGGCGTACTACTTCTGCGGGGAACCCATCCCCTACCGCACCCTGGTGAG SEQ ID NO:2310 B-Catenin NM_00190 4.1 
SEQ_ID NO:2311 BAD NM_03298 9.1 
SEQ ID NO:2312 BAG1 NM_00432 3.2 
SEQ ID NO:2313 BAG2 NM_00428 2.2 CTAGGGGCAAAAAGCATGACTGCTTTTTCCTGTCTGGCATGGAATCACGCAGTCACCTTGGGCATTTAG SEQ ID NO:2314 BAG3 NM_00428 1.2 
SEQ ID NO:2315 Bak NM_00118 8.1 CCATTCCCACCATTCTACCTGAGGCCAGGACGTCTGGGGTGTGGGGATTGGTGGGTCTATGTTCCC SEQ ID NO:2316 Bax NM_00432 4.1 CCGCCGTGGACACAGACTCCCCCCGAGAGGTCTTTTTCCGAGTGGCAGCTGACATGTTTTCTGACGGCAA SEQ ID NO:2317 BBC3 NM_01441 7.1 
SEQ ID NO:2318 BCAS1 NM_00365 7.1 
SEQ ID NO:2319 Bcl2 NM_00063 3.1 
SEQ ID NO:2320 BCL2L10 NM_02039 6.2 
SEQ ID NO:2321 BCL2L11 NM_13862 1.1 AATTACCAAGCAGCCGAAGACCACCCACGAATGGTTATCTTACGACTGTTACGTTACATTGTCCGCCTG SEQ ID NO:2322 BCL2L12 NM_13863 9.1 
SEQ ID NO:2323 Bclx NM_00119 1.1 CTTTTGTGGAACTCTATGGGAACAATGCAGCAGCCGAGAGCCGAAAGGGCCAGGAACGCTTCAACCGCTG SEQ ID NO:2324 BCRP No_00482 7.1 
SEQ ID NO:2325 BFGF NM_00708 3.1 
SEQ ID NO:2326 BGN NM_00171 1.3 GAGCTCCGCAAGGATGACTTCAAGGGTCTCCAGCACCTCTACGCCCTCGTCCTGGTGAACAACAAG SEQ ID NO:2327 BID NM_00119 6.2 GGACTGTGAGGTCAACAACGGTTCCAGCCTCAGGGATGAGTGCATCACAAACCTACTGGTGTTTGGCTTCC SEQ ID NO:2328 BIK NM_00119 7.3 ATTCCTATGGCTCTGCAATTGTCACCGGTTAACTGTGGCCTGTGCCCAGGAAGAGCCATTCACTCCTGCC SEQ ID NO:2329 BIN1 NM_00430 5.1 
SEQ ID NO:2330 BLMH NM_00038 6.2 
SEQ ID NO:2331 BMP2 NM_00120 0.1 
SEQ ID NO:2332 BMP4 NM_00120 2.2 GGGCTAGCCATTGAGGTGACTCACCTCCATCAGACTCGGACCCACCAGGGCCAGCATGTCAGGATTAGC SEQ ID NO:2333 BMP7 NM_00171 9.1 TCGTGGAACATGACAAGGAATTCTTCCACCCACGCTACCACCATCGAGAGTTCCGGTTTGATCTTTCCA SEQ ID NO:2334 BMPR1A NM_00432 9.2 TTGGTTCAGCGAACTATTGCCAAACAGATTCAGATGGTCCGGCAAGTTGGTAAAGGCCGATATGGAGA SEQ ID NO:2335 BRAF NM_00433 3.1 
SEQ ID NO:2336 BRCA1 NM_00729 5.1 TCAGGGGGCTAGAAATCTGTTGCTATGGGCCCTTCACCAACATGCCCACAGATCAACTGGAATGG SEQ ID NO:2337 BRCA2 NM_00005 9.1 AGTTCGTGCTTTGCAAGATGGTGCAGAGCTTTATGAAGCAGTGAAGAATGCAGCAGACCCAGCTTACCTT SEQ ID NO:2338 BRK NM_00597 5.1 
SEQ ID NO:2339 BTF3 NM_00120 7.2 
SEQ ID NO:2340 BTRC NM_03363 7.2 GTTGGGACACAGTTGGTCTGCAGTCGGCCCAGGACGGTCTACTCAGCACAACTGACTGCTTCA SEQ ID NO:2341 BUB1 NM_00433 6.1 CCGAGGTTAATCCAGCACGTATGGGGCCAAGTGTAGGCTCCCAGCAGGAACTGAGAGCGCCATGTCTT SEQ ID NO:2342 BUB1B NM_00121 1.3 
SEQ ID NO:2343 BUB3 NM_00472 5.1 
SEQ ID NO:2344 c-abl NM_00515 7.2 
SEQ ID NO:2345 c-kit NM_00022 2.1 
SEQ ID NO:2346 c-myb (MYB official) NM_00537 5.1 
SEQ ID NO:2347 c-Src NM_00541 7.3 
SEQ ID NO:2348 C20 orf1 NM_01211 2.2 TCAGCTGTGAGCTGCGGATACCGCCCGGCAATGGGACCTGCTCTTAACCTCAAACCTAGGACCGT SEQ ID NO:2349 C20ORF126 NM_03081 5.2 CCAGCACTGCTCGTTACTGTCTGCCTTCAGTGGTCTGAGGTCCCAGTATGAACTGCCGTGAAGTCAA SEQ ID NO:2350 C8orf4 NM_02013 0.2 CTACGAGTCAGCCCATCCATCCATGGCTACCACTTCGACACAGCCTCTCGTAAGAAAGCCGTGGGCA SEQ ID NO:2351 CA9 NM_00121 6.1 
SEQ ID NO:2352 Cad17 NM_00406 3.2 
SEQ ID NO:2353 CALD1 NM_00434 2.4 
SEQ ID NO:2354 CAPG NM_00174 7.1 GATTGTCACTGATGGGGAGGAGCCTGCTGAGATGATCCAGGTCCTGGGCCCCAAGCCTGCTCTGAAGG SEQ ID NO:2355 CAPN1 NM_00518 6.2 
SEQ ID NO:2356 CASPB NM_03335 7.1 CCTCGGGGATACTGTCTGATCATCAACAATCACAATTTTGCAAAAGCACGGGAGAAAGTGCCCAAACTTC SEQ ID NO:2357 CASP9 NM_00122 9.2 
SEQ ID NO:2358 CAT NM_00175 2.1 
SEQ ID NO:2359 CAV1 NM_00175 3.3 
SEQ ID NO:2360 CBL NM_00518 8.1 TCATTCACAAACCTGGCAGTTATATCTTCCGGCTGAGCTGTACTCGTCTGGGTCAGTGGGCTATTGGGTATG SEQ ID NO:2361 CCL20 NM_00459 1.1 CCATGTGCTGTACCAAGAGTTTGCTCCTGGCTGCTTTGATGTCAGTGCTGCTACTCCACCTCTGCGGCG SEQ ID NO:2362 CCL3 NM_00298 3.1 
SEQ ID NO:2363 CCNA2 NM_00123 7.2 
SEQ ID NO:2364 CCNB1 NM_03198 6.1 
SEQ ID NO:2365 CCNB2 NM_00470 1.2 
SEQ ID NO:2366 CCND1 NM_00175 8.1 GCATGTTCGTGGCCTCTAAGATGAAGGAGACCATCCCCCTGACGGCCGAGAAGCTGTGCATCTACACCG SEQ ID NO:2367 CCND3 NM_00176 0.2 
SEQ ID NO:2368 CCNE1 NM_00123 8.1 AAAGAAGATGATGACCGGGTTTACCCAAACTCAACGTGCAAGCCTCGGATTATTGCACCATCCAGAGGCTC SEQ ID NO:2369 CCNE2 NM_05774 9.1 
SEQ ID NO:2370 CCNE2 variant 1 NM_05774 9var1 
SEQ ID NO:2371 CCR7 NM_00183 8.2 GGATGACATGCACTCAGCTCTTGGCTCCACTGGGATGGGAGGAGAGGACAAGGGAAATGTCAGG SEQ ID NO:2372 CD105 NM_00011 8.1 
SEQ ID NO:2373 CD134 (TNFRSF4 official) NM_00332 7.1 
SEQ ID NO:2374 CD18 NM_00021 1.1 
SEQ ID NO:2375 CD24 NM_01323 0.1 
SEQ ID NO:2376 CD28 NM_00613 9.1 TGTGAAAGGGAAACACCTTTGTCCAAGTCCCCTATTTCCCGGACCTTCTAAGCCCTTTTGGGTGCT SEQ ID NO:2377 CD31 NM_00044 2.1 
SEQ ID NO:2378 CD34 NM_00177 3.1 CCACTGCACACACCTCAGAGGCTGTTCTTGGGGCCCTACACCTTGAGGAGGGGCAGGTAAACTCCTG SEQ ID NO:2379 CD3z NM_00073 4.1 AGATGAAGTGGAAGGCGCTTTTCACCGCGGCCATCCTGCAGGCACAGTTGCCGATTACAGAGGCA SEQ ID NO:2380 CD44E X55150 
SEQ ID NO:2381 CD44s M59040.1 
SEQ ID NO:2382 CD44v3 AJ251595v 3 CACACAAAACAGAACCAGGACTGGACCCAGTGGAACCCAAGCCATTCAAATCCGGAAGTGCTACTTCAG SEQ ID NO:2383 CD44v6 AJ251595v 6 
SEQ ID NO:2384 CD68 NM_00125 1.1 
SEQ ID NO:2385 CD80 NM_00519 1.2 TTCAGTTGCTTTGCAGGAAGTGTCTAGAGGAATATGGTGGGCACAGAAGTAGCTCTGGTGACCTTGATCAA SEQ ID NO:2386 CD82 NM_00223 1.2 
SEQ ID NO:2387 CD8A NM_17182 7.1 AGGGTGAGGTGCTTGAGTCTCCAACGGCAAGGGAACAAGTACTTCTTGATACCTGGGATACTGTGCCC SEQ ID NO:2388 CD9 NM_00176 9.1 GGGCGTGGAACAGTTTATCTCAGACATCTGCCCCAAGAAGGACGTACTCGAAACCTTCACCGTG SEQ ID NO:2389 CDC2 NM_00178 6.2 GAGAGCGACGCGGTTGTTGTAGCTGCCGCTGCGGCCGCCGCGGAATAATAAGCCGGGATCTACCATAC SEQ ID NO:2390 CDC20 NM_00125 5.1 TGGATTGGAGTTCTGGGAATGTACTGGCCGTGGCACTGGACAACAGTGTGTACCTGTGGAGTGCAAGC SEQ ID NO:2391 cdc25A NM_00178 9.1 TCTTGCTGGCTACGCCTCTTCTGTCCCTGTTAGACGTCCTCCGTCCATATCAGAACTGTGCCACAATGCAG SEQ ID NO:2392 CDC25B NM_02187 4.1 
SEQ ID NO:2393 CDC25C NM_00179 0.2 GGTGAGCAGAAGTGGCCTATATCGCTCCCCGTCGATGCCAGAGAACTTGAACAGGCCAAGACTGAAG SEQ ID NO:2394 CDC4 NM_01831 5.2 
SEQ ID NO:2395 CDC42 NM_00179 1.2 
SEQ ID NO:2396 CDC42BPA NM_00360 7.2 GAGCTGAAAGACGCACACTGTCAGAGGAAACTGGCCATGCAGGAATTCATGGAGATCAATGAGCGGC SEQ ID NO:2397 CDC6 NM_00125 4.2 GCAACACTCCCCATTTACCTCCTTGTTCTCCACCAAAGCAAGGCAAGAAAGAGAATGGTCCCCCTCA SEQ ID NO:2398 CDCA7 v2 NM_14581 0.1 AAGACCGTGGATGGCTACATGAATGAAGATGACCTGCCCAGAAGCCGTCGCTCCAGATCATCCGTGACCCT SEQ ID NO:2399 CDH1 NM_00436 0.2 
SEQ ID NO:2400 CDH11 NM_00179 7.2 GTCGGCAGAAGCAGGACTTGTACCTTCTGCCCATAGTGATCAGCGATGGCGGCATCCCGCCCATGAGTAG SEQ ID NO:2401 CDH3 NM_00179 3.3 ACCCATGTACCGTCCTCGGCCAGCCAACCCAGATGAAATCGGCAACTTTATAATTGAGAACCTGAAGGCGG SEQ ID NO:2402 CDK2 NM_001?9 8.2 
SEQ ID NO:2403 CDX1 NM_00180 4.1 AGCAACACCAGCCTCCTGGCCACCTCCTCTCCAATGCCTGTGAAAGAGGAGTTTCTGCCATAGCCC SEQ ID NO:2404 Cdx2 NM_00126 5.2 GGGCAGGCAAGGTTTACACTGCGGAAGCCAAAGGCAGCTAAGATAGAAAGCTGGACTGACCAAAGAC SEQ ID NO:2405 CEACAM1 NM_00171 2.2 ACTTGCCTGTTCAGAGCACTCATTCCTTCCCACCCCCAGTCCTGTCCTATCACTCTAATTCGGATTTGCCA SEQ ID NO:2406 CEACAM6 NM_00248 3.2 CACAGCCTCACTTCTAACCTTCTGGAACCCACCCACCACTGCCAAGCTCACTATTGAATCCACGCCATTCAA SEQ ID NO:2407 CEBPB NM_00519 4.2 GCAACCCACGTGTAACTGTCAGCCGGGCCCTGAGTAATCGCTTAAAGATGTTCCTACGGGCTTGT SEQ ID NO:2408 CEGP1 NM_02097 4.1 
SEQ ID NO:2409 CENPA NM_00180 9.2 TAAATTCACTCGTGGTGTGGACTTCAATTGGCAAGCCCAGGCCCTATTGGCCCTACAAGAGGC SEQ ID NO:2410 CENPE NM_00181 3.1 
SEQ ID NO:2411 CENPF NM_01634 3.2 CTCCCGTCAACAGCGTTCTTTCCAAACACTGGACCAGGAGTGCATCCAGATGAAGGCCAGACTCACCC SEQ ID NO:2412 CES2 NM_00386 9.4 
SEQ ID NO:2413 CGA (CHGA official) NM_00127 5.2 
SEQ ID NO:2414 CGB NM_00073 7.2 
SEQ ID NO:2415 CHAF1B NM_00544 1.1 
SEQ ID NO:2416 CHD2 NM_00127 1.1 
SEQ ID NO:2417 CHFR NM_01822 3.1 
SEQ ID NO:2418 Chk1 NM_00127 4.1 
SEQ ID NO:2419 Chk2 NM_00719 4.1 
SEQ ID NO:2420 CIAP1 NM_00116 6.2 
SEQ ID NO:2421 clAP2 NM_00116 5.2 
SEQ ID NO:2422 CKS1B NM_00182 6.1 
SEQ ID NO:2423 CKS2 NM_00182 7.1 GGCTGGACGTGGTTTTGTCTGCTGCGCCCGCTCTTCGCGCTCTCGTTTCATTTTCTGCAGCG SEQ ID NO:2424 Claudin 4 NM_00130 5.2 
SEQ ID NO:2425 CLDN1 NM_02110 1.3 
SEQ ID NO:2426 CLDN7 NM_00130 7.3 
SEQ ID NO:2427 CLIC1 NM_00128 8.3 CGGTACTTGAGCAATGCCTACGCCCGGGAAGAATTCGCTTCCACCTGTCCAGATGATGAGGAGATCGA SEQ ID NO:2428 CLTC NM_00485 9.1 ACCGTATGGACAGCCACAGCCTGGCTTTGGGTACAGCATGTGAGATGAAGCGCTGATCCTGTAGTCA SEQ ID NO:2429 CLU NM_00183 1.1 
SEQ ID NO:2430 cMet NM_00024 5.1 
SEQ ID NO:2431 cMYC NM_00246 7.1 
SEQ ID NO:2432 CNN NM_00129 9.2 TCCACCCTCCTGGCTTTGGCCAGCATGGCGAAGACGAAAGGAAACAAGGTGAACGTGGGAGTGA SEQ ID NO:2433 COL1A1 NM_00008 8.2 GTGGCCATCCAGCTGACCTTCCTGCGCCTGATGTCCACCGAGGCCTCCCAGAACATCACCTACCACTG SEQ ID NO:2434 COL1A2 NM_00008 9.2 
SEQ ID NO:2435 COPS3 NM_00365 3.2 ATGCCCAGTGTTCCTGACTTCGAAACGCTATTCTCACAGGTTCAGCTCTTCATCAGCACTTGTAATGGGGAG SEQ ID NO:2436 COX2 NM_00096 3.1 
SEQ ID NO:2437 COX3 MITO_CO X3 
SEQ ID NO:2438 CP NM_00009 6.1 
SEQ ID NO:2439 CRBP NM_00289 9.2 TGGTCTGCAAGCAAGTATTCAAGAAGGTGCAGTGAGGCCCAAGCAGACAACCTTGTCCCAACCAATCAGC SEQ ID NO:2440 CREBBP NM_00438 0.1 
SEQ ID NO:2441 CRIP2 NM_00131 2.1 
SEQ ID NO:2442 cripto (TDGF1 official) NM_00321 2.1 GGGTCTGTGCCCCATGACACCTGGCTGCCCAAGAAGTGTTCCCTGTGTAAATGCTGGCACGGTCA SEQ ID NO:2443 CRK(a) NM_01682 3.2 
SEQ ID NO:2444 CRMP1 NM_00131 3.1 
SEQ ID NO:2445 CRYAB NM_00188 5.1 GATGTGATTGAGGTGCATGGAAAACATGAAGAGCGCCAGGATGAACATGGTTTCATCTCCAGGGAGTTC SEQ ID NO:2446 CSEL1 NM_00131 6.2 TTACGCAGCTCATGCTCTTGAACGGCTCTTTACTATGCGAGGGCCTAACAATGCCACTCTCTTTACAGCTGC SEQ ID NO:2447 CSF1 NM_00075 7.3 
SEQ ID NO:2448 CSK (SRC) NM_00438 3.1 CCTGAACATGAAGGAGCTGAAGCTGCTGCAGACCATCGGGAAGGGGGAGTTCGGAGACGTGATG SEQ ID NO:2449 CTAG1B NM_00132 7.1 GCTCTCCATCAGCTCCTGTCTCCAGCAGCTTTCCCTGTTGATGTGGATCACGCAGTGCTTTCTGCCCGTGTT SEQ ID NO:2450 CTGF NM_00190 1.1 
SEQ ID NO:2451 CTHRC1 NM_13845 5.2 GCTCACTTCGGCTAAAATGCAGAAATGCATGCTGTCAGCGTTGGTATTTCACATTCAATGGAGCTGA SEQ ID NO:2452 CTLA4 NM_00521 4.2 CACTGAGGTCCGGGTGACAGTGCTTCGGCAGGCTGACAGCCAGGTGACTGAAGTCTGTGCGGCAACCTAC SEQ ID NO:2453 CTNNBIP1 NM_02024 8.2 GTTTTCCAGGTCGGAGACGGAAGACCGGAGGCAGTAGCTGCAAAGCCCTTGGAACACCCTGGATGCT SEQ ID NO:2454 CTSB NM_00190 8.1 GGCCGAGATCTACAAAAACGGCCCCGTGGAGGGAGCTTTCTCTGTGTATTCGGACTTCCTGC SEQ ID NO:2455 CTSD NM_00190 9.1 
SEQ ID NO:2456 CTSH NM_00439 0.1 
SEQ ID NO:2457 CTSL NM_00191 2.1 
SEQ ID NO:2458 CTSL2 NM_00133 3.2 TGTCTCACTGAGCGAGCAGAATCTGGTGGACTGTTCGCGTCCTCAAGGCAATCAGGGCTGCAATGGT SEQ ID NO:2459 CUL1 NM_00359 2.2 ATGCCCTGGTAATGTCTGCATTCAACAATGACGCTGGCTTTGTGGCTGCTCTTGATAAGGCTTGTGGTCGC SEQ ID NO:2460 CUL4A NM_00358 9.1 
SEQ ID NO:2461 CXCL12 NM_00060 9.3 GAGCTACAGATGCCCATGCCGATTCTTCGAAAGCCATGTTGCCAGAGCCAACGTCAAGCATCTCAAA SEQ ID NO:2462 CXCR4 NM_00346 7.1 TGACCGCTTCTACCCCAATGACTTGTGGGTGGTTGTGTTCCAGTTTCAGCACATCATGGTTGGCCTTATCCT SEQ ID NO:2463 CYBA NM_00010 1.1 
SEQ ID NO:2464 CYP1B1 NM_00010 4.2 CCAGCTTTGTGCCTGTCACTATTCCTCATGCCACCACTGCCAACACCTCTGTCTTGGGCTACCACATTCCC SEQ ID NO:2465 CYP2C8 NM_00077 0.2 
SEQ ID NO:2466 CYP3A4 NM_01746 0.3 
SEQ ID NO:2467 CYR61 NM_00155 4.3 
SEQ ID NO:2468 DAPK1 NM_00493 8.1 
SEQ ID NO:2469 DCC NM_00521 5.1 
SEQ ID NO:2470 DCC_exons1 8-23 X76132_1 8-23 GGTCACCGTTGGTGTCATCACAGTGCTGGTAGTGGTCATCGTGGCTGTGATTTGCACCCGACGCTC SEQ ID NO:2471 DCC_exons6-7 X76132_6-7 
SEQ ID NO:2472 DCK NM_00078 8.1 
SEQ ID NO:2473 DDB1 NM_00192 3.2 TGCGGATCATCCGGAATGGAATTGGAATCCACGAGCATGCCAGCATTGACTTACCAGGCATCAAAGGA SEQ ID NO:2474 DET1 NM_01799 6.2 CTTGTGGAGATCACCCAATCAGGTTCTATGCCCGGGACTCGGGCCTGCTCAAGTTTGAGATCCAGGCGGG SEQ ID NO:2475 DHFR NM_00079 1.2 
SEQ ID NO:2476 DHPS NM_01340 7.1 
SEQ ID NO:2477 DIABLO NM_01988 7.1 
SEQ ID NO:2478 DIAPH 1 NM_00521 9.2 CAAGCAGTCAAGGAGAACCAGAAGCGGCGGGAGACAGAAGAAAAGATGAGGCGAGCAAAACT SEQ ID NO:2479 DICER1 NM_17743 8.1 TCCAATTCCAGCATCACTGTGGAGAAAAGCTG1TTGTCTCCCCAGCATACTTTATCGCCTTCACTGCC SEQ ID NO:2480 DKK1 NM_01224 2.1 TGACAACTACCAGCCGTACCCGTGCGCAGAGGACGAGGAGTGCGGCACTGATGAGTACTGCGCTAGTCCC SEQ ID NO:2481 DLC1 NM_00609 4.3 GATTCAGACGAGGATGAGCCTTGTGCCATCAGTGGCAAATGGACTTTCCAAAGGGACAGCAAGAGGTG SEQ ID NO:2482 DPYD NM_00011 0.2 
SEQ ID NO:2483 DR4 NM_00384 4.1 
SEQ ID NO:2484 DR5 NM_00384 2.2 
SEQ ID NO:2485 DRG1 NM_00414 7.3 CCTGGATCTCCCAGGTATCATTGAAGGTGCCAAGGATGGGAAAGGTAGAGGTCGTCAAGTCATTGCA SEQ ID NO:2486 DSP NM_00441 5.1 
SEQ ID NO:2487 DTYMK NM_01214 5.1 
SEQ ID NO:2488 DUSP1 NM_00441 7.2 
SEQ ID NO:2489 DUSP2 NM_00441 8.2 
SEQ ID NO:2490 DUT NM_00194 8.2 ACACATGGAGTGCTTCTGGAACTATCAGCCCACTTGACCACCCAGTTTGTGGAAGCACAGGCAAGAG SEQ ID NO:2491 DYRK1 B NM_00471 4.1 
SEQ ID NO:2492 E2F1 NM_00522 5.1 
SEQ ID NO:2493 EDN1 endothelin NM_00195 5.1 
SEQ ID NO:2494 EFNA1 NM_00442 8.2 TACATCTCCAAACCCATCCACCAGCATGAAGACCGCTGCTTGAGGTTGAAGGTGACTGTCAGTGGCAA SEQ ID NO:2495 EFNA3 NM_00495 2.3 ACTACATCTCCACGCCCACTCACAACCTGCACTGGAAGTGTCTGAGGATGAAGGTGTTCGTCTGCTG SEQ ID NO:2496 EFNB1 NM_00442 9.3 GGAGCCCGTATCCTGGAGCTCCCTCAACCCCAAGTTCCTGAGTGGGAAGGGCTTGGTGATCTATCC SEQ ID NO:2497 EFNB2 NM_00409 3.2 
SEQ ID NO:2498 EFP NM_00508 2.2 
SEQ ID NO:2499 EGFR NM_00522 8.1 TGTCGATGGACTTCCAGAACCACCTGGGCAGCTGCCAAAAGTGTGATCCAAGCTGTCCCAAT SEQ ID NO:2500 EGLN1 NM_02205 1.1 
SEQ ID NO:2501 EGLN3 NM_02207 3.2 GCTGGTCCTCTACTGCGGGAGCCGGCTGGGCAAATACTACGTCAAGGAGAGGTCTAAGGCAATGGTGG SEQ ID NO:2502 EGR1 NM_00196 4.2 
SEQ ID NO:2503 EGR3 NM_00443 0.2 
SEQ ID NO:2504 EI24 NM_00487 9.2 
SEQ ID NO:2505 EIF4E NM_00196 8.1 
SEQ ID NO:2506 EIF4EL3 NM_00484 6.1 AAGCCGCGGTTGAATGTGCCATGACCCTCTCCCTCTCTGGATGGCACCATCATTGAAGCTGGCGTCA SEQ ID NO:2507 ELAVL1 NM_00141 9.2 
SEQ ID NO:2508 EMP1 NM_00142 3.1 
SEQ ID NO:2509 EMR3 NM_03257 1.2 TGGCCTACCTCTTCACCATCATCAACAGCCTCCAAGGCTTCTTCATCTTCTTGGTCTACTGCCTCCTCA SEQ ID NO:2510 EMS1 NM_00523 1.2 GGCAGTGTCACTGAGTCCTTGAAATCCTCCCCTGCCCCGCGGGTCTCTGGATTGGGACGCACAGTGCA SEQ ID NO:2511 ENO1 NM_00142 8.2 CAAGGCCGTGAACGAGAAGTCCTGCAACTGCCTCCTGCTCAAAGTCAACCAGATTGGCTCCGTGACCG SEQ ID NO:2512 EP300 NM_00142 9.1 
SEQ ID NO:2513 EPAS1 NM_00143 0.3 
SEQ ID NO:2514 EpCAM NM_00235 4.1 
SEQ ID NO:2515 EPHA2 NM_00443 1.2 
SEQ ID NO:2516 EPHB2 NM_00444 2.4 CAACCAGGCAGCTCCATCGGCAGTGTCCATCATGCATCAGGTGAGCCGCACCGTGGACAGCATTAC SEQ ID NO:2517 EPHB4 NM_00444 4.3 
SEQ ID NO:2518 EphB6 NM_00444 5.1 ACTGGTCCTCCATCGGCTCCCCAGGAGCTTTGGTTTGAGGTGCAAGGCTCAGCACTCATGCTACACTGG SEQ ID NO:2519 EPM2A NM_00567 0.2 ACTGTGGCACTTAGGGGAGATGACATTTGCTTTGGGCAGAGGCAGCTAGCCAGGACACATTTCCACT SEQ ID NO:2520 ErbB3 NM_00198 2.1 
SEQ ID NO:2521 ERCC1 NM_00198 3.1 GTCCAGGTGGATGTGAAAGATCCCCAGCAGGCCCTCAAGGAGCTGGCTAAGATGTGTATCCTGGCCG SEQ ID NO:2522 ERCC2 NM_00040 0.2 TGGCCTTCTTCACCAGCTACCAGTACATGGAGAGCACCGTGGCCTCCTGGTATGAGCAGGGGATCCTTG SEQ ID NO:2523 EREG NM_00143 2.1 
SEQ ID NO:2524 ERK1 Z11696.1 ACGGATCACAGTGGAGGAAGCGCTGGCTCACCCCTACCTGGAGCAGTACTATGACCCGACGGATGAG SEQ ID NO:2525 ERK2 NM_00274 5.1 AGTTCTTGACCCCTGGTCCTGTCTCCAGCCCGTCTTGGCTTATCCACTTTGACTCCTTTGAGCCGTTT SEQ ID NO:2526 ESPL1 NM_01229 1.1 ACCCCCAGACCGGATCAGGCAAGCTGGCCCTCATGTCCCCTTCACGGTGTTTGAGGAAGTCTGCCCTACA SEQ ID NO:2527 EstR1 NM_00012 5.1 CGTGGTGCCCCTCTATGACCTGCTGCTGGAGATGCTGGACGCCCACCGCCTACATGCGCCCACTAGCC SEQ ID NO:2528 ETV4 NM_00198 6.1 TCCAGTGCCTATGACCCCCCCAGACAAATCGCCATCAAGTCCCCTGCCCCTGGTGCCCTTGGACAGT SEQ ID NO:2529 F3 NM_00199 3.2 
SEQ ID NO:2530 FABP4 NM_00144 2.1 GCTTTGCCACCAGGAAAGTGGCTGGCATGGCCAAACCTAACATGATCATCAGTGTGAATGGGGATG SEQ ID NO:2531 FAP NM_00446 0.2 CTGACCAGAACCACGGCTTATCCGGCCTGTCCACGAACCACTTATACACCCACATGACCCACTTCC SEQ ID NO:2532 fas NM_00004 3.1 
SEQ ID NO:2533 fasl NM_00063 9.1 
SEQ ID NO:2534 FASN NM_00410 4.4 GCCTCTTCCTGTTCGACGGCTCGCCCACCTACGTACTGGCCTACACCCAGAGCTACCGGGCAAAGC SEQ ID NO:2535 FBXO5 NM_01217 7.2 
SEQ ID NO:2536 FBXW7 NM_03363 2.1 CCCCAGTTTCAACGAGACTTCATTTCATTGCTCCCTAAAGAGTTGGCACTCTATGTGCTTTCATTCCTGGAAC SEQ ID NO:2537 FDXR NM_00411 0.2 GAGATGATTCAGTTACCGGGAGCCCGGCCCATTTTGGATCCTGTGGATTTCTTGGGTCTCCAGGACAAGAT SEQ ID NO:2538 FES NM_00200 5.2 CTCTGCAGGCCTAGGTGCAGCTCCTCAGCGGCTCCAGCTCATATGCTGACAGCTCTTCACAGTCCTGG SEQ ID NO:2539 FGF18 NM_00386 2.1 CGGTAGTCAAGTCCGGATCAAGGGCAAGGAGACGGAATTCTACCTGTGCATGAACCGCAAAGGCAAGC SEQ ID NO:2540 FGF2 NM_00200 6.2 
SEQ ID NO:2541 FGFR1 NM_02310 9.1 
SEQ ID NO:2542 FGFR2 isoform 1 NM_00014 1.2 
SEQ ID NO:2543 FHIT NM_00201 2.1 CCAGTGGAGCGCTTCCATGACCTGCGTCCTGATGAAGTGGCCGATTTGTTTCAGACGACCCAGAGAG SEQ ID NO:2544 FIGF NM_00446 9.2 
SEQ ID NO:2545 FLJ12455 NM_02207 8.1 CCACCAGCATGAAGTTTCGGACAGACATGGCCTTTGTGAGGGGTTCCAGTTGTGCTTCAGACAGCC SEQ ID NO:2546 FLJ20712 AK000719. 1 
SEQ ID NO:2547 FLT1 NM_00201 9.1 
SEQ ID NO:2548 FLT4 NM_00202 0.1 ACCAAGAAGCTGAGGACCTGTGGCTGAGCCCGCTGACCATGGAAGATCTTGTCTGCTACAGCTTCCAGG SEQ ID NO:2549 FOS NM_00525 2.2 CGAGCCCTTTGATGACTTCCTGTTCCCAGCATCATCCAGGCCCAGTGGCTCTGAGACAGCCCGCTCC SEQ ID NO:2550 FOX03A NM_00145 5.1 
SEQ ID NO:2551 FPGS NM_00495 7.3 CAGCCCTGCCAGTTTGACTATGCCGTCTTCTGCCCTAACCTGACAGAGGTGTCATCCACAGGCAAC SEQ ID NO:2552 FRP1 NM_00301 2.2 
SEQ ID NO:2553 FST NM_00635 0.2 
SEQ ID NO:2554 Furin NM_00256 9.1 
SEQ ID NO:2555 FUS NM_00496 0.1 
SEQ ID NO:2556 FUT1 NM_00014 8.1 CCGTGCTCATTGCTAACCACTGTCTGTCCCTGAACTCCCAGAACCACTACATCTGGCTTTGGGCAG SEQ ID NO:2557 FUT3 NM_00014 9.1 
SEQ ID NO:2558 FUT6 NM_00015 0.1 CGTGTGTCTCAAGACGATCCCACTGTGTACCCTAATGGGTCCCGCTTCCCAGACAGCACAGGGACC SEQ ID NO:2559 FXYD5 NM_01416 4.4 AGAGCACCAAAGCAGCTCATCCCACTGATGACACCACGACGCTCTCTGAGAGACCATCCCCAAGCAC SEQ ID NO:2560 FYN NM_00203 7.3 GAAGCGCAGATCATGAAGAAGCTGAAGCACGACAAGCTGGTCCAGCTCTATGCAGTGGTGTCTGAGGAG SEQ ID NO:2561 FZD1 NM_00350 5.1 
SEQ ID NO:2562 FZD2 NM_00146 6.2 
SEQ ID NO:2563 FZD6 NM_00350 6.2 AATGAGAGAGGTGAAAGCGGACGGAGCTAGCACCCCCAGGTTAAGAGAACAGGACTGTGGTGAACCT SEQ ID NO:2564 G-Catenin NM_00223 0.1 TCAGCAGCAAGGGCATCATGGAGGAGGATGAGGCCTGCGGGCGCCAGTACACGCTCAAGAAAACCACC SEQ ID NO:2565 G1P2 NM_00510 1.1 CAACGAATTCCAGGTGTCCCTGAGCAGCTCCATGTCGGTGTCAGAGCTGAAGGCGCAGATC SEQ ID NO:2566 GADD45 NM_00192 4.2 
SEQ ID NO:2567 GADD45B NM_01567 5.1 ACCCTCGACAAGACCACACTTTGGGACTTGGGAGCTGGGGCTGAAGTTGCTCTGTACCCATGAACTCCCA SEQ ID NO:2568 GADD45G NM_00670 5.2 CGCGCTGCAGATCCATTTTACGCTGATCCAGGCTTTCTGCTGCGAGAACGACATCGACATAGTGCG SEQ ID NO:2569 GAGE4 NM_00147 4.1 
SEQ ID NO:2570 GBP1 NM_00205 3.1 
SEQ ID NO:2571 GBP2 NM_00412 0.2 
SEQ ID NO:2572 GCLC NM_00149 8.1 CTGTTGCAGGAAGGCATTGATCATCTCCTGGCCCAGCATGTTGCTCATCTCTTTATTAGAGACCCACTGAC SEQ ID NO:2573 GCLM NM_00206 1.1 
SEQ ID NO:2574 GCNT1 NM_00149 0.3 
SEQ ID NO:2575 GDF15 NM_00486 4.1 CGCTCCAGACCTATGATGACTTGTTAGCCAAAGACTGCCACTGCATATGAGCAGTCCTGGTCCTTCCACTGT SEQ ID NO:2576 GIT1 NM_01403 0.2 GTGTATGACGAGGTGGATCGAAGAGAAAATGATGCAGTGTGGCTGGCTACCCAAAACCACAGCACTCTGGT SEQ ID NO:2577 GJA1 NM_00016 5.2 GTTCACTGGGGGTGTATGGGGTAGATGGGTGGAGAGGGAGGGGATAAGAGAGGTGCATGTTGGTATTT SEQ ID NO:2578 GJB2 NM_00400 ' 4.3 
SEQ ID NO:2579 GPX1 NM_00058 1.2 GCTTATGACCGACCCCAAGCTCATCACCTGGTCTCCGGTGTGTCGCAACGATGTTGCCTGGAACTTT SEQ ID NO:2580 GPX2 NM_00208 3.1 
SEQ ID NO:2581 Grb10 NM_00531 1.2 CTTCGCCTTTGCTGATTGCCTCTCCAAACGCCTGCCTGACGACTGCCTTGGAGCATGTGCGTTATGG SEQ ID NO:2582 GRB14 NM_00449 0.1 
SEQ ID NO:2583 GRB2 NM_00208 6.2 
SEQ ID NO:2584 GRB7 NM_00531 0.1 CCATCTGCATCCATCTTGTTTGGGCTCCCCACCCTTGAGAAGTGCCTCAGATAATACCCTGGTGGCC SEQ ID NO:2585 GRIK1 NM_00083 0.2 
SEQ ID NO:2586 GRO1 NM_00151 1.1 
SEQ ID NO:2587 GRP NM_00209 1.1 
SEQ ID NO:2588 GRPR NM_00531 4.1 
SEQ ID NO:2589 GSK3B NM_00209 3.2 GACAAGGACGGCAGCAAGGTGACAACAGTGGTGGCAACTCCTGGGCAGGGTCCAGACAGGCCACAA SEQ ID NO:2590 GSTA3 NM_00084 7.3 TCTCCAACTTCCCTCTGCTGAAGGCCCTGAAAACCAGAATCAGCAACCTGCCCACGGTGAAGAAGT SEQ ID NO:2591 GSTM1 NM_00056 1.1 
SEQ ID NO:2592 GSTM3 NM_00084 9.3 
SEQ ID NO:2593 GSTp NM_00085 2.2 
SEQ ID NO:2594 GSTT1 NM_00085 3.1 CACCATCCCCACCCTGTCTTCCACAGCCGCCTGAAAGCCACAATGAGAATGATGCACACTGAGGCC SEQ ID NO:2595 H2AFZ NM_00210 6.2 
SEQ ID NO:2596 HB-EGF NM_00194 5.1 
SEQ ID NO:2597 hCRA a U78556.1 
SEQ ID NO:2598 HDAC1 NM_00496 4.2 
SEQ ID NO:2599 HDAC2 NM_00152 7.1 
SEQ ID NO:2600 HDGF NM_00449 4.1 TCCTAGGCATTCTGGACCTCTGGGTTGGGATCAGGGGTAGGAATGGAAGGATGGAGCATCAACAGC SEQ ID NO:2601 hENT1 NM_00495 5.1 AGCCGTGACTGTTGAGGTCAAGTCCAGCATCGCAGGCAGCAGCACCTGGGAACGTTACTT SEQ ID NO:2602 Hepsin NM_00215 1.1 
SEQ ID NO:2603 HER2 NM_00444 8.1 CGGTGTGAGAAGTGCAGCAAGCCCTGTGCCCGAGTGTGCTATGGTCTGGGCATGGAGCACTTGCGAGAGG SEQ ID NO:2604 Herstatin AF177761. 2 CACCCTGTCCTATCCTTCCTCAGACCCTCTTGGGACCTAGTCTCTGCCTTCTACTCTCTACCCCTGGCC SEQ ID NO:2605 HES6 NM_01864 5.3 TTAGGGACCCTGCAGCTCTGGAGTGGGTGGAGGGAGGGAGCTACGGGCAGGAGGAAGAATTTTGTAG SEQ ID NO:2606 HGF M29145.1 CCGAAATCCAGATGATGATGCTCATGGACCCTGGTGCTACACGGGAAATCCACTCATTCCTTGGG SEQ ID NO:2607 HIF1A NM_00153 0.1 
SEQ ID NO:2608 HK1 NM_00018 8.1 TACGCACAGAGGCAAGCAGCTAAGAGTCCGGGATCCCCAGCCTACTGCCTCTCCAGCACTTCTCTC SEQ ID NO:2609 HLA-DPB1 NM_00212 1.4 
SEQ ID NO:2610 HLA-DRA NM_01911 1.3 GACGATTTGCCAGCTTTGAGGCTCAAGGTGCATTGGCCAACATAGCTGTGGACAAAGCCAACCTGGA SEQ ID NO:2611 HLA-DRB1 NM_00212 4.1 GCTTTCTCAGGACCTGGTTGCTACTGGTTCGGCAACTGCAGAAAATGTCCTCCCTTGTGGCTTCCT SEQ ID NO:2612 HLA-G NM_00212 7.2 CCTGCGCGGCTACTACAACCAGAGCGAGGCCAGTTCTCACACCCTCCAGTGGATGATTGGCTGCGACCTG SEQ ID NO:2613 HMGB1 NM_00212 8.3 TGGCCTGTCCATTGGTGATGTTGCGAAGAAACTGGGAGAGATGTGGAATAACACTGCTGCAGATGACAAGC SEQ ID NO:2614 hMLH NM_04024 9.2 
SEQ ID NO:2615 HNRPAB NM_00449 9.2 
SEQ ID NO:2616 HNRPD NM_03137 0.2 GCCAGTAAGAACGAGGAGGATGAAGGCCATTCAAACTCCTCCCCACGACACTCTGAAGCAGCGACG SEQ ID NO:2617 HoxA1 NM_00552 2.3 AGTGACAGATGGACAATGCAAGAATGAACTCCTTCCTGGAATACCCCATACTTAGCAGTGGCGACTCGG SEQ ID NO:2618 HoxA5 NM_01910 2.2 
SEQ ID NO:2619 HOXB13 NM_00636 1.2 CGTGCCTTATGGTTACTTTGGAGGCGGGTACTACTCCTGCCGAGTGTCCCGGAGCTCGCTGAAACCCTGTG SEQ ID NO:2620 HOXB7 NM_00450 2.2 CAGCCTCAAGTTCGGTTTTCGCTACCGGAGCCTTCCCAGAACAAACTTCTTGTGCGTTTGCTTCCAAC SEQ ID NO:2621 HRAS NM_00534 3.2 GGACGAATACGACCCCACTATAGAGGATTCCTACCGGAAGCAGGTGGTCATTGATGGGGAGACGTGC SEQ ID NO:2622 HSBP1 NM_00153 7.1 GGAGATGGCCGAGACTGACCCCAAGACCGTGCAGGACCTCACCTCGGTGGTGCAGACACTCCTGCAG SEQ ID NO:2623 HSD17B1 NM_00041 3.1 
SEQ ID NO:2624 HSD17B2 NM_00215 3.1 GCTTTCCAAGTGGGGAATTAAAGTTGCTTCCATCCAACCTGGAGGCTTCCTAACAAATATCGCAGGCA SEQ ID NO:2625 HSPA1A NM_00534 5.4 CTGCTGCGACAGTCCACTACCTTTTTCGAGAGTGACTCCCGTTGTCCCAAGGCTTCCCAGAGCGAACCTG SEQ ID NO:2626 HSPA1B NM_00534 6.3 GGTCCGCTTCGTCTTTCGAGAGTGACTCCCGCGGTCCCAAGGCTTTCCAGAGCGAACCTGTGC SEQ ID NO:2627 HSPA4 NM_00215 4.3 
SEQ ID NO:2628 HSPA5 NM_00534 7.2 
SEQ ID NO:2629 HSPA8 NM_00659 7.3 
SEQ ID NO:2630 HSPB1 NM_00154 0.2 
SEQ ID NO:2631 HSPCA NM_00534 8.2 CAAAAGGCAGAGGCTGATAAGAACGACAAGTCTGTGAAGGATCTGGTCATCTTGCTTTATGAAACTGCGCT SEQ ID NO:2632 HSPE1 NM_00215 7.1 
SEQ ID NO:2633 HSPG2 NM_00552 9.2 GAGTACGTGTGCCGAGTGTTGGGCAGCTCCGTGCCTCTAGAGGCCTCTGTCCTGGTCACCATTGAG SEQ ID NO:2634 ICAM1 NM_00020 1.1 GCAGACAGTGACCATCTACAGCTTTCCGGCGCCCAACGTGATTCTGACGAAGCCAGAGGTCTCAGAAG SEQ ID NO:2635 ICAM2 NM_00087 3.2 GGTCATCCTGACACTGCAACCCACTTTGGTGGCTGTGGGCAAGTCCTTCACCATTGAGTGCA SEQ ID NO:2636 ID1 NM_00216 5.1 AGAACCGCAAGGTGAGCAAGGTGGAGATTCTCCAGCACGTCATCGACTACATCAGGGACCTTCAGTTGGA SEQ ID NO:2637 ID2 NM_00216 6.1 
SEQ ID NO:2638 ID3 NM_00216 7.2 
SEQ ID NO:2639 ID4 NM_00154 6.2 
SEQ ID NO:2640 IFIT1 NM_00154 8.1 
SEQ ID NO:2641 IGF1 NM_00061 8.1 
SEQ ID NO:2642 IGF1R NM_00087 5.2 
SEQ ID NO:2643 IGF2 NM_00061 2.2 
SEQ ID NO:2644 IGFBP2 NM_00059 7.1 
SEQ ID NO:2645 IGFBP3 NM_00059 8.1 ACGCACCGGGTGTCTGATCCCAAGTTCCACCCCCTCCATTCAAAGATAATCATCATCAAGAAAGGGCA SEQ ID NO:2646 IGFBP5 NM_00059 9.1 TGGACAAGTACGGGATGAAGCTGCCAGGCATGGAGTACGTTGACGGGGACTTTCAGTGCCACACCTTCG SEQ ID NO:2647 IGFBP6 NM_00217 8.1 
SEQ ID NO:2648 IGFBP7 NM_00155 3 GGGTCACTATGGAGTTCAAAGGACAGAACTCCTGCCTGGTGACCGGGACAACCTGGCCATTCAGACCC SEQ ID NO:2649 IHH NM_00218 1.1 
SEQ ID NO:2650 IL-8 NM_00058 4.2 AAGGAACCATCTCACTGTGTGTAAACATGACTTCCAAGCTGGCCGTGGCTCTCTTGGCAGCCTTCCTGAT SEQ ID NO:2651 IL10 NM_0005T 2.1 
SEQ ID NO:2652 IL1B NM_00057 6.2 AGCTGAGGAAGATGCTGGTTCCCTGCCCACAGACCTTCCAGGAGAATGACCTGAGCACCTTCTTTCC SEQ ID NO:2653 IL6 NM_00060 0.1 CCTGAACCTTCCAAAGATGGCTGAAAAAGATGGATGCTTCCAATCTGGATTCAATGAGGAGACTTGCCTGGT SEQ ID NO:2654 IL6ST NM_00218 4.2 
SEQ ID NO:2655 ILT-2 NM_00666 9.1 AGCCATCACTCTCAGTGCAGCCAGGTCCTATCGTGGCCCCTGAGGAGACCCTGACTCTGCAGT SEQ ID NO:2656 IMP-1 NM_00654 6.2 GAAAGTGTTTGCGGAGCACAAGATCTCCTACAGCGGCCAGTTCTTGGTCAAATCCGGCTACGCCTTC SEQ ID NO:2657 IMP2 NM_00654 8.3 
SEQ ID NO:2658 ING1L NM_00156 4.1 
SEQ ID NO:2659 ING5 NM_03232 9.4 CCTACAGCAAGTGCAAGGAATACAGTGACGACAAAGTGCAGCTGGCCATGCAGACCTACGAGATG SEQ ID NO:2660 INHA NM_00219 1.2 
SEQ ID NO:2661 INHBA NM_00219 2.1 
SEQ ID NO:2662 INHBB NM_00219 3.1 
SEQ ID NO:2663 IRS1 NM_00554 4.1 
SEQ ID NO:2664 ITGA3 NM_00220 4.1 
SEQ ID NO:2665 ITGA4 NM_00088 5.2 CAACGCTTCAGTGATCAATCCCGGGGCGATTTACAGATGCAGGATCGGAAAGAATCCCGGCCAGAC SEQ ID NO:2666 ITGA5 NM_00220 5.1 
SEQ ID NO:2667 ITGA6 NM_00021 0.1 CAGTGACAAACAGCCCTTCCAACCCAAGGAATCCCACAAAAGATGGCGATGACGCCCATGAGGCTAAAC SEQ ID NO:2668 ITGA7 NM_00220 6.1 
SEQ ID NO:2669 ITGAV NM_00221 0.2 
SEQ ID NO:2670 ITGB1 NM_00221 1.2 
SEQ ID NO:2671 ITGB3 NM_00021 2.1 
SEQ ID NO:2672 ITGB4 NM_00021 3.2 CAAGGTGCCCTCAGTGGAGCTCACCAACCTGTACCCGTATTGCGACTATGAGATGAAGGTGTGCGC SEQ ID NO:2673 ITGB5 NM_00221 3.3 TCGTGAAAGATGACCAGGAGGCTGTGCTATGTTTCTACAAAACCGCCAAGGACTGCGTCATGATGTTCACC SEQ ID NO:2674 K-ras NM_03336 0.2 GTCAAAATGGGGAGGGACTAGGGCAGTTTGGATAGCTCAACAAGATACAATCTCACTCTGTGGTGGTCCTG SEQ ID NO:2675 KCNH2 iso alb NM_00023 8.2 
SEQ ID NO:2676 KCNH2 iso a/c NM_17205 7.1 
SEQ ID NO:2677 KCNK4 NM_01661 1.2 CCTATCAGCCGCTGGTGTGGTTCTGGATCCTGCTCGGCCTGGCTTACTTCGCCTCAGTGCTCACCACCA SEQ ID NO:2678 KDR NM_00225 3.1 GAGGACGAAGGCCTCTACACCTGCCAGGCATGCAGTGTTCTTGGCTGTGCAAAAGTGGAGGCATTTTT SEQ ID NO:2679 Ki-67 NM_00241 7.1 
SEQ ID NO:2680 KIAA0125 NM_01479 2.2 GTGTCCTGGTCCATGTGGTGCACGTGTCTCCACCTCCAAGGAGAGGCTCCTCAGTGTGCACCTCCC SEQ ID NO:2681 KIF22 NM_00731 7.1 CTAAGGCACTTGCTGGAAGGGCAGAATGCCAGTGTGCTTGCCTATGGACCCACAGGAGCTGGGAAGA SEQ ID NO:2682 KIF2C NM_00684 5.2 
SEQ ID NO:2683 KIFC1 XM_37181 3.1 CCACAGGGTTGAAGAACCAGAAGCCAGTTCCTGCTGTTCCTGTCCAGAAGTCTGGCACATCAGGTG SEQ ID NO:2684 Kitlng NM 00089 9.1 
SEQ ID NO:2685 KLF5 NM_00173 0.3 
SEQ ID NO:2686 KLF6. NM_00130 0.4 CACGAGACCGGCTACTTCTCGGCGCTGCCGTCTCTGGAGGAGTACTGGCAACAGACCTGCCTAGAGC SEQ ID NO:2687 KLK10 NM_00277 6.1 
SEQ ID NO:2688 KLK6 NM_00277 4.2 
SEQ ID NO:2689 KLRK1 NM_00736 0.1 TGAGAGCCAGGCTTCTTGTATGTCTCAAAATGCCAGCCTTCTGAAAGTATACAGCAAAGAGGACCAGGAT SEQ ID NO:2690 KNTC2 NM_00610 1.1 ATGTGCCAGTGAGCTTGAGTCCTTGGAGAAACACAAGCACCTGCTAGAAAGTACTGTTAACCAGGGGCTCA SEQ ID NO:2691 KRAS2 NM_00498 5.3 
SEQ ID NO:2692 KRT19 NM_00227 6.1 
SEQ ID NO:2693 KRT8 NM_00227 3.1 
SEQ ID NO:2694 LAMA3 NM_00022 7.2 
SEQ ID NO:2695 LAMB3 NM_00022 8.1 ACTGACCAAGCCTGAGACCTACTGCACCCAGTATGGCGAGTGGCAGATGAAATGCTGCAAGTGTGAC SEQ ID NO:2696 LAMC2 NM_00556 2.1 
SEQ ID NO:2697 LAT NM_01438 7.2 GTGAACGTTCCGGAGAGCGGGGAGAGCGCAGAAGCGTCTCTGGATGGCAGCCGGGAGTATGTGAATGT SEQ ID NO:2698 LCN2 NM_00556 4.2 
SEQ ID NO:2699 LDLRAP1 NM_01562 7.1 CAGTGCCTCTCGCCTGTCGACTGGGACAAGCCTGACAGCAGCGGCACAGAGCAGGATGACCTCTTCA SEQ ID NO:2700 LEF NM_01626 9.2 GATGACGGAAAGCATCCAGATGGAGGCCTCTACAACAAGGGACCCTCCTACTCGAGTTATTCCGGG SEQ ID NO:2701 LGALS3 NM_00230 6.1 AGCGGAAAATGGCAGACAATTTTTCGCTCCATGATGCGTTATCTGGGTCTGGAAACCCAAACCCTCAAG SEQ ID NO:2702 LGMN NM_00100 8530.1 TTGGTGCCGTTCCTATAGATGATCCTGAAGATGGAGGCAAGCACTGGGTGGTGATCGTGGCAGGTTC SEQ ID NO:2703 LILRB3 NM_00686 4.1 CACCTGGTCTGGGAAGATACCTGGAGGTTTTGATTGGGGTCTCGGTGGCCTTCGTCCTGCTGCTCTT SEQ ID NO:2704 LMNB1 NM_00557 3.1 TGCAAACGCTGGTGTCACAGCCAGCCCCCCAACTGACCTCATCTGGAAGAACCAGAACTCGTGGGG SEQ ID NO:2705 LMYC NM_01242 1.1 CCCATCCAGAACACTGATTGCTGTCATTCAAGTGAAAGGGATGGAGGTCAGAAAGGGTGCATAGAAAGCAG SEQ ID NO:2706 LOX NM_00231 7.3 CCAATGGGAGAACAACGGGCAGGTGTTCAGCTTGCTGAGCCTGGGCTCACAGTACCAGCCTCAGCG SEQ ID NO:2707 LOXL2 NM_00231 8.1 TCAGCGGGCTCTTAAACAACCAGCTGTCCCCGCAGTAAAGAAGCCTGCGTGGTCAACTCCTGTCTT SEQ ID NO:2708 LRP5 NM_00233 5.1 CGACTATGACCCACTGGACAAGTTCATCTACTGGGTGGATGGGCGCCAGAACATCAAGCGAGCCAAG SEQ ID NO:2709 LRP6 NM_00233 6.1 GGATGTAGCCATCTCTGCCTCTATAGACCTCAGGGCCTTCGCTGTGCTTGCCCTATTGGCTTTGAACT SEQ ID NO:2710 LY6D NM_00369 5.2 AATGCTGATGACTTGGAGCAGGCCCCACAGACCCCACAGAGGATGAAGCCACCCCACAGAGGATGCAG SEQ ID NO:2711 MAD NM_00235 7.1 
SEQ ID NO:2712 MAD1L1 NM_00355 0.1 AGAAGCTGTCCCTGCAAGAGCAGGATGCAGCGATTGTGAAGAACATGAAGTCTGAGCTGGTACGGCT SEQ ID NO:2713 MAD2L1 NM_00235 8.2 
SEQ ID NO:2714 MADH2 NM_00590 1.2 GCTGCCTTTGGTAAGAACATGTCGTCCATCTTGCCATTCACGCCGCCAGTTGTGAAGAGACTGCTGGGAT SEQ ID NO:2715 MADH4 NM_00535 9.3 
SEQ ID NO:2716 MADH7 NM_00590 4.1 
SEQ ID NO:2717 MAP2 NM_03184 6.1 CGGACCACCAGGTCAGAGCCAATTCGCAGAGCAGGGAAGAGTGGTACCTCAACACCCACTACCCCTG SEQ ID NO:2718 MAP2K1 NM_00275 5.2 
SEQ ID NO:2719 MAP3K1 XM_04206 6.8 GGTTGGCATCAAAAGGAACTGGTGCAGGAGAGTTTCAGGGACAATTACTGGGGACAATTGCATTTATGGCA SEQ ID NO:2720 MAPK14 NM_13901 2.1 
SEQ ID NO:2721 Maspin NM_00263 9.1 
SEQ ID NO:2722 MAX NM_00238 2.3 
SEQ ID NO:2723 MCM2 NM_00452 6.1 
SEQ ID NO:2724 MCM3 NM_00238 8.2 
SEQ ID NO:2725 MCM6 NM_00591 5.2 
SEQ ID NO:2726 MCP1 NM_00298 2.1 CGCTCAGCCAGATGCAATCAATGCCCCAGTCACCTGCTGTTATAACTTCACCAATAGGAAGATCTCAGTGC SEQ ID NO:2727 MDK NM_00239 1.2 GGAGCCGACTGCAAGTACAAGTTTGAGAACTGGGGTGCGTGTGATGGGGGCACAGGCACCAAAGTC SEQ ID NO:2728 MDM2 NM_00239 2.1 CTACAGGGACGCCATCGAATCCGGATCTTGATGCTGGTGTAAGTGAACATTCAGGTGATTGGTTGGAT SEQ ID NO:2729 MGAT5 NM_00241 0.2 
SEQ ID NO:2730 MGMT NM_00241 2.1 GTGAAATGAAACGCACCACACTGGACAGCCCTTTGGGGAAGCTGGAGCTGTCTGGTTGTGAGCAGGGTC SEQ ID NO:2731 mGST1 NM_02030 0.2 ACGGATCTACCACACCATTGCATATTTGACACCCCTTCCCCAGCCAAATAGAGCTTTGAGIIIIIIIGTTGGA TATGGA SEQ ID NO:2732 MMP1 NM_00242 1.2 
SEQ ID NO:2733 MMP12 NM_00242 6.1 
SEQ ID NO:2734 MMP2 NM_00453 0.1 
SEQ ID NO:2735 MMP7 NM_00242 3.2 
SEQ ID NO:2736 MMP9 NM_00499 4.1 GAGAACCAATCTCACCGACAGGCAGCTGGCAGAGGAATACCTGTACCGCTATGGTTACACTCGGGTG SEQ ID NO:2737 MRP1 NM_00499 6.2 
SEQ ID NO:2738 MRP2 NM_00039 2.1 AGGGGATGACTTGGACACATCTGCCATTCGACATGACTGCAATTTTGACAAAGCCATGCAGTTTT SEQ ID NO:2739 MRP3 NM_00378 6.2 
SEQ ID NO:2740 MRP4 NM_00584 5.1 AGCGCCTGGAATCTACAACTCGGAGTCCAGTGTTTTCCCACTTGTCATCTTCTCTCCAGGGGCTCT SEQ ID NO:2741 MRPL40 NM_00377 6.2 ACTTGCAGGCTGCTATCCTTAACATGCTGCCCCTGAGAGTAGGAATGACCAGGGTTCAAGTCTGCT SEQ ID NO:2742 MSH2 NM_00025 1.1 
SEQ ID NO:2743 MSH3 NM_00243 9.1 
SEQ ID NO:2744 MSH6 NM_00017 9.1 TCTATTGGGGGATTGGTAGGAACCGTTACCAGCTGGAAATTCCTGAGAATTTCACCACTCGCAATTTG SEQ ID NO:2745 MT3 NM_00595 4.1 
SEQ ID NO:2746 MTA1 NM_00468 9.2 
SEQ ID NO:2747 MUC1 NM_00245 6.1 GGCCAGGATCTGTGGTGGTACAATTGACTCTGGCCTTCCGAGAAGGTACCATCAATGTCCACGACGTGGAG SEQ ID NO:2748 MUC2 NM_00245 7.1 CTATGAGCCATGTGGGAACCGGAGCTTCGAGACCTGCAGGACCATCAACGGCATCCACTCCAACAT SEQ ID NO:2749 MUC5B XM_03987 7.11 TGCCCTTGCACTGTCCTAACGGCTCAGCCATCCTGCACACCTACACCCACGTGGATGAGTGTGGCTG SEQ ID NO:2750 MUTYH NM_01222 2.1 GTACGACCAAGAGAAACGGGACCTACCATGGAGAAGACGGGCAGAAGATGAGATGGACCTGGACAGG SEQ ID NO:2751 MVP NM_01745 8.1 
SEQ ID NO:2752 MIX1 NM_00246 2.2 
SEQ ID NO:2753 MXD4 NM_00645 4.2 
SEQ ID NO:2754 MYBL2 NM_00246 6.1 
SEQ ID NO:2755 MYH11 NM_00247 4.1 
SEQ ID NO:2756 MYLK NM_05302 5.1 
SEQ ID NO:2757 NAT2 NM_00001 5.1 
SEQ ID NO:2758 NAV2 NM_18296 4.3 CTCTCCCAGCACAGCTTGAACCTCACTGAGTCAACCAGCCTGGACATGTTGCTGGATGACACTGGTG SEQ ID NO:2759 NCAM1 NM_00061 5.1 
SEQ ID NO:2760 NDE1 NM_01766 8.1 CTACTGCGGAAAGTCGGGGCACTGGAGTCCAAACTCGCTTCCTGCCGGAACCTCGTGTACGATCAGTCC SEQ ID NO:2761 NDRG1 NM_00609 6.2 AGGGCAACATTCCACAGCTGCCCTGGCTGTGATGAGTGTCCTTGCAGGGGCCGGAGTAGGAGCACTG SEQ ID NO:2762 NDUFS3 NM_00455 1.1 TATCCATCCTGATGGCGTCATCCCAGTGCTGACTTTCCTCAGGGATCACACCAATGCACAGTTCAA SEQ ID NO:2763 NEDD8 NM_00615 6.1 TGCTGGCTACTGGGTGTTAGTTTGCAGTCCTGTGTGCTTCCCTCTCTTATGACTGTGTCCCTGGTTGTC SEQ ID NO:2764 NEK2 NM_00249 7.1 
SEQ ID NO:2765 NF2 NM_00026 8.2 ACTCCAGAGCTGACCTCCACCGCCCAGCCTGGGAAGTCATTGTAGGGAGTGAGACACTGAAGCCCTGA SEQ ID NO:2766 NFKBp50 NM_00399 8.1 
SEQ ID NO:2767 NFKBp65 NM_02197 5.1 CTGCCGGGATGGCTTCTATGAGGCTGAGCTCTGCCCGGACCGCTGCATCCACAGTTTCCAGAACCTGG SEQ ID NO:2768 NISCH NM_00718 4.1 
SEQ ID NO:2769 Nkd-1 NM_03311 9.3 GAGAGAGTGAGCGAACCCTGCCCAGGCTCCAAGAAGCAGCTGAAGTTTGAAGAGCTCCAGTGCGACG SEQ ID NO:2770 NMB NM_02107 7.1 GGCTGCTGGTACAAATACTGCAGAAATGACACCAATAATAGGGGCAGACACAACAGCGTGGCTTAGATTG SEQ ID NO:2771 NMBR NM_00251 1.1 
SEQ ID NO:2772 NME1 NM_00026 9.1 
SEQ ID NO:2773 NOS3 NM_00060 3.2 ATCTCCGCCTCGCTCATGGGCACGGTGATGGCGAAGCGAGTGAAGGCGACAATCCTGTATGGCTCCGA SEQ ID NO:2774 NOTCH1 NM_01761 7.2 
SEQ ID NO:2775 NOTCH2 NM_02440 8.2 
SEQ ID NO:2776 NPM1 NM_00252 0.2 
SEQ ID NO:2777 NR4A1 NM_00213 5.2 CACAGCTTGCTTGTCGATGTCCCTGCCTTCGCCTGCCTCTCTGCCCTTGTCCTCATCACCGACCGGCAT SEQ ID NO:2778 NRG1 NM_01395 7.1 
SEQ ID NO:2779 NRP1 NM_00387 3.1 
SEQ ID NO:2780 NRP2 NM_0038T 2.1 
SEQ ID NO:2781 NTN1 NM_00482 2.1 AGAAGGACTATGCCGTCCAGATCCACATCCTGAAGGCGGACAAGGCGGGGGACTGGTGGAAGTTCACGG SEQ ID NO:2782 NUFIP1 NM_01234 5.1 
SEQ ID NO:2783 ODC1 NM_00253 9.1 
SEQ ID NO:2784 OPN, osteopontin NM_00058 2.1 
SEQ ID NO:2785 ORC1L NM_00415 3.2 TCCTTGACCATACCGGAGGGTGCATGTACATCTCCGGTGTCCCTGGGACAGGGAAGACTGCCACTG SEQ ID NO:2786 OSM NM_02053 0.3 GTTTCTGAAGGGGAGGTCACAGCCTGAGCTGGCCTCCTATGCCTCATCATGTCCCAAACCAGACACCT SEQ ID NO:2787 OSMR NM_00399 9.1 
SEQ ID NO:2788 P14ARF S78535.1 
SEQ ID NO:2789 p16-INK4 L27211.1 
SEQ ID NO:2790 p21 NM_00038 9.1 TGGAGACTCTCAGGGTCGAAAACGGCGGCAGACCAGCATGACAGATTTCTACCACTCCAAACGCC SEQ ID NO:2791 p27 NM_00406 4.1 CGGTGGACCACGAAGAGTTAACCCGGGACTTGGAGAAGCACTGCAGAGACATGGAAGAGGCGAGCC SEQ ID NO:2792 P53 NM_00054 6.2 CTTTGAACCCTTGCTTGCAATAGGTGTGCGTCAGAAGCACCCAGGACTTCCATTTGCTTTGTCCCGGG SEQ ID NO:2793 p53R2 AB036063. 1 
SEQ ID NO:2794 PADI4 NM_01238 7.1 AGCAGTGGCTTGCTTTCTTCTCCTGTGATGTCCCAGTTTCCCACTCTGAAGATCCCAACATGGTCCTAGCA SEQ ID NO:2795 PAI1 NM_00060 2.1 
SEQ ID NO:2796 Pak1 NM_00257 6.3 GAGCTGTGGGTTGTTATGGAATACTTGGCTGGAGGCTCCTTGACAGATGTGGTGACAGAAACTTGCATGG SEQ ID NO:2797 PARC NM_01508 9.1 GGAGCTGACCTGCTTCCTACATCGCCTGGCCTCGATGCATAAGGACTATGCTGTGGTGCTCTGCT SEQ ID NO:2798 PCAF NM_00388 4.3 AGGTGGCTGTGTTACTGCAACGTGCCACAGTTCTGCGACAGTCTACCTCGGTACGAAACCACACAGGTG SEQ ID NO:2799 PCNA NM_00259 2.1 
SEQ ID NO:2800 PDGFA NM_00260 7.2 TTGTTGGTGTGCCCTGGTGCCGTGGTGGCGGTCACTCCCTCTGCTGCCAGTGTTTGGACAGAACCCA SEQ ID NO:2801 PDGFB NM_00260 8.1 ACTGAAGGAGACCCTTGGAGCCTAGGGGCATCGGCAGGAGAGTGTGTGGGCAGGGTTATTTA SEQ ID NO:2802 PDGFC NM_01620 5.1 
SEQ ID NO:2803 PDGFD NM_02520 8.2 
SEQ ID NO:2804 PDGFRa NM_00620 6.2 
SEQ ID NO:2805 PDGFRb NM_00260 9.2 CCAGCTCTCCTTCCAGCTACAGATCAATGTCCCTGTCCGAGTGCTGGAGCTAAGTGAGAGCCACCC SEQ ID NO:2806 PFN1 NM_00502 2.2 GGAAAACGTTCGTCAACATCACGCCAGCTGAGGTGGGTGTCCTGGTTGGCAAAGACCGGTCAAGTTTT SEQ ID NO:2807 PFN2 NM_05302 4.1 
SEQ ID NO:2808 PGK1 NM_00029 1.1 
SEQ ID NO:2809 PI3K NM_00264 6.2 
SEQ ID NO:2810 PI3KC2A NM_00264 5.1 
SEQ ID NO:2811 PIK3CA NM_00621 8.1 GTGATTGAAGAGCATGCCAATTGGTCTGTATCCCGAGAAGCAGGATTTAGCTATTCCCACGCAGGAC SEQ ID NO:2812 PIM1 NM_00264 8.2 CTGCTCAAGGACACCGTCTACACGGACTTCGATGGGACCCGAGTGTATAGCCCTCCAGAGTGGATCC SEQ ID NO:2813 Pin1 NM_00622 1.1 GATCAACGGCTACATCCAGAAGATCAAGTCGGGAGAGGAGGACTTTGAGTCTCTGGCCTCACAGTTCA SEQ ID NO:2814 PKD1 NM_00029 6.2 CAGCACCAGCGATTACGACGTTGGCTGGGAGAGTCCTCACAATGGCTCGGGGACGTGGGCCTATTCAG SEQ ID NO:2815 PKR2 NM_00265 4.3 CCGCCTGGACATTGATTCACCACCCATCACAGCCCGGAACACTGGCATCATCTGTACCATTGGCCCAG SEQ ID NO:2816 PLA2G2A NM_00030 0.2 
SEQ ID NO:2817 PLAUR NM_00265 9.1 
SEQ ID NO:2818 PLK NM_00503 0.2 AATGAATACAGTATTCCCAAGCACATCAACCCCGTGGCCGCCTCCCTCATCCAGAAGATGCTTCAGACA SEQ ID NO:2819 PLK3 NM_00407 3.2 TGAAGGAGACGTACCGCTGCATCAAGCAGGTTCACTACACGCTGCCTGCCAGCCTCTCACTGCCTG SEQ ID NO:2820 PLOD2 NM_00093 5.2 
SEQ ID NO:2821 PMS1 NM_00053 4.2 
SEQ ID NO:2822 PMS2 NM_00053 5.2 
SEQ ID NO:2823 PPARG NM_00503 7.3 TGACTTTATGGAGCCCAAGTTTGAGTTTGCTGTGAAGTTCAATGCACTGGAATTAGATGACAGCGACTTGGC SEQ ID NO:2824 PPID NM_00503 8.1 TCCTCATTTGGATGGGAAACATGTGGTGTTTGGCCAAGTAATTAAAGGAATAGGAGTGGCAAGGATATTGG SEQ ID NO:2825 PPM1D NM_00362 0.1 GCCATCCGCAAAGGCTTTCTCGCTTGTCACCTTGCCATGTGGAAGAAACTGGCGGAATGGCC SEQ ID NO:2826 PPP2R4 NM_17800 1.1 
SEQ ID NO:2827 PR NM_00092 6.2 
SEQ ID NO:2828 PRDX2 NM_00580 9.4 GGTGTCCTTCGCCAGATCACTGTTAATGATTTGCCTGTGGGACGCTCCGTGGATGAGGCTCTGCGGCTG SEQ ID NO:2829 PRDX3 NM_00679 3.2 
SEQ ID NO:2830 PRDX4 NM_00640 6.1 
SEQ ID NO:2831 PRDX6 NM_00490 5.2 
SEQ ID NO:2832 PRKCA NM_00273 7.1 CAAGCAATGCGTCATCAATGTCCCCAGCCTCTGCGGAATGGATCACACTGAGAAGAGGGGGCGGATTTAC SEQ ID NO:2833 PRKCB1 NM_00273 8.5 GACCCAGCTCCACTCCTGCTTCCAGACCATGGACCGCCTGTACTTTGTGATGGAGTACGTGAATGGG SEQ ID NO:2834 PRKCD NM_00625 4.1 CTGACACTTGCCGCAGAGAATCCCTTTCTCACCCACCTCATCTGCACCTTCCAGACCAAGGACCACCT SEQ ID NO:2835 PRKR NM_00275 9.1 
SEQ ID NO:2836 pS2 NM_00322 5.1 
SEQ ID NO:2837 PTCH NM_00026 4.2 CCACGACAAAGCCGACTACATGCCTGAAACAAGGCTGAGAATCCCGGCAGCAGAGCCCATCGAGTA SEQ ID NO:2838 PTEN NM_00031 4.1 
SEQ ID NO:2839 PTGER3 NM_00095 7.2 
SEQ ID NO:2840 PTHLH NM_00282 0.1 
SEQ ID NO:2841 PTHR1 NM_00031 6.1 
SEQ ID NO:2842 PTK2 NM_00560 7.3 GACCGGTCGAATGATAAGGTGTACGAGAATGTGACGGGCCTGGTGAAAGCTGTCATCGAGATGTCCAG SEQ ID NO:2843 PTK2B NM_00410 3.3 
SEQ ID NO:2844 PTP4A3 NM_00707 9.2 AATATTTGTGCGGGGTATGGGGGTGGGTTTTTAAATCTCGTTTCTCTTGGACAAGCACAGGGATCTCGTT SEQ ID NO:2845 PTP4A3 v2 NM_03261 1.1 CCTGTTCTCGGCACCTTAAATTATTAGACCCCGGGGCAGTCAGGTGCTCCGGACACCCGAAGGCAATA SEQ ID NO:2846 PTPD1 NM_00703 9.2 
SEQ ID NO:2847 PTPN1 NM_00282 7.2 
SEQ ID NO:2848 PTPRF NM_00284 0.2 
SEQ ID NO:2849 PTPRJ NM_00284 3.2 
SEQ ID NO:2850 PTPRO NM_03066 7.1 CATGGCCTGATCATGGTGTGCCCACAGCAAATGCTGCAGAAAGTATCCTGCAGTTTGTACACATGG SEQ ID NO:2851 PTTG1 NM_00421 9.2 
SEQ ID NO:2852 RAB32 NM_00683 4.2 
SEQ ID NO:2853 RAB6C NM_03214 4.1 
SEQ ID NO:2854 RAC1 NM_00690 8.3 TGTTGTAAATGTCTCAGCCCCTCGTTCTTGGTCCTGTCCCTTGGAACCTTTGTACGCTTTGCTCAA SEQ ID NO:2855 RAD51C NM_05821 6.1 
SEQ ID NO:2856 RAD54L NM_00357 9.2 AGCTAGCCTCAGTGACACACATGACAGGTTGCACTGCCGACGTTGTGTCAACAGCCGTCAGATCCGG SEQ ID NO:2857 RAF1 NM_00288 0.1 
SEQ ID NO:2858 RALBP1 NM_00678 8.2 
SEQ ID NO:2859 RANBP2 NM_00626 7.3 
SEQ ID NO:2860 ranBP7 NM_00639 1.1 
SEQ ID NO:2861 RANBP9 NM_00549 3.2 
SEQ ID NO:2862 RAP1GDS1 NM_02115 9.3 TGTGGATGCTGGATTGATTTCACCACTGGTGCAGCTGCTAAATAGCAAAGACCAGGAAGTGCTGCTT SEQ ID NO:2863 RARA NM_00096 4.1 
SEQ ID NO:2864 RARB NM_01615 2.2 
SEQ ID NO:2865 RASSF1 NM_00718 2.3 AGTGGGAGACACCTGACCTTTCTCAAGCTGAGATTGAGCAGAAGATCAAGGAGTACAATGCCCAGATCA SEQ ID NO:2866 RBM5 NM_00577 8.1 CGAGAGGGAGAGCAAGACCATCATGCTGCGCGGCCTTCCCATCACCATCACAGAGAGCGATATTCGAGA SEQ ID NO:2867 RBX1 NM_01424 8.2 
SEQ ID NO:2868 RCC1 NM_00126 9.2 GGGCTGGGTGAGAATGTGATGGAGAGGAAGAAGCCGGCCCTGGTATCCATTCCGGAGGATGTTGTG SEQ ID NO:2869 REG4 NM_03204 4.2 
SEQ ID NO:2870 RFC NM_00305 6.1 
SEQ ID NO:2871 RhoB NM_00404 0.2 AAGCATGAACAGGACTTGACCATCTTfCCAACCCCTGGGGAAGACATTTGCAACTGACTTGGGGAGG SEQ ID NO:2872 rhoC NM_17574 4.1 CCCGTTCGGTCTGAGGAAGGCCGGGACATGGCGAACCGGATCAGTGCCTTTGGCTACCTTGAGTGCTC SEQ ID NO:2873 RIZ1 NM_01223 1.1 
SEQ ID NO:2874 RNF11 NM_01437 2.3 
SEQ ID NO:2875 ROCK1 NM_00540 6.1 
SEQ ID NO:2876 ROCK2 NM_00485 0.3 GATCCGAGACCCTCGCTCCCCCATCAACGTGGAGAGCTTGCTGGATGGCTTAAATTCCTTGGTCCT SEQ ID NO:2877 RPLPO NM_00100 2.2 
SEQ ID NO:2878 RPS13 NM_00101 7.2 
SEQ ID NO:2879 RRM1 NM_00103 3.1 GGGCTACTGGCAGCTACATTGCTGGGACTAATGGCAATTCCAATGGCCTTGTACCGATGCTGAGAG SEQ ID NO:2880 RRM2 NM_00103 4.1 CAGCGGGATTAAACAGTCCTTTAACCAGCACAGCCAGTTAAAAGATGCAGCCTCACTGCTTCAACGCAGAT SEQ ID NO:2881 RTN4 NM_00700 8.1 
SEQ ID NO:2882 RUNX1 NM_00175 4.2 AACAGAGACATTGCCAACCATATTGGATCTGCTTGCTGTCCAAACCAGCAAACTTCCTGGGCAAATCAC SEQ ID NO:2883 RXRA NM_00295 7.3 GCTCTGTTGTGTCCTGTTGCCGGCTCTGGCCTTCCTGTGACTGACTGTGAAGTGGCTTCTCCGTAC SEQ ID NO:2884 S100A1 NM_00627 1.1 TGGACAAGGTGATGAAGGAGCTAGACGAGAATGGAGACGGGGAGGTGGACTTCCAGGAGTATGTGGTGCT SEQ ID NO:2885 S100A2 NM_00597 8.2 
SEQ ID NO:2886 S100A4 NM_00296 1.2 GACTGCTGTCATGGCGTGCCCTCTGGAGAAGGCCCTGGATGTGATGGTGTCCACCTTCCACAAGTACTCG SEQ ID NO:2887 S100A8 NM_00296 4.3 
SEQ ID NO:2888 S100A9 NM_00296 5.2 CTTTGGGACAGAGTGCAAGACGATGACTTGCAAAATGTCGCAGCTGGAACGCAACATAGAGACCA SEQ ID NO:2889 S100P NM_00598 0.2 AGACAAGGATGCCGTGGATAAATTGCTCAAGGACCTGGACGCCAATGGAGATGCCCAGGTGGACTTC SEQ ID NO:2890 SAT NM_00297 0.1 CCTTTTACCACTGCCTGGTTGCAGAAGTGCCGAAAGAGCACTGGACTCCGGAAGGACACAGCATTGT SEQ ID NO:2891 SBA2 NM_01863 9.3 GGACTCAACGATGGGCAGATCAAGATCTGGGAGGTGCAGACAGGGCTCCTGCTTTTGAATCTTTCCG SEQ ID NO:2892 SDC1 NM_00299 7.1 
SEQ ID NO:2893 SEMA3B NM_00463 6.1 GCTCCAGGATGTGTTTCTGTTGTCCTCGCGGGACCACCGGACCCCGCTGCTCTATGCCGTCTTCTCCACGT SEQ ID NO:2894 SEMA3F NM_00418 6.1 
SEQ ID NO:2895 SEMA4B NM_02021 0.1 TTCCAGCCCAACACAGTGAACACTTTGGCCTGCCCGCTCCTCTCCAACCTGGCGACCCGACTC SEQ ID NO:2896 SFRP2 NM_00301 3.2 CAAGCTGAACGGTGTGTCCGAAAGGGACCTGAAGAAATCGGTGCTGTGGCTCAAAGACAGCTTGCA SEQ ID NO:2897 SFRP4 NM_00301 4.2 TACAGGATGAGGCTGGGCATTGCCTGGGACAGCCTATGTAAGGCCATGTGCCCCTTGCCCTAACAAC SEQ ID NO:2898 SGCB NM_00023 2.1 
SEQ ID NO:2899 SHC1 NM_00302 9.3 CCAACACCTTCTTGGCTTCTGGGACCTGTGTTCTTGCTGAGCACCCTCTCCGGTTTGGGTTGGGATAACAG SEQ ID NO:2900 SHH NM_00019 3.2 GTCCAAGGCACATATCCACTGCTCGGTGAAAGCAGAGAACTCGGTGGCGGCCAAATCGGGAGGCTGCTTC SED ID NO:2901 SI NM_00104 1.1 
SEQ ID NO:2902 Siah-1 NM_00303 1.2 TTGGCATTGGAACTACATTCAATCCGCGGTATCCTCGGATTAGTTCTAGGACCCCCTTCTCCATACC SEQ ID NO:2903 SIAT4A NM_00303 3.2 AACCACAGTTGGAGGAGGACGGCAGAGACAGTTTCCCTCCCCGCTATACCAACACCCTTCCTTCG SEQ ID NO:2904 SIAT7B NM_00645 6.1 TCCAGCCCAAATCCTCCTGGTGGCACATCCTACCCCAGATGCTAAAGTGATTCAAGGACTCCAGGACACC SEQ ID NO:2905 SIM2 NM_00506 9.2 GATGGTAGGAAGGGATGTGCCCGCCTCTCCACGCACTCAGCTATACCTCATTCACAGCTCCTTGTG SEQ ID NO:2906 SIN3A NM_01547 7.1 
SEQ ID NO:2907 SIR2 NM_01223 8.3 AGCTGGGGTGTCTGTTTCATGTGGAATACCTGACTTCAGGTCAAGGGATGGTATTTATGCTCGCCTTGCTGT SECT ID NO:2908 SKP1A NM_00693 0.2 
SEQ ID NO:2909 SKP2 NM_00598 3.2 AGTTGCAGAATCTAAGCCTGGAAGGCCTGCGGCTTTCGGATCCCATTGTCAATACTCTCGCAAAAAACTCA SEQ ID N0:2910 SLC25A3 NM_21361 1.1 TCTGCCAGTGCTGAATTCTTTGCTGACATTGCCCTGGCTCCTATGGAAGCTGCTAAGGTTCGAA SEQ ID NO:2911 SLC2A1 NM_00651 6.1 GCCTGAGTCTCCTGTGCCCACATCCCAGGCTTCACCCTGAATGGTTCCATGCCTGAGGGTGGAGACT SEQ ID NO:2912 SLC31A1 NM_00185 9.2 CCGTTCGAAGAGTCGTGAGGGGGTGACGGGTTAAGATTCGGAGAGAGAGGTGCTAGTGGCTGGACT SEQ ID NO:2913 SLC5A8 NM_14591 3.2 
SEQ ID NO:2914 SLC7A5 NM_00348 6.4 GCGCAGAGGCCAGTTAAAGTAGATCACCTCCTCGAACCCACTCCGGTTCCCCGCAACCCACAGCTCAGCT SEQ ID NO:2915 SLPI NM_00306 4.2 
SEQ ID NO:2916 SMARCA3 NM_00307 1.2 AGGGACTGTCCTGGCACATTATGCAGATGTCCTGGGTCTTTTGCTTAGACTGCGGCAAATTTGTTG SEQ ID NO:2917 SNAI1 NM_00598 5.2 CCCAATCGGAAGCCTAACTACAGCGAGCTGCAGGACTCTAATCCAGAGTTTACCTTCCAGCAGCCCTAC SEQ ID NO:2918 SNAI2 NM_00306 8.3 
SEQ ID NO:2919 SNRPF NM_00309 5.1 
SEQ ID NO:2920 SOD1 NM_00045 4.3 TGAAGAGAGGCATGTTGGAGACTTGGGCAATGTGACTGCTGACAAAGATGGTGTGGCCGATGTGTCTATT SEQ ID NO:2921 SOD2 NM_00063 6.1 
SEQ ID NO:2922 SOS1 NM_00563 3.2 TCTGCACCAAATTCTCCAAGAACACCGTTAACACCTCCGCCTGCTTCTGGTGCTTCCAGTACCAC SEQ ID NO:2923 SOX17 NM_02245 4.2 TCGTGTGCAAGCCTGAGATGGGCCTCCCCTACCAGGGGCATGACTCCGGTGTGAATCTCCCCGACAG SEQ ID NO:2924 SPARC NM_00311 8.1 
SEQ ID NO:2925 SPINT2 NM_02110 2.1 AGGAATGCAGCGGATTCCTCTGTCCCAAGTGCTCCCAGAAGGCAGGATTCTGAAGACCACTCCAGCGA SEQ ID NO:2926 SPRY1 AK026960. 1 
SEQ ID NO:2927 SPRY2 NM_00584 2.1 TGTGGCAAGTGCAAATGTAAGGAGTGCACCTACCCAAGGCCTCTGCCATCAGACTGGATCTGCGAC SEQ ID NO:2928 SR-A1 NM_02122 8.1 
SEQ ID NO:2929 ST14 NM_02197 8.2 TGACTGCACATGGAACATTGAGGTGCCCAACAACCAGCATGTGAAGGTGCGCTTCAAATTCTT SEQ ID NO:2930 STAT1 NM_00731 5.1 
SEQ ID NO:2931 STAT3 NM_00315 0.1 TCACATGCCACTTTGGTGTTTCATAATCTCCTGGGAGAGATTGACCAGCAGTATAGCCGCTTCCTGCAAG SEQ ID NO:2932 STAT5A NM_00315 2.1 GAGGCGCTCAACATGAAATTCAAGGCCGAAGTGCAGAGCAACCGGGGCCTGACCAAGGAGAACCTCGTGT TCCTGGC SEQ ID NO:2933 STAT5B NM_01244 8.1 
SEQ ID NO:2934 STC1 NM_00315 5.1 
SEQ ID NO:2935 STK11 NM_00045 5.3 GGACTCGGAGACGCTGTGCAGGAGGGCCGTCAAGATCCTCAAGAAGAAGAAGTTGCGAAGGATCCC SEQ ID NO:2936 STK15 NM_00360 0.1 CATCTTCCAGGAGGACCACTCTCTGTGGCACCCTGGACTACCTGCCCCCTGAAATGATTGAAGGTCGGA SEQ ID NO:2937 STMN1 NM_00556 3.2 AATACCCAACGCACAAATGACCGCACGTTCTCTGCCCCGTTTCTTGCCCCAGTGTGGTTTGCATTGTCTCC SEQ ID NO:2938 STMY3 NM_00594 0.2 
SEQ ID NO:2939 STS NM_00035 1.2 
SEQ ID NO:2940 SURV NM_00116 8.1 
SEQ ID NO:2941 TAGLN NM_00318 6.2 
SEQ ID NO:2942 TBP NM_00319 4.1 GCCCGAAACGCCGAATATAATCCCAAGCGGTTTGCTGCGGTAATCATGAGGATAAGAGAGCCACG SEQ ID NO:2943 TCF-1 NM_00054 5.3 GAGGTCCTGAGCACTGCCAGGAGGGACAAAGGAGCCTGTGAACCCAGGACAAGCATGGTCCCACATC SEQ ID NO:2944 TCF-7 NM_00320 2.2 GCAGCTGCAGTCAACAGTTCAAAGAAGTCATGGCCCAAATCCAGTGTGCACCCCTCCCCATTCACAG SEQ ID NO:2945 TCF7L1 NM_03128 3.1 CCGGGACACTTTCCAGAAGCCGCGGGACTATTTCGCCGAAGTGAGAAGGCCTCAGGACAGCGCGTTCT SEQ ID NO:2946 TCF7L2 NM_03075 6.1 CCAATCACGACAGGAGGATTCAGACACCCCTACCCCACAGCTCTGACCGTCAATGCTTCCGTGTCCA SEQ ID NO:2947 TCFL4 NM_17060 7.2 
SEQ ID NO:2948 TEK NM_00045 9.1 
SEQ ID NO:2949 TERC U86046.1 
SEQ ID NO:2950 TERT NM_00321 9.1 
SEQ ID NO:2951 TFF3 NM_00322 6.1 
SEQ ID NO:2952 TGFA NM_00323 6.1 
SEQ ID NO:2953 TGFB2 NM_00323 8.1 
SEQ ID NO:2954 TGFB3 NM_00323 9.1 GGATCGAGCTCTTCCAGATCCTTCGGCCAGATGAGCACATTGCCAAACAGCGCTATATCGGTGGC SEQ ID NO:2955 TGFBI NM_00035 8.1 GCTACGAGTGCTGTCCTGGATATGAAAAGGTCCCTGGGGAGAAGGGCTGTCCAGCAGCCCTACCACT SEQ ID NO:2956 TGFBR1 NM_00461 2.1 GTCATCACCTGGCCTTGGTCCTGTGGAACTGGCAGCTGTCATTGCTGGACCAGTGTGCTTCGTCTGC SEQ ID NO:2957 TGFBR2 NM_00324 2.2 AACACCAATGGGTTCCATCTTTCTGGGCTCCTGATTGCTCAAGCACAGTTTGGCCTGATGAAGAGG SEQ ID NO:2958 THBS1 NM_00324 6.1 
SEQ ID NO:2959 THY1 NM_00628 8.2 GGACAAGACCCTCTCAGGCTGTCCCAAGCTCCCAAGAGCTTCCAGAGCTCTGACCCACAGCCTCCAA SEQ ID NO:2960 TIMP1 NM_00325 4.1 
SEQ ID NO:2961 TIMP2 NM_00325 5.2 TCACCCTCTGTGACTTCATCGTGCCCTGGGACACCCTGAGCACCACCCAGAAGAAGAGCCTGAACCACA SEQ ID NO:2962 TIMP3 NM_00036 2.2 CTACCTGCCTTGCTTTGTGACTTCCAAGAACGAGTGTCTCTGGACCGACATGCTCTCCAATTTCGGT SEQ ID NO:2963 TJP1 NM_00325 7.1 
SEQ ID NO:2964 TK1 NM_00325 8.1 
SEQ ID NO:2965 TLN1 NM_00628 9.2 
SEQ ID NO:2966 TMEPAI NM_02018 2.3 CAGAAGGATGCCTGTGGCCCTCGGAGAGCACAGTGTCAGGCAACGGAATCCCAGAGCCGCAGGTCTAC SEQ ID NO:2967 TMSB10 NM_02110 3.2 GAAATCGCCAGCTTCGATAAGGCCAAGCTGAAGAAAACGGAGACGCAGGAAAAGAACACCCTGCCGAC SEQ ID NO:2968 TMSB4X NM_02110 9.2 CACATCAAAGAACTACTGACAACGAAGGCCGCGCCTGCCTTTCCCATCTGTCTATCTATCTGGCTGGCAGG SEQ ID NO:2969 TNC NM_00216 0.1 AGCTCGGAACCTCACCGTGCCTGGCAGCCTTCGGGCTGTGGACATACCGGGCCTCAAGGCTGCTAC SEQ ID NO:2970 TNF NM_00059 4.1 GGAGAAGGGTGACCGACTCAGCGCTGAGATCAATCGGCCCGACTATCTCGACTTTGCCGAGTCTGGGCA SEQ ID NO:2971 TNFRSF5 NM_00125 0.3 TCTCACCTCGCTATGGTTCGTCTGCCTCTGCAGTGCGTCCTCTGGGGCTGCTTGCTGACCGCTGTCCATC SEQ ID NO:2972 TNFRSF6B NM_00382 3.2 
SEQ ID NO:2973 TNFSF4 NM_00332 6.2 
SEQ ID NO:2974 TOP2A NM_00106 7.1 
SEQ ID NO:2975 TOP2B NM_00106 8.1 TGTGGACATCTTCCCCTCAGACTTCCCTACTGAGCCACCTTCTCTGCCACGAACCGGTCGGGCTAG SEQ ID NO:2976 TP NM_00195 3.2 
SEQ ID NO:2977 TP53BP1 NM_00565 7.1 
SEQ ID NO:2978 TP53BP2 NM_00542 6.1 
SEQ ID NO:2979 TP53I3 NM_00488 1.2 GCGGACTTAATGCAGAGACAAGGCCAGTATGACCCACCTCCAGGAGCCAGCAACATTTTGGGACTTGA SEQ ID NO:2980 TRAG3 NM_00490 9.1 GACGCTGGTCTGGTGAAGATGTCCAGGAAACCACGAGCCTCCAGCCCATTGTCCAACAACCACCCA SEQ ID NO:2981 TRAIL NM_00381 0.1 
SEQ ID NO:2982 TS NM_00107 1.1 GCCTCGGTGTGCCTTTCAACATCGCCAGCTACGCCCTGCTCACGTACATGATTGCGCACATCACG SEQ ID NO:2983 TST NM_00331 2.4 GGAGCCGGATGCAGTAGGACTGGACTCGGGCCATATCCGTGGTGCCGTCAACATGCCTTTCATGGACTT SEQ ID NO:2984 TUBA1 NM_00600 0.1 TGTCACCCCGACTCAACGTGAGACGCACCGCCCGGACTCACCATGCGTGAATGCATCTCAGTCCACGT SEQ ID NO:2985 TUBB NM_00106 9.1 
SEQ ID NO:2986 TUFM NM_00332 1.3 GTATCACCATCAATGCGGCTCATGTGGAGTATAGCACTGCCGCCCGCCACTACGCCCACACAGACTG SEQ ID NO:2987 TULP3 NM_00332 4.2 
SEQ ID NO:2988 tusc4 NM_00654 5.4 GGAGGAGCTAAATGCCTCAGGCCGGTGCACTCTGCCCATTGATGAGTCCAACACCATCCACTTGAAGG SEQ ID NO:2989 UBB NM_01895 5.1 
SEQ ID NO:2990 UBC NM_02100 9.2 ACGCACCCTGTCTGACTACAACATCCAGAAAGAGTCCACCCTGCACCTGGTGCTCCGTCTTAGAGGT SEQ ID NO:2991 UBE2C NM_00701 9.2 TGTCTGGCGATAAAGGGATTTCTGCCTTCCCTGAATCAGACAACCTTTTCAAATGGGTAGGGACCAT SEQ ID NO:2992 UBE2M NM_00396 9.1 
SEQ ID NO:2993 UBL1 NM_00335 2.3 
SEQ ID NO:2994 UCP2 NM_00335 5.2 ACCATGCTCCAGAAGGAGGGGCCCCGAGCCTTCTACAAAGGGTTCATGCCCTCCTTTCTCCGCTTGGGTT SEQ ID NO:2995 UGT1A1 NM_00046 3.2 CCATGCAGCCTGGAATTTGAGGCTACCCAGTGCCCCAACCCATTCTCCTACGTGCCCAGGCCTCTC SEQ ID NO:2996 UMPS NM_00037 3.1 
SEQ ID NO:2997 UNC5A XM_03030 0.7 GACAGCTGATCCAGGAGCCACGGGTCCTGCACTTCAAGGACAGTTACCACAACCTGCGCCTATCCAT SEQ ID NO:2998 UNC5B NM_17074 4.2 AGAACGGAGGCCGTGACTGCAGCGGGACGCTGCTCGACTCTAAGAACTGCACAGATGGGCTGTGCATG SEQ ID NO:2999 UNC5C NM_00372 8.2 CTGAACACAGTGGAGCTGGTTTGCAAACTCTGTGTGCGGCAGGTGGAAGGAGAAGGGCAGATCTTCCAG SEQ ID NO:3000 upa NM_00265 8.1 GTGGATGTGCCCTGAAGGACAAGCCAGGCGTCTACACGAGAGTCTCACACTTCTTACCCTGGATCCGCAG SEQ ID NO:3001 UPP1 NM_00336 4.2 
SEQ ID NO:3002 VCAM1 NM_00107 8.2 
SEQ ID NO:3003 VCL NM_00337 3.2 GATACCACAACTCCCATCAAGCTGTTGGCAGTGGCAGCCACGGCGCCTCCTGATGCGCCTAACAGGGA SEQ ID NO:3004 VCP NM_00712 6.2 GGCTTTGGCAGCTTCAGATTCCCTTCAGGGAACCAGGGTGGAGCTGGCCCCAGTCAGGGCAGTGGAG SEQ ID NO:3005 VDAC1 NM_00337 4.1 
SEQ ID NO:3006 VDAC2 NM_00337 5.2 ACCCACGGACAGACTTGCGCGCGTCCAATGTGTATTCCTCCATCATATGCTGACCTTGGCAAAGCT SEQ ID NO:3007 VDR NM_00037 6.1 GCCCTGGATTTCAGAAAGAGCCAAGTCTGGATCTGGGACCCTTTCCTTCCTTCCCTGGCTTGTAACT SEQ ID NO:3008 VEGF NM_00337 6.3 CTGCTGTCTTGGGTGCATTGGAGCCTTGCCTTGCTGCTCTACCTCCACCATGCCAAGTGGTCCCAGGCTGC SEQ ID NO:3009 VEGF_altsplic e1 AF486837. 1 
SEQ ID NO:3010 VEGF_altsplic e2 AF214570. 1 
SEQ ID NO:3011 VEGFB NM_00337 7.2 
SEQ ID NO:3012 VEGFC NM_00542 9.2 
SEQ ID NO:3013 VIM NM_00338 0.1 
SEQ ID NO:3014 WIF NM_00719 1.2 TACAAGCTGAGTGCCCAGGCGGGTGCCGAAATGGAGGCTTTTGTAATGAAAGACGCATCTGCGAGTG SEQ ID NO:3015 WISP1 NM_00388 2.2 
SEQ ID NO:3016 Wnt-3a NM_03313 1.2 
SEQ ID NO:3017 Wnt-5a NM_00339 2.2 
SEQ ID NO:3018 Wnt-5b NM_03264 2.2 
SEQ ID NO:3019 WNT2 NM_00339 1.1 CGGTGGAATCTGGCTCTGGCTCCCTCTGCTCTTGACCTGGCTCACCCCCGAGGTCAACTCrTCATGG SEQ ID NO:3020 wwox NM_01637 3.1 
SEQ ID NO:3021 XPA NM_00038 0.2 
SEQ ID NO:3022 XPC NM_00462 8.2 
SEQ ID NO:3023 XRCC1 NM_00629 7.1 GGAGATGAAGCCCCCAAGCTTCCTCAGAAGCAACCCCAGACCAAAACCAAGCCCACTCAGGCAGCTGGAC SEQ ID NO:3024 YB-1 NM_00455 9.1 
SEQ ID NO:3025 YWHAH NM_00340 5.2 CATGGCCTCCGCTATGAAGGCGGTGACAGAGCTGAATGAACCTCTCTCCAATGAAGATCGAAATCTCC SEQ ID NO:3026 zbtb7 NM_01589 8.2 CTGCGTTCACACCCCAGTGTCACAGGGCGAGCTGTTCTGGAGAGAAAACCATCTGTCGTGGCTGAG SEQ ID NO:3027 ZG16 NM_15233 8.1 
SEQ ID NO:3028
Claims (12)
- A method of predicting clinical outcome for a human subject diagnosed with colorectal cancer following surgical resection of said cancer, comprising:determining a normalized expression level of an RNA transcript of MYBL2, or an expression product thereof, in a biological sample comprising colorectal cancer cells obtained from said human subject, andpredicting the likelihood of a positive clinical outcome for said human subject based on said normalized expression level, wherein an increased normalized expression of an RNA transcript of MYBL2, or an expression product thereof, is positively correlated with an increased likelihood of a positive clinical outcome.
- A method as claimed in claim 1, wherein said colorectal cancer is Dukes B (stage In or Dukes C (stage III) colorectal cancer.
- A method as claimed in claim 1, wherein said colorectal cancer is Dukes B (stage II) or Dukes C (stage III) colorectal cancer, the method comprising:determining the normalized expression level of an RNA transcript of MYBL2 in a biological sample comprising colorectal cancer cells obtained from said human subject, and;predicting the likelihood of recurrence of colorectal cancer for the human subject based on the normalized expression level, wherein an increased normalized expression of an RNA transcript of MYBL2 is positively correlated with decreased likelihood of recurrence of colorectal cancer.
- A method as claimed in claim 2 or 3, wherein said colorectal cancer is Dukes B (stage II) or Dukes C (stage III) colon cancer.
- A method as claimed in any preceding claim, wherein said normalized expression level of an RNA transcript of MYBL2 is determined using a PCR-based method.
- A method as claimed in any preceding claim, wherein said normalized expression level of an RNA transcript of MYBL2 is normalized relative to the expression level of an RNA transcript of at least one reference gene.
- A method as claimed in any of claims 1 to 4, wherein said normalized expression level of an expression product of an RNA transcript of MYBL2 is normalized relative to the expression level of an expression product of an RNA transcript of at least one reference gene.
- A method as claimed in claim 1, wherein said clinical outcome is expressed in terms of Recurrence-Free Interval (RFI), Overall Survival (OS), or Disease-Free Survival (DFS).
- A method as claimed in any preceding claim, further comprising the step of creating a report summarizing said prediction.
- A method of determining whether a human subject diagnosed with colorectal cancer should be subjected to further therapy following surgical resection of the cancer, comprising carrying out a method as claimed in claim 3, wherein if the likelihood of recurrence of colorectal cancer is increased, said patient is recommended further therapy following said surgical resection.
- A method as claimed in claim 10, wherein said further therapy is chemotherapy.
- A method as claimed in claim 10 or 11, wherein said further therapy is radiation therapy.
Applications Claiming Priority (4)
| Application Number | Priority Date | Filing Date | Title |
|---|---|---|---|
| US75839206P | 2006-01-11 | 2006-01-11 | |
| US80027706P | 2006-05-12 | 2006-05-12 | |
| US81007706P | 2006-05-31 | 2006-05-31 | |
| EP07717900.0A EP1974058B1 (en) | 2006-01-11 | 2007-01-11 | Gene expression markers for colorectal cancer prognosis |
Related Parent Applications (5)
| Application Number | Title | Priority Date | Filing Date |
|---|---|---|---|
| EP07717900.0 Division | 2007-01-11 | ||
| WOPCT/US2007/000995 Previously-Filed-Application | 2007-01-11 | ||
| EP07717900.0A Division-Into EP1974058B1 (en) | 2006-01-11 | 2007-01-11 | Gene expression markers for colorectal cancer prognosis |
| EP07717900.0A Division EP1974058B1 (en) | 2006-01-11 | 2007-01-11 | Gene expression markers for colorectal cancer prognosis |
| PCT/US2007/000995 Previously-Filed-Application WO2007082099A2 (en) | 2006-01-11 | 2007-01-11 | Gene expression markers for colorectal cancer prognosis |
Publications (2)
| Publication Number | Publication Date |
|---|---|
| EP2377950A1 EP2377950A1 (en) | 2011-10-19 |
| EP2377950B1 true EP2377950B1 (en) | 2014-09-17 |
Family
ID=38257063
Family Applications (9)
| Application Number | Title | Priority Date | Filing Date |
|---|---|---|---|
| EP10177406.5A Not-in-force EP2377950B1 (en) | 2006-01-11 | 2007-01-11 | Gene expression markers for colorectal cancer prognosis |
| EP10194713A Withdrawn EP2412820A1 (en) | 2006-01-11 | 2007-01-11 | Gene expression markers for colorectal cancer prognosis |
| EP10194715A Withdrawn EP2407553A1 (en) | 2006-01-11 | 2007-01-11 | Gene Expression Markers for Colorectal Cancer Prognosis |
| EP10194719.0A Not-in-force EP2412823B1 (en) | 2006-01-11 | 2007-01-11 | Gene expression markers for colorectal cancer prognosis |
| EP10194722A Withdrawn EP2400036A1 (en) | 2006-01-11 | 2007-01-11 | Gene expression markers for colorectal cancer prognosis |
| EP10194714.1A Not-in-force EP2412821B1 (en) | 2006-01-11 | 2007-01-11 | AREG as a gene expression marker for colorectal cancer prognosis |
| EP10194717A Withdrawn EP2412822A1 (en) | 2006-01-11 | 2007-01-11 | Gene expression markers for colorectal cancer prognosis |
| EP10194720.8A Not-in-force EP2412824B1 (en) | 2006-01-11 | 2007-01-11 | Gene Expression Markers for Colorectal Cancer Prognosis |
| EP07717900.0A Active EP1974058B1 (en) | 2006-01-11 | 2007-01-11 | Gene expression markers for colorectal cancer prognosis |
Family Applications After (8)
| Application Number | Title | Priority Date | Filing Date |
|---|---|---|---|
| EP10194713A Withdrawn EP2412820A1 (en) | 2006-01-11 | 2007-01-11 | Gene expression markers for colorectal cancer prognosis |
| EP10194715A Withdrawn EP2407553A1 (en) | 2006-01-11 | 2007-01-11 | Gene Expression Markers for Colorectal Cancer Prognosis |
| EP10194719.0A Not-in-force EP2412823B1 (en) | 2006-01-11 | 2007-01-11 | Gene expression markers for colorectal cancer prognosis |
| EP10194722A Withdrawn EP2400036A1 (en) | 2006-01-11 | 2007-01-11 | Gene expression markers for colorectal cancer prognosis |
| EP10194714.1A Not-in-force EP2412821B1 (en) | 2006-01-11 | 2007-01-11 | AREG as a gene expression marker for colorectal cancer prognosis |
| EP10194717A Withdrawn EP2412822A1 (en) | 2006-01-11 | 2007-01-11 | Gene expression markers for colorectal cancer prognosis |
| EP10194720.8A Not-in-force EP2412824B1 (en) | 2006-01-11 | 2007-01-11 | Gene Expression Markers for Colorectal Cancer Prognosis |
| EP07717900.0A Active EP1974058B1 (en) | 2006-01-11 | 2007-01-11 | Gene expression markers for colorectal cancer prognosis |
Country Status (15)
| Country | Link |
|---|---|
| US (10) | US7695913B2 (en) |
| EP (9) | EP2377950B1 (en) |
| JP (7) | JP5297202B2 (en) |
| KR (1) | KR20090003178A (en) |
| AU (1) | AU2007204826B2 (en) |
| BR (1) | BRPI0706511A2 (en) |
| CA (1) | CA2636984A1 (en) |
| DK (1) | DK1974058T3 (en) |
| ES (1) | ES2491222T3 (en) |
| HK (1) | HK1120089A1 (en) |
| IL (1) | IL192794A (en) |
| MX (1) | MX2008008973A (en) |
| NO (1) | NO20083461L (en) |
| NZ (7) | NZ593228A (en) |
| WO (1) | WO2007082099A2 (en) |
Cited By (1)
| Publication number | Priority date | Publication date | Assignee | Title |
|---|---|---|---|---|
| WO2023075123A1 (en) * | 2021-10-26 | 2023-05-04 | 사회복지법인 삼성생명공익재단 | Pharmaceutical composition for treatment and metastasis inhibition of colorectal cancer, comprising mirnas, and use thereof |
Families Citing this family (73)
| Publication number | Priority date | Publication date | Assignee | Title |
|---|---|---|---|---|
| CA2506066A1 (en) | 2002-11-15 | 2004-06-03 | Genomic Health, Inc. | Gene expression profiling of egfr positive cancer |
| CA2563074C (en) | 2004-04-09 | 2014-05-20 | Genomic Health, Inc. | Gene expression markers for predicting response to chemotherapy |
| EP2377950B1 (en) * | 2006-01-11 | 2014-09-17 | Genomic Health, Inc. | Gene expression markers for colorectal cancer prognosis |
| US8700335B2 (en) | 2006-05-18 | 2014-04-15 | Caris Mpi, Inc. | System and method for determining individualized medical intervention for a disease state |
| US8768629B2 (en) * | 2009-02-11 | 2014-07-01 | Caris Mpi, Inc. | Molecular profiling of tumors |
| US20090076734A1 (en) | 2007-03-22 | 2009-03-19 | Torres-Roca Javier F | Gene Signature for the Prediction of Radiation Therapy Response |
| US20080234946A1 (en) * | 2007-03-22 | 2008-09-25 | University Of South Florida | Predictive radiosensitivity network model |
| PL2140269T3 (en) | 2007-03-27 | 2014-07-31 | Immunovia Ab | Protein signature/markers for the detection of adenocarcinoma |
| US20090123920A1 (en) * | 2007-11-08 | 2009-05-14 | Maher Albitar | Jak2 mutations |
| ES2332167B1 (en) | 2007-12-04 | 2010-10-25 | Universidad Autonoma De Madrid | EMPLOYMENT OF TREFOIL FACTOR-FAMILY 3 (TFF3) IN THE FORECAST OF DIAGNOSED SUBJECTS WITH COLORECTAL CANCER. |
| WO2009123634A1 (en) * | 2008-04-02 | 2009-10-08 | Regents Of The University Of California | Systems and methods for predicting response of biological samples |
| US8067178B2 (en) | 2008-03-14 | 2011-11-29 | Genomic Health, Inc. | Gene expression markers for prediction of patient response to chemotherapy |
| NZ610482A (en) | 2008-05-14 | 2014-08-29 | Genomic Health Inc | Predictors of patient response to treatment with egf receptor inhibitors |
| US20100029748A1 (en) * | 2008-08-04 | 2010-02-04 | Sloan-Kettering Institute For Cancer Research | Metastasis Promoting Genes and Proteins |
| US10359425B2 (en) * | 2008-09-09 | 2019-07-23 | Somalogic, Inc. | Lung cancer biomarkers and uses thereof |
| US20100221752A2 (en) * | 2008-10-06 | 2010-09-02 | Somalogic, Inc. | Ovarian Cancer Biomarkers and Uses Thereof |
| US20110257034A1 (en) * | 2008-10-10 | 2011-10-20 | Cornell University | Methods for identifying genes which predict disease outcome for patients with colon cancer |
| US20120041274A1 (en) | 2010-01-07 | 2012-02-16 | Myriad Genetics, Incorporated | Cancer biomarkers |
| US8765383B2 (en) * | 2009-04-07 | 2014-07-01 | Genomic Health, Inc. | Methods of predicting cancer risk using gene expression in premalignant tissue |
| EP2425020A4 (en) * | 2009-05-01 | 2016-04-20 | Genomic Health Inc | Gene expression profile algorithm and test for likelihood of recurrence of colorectal cancer and response to chemotherapy |
| TWI513465B (en) * | 2009-06-25 | 2015-12-21 | Regeneron Pharma | Method of treating cancer with dll4 antagonist and chemotherapeutic agent |
| US20120053253A1 (en) | 2010-07-07 | 2012-03-01 | Myriad Genetics, Incorporated | Gene signatures for cancer prognosis |
| US20130116150A1 (en) | 2010-07-09 | 2013-05-09 | Somalogic, Inc. | Lung Cancer Biomarkers and Uses Thereof |
| WO2012015765A2 (en) | 2010-07-27 | 2012-02-02 | Genomic Health, Inc. | Method for using gene expression to determine prognosis of prostate cancer |
| CN106198980B (en) | 2010-08-13 | 2018-09-07 | 私募蛋白质体公司 | Cancer of pancreas biomarker and application thereof |
| WO2012030840A2 (en) | 2010-08-30 | 2012-03-08 | Myriad Genetics, Inc. | Gene signatures for cancer diagnosis and prognosis |
| US9670547B2 (en) | 2010-09-15 | 2017-06-06 | Almac Diagnostics Limited | Molecular diagnostic test for cancer |
| JP2014509189A (en) * | 2011-01-25 | 2014-04-17 | アルマック ダイアグノスティックス リミテッド | Colon cancer gene expression signature and methods of use |
| EP2773772A1 (en) | 2011-11-04 | 2014-09-10 | Oslo Universitetssykehus HF | Methods and biomarkers for analysis of colorectal cancer |
| AU2012344155A1 (en) | 2011-11-28 | 2014-07-03 | Fundacio Institut De Recerca Biomedica (Irb Barcelona) | Methods and kits for the prognosis of colorectal cancer |
| EP2794924B1 (en) | 2011-12-22 | 2019-02-06 | Baylor Research Institute | Identification of mirna signatures in human colorectal cancer |
| CA2860594A1 (en) * | 2012-01-09 | 2013-07-18 | Oslo Universitetssykehus Hf | Methods and biomarkers for analysis of colorectal cancer |
| NZ722902A (en) | 2012-01-31 | 2017-12-22 | Genomic Health Inc | Gene expression profile algorithm and test for determining prognosis of prostate cancer |
| WO2013150167A2 (en) | 2012-04-03 | 2013-10-10 | Servicio Andaluz De Salud | Microrna expression model as a survival indicator in patients having metastatic colorectal cancer |
| WO2014077915A1 (en) * | 2012-11-14 | 2014-05-22 | Mayo Foundation For Medical Education And Research | Methods and materials for identifying malignant skin lesions |
| EP4190918A1 (en) | 2012-11-16 | 2023-06-07 | Myriad Genetics, Inc. | Gene signatures for cancer prognosis |
| ES2475366B1 (en) * | 2012-12-10 | 2015-05-05 | Fundación Imdea Alimentación | Methods and kits for colorectal cancer prognosis |
| US20140272969A1 (en) | 2013-03-14 | 2014-09-18 | Abbott Molecular Inc. | Cell preparations and cell supports and their use in theranosis |
| AR096507A1 (en) * | 2013-05-30 | 2016-01-13 | Fundació Institució Catalana De Recerca I Estudis Avançats | METHODS AND KITS FOR THE FORECAST OF COLORRECTAL CANCER |
| US10185809B1 (en) * | 2013-10-15 | 2019-01-22 | Iqvia Inc. | Patient projection methodology |
| GB201319878D0 (en) * | 2013-11-11 | 2013-12-25 | Immunovia Ab | Method, Array and use thereof |
| AU2015237229A1 (en) * | 2014-03-28 | 2016-11-10 | Applied Proteomics, Inc. | Protein biomarker profiles for detecting colorectal tumors |
| EP3623482A1 (en) | 2014-05-13 | 2020-03-18 | Myriad Genetics, Inc. | Gene signatures for cancer prognosis |
| WO2016025717A1 (en) | 2014-08-14 | 2016-02-18 | Mayo Foundation For Medical Education And Research | Methods and materials for identifying metastatic malignant skin lesions and treating skin cancer |
| JP6415712B2 (en) | 2014-10-24 | 2018-10-31 | コーニンクレッカ フィリップス エヌ ヴェKoninklijke Philips N.V. | Assessment of TGF-β cell signaling pathway activity using mathematical modeling of target gene expression |
| CN108064380A (en) | 2014-10-24 | 2018-05-22 | 皇家飞利浦有限公司 | Use the prediction of the medical prognosis and therapeutic response of various kinds of cell signal transduction path activity |
| CA2965217A1 (en) | 2014-10-24 | 2016-04-28 | Koninklijke Philips N.V. | Medical prognosis and prediction of treatment response using multiple cellular signaling pathway activities |
| CN107002720B (en) | 2014-11-25 | 2018-10-16 | 三菱电机株式会社 | Gas pressure type actuator |
| WO2016089928A1 (en) * | 2014-12-01 | 2016-06-09 | Weitz Andrew C | Methods for treating and assessing tumor invasion and metastasis |
| EP3073268A1 (en) * | 2015-03-27 | 2016-09-28 | Deutsches Krebsforschungszentrum Stiftung des Öffentlichen Rechts | Biomarker panel for diagnosing cancer |
| US9689874B2 (en) | 2015-04-10 | 2017-06-27 | Applied Proteomics, Inc. | Protein biomarker panels for detecting colorectal cancer and advanced adenoma |
| US11244760B2 (en) | 2015-06-25 | 2022-02-08 | Karydo Therapeutix, Inc. | Prediction device based on inter-organ cross talk system |
| AU2016309659A1 (en) | 2015-08-14 | 2018-04-12 | Koninklijke Philips N.V. | Assessment of NFkB cellular signaling pathway activity using mathematical modelling of target gene expression |
| WO2017170803A1 (en) | 2016-03-29 | 2017-10-05 | 株式会社国際電気通信基礎技術研究所 | Pharmaceutical composition or food composition, and method for assessing effect of active ingredient in vivo |
| CN109477147A (en) | 2016-05-10 | 2019-03-15 | 梅约医学教育与研究基金会 | For cutaneum carcinoma by stages with the method for the treatment of and material |
| US11746381B2 (en) | 2017-03-10 | 2023-09-05 | Cancer Diagnostics Research Innvovations, LLC | Methods for diagnosing and treating gastric cancer using miRNA expression |
| WO2018224731A1 (en) * | 2017-06-05 | 2018-12-13 | Ls Cancerdiag Oy | A method for determining whether a subject is at risk to develop cancer and tools related thereto |
| EP3461915A1 (en) | 2017-10-02 | 2019-04-03 | Koninklijke Philips N.V. | Assessment of jak-stat1/2 cellular signaling pathway activity using mathematical modelling of target gene expression |
| EP3502279A1 (en) | 2017-12-20 | 2019-06-26 | Koninklijke Philips N.V. | Assessment of mapk-ap 1 cellular signaling pathway activity using mathematical modelling of target gene expression |
| JP7027179B2 (en) * | 2018-01-24 | 2022-03-01 | キヤノン株式会社 | Feeding rotating body, sheet feeding device and image forming device |
| US11198911B2 (en) | 2018-03-08 | 2021-12-14 | University Of Notre Dame Du Lac | Systems and methods for assessing colorectal cancer molecular subtype and risk of recurrence and for determining and administering treatment protocols based thereon |
| KR102007450B1 (en) * | 2018-05-31 | 2019-08-05 | 한국과학기술연구원 | Screening method for new therapeuric targets of drug discovery for colon cancer and prognostic biomarkers for colon cancer screened by using the same |
| WO2020112853A1 (en) | 2018-11-28 | 2020-06-04 | Genascence Corporation | Methods and compositions for treating osteoarthritis |
| WO2020123699A1 (en) * | 2018-12-11 | 2020-06-18 | The Trustees Of Columbia University In The City Of New York | Compounds and compositions that cause mycn and/or cmyc degradation and methods of use thereof |
| CN110257518B (en) * | 2019-07-01 | 2022-08-02 | 复旦大学附属中山医院 | Gene set for predicting curative effect of metastatic colorectal cancer transformation treatment |
| KR102263984B1 (en) * | 2020-02-21 | 2021-06-11 | 재단법인 아산사회복지재단 | Analytical method for predicting response to preoperative chemoradiotherapy in rectal cancer patients |
| KR102535150B1 (en) * | 2020-04-14 | 2023-05-23 | 주식회사 베르티스 | Composition for Predicting Cancer Prognosis |
| WO2021222220A2 (en) * | 2020-04-29 | 2021-11-04 | Freenome Holdings, Inc. | Rna markers and methods for identifying colon cell proliferative disorders |
| GB202010970D0 (en) | 2020-07-16 | 2020-09-02 | Immunovia Ab | Methods, arrays and uses thereof |
| CN112322730B (en) * | 2020-10-16 | 2023-04-18 | 上海市第一人民医院 | Marker KIFC1 for predicting tumor drug resistance and recurrence, and inhibitor and application thereof |
| EP4026918A1 (en) | 2021-01-12 | 2022-07-13 | Koninklijke Philips N.V. | Prediction of an outcome of a colorectal cancer subject |
| CN113667673B (en) * | 2021-07-15 | 2024-02-06 | 武汉血液中心 | Montellike FUT1236delG allele and detection method and application thereof |
| WO2024035653A1 (en) * | 2022-08-06 | 2024-02-15 | H. Lee Moffitt Cancer Center And Research Institute, Inc. | Predictive biomarker in avastin in colon cancer |
Family Cites Families (51)
| Publication number | Priority date | Publication date | Assignee | Title |
|---|---|---|---|---|
| US20020172987A1 (en) * | 1998-02-12 | 2002-11-21 | Terstappen Leon W.M.M. | Methods and reagents for the rapid and efficient isolation of circulating cancer cells |
| WO1999064626A2 (en) | 1998-06-06 | 1999-12-16 | Genostic Pharma Limited | Probes used for genetic profiling |
| AU4158799A (en) | 1998-06-06 | 1999-12-30 | Genostic Pharma Limited | Probes used for genetic filing |
| JP5213202B2 (en) | 1998-10-28 | 2013-06-19 | バイシス・インコーポレーテツド | Detection and use of cell arrays and markers of genetic disorders |
| EP0999016B1 (en) * | 1998-11-06 | 2001-07-11 | Temco S. R. L. | Cutter for cross cutting of webs |
| US6960439B2 (en) * | 1999-06-28 | 2005-11-01 | Source Precision Medicine, Inc. | Identification, monitoring and treatment of disease and characterization of biological condition using gene expression profiles |
| US6692916B2 (en) * | 1999-06-28 | 2004-02-17 | Source Precision Medicine, Inc. | Systems and methods for characterizing a biological condition or agent using precision gene expression profiles |
| EP1265582A2 (en) * | 1999-09-29 | 2002-12-18 | Human Genome Sciences, Inc. | Colon and colon cancer associated polynucleotides and polypeptides |
| AU2088801A (en) | 1999-12-10 | 2001-06-18 | Dana-Farber Cancer Institute, Inc. | Metastasis genes and uses thereof |
| US7029677B2 (en) * | 2000-01-25 | 2006-04-18 | Nuvelo, Inc. | Methods of therapy and diagnosis using immunotargeting of CD84Hy1-expressing cells |
| US7195870B2 (en) | 2000-04-06 | 2007-03-27 | Epigenomics Ag | Diagnosis of diseases associated with gene regulation |
| WO2005000087A2 (en) | 2003-06-03 | 2005-01-06 | Chiron Corporation | Gene products differentially expressed in cancerous colon cells and their methods of use ii |
| EP1307556A2 (en) | 2000-08-03 | 2003-05-07 | Corixa Corporation | Compositions and methods for the therapy and diagnosis of colon cancer |
| US20030166064A1 (en) * | 2000-08-03 | 2003-09-04 | Corixa Corporation | Compositions and methods for the therapy and diagnosis of colon cancer |
| US20020110832A1 (en) | 2000-08-03 | 2002-08-15 | Corixa Corporation | Compositions and methods for the therapy and diagnosis of colon cancer |
| US20030077568A1 (en) * | 2000-09-15 | 2003-04-24 | Gish Kurt C. | Methods of diagnosis of colorectal cancer, compositions and methods of screening for colorectal cancer modulators |
| WO2002024956A2 (en) | 2000-09-19 | 2002-03-28 | Whitehead Institute For Biomedical Research | Genetic markers for tumors |
| AU2002246519A1 (en) * | 2000-11-20 | 2002-08-06 | Corixa Corporation | Compositions and methods for the therapy and diagnosis of colon cancer |
| WO2002074156A2 (en) * | 2001-02-02 | 2002-09-26 | Corixa Corporation | Compositions and methods for the therapy and diagnosis of colon cancer |
| US20020197633A1 (en) * | 2001-05-09 | 2002-12-26 | Jones Brian C. | Evaluation of ultraviolet radiation damage to skin using new gene markers, methods and compositions related thereto |
| US20030148314A1 (en) * | 2001-08-01 | 2003-08-07 | Millennium Pharmaceuticals, Inc. | Compositions, kits, and methods for identification, assessment, prevention, and therapy of colon cancer |
| US7622260B2 (en) * | 2001-09-05 | 2009-11-24 | The Brigham And Women's Hospital, Inc. | Diagnostic and prognostic tests |
| CA2466502A1 (en) * | 2001-11-09 | 2003-05-15 | Source Precision Medicine, Inc. | Identification, monitoring and treatment of disease and characterization of biological condition using gene expression profiles |
| US20030225526A1 (en) * | 2001-11-14 | 2003-12-04 | Golub Todd R. | Molecular cancer diagnosis using tumor gene expression signature |
| US20030148410A1 (en) * | 2001-12-10 | 2003-08-07 | Millennium Pharmaceuticals, Inc. | Novel genes, compositions, kits, and methods for identification, assessment, prevention, and therapy of colon cancer |
| EP1534739A4 (en) * | 2002-01-18 | 2006-05-31 | Bristol Myers Squibb Co | Identification of polynucleotides and polypeptide for predicting activity of compounds that interact with protein tyrosine kinases and/or protein tyrosine kinase pathways |
| US7955800B2 (en) * | 2002-06-25 | 2011-06-07 | Advpharma Inc. | Metastasis-associated gene profiling for identification of tumor tissue, subtyping, and prediction of prognosis of patients |
| US20040053317A1 (en) * | 2002-09-10 | 2004-03-18 | Sidney Kimmel Cancer Center | Gene segregation and biological sample classification methods |
| AU2003304203A1 (en) | 2002-10-29 | 2005-01-04 | Pharmacia Corporation | Differentially expressed genes involved in cancer, the polypeptides encoded thereby, and methods of using the same |
| ATE412779T1 (en) * | 2003-02-20 | 2008-11-15 | Genomic Health Inc | USE OF INTRONIC RNA SEQUENCES TO QUANTIFY GENE EXPRESSION |
| EP3330875B1 (en) | 2003-07-10 | 2021-12-01 | Genomic Health, Inc. | Expression profile algorithm and test for prognosing breast cancer recurrence |
| WO2005015236A2 (en) | 2003-07-18 | 2005-02-17 | Roche Diagnostics Gmbh | A method for predicting the progression of adenocarcinoma |
| US20050014165A1 (en) * | 2003-07-18 | 2005-01-20 | California Pacific Medical Center | Biomarker panel for colorectal cancer |
| AU2004262369A1 (en) * | 2003-07-29 | 2005-02-10 | Bristol-Myers Squibb Company | Biomarkers of cyclin-dependent kinase modulation |
| EP1892306A3 (en) | 2003-10-06 | 2008-06-11 | Bayer HealthCare AG | Methods and kits for investigating cancer |
| WO2005076005A2 (en) | 2004-01-30 | 2005-08-18 | Medizinische Universität Wien | A method for classifying a tumor cell sample based upon differential expression of at least two genes |
| US20060195266A1 (en) * | 2005-02-25 | 2006-08-31 | Yeatman Timothy J | Methods for predicting cancer outcome and gene signatures for use therein |
| WO2005100593A1 (en) | 2004-04-16 | 2005-10-27 | Monash University | A method for monitoring the progress of cancer |
| WO2006010150A2 (en) | 2004-07-15 | 2006-01-26 | University Of Utah Research Foundation | Housekeeping genes and methods for identifying the same |
| US20060183893A1 (en) | 2005-01-25 | 2006-08-17 | North Don A | Nucleic acids for apoptosis of cancer cells |
| US20090220495A1 (en) | 2005-04-07 | 2009-09-03 | Abdallah Fanidi | Cancer Related Genes (PRLR) |
| EP1907858A4 (en) * | 2005-06-13 | 2009-04-08 | Univ Michigan | Compositions and methods for treating and diagnosing cancer |
| WO2007061876A2 (en) | 2005-11-23 | 2007-05-31 | University Of Utah Research Foundation | Methods and compositions involving intrinsic genes |
| WO2007070621A2 (en) | 2005-12-13 | 2007-06-21 | Children's Medical Center Corporation | Prognosis indicators for solid human tumors |
| NZ544432A (en) | 2005-12-23 | 2009-07-31 | Pacific Edge Biotechnology Ltd | Prognosis prediction for colorectal cancer using a prognositc signature comprising markers ME2 and FAS |
| EP2377950B1 (en) | 2006-01-11 | 2014-09-17 | Genomic Health, Inc. | Gene expression markers for colorectal cancer prognosis |
| US20100009905A1 (en) | 2006-03-24 | 2010-01-14 | Macina Roberto A | Compositions and Methods for Detection, Prognosis and Treatment of Colon Cancer |
| US20090258795A1 (en) * | 2007-03-15 | 2009-10-15 | Genomic Health, Inc. | Gene expression markers for prediction of patient response to chemotherapy |
| US8067178B2 (en) * | 2008-03-14 | 2011-11-29 | Genomic Health, Inc. | Gene expression markers for prediction of patient response to chemotherapy |
| US8765383B2 (en) * | 2009-04-07 | 2014-07-01 | Genomic Health, Inc. | Methods of predicting cancer risk using gene expression in premalignant tissue |
| EP2425020A4 (en) * | 2009-05-01 | 2016-04-20 | Genomic Health Inc | Gene expression profile algorithm and test for likelihood of recurrence of colorectal cancer and response to chemotherapy |
-
2007
- 2007-01-11 EP EP10177406.5A patent/EP2377950B1/en not_active Not-in-force
- 2007-01-11 NZ NZ593228A patent/NZ593228A/en unknown
- 2007-01-11 EP EP10194713A patent/EP2412820A1/en not_active Withdrawn
- 2007-01-11 KR KR1020087019544A patent/KR20090003178A/en not_active Application Discontinuation
- 2007-01-11 NZ NZ593227A patent/NZ593227A/en unknown
- 2007-01-11 NZ NZ593229A patent/NZ593229A/en unknown
- 2007-01-11 EP EP10194715A patent/EP2407553A1/en not_active Withdrawn
- 2007-01-11 WO PCT/US2007/000995 patent/WO2007082099A2/en active Application Filing
- 2007-01-11 MX MX2008008973A patent/MX2008008973A/en active IP Right Grant
- 2007-01-11 EP EP10194719.0A patent/EP2412823B1/en not_active Not-in-force
- 2007-01-11 JP JP2008550454A patent/JP5297202B2/en active Active
- 2007-01-11 EP EP10194722A patent/EP2400036A1/en not_active Withdrawn
- 2007-01-11 AU AU2007204826A patent/AU2007204826B2/en active Active
- 2007-01-11 NZ NZ593225A patent/NZ593225A/en unknown
- 2007-01-11 CA CA002636984A patent/CA2636984A1/en not_active Abandoned
- 2007-01-11 NZ NZ593226A patent/NZ593226A/en unknown
- 2007-01-11 NZ NZ593224A patent/NZ593224A/en unknown
- 2007-01-11 BR BRPI0706511-6A patent/BRPI0706511A2/en not_active IP Right Cessation
- 2007-01-11 DK DK07717900.0T patent/DK1974058T3/en active
- 2007-01-11 US US11/653,102 patent/US7695913B2/en active Active
- 2007-01-11 EP EP10194714.1A patent/EP2412821B1/en not_active Not-in-force
- 2007-01-11 NZ NZ569788A patent/NZ569788A/en unknown
- 2007-01-11 EP EP10194717A patent/EP2412822A1/en not_active Withdrawn
- 2007-01-11 EP EP10194720.8A patent/EP2412824B1/en not_active Not-in-force
- 2007-01-11 ES ES07717900.0T patent/ES2491222T3/en active Active
- 2007-01-11 EP EP07717900.0A patent/EP1974058B1/en active Active
-
2008
- 2008-07-13 IL IL192794A patent/IL192794A/en active IP Right Grant
- 2008-08-08 NO NO20083461A patent/NO20083461L/en not_active Application Discontinuation
-
2009
- 2009-01-15 HK HK09100394.3A patent/HK1120089A1/en not_active IP Right Cessation
-
2010
- 2010-01-29 US US12/696,934 patent/US8153378B2/en active Active
- 2010-10-25 US US12/911,544 patent/US8153380B2/en active Active
- 2010-10-25 US US12/911,532 patent/US8029995B2/en active Active
- 2010-10-25 US US12/911,551 patent/US8026060B2/en active Active
- 2010-10-25 US US12/911,519 patent/US8273537B2/en active Active
- 2010-10-25 US US12/911,526 patent/US8153379B2/en active Active
-
2011
- 2011-01-19 US US13/009,733 patent/US8198024B2/en active Active
-
2012
- 2012-03-06 US US13/413,338 patent/US8367345B2/en active Active
- 2012-12-13 JP JP2012272400A patent/JP5486664B2/en active Active
- 2012-12-28 US US13/729,462 patent/US20130102492A1/en not_active Abandoned
-
2013
- 2013-06-13 JP JP2013124952A patent/JP2013215201A/en active Pending
- 2013-06-13 JP JP2013124951A patent/JP5486720B2/en active Active
- 2013-06-13 JP JP2013124949A patent/JP5486718B2/en active Active
- 2013-06-13 JP JP2013124950A patent/JP5486719B2/en active Active
- 2013-06-13 JP JP2013124948A patent/JP5486717B2/en active Active
Cited By (1)
| Publication number | Priority date | Publication date | Assignee | Title |
|---|---|---|---|---|
| WO2023075123A1 (en) * | 2021-10-26 | 2023-05-04 | 사회복지법인 삼성생명공익재단 | Pharmaceutical composition for treatment and metastasis inhibition of colorectal cancer, comprising mirnas, and use thereof |
Also Published As
Similar Documents
| Publication | Publication Date | Title |
|---|---|---|
| EP2377950B1 (en) | Gene expression markers for colorectal cancer prognosis | |
| US8067178B2 (en) | Gene expression markers for prediction of patient response to chemotherapy | |
| US10179936B2 (en) | Gene expression profile algorithm and test for likelihood of recurrence of colorectal cancer and response to chemotherapy | |
| US20090258795A1 (en) | Gene expression markers for prediction of patient response to chemotherapy |
Legal Events
| Date | Code | Title | Description |
|---|---|---|---|
| 17P | Request for examination filed |
Effective date: 20100917 |
|
| AC | Divisional application: reference to earlier application |
Ref document number: 1974058 Country of ref document: EP Kind code of ref document: P |
|
| AK | Designated contracting states |
Kind code of ref document: A1 Designated state(s): AT BE BG CH CY CZ DE DK EE ES FI FR GB GR HU IE IS IT LI LT LU LV MC NL PL PT RO SE SI SK TR |
|
| AX | Request for extension of the european patent |
Extension state: AL BA HR MK RS |
|
| PUAI | Public reference made under article 153(3) epc to a published international application that has entered the european phase |
Free format text: ORIGINAL CODE: 0009012 |
|
| 17Q | First examination report despatched |
Effective date: 20120711 |
|
| REG | Reference to a national code |
Ref country code: HK Ref legal event code: DE Ref document number: 1162613 Country of ref document: HK |
|
| GRAP | Despatch of communication of intention to grant a patent |
Free format text: ORIGINAL CODE: EPIDOSNIGR1 |
|
| INTG | Intention to grant announced |
Effective date: 20140411 |
|
| GRAS | Grant fee paid |
Free format text: ORIGINAL CODE: EPIDOSNIGR3 |
|
| GRAA | (expected) grant |
Free format text: ORIGINAL CODE: 0009210 |
|
| AC | Divisional application: reference to earlier application |
Ref document number: 1974058 Country of ref document: EP Kind code of ref document: P |
|
| AK | Designated contracting states |
Kind code of ref document: B1 Designated state(s): AT BE BG CH CY CZ DE DK EE ES FI FR GB GR HU IE IS IT LI LT LU LV MC NL PL PT RO SE SI SK TR |
|
| REG | Reference to a national code |
Ref country code: GB Ref legal event code: FG4D |
|
| REG | Reference to a national code |
Ref country code: CH Ref legal event code: EP |
|
| REG | Reference to a national code |
Ref country code: IE Ref legal event code: FG4D |
|
| REG | Reference to a national code |
Ref country code: AT Ref legal event code: REF Ref document number: 687745 Country of ref document: AT Kind code of ref document: T Effective date: 20141015 |
|
| REG | Reference to a national code |
Ref country code: DE Ref legal event code: R096 Ref document number: 602007038624 Country of ref document: DE Effective date: 20141030 |
|
| PG25 | Lapsed in a contracting state [announced via postgrant information from national office to epo] |
Ref country code: LT Free format text: LAPSE BECAUSE OF FAILURE TO SUBMIT A TRANSLATION OF THE DESCRIPTION OR TO PAY THE FEE WITHIN THE PRESCRIBED TIME-LIMIT Effective date: 20140917 Ref country code: SE Free format text: LAPSE BECAUSE OF FAILURE TO SUBMIT A TRANSLATION OF THE DESCRIPTION OR TO PAY THE FEE WITHIN THE PRESCRIBED TIME-LIMIT Effective date: 20140917 Ref country code: GR Free format text: LAPSE BECAUSE OF FAILURE TO SUBMIT A TRANSLATION OF THE DESCRIPTION OR TO PAY THE FEE WITHIN THE PRESCRIBED TIME-LIMIT Effective date: 20141218 Ref country code: FI Free format text: LAPSE BECAUSE OF FAILURE TO SUBMIT A TRANSLATION OF THE DESCRIPTION OR TO PAY THE FEE WITHIN THE PRESCRIBED TIME-LIMIT Effective date: 20140917 |
|
| REG | Reference to a national code |
Ref country code: NL Ref legal event code: VDEP Effective date: 20140917 |
|
| REG | Reference to a national code |
Ref country code: LT Ref legal event code: MG4D |
|
| PG25 | Lapsed in a contracting state [announced via postgrant information from national office to epo] |
Ref country code: CY Free format text: LAPSE BECAUSE OF FAILURE TO SUBMIT A TRANSLATION OF THE DESCRIPTION OR TO PAY THE FEE WITHIN THE PRESCRIBED TIME-LIMIT Effective date: 20140917 Ref country code: LV Free format text: LAPSE BECAUSE OF FAILURE TO SUBMIT A TRANSLATION OF THE DESCRIPTION OR TO PAY THE FEE WITHIN THE PRESCRIBED TIME-LIMIT Effective date: 20140917 |
|
| REG | Reference to a national code |
Ref country code: AT Ref legal event code: MK05 Ref document number: 687745 Country of ref document: AT Kind code of ref document: T Effective date: 20140917 |
|
| PG25 | Lapsed in a contracting state [announced via postgrant information from national office to epo] |
Ref country code: NL Free format text: LAPSE BECAUSE OF FAILURE TO SUBMIT A TRANSLATION OF THE DESCRIPTION OR TO PAY THE FEE WITHIN THE PRESCRIBED TIME-LIMIT Effective date: 20140917 |
|
| PG25 | Lapsed in a contracting state [announced via postgrant information from national office to epo] |
Ref country code: RO Free format text: LAPSE BECAUSE OF FAILURE TO SUBMIT A TRANSLATION OF THE DESCRIPTION OR TO PAY THE FEE WITHIN THE PRESCRIBED TIME-LIMIT Effective date: 20140917 Ref country code: PT Free format text: LAPSE BECAUSE OF FAILURE TO SUBMIT A TRANSLATION OF THE DESCRIPTION OR TO PAY THE FEE WITHIN THE PRESCRIBED TIME-LIMIT Effective date: 20150119 Ref country code: EE Free format text: LAPSE BECAUSE OF FAILURE TO SUBMIT A TRANSLATION OF THE DESCRIPTION OR TO PAY THE FEE WITHIN THE PRESCRIBED TIME-LIMIT Effective date: 20140917 Ref country code: IS Free format text: LAPSE BECAUSE OF FAILURE TO SUBMIT A TRANSLATION OF THE DESCRIPTION OR TO PAY THE FEE WITHIN THE PRESCRIBED TIME-LIMIT Effective date: 20150117 Ref country code: CZ Free format text: LAPSE BECAUSE OF FAILURE TO SUBMIT A TRANSLATION OF THE DESCRIPTION OR TO PAY THE FEE WITHIN THE PRESCRIBED TIME-LIMIT Effective date: 20140917 Ref country code: SK Free format text: LAPSE BECAUSE OF FAILURE TO SUBMIT A TRANSLATION OF THE DESCRIPTION OR TO PAY THE FEE WITHIN THE PRESCRIBED TIME-LIMIT Effective date: 20140917 Ref country code: ES Free format text: LAPSE BECAUSE OF FAILURE TO SUBMIT A TRANSLATION OF THE DESCRIPTION OR TO PAY THE FEE WITHIN THE PRESCRIBED TIME-LIMIT Effective date: 20140917 |
|
| PG25 | Lapsed in a contracting state [announced via postgrant information from national office to epo] |
Ref country code: AT Free format text: LAPSE BECAUSE OF FAILURE TO SUBMIT A TRANSLATION OF THE DESCRIPTION OR TO PAY THE FEE WITHIN THE PRESCRIBED TIME-LIMIT Effective date: 20140917 Ref country code: PL Free format text: LAPSE BECAUSE OF FAILURE TO SUBMIT A TRANSLATION OF THE DESCRIPTION OR TO PAY THE FEE WITHIN THE PRESCRIBED TIME-LIMIT Effective date: 20140917 |
|
| REG | Reference to a national code |
Ref country code: DE Ref legal event code: R097 Ref document number: 602007038624 Country of ref document: DE |
|
| PG25 | Lapsed in a contracting state [announced via postgrant information from national office to epo] |
Ref country code: BE Free format text: LAPSE BECAUSE OF NON-PAYMENT OF DUE FEES Effective date: 20150131 |
|
| PLBE | No opposition filed within time limit |
Free format text: ORIGINAL CODE: 0009261 |
|
| STAA | Information on the status of an ep patent application or granted ep patent |
Free format text: STATUS: NO OPPOSITION FILED WITHIN TIME LIMIT |
|
| PG25 | Lapsed in a contracting state [announced via postgrant information from national office to epo] |
Ref country code: DK Free format text: LAPSE BECAUSE OF FAILURE TO SUBMIT A TRANSLATION OF THE DESCRIPTION OR TO PAY THE FEE WITHIN THE PRESCRIBED TIME-LIMIT Effective date: 20140917 |
|
| REG | Reference to a national code |
Ref country code: DE Ref legal event code: R119 Ref document number: 602007038624 Country of ref document: DE |
|
| 26N | No opposition filed |
Effective date: 20150618 |
|
| REG | Reference to a national code |
Ref country code: CH Ref legal event code: PL |
|
| PG25 | Lapsed in a contracting state [announced via postgrant information from national office to epo] |
Ref country code: IT Free format text: LAPSE BECAUSE OF FAILURE TO SUBMIT A TRANSLATION OF THE DESCRIPTION OR TO PAY THE FEE WITHIN THE PRESCRIBED TIME-LIMIT Effective date: 20140917 Ref country code: LU Free format text: LAPSE BECAUSE OF FAILURE TO SUBMIT A TRANSLATION OF THE DESCRIPTION OR TO PAY THE FEE WITHIN THE PRESCRIBED TIME-LIMIT Effective date: 20150111 |
|
| GBPC | Gb: european patent ceased through non-payment of renewal fee |
Effective date: 20150111 |
|
| PG25 | Lapsed in a contracting state [announced via postgrant information from national office to epo] |
Ref country code: MC Free format text: LAPSE BECAUSE OF FAILURE TO SUBMIT A TRANSLATION OF THE DESCRIPTION OR TO PAY THE FEE WITHIN THE PRESCRIBED TIME-LIMIT Effective date: 20140917 |
|
| PG25 | Lapsed in a contracting state [announced via postgrant information from national office to epo] |
Ref country code: LI Free format text: LAPSE BECAUSE OF NON-PAYMENT OF DUE FEES Effective date: 20150131 Ref country code: CH Free format text: LAPSE BECAUSE OF NON-PAYMENT OF DUE FEES Effective date: 20150131 Ref country code: GB Free format text: LAPSE BECAUSE OF NON-PAYMENT OF DUE FEES Effective date: 20150111 Ref country code: DE Free format text: LAPSE BECAUSE OF NON-PAYMENT OF DUE FEES Effective date: 20150801 |
|
| REG | Reference to a national code |
Ref country code: FR Ref legal event code: ST Effective date: 20150930 |
|
| REG | Reference to a national code |
Ref country code: IE Ref legal event code: MM4A |
|
| PG25 | Lapsed in a contracting state [announced via postgrant information from national office to epo] |
Ref country code: FR Free format text: LAPSE BECAUSE OF NON-PAYMENT OF DUE FEES Effective date: 20150202 Ref country code: SI Free format text: LAPSE BECAUSE OF FAILURE TO SUBMIT A TRANSLATION OF THE DESCRIPTION OR TO PAY THE FEE WITHIN THE PRESCRIBED TIME-LIMIT Effective date: 20140917 |
|
| PG25 | Lapsed in a contracting state [announced via postgrant information from national office to epo] |
Ref country code: IE Free format text: LAPSE BECAUSE OF NON-PAYMENT OF DUE FEES Effective date: 20150111 |
|
| PG25 | Lapsed in a contracting state [announced via postgrant information from national office to epo] |
Ref country code: BG Free format text: LAPSE BECAUSE OF FAILURE TO SUBMIT A TRANSLATION OF THE DESCRIPTION OR TO PAY THE FEE WITHIN THE PRESCRIBED TIME-LIMIT Effective date: 20140917 Ref country code: HU Free format text: LAPSE BECAUSE OF FAILURE TO SUBMIT A TRANSLATION OF THE DESCRIPTION OR TO PAY THE FEE WITHIN THE PRESCRIBED TIME-LIMIT; INVALID AB INITIO Effective date: 20070111 |
|
| PG25 | Lapsed in a contracting state [announced via postgrant information from national office to epo] |
Ref country code: TR Free format text: LAPSE BECAUSE OF FAILURE TO SUBMIT A TRANSLATION OF THE DESCRIPTION OR TO PAY THE FEE WITHIN THE PRESCRIBED TIME-LIMIT Effective date: 20140917 |
|
| REG | Reference to a national code |
Ref country code: HK Ref legal event code: WD Ref document number: 1162613 Country of ref document: HK |